Article

The Environmental Aspect in the Concept of Corporate Social Responsibility in the Energy Industry and Sustainable Development of the Economy

Institute of Management and Quality Science, Department of Logistics and Information Systems, University of Zielona Góra, ul. Licealna 9, 65-417 Zielona Góra, Poland
*
Authors to whom correspondence should be addressed.
Energies 2021, 14(18), 5993; https://doi.org/10.3390/en14185993
Submission received: 16 August 2021 / Revised: 16 September 2021 / Accepted: 17 September 2021 / Published: 21 September 2021

Abstract

:
Sustainable development is now an important direction for the further development of all economies in the world. It is important to balance economic development with the impact on the environment and our planet. Another direction in the development of management sciences is the emergence of the concept of Corporate Social Responsibility, which considers this impact in three key aspects—economic, environmental and social—in terms of microeconomics. This concept gives companies specific guidelines and tools that minimize their negative impact on the environment. Reducing the negative impact of companies influences the environment and this is what is mainly associated with them. However, companies should also pay attention to internal consistency and caring for employees. Company practices such as the exploitation of people, including children, and injustice in the workplace are some of the factors that can be observed in less developed countries. The article focuses on the presentation of the environmental aspect in the context of the concept of corporate social responsibility. We analyzed individual sectors of the economy in terms of the environmental aspect, with particular emphasis on the energy industry. The study is based on a statistical analysis taking into account data from 1718 companies from all over the world. The aim of the article is to present the environmental aspect in the context of corporate social responsibility in the energy industry as a direction for sustainable development of the economy. The article is based on the analysis of the literature and databases presenting CSR, which was created on the basis of questionnaire research. The article shows which regions of the world are worse and which are better in terms of the environmental aspects of CSR. Conclusions on the main CSR guidelines for the environment are also presented. We analyzed factors such as environmental routines, policies and targets, implementation of environmental management systems, ISO 14001/EMAS certification, environmental reporting, environmental requirements inside the supply chain, the trend of GHG emissions and the trend of energy consumption for their environmental impact. The analysis was carried out on the basis of given regions of the world and individual sectors of the economy, especially the energy industry.

1. Introduction

Sustainable development are activities aimed at a sustainable economy. Undoubtedly, we cannot avoid the development of the economy and technology, and its progress will continue to grow. Hence, the negative effects can also be very large. Therefore, it is crucial to take care of balance and eliminate these negative effects. Fires, destruction of the environment, global warming and the depletion of natural resources are effects of human activity. The development of companies also contributes to the destruction of the environment, thus lowering our quality of life [1]. The concept of sustainable development draws attention to the need to balance the benefits of economic development with their negative effects. Therefore, an important task is to reduce the negative impact on the economy. The same assumptions can be found in the concept of corporate social responsibility, which gives instruments and guidelines for managing an organization in an ordered manner [2].
Corporate social responsibility (CSR) is not a new concept of management, but it is very important from the point of view of economic development. Its impact is significant in all dimensions of the economy [3]. In this article, the environmental aspect of CSR was analyzed. It is particularly important from the point of view of some sectors of the economy. In this study, the main emphasis was placed on the analysis of the energy industry. It is one of the sectors of the economy that unfortunately has a negative impact on the environment [4,5]. The analysis was carried out from the point of view of the concept of corporate social responsibility only in the environmental area and compared with other sectors. It can be concluded that this is a research gap appearing in the world literature because there is no international research on this subject. Numerous studies can be found in the literature on sustainable development and its impact, as well as the directions of changes for the energy industry. It is undoubtedly important nowadays to care for the balance, especially in terms of energy generation, obtaining renewable energy sources, saving water, pollution and sewage. These are key actions for sustainable development, as can be found in many literature sources and research. However, there are no studies on the analysis of the environmental aspect of CSR for the energy industry. In this study, we present the differences and dependencies between sustainable development and the concept of corporate social responsibility.
However, it should be emphasized that this analysis should also be carried out on the other two aspects of the concept of corporate social responsibility—social and economic. However, due to the limited scope of the study, only the environmental aspect was analyzed in the article. The aim of the article is, therefore, to present the environmental aspect in the context of corporate social responsibility in the energy industry as a direction for sustainable development of the economy. The article was based on the analysis of the literature and databases presenting CSR, which was created on the basis of questionnaire research.

2. Corporate Social Responsibility and Sustainable Development—Review of the Literature

2.1. Corporate Social Responsibility—The Idea and the Possibility of Using

Over the past few years and even centuries, a huge development of the economy has been observed. From agriculture, through the industrial economy, to the age of knowledge, dominated by technology and intellectual capital. However, the development of the economy contributes to negative actions, not only having negative impacts on the environment but also giving rise to employee abuse or unethical activities. These changes made it necessary to create the concept of CSR. Although it is not new, its postulates are very topical today. There are many divisions of CSR in the literature and economic practice. Among them, one can mention, for example, the division into economic, environmental, social and ethical [4,5,6] concerns. This is not the only breakdown that indicates the area of interest for corporate social responsibility. A.B. Carroll first pointed to society’s economic, legal, ethical and discretionary expectations of organizations [7]. A few years later, the same author revised the four aspects of the CSR pyramid as economic, legal, ethical and philanthropic [8]. The concept of corporate social responsibility revolves around the inside of the company and its management attitudes towards employees, but also stakeholders, the local community and the entire society. It should be emphasized that companies are not only the subject of rights and obligations, but also of economic, legal and social responsibility [9]. Moreover, it is the processes of integrating employees and their working conditions that will affect the competitive advantage of a given organization [2,10]; hence, it is all the more important to care for the human capital of the company. It should be emphasized that the concept of corporate social responsibility comes down to specific skills with its social and natural environment [11]. R.W. Griffin points out that corporate social responsibility is a set of obligations of an organization towards the local society in which it operates [12]. S. Young states that CSR is a strategic and long-term approach in which the following are important: social dialogue, transparent relations and searching for solutions applicable to everyone [13]. Moreover, many authors indicate that companies, thanks to their social and political activity, build the welfare of society, including their quality of life [14,15,16,17]. The goal of corporate social responsibility is undoubtedly also to care for the interests of others, including employees and the society, as well as all other stakeholders [18]. Thus, these resources are used for broad social purposes, not just for the narrow, limited interests of individuals and companies [19]. It is important, however, that the principles of open competition are met in the operations of companies, and that the operations are conducted without fraud [20], which is also indicated by emphasizing ethical aspects. One of the areas discussed as a key in the concept of corporate social responsibility is the environmental aspect. Influencing society is also influencing their environment [21], place of life and work, everything that surrounds us, and, from a global perspective, climate change. Hence, it is important to minimize the negative impact of production and mining activities so as to degrade the environment as little as possible.

2.2. CSR and Sustainable Development in the Energy Industry

In the idea of corporate social responsibility, the environmental aspect, to the greatest extent, refers to the idea of sustainable development. Although this concept is narrower in scope and falls within the category of sustainable development, it provides us with specific solutions, good practices and a tool that is dedicated to companies for their responsible operation. J. Adamczyk states that “the obligation to conduct business in a transparent and ethical manner according to the principles of sustainable development consists in striving for social welfare, taking into account the expectations of stakeholders, but in accordance with the law and norms of behavior” [22]. It should be emphasized that in the definition prepared by the UN, corporate social responsibility is the overall contribution of businesses to sustainable development [23]. Sustainable development is a response to all three main and interrelated issues of the modern world: economic development, social progress and natural environment relations [24,25,26]. “Sustainable development is based on economic-environmental integration, environmental protection, intergenerational commitment and intergenerational and intergenerational justice, quality of life and participation of individuals in the development process. It becomes concrete when it improves the quality of human life and, second, the planet’s viability” [25,27]. It can be concluded that sustainable development is development that meets the needs of the present without compromising the ability of future generations to meet their own needs [28].
The world strives for sustainable development, and the concept of corporate social responsibility on a micro scale indicates the direction of a responsible action. Energy industry is one of the sectors of the economy that is at the center of both concepts. Unfortunately, it also generates a negative impact on the environment through the emission of gases, but also waste [29,30,31]. The negative impact on energy production is a problem not only for individual companies, but also for individual household policies, and these problems vary widely across the world [32]. In particular, it is a problem that concerns the environment, natural resources and the search for alternatives to natural resources that are starting to run out [33,34,35]. Responsible action, especially in this sector, can meet the needs of the present without endangering future generations.
Much of the literature refers to sustainable development in the energy sector, pointing to new forms of alternative solutions. Attention is also drawn to the problem facing the economy, namely, the depletion of natural resources and the need to search for alternative forms [36,37,38,39,40]. When analyzing the results of research on CSR in the energy industry, it can be stated that this sector has been analyzed in this area in terms of reporting [41], management and corporate governance [42]. The presentation of the implementation and effects of CSR in the environmental aspect in the energy sector requires further research and is an area for further considerations.
The public, environmental and governmental organizations state that CSR in the field of the environment and society of energy companies is their responsibility. The changing climate and growing electricity needs make it necessary to define CSR for the energy sector [43]. ECOTEC research (2007) presents the key success factors of CSR policies on the markets for electricity and gas [44]. OLADE (Quito, Ecuador) (2014) developed a methodology for companies in this sector, which focuses on the role of CSR promoters in given countries and regions [45]. The critical issues identified by the Uusimaa Regional Council (Helsinki, Finland) in cooperation with the countries of the Baltic Sea Region (2007) and Wilde-Ramsing (2009) provide a comprehensive list of indicators from the literature that should form the basis for the development of a comprehensive CSR policy. These issues can be divided into three pillars of sustainable development for the energy industry: social issues, environmental issues and economic issues [46,47]. Enterprises from the energy sector are the largest consumer of fossil fuels, and thus emit the most carbon dioxide. This affects the high consumption of fuels and fuel mixtures. Electricity generation, which is increased in highly developed countries, may have negative effects on the environment, such as climate change, the deterioration of air, soil and water quality, production of hazardous waste, loss of biodiversity and acid rain [43].
There are many related problems with the supply and use of energy. These types of problems and their consequences vary by country or region. The problems facing developing countries are different from those facing developed countries. Past trends and future trends in energy consumption in developing countries, such as population growth, also increase energy consumption, which in turn affects the ecosystem. The prospects for changes in energy supply were considered, such as increasing the role of gas in cooking food and generating electricity, displacing oil as in the case of replacing fuel-powered vehicles with electric vehicles, and the use of renewable energy sources for energy production such as biomass, solar, wind, etc. [33].
CSR is important for the energy sector in the areas of economic, social and environmental concerns. It can be seen that companies from the energy sector are increasingly adapting their CSR policy to the standards of sustainable development and its reporting, such as UN Global Compact, OECD Guidelines for Multinational Enterprises (Paris, France), Global Reporting Initiative (GRI) (Amsterdam, The Netherlands) and Carbon Disclosure Project (CDP). According to studies by EPSU et al. [46], over 70% of the surveyed enterprises in the energy sector are members of the UN Global Compact, and about 38% have a clear reference to the OECD guidelines in their publicly available documents on CSR policy. In addition, 80% of companies use the CDP standard to report CO2 emissions, and 67% report in accordance with the GRI G3 sustainability reporting guidelines. The analysis also showed that 63% of companies that apply the GRI guidelines also use the Electricity Sector Supplement (EUSS). About 38% of companies take advantage of all four CSR initiatives, and 13% have not incorporated any of the four into their policy. Research has also shown that while companies are eager to report CSR and make efforts to apply international standards, it does not end up being responsible behavior. The authors of the report conclude that a set of tools and an expert knowledge center should be created that will connect different organizations in order to better implement CSR assumptions for the energy industry [46].
Research in the literature mentions reporting for the energy sector. There are indicated guidelines to what extent enterprises should act pro-social and pro-environmental. These issues are related to sustainable development due to the activities of this sector. The authors of the unanimous opinion point to the low level of compliance of enterprises from this sector with the CSR assumptions. Going further, they even state that it is closer to public relations than caring for the environment. Later in the article, we present research showing the level of CSR for the energy sector. To better illustrate this sector, it is be compared with other sectors. The mere presentation of the energy sector might not show its situation in the context of the entire economy.

3. Materials and Methods

Data for this analysis were obtained from the company GES Investment Services. They came from questionnaires concerning corporate social responsibility. Questionnaires were created based on interviews, document analysis, verification of reports, policies, codes of conduct and compliances. A total of 1718 companies from 29 countries, representing 64 industries, were assessed in terms of the environmental aspect of CSR. The overall rating in this area could reach a value from 0 to 24 and was the sum of eight indicators, presented in Table 1.
The score for each indicator was in the range of (0–3). A lack of points meant the company was not taking specific actions in a given scope or their non-compliance with legal regulations, international agreements and guidelines of social responsibility. To score one point, specific terms for the indicator must be met. For two points, a company must exceed those requirements. For the maximum score, companies must fulfill all criteria. Points were awarded for having appropriate routines and organizational solutions concerning environmental issues and processes, adopting environmental policies and setting specific targets, the scope of EMS implementation, ISO 14001 or EMAS certification, the range and the quality of environmental data disclosed by the company, appointing environmental requirements in relations inside the supply chain and the environmental performance illustrated by the GHG emissions and energy consumption over time.
Research was conducted in three phases: general analysis, comparative regional analysis and comparative sector analysis. In the first phase, the whole group under study was assessed to identify their biggest problems in the environmental aspect of CSR. Simple descriptive statistics were used for this purpose. For the next two phases of the research, companies were divided into groups according to two classifications: regional, taking into account geographical and cultural proximity, and sector, according to the Global Industry Classification Standard (2008) (Table 2 and Table 3).
In the regional and sector analysis, statistical methods were used to assess the differences between groups. The Shapiro–Wilk test was chosen to verify the normality of the distribution of results obtained inside specific groups. Test statistics were calculated according to the formula [48]:
W = i = 1 n a i X i 2 i = 1 n ( X i + X ¯ ) 2
where ai can be found in mathematical tables, Xi is the ith order statistic and x ¯ {\displaystyle {\bar {x} X¯ is the mean.
Since not all groups had distributions close to normal, there were more than two groups to compare, and in the regional analysis, those groups were not equinumerous, so the nonparametric Kruskal–Wallis test was chosen to verify statistical significance of differences. There are related ranks in the sample, so the statistics are counted using the following formula [49]:
H p = H 1 i = 1 t i 3 t i N 3 N
where N—total number of observations; ti—the number of observations with the same rank; H—the result of the Kruskal–Wallis test without applying the corrections for associated ranks [50].
H = 12 N N + 1 i = 1 p R i 2 n i 3 N + 1
where p—number of compared groups; Ri—sum of ranks in a given group; ni—the number of observations in a given group.
Post hoc analysis Mann–Whitney tests were performed for each pair of assessed groups with the following formula [51]:
U = R min k n k n k + 1 2
where Rmin (k)—sum of ranks for the group in which the sum is smaller; nk—number of observations in the group with the lower sum of ranks.
Statistics for multiple pairwise comparisons were calculated with the Bonferroni corrected version. The correction of significance level was performed in line with this formula [52]:
PC α = EW α k
where PCα—Bonferroni corrected significance level; EWα—nominal significance level; k—number of tests.

4. Results

Regardless of the type of activity and location, each company is related to the environment. It is always a two-way relationship. Firstly, the environment provides the resources necessary to run the business. Secondly, the environment is where these resources return in the form of waste and pollution. The capabilities of the environment in both roles are limited and it is important not to use them excessively.

4.1. General Analysis

First, the basic statistical indicators were analyzed. The analysis covered all the researched companies—1718 organizations. The analysis concerned the comparison of the individual analyzed CSR factors, which are presented in Table 1.
Zero grades were noted in all analyzed indicators. They accounted for 8.38% in the case of reporting and 54.66% for ISO 14001/EMAS certification (Table 4). Meanwhile, 7.74% of entities obtained zero grades in all, and 61.53% in at least one indicator.
Except for environmental routines, maximum ratings were recorded in all indicators. There were no companies with maximum rating. The highest total grade was 22. Considering the average values, the order of indicators starting from the highest grades is as follows:
Environmental management system;
Reporting;
Environmental routines;
Environmental policies;
GHG emissions;
Energy consumption;
ISO/EMAS certification;
Environmental requirements inside the supply chain.
The last one can be identified as the main problem for companies to operate in an environmentally responsible manner. Considering the medians, the order is similar, but ISO 14001/EMAS certification is worse, being the only indicator with the median value of 0. This is due to the fact that most companies do not have the appropriate certification at all, and the certified ones implement it on a wide range of operations.
The standard deviation achieved values in the range (0.68–1.14); however, due to the large variation in central measures, the coefficient of variation better reflects the heterogeneity of the groups. The most similar grades were obtained in reporting indicator, the least in ISO 14001/EMAS certification.

4.2. Regional Comparative Analysis

In the next stage, the relationship between the aforementioned indicators of CSR depending on regions was analyzed. The distribution of general ratings in regional groups is presented in Figure 1.
Four regional groups achieved a higher median of overall rating than the entire population: Western Europe, Southern Europe, Benelux and Japan. The lowest median, but also the first quartile results, were recorded for Northern Europe. All regions had entities with an overall zero rating. The companies with the highest overall rating represented the North American group. As there is no single group with the highest values of extremes, median, first and third quartile at the same time, there is no clear leader among the regions. It is also impossible to unequivocally identify the region with the worst results.
The differences seen in the above chart required statistical confirmation. The statistical significance of the differences was verified using the non-parametric Kruskal–Wallis test. The results of the test indicated that at least one of the groups came from a different population. At a later stage, in post hoc analysis pairs were tested using the Mann–Whitney method. The results are shown in Table 5.
Since there were multiple comparisons made, it is more accurate to consider Bonferroni corrected values. Of 28 differences, 15 appeared to be statistically significant. The table above in combination with Figure 2 made it possible to draw some assumptions. Western Europe, Southern Europe and Japan are all significantly better than Northern Europe, Australia, North America and China, but no different from each other. All these countries created a high-scoring group in terms of the environmental aspect of CSR. Northern Europe, North America and China have no significant differences between each other but they all differ significantly from the members of a high-scoring group. Benelux and Australia should be considered as the links between the groups. Our statistical analysis of the differences include Benelux and Australia in high- and low-scoring groups, respectively, but they do not differ significantly from each other.
The most homogeneous group in terms of obtained overall ratings was Western Europe, whose coefficient of variation was 35.56%. The highest diversity was observed in Northern Europe with v = 74.61%.
The overall score is the sum of eight partial grades. The values of their medians achieved by specific regions are presented in Table 6.
The data in the table confirm the previous assumption about the high- and low-scoring groups of regions. It is important to point out that Benelux is the highest scoring region in two indicators concerning actual environmental performance: GHG emissions and energy consumption. Companies representing all regions struggle with creating and implementing environmental requirements in the supply chain. It signals the global problem of turning into a broader perspective of CSR—from individual into supply chain activities. The biggest dispersion among regions were observed in ISO 14001/EMAS certification.
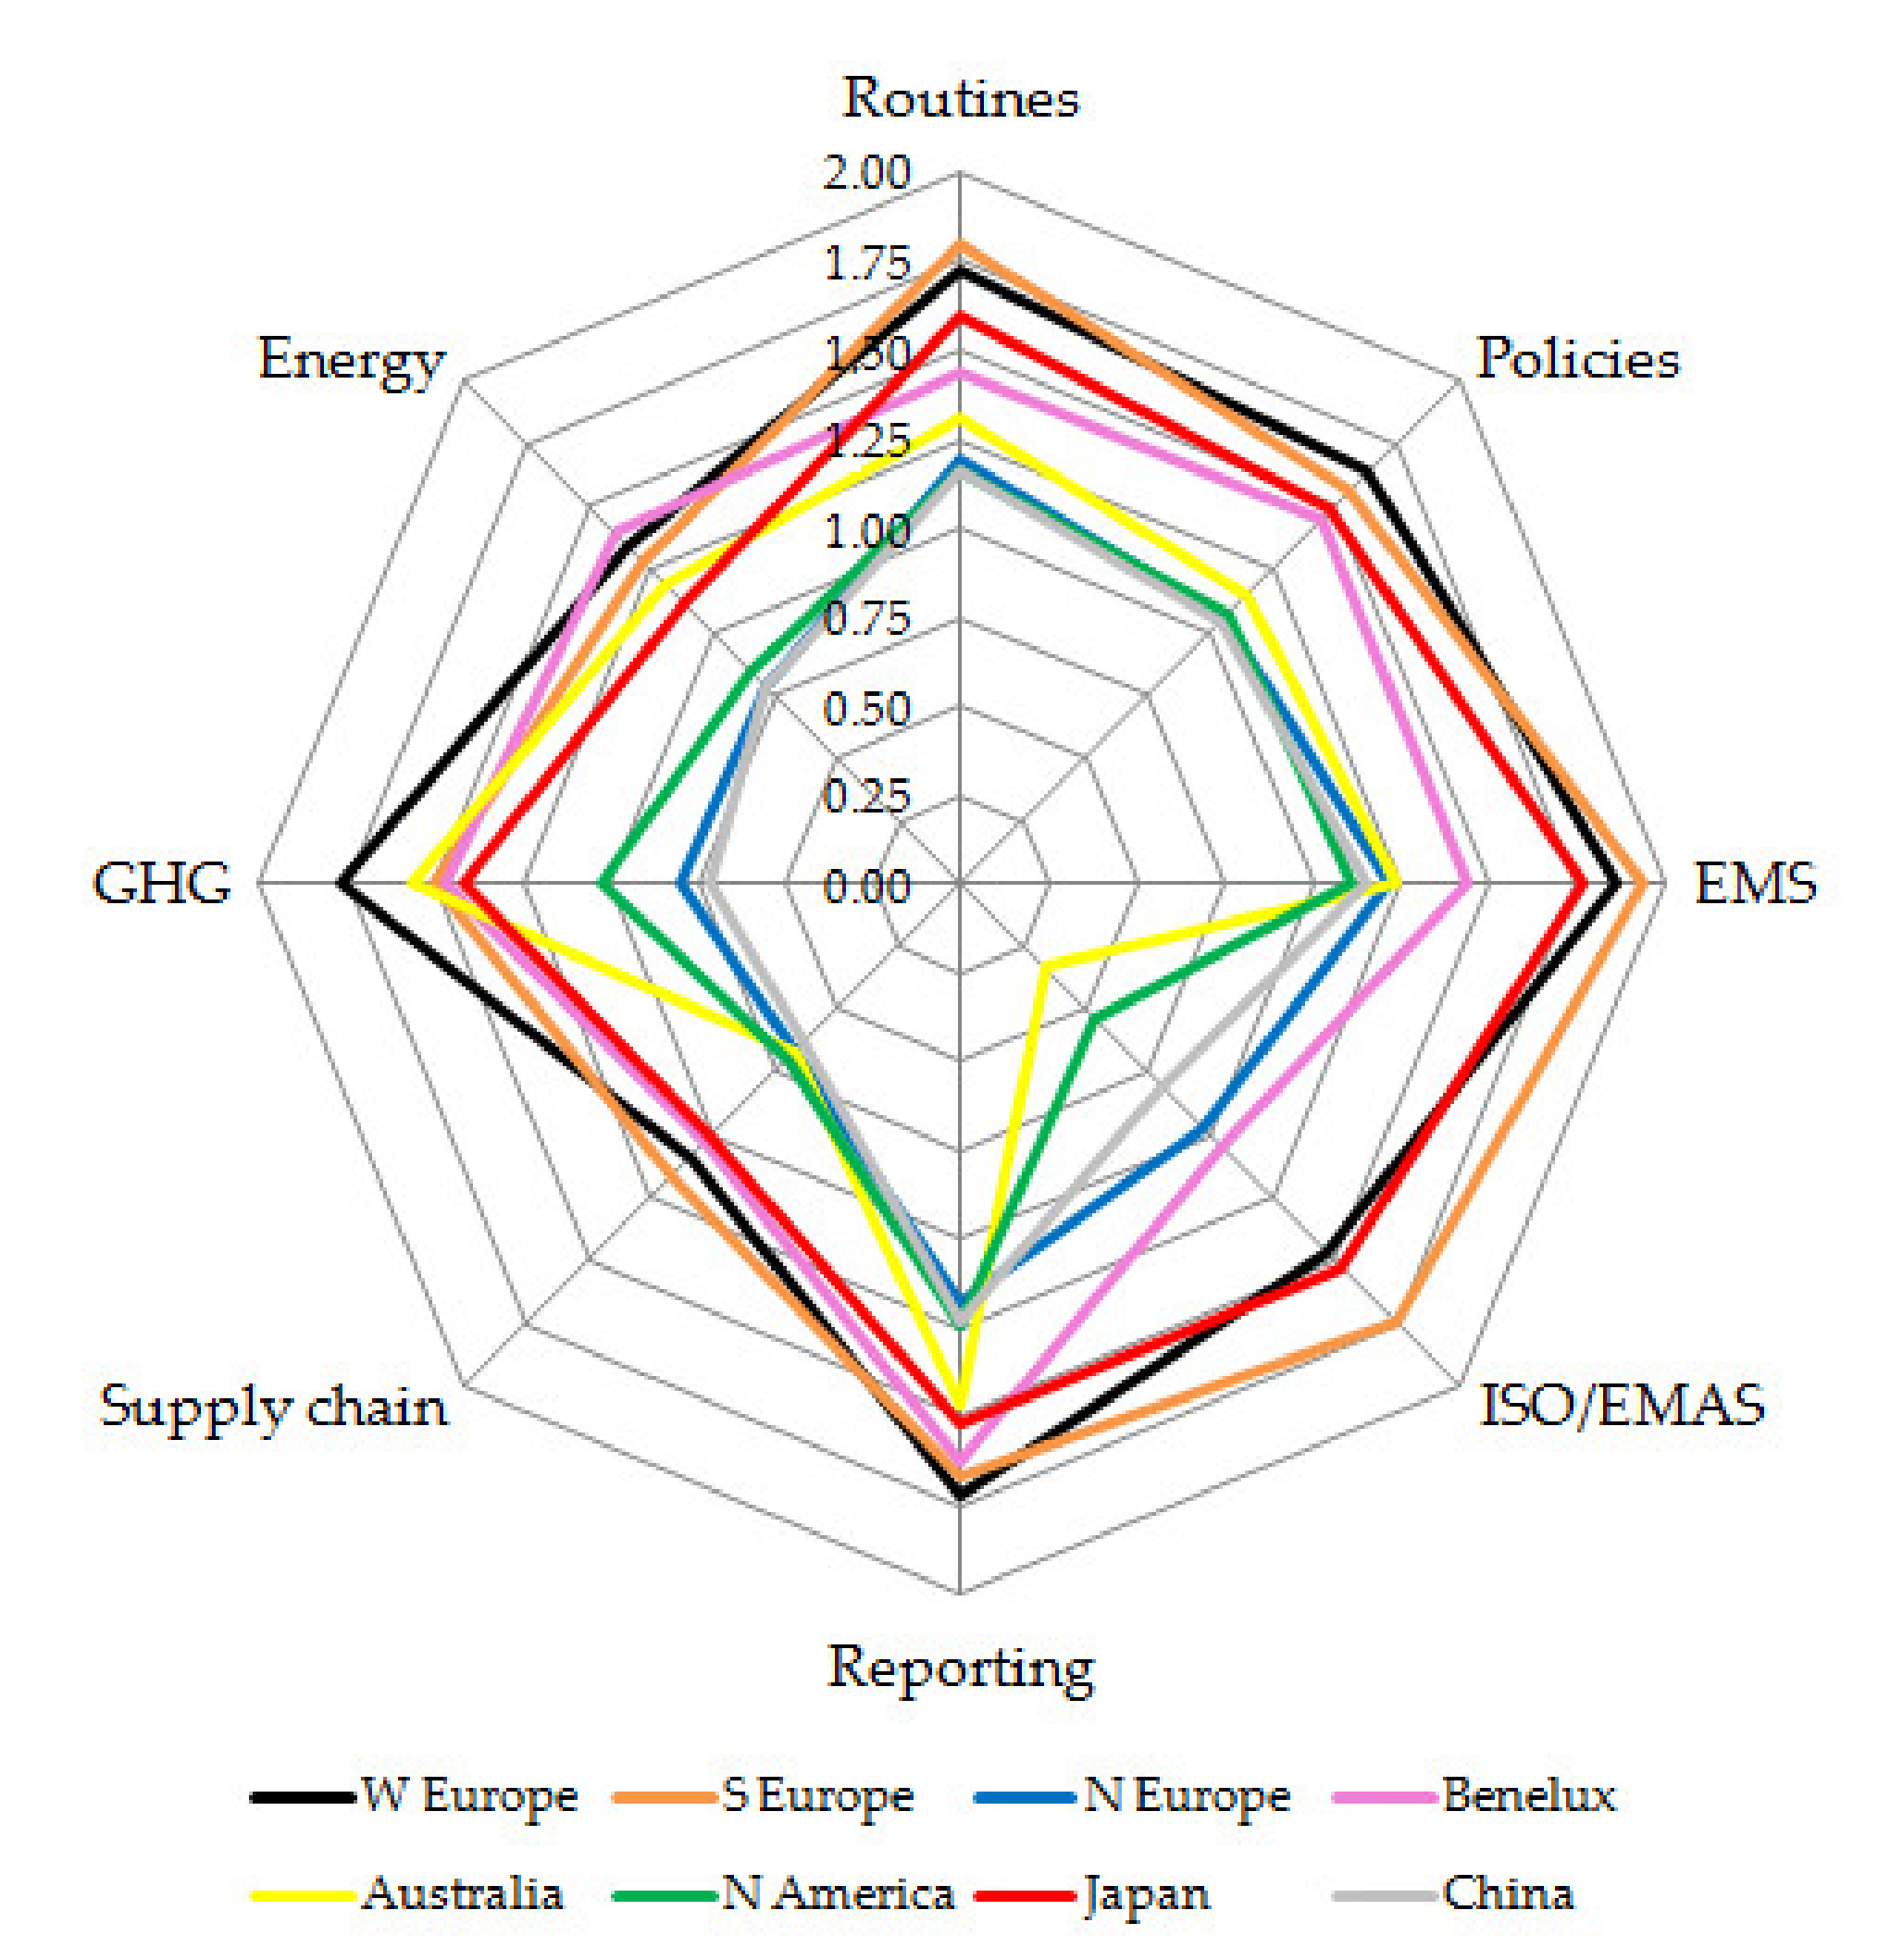
Disproportion between grades obtained in assessed indicators is also confirmed by mean values, as clearly illustrated in Figure 2.
The above analysis on the radar chart (Figure 2) shows:
China, North America, Northern Europe and Australia were the lowest rated regions in terms of the environmental aspect of CSR;
The highest rated regions were Southern Europe, Western Europe and Japan;
There was a noticeable problem in the field of supply chains and consumption energy, which is clearly an area for improvement for all regions, as it is a key area for all economies;
Factors related to management, such as reporting and implementation of the environmental management system, constituted the best-assessed area, which is certainly part of the marketing activities of companies and legal restrictions;
Large discrepancies could be observed between the perceptions of ISO 14001/EMAS certification systems and standards across countries. This may be the result of trends and fashion in the scope of applied certificates and their departure from them in individual countries. These differences are very noticeable and show that this certification has its supporters and opponents.
The regional analysis showed large differences between countries and activities in the field of the environment in line with the concept of CSR. Similarly, within the individual CSR factors, there are also considerable discrepancies in the level of application.

4.3. Sector Comparative Analysis

Four sectors achieved a higher median of overall rating than the entire population: materials, utilities, industry and consumer staples. Moreover, the first two mentioned sectors obtained values of the first quartile higher than the median for the whole population. The two leading sectors are easy to identify in the figure even without numeric data (Figure 3).
The group with the lowest median and the third quartile values is finance. There were no entities with an overall score equal to 0 in the utilities sector. In this case, the Kruskal–Wallis test also indicated that at least one of the groups came from a different population. Table 7 presents the results of post hoc analysis carried out using Mann–Whitney tests.
In the sector analysis, high- and low-scoring groups were also shaped. Utilities, industry, consumer staples and materials obtained significantly higher results than consumer discretionary, telecommunication services, IT, energy, health care and finance. There were no significant differences observed inside the groups except two cases. Materials could be positioned as an individual leader but results of this sector were not significantly better than those in utilities. In the low-scoring group, the financial sector had a significantly lower score than consumer discretionary.
The coefficient of variation of the overall ratings obtained in the sectors was in the range of 35.34–80.83%. The smallest diversity of grades occurred in materials, while the largest was in IT sector (see Table 8).
As it was in the case of geographical analysis, the lowest partial grades were obtained in the case of environmental requirements inside the supply chain (Table 8). The highest grades were obtained for environmental management systems.
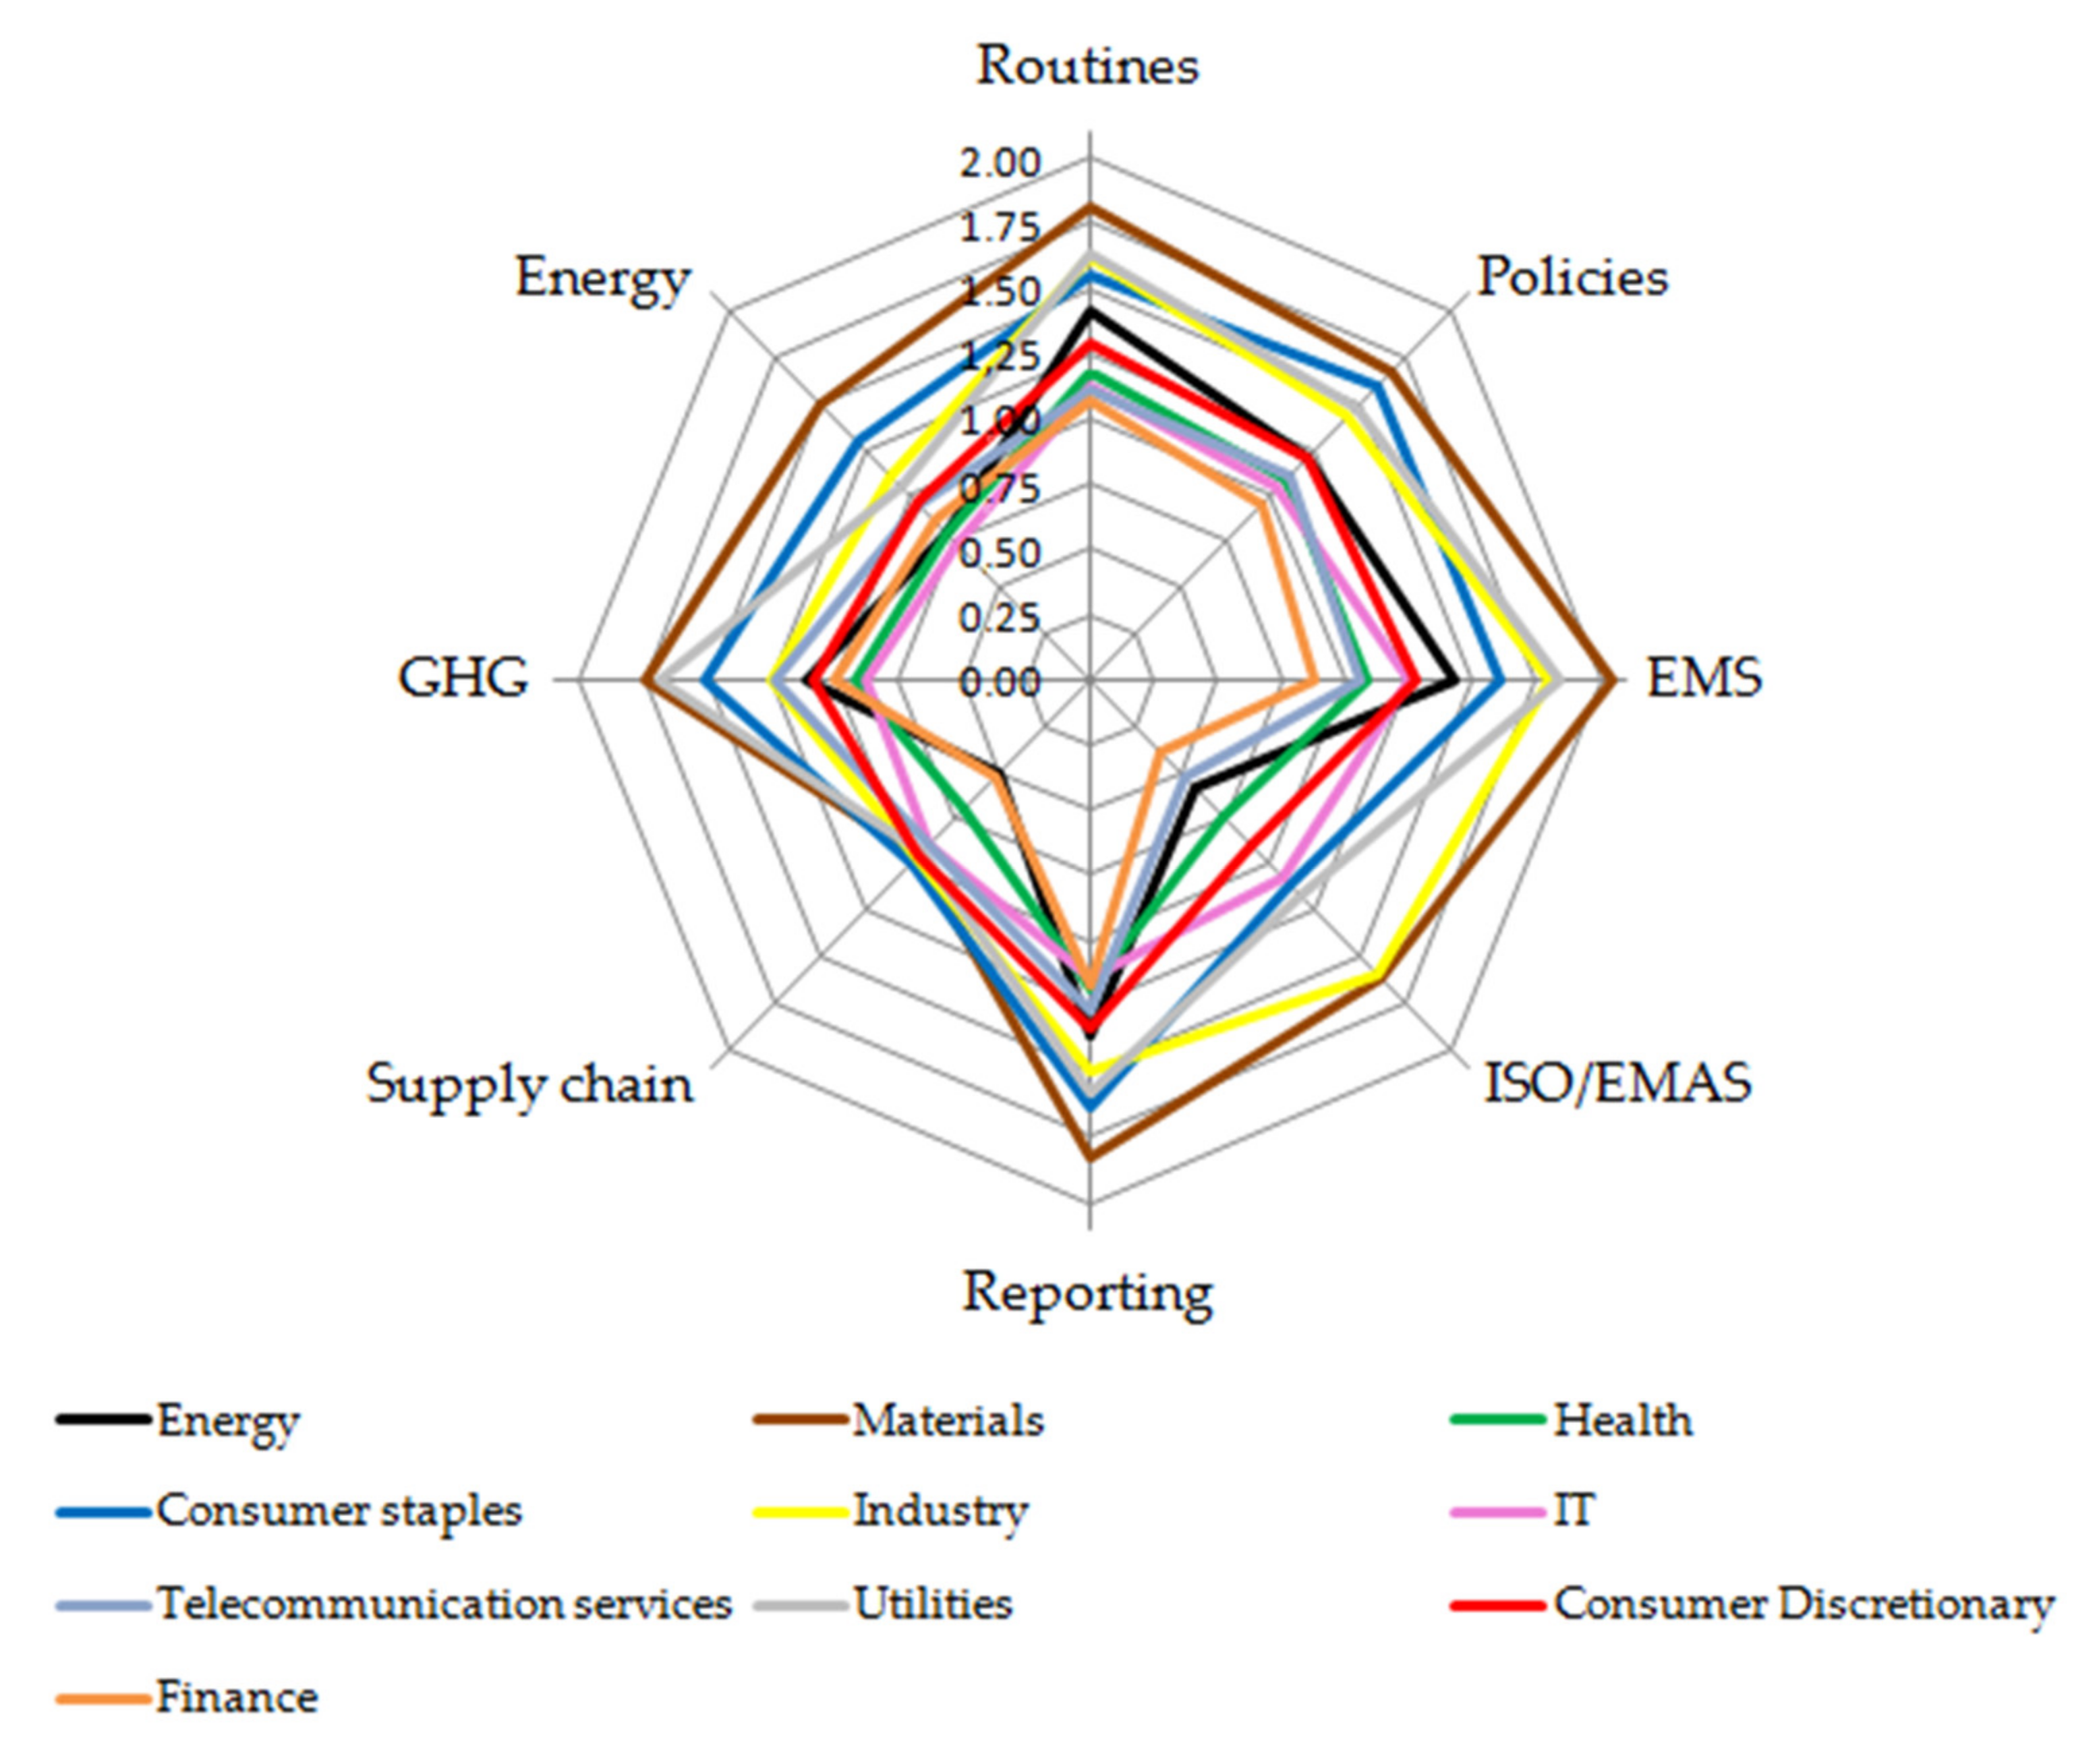
Figure 4 shows mean values of grades obtained by sectors and illustrates the differences between specific sectors in all indicators.
From the analysis of CSR indicators in the context of the sectors of the economy (Figure 4), one can conclude:
The widest spread of the grades was in ISO 14001/EMAS certification, which shows that there are different approaches to the application of ISO and EMAS certification in different sectors;
The smallest span was observed in environmental requirements in supply chain, and thus, these are areas for improvement in all sectors;
The highest rated sectors were materials, industry, telecommunication services, consumer staples and utilities;
The lowest rated sectors were finances, telecommunication services and health care;
Just like in the regional analysis, in the sector analysis, routines and implementation of environmental management systems (EMS) were rated the highest.
The analysis of individual sectors of the economy showed similar conclusions as the analysis of regions in terms of the development of the environmental aspect according to the CSR concept.
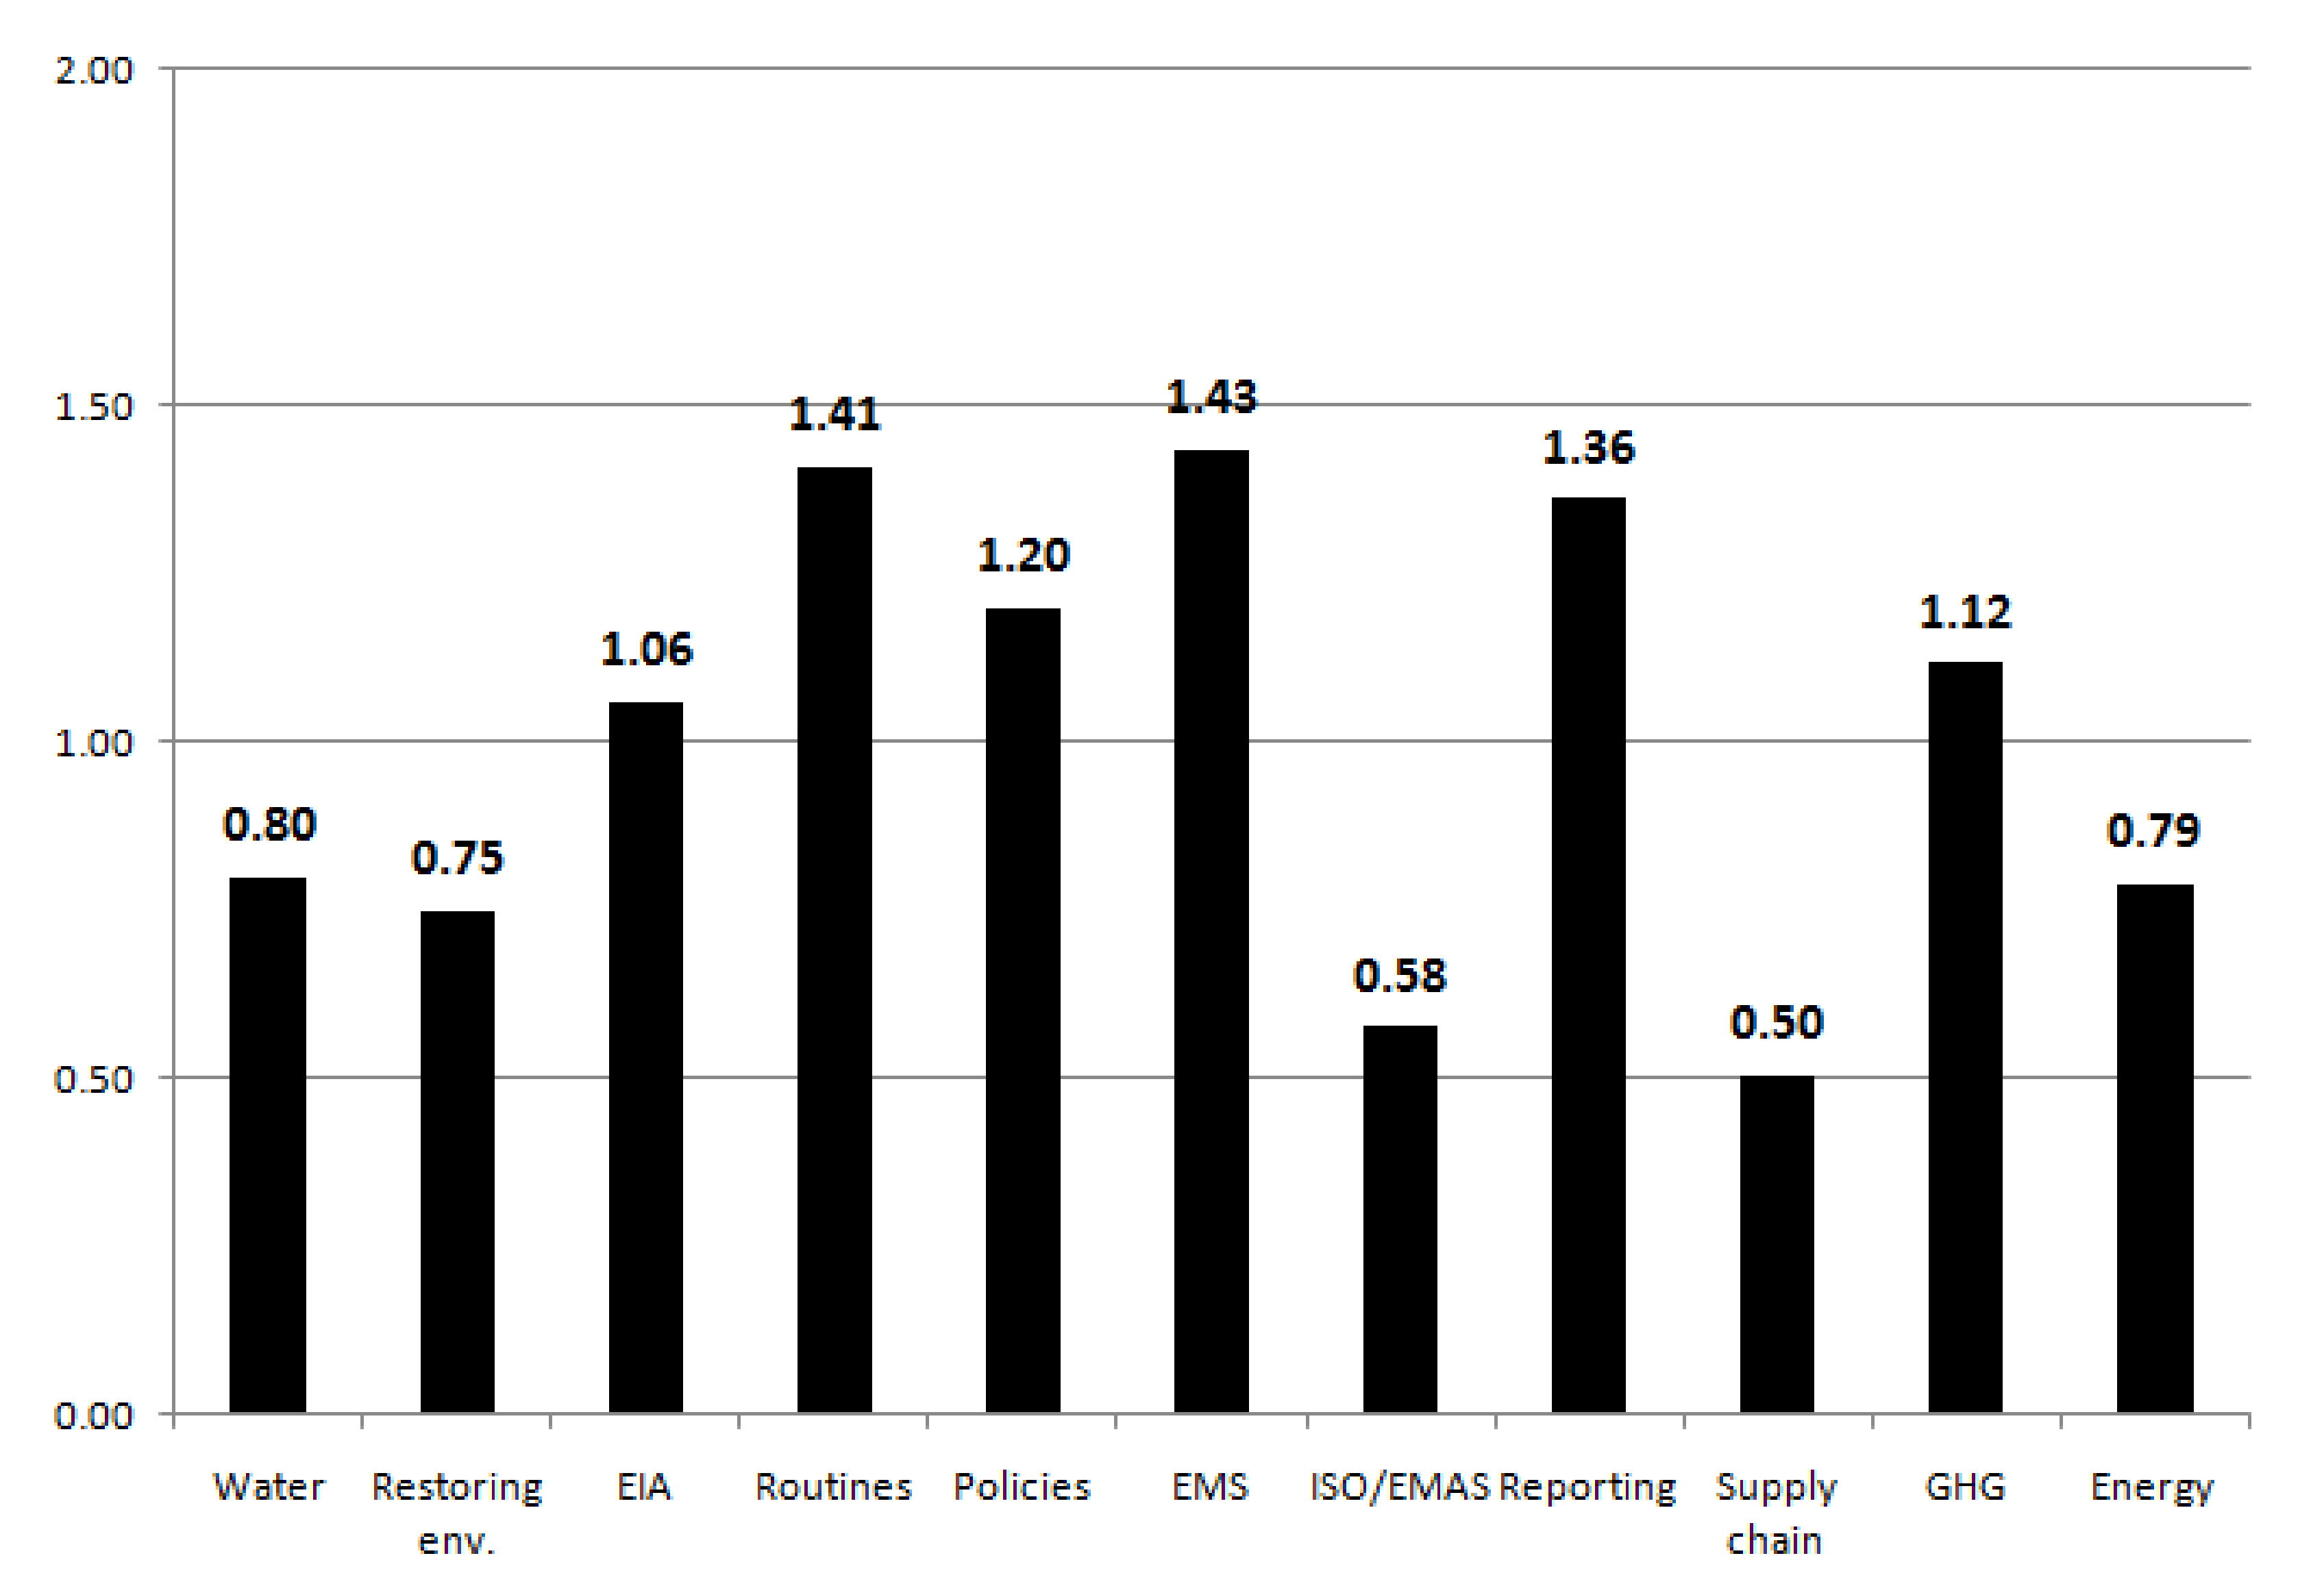
In the last stage of the analysis, only the results for the energy industry were compared. Figure 5 shows the average values for individual CSR indicators in this sector. It was prepared in accordance with the methodology of the previous analyzes. Additionally, three CSR indicators specific only to this industry were presented. They answer the questions:
How has the amount of water consumption changed over time? (Water)
Is the company taking its responsibilities towards restoring the environment? (Restoring env.)
Does the company conduct environmental impact assessment in its project development process? (EIA)
Considering only the energy sector compared to the others, the following conclusions can be drawn:
It was worse compared to other sectors of the economy, especially in Northern Europe, North America and China;
It was in the middle position compared to other sectors;
CSR in supply chains and ISO 14001/EMAS certification were the worst performers, just like in other sectors. However, when it comes to supply chains, the energy industry has the lowest index. This may be related to the monopoly in this type of production and the reluctance to cooperate with other actors in the supply chain, as these enterprises are the main cooperators of the supply chains;
Unfortunately, the energy sector was rated very poorly in the area of energy. This raises serious doubts as to the approach of these companies to CSR assumptions and may suggest that these companies operate only on the basis of reporting and public relations obligations;
The energy industry did not stand out among other sectors, because here the highest rated were routines, reporting and implementing environmental management systems. These are elements that are mandatory for companies and they are even forced to report and use these systems;
The lowest rated factors were those which were the most influential of the energy industry and which should be perfectly implemented for this sector. Factors specific to the energy industry, such as water consumption, whether the company takes responsibility for environmental restoration and whether they supervise the company’s environmental impact, are rated very low.
After carrying out the above analysis, it can be concluded that the level of CSR for the energy industry is quite low. Factors specific to this sector are rated the lowest. Moreover, in the context of other sectors, the energy sector is average. It is in the middle of all sectors studied. The conducted analysis indicates the key factors for the CSR environmental area. Compared to the other sectors, the energy industry performed at an average level. In the context of sustainable development, many countries and regions are faced with the need for improving the current situation.

5. Discussion

The environmental aspect of CSR is crucial for the operations of all the companies regardless of their profile and location. In the long term, it determines the functioning of the whole economy and the well-being of future generations. This study showed the approach entities have towards the environmental aspect of CSR. The following conclusions can be drawn from the conducted research, summarizing the conducted analyses:
One of the conclusions that arises after the statistical analysis is the fact that companies achieved the highest grades in implementing environmental management systems and reporting environmental data. The same results were found in the analysis by region and sector. It can be concluded that these are activities related to public relations and legal regulations;
The biggest problems for the companies are ISO 14001/EMAS certification and setting environmental requirements in the supply chain. The results of the research show that companies pursue a policy of corporate social responsibility in relation to operating within their organization and social environment. Important from the point of view of effective operation, cooperation within supply chains is at a low level. This proves that cooperation within supply chains is the highest level of advancement of this concept;
Based on our analysis, 61.53% of assessed entities did not demonstrate any meaningful activities in at least one indicator, and 7.74% were passive in all eight parameters.
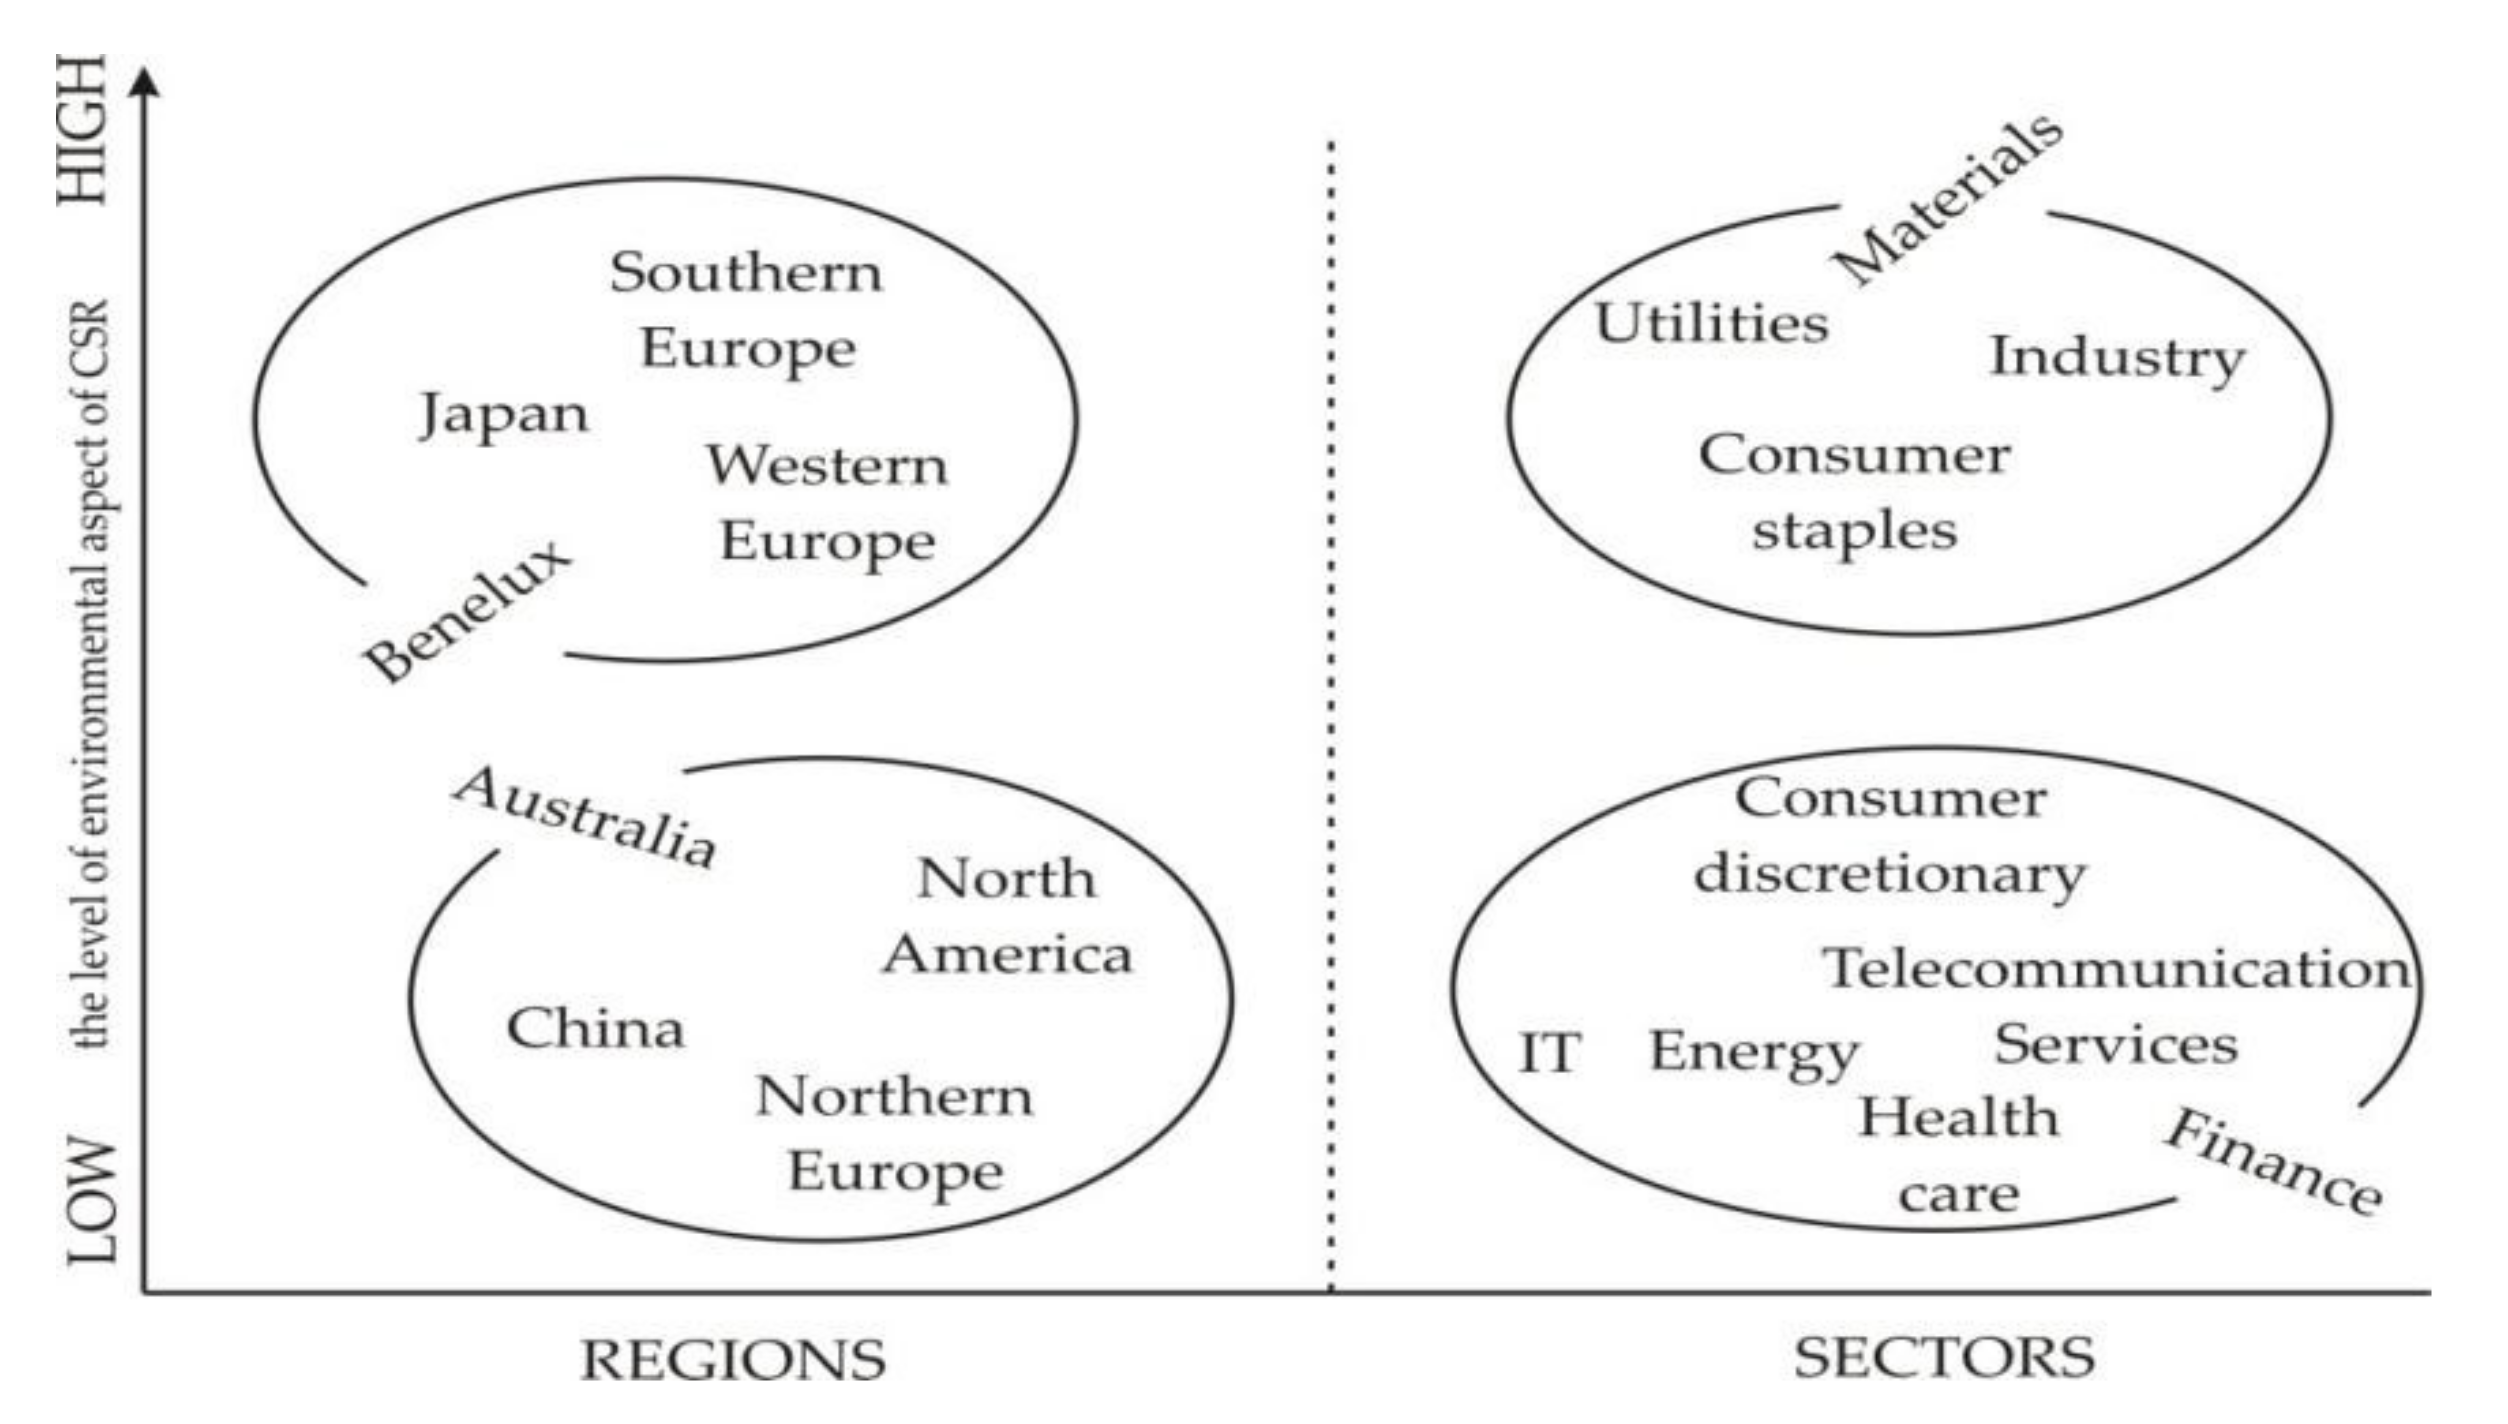
The analysis shows significant divisions within individual regions and sectors of the economy. These dependencies are presented in Figure 6.
The division into low- and high-scoring groups was made on the basis of the research results and verification of the statistical significance of the differences. Sectors/regions belonging to the low-scoring group scored significantly lower than all representatives of the high-scoring group, and at the same time did not differ significantly in this respect from each other within the group. The high-scoring group was determined analogously.
Regional and sector analysis of the environmental aspect of CSR showed that:
It is impossible to arrange the regions consecutively due to their grades in the environmental aspect of CSR. Obtained values and the analysis of statistical significance of differences showed that they should be divided into two groups of high- and low-scoring of the environmental aspect of CSR. Southern Europe, Japan and Western Europe all belong to the first group, while China, North America and Northern Europe belong to the second one. There is no statistically significant difference between Benelux and Australia, which are statistically linked to the high-scoring and low-scoring groups, respectively;
In the sector analysis, high- and low-scoring groups also exist, but there are no links between them. Instead, there were sectors which stuck out positively and negatively from others. Sectors with the best environmental practices are utilities, industry, consumer staples and materials as a leader of that group. Materials are significantly better than all other sectors except utilities. Consumer discretionary, telecommunication services, IT, energy, health care and finance sectors create a low-scoring group. The financial sector obtained significantly lower results than consumer discretionary;
Northern Europe was the most internally diversified region in terms of obtained ratings, and the least was Eastern Europe. For the sectors, these groups were IT and materials, respectively;
The energy sector shows a low level of application of corporate social responsibility. Unfortunately, the energy industry does not apply a high level of CSR guidelines. The application of the ISO/EMAS and energy consumption standards was rated the lowest here, which is related to the given sector.
The conducted analysis shows significant differences between the regions of the world and sectors of the economy. Unfortunately, compared to the research sample, the energy industry does not rank high. On the contrary, the analyzed factors indicate a low level of use of CSR concepts in the area of the environment.

6. Conclusions

The impact of companies on the environment is very high. It concerns both mining and production companies, as well as other companies in which waste can have a significant impact on the degradation of the environment. We present an analysis of the application of the concept of corporate social responsibility in terms of the environmental aspect. We performed statistical analysis of regions and sectors and found large differences and dependencies between the analyzed regions and sectors. Our results also showed changes related to ISO/EMAS certification. Currently, many countries and sectors are departing from certification, which is why this factor is no longer a determinant of CSR. This analysis should also be carried out for other aspects of CSR, but due to the limited nature of the article, we decided to describe only the environmental aspect.
In order to strive for the sustainable development of the economy, in terms of micro-individual companies, activities related to the environmental aspect of CSR should be at high level. Only those aspects which are required by law or through social pressure companies were highly rated. On the other hand, factors such as energy consumption and the situation of industry energy indicate the awareness of entrepreneurs of sustainable development, but there is still much to be improved.

Author Contributions

Conceptualization, K.H. and M.K.; methodology, K.H. and M.K.; software, K.H. and M.K.; validation, K.H. and M.K.; formal analysis, K.H. and M.K.; investigation, K.H. and M.K.; resources, K.H. and M.K.; data curation, K.H. and M.K.; writing—original draft preparation, K.H. and M.K.; writing—review and editing, K.H. and M.K.; visualization, K.H. and M.K.; supervision, K.H. and M.K.; project administration, K.H. and M.K.; funding acquisition, K.H. and M.K. All authors have read and agreed to the published version of the manuscript.

Funding

This research received no external funding.

Institutional Review Board Statement

Not applicable.

Informed Consent Statement

Not applicable.

Data Availability Statement

Not applicable.

Conflicts of Interest

The authors declare no conflict of interest.

References

  1. Sokołowska, A. Społeczna Odpowiedzialność Małego Przedsiębiorstwa. Identyfikacja-Ocena-Kierunki Doskonalenia; Wyd. Uniwerystetu Ekonomicznego We Wrocławiu: Wrocław, Poland, 2013; p. 18. [Google Scholar]
  2. Gableta, M. W kierunku operacjonalizacji pojęcia odpowiedzialności społecznej w obszarze zatrudnienia. In Kierunki i Dylematy Rozwoju Nauki i Praktyki Zarządzania Przedsiębiorstwem; Jagoda, H., Lichtarski, J., Eds.; Wyd. UE We Wrocławiu: Wrocław, Poland, 2010; p. 73. [Google Scholar]
  3. Newell, A.P. Corporate Social Responsibility: Challenges, Benefits and Impact on Business Performance; Nova Publishers: New York, NY, USA, 2014; p. vii. [Google Scholar]
  4. Huk, K. Logistyka miejska a społeczna odpowiedzialność biznesu—Wspólne obszary zainteresowania. Stud. Ekon. Zesz. Nauk. Uniw. Ekon. W Katowicach 2015, 249, 155–163. [Google Scholar]
  5. Huk, K.; Witkowski, K.; Wasilewski, W. Social aspects of urban logistics in the context of CSR. Logist. Transp. 2016, 3, 13–20. [Google Scholar]
  6. Garriga, E.; Melé, D. Corporate Social Responsibility Theories: Mapping the Territory. J. Bus. Ethics 2004, 53, 51–71. [Google Scholar] [CrossRef]
  7. Carroll, A.B. A Three-Dimensional Conceptual Model of Corporate Performance. Acad. Manag. Rev. 1979, 4, 497–505. [Google Scholar] [CrossRef] [Green Version]
  8. Carroll, A.B. Busieness and Society. Ethics and Stakeholder Management; College Division South-Western Publishing Co.: Cincinaati, OH, USA, 1993. [Google Scholar]
  9. Sokołowska, A. Społeczna odpowiedzialność małego przedsiębiorstwa—Przejawy i dylematy. E Mentor 2009, 5, 31–37. [Google Scholar]
  10. Stareček, A.; Gyurák Babeľová, Z.; Makyšová, H.; Cagáňová, D. Sustainable Human Resource Management and Generations of Employees in Industrial Enterprises. Acta Logist. 2021, 8, 45–53. [Google Scholar] [CrossRef]
  11. Adamiak, A.; Nowicki, M. Etyka i społeczna odpowiedzialność biznesu. In Podstawy Zarządzania; Zakrzewska-Bielawska, A., Ed.; Oficyna Wolters Kluwer Business: Warszawa, Poland, 2012; p. 504. [Google Scholar]
  12. Griffin, R.W. Podstawy Zarządzania Organizacjami; PWE: Warszawa, Poland, 2004. [Google Scholar]
  13. Young, S. Etyczny Kapitalizm: Jak Na Powrót Połączyć Prywatny Interes z Dobrem Publicznym; Metamorfoza: Wrocław, Poland, 2005. [Google Scholar]
  14. Ackerman, R.W. How Companies Respond to Social Demands. Harv. Univ. Rev. 1973, 51, 88–98. [Google Scholar]
  15. Jones, T.M. Corporate Social Responsibility Revisited Redefined. Calif. Manag. Rev. 1980, 5, 59–67. [Google Scholar] [CrossRef]
  16. Vogel, D. The Study of Social Issues in Management. Crit. Appraisal. Calif. Manag. Rev. 1986, 28, 142–151. [Google Scholar] [CrossRef]
  17. Wartick, S.; Mahon, S. Towards a Substantive Definition of the Corporate Issue Construct: A Review and Synthesis of Literature. Busieness Soc. 1994, 33, 293–311. [Google Scholar] [CrossRef]
  18. Weber, J.; Wasielewski, D. Corporate Social Responsibility; IABS: Pittsburgh, PA, USA, 2018; p. 40. [Google Scholar]
  19. Frederick, W.C. The Growing Concern over Business Responsibility. Calif. Manag. Rev. 1960, 2, 54–61. [Google Scholar] [CrossRef]
  20. Friedman, M. The Social Responsibility of Business Is to Increase Its Profits. New York Times Magazine, 13 September 1970; 122–126. [Google Scholar]
  21. Bajdor, P.; Pawełoszek, I.; Fidlerova, H. Analysis and Assessment of Sustainable Entrepreneurship Practices in Polish Small and Medium Enterprises. Sustainability 2021, 13, 3595. [Google Scholar] [CrossRef]
  22. Adamczyk, J. Obszary i kryteria oceny społecznej odpowiedzialności przedsiębiorstw. Pr. Nauk. Uniw. Ekon. We Wrocławiu 2014, 338, 9–19. [Google Scholar] [CrossRef] [Green Version]
  23. United Nations. UNGC Our Participants. Available online: https://www.unglobalcompact.org/what-is-gc/participants (accessed on 11 August 2020).
  24. Gore, A. Earth in the Balance; Chelsea Green: New York, NY, USA, 1992. [Google Scholar]
  25. Norouzi, N.; Ataei, E. Globalization and sustainable development. Int. J. Innov. Res. Humanit. 2021, 1, 69. [Google Scholar]
  26. Surówka, M.; Popławski, M.; Fidlerová, H. Technical Infrastructure as an Element of Sustainable Development of Rural Regions in Małopolskie Voivodeship in Poland and Trnava Region in Slovakia. Agriculture 2021, 11, 141. [Google Scholar] [CrossRef]
  27. Kelimeler, A. Constitution and Sustainable Development. İstanbul Hukuk Mecmuası 2020, 78, 1921–1957. [Google Scholar] [CrossRef]
  28. World Commission on Environment and Development. Our Common Future; Oxford University Press: Oxford, UK, 1987; Available online: https://sustainabledevelopment.un.org/content/documents/5987our-common-future.pdf (accessed on 15 July 2021).
  29. Fidlerová, H.; Mĺkva, M. Application of Selected Methods of Industrial Engineering in Enterprises in the Context of Sustainable Production. Qual. Prod. Improv. 2018, 2, 71–91. [Google Scholar] [CrossRef]
  30. Straka, M.; Rosova, A.; Malindzakova, M.; Khouri, S.; Culkova, K. Evaluating the Waste Incineration Process for Sustainable Development through Modelling, Logistics, and Simulation. Pol. J. Environ. Stud. 2018, 27, 1–10. [Google Scholar] [CrossRef]
  31. Labib, O.; Manaf, L.; Sharaai, A.H.; Zaid, S.S.M. Moderating Effects on Residents’ Willingness in Waste Sorting to Improve Waste Handling in Dammam City, Saudi Arabia. Recycling 2021, 6, 24. [Google Scholar] [CrossRef]
  32. Quinn, A.K.; Bruce, N.; Puzzolo, E.; Dickinson, K.; Sturke, R.; Jack, D.W.; Mehta, S.; Shankar, A.; Sherr, K.; Rosenthal, J.P. An analysis of efforts to scale up clean household energy for cooking around the word. Energy Sustain. Dev. 2018, 46, 1–10. [Google Scholar] [CrossRef] [PubMed]
  33. Olajuyin, E.A.; Areola, R.I. Energy and Sustainable development in developing countries. J. Electr. Electron. Eng. 2019, 1412–1415. [Google Scholar]
  34. Japee, G.P.; Oza, P. Redefining Sustainable Development. Psychol. Educ. 2021, 58, 5610–5619. [Google Scholar]
  35. Brent, A.C. Renewable Energy for Sustainable Development. Sustainability 2021, 13, 1989. [Google Scholar] [CrossRef]
  36. Saraswat, S.K.; Digalwar, A.K. Evaluation of energy alternatives for sustainable development of energy sector in India: An integrated Shannon’s entropy fuzzy multi-criteria decision approach. Renew. Energy 2021, 171, 58–74. [Google Scholar] [CrossRef]
  37. Schlör, H.; Fisher, W.; Hake, F. Methods of measuring sustainable development of the German energy sector. Appl. Energy 2013, 101, 172–181. [Google Scholar] [CrossRef]
  38. Zha, J.; Tan, T.; Ma, S. How to reduce energy intensity to achieve sustainable development of China’s transport sector? A cross-regional comparison analysis. Socio Econ. Plan. Sci. 2020, 71, 2662. [Google Scholar]
  39. Abdallah, K.B.; Belloumi, M.; Wolf, D. Indicators for sustainable energy development: A multivariate cointegration and causality analysis from Tunisian road transport sector. Renew. Sustain. Energy Rev. 2013, 25, 34–43. [Google Scholar] [CrossRef]
  40. Islam, S.M.N. Sustainable economic developments in the australian energy sector: Findings of the australian energy planning system optimization model (AEPSOM). Renew. Sustain. Energy Rev. 1997, 1, 229–238. [Google Scholar] [CrossRef]
  41. Karaman, A.S.; Orazalin, N.; Uyar, A.; Shahbaz, M. CSR achievement, reporting, and assurance in the energy sector: Does economic development matter? Energy Policy 2021, 149, 1–15. [Google Scholar] [CrossRef]
  42. Shahbaz, M.; Karaman, A.; Kilic, M.; Uyar, A. Board attributes, CSR engagement, and corporate performance: What is the nexus in the energy sector? Energy Policy 2020, 143, 1–14. [Google Scholar] [CrossRef]
  43. Stjepcevic, J.; Siksnelyte, I. Corporate Social Responsibility in Energy Sector. Transform. Bus. Econ. 2017, 16, 21–33. [Google Scholar]
  44. ECOTEC. The Impact on Employment in EU-25 of the Opening of Electricity and Gas Markets, and of Key EU Directives in the Field of Energy. Case Study Country Chapter—SWEDEN and Vattenfall; ECOTEC Research & Consulting: Birmingham UK, 2007. [Google Scholar]
  45. Latin American Energy Organization (OLADE). Methodology for the Implementation of CSR Actions in Energy Companies with Gender Equality; Latin American Energy Organization (OLADE): Quito, Ecuador, 2014. [Google Scholar]
  46. Wilde-Ramsing, J. Quality Kilowatts: A Normative-Empirical Approach to the Challenge of Defining and Providing Sustainable Electricity in Developing Countries. 2009. Available online: https://www.somo.nl/wp-content/uploads/2009/06/Quality-Kilowatts.pdf (accessed on 9 September 2021).
  47. Uusimaa Regional Council; in Cooperation Green Net Finland; District Heating Association of Latvia; Max Planck Institute for Plasmahysics; House of Europe; Energie Plus; Association of Municipalities of Estonia as well as municipalities of Sollefteå, Rehna, Grevesmühlen, Kaunas and Vantaa. Energy. Future. Responsibility. Promoting Energy Saving and Corporate Social Responsibility in the Baltic Sea Region; Uusimaa Regional Council: Helsinki, Finland, 2007. [Google Scholar]
  48. Razali, N.M.; Yap, B.W. Power Comparisons of Shapiro-Wilk, Kolmogorov-Smirnov, Lilliefors and Anderson-Darling Tests. J. Stat. Model. Anal. 2011, 2, 21–33. [Google Scholar]
  49. Guo, S.; Zhong, S.; Zhang, A. Privacy-preserving Kruskal–Wallis test. Comput. Methods Programs Biomed. 2013, 112, 135–145. [Google Scholar] [CrossRef]
  50. Ostertagová, E.; Ostertag, O.; Kováč, J. Methodology and Application of the Kruskal-Wallis Test. Appl. Mech. Mater. 2014, 611, 115–120. [Google Scholar] [CrossRef]
  51. Zar, J.H. Biostatistical Analysis; Prentice Hall: Hoboken, NJ, USA, 1998. [Google Scholar]
  52. Warner, R.M. Applied Statistics; SAGE Publications: Thousand Oaks, CA, USA, 2008. [Google Scholar]
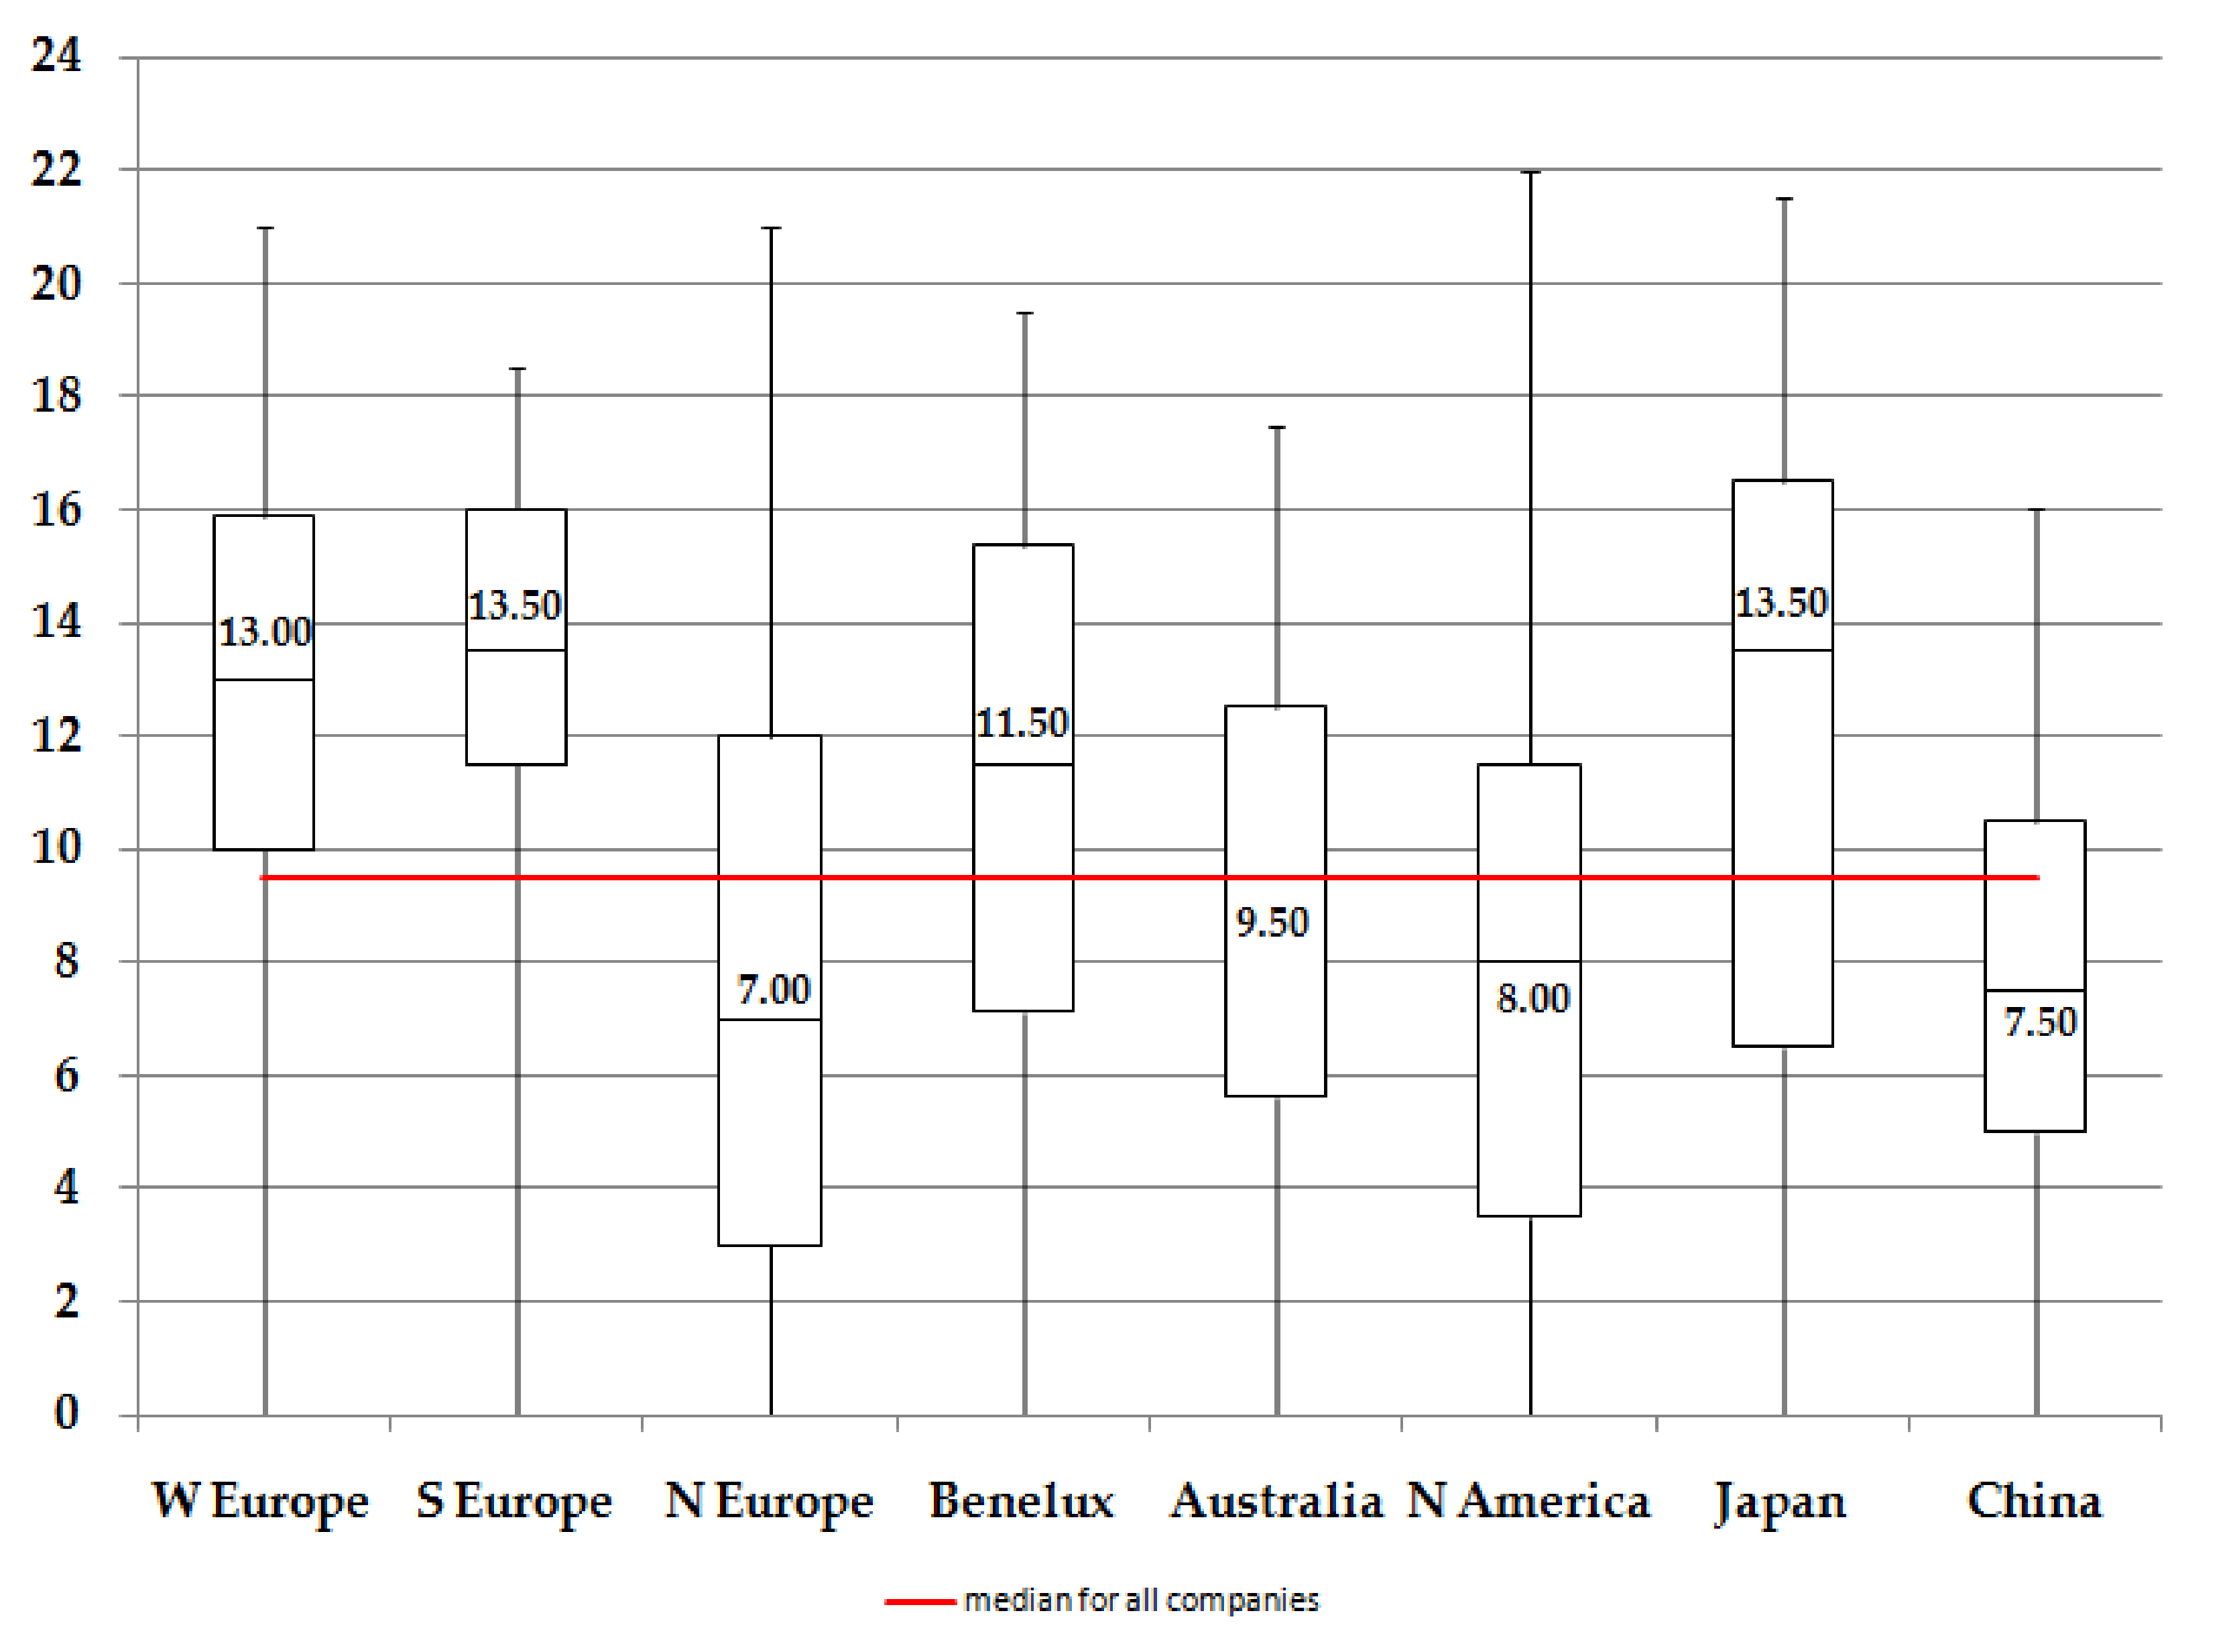
Figure 1. The distribution of overall grades in regions.
Energies 14 05993 g001
Figure 2. Mean values of grades obtained by regions in assessed indicators.
Energies 14 05993 g002
Figure 3. The distribution of overall grades in sectors.
Energies 14 05993 g003
Figure 4. Mean values of grades obtained by sectors in assessed indicators.
Energies 14 05993 g004
Figure 5. Indicators of CSR in energy industry.
Energies 14 05993 g005
Figure 6. High- and low-scoring groups in terms of the environmental aspect of CSR.
Energies 14 05993 g006
Table 1. Indicators of CSR used in research.
Indicators of Corporate Social Responsibility (CSR)
Environmental Routines—Routines
Environmental Policies and Targets—Policies
Implementation of Environmental Management System—EMS
ISO 14001/EMAS Certification—ISO/EMAS
Environmental Reporting—Reporting
Environmental Requirements Inside the Supply Chain—Supply Chain
The Trend of GHG Emissions—GHG
The Trend of Energy Consumption—Energy Consumption
Table 2. Number of companies in the study by industry.
IndustryNumber of Companies
Telecommunication Services (TS)102
Health Care (health)157
Information Technology (IT)205
Materials161
Industrials (industry)231
Consumer Discretionary (CD)241
Consumer Staples (CS)138
Energy123
Utilities84
Finance276
SUM1718
Table 3. Number of companies in the study according to regions.
Regions CountriesNumber
of Companies
Western Europe(Austria, France, Ireland, Germany, Switzerland, United Kingdom)254
Southern Europe(Spain, Portugal, Italy)51
Northern Europe(Denmark, Finland, Norway, Sweden)349
Benelux(Belgium, The Netherlands, Luxembourg)42
Australia(Australia, New Zealand, Papua New Guinea)66
North America(Bermuda, Jamaica, Cayman Islands, Canada, Panama, USA)648
Japan(Japan)271
China(China, Hong Kong, Singapore)37
SUM1718
Table 4. Basic statistics of grades achieved in indicators.
RoutinesPoliciesEMSISO/EMASReportingSupply
Chain
GHGEnergy Consump.
Minimum00000000
Maximum2.53333333
Mean1.351.241.390.971.370.821.190.99
Median1.51.51.501.5111
Standard
Deviation
0.730.720.981.140.680.720.980.77
Coefficient of Variation (%)53.7558.0470.52118.2749.8787.6582.6878.22
0 Grades (n)167196351939144533475423
0 Grades (%)9.7211.4120.4354.668.3831.0227.6524.62
Table 5. Statistical significance of differences between regions, Bonferroni corrected/incorrected.
K-W Test:
4,956E−46
W EuropeS EuropeN EuropeBeneluxAustraliaN
America
JapanChina
W Europe 0.66786.22 × 10−23 **0.071492.96 × 10−8 **1.78 × 10⁻³⁴ **0.28851.79 × 10−9 **
S Europe1 4.42 × 10⁻⁸ **0.083997.14 × 10−6 **8.75 × 10⁻¹¹ **0.49283.28 × 10−7 **
N Europe1.74 × 10−21 **1.24 × 10⁻⁶ ** 0.001135 **0.065590.96831.60 × 10−12 **0.9184
Benelux110.03177 * 0.03518 *0.000181 **0.3190.001516 **
Australia 8.30 × 10⁻⁷ **0.0002 **10.9851 0.03616 *0.000114 **0.1052
N America4.97 × 10−33 **2.45 × 10⁻⁹ **10.005062 **1 2.50 × 10⁻¹⁹ **0.9843
Japan114.47 × 10−11 **10.003204 **6.99 × 10⁻¹⁸ ** 3.58 × 10⁻⁵ **
China5.01 × 10−8 **9.18 × 10⁻⁶ **10.04244 *110.001001 **
* p < 0.05; ** p < 0.01.
Table 6. Partial grades’ medians among regions.
RoutinePolicyEMSISO/EMASReportingSupply
Chain
GHGEnergy
W Europe21.5222121
S Europe21.522211.51
N Europe111.5010.50.50.5
Benelux1.51.51.512122
Australia1.511.501.50.521
N America11101.50.511
Japan21.5221.5121
China111.5010.50.51
Table 7. Statistical significance of differences between sectors, Bonferroni corrected/incorrected.
K-W Test:
2.107E−40
EnergyMaterialsHealthCSIndustryITTSUtilitiesCDFinance
Energy 4.00 × 10⁻¹⁵ **0.14418.20 × 10−7 **2.94 × 10⁻⁷ **0.35670.80811.10 × 10−5 **0.41450.004086 **
Materials1.80 × 10−13 ** 1.39 × 10⁻¹⁵ **
5.11 × 10⁻⁵ **0.000373 **1.87 × 10⁻¹³ **1.28 × 10⁻¹² **0.001647 **6.63 × 10⁻¹³ **3.60 × 10⁻²⁹ **
Health16.23 × 10−14 ** 1.02 × 10⁻⁷ **6.11 × 10⁻⁹ **0.76250.51011.97 × 10−6 **0.02791 *0.189
CS3.69 × 10−5 **0.002301 **4.58 × 10⁻⁶ ** 0.58652.66 × 10−6 **2.27 × 10⁻⁵ **0.87587.92 × 10−5 **6.96 × 10⁻¹⁵ **
Industry1.32 × 10−5 **0.0168 *2.75 × 10−7 **1 1.38 × 10⁻⁷ **2.52 × 10⁻⁶ **0.82448.72 × 10−6 **1.38 × 10⁻¹⁸ **
IT18.40 × 10−12 **10.00012 **6.20 × 10⁻⁶ ** 0.76133.46 × 10−5 **0.083020.1251
TS15.76 × 10−11 **10.00102 **0.000113 **1 0.000111 **0.26830.05337
Utilities0.000493 **0.07418.86 × 10−5 **110.001556 **0.004983 ** 0.000605 **3.15 × 10⁻¹¹ **
CD12.98 × 10−11 **10.003566 **0.000392 **110.02721 * 7.14 × 10−5 **
Finance0.18391.62 × 10−27 **13.13 × 10⁻¹³ **6.19 × 10⁻¹⁷ **111.42 × 10⁻⁹ **0.003212 **
* p < 0.05; ** p < 0.01.
Table 8. Partial grades’ medians among regions.
RoutinePolicyEMSISO/EMASReportingSupply
Chain
GHGEnergy
Energy1.51.51.5010.511
Materials22222122
Health111010.511
CS1.51.51.511.511.51
Industry1.51.5221.5111
IT111.50110.50.5
TS11101.5111
Utilities1.51.5211.5121
CD11.51.501.5111
Finance111010.2511
Publisher’s Note: MDPI stays neutral with regard to jurisdictional claims in published maps and institutional affiliations.