
Analysis of Spatial Distribution of Sediment Pollutants Accumulated in the Vicinity of a Small Hydropower Plant


Abstract
1. Introduction
2. Materials and Methods
3. Results and Discussion
3.1. Grain Size Composition
3.2. Heavy Metals
3.2.1. Copper (Cu)
3.2.2. Nickel (Ni)
3.2.3. Chromium (Cr)
3.2.4. Zinc (Zn)
3.2.5. Lead (Pb)
3.2.6. Cadmium (Cd)
3.3. LAWA Classification of Sediment Contamination with Heavy Metals
3.4. pH and Electrolytic Conductivity (EC)
3.5. Statistical Significance Test and Correlation Matrix between Results
- Ni = 89.5%; 14.0%; 23.2%; 18.2%;
- Cr = 72.4%; 5.88%; 2.45%; 55.6%;
- Zn = 87.9%; 5.71%; 11.7%; 47.8%;
- Pb = 84,2%; 13.6%; 50.8%; 15.1%;
- Cd = -; 14.3%; 60.0%; no data.
4. Conclusions
Author Contributions
Funding
Institutional Review Board Statement
Informed Consent Statement
Conflicts of Interest
References
- López, P.; López-Tarazón, J.A.; Casas-Ruiz, J.P.; Pompeo, M.; Ordoñez, J.; Muñoz, I. Sediment size distribution and composition in a reservoir affected by severe water level fluctuations. Sci. Total Environ. 2016, 540, 158–167. [Google Scholar] [CrossRef]
- Rzetala, M.; Babicheva, V.A.; Rzetala, M.A. Composition and physico-chemical properties of bottom sediments in the southern part of the Bratsk Reservoir (Russia). Sci. Rep. 2019, 9, 12790. [Google Scholar] [CrossRef] [PubMed]
- Kuriqi, A.; Pinheiro, A.N.; Sordo-Ward, A.; Bejarano, M.D.; Garrote, L. Ecological impacts of run-of-river hydropower plants—Current status and future prospects on the brink of energy transition. Renew. Sust. Energ. Rev. 2021, 142, 110833. [Google Scholar] [CrossRef]
- Myronidis, D.; Emmanouloudis, D.; Arabatzis, G. Research on the contribution of Small Hydroelectric Plants (SHP) as development projects to the energy balance of Greece. J. Environ. Prot. Ecol. 2008, 9, 614–626. [Google Scholar]
- Alekseevskiy, N.I.; Berkovich, K.M.; Chalov, R.S. Erosion, sediment transportation and accumulation in rivers. Int. J. Sediment Res. 2008, 23, 93–105. [Google Scholar] [CrossRef]
- Hojan, M.; Rurek, M. Effect of Emergency Water Discharges from the Dam in Włocławek on the Sedimentary Structures of Channel Bars in the Lower Flow Regime of the River Vistula. Water 2021, 13, 328. [Google Scholar] [CrossRef]
- Kondolf, G.M.; Gao, Y.; Annandale, G.W.; Morris, G.L.; Jiang, E.; Zhang, J.; Cao, Y.; Carling, P.; Fu, K.; Guo, Q.; et al. Sustainable sediment management in reservoirs and regulated rivers: Experiences from five continents. Earth’s Future 2014, 2, 256–280. [Google Scholar] [CrossRef]
- Vörösmarty, C.J.; Meybeck, M.; Fekete, B.; Sharma, K.; Green, P.; Syvitski, J.P. Anthropogenic sediment retention: Major global impact from registered river impoundments. Glob. Planet. Chang. 2003, 39, 169–190. [Google Scholar] [CrossRef]
- Smith, N.D.; Morozova, G.S.; Gibling, M.R. Channel enlargement by avulsion-induced sediment starvation in the Saskatchewan River. Geology 2014, 42, 355–358. [Google Scholar] [CrossRef]
- Philips, J.D.; Slattery, M.C.; Musselman, Z.A. Dam-to-delta sediment inputs and storage in the lower trinity river, Texas. Geomorphology 2004, 62, 17–34. [Google Scholar] [CrossRef]
- Sear, D.A.; Newson, M.D.; Brookes, A. Sediment-related river maintenance: The role of fluvial geomorphology. Earth Surf. Process. Landf. 1995, 20, 629–647. [Google Scholar] [CrossRef]
- Buter, A.; Spitzer, A.; Comiti, F.; Heckmann, T. Geomorphology of the Sulden River basin (Italian Alps) with a focus on sediment connectivity. J. Maps 2020, 16, 890–901. [Google Scholar] [CrossRef]
- Hauer, C.; Leitner, P.; Unfer, G.; Pulg, U.; Habersack, H.; Graf, W. The Role of Sediment and Sediment Dynamics in the Aquatic Environment. In Riverine Ecosystem Management; Aquatic Ecology Series; Schmutz, S., Sendzimir, J., Eds.; Springer: Cham, Switzerland, 2018; Volume 8. [Google Scholar] [CrossRef]
- Yoshida, Y.; Lee, H.S.; Trung, B.H.; Tran, H.-D.; Lall, M.K.; Kakar, K.; Xuan, T.D. Impacts of Mainstream Hydropower Dams on Fisheries and Agriculture in Lower Mekong Basin. Sustainability 2020, 12, 2408. [Google Scholar] [CrossRef]
- Stanley, D.J.; Clemente, P.L. Clay Distributions, Grain Sizes, Sediment Thicknesses, and Compaction Rates to Interpret Subsidence in Egypt’s Northern Nile Delta. J. Coast. Res. 2014, 30, 88–101. [Google Scholar] [CrossRef]
- Frihy, O.E.; Deabes, E.A.; El Sayed, W. Processes Reshaping the Nile Delta Promontories of Egypt: Pre- and Post Protection. Geomorphology 2003, 53, 263–279. [Google Scholar] [CrossRef]
- Mueller, E.R.; Schmidt, J.C.; Topping, D.J.; Shafroth, P.B.; Rodríguez-Burgueño, J.E.; Ramírez-Hernández, J.; Gramsa, P.E. Geomorphic change and sediment transport during a small artificial flood in a transformed post-dam delta: The Colorado River delta, United States and Mexico. Ecol. Eng. 2017, 106, 757–775. [Google Scholar] [CrossRef]
- Carriquiry, J.D.; Sánchez, A.; Camacho-Ibar, V.F. Sedimentation in the northern Gulf of California after cessation of the Colorado River discharge. Sediment. Geol. 2001, 144, 37–62. [Google Scholar] [CrossRef]
- Wang, J.; Delang, C.O.; Guolong, H.; Gao, L.; Lu, X. Net primary production increases in the Yangtze River Basin within the latest two decades. Glob. Ecol. Conserv. 2021, 26, e01497. [Google Scholar] [CrossRef]
- Kondolf, G.M.; Schmitt, R.J.P.; Carling, P.; Darby, S.; Arias, M.; Bizzi, S.; Castelleti, A.; Cochrane, T.A.; Gibson, S.; Kummu, M.; et al. Changing sediment budget of the Mekong: Cumulative threats and management strategies for a large river basin. Sci. Total Environ. 2018, 625, 114–134. [Google Scholar] [CrossRef]
- Besset, M.; Anthony, E.J.; Sabatier, F. River delta shoreline reworking and erosion in the Mediterranean and Black Seas: The potential roles of fluvial sediment starvation and other factors. Elem. Sci. Anthr. 2017, 5, 54. [Google Scholar] [CrossRef]
- Rahman, M.S.; Saha, N.; Molla, A.H.; Al-Reza, S.M. Assessment of Anthropogenic Influence on Heavy Metals Contamination in the Aquatic Ecosystem Components: Water, Sediment, and Fish. Soil Sediment Contam. Int. J. 2014, 23, 353–373. [Google Scholar] [CrossRef]
- Vukosav, P.; Mlakar, M.; Cukrov, N.; Kwokal, Z.; Pižeta, I.; Pavlus, N.; Spoljarić, I.; Vurnek, M.; Brozinčević, A.; Omanović, D. Heavy metal contents in water, sediment and fish in a karst aquatic ecosystem of the Plitvice Lakes National Park (Croatia). Environ. Sci. Pollut. Res. Int. 2014, 21, 3826–3839. [Google Scholar] [CrossRef]
- Kabała, C.; Gałka, B.; Jezierski, P. Assessment and monitoring of soil and plant contamination with trace elements around Europe’s largest copper ore tailings impoundment. Sci. Total Environ. 2020, 738, 139918. [Google Scholar] [CrossRef]
- Maavara, T.; Parsons, C.T.; Ridenour, C.; Stojanovic, S.; Dürr, H.H.; Powley, H.R.; Van Cappellen, P. Global phosphorus retention by river damming. Proc. Natl. Acad. Sci. USA 2015, 112, 15603–15608. [Google Scholar] [CrossRef] [PubMed]
- Ndeda, L.A.; Manohar, S.; Macharia, G.M. Accumulation of heavy metals on bed sediments of Nairobi dam, Kenya. J. Environ. Chem. Ecotoxicol. 2017, 9, 1–7. [Google Scholar] [CrossRef]
- Naden, P.S.; Murphy, J.F.; Old, G.H.; Newman, J.; Scarlett, P.; Harman, M.; Duerdoth, C.P.; Hawczak, A.; Pretty, J.L.; Arnold, A.; et al. Understanding the controls on deposited fine sediment in the streams of agricultural catchments. Sci. Total Environ. 2016, 547, 366–381. [Google Scholar] [CrossRef] [PubMed]
- Tomczyk, P.; Wiatkowski, M. Shaping changes in the ecological status of watercourses within barrages with hydropower schemes—Literature review. Arch. Environ. Prot. 2020, 46, 78–94. [Google Scholar] [CrossRef]
- Downs, P.W.; Cui, Y.; Wooster, J.K.; Dusterhoff, S.R.; Booth, D.B.; Dietrich, W.E.; Sklar, L.S. Managing reservoir sediment release in dam removal projects: An approach informed by physical and numerical modelling of non-cohesive sediment. Int. J. River Basin Manag. 2009, 7, 433–452. [Google Scholar] [CrossRef]
- Tsalis, T.A.; Malamateniou, K.E.; Koulouriotis, D.; Nikolaou, I.E. New challenges for corporate sustainability reporting: United Nations’ 2030 Agenda for sustainable development and the sustainable development goals. Corp. Soc. Responsib. Environ. Manag. 2020, 27, 1617–1629. [Google Scholar] [CrossRef]
- Operacz, A. Possibility of Hydropower Development: A Simple-to-Use Index. Energies 2021, 14, 2764. [Google Scholar] [CrossRef]
- The European Parliament and the Council. Directive 2000/60/EC of the European Parliament and of the Council Establishing a Framework for Community Action in the Field of Water Policy (Water Framework Directive); The European Parliament and the Council: Brussels, Belgium, 2000. [Google Scholar]
- Kasperek, R.; Wiatkowski, M. Hydropower generation of the Nysa Kłodzka River. Ecol. Chem. Eng. S 2014, 21, 327–336. [Google Scholar] [CrossRef]
- Duodu, G.O.; Goonetilleke, A.; Ayoko, G.A. Optimization of in-cell accelerated solvent extraction technique for the determination of organochlorine pesticides in river sediments. Talanta 2016, 150, 278–285. [Google Scholar] [CrossRef]
- Waroszewski, J.; Sprafke, T.; Kabała, C.; Kobierski, M.; Kierczak, J.; Musztyfaga, E.; Loba, A.; Mazurek, R.; Łabaz, B. Tracking textural, mineralogical and geochemical signatures in soils developed from basalt-derived materials covered with loess sediments (SW Poland). Geoderma 2019, 337, 983–997. [Google Scholar] [CrossRef]
- Bojko, O.; Kabała, C. Organic carbon pools in mountain soils—Sources of variability and predicted changes in relation to climate and land use changes. CATENA 2017, 149, 209–220. [Google Scholar] [CrossRef]
- He, D.; Shi, X.; Wu, D. Particle-size distribution characteristics and pollution of heavy metals in the surface sediments of Kuitun River in Xinjiang, China. Environ. Earth Sci. 2016, 75, 104. [Google Scholar] [CrossRef]
- Sarmani, S.B. The determination of heavy metals in water, suspended materials and sediments from Langat River, Malaysia. Hydrobiologia 1989, 176, 233–238. [Google Scholar] [CrossRef]
- Wdowczyk, A.; Pulikowska, A. Comparison of Landfill Leachate Properties by LPI and Phytotoxicity-A Case Study. Front. Environ. Sci. 2021, 9, 693112. [Google Scholar] [CrossRef]
- The Polish Society of Soil Science (PSSS). Particle size distribution and textural classes of soild and mineral materials-classification of Polish Society of Soil Science 2008. Ann. Soil Sci. 2009, 2, 5–16. [Google Scholar]
- Bieganowski, A.; Witkowska-Walczak, B.; Gliñski, J.; Sokołowska, Z.; Sławiński, C.; Brzezińska, M.; Włodarczyk, T. Database of Polish arable mineral soils: A review. Int. Agrophysics 2013, 27, 335–350. [Google Scholar] [CrossRef]
- Kruczkowska, B.; Błaszkiewicz, M.; Jonczak, J.; Uzarowicz, Ł.; Moska, P.; Brauer, A.; Bonk, A.; Słowiński, M. The Late Glacial pedogenesis interrupted by aeolian activity in Central Poland-Records from the Lake Gościąż catchment. CATENA 2020, 185, 104286. [Google Scholar] [CrossRef]
- McKnight, P.E.; Najab, J. Mann-Whitney U Test. In The Corsini Encyclopedia of Psychology; Weiner, I.B., Craighead, W.E., Eds.; Wiley: Hoboken, NJ, USA, 2010. [Google Scholar] [CrossRef]
- Myronidis, D.; Theofanous, N. Changes in climatic patterns and tourism and their concomitant effect on drinking water transfers into the Region of South Aegean, Greece. Stoch. Environ. Res. Risk Assessment. 2021, 35, 1725–1739. [Google Scholar] [CrossRef] [PubMed]
- Asuero, A.G.; Sayago, A.; González, A.G. The Correlation Coefficient: An Overview. Crit. Rev. Anal. Chem. 2006, 36, 41–59. [Google Scholar] [CrossRef]
- Zgłobicki, W.; Lata, L.; Plak, A.; Reszka, M. Geochemical and statistical approach to evaluate background concentrations of Cd, Cu, Pb and Zn (case study: Eastern Poland). Environ. Earth Sci. 2011, 62, 347–355. [Google Scholar] [CrossRef]
- Gałuszka, A.; Migaszewski, Z.M.; Dołęgowska, S.; Michalik, A.; Duczmal-Czernikiewicz, A. Geochemical background of potentially toxic trace elements in soils of the historic copper mining area: A case study from Miedzianka Mt., Holy Cross Mountains, south-central Poland. Environ. Earth Sci. 2015, 74, 4589–4605. [Google Scholar] [CrossRef]
- Dung, T.T.T.; Cappuyns, V.; Swennen, R.; Phung, K.N. From geochemical background determination to pollution assessment of heavy metals in sediments and soils. Rev. Environ. Sci. Biotechnol. 2013, 12, 335–353. [Google Scholar] [CrossRef]
- Aghili, S.; Vaezihir, A.; Hosseinzadeh, M. Distribution and modeling of heavy metal pollution in the sediment and water mediums of Pakhir River, at the downstream of Sungun mine tailing dump, Iran. Environ. Earth Sci. 2018, 77, 4. [Google Scholar] [CrossRef]
- Wojciechowska, E.; Nawrot, N.; Walkusz-Miotk, J.; Matej-Łukowicz, K.; Pazdro, K. Heavy Metals in Sediments of Urban Streams: Contamination and Health Risk Assessment of Influencing Factors. Sustainability 2019, 11, 563. [Google Scholar] [CrossRef]
- LAWA-Arbeitskreis Zielvorgaben. Zusammenarbeit mit LAWA-Arbeitskreis, Qualitative Hydrologie der Flieβgewässer, Beurteilung der Wasserbeschaffenheit von Flieβgewässern in der Bundesrepublik Deutschland-Chemische Gewässergűteklassifikation; Länder-Arbeitsgemeinschaft Wasser (LAWA—State Working Group on Water): Berlin, Germany, 1998. [Google Scholar]
- Wiatkowski, M.; Tomczyk, P. Comparative Assessment of the Hydromorphological Status of the Rivers Odra, Bystrzyca, and Ślęza Using the RHS, LAWA, QBR, and HEM Methods above and below the Hydropower Plants. Water 2018, 10, 855. [Google Scholar] [CrossRef]
- Raffa, C.M.; Chiampo, F.; Shanthakumar, S. Remediation of Metal/Metalloid-Polluted Soils: A Short Review. Appl. Sci. 2021, 11, 4134. [Google Scholar] [CrossRef]
- Selvi, A.; Rajasekar, A.; Theerthagiri, J.; Ananthaselvam, A.; Sathishkumar, K.; Madhavan, J.; Rahman, P.K.S.M. Integrated Remediation Processes Toward Heavy Metal Removal/Recovery from Various Environments-A Review. Front. Environ. Sci. 2019, 7, 66. [Google Scholar] [CrossRef]
- Sharma, S.; Tiwari, S.; Hasan, A.; Saxena, V.; Pandey, L.M. Recent advances in conventional and contemporary methods for remediation of heavy metal-contaminated soils. 3 Biotech 2018, 8, 216. [Google Scholar] [CrossRef]
- Obolewski, K.; Glińska-Lewczuk, K. Distribution of heavy metals in bottom sediments of floodplain lakes and their partent river-A case study of the Słupia. J. Elem. 2013, 18, 673–682. [Google Scholar] [CrossRef]
- Wang, A.J.; Bong, C.W.; Xu, Y.H.; Hassan, M.H.A.; Ye, X.; Bakar, A.F.A.; Li, Y.H.; Lai, Z.K.; Xu, J.; Loh, K.H. Assessment of heavy metal pollution in surficial sediments from a tropical river-estuary-shelf system: A case study of Kelantan River, Malaysia. Mar Pollut Bull. 2017, 125, 492–500. [Google Scholar] [CrossRef]
- Huang, L.; Fang, H.; Ni, K.; Yang, W.; Zhao, W.; He, G.; Han, Y.; Li, X. Distribution and Potential Risk of Heavy Metals in Sediments of the Three Gorges Reservoir: The Relationship to Environmental Variables. Water 2018, 10, 1840. [Google Scholar] [CrossRef]
- Kim, S.; Yang, D.S.; Kim, Y.S. Distribution of metal contamination and grain size in the sediments of Nakdong River, Korea. Environ. Monit. Assess. 2020, 192, 502. [Google Scholar] [CrossRef]
- Sojka, M.; Jaskuła, J.; Siepak, M. Heavy Metals in Bottom Sediments of Reservoirs in the Lowland Area of Western Poland: Concentrations, Distribution, Sources and Ecological Risk. Water 2019, 11, 56. [Google Scholar] [CrossRef]
- Astatkie, H.; Ambelu, A.; Mengistie, E. Contamination of Stream Sediment with Heavy Metals in the Awetu Watershed of Southwestern Ethiopia. Front. Earth Sci. 2021, 9. [Google Scholar] [CrossRef]
- Hahn, J.; Opp, C.; Evgrafova, A.; Groll, M.; Zitzer, N.; Laufenberg, G. Impacts of dam draining on the mobility of heavy metals and arsenic in water and basin bottom sediments of three studied dams in Germany. Sci. Total Environ. 2018, 640–641, 1072–1081. [Google Scholar] [CrossRef]
- Frémion, F.; Bordas, F.; Mourier, B.; Lenain, J.-F.; Kestens, T.; Courtin-Nomade, A. Influence of dams on sediment continuity: A study case of a natural metallic contamination. Sci. Total. Environ. 2016, 547, 282–294. [Google Scholar] [CrossRef] [PubMed]
- Kamidis, N.; Sylaios, G. Impact of river damming on sediment texture and trace metals distribution along the watershed and the coastal zone of Nestos River (NE Greece). Environ. Earth Sci. 2017, 76, 373. [Google Scholar] [CrossRef]
- Zhao, X.; Gao, B.; Xu, D.; Gao, L.; Yin, S. Heavy metal pollution in sediments of the largest reservoir (Three Gorges Reservoir) in China: A review. Environ. Sci. Pollut. Res. 2018, 24, 20844–20858. [Google Scholar] [CrossRef] [PubMed]
- Shim, M.J.; Yang, Y.M.; Oh, D.Y.; Lee, S.H.; Yoon, Y.Y. Spatial distribution of heavy metal accumulation in the sediments after dam construction. Environ. Monit. Assess. 2015, 187, 733. [Google Scholar] [CrossRef] [PubMed]
- Aradpour, S.; Noori, R.; Tang, Q.; Bhattarai, R.; Hooshyaripor, F.; Hosseinzadeh, M.; Haghighi, A.T.; Klöve, B. Metal contamination assessment in water column and surface sediments of a warm monomictic man-made lake: Sabalan Dam Reservoir, Iran. Hydrol. Res. 2020, 51, 799–814. [Google Scholar] [CrossRef]


| Parameter | Equation | Description |
|---|---|---|
| U value | U = − ∑ranks | - n—the number of items in the samples
- ∑ranks—the sum of ranks in the sample |
| z-ratio | z = | - —the standard deviation of U - —the mean of U |
| Heavy Metal | Geochemical Background (0 class) | 1st Class (No Pollution) | 2nd Class (Little Pollution) | 3rd Class (Medium Pollution) | 4th Class (Heavy Pollution) |
|---|---|---|---|---|---|
| Cu | <6 | 6–19.9 | 20–99.9 | 100–199.9 | ≥200 |
| Ni | <5 | 5–29.9 | 30–49.9 | 50–99.9 | ≥100 |
| Cr | <5 | 5–19.9 | 20–99.9 | 100–499.9 | ≥500 |
| Zn | <48 | 48–199.9 | 200–999.9 | 1000–999.9 | ≥2000 |
| Pb | <10 | 10–49.9 | 50–199.9 | 200–499.9 | ≥500 |
| Cd | <0.5 | 0.5–0.99 | 1–4.9 | 5–19.9 | ≥20 |
| Heavy Metal | 0 Class (no Pollution) | 1st Class (Little Pollution) | 2nd Class (Medium Pollution) | 3rd Class (Noticeable Pollution) | 4th Class (Heavy Pollution) | 5th Class (Very Heavy Pollution) |
|---|---|---|---|---|---|---|
| Cu | ≤20.0 | 20.1–40.0 | 40.1–60.0 | 60.1–120.0 | 120.1–240.0 | >240.0 |
| Ni | ≤30.0 | 30.1–40.0 | 40.1–50.0 | 50.1–100.0 | 100.1–200.0 | >200.0 |
| Cr | ≤80.0 | 80.1–90.0 | 90.1–100.0 | 100.1–200.0 | 200.1–400.0 | >400.0 |
| Zn | ≤100.0 | 100.1–150.0 | 150.1–200.0 | 200.1–400.0 | 400.1–800.0 | >800.0 |
| Pb | ≤25.0 | 25.1–50.0 | 50.1–100.0 | 100.1–200.0 | 200.1–400.0 | >400.0 |
| Cd | ≤0.30 | 0.31–0.60 | 0.61–1.20 | 1.21–2.40 | 2.41–4.80 | >4.80 |
| Location | Distance from Hydropower Plant (m) | Granulometric Group | |
|---|---|---|---|
| Spring | Fall | ||
| Reference | 18,500 | loose sand/sandy loam | loose sand |
| Upstream hydropower plant | 150 | loamy silt | loamy silt |
| 125 | loamy silt | clayey silt | |
| 100 | loamy silt | loamy silt | |
| 80 | loamy silt | loamy silt | |
| 60 | loamy silt | loamy silt | |
| 40 | loamy silt | clayey silt | |
| 20 | loamy silt | clayey silt | |
| Downstream hydropower plant | 20 | loose sand/weakly loamy sand | loose sand |
| 40 | loose sand | loose sand | |
| 60 | loose sand | loose sand | |
| 80 | loose sand/weakly loamy sand | loose sand | |
| 100 | sandy loam | loamy sand | |
| 125 | loamy sand | loamy sand | |
| 150 | weakly loamy sand | weakly loamy sand | |
| Upstream | Downstream | Reference | |||||||
|---|---|---|---|---|---|---|---|---|---|
| Min | Max | Median | Min | Max | Median | Min | Max | Median | |
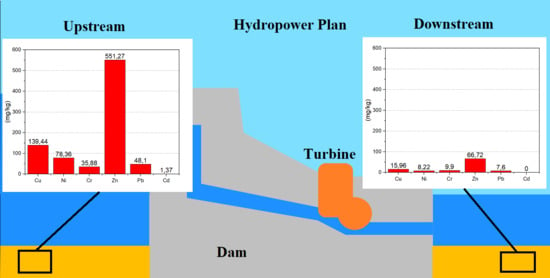
| Cu | 85.74 | 223.09 | 139.44 | 2.79 | 73.09 | 15.96 | 2.60 | 10.52 | 3.43 |
| Ni | 71.36 | 90.71 | 78.36 | 2.59 | 37.52 | 8.22 | 7.67 | 18.92 | 9.11 |
| Cr | 29.64 | 48.54 | 35.88 | 4.15 | 32.30 | 9.90 | 24.46 | 72.29 | 31.63 |
| Zn | 341.00 | 645.52 | 551.27 | 19.73 | 394.57 | 66.72 | 11.84 | 35.21 | 14.65 |
| Pb | 38.00 | 69.19 | 48.10 | 1.1 | 52.74 | 7.60 | 2.73 | 9.04 | 5.84 |
| Cd | 1.05 | 2.10 | 1.37 | 0.00 | 2.64 | 0.00 | 0.00 | 0.52 | 0.00 |
| Location | Distance from Hydropower Plant (m) | Parameters | Parameters | ||||||||||
|---|---|---|---|---|---|---|---|---|---|---|---|---|---|
| Cu | Cd | Ni | Cr | Zn | Pb | Cu | Cd | Ni | Cr | Zn | Pb | ||
| SPRING | FALL | ||||||||||||
| Reference | 18,500 | 0 | 0 | 0 | 0 | 0 | 0 | 0 | 0 | 0 | 0 | 0 | 0 |
| Upstream hydropower plant | 150 | IV | III | 0 | IV | II | III | III | III | 0 | IV | I | III |
| 125 | IV | III | 0 | IV | I | II | IV | III | 0 | IV | I | III | |
| 100 | IV | III | 0 | IV | I | III | III | III | 0 | IV | I | III | |
| 80 | IV | III | 0 | IV | I | II | III | III | 0 | IV | I | III | |
| 60 | IV | III | 0 | IV | I | III | IV | III | 0 | IV | I | III | |
| 40 | IV | III | 0 | IV | I | II | III | III | 0 | III | I | III | |
| 20 | IV | III | 0 | IV | I | III | IV | III | 0 | IV | II | III | |
| Downstream hydropower plant | 20 | 0 | 0 | 0 | 0 | 0 | 0 | 0 | 0 | 0 | 0 | 0 | 0 |
| 40 | 0 | 0 | 0 | 0 | 0 | II | 0 | 0 | 0 | 0 | 0 | 0 | |
| 60 | 0 | 0 | 0 | 0 | 0 | 0 | 0 | 0 | 0 | 0 | 0 | 0 | |
| 80 | 0 | 0 | 0 | 0 | 0 | 0 | 0 | 0 | 0 | 0 | 0 | 0 | |
| 100 | III | I | 0 | III | I | II | I | 0 | 0 | II | 0 | II | |
| 125 | 0 | 0 | 0 | I | 0 | 0 | I | 0 | 0 | I | 0 | II | |
| 150 | 0 | 0 | 0 | 0 | 0 | 0 | I | 0 | 0 | 0 | 0 | I | |
| Parameters | Upstream | Downstream | Reference | ||||||
|---|---|---|---|---|---|---|---|---|---|
| Min | Max | Median | Min | Max | Median | Min | Max | Median | |
| pHH2O | 6.77 | 7.38 | 7.03 | 6.94 | 7.9 | 7.47 | 7.35 | 7.98 | 7.56 |
| pHKCl | 6.47 | 6.9 | 6.79 | 6.88 | 7.68 | 7.31 | 7.08 | 7.75 | 7.435 |
| EC (μS/cm) | 204 | 653 | 472 | 29 | 275 | 113.5 | 21.3 | 213 | 99.95 |
| Parameter | Upstream | Downstream | Combined | U 1 | z | ||||||
|---|---|---|---|---|---|---|---|---|---|---|---|
| ∑ranks | U | ∑ranks | U | ∑ranks | σ | ||||||
| Cu | 371 | 26.5 | 0 | 190 | 10 | 266 | 561 | 17 | 27.453 | 0 ** | −4.82643 ** |
| Ni | 371 | 26.5 | 0 | 190 | 10 | 266 | 561 | 17 | 27.453 | 0 ** | −4.82643 ** |
| Cr | 365 | 26.07 | 6 | 196 | 10.32 | 260 | 561 | 17 | 27.453 | 6 ** | −4.60788 ** |
| Zn | 370 | 26.43 | 1 | 191 | 10.05 | 265 | 561 | 17 | 27.453 | 1 ** | −4.79001 ** |
| Pb | 360 | 25.71 | 11 | 201 | 10.58 | 255 | 561 | 17 | 27.453 | 11 ** | −4.42575 ** |
| Cd | 357 | 25.5 | 14 | 204 | 10.74 | 252 | 561 | 17 | 27.453 | 14 ** | −4.31647 ** |
| Øav. | 105 | 7.5 | 266 | 456 | 24 | 0 | 561 | 17 | 27.453 | 0 ** | 4.82643 ** |
| pHH2O | 125 | 8.93 | 246 | 436 | 22.95 | 20 | 561 | 17 | 27.453 | 20 ** | 4.09791 ** |
| pHKCl | 107 | 7.64 | 264 | 454 | 23.89 | 2 | 561 | 17 | 27.453 | 2 ** | 4.75358 ** |
| EC | 369 | 26.36 | 2 | 192 | 10.11 | 264 | 561 | 17 | 27.453 | 2 ** | −4.75358 ** |
| Cu | Ni | Cr | Zn | Pb | Cd | Øav. | pHH2O | pHKCl | EC | |
|---|---|---|---|---|---|---|---|---|---|---|
| Cu | 1 | |||||||||
| Ni | 0.935 ** | 1 | ||||||||
| Cr | 0.536 ** | 0.629 ** | 1 | |||||||
| Zn | 0.935 ** | 0.972 ** | 0.563 ** | 1 | ||||||
| Pb | 0.903 ** | 0.888 ** | 0.479 ** | 0.901 ** | 1 | |||||
| Cd | 0.755 ** | 0.792 ** | 0.634 ** | 0.745 ** | 0.697 ** | 1 | ||||
| Øav. | −0.836 ** | −0.887 ** | −0.606 ** | −0.868 ** | −0.746 ** | −0.683 ** | 1 | |||
| pHH2O | −0.746 ** | −0.753 ** | −0.506 ** | −0.786 ** | −0.671 ** | −0.571 ** | 0.804 ** | 1 | ||
| pHKCl | −0.857 ** | −0.864 ** | −0.598 ** | −0.876 ** | −0.755 ** | −0.683 ** | 0.905 ** | 0.918 ** | 1 | |
| EC | 0.788 ** | 0.902 ** | 0.618 ** | 0.923 ** | 0.782 ** | 0.663 ** | −0.863 ** | −0.832 ** | −0.872 ** | 1 |
| Reference | This Research | Hahn et al. 2018 [62] | Frémion et al. 2016 [63] | Kamidis & Sylaios 2017 [64] | |||||
|---|---|---|---|---|---|---|---|---|---|
| Location | Ślęza, Poland | Klingenberg, Germany | Vaussaire, France | Platanovrisi, Greece | |||||
| Parameter | Upstream | Downstream | Upstream | Downstream | Upstream | Downstream | Upstream | Downstream | |
| pHH2O | 7.03 | 7.47 | 4.50 | 4.50 | 5.30 | 6.30 | - | - | |
| EC (μS/cm) | 472 | 114 | 550 | 181 | - | - | - | - | |
| Particle sizes (%) | Sand | 21.0 | 92.0 | 5.1 | 40.6 | - | - | 31.5 | 97.5 |
| Silt | 72.0 | 5.0 | 69.2 | 39.6 | - | - | 54.0 | 2.2 | |
| Clay | 7.0 | 3.0 | 25.7 | 20.1 | - | - | 14.5 | 0.3 | |
| Reference | This Research | Zhao et al. 2017 [65] | Shim et al. 2015 [66] | Aradpour et al. 2020 [67] | |||||
|---|---|---|---|---|---|---|---|---|---|
| Location | Ślęza, Poland | Three Georges, China | Guam, South Korea | Sabalan, Iran | |||||
| Parameter | Upstream | Downstream | Upstream | Downstream | Upstream | Downstream | Upstream | Downstream | |
| Cu | 139.44 | 15.96 | 58.0 | 39.0 | 61.3 | 27.6 | 70.0 | 61.0 | |
| Ni | 78.36 | 8.22 | 50.0 | 43.0 | 24.1 | 18.5 | 11.0 | 9.0 | |
| Cr | 35.88 | 9.90 | 85.0 | 80.0 | 61.2 | 59.7 | 18.0 | 8.0 | |
| Zn | 551.27 | 66.72 | 105.0 | 99.0 | 154 | 136 | 23.0 | 12.0 | |
| Pb | 48.10 | 7.60 | 44.0 | 38.0 | 59.1 | 29.1 | 53.0 | 45.0 | |
| Cd | 1.37 | 0.00 | 0.70 | 0.60 | 0.50 | 0.20 | - | - | |
Publisher’s Note: MDPI stays neutral with regard to jurisdictional claims in published maps and institutional affiliations. |
© 2021 by the authors. Licensee MDPI, Basel, Switzerland. This article is an open access article distributed under the terms and conditions of the Creative Commons Attribution (CC BY) license (https://creativecommons.org/licenses/by/4.0/).
Share and Cite
Tomczyk, P.; Gałka, B.; Wiatkowski, M.; Buta, B.; Gruss, Ł. Analysis of Spatial Distribution of Sediment Pollutants Accumulated in the Vicinity of a Small Hydropower Plant. Energies 2021, 14, 5935. https://doi.org/10.3390/en14185935
Tomczyk P, Gałka B, Wiatkowski M, Buta B, Gruss Ł. Analysis of Spatial Distribution of Sediment Pollutants Accumulated in the Vicinity of a Small Hydropower Plant. Energies. 2021; 14(18):5935. https://doi.org/10.3390/en14185935
Chicago/Turabian StyleTomczyk, Paweł, Bernard Gałka, Mirosław Wiatkowski, Bogna Buta, and Łukasz Gruss. 2021. "Analysis of Spatial Distribution of Sediment Pollutants Accumulated in the Vicinity of a Small Hydropower Plant" Energies 14, no. 18: 5935. https://doi.org/10.3390/en14185935
APA StyleTomczyk, P., Gałka, B., Wiatkowski, M., Buta, B., & Gruss, Ł. (2021). Analysis of Spatial Distribution of Sediment Pollutants Accumulated in the Vicinity of a Small Hydropower Plant. Energies, 14(18), 5935. https://doi.org/10.3390/en14185935