1. Introduction
On the one hand, energy policy is one of the most complex processes and challenges of the modern world [
1]. On the other hand, energy security is a fundamental condition for sustainable development, which is a goal pursued by all countries in the world. Analyzing the situation, forecasting, and making decisions in this area is of interest to researchers who propose various measures and conduct numerous studies, striving to obtain reliable measurements and interpretable results. It is important since the obtained results can be used by decision-makers to make responsible decisions. The literature emphasizes the importance of methods of energy supply and related costs, as well as the important role of energy in economic development and the impact it has on the progress of individual countries, especially in the industrial sector [
2]. It is recognized that an affordable and adequate energy supply plays a key role in economic development [
3]. Energy is an important factor contributing to the achievement of sustainable development goals, since energy consumption is necessary for economic, environmental, and social reasons [
4]. Therefore, energy security is of key importance for states, international organizations, and also for individual consumers [
5]. It should be mentioned that the discussion on energy security has a long history, while papers containing scientific analyses in accordance with current research principles and standards were published only occasionally until recently [
6,
7,
8]. However, in recent years, this issue has been noticed and has become one of the most important topics discussed today [
9] since, according to many authors, energy affects every aspect of life (not only economic, but also social) [
10].
An important aspect related to energy security is the assessment of its current and future status. Simple approaches can be used to assess the state of energy security, based, for example, on the technical analysis of the stability of the energy system or the economic analysis of energy imports. However, much more interesting, and at the same time methodologically justified, are complex approaches taking into account various technical, commercial, economic, environmental, etc. factors [
1]. Such a complex assessment is more reliable when it is supported by an analysis of uncertainty and sensitivity [
11]. In addition to assessing the current state of energy security, an important aspect that is often ignored in research is forecasting and analyzing future scenarios [
12]. Forecasts allow one to react in advance to threats to energy security and support decision-making processes, limiting the occurrence of adverse effects [
13]. It should be noted that both in the context of the current assessment and forecasting, it is important that energy security is measured using reliable methods that allow for an objective numerical assessment [
14]. Therefore, multi-criteria decision analysis (MCDA) methods are used here, allowing for the construction of complex indexes based on a reliable and widely recognized methodology [
15]. MCDA methods have been developed to deal with complex decision problems in which there are many, often conflicting, criteria and uncertainties [
16]. They allow for dealing with such problems in a structured, transparent, and credible way. Moreover, MCDA methods are often used in
ex-ante decision problems, where the decision maker or analyst is not able to fully determine all consequences of the decision [
17] and thus also allow uncertainty to be analyzed. MCDA methods that deal well with uncertainties related to both input data and decision consequences are methods based on fuzzy set theory [
18]. Unfortunately, many such methods are computationally very complicated, which means that they are treated by stakeholders as a ‘black box’. This undermines the confidence in the fuzzy MCDA methods and the credibility of the recommendations generated by these methods [
19].
A research gap is visible here, consisting in the need for a complex assessment and forecasting of energy security with the use of an appropriate research methodology. The methodology used should allow for a systematic analysis of uncertainty. At the same time, it should be relatively uncomplicated in terms of calculations and give results easy to interpret. Therefore, the aim of this research and, at the same time, our methodological contribution, is to develop a new approach to assessing the current and future energy security based on a complex safety index, supported by the computationally transparent fuzzy MCDA method. The proposed approach will allow for forecasting future energy security based on the methodology derived from econometrics, management, and decision sciences. The practical aspect of the research is the implementation of the developed methodological approach and the determination of energy security forecasts for countries that are significant energy users in the world.
Section 2 provides an overview of the literature on energy security and its measurement.
Section 3 provides an extensive discussion of the methodological details of the proposed approach and research procedure.
Section 4 presents the research results in the form of energy security forecasts and a discussion. The article ends with conclusions from the conducted research and an indication of further directions of work.
2. Literature Review
There are opinions in the literature that, for many years of dealing with the subject of energy, no generally accepted definition of energy security has been developed and that such action is extremely difficult to implement [
20]. On the other hand, the term promoted by the International Energy Agency (IEA) is commonly cited, according to which energy security should be defined as the uninterrupted availability of energy sources at an affordable price [
21]. At the same time, it has a long and short-term dimension. In the longer term, it concerns investments in energy supply in line with economic development and sustainable environmental needs, while in the short term it focuses on controlling supply and demand changes. With this approach to the issue of energy security, the associated uncertainty that many countries feel is the result of a lack of physical availability of energy sources or inaccessible prices.
The literature proposes three positions towards understanding the essence of energy security, namely the approach taking into account:
Technical and technological parameters, i.e., technical stability and resistance of the energy system;
Only the questions of whether and how much energy is imported by a given country (using the energy dependence index);
Comprehensive approach to the discussed issues, including a number of variables (technical, market, economic, environmental, etc.) in order to assess and forecast energy security. An example of such a comprehensive approach is the international energy security risk index (IESRI), a composite aggregated measure based on 29 individual variables divided into eight groups. IESRI started to be used in research from 2012 as a new tool designed to facilitate a better understanding of global energy markets [
1].
Azzuni and Breyer (2020) [
14] believe that measuring energy security by means of appropriate methods is of great importance as it allows for an objective assessment using reliable numerical indicators. The authors presented methodological gaps in their work. In their conclusions, they pointed out that there is no single way to develop and increase energy security, but there are various alternatives and options. The literature on the subject indicates that it is difficult to measure energy security with a simple measure [
8]. An example of a proposal is the use of MCDA methods, which will enable the combination of indicators into one index [
15]. With Saisana et al. (2005), [
11] indicates that such a complex measure is more reliable if the analysis of uncertainty, sensitivity, and robustness is also performed.
Gasser (2020) [
12] pointed out that the interest in using energy security indicators has increased recently. He also indicated their usefulness for comparing countries in terms of energy. In his work, he presented the results of a detailed analysis of 63 quantitative indicators measuring the level of energy security of at least one country. In their conclusions, the author of the review indicated the lack of transparency, especially in areas such as selection of a set of indicators, standardization methods, weighting of indicators, and aggregation functions. He also noted weaknesses in data processing and multivariate analysis. According to Gasser [
12], only a few studies provide analyses of uncertainty, sensitivity, or robustness, which may increase confidence in the final results. Additionally, the author noted that in most studies, indexes are constructed on the basis of historical data. Few provide forecasts or scenario analyses which are tools to show future trends that can support policymakers in making the right decisions about future energy policy.
Podbregar et al. (2020) [
1] emphasize that the usual methodological approach (i.e., the selection of indicators to measure energy security, cannot be used). According to the authors, the collection of the data used and its subsequent processing takes place using a differentiated approach, which affects the correct analysis of energy security, which is associated with a high degree of risk, uncertainty, and ambiguity. The literature discusses and proposes many tools for assessing the level of energy security, including Kanchana and Unesaki (2014) [
22]; Lu et al. (2014) [
23]; and Phdungsilp (2015) [
24]. Noteworthy are the studies by Azzuni and Breyer (2017) [
25], continued in 2020 [
14], who developed a 15-dimensional analysis of energy security which included: availability, diversity, cost, technology and efficiency, location, time frame, resilience, environment, health, culture, literacy, employment, politics, military, and cyber security. The authors emphasized that this is one of the most comprehensive and detailed approaches. They also noted that there is a need to develop an appropriate tool to quantify the level of energy security that will support appropriate policy in this area and the need for a holistic but sufficiently detailed approach for individual countries in a global context. In 2020, Azzuni and Breyer [
14] proposed an energy security assessment using an indicator covering the sustainable development of the energy system. This index is built on 15 dimensions and parameters discussed in the publication from 2017 [
25], and according to the authors, the newly introduced energy security index completes the existing research gaps in energy issues.
The literature on the subject shows methodological diversity, the results of interesting research and the use of interesting measures used to assess the level of energy security. An example is the risky external energy supply (REES) index used by Le Coq et al. (2009) [
26] to assess the security of the EU’s external energy supply (oil, natural gas, and coal), whereas Delgado (2011) [
27] proposed the socioeconomic energy risk index, and Munoza et al. (2015) [
28] used the geopolitical energy supply risk index (GESRI) in their research to quantify geopolitical energy risk. The ordered weighted average for the EU countries was the methodological basis for the complex indicators of energy supply security, which was proposed by Badea et al. (2011) [
29]. Another proposal for measuring energy security is an indicator constructed with the use of the five most common dimensions of this issue, developed by Erahman et al. (2016) [
30]. The proposal to use the proprietary index of energy security covering the environment and social aspects in EU countries was proposed by Radovanovic et al. (2017) [
31]. However, Augutis et al. (2020) [
32] stated that this proposal does not provide any threshold values and the results are difficult to interpret, which undermines the information credibility in terms of energy security of the proposed measure.
The article by Chernyak et al. (2018) [
33] containing analyses and forecasts of the energy security risk index for eleven European countries in the period between 1992 and 2016 is noteworthy. Taking into account various approaches to defining energy security discussed in the literature, the authors proposed a regressive model for assessing the energy security risk index, which takes into account the levels of economic, technical and technological, environmental, social, and resource components. Earlier, they classified the countries under study into three groups according to IESRI, and in their final research they focused on calculating the forecast of the energy security risk index based on data from 1992 to 2014. According to the authors, this made it possible to learn about the shaping of the energy market in the near future, especially for Ukraine, which needs to develop a new energy security strategy.
Li et al. (2019) [
34] believe that among the works published recently, it is worth paying a lot of attention to discussing the current situation, forecasts and proposed decisions in the field of energy security. Interesting considerations on energy demand, its supply and import as well as costs, energy security, CO2 emissions in connection with the state and environmental development of Pakistan were presented by Lin and Raz (2020) [
35]. The authors estimated eleven indicators of energy security for long-term energy supply using the MARKAL framework and obtained proposals for solutions to improve the energy security of their country. Augutis et al. (2020) [
32] presented a study on the energy security of the small Baltic countries (Estonia, Latvia, and Lithuania), which is essential for ensuring energy independence and is a driving force for economic development. In their work, they presented the research results obtained on the basis of a system of indicators, which took into account the technical, economic, geopolitical, and socio-political aspects of energy security. The main goal of the work of Podbregar et al. (2020) [
1] was an analysis of the methodological environment of the IESRI. In the presented study, the authors used stepwise regression, principal component analysis, and Promax oblique rotation. Critical evaluation of the Index suggested design changes to it and the removal of variables that do not contribute to its precision.
Table 1 includes studies that measured countries’ energy security and risk using various methods and energy indices. In turn,
Table 2 includes other interesting research in the field of energy security.
The discussed studies indicate the importance of energy policy and energy security. They propose a complex approach to energy security and risk assessment, while signaling that it is important to properly capture uncertainty, sensitivity, and robustness in such analyses. Additionally, great attention should be paid to forecasts and scenarios relating to the future. A research gap is visible here, indicated, among others, by Gasser [
12], related to paying too little attention to the analysis of the future. Therefore, in this study, we propose a forecasting framework for energy security assessment. It forecasts future energy security using the Holt’s method. As discussed above, our framework takes into account the uncertainty of forecasts based on fuzzy set theory, and at the same time provides a comprehensive safety assessment through the use of the complex IESRI index and the MCDA methodology.
3. Materials and Methods
The methodological approach proposed in the article is based on four foundations: data available in the International Index of Energy Security Risk report [
36], Holt’s forecasting method [
37], fuzzy set theory [
38], and the fuzzy weighted sum method (FWSM) [
39].
3.1. International Index of Energy Security Risk
The empirical material used in the research came from a report [
36] on the IESRI. It is a tool designed to better understand global energy markets. The report contains information on the trends in the field of threats to energy security and the energy market in the period from 1980 to 2018. The published lists concerned 25 countries that make up the group of significant energy users: Australia, Brazil, Canada, China, Denmark, France, Germany, India, Indonesia, Italy, Japan, Mexico, the Netherlands, New Zealand, Norway, Poland, Russian Federation, South Africa, South Korea, Spain, United States, Thailand, Turkey, Ukraine, and Great Britain.
IESRI is a complex indicator that measures threats to energy security in relation to the base average of countries belonging to the Organization for Economic Cooperation and Development (OECD). The primary source material for the index is the U.S. Energy Information Administration’s database of international energy statistics, which is compiled from hundreds of other documents and data. Key information comes from, among others, the World Bank, IEA, British Petroleum or OECD. These include, for example: energy prices, transport and energy generation, and the use of refineries. Selected information on energy security has been concentrated in eight categories: (1) Global Fuel, (2) Fuel Import, (3) Energy Expenditure, (4) Price & Market Volatility, (5) Energy Use Intensity, (6) Electric Power Sector, (7) Transportation Sector, (8) Environmental. They represent and balance some key and often competing aspects of energy security. Using these categories as guidance, 29 individual metrics were developed covering a wide range of energy sources, energy end-use, generation capacity, operations and emissions. The individual metrics and categories along with the assigned values of the weighting factors are presented in
Table 3 [
36].
Due to the different measurement units that accompany the variables that take part in the index construction, they were transformed into a comparable form. In order for the indicator to provide information on both changes in energy security risk in a given country and changes in risk compared to other countries over time, an international benchmark has been created. A complete description of the methodology, IESRI values obtained for individual countries participating in the study, and the ranking obtained on this basis were published in the International Index of Energy Security Risk report [
36].
It should be noted that, in practice, IESRI is a MCDA model. Metrics correspond to criteria, categories correspond to groups of criteria, individual countries and the OECD group are decision alternatives, and the calculation procedure used in IESRI is a practical implementation of the weighted sum method (WSM). In turn, the performances of alternatives are the values of the metrics for individual countries.
3.2. Holt’s Forecasting Method
The two-parameter Holt’s model is the exponential smoothing method [
37], which is used when significant change in the development tendency of the forecast variable is found [
40]. This model belongs to the group of adaptive forecasting methods and is used when there is a time series in which there is a distinct systematic component in the form of a linear trend with random fluctuations.
Due to the popularity of the Holt’s method, a significant number of its applications in various fields have been reported in the literature. Among the recent publications, the work of Poonia and Azad (2020) [
41] on short-term COVID-19 forecasts for 28 Indian states and five union territories deserves attention. Martinez et al. (2020) [
42] were also interested in the topic and applied the Holt’s model to predict daily reported COVID-19 cases in Brazil and three Brazilian states. Another application of the mentioned procedure for forecasting electricity consumption in Malaysia is presented in the work of Ahmad and Nor (2020) [
43]. On the other hand, the research by Soebandrija et al. (2020) [
44] focused on forecasting the demand for laboratory equipment, and the work of Huard et al. (2020) [
45] includes sales forecasts based on Cdiscount e-commerce data. There is also great interest in the Holt–Winters model, which is one of the adaptive models of forecasting variables with seasonal fluctuations. The work of Trull et al. (2020) [
46] discusses electricity demand forecasts in Spain. On the other hand, the article by Almazrouee (2020) [
47] presents a comparison of the Prophet model with the Holt-Winters model in order to assess the long-term forecasting of electrical loads in Kuwait.
The Holt’s method involves smoothing using a moving average of the time series. Thanks to this action, we obtain information about the properties of the series that can be used to calculate the forecast. Holt’s method for a time series without seasonal fluctuations can be written by the Formulas (1) and (2):
where:
—the level is a smoothed estimate of the value of the data at the end of the t period (t = 0,1, …, n),
—the trend is a smoothed estimate of the average growth at the end of the t period,
—smoothing parameters, .
Finding the optimal values of
α and
β is looking for a combination of these parameters that minimizes the sum of squared prediction errors one step ahead, according to the Formula (3) [
48]:
In Formula (1), the starting point is to take the corresponding actual value as the evaluation of the trend value in the first period. The Holt’s method takes into account the dependence (2) of the increase in the assessments of the trend value in the
t period on the change (increase) in the assessments of the trend value in the previous period, i.e.,
t−1. The
β parameter expresses the effect of the previous increment. The force is greater as
β approaches zero. Thus, the forecast can be written as the Formula (4):
where:
—the last (latest) evaluation of the trend value,
Expired forecasts can be compared with the actual values of the time series. The obtained differences are errors of expired forecasts provided by the model for the adopted parameters
α and
β. The linear mean of the expired forecast errors is taken as a general measure of the quality of the Holt model, according to the Formula (5):
3.3. Fuzzy Set Theory and Fuzzy Weighted Sum Method
The fuzzy set theory was developed by Zadeh [
38], and one of its practical implementations are trapezoidal fuzzy numbers (TFNs) [
49,
50]. The advantages of TFNs, compared to more complex implementations, are: ease of use, ease of interpretation [
51], computational efficiency and easier data acquisition [
52]. It is believed that the trapezoidal approximation is a reasonable compromise between the tendency to lose too much information and the tendency to introduce too complicated forms of approximation [
52]. TFN
is described by the Formula (6) [
53]:
with
The basic mathematical operations performed on TFNs and used in the developed research procedure are adding two TFNs
and multiplying TFN by the crisp number
, according to the Formulas (7) and (8) [
54]:
Fuzzy numbers can be generated from the set of crisp numbers. This process is called fuzzification [
55]. In the fuzzification process, TFN elements can be constructed on the basis of at least two approaches, which we have defined as: (1) the population standard deviation approach [
13], and (2) the half distance approach between max./min. and the mean [
56]. In both approaches, the
values of TFN are generated from the formulas shown in
Table 4, where
is the
i-th sample in the form of crisp number, and
k is the number of samples.
In the approach based on population standard deviation, in extreme cases, and in particular when , the variable may become negative. In that case, the negative value should be replaced by assigning . Based on the above-mentioned elements of the fuzzy set theory, the FWSM was implemented, which in practice is a fuzzy extension of the MCDA model used in IESRI.
WSM in its classic version [
57] is also called the weighted scoring method or simple additive weighting (SAW) method [
58]. Although WSM defines the data normalization procedure [
59], data normalization is already implemented in IESRI and all data is provided in a normalized form [
36]. Therefore, in our approach, we decided to use FWSM without a built-in standardization procedure. Thanks to this, we avoided additional scaling of the data, and as a result, the obtained numerical results of forecasts are fully consistent with the scale used in IESRI. Consequently, the current IESRI results (2018) can be compared with the forecasts obtained in the study. The use of other MCDA methods, such as AHP [
60] or PROMETHEE, would not allow direct comparison of the status quo with the forecast values, as the results would be expressed on scales other than the scale used in IESRI.
FWSM, as with other MCDA methods, allows one to consider a discrete decision problem that includes a set of decision alternatives
. Each alternative is considered in terms of
n criteria belonging to the set
, and the criteria are assigned weights
, where
[
61]. FWSM calculates the sum of the products of the criteria weights and the performance of alternatives for each criterion, according to the Formula (9) [
62]:
Then, the obtained values are defuzzified using the Formula (10) [
39,
62]:
In our FWSM implementation, the alternatives are ranked from minimum to maximum, so the better alternative has a lower .
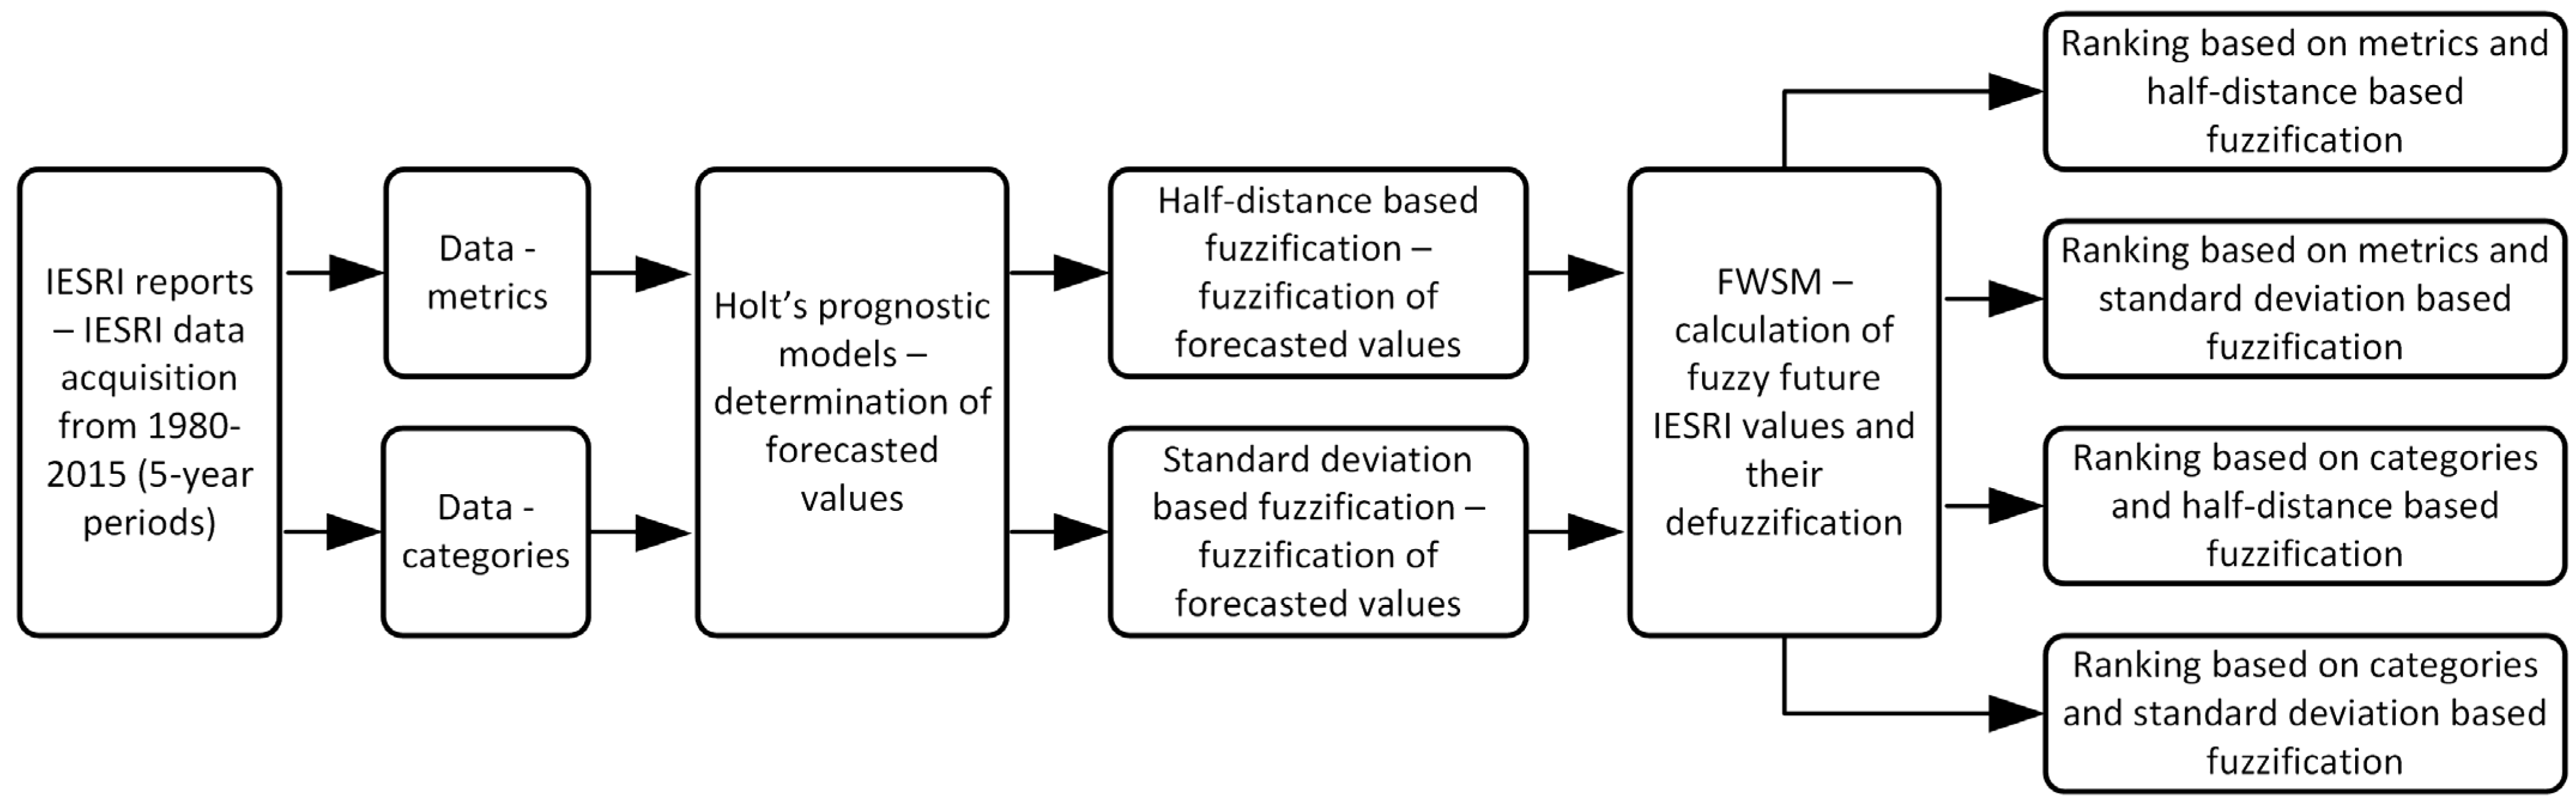
3.4. Research Procedure
The data available in the 2020 edition of the International Index of Energy Security Risk report [
36] were obtained for the research. The data included 29 metrics, grouped into 8 categories. The metrics covered five-year periods from 1980 to 2015, and their values were given for twenty-five countries and for the OECD group in total. The IERSI report was also used to derive the weights of individual metrics and categories. It should be clarified here that the use of five-year periods caused that the most recent data (i.e., data from 2016, 2017, and 2018 were ignored). The use of these data would disrupt the five-year trend due to the non-cyclical nature of the time series. In other words, the latest trends would be determined in the one-year time frame, not in the five-year frame, disturbing the dynamics of changes in the time series. As a result, this would lead to the incorrect behavior of the forecasting model.
Based on data from 1980 to 2015, Holt’s forecast models for each country and OECD group were built. These models made it possible to determine the projected values of individual metrics and categories in 2020, 2025, and 2030 (see Formulas (1)–(4)). While the forecast for 2020 seems to be overdue already, it should be noted that research data for this year are not yet available, as the IESRI report for 2020 will not be available until 2022. It should be indicated that for the forecasts for 2020–2030, the forecast horizon value was
h = 1, 2, 3. Moreover, it should be clarified that in the case of a downtrend, in some cases the Holt’s method generated negative values. Since the IESRI values are ≥0, negative values were converted to 0. For metrics, these were 14 negative forecasts for 2020, 51 forecasts for 2025 and 63 forecasts for 2030 (see
Tables S2 and S3 in Supplementary Materials). In turn, in the case of the category, these were 2 forecasts for 2020, 3 forecasts for 2025 and 5 forecasts for 2030 (see
Tables S4 and S5 in Supplementary Materials).
Then, based on the forecasted metric/category values for 2020, 2025, 2030, TFNs were generated. These numbers were constructed separately using both approaches indicated in
Table 4. TFNs generated for individual countries were input data for the multi-criteria procedure based on FWSM.
The FWSM procedure was carried out using Formulas (9) and (10) with the use of arithmetic operations defined by Formulas (7) and (8) on TFNs determined by Formula (6). As a result, defuzzified forecasted IESRI values were obtained. The values are in ascending order, so the best alternative has the lowest risk described by the IESRI value.
The diagram of the test procedure is presented in
Figure 1.
It should be noted that the procedure was carried out in two variants. The first was to use the detailed metrics used by IESRI. However, the second option was based on categories, which made it possible to make slightly more generalized forecasts relating to averaging the values of the metrics included in a given category. In this way, the forecasts were to some extent independent of detailed metrics. In this variant, the values of a given category were calculated as the weighted sum of the metrics that make up this category. Then, on the basis of these averaged values of the categories, category forecasts for the years 2020, 2025, 2030 were generated. As a result, a total of four rankings were obtained, based on metrics or categories of metrics and one of the two fuzzification methods. It allowed us to verify the forecasts and examine the sensitivity of the obtained solution depending on the selected level of generalization of the criteria (metrics or categories) and depending on the selected fuzzification method.
4. Results
All of the obtained results were based on the data published in the International Index of Energy Security Risk report (2020 edition) [
36]. Based on this data, the projected future IESRI values were calculated. At the beginning, the category values were calculated based on the values of individual metrics. Then, for the categories and for the detailed metrics, forecasts for the year 2020, 2025, and 2030 were determined, using the Holt’s method for this purpose. Source data for each country in the form of metric values, as well as calculated category values and forecasts, are presented in the
Supplementary Materials, Table S1.
Based on the value of the forecasts, fuzzification was performed using two approaches and the TFNs aggregating the forecasts for the years 2020, 2025, and 2030 were determined into one fuzzy number for each metric/category describing a given country. These TFNs are also featured in the
Supplementary Materials, in Table S2 (metrics, standard deviation based fuzzification),
Table S3 (metrics, half distance based fuzzification),
Table S4 (categories, standard deviation based fuzzification), and
Table S5 (categories, half distance based fuzzification). In this way, four different scenarios presented in
Tables S2–S5 were defined, the solutions of which were different variants of the IESRI forecast for the period 2020–2030.
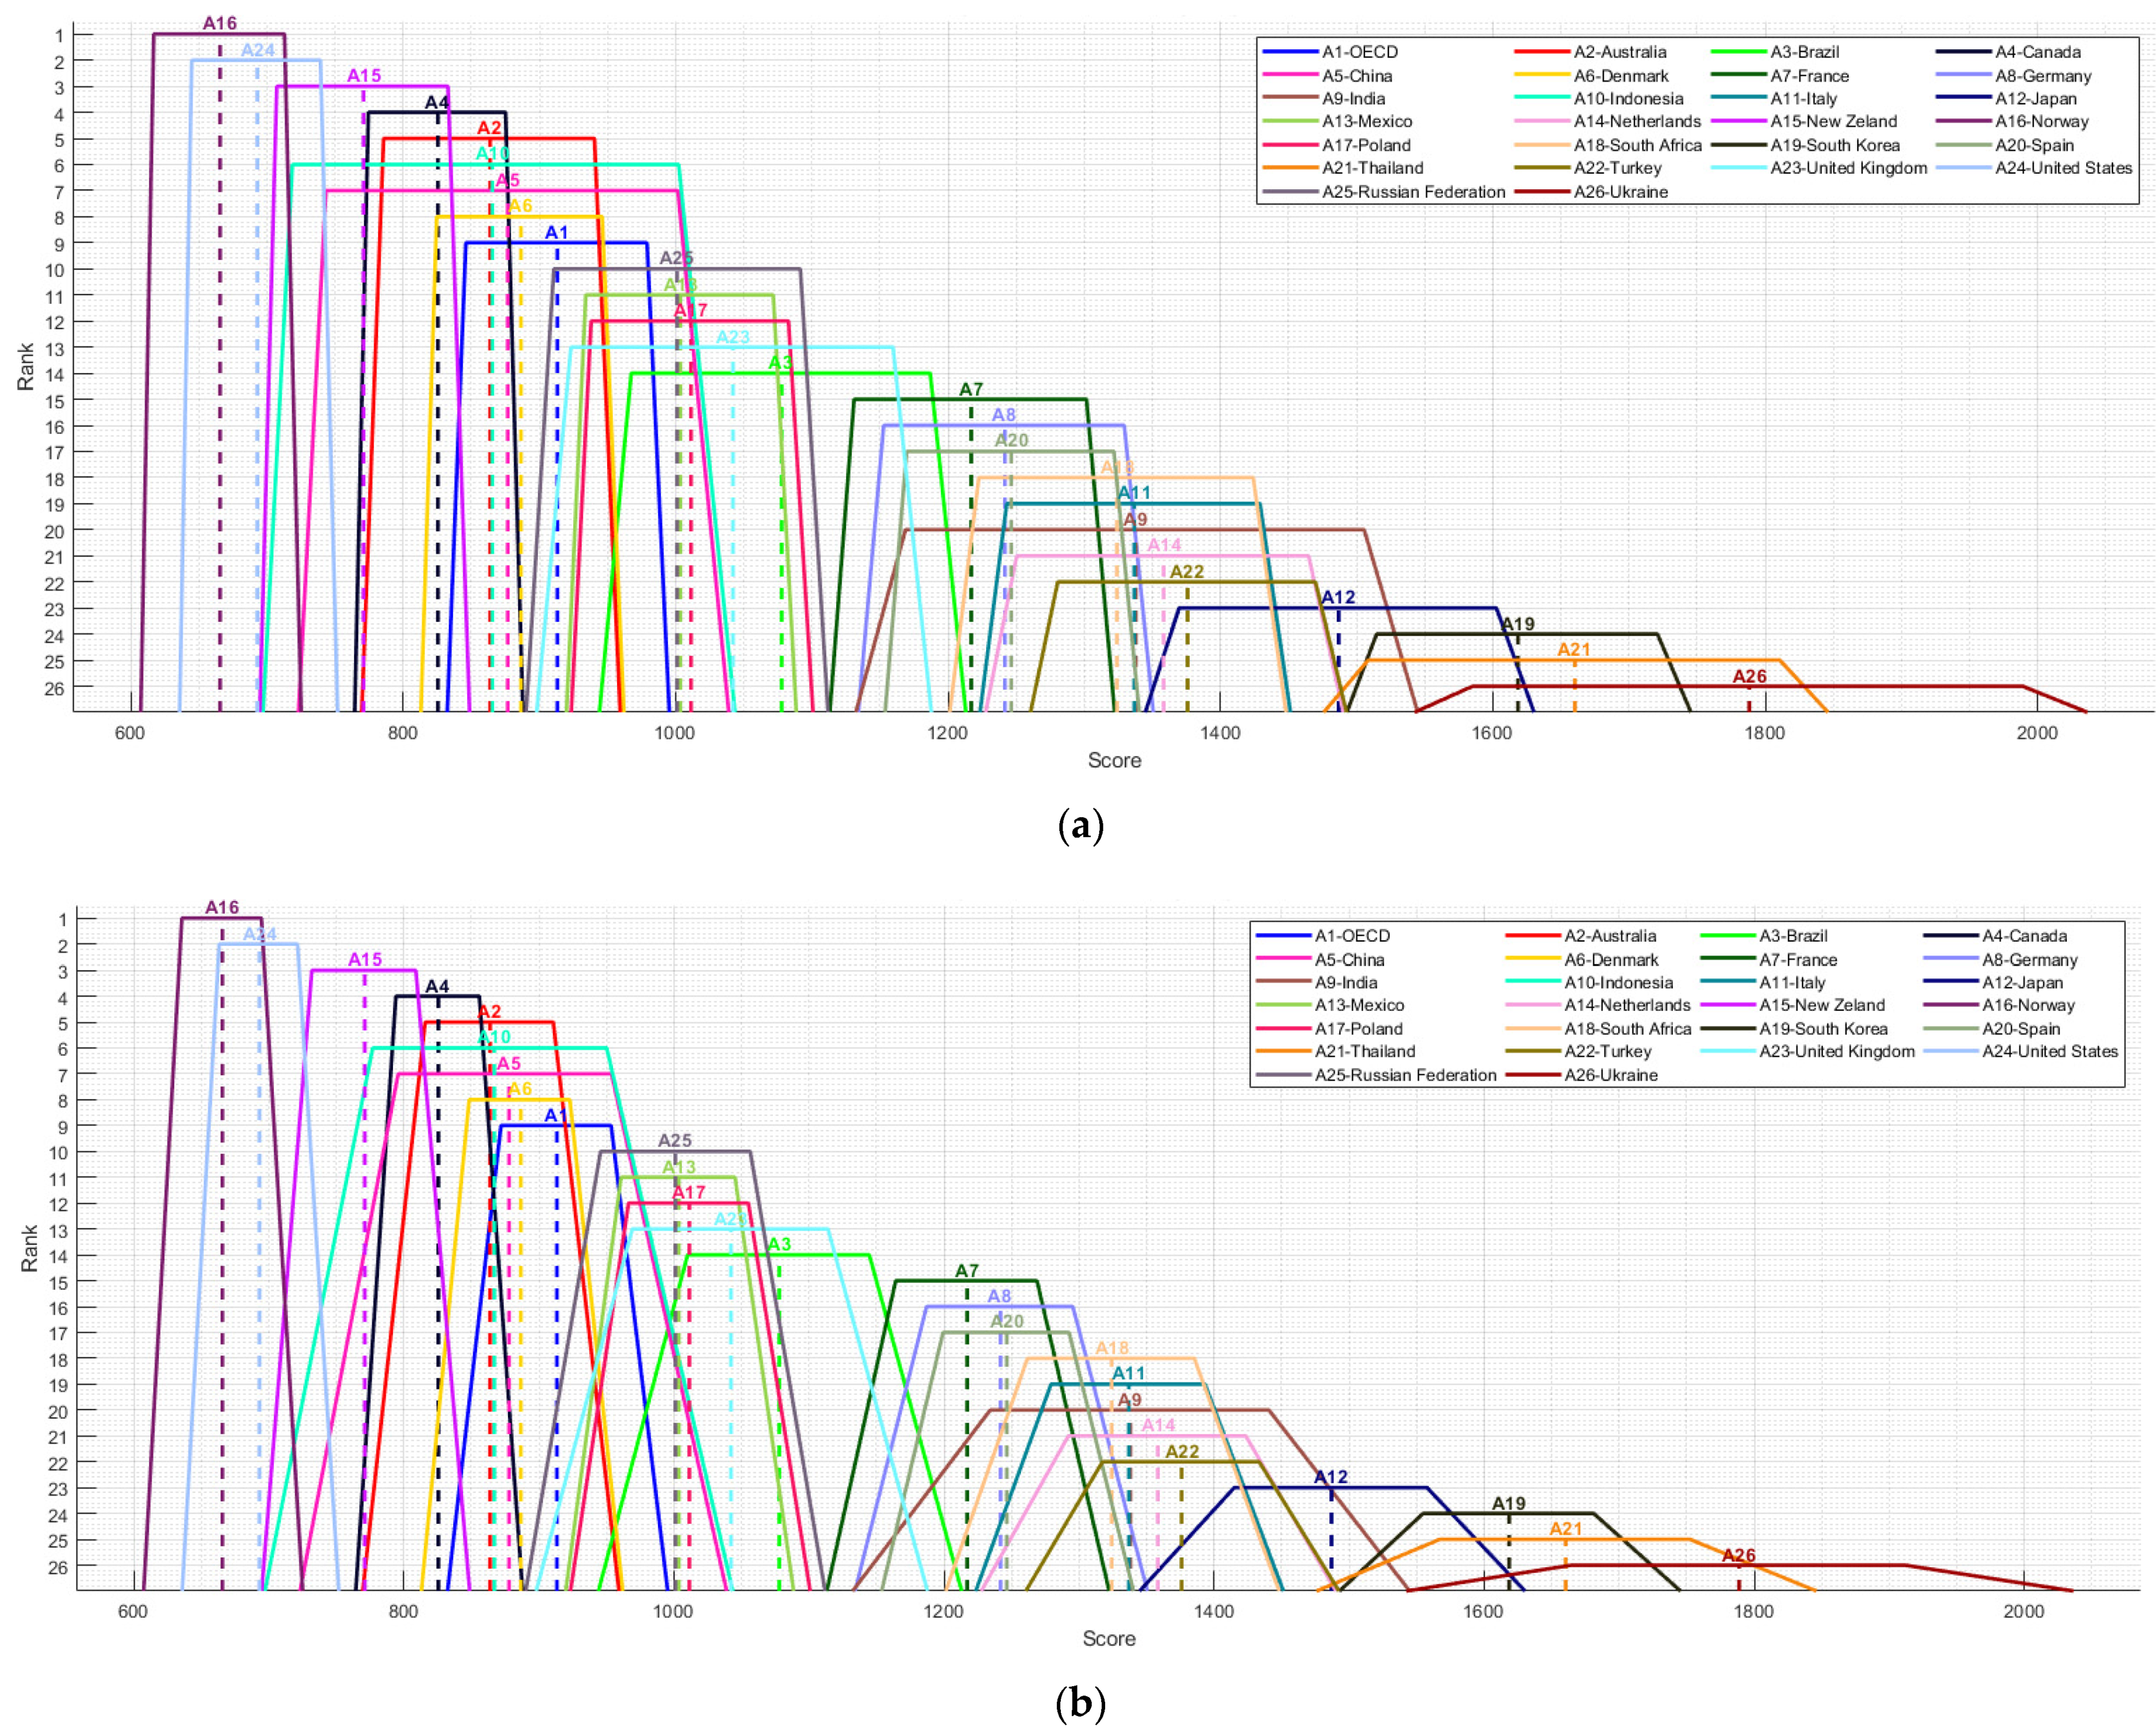
As a result of the research, for each of the scenarios considered, a country ranking was obtained, based on the aggregated IESRI values forecasted for the 2020–2030 period.
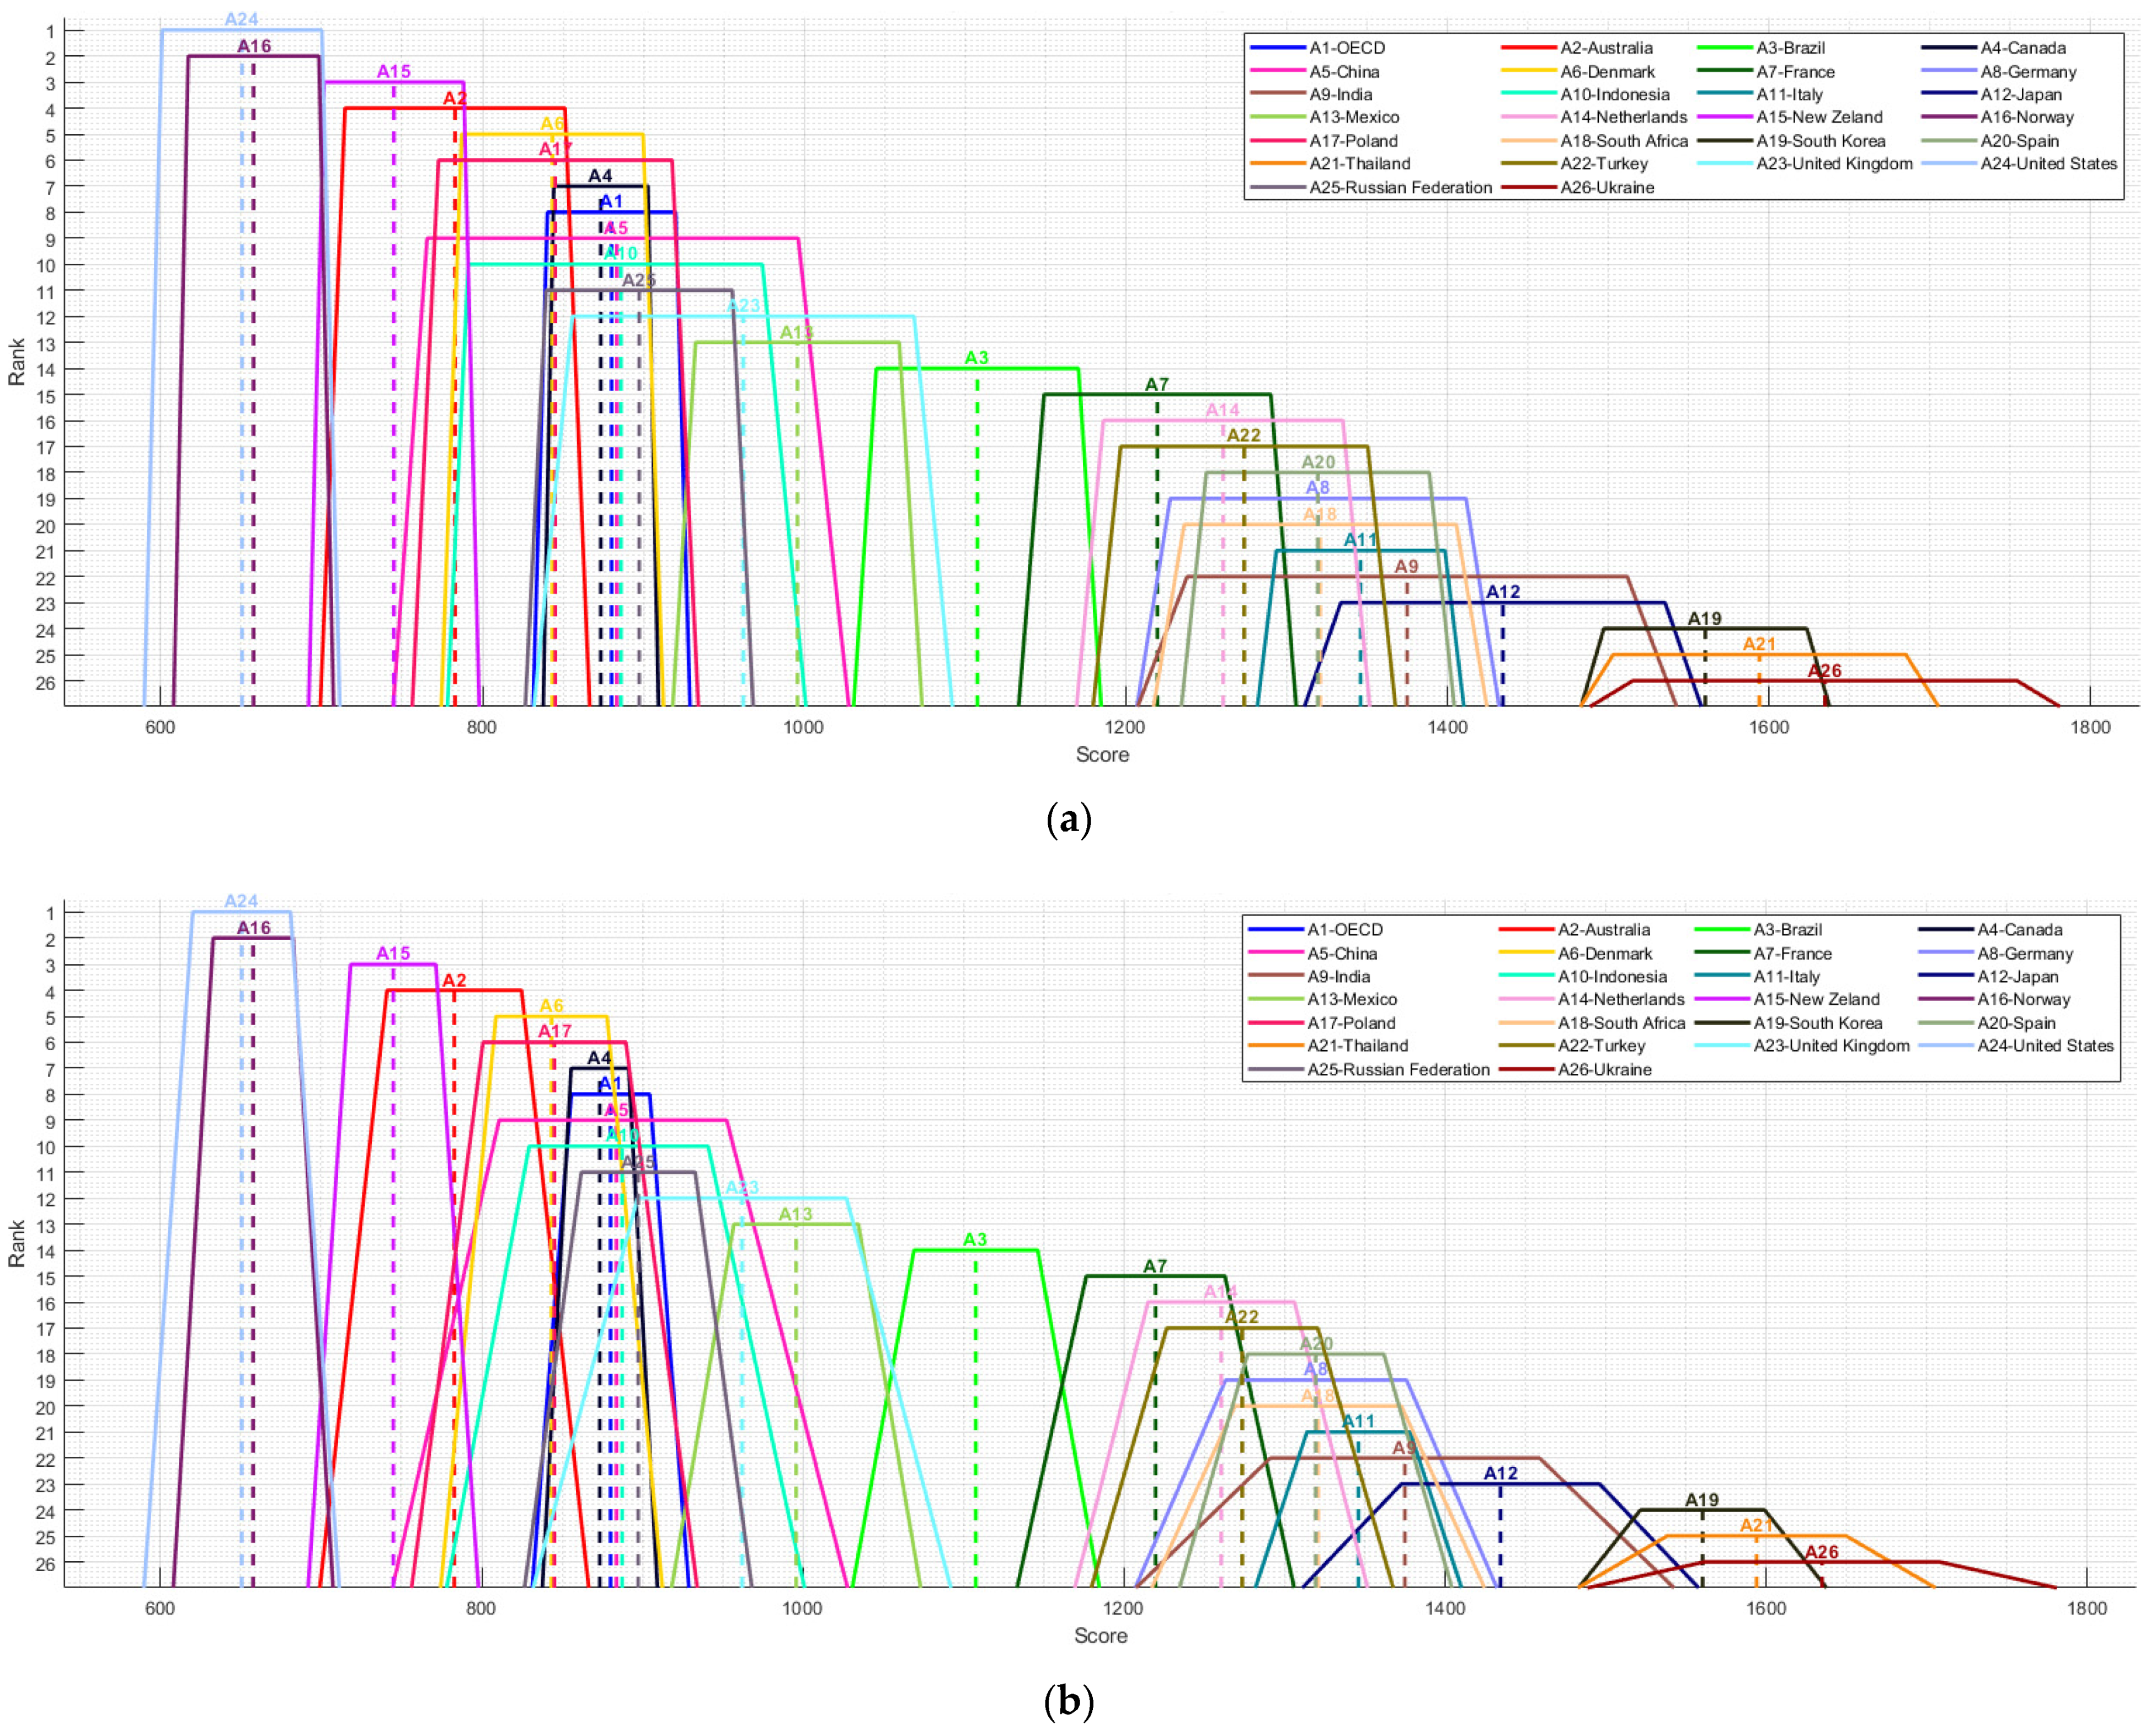
Figure 2 shows the rankings obtained on the basis of the forecasted metric values, using TFNs constructed using standard deviation based fuzzification (
Figure 2a) and half distance based fuzzification (
Figure 2b). In turn,
Figure 3 shows the rankings generated using the forecasted values of the categories, based on TFNs constructed using standard deviation based fuzzification (
Figure 3a) and half distance based fuzzification (
Figure 3b). The rankings with the numerical values of the forecasts are also presented in
Table 5, against the background of the current state taken from the International Index of Energy Security Risk 2020 edition report [
36]. Additionally,
Table A1 and
Table A2 (
Appendix A) show the values of TFNs
(see Formula (9)), the defuzzified values of which in
Table 5 were the basis for determining the order of countries in the rankings. The same TFNs shown in
Table A1 and
Table A2 are also shown in
Figure 2 and
Figure 3 and represent the fuzzy values of the IESRI forecasts for the 2020–2030 period.
When analyzing the results presented in
Table 5, it should be noted that both in the case of forecasts based on metrics and categories, the fuzzification method hardly affects the obtained forecasts. Depending on the selected fuzzification method, differences appear in the case of the TFN core, which results from the formulas shown in
Table 4 and is shown in
Table A1 and
Table A2. It can also be seen from
Figure 2 and
Figure 3 that using standard deviation based fuzzification a wider TFN core is obtained than using half distance based fuzzification. However, after the defuzzification of TFNs presented in
Table A1 and
Table A2, the differences between standard deviation based fuzzification and half distance based fuzzification almost always concern only the decimal part of the score, as shown in
Table 5. Slightly larger differences, at the level of 1.5 score points, appear only in the case of Indonesia (A10). Nevertheless, the fuzzification method does not affect the order of countries in the rankings.
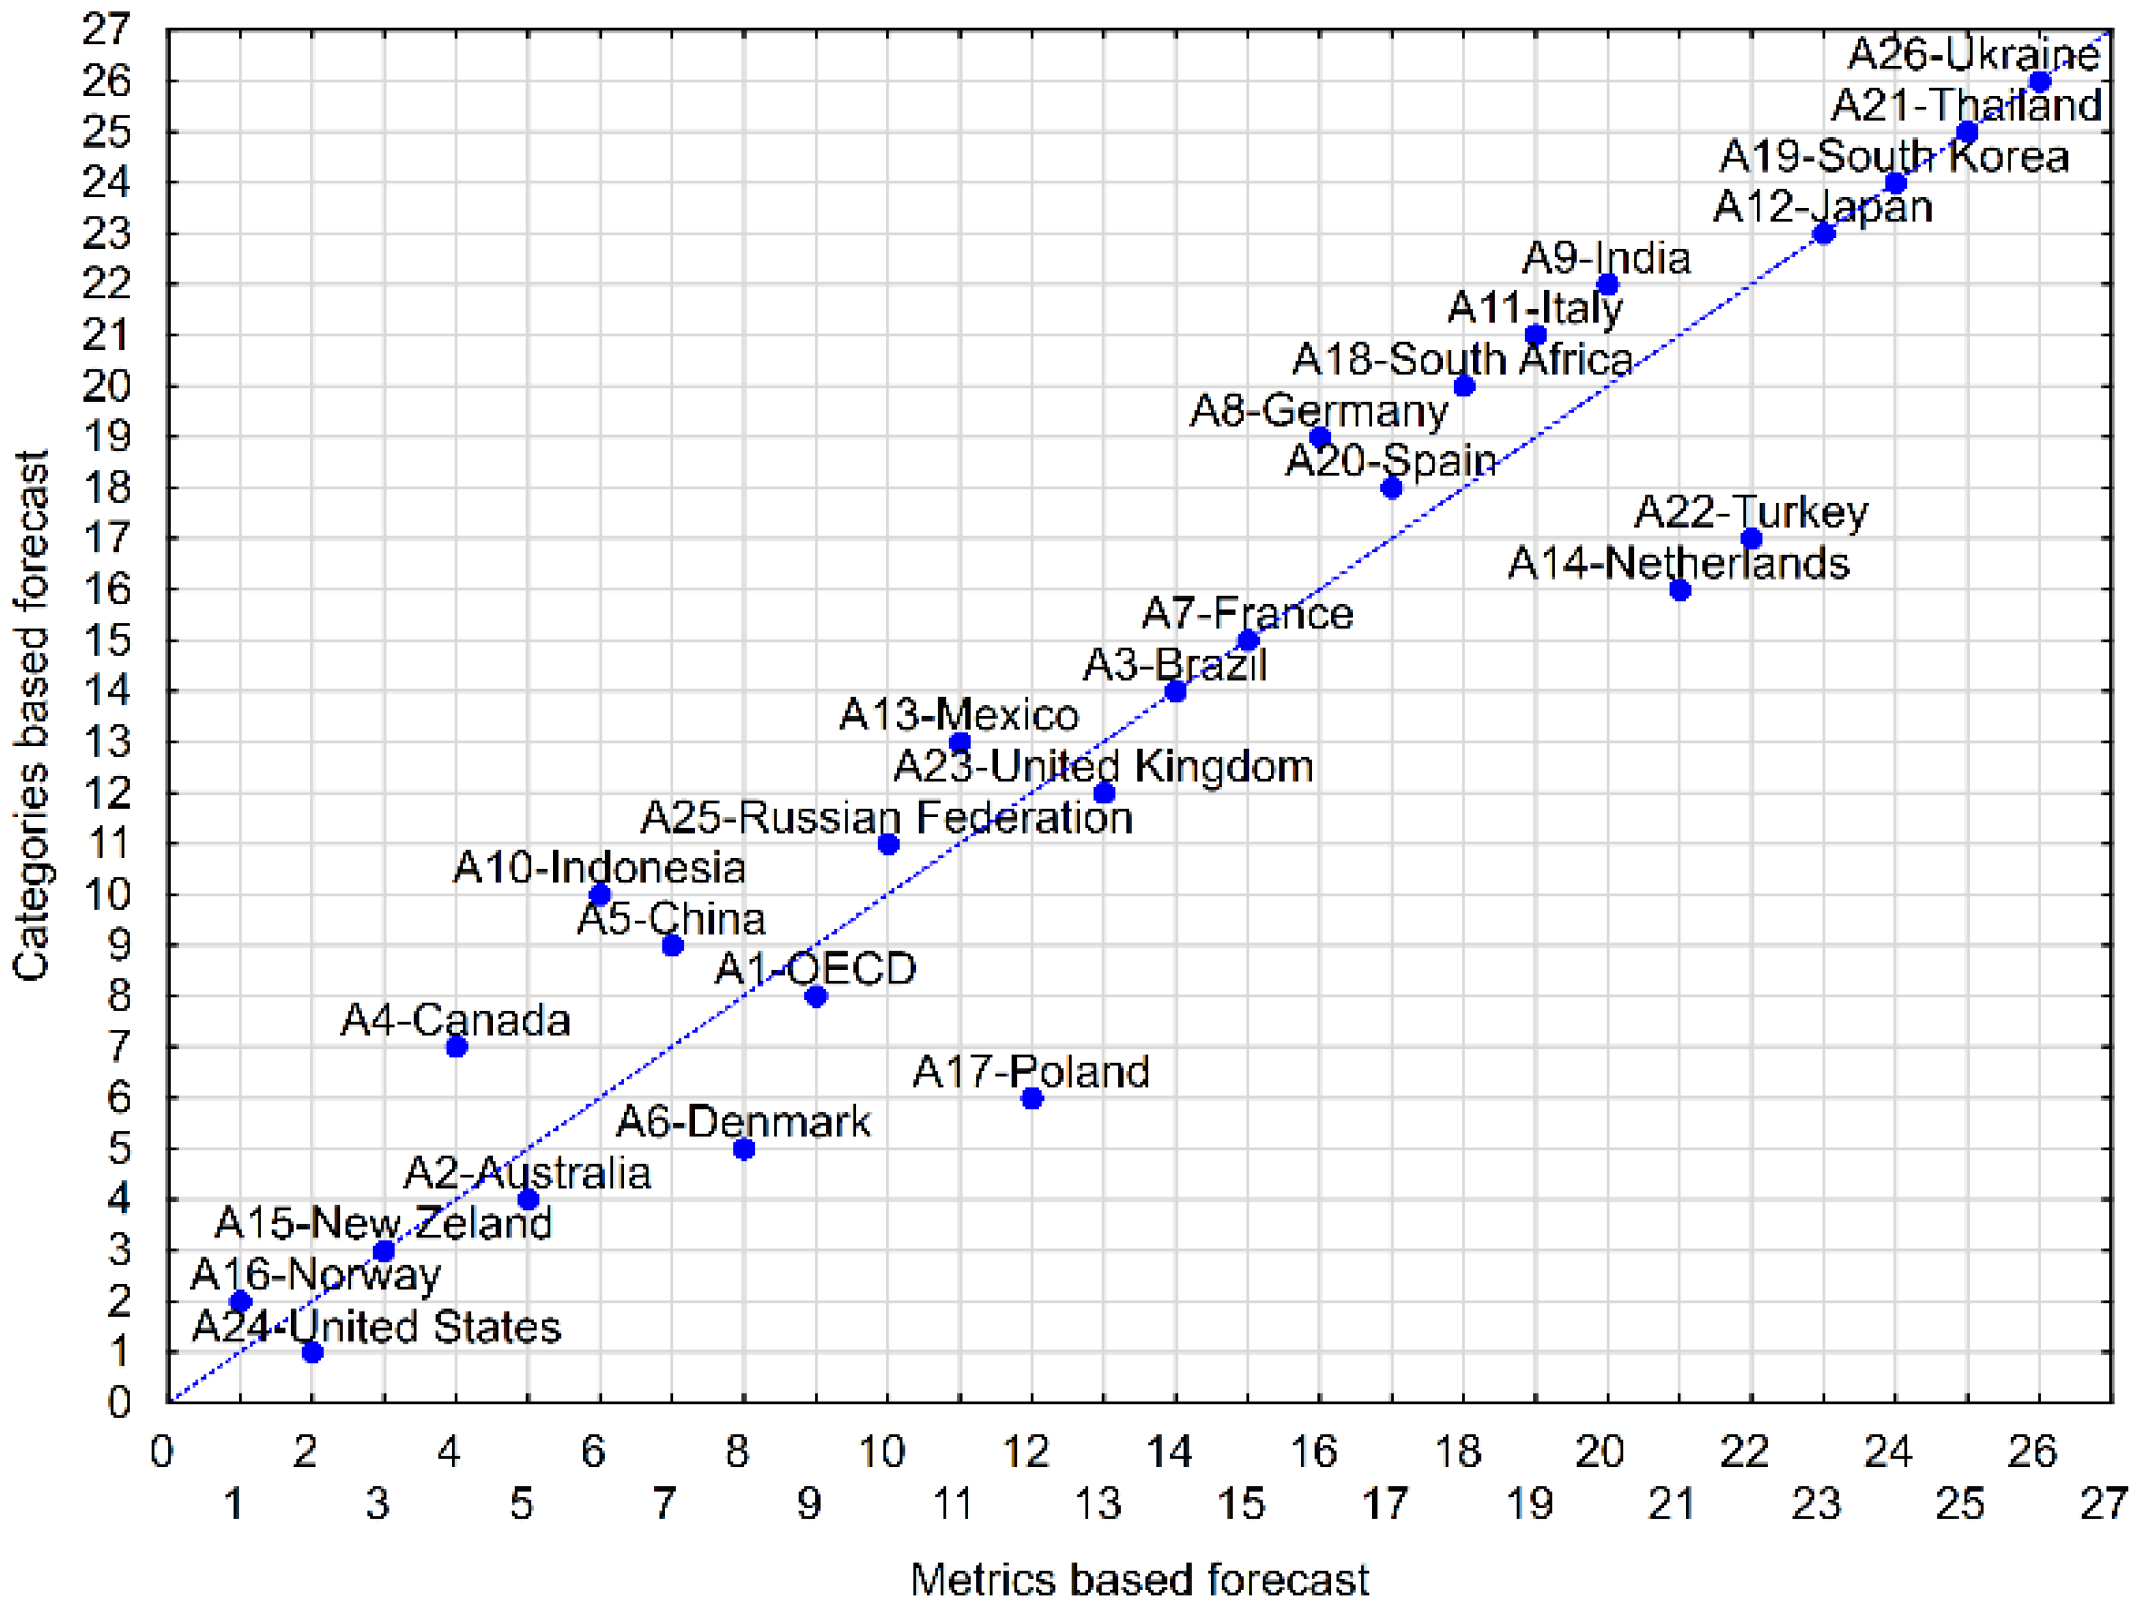
When it comes to comparing forecasts based on metrics and categories, they differ to some extent. The smallest differences between the forecast scores obtained on the basis of metrics and categories are in the case of A5-China, A7-France, and A18-South Africa. These differences are at the level of about 4–6 score points. In turn, the largest differences, exceeding 100 points, appear in the case of A17-Poland, A22-Turkey, A25-Russian Federation, and A26-Ukraine. The analysis of the dispersion between the forecast rankings based on metrics and categories is shown in
Figure 4.
Table 5 and
Figure 4 show that the considered rankings overlap for seven countries: A15-New Zealand (3rd place), A3-Brazil (14), A7-France (15), A12-Japan (23), A19-South Korea (24), A21-Thailand (25), and A26-Ukraine (26). For most countries, the differences in the rankings are 1–3 places, and there are bigger differences only in the case of A10-Indonesia (4 places), A17-Poland (6), A14-Netherlands (5), A22-Turkey (5). The Kendall’s tau correlation coefficient, which is recommended when examining the similarity of rankings [
63], for rankings based on metrics and categories was 0.84, which indicates a significant similarity. On the other hand, some countries show that the differences in forecasts based on metrics and categories can be significant.
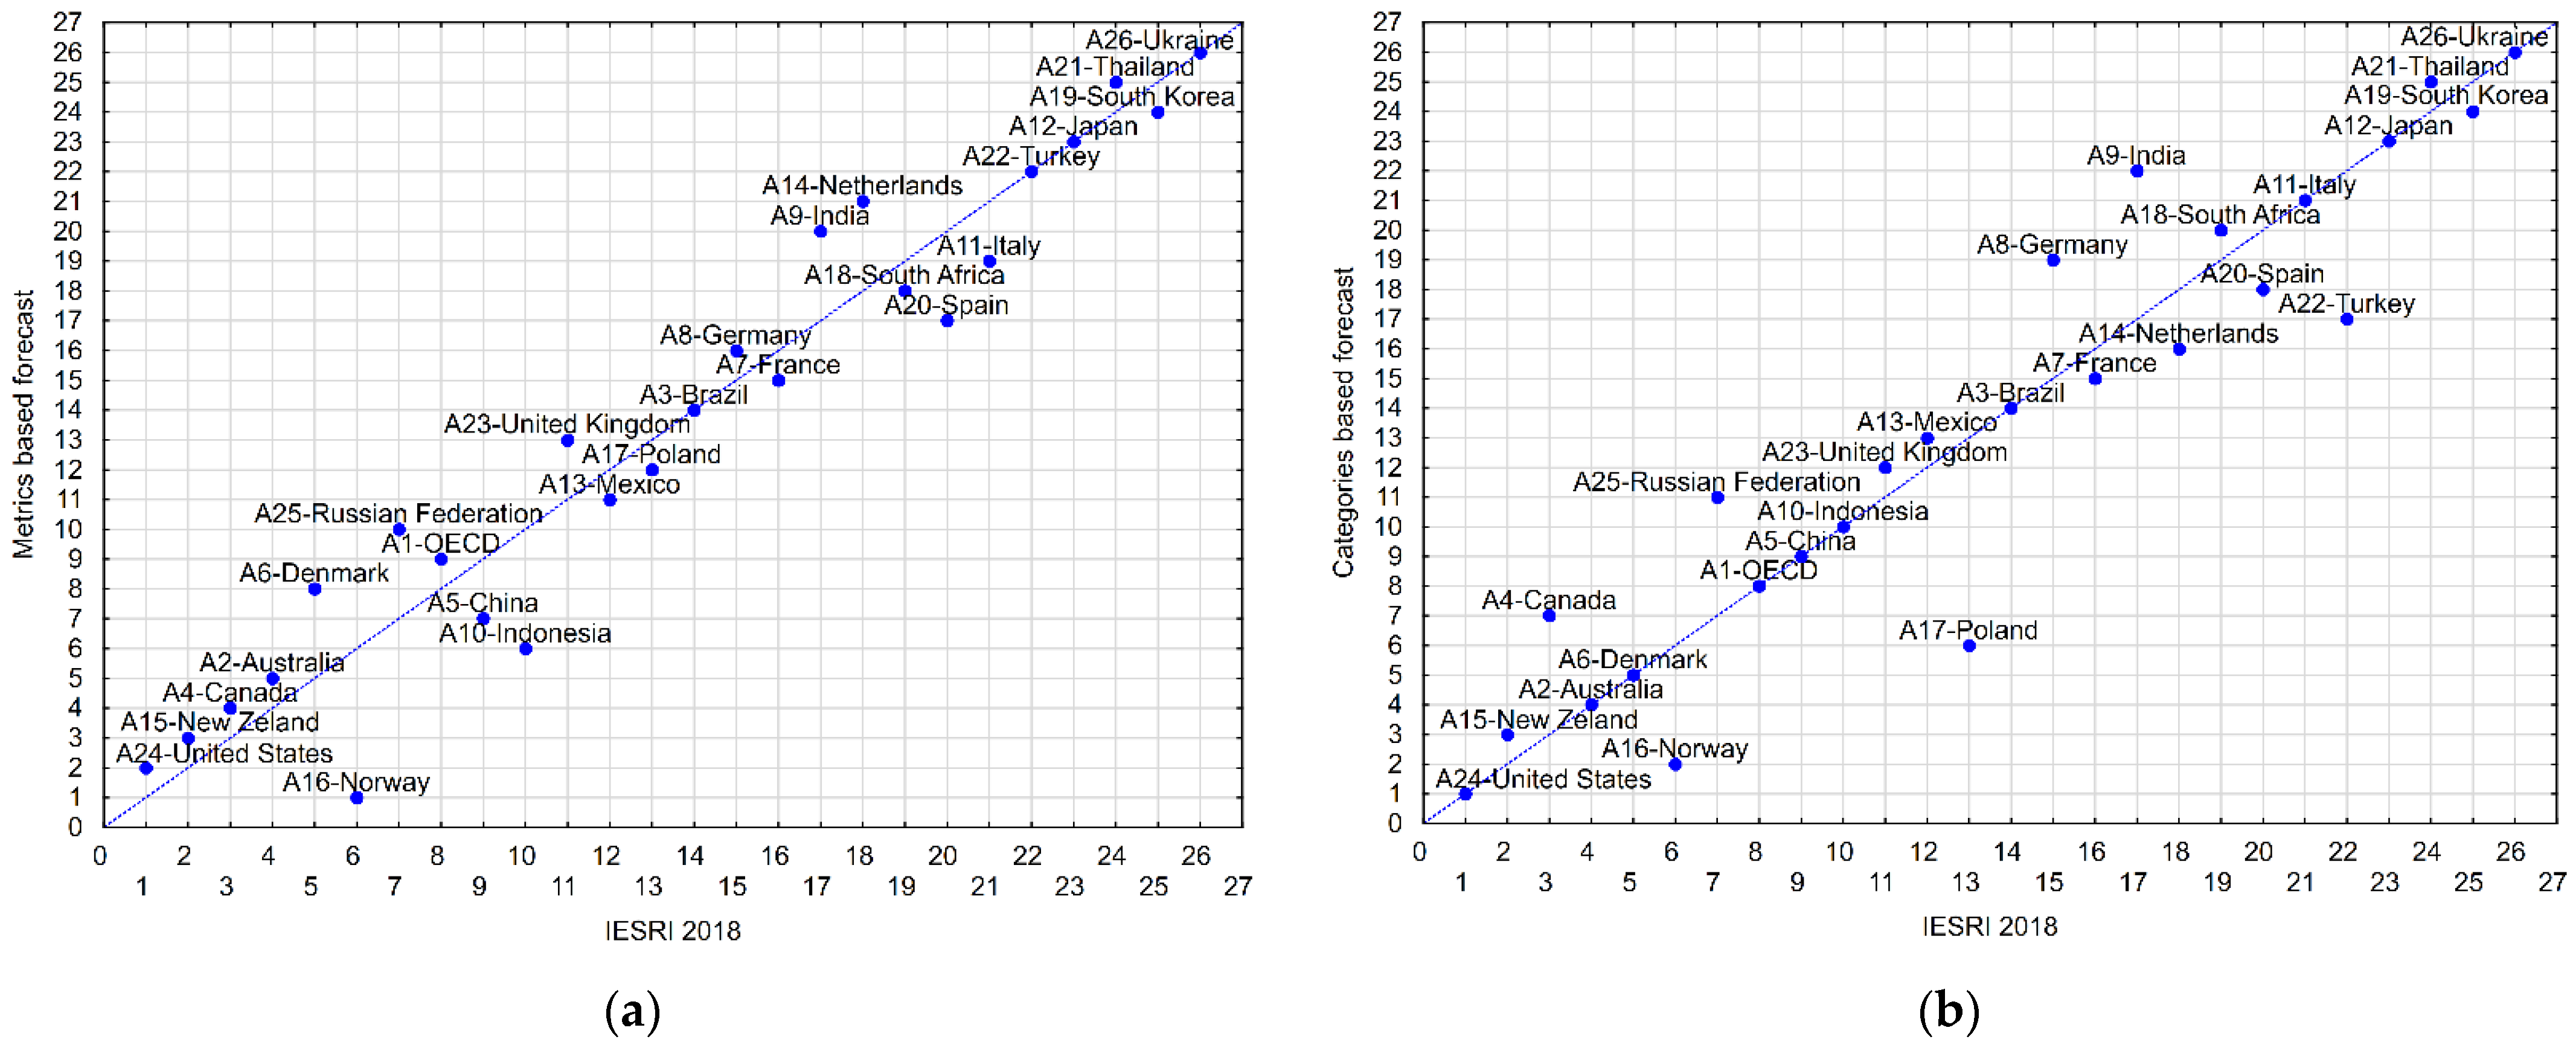
The most important element of the analysis is the comparison of the current (Energy Security Risk 2018) scores and the current ranking with the forecasts.
Figure 5 shows the scattering between the current IESRI 2018 ranking and the projected rankings based on metrics and categories. If a country is below the diagonal of the graph, it means that the forecast predicts its rise in the ranking in the period 2020–2030 in relation to 2018.
Based on
Figure 5a and
Table 5, it is easy to see that in the case of the metric-based forecast, the promotion of the following countries is predicted: A16-Norway (by 5 places), A5-China (2), A10-Indonesia (4), A20-Spain (3), and A11-Italy (2), as well as a promotion by one place for A13-Mexico, A17-Poland, A7-France, A18-South Africa, and A19-South Korea. In turn, the biggest loss, by as many as three places, is expected in the case of A6-Denmark, A9-India, A14-Netherlands and A25-Russian Federation. Other countries will report losses as well, and the forecast shows no change in the ranking for A3-Brazil, A22-Turkey, A12-Japan, and A26-Ukraine. According to the metric-based forecast, the most significant advance of A16-Norway will make it overtake A24-United States between 2020 and 2030 and become a leader in the IESRI ranking. However, taking into account the uncertainty expressed by the fuzzy scores and presented in
Figure 2 and in
Table A1, it should be noted that the change of the leader is not certain. Moreover, based on
Figure 2 and
Table A1, A15-New Zealand and A10-Indonesia also have a minimum chance of being first in the ranking. On the other hand, A15-New Zealand may even drop to position nine in the 2020–2030 ranking, behind the OECD average (A1). On the other hand, A10-Indonesia could drop to position 14 behind A3-Brazil. The greatest uncertainty is characterized by the forecast A26-Ukraine score, which is in the last place in the 2018 ranking and in the 2020–2030 ranking. However, despite this, it is only allowed to be in the 23rd place and getting ahead of A12-Japan in the forecasted ranking based on metrics.
When analyzing
Figure 5b together with
Table 5 (i.e., the forecasts based on categories), it should be noted that A16-Norway (by four places), as well as A17-Poland (7), A22-Turkey (5), A14-Netherlands (2), A20-Spain (2), A7-France (1), A19-South Korea (1) are expected to rise in the ranking. This forecast shows that A24-United States, A2-Australia, A6-Denmark, A1-OECD, A5-China, A10-Indonesia, A3-Brazil, A11-Italy, A12-Japan, and A26-Ukraine have maintained their position in the ranking. The biggest drops in the ranking, by as much as 3 places, are expected for: A9-India (by 5 places), A4-Canada (4), A8-Germany (4), and A25-Russian Federation (4). For the remaining countries, a decrease by one place is forecasted. In the case of the category-based forecast, A24-United States is expected to remain at the top of the ranking, but an uncertainty analysis based on
Figure 3 and
Table A2 indicates that there is a high probability that the United States will be overtaken by A16-Norway. In turn, the A15-New Zealand and A2-Australia have only a minimal chance of overtaking these two countries. The lowest uncertainty is characteristic of the 14th place of the A3-Brazil alternative, which with low probability may change places in the ranking with A13-Mexico, A23-United Kingdom, A7-France, and with minimal probability it may be overtaken by A14-Netherlands and A22-Turkey. As in the metric-based forecast, also here the last place is predicted for A26-Ukraine, which, after taking uncertainty into account, could move up a maximum of 4 places and overtake A9-India. It should be noted here that due to the different methodology (averaging the values of metrics in categories and forecasting the value of categories), the predicted ranking based on categories is less reliable than the forecast based on metrics.
5. Conclusions
Summarizing the obtained results from the methodological point of view, it should be stated that the forecasts presented in
Table 5 are not completely certain. Therefore, a very important contribution of this article concerns the consideration of the uncertainty captured with the fuzzy set theory and represented by TFNs. This uncertainty indicates some acceptable prediction error and informs about alternative possible IESRI score values and positions in the predicted rankings (see
Figure 2 and
Figure 3 and
Table A1 and
Table A2). Additionally, thanks to the forecast aggregation method consisting in the construction of a fuzzy number based on forecasts for 2020, 2025, and 2030, the resulting forecast takes into account the uncertainty of time. Thanks to this, in practice, the possible time of occurrence of the event (obtaining the predicted IESRI score value) was obtained in the 2020–2030 period without a strong determination of the exact time.
Despite the uncertainty, the forecasts indicate certain trends, the observation of which, together with the obtained numerical values of the forecasts, constitutes a practical contribution of the article. The observed trends include: dynamic increase in energy security by Norway (decrease of the IESRI score by over 200 points in the perspective of 2020–2030 in relation to 2018), stability of energy security in the case of the United States, or no chance for improvement of Ukraine’s energy security. Analyzing
Table 5, one can also notice a generalized conclusion that countries such as China, Indonesia, Norway and the United States will increase their energy security. However, in the case of other countries, the security will decline (IESRI score will increase) even in the case of anticipated promotions in the IESRI ranking.
As for the limitations of the methodology used, it should be remembered that the presented forecasts are based on Holt’s method taking into account linear trends with random fluctuations. This means that this method does not take into account seasonal fluctuations, unlike the Holt-Winters method. On the other hand, in the perspective of the five-year periods 1980–2015, it is difficult to find such seasonal fluctuations, since if they did occur, they would probably have been included and smoothed out within the five-year periods. Also, the use of TFNs may raise the objection that there are much more advanced fuzzy set implementations. However, as noted earlier, TFNs have numerous advantages over other more complex implementations. The biggest limitation of the applied forecasting methodology is the fact that it is only a mathematical model that may not take into account real events and situations in the political, economic or social context. On the other hand, the mathematical model was based on a reliable, complex IESRI. In turn, the numerical data contained in the IESRI 2020 edition constitute a reliable basis for the developed model and determine its numerical reliability. As for the directions of further work, an interesting issue may be the use of other MCDA methods to forecast energy security risk such as VMCM [
64], Fuzzy ANP [
65], or Fuzzy TOPSIS [
18].


