Article

Reuse of Flowback Water from Hydraulic Fracturing for Drilling Mud Preparation and Secondary Hydrocarbon Recovery

by
Ewa Knapik
,
Katarzyna Chruszcz-Lipska
,
Łukasz Łukańko
* and
Sławomir Wysocki
Faculty of Drilling, Oil and Gas, AGH University of Science and Technology, al. Mickiewicza 30, 30-059 Krakow, Poland
*
Author to whom correspondence should be addressed.
Energies 2021, 14(18), 5921; https://doi.org/10.3390/en14185921
Submission received: 5 August 2021 / Revised: 11 September 2021 / Accepted: 15 September 2021 / Published: 17 September 2021

Abstract

:
Flowback water after completion of hydraulic fracturing is one of major waste streams generated during the lifespan of a well so its beneficial reuse is crucial. The application of treated flowback is not limited to stimulation processes but also may include drilling operations and secondary oil recovery. The flowback water used in this work is characterized by high salinity reaching up to ~295 g/L caused mainly by NaCl. The presence of suspended solids, mainly corrosion products, prompts the use of coagulation and filtration as treatment methods. Among tested coagulants the most effective one was the SAX18 (NaAlO2) commercial coagulant applied at concentration of 12 mL/L which reduces the water turbidity from over 400 FTU to 23 FTU. The applied treatment greatly reduces the concentration of scaling ions and so the concentration of SiO2 is reduced by 64%, Ba2+–66%, Fe2–36%, Mn2+–65%, SO42−–66%. The treated flowback fluid can be reused in surfactant flooding for enhanced oil recovery where achieves 7% higher displacing efficiency than fresh water. The drilling muds which were prepared using the untreated flowback water exhibit good rheological properties. The obtained results show that recycling of flowback water in future drilling and exploitation operations is technically feasible.

1. Introduction

Natural gas produced from unconventional reservoirs represents 40% of the world’s recoverable natural gas [1]. Hydraulic fracturing (HF) is a necessary stimulation method to achieve a profitable level of gas production. Large quantities of fresh water used for HF cause severe environmental concerns, such as large surface and/or groundwater withdrawal, induced earthquakes, generation of large volumes of produced and flowback water transported to disposal wells [2,3]. The reuse of produced and flowback water in hydraulic fracturing operations is commonly practiced by industry to reduce fresh water consumption. This internal recycling minimizes the costs of flowback transport and disposal. According to Candia and Seth [4] the operators can save anywhere from $50,000 to $30,0000 per single fractured well by using advanced technology to recycle their water. There are many successive examples of a proper flowback management. All major gas fields in USA, from the Marcellus and Utica in the Northeast, to the Eagle Ford and Permian Basin in Texas, are recycling this waste stream.
Although the reuse of flowback for fracturing is well established there are some technical obstacles hindering this process and other directions for flowback usage should be considered. The feasibility of flowback reuse depends on two major factors. Foremost is the quantity of the flowback generated. The term flowback refers to the fluids and sand returning to the surface during the first few days/weeks after stimulation. This stream usually contains produced water, which is a natural formation water [5]. Hydraulic fracturing operations require an average of 20,000 m3 of water per well while the amount of flowback is approximately 950 to 2200 m3 of water per well [6]. This volume provides approximately 5% to 15% of the total water needed to fracture a new well. At the same time this volume could completely satisfy the total water demand during drilling a new well so this direction in flowback management seems to be reasonable and should be consider by operators.
The second major issue in flowback water reuse is its quality. The high salinity, the presence of suspended solids and scale-causing compounds (calcium, magnesium, barium, sulfate) are typical constituents of concern. Dissolved salts and some hydraulic fracturing chemical additives are difficult to treat with conventional processes [7,8]. The water-quality limitations of reusing flowback for subsequent hydraulic fracturing were described in few reports [9,10]. Stewart [11] provides water quality parameters for fracturing fluids where the recommended chlorides concentration ranges from 2000 to 40,000 mg/L, calcium < 300 mg/L, iron < 10 mg/L, magnesium < 100 mg/L, barium 2 mg/L. To meet these criteria an intensive flowback treatment is required. Biological treatments [12] and electrocoagulation [13] are a viable options to reduce the chemical oxygen demand. Commercial desalination technologies relies on membrane separation [14]. Suitable desalination technologies for the high-salinity flowback include membrane distillation [15,16], reverse osmosis [17,18] and forward osmosis [19]. To avoid membrane fouling some pretreatments including coagulation, softening, adsorption and filtration are required. This approach results in increased costs of purification system and increased waste creation. Direct reuse of flowback without pretreatment (blending with fresh water) is technically feasible but requires the development of brine-tolerant fracturing fluid systems to avoid potential well plugging [20].
Preparation of drilling muds permits the use of water of lower quality. Some chemicals present in flowback may have a positive impact on mud properties. Additives such surfactants, scale inhibitors, biocides and friction reducers are common for both drilling and fracturing fluids [21,22]. Xiao et al. [23] found that polypropylene glycols, commonly identified in flowback [24], can increase the viscosity and reduce the API fluid loss of original drilling mud. Brine based drilling fluids are widely utilized systems due to their ability to inhibit swelling of formation clays and to control hydrostatic pressures without a weighting materials [25]. Both monovalent (NaCl, KCl, NaBr) and divalent (CaCl2, CaBr2, ZnBr2) brines are suitable as a base brine for mud preparation [26]. Huang et al. [27] calculated the so-called “safe salinity window” where the critical salinity is 28 wt.% hence the high salinity of flowback should not affect the mud properties. Moreover, using the flowback from a given formation to drill further wells in it may ensure good compatibility with formation fluids. There are numerous reports on reuse of produced water in drilling operations. Ezzat et al. [28] described an successful application of a high-density CaCl2/CaBr2 brine blended with the natural reservoir fluid in gas wells located offshore Egypt. Ribeiro et al. [29] studied the suitability of the Urucu oilfield produced water for mud preparation. Marathon Oil Company demonstrated beneficial use of produced water in the Indian Basin Field located in Eddy County, New Mexico [30]. This recycling in Marathon’s drilling projects saves over 15,000 m3 of groundwater annually. The application of flowback from hydraulic fracturing for mud preparation has not yet been described.
The water processing standards for its reinjection into formation are even lower. The reduction in permeability in the near-wellbore region depends mostly on the suspended solids and oil content in water. Michaelsen et al. [31] set the allowable limits for injection water to be 2 ppmv sand and 40 ppmv dispersed oil. Bader [32] proposed an acceptable limit of oil content in water below 10 mg/L. He et al. [33] describe the requirements for the quality of the water reinjected into the Sulige gas field. According to this study, only concentration of the divalent cations Ca2+ and Mg2+ should be limited to 150 mg/L and suspended matter < 10 mg/L while no specific limits for total dissolved solids are settled. Only minimal flowback treatment is necessary to meet these criteria. Mature oil fields are often revitalised by the use of hydraulic fracturing [34,35] and hence the resulted flowback can be reused for oil recovery. As flowback contains different surfactants and polymers its reinjection could be considered as a chemical enhanced oil recovery (CEOR) method. Dai et al. [36] studied the reutilization of flowback fluids composed of viscoelastic surfactants in surfactant flooding. During the investigations on core plugs the incremental oil recovery was on average 10% of original oil in place. Guar gum, the main component of fracturing fluids, has been described as natural polymer suitable in EOR operations [37,38]. All of this makes the use of flowback a promising method for EOR.
The main aim of this work is to develop new options for flowback reuse where an extensive water treatment system is not required. The obtained results are of great importance for oil industry as they show a new source of water for technical operations. So far the flowback water was utilized as a hazardous waste or reused for further fracturing operations. This study shows that water after stimulation operations may be used for drilling or production enhancement which can be especially useful for small oil fields operators where water utilization options are limited. Application of untreated flowback water for preparation of fully functional drilling mud is the main novelty of this study. For the first time the physicochemical and rheological properties of such drilling mud are reported. The second application of flowback includes its reinjection for oil recovery. The minimum flowback treatment including coagulation and filtration was applied to achieve reinjection water quality. The flooding tests were performed to evaluate hydrocarbons recovery and identify possible interactions between crude oil and flowback. To the best of our knowledge, this may be the first time to reuse guar-based fracturing flowback fluids for EOR. Presented results extend the range of flowback applications and create an opportunity for its effective and comprehensive management.
This research perfectly fits to general trends which postulate the maximum use of available water resources. Some urban water supply systems are a good example of water policy under scarcity conditions [39] but in oil industry a sustainable water management is still under development and different problems need to be solved. Contamination of drinking waters with salty flowback waters raises public concern so an advanced monitoring of water quality should be ensured. Study of Piazza et al. [40] shows the optimal configuration of a real-time sensor network and similar optimization system should be developed for wells in the oilfield. The application of flowback water outside the energy sector would require its deeper treatment. Sorption in fixed-bed columns packed with a reactive porous media could be an effective supplement to the present purification systems. Studies of Shubair et al. [41] and Eljamal et al. [42] show that new highly engineered materials can ensure an efficient treatment of contaminated waters. Based on results in this study our further research should focus on real-field applications where proposed solutions will be tested under reservoir conditions.

2. Materials and Methods

2.1. Chemicals and Reagents

Methylene chloride used as a solvent in the experiments was analytical grade and purchased from Sigma-Aldrich (St. Louis, MO, USA). Commercial coagulants including ALS, PAX18, PAXXL10, PAX19F, PAX19H, SAX13, SAX18, PIX113 and PIX116 were obtained from Antidotum Łódź Company (Łódź, Poland). The chemical standards used for water quality parameters measurements were analytical grade and purchased through Sigma-Aldrich. The crude oil with density of 0.827 g/mL and viscosity of 3.05 mm2/s was used in flooding experiments.
Drilling muds were prepared using a Functionally Graded Materials (FGMs) agent which is a mixture of biodegradable natural and synthetic polymers used as a structural forming composition for drilling fluids; developed by Polymer Tech (Krakow, Poland). Nano-Amine 016–cationic oligomer with primary amine groups, was used as a hydration inhibitor for water-based muds; developed by Polymer Tech. MIKHART 35 (marked as Block) is a ground marble (calcium carbonate) and was used as a bridging agent (BDC Poland, Krakow, Poland). Antykor PP provided by PSPW Krosno (Krosno, Poland) was used as an anti-corrosion agent.

2.2. Flowback Collection and Well Information

Hydraulic fracturing operations were carried out in west Poland in December 2019. The main goal was to perform hydraulic stimulation on two intervals in a Carboniferous formation. After geological investigation the decision was made to use two kinds of stimulation fluid i.e., linear gel and crosslink frac fluid. Two kinds of ceramic proppant were used (40/70 an 20/50 mesh), respectively. Base of both hydraulic fracturing fluids was 2 wt.% KCl in water. Before hydraulic fracturing operation to the well 4 m3 of 15% hydrochloric acid was injected. During second stage around 42 m3 of liner gel was pumped into the well. Linear gel fluid mixture was a composition of water, bacteria control additives, clay control additives, buffering agent and gelling agent. Detailed composition of linear gel fluid was presented in Table 1.
In the next stage, 695.9 m3 of crosslinked frac fluid was injected into the geological formation. In Table 2 detailed information about crosslinked fluid composition was presented.
In the last stage, 35 m3 of the previously described linear gel was injected. During hydraulic fracturing operation concentration of chemicals additives as well as proppant was changed. The average pumping of frac fluid rate was 3.68 m3/min and well head pressure was 300 bar. Immediately after whole hydraulic fracturing fluids were injected the well was shut off for gels breakage. After two hours of waiting, the well was open for the initial treatment process. During 4 days of well treatment process, 373 m3 of flowback was recovered and the well was shut for 3 weeks. The main flowback recovery process started at the beginning of January 2020 and was continued for 11 days. During this stage 781 m3 of mixture of fracturing fluid and formation water were recovered. The recovered fluid was sampled by the well operator approximately every two days and provided under a non-disclosure agreement. For laboratory experiments (coagulation and filtration and preparation of drilling mud) a mixture of flowback obtained on 12 January 2020 and 17 January 2020 was used (ratio 1:1).

2.3. Analytical Measurements of Physicochemical Parameters of Flowback Water

The turbidity of the flowback waters were measured by spectrophotometric method at a wavelength of 450 nm using a DR/2000 spectrophotometer (HACH, Loveland, CO, USA). The pH of the samples was tested with the potentiometric method using a combined electrode of the ERH-11 type combined with a model CPC-411 pH/conductivity meter by Elmetron (Zabrze, Poland). The electrolytic conductivity was measured by the potentiometric method using an EC-60 type conductivity cell, which is a system of two platinum electrodes placed inside a glass measuring cell. This sensor was coupled to the Elmetron model CPC-411pH/conductivity meter. The density of the samples was determined using the pycnometric method. Chloride ions were determined by the Mohr method. For this purpose, a standard AgNO3 solution with the concentration of 0.1 mol/L was used for the titration of the tested flowback water sample against potassium chromate as an indicator. The content of macroelements and selected microelements in the investigated aqueous samples were measured using emission spectrometry (inductively induced plasma emission spectrophotometer (ICP-OES)–Plasm 40 by Perkin Elmer, Norwalk, CT, USA). The size of suspended solids in raw and treated flowback was measured by a laser diffraction method using the Mastersizer instrument (2000, Malvern, Worcestershire, UK).
Total organic carbon (TOC) was measured using a TOC-L analyzer (Shimadzu, Columbia, MA, USA) according to Standard Method 5310B recommended by the American Water Works Association. The organic semi-polar compounds were extracted from raw and treated flowback using 15 mL of dichloromethane (DCM) per 100 mL of water sample. The obtained extracts were analyzed using a model 6890 gas chromatograph (Agilent, Wilmington, DE, USA) connected with an HP 5972 single quadrupole mass spectrometer operating in SIM mode. 1 μL of extract was injected in splitless mode on a 30 m DB-5 (0.25 mm I.D., 0.25 μm film thickness) capillary column at an injection temperature of 280 °C. The flow velocity of helium carrier gas was 35 cm/sec. Resulting chromatograms were screened against a NIST 17 mass spectral library to identify main organic compounds. Flame ionization detector was used as a complementary detector to MS. Temperature of FID was 320 °C and other operational parameters were the same as before. The total amount of extracted organics was determined by weight after solvent evaporation.

2.4. Preparation of Untreated Flowback-Based Drilling Mud

Weighed amounts of chemicals (as shown in Table 3) were added to 500 mL of water/flowback brine and mixed for 2 h with a mechanical stirrer at a speed of 3500 rpm. Technological parameters of prepared drilling fluids were investigated. Then the liquids were allowed to stand for 24 h, and after that time the technological parameters were tested again. Mixtures of flowback water and FGM agent were described as +FGM-x (where x is 1 or 2) and complete drilling fluids based on brine were denoted as Mud-x. The detailed chemical composition of the tested liquids is shown in Table 3.
Testing the rheological parameters of the prepared drilling fluids was carried out using an M3500 rotary viscometer (Grace Instrument, Houston, TX, USA) in accordance with the international standard API Spec 13B-1: Recommended Practice for Field Testing Water-based Drilling Fluids [43]. Clay swelling under the influence of prepared drilling fluids is an especially important phenomenon for different formations. Linear swelling studies were performed using a M4600 HP/HT Linear Swell Meter (Grace Instrument). The test rock samples (Miocene shale) were conditioned in the tested liquid for 20 h under standard conditions.

2.5. Coagulation and Filtration as Methods for Flowback Water Treatment

Coagulation experiments were carried out with the use of various types of coagulants containing the following compounds: sodium aluminate (SAX13, SAX18), polyaluminium chloride (PAX18, PAXXL19F, PAXXL19H, PAXXL10), aluminium sulfate (ALS), iron(III) sulfate (PIX113) and iron(III) chloride (PIX116). Detailed characteristics of these coagulants are presented in the Appendix (Table A1).
The experiment aimed at selecting the best coagulant for the investigated flowback water was as follows: 0.15 mL of the appropriate coagulant (Table A1) was put into each test tube, and then 30 mL of flowback water was added very quickly. It can be assumed that all samples in a series have the same start time for the coagulation process. The identification of the most effective coagulant was based on visual observations.
The next step was to select the optimal dose of coagulants for coagulants, which in the preliminary selection gave the best coagulation effect. The following doses of coagulant were used: 1200, 600, 300, 200, 100 and 50 μL per 50 mL of water. After the appropriate dose of coagulant had been added, the samples were mixed vigorously at 1000 rpm for 1 min and then slowly mixed for 2 min at 60 rpm with a 2 cm diameter stirrer in a 200 mL beaker. The samples were then allowed to settle down in the measuring cylinders. The coagulation process was observed over time for each of the samples.
After the coagulation process was carried out with the use of the best coagulant in its optimal dose (mL), the filtration process was performed. Filtration was done on a regenerated cellulose filter with a pore size of 45 μm. The thus obtained water was used for flooding experiments.

2.6. Flowback Flooding for Enhanced Oil Recovery

Due to the presence of low-weight surfactants the treated flowback can be considered as a chemical mixture suitable for chemical EOR method. Two sets of flooding experiments (with distilled water and treated flowback) were carried out to compare the recovery efficiency. Sandpack was used as a model porous media: 145 g of the quartz sand (0.25–0.75 mm grain size) was packed and compacted by vibrations in a glass column with an inner diameter of 3.0 cm and a length of 30 cm. The column was closed at both ends with valve plugs that allowed the liquid to pass through. The sand-filled column was weighed and distilled water was then pumped by a TH15 peristaltic pump (Aqua-Trend, Łódź, Poland) to determine the porosity of the bed. The wet-packed sandpack was flooded with 300 mL of crude oil, the content of water and oil in the core was determined on the basis of mass balance. The oil-saturated sandpack was oriented vertically and the oil was allowed to flow freely under the gravity (the simulated primary recovery). Distilled water (or flowback) flooding was conducted horizontally at a constant flow rate of 25 mL/min. The total amount of 1000 mL of distilled or treated water was injected. The resulted filtrate was collected in 100 mL vessels (10 samples of filtrate per each run). The crude oil was extracted from each sample using 15 mL of dichloromethane, the solvent was evaporated and the resulted oil was weighted. All experiments described in Section 2.3, Section 2.4, Section 2.5 and Section 2.6 were performed in triplicate. All data are shown as the mean of three samples with standard deviation.

3. Results and Discussion

3.1. Chemical Composition of Flowback

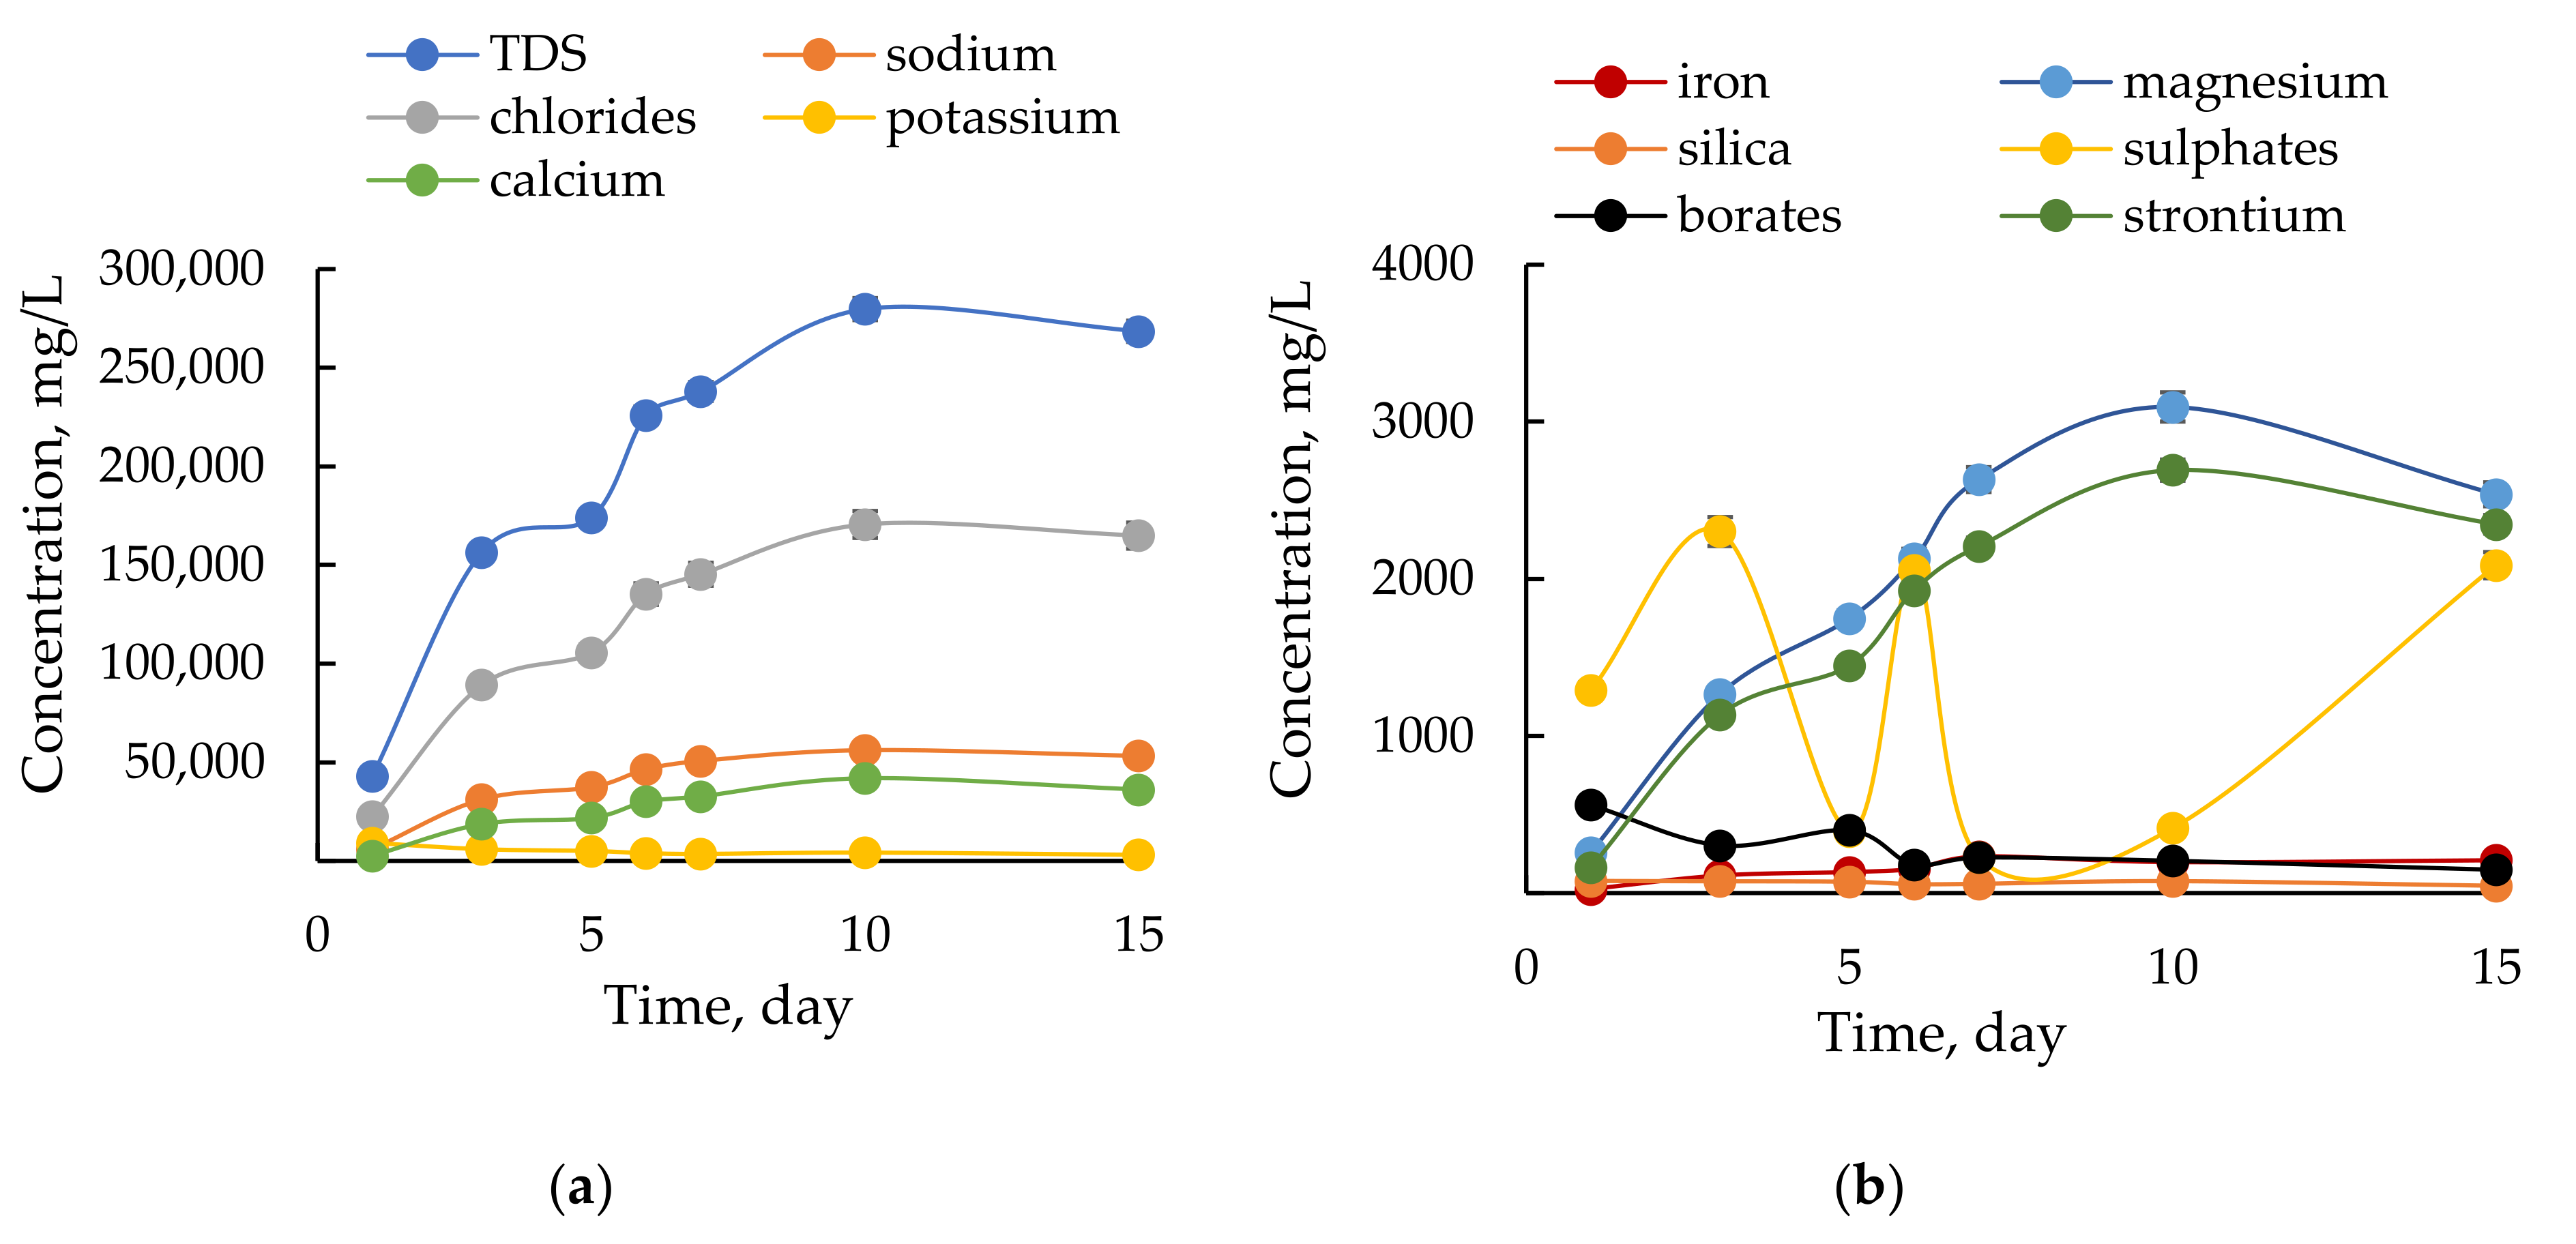
3.1.1. Inorganic Constituents in Flowback Water

Composition of flowback fluids is often reported due to the possible environmental issues and public concerns. Most researchers focus on composition of flowback and produced water from the Marcellus shale gas exploitation and other American reservoirs [44,45] while numbers of papers for European shale gas sites is limited. The detailed composition of received flowback is reported in Table A2 in the Appendix. The changes of water parameters over receiving time are shown in Figure 1.
The flowback composition is temporally variable. The mineralization of recovered flowback increased over time as a result of reservoir brine inflow. This explanation for the observed trend is confirmed by other researchers [46,47]. The content of dissolved solids is related mainly to NaCl, profiles of changes for TDS and Na+ and Cl are identical in shape, initially rapid and later becoming less steep with time. The TDS of tested flowback is approx. 275 g/L and fits within typical range previously reported for flowback waters. The TDS in flowback from Marcellus Formation is approx. 120 g/L and 150–300 g/L for water from the Bakken formation [48]. The concentration of K+ is practically unchanged as KCl solution was a base used for fracturing fluids preparation. Calcium, strontium and magnesium are released as a result of chemical acidizing of carbonate minerals in rock matrix. At the beginning of fracturing a small amount of HCl solution was injected to facilitate the penetration of the fracturing fluid. The decreasing pH (from 7 to 4) is related to the recovery of unreacted acid. Silica (SiO2) concentration decreases from 77 mg/L to 46 mg/L which proves the cleaning the well from crushed and dissolved silicates. Sulfates content varies greatly without a specific trend, the well was shut off for few hours per day and during these periods some sulfate-reducing bacteria could be active. The flowback was yellow-brown in color and iron-oxide precipitate was evident in all samples. The concentration of Fe and Mn increases over time as a result of corrosion processes at low pH. Reducing conditions in the well promote additionally the release of these species from formation minerals. Burnside et al. [49] indicated that the mobility of iron and manganese depends on the oxidation-reduction potential (Eh). The observed brown precipitates results from the high Eh at which these elements are immobilised as Fe(III) or Mn(IV) oxyhydroxides. Gas-bearing shales are enriched in heavy elements like As, Ni, Co, Pb, Cd and Cr. In the flowback these elements were present in the amount of less than 1 ppm. The acidic conditions induce the mobility of heavier elements. Jeng [50] reports that at pH lowered to 1 the Norwegian Alum shale released up to 62% Zn, 41% Ni and 26% Pb. Low content of phosphates, which are a common pollution of groundwater due to over-fertilization, suggest that there was no contact between groundwater and flowback. Borate-based cross-linkers were compounds of the fracturing fluid hence the relatively high content of borates in the flowback. Boron needs to be removed from flowback before its possible reuse as “frac water” [51]. On the other hand Ozkan and Kaplan [52] observed that boron additives improve the rheological properties of the drilling mud and only slightly hinder its filtration properties.

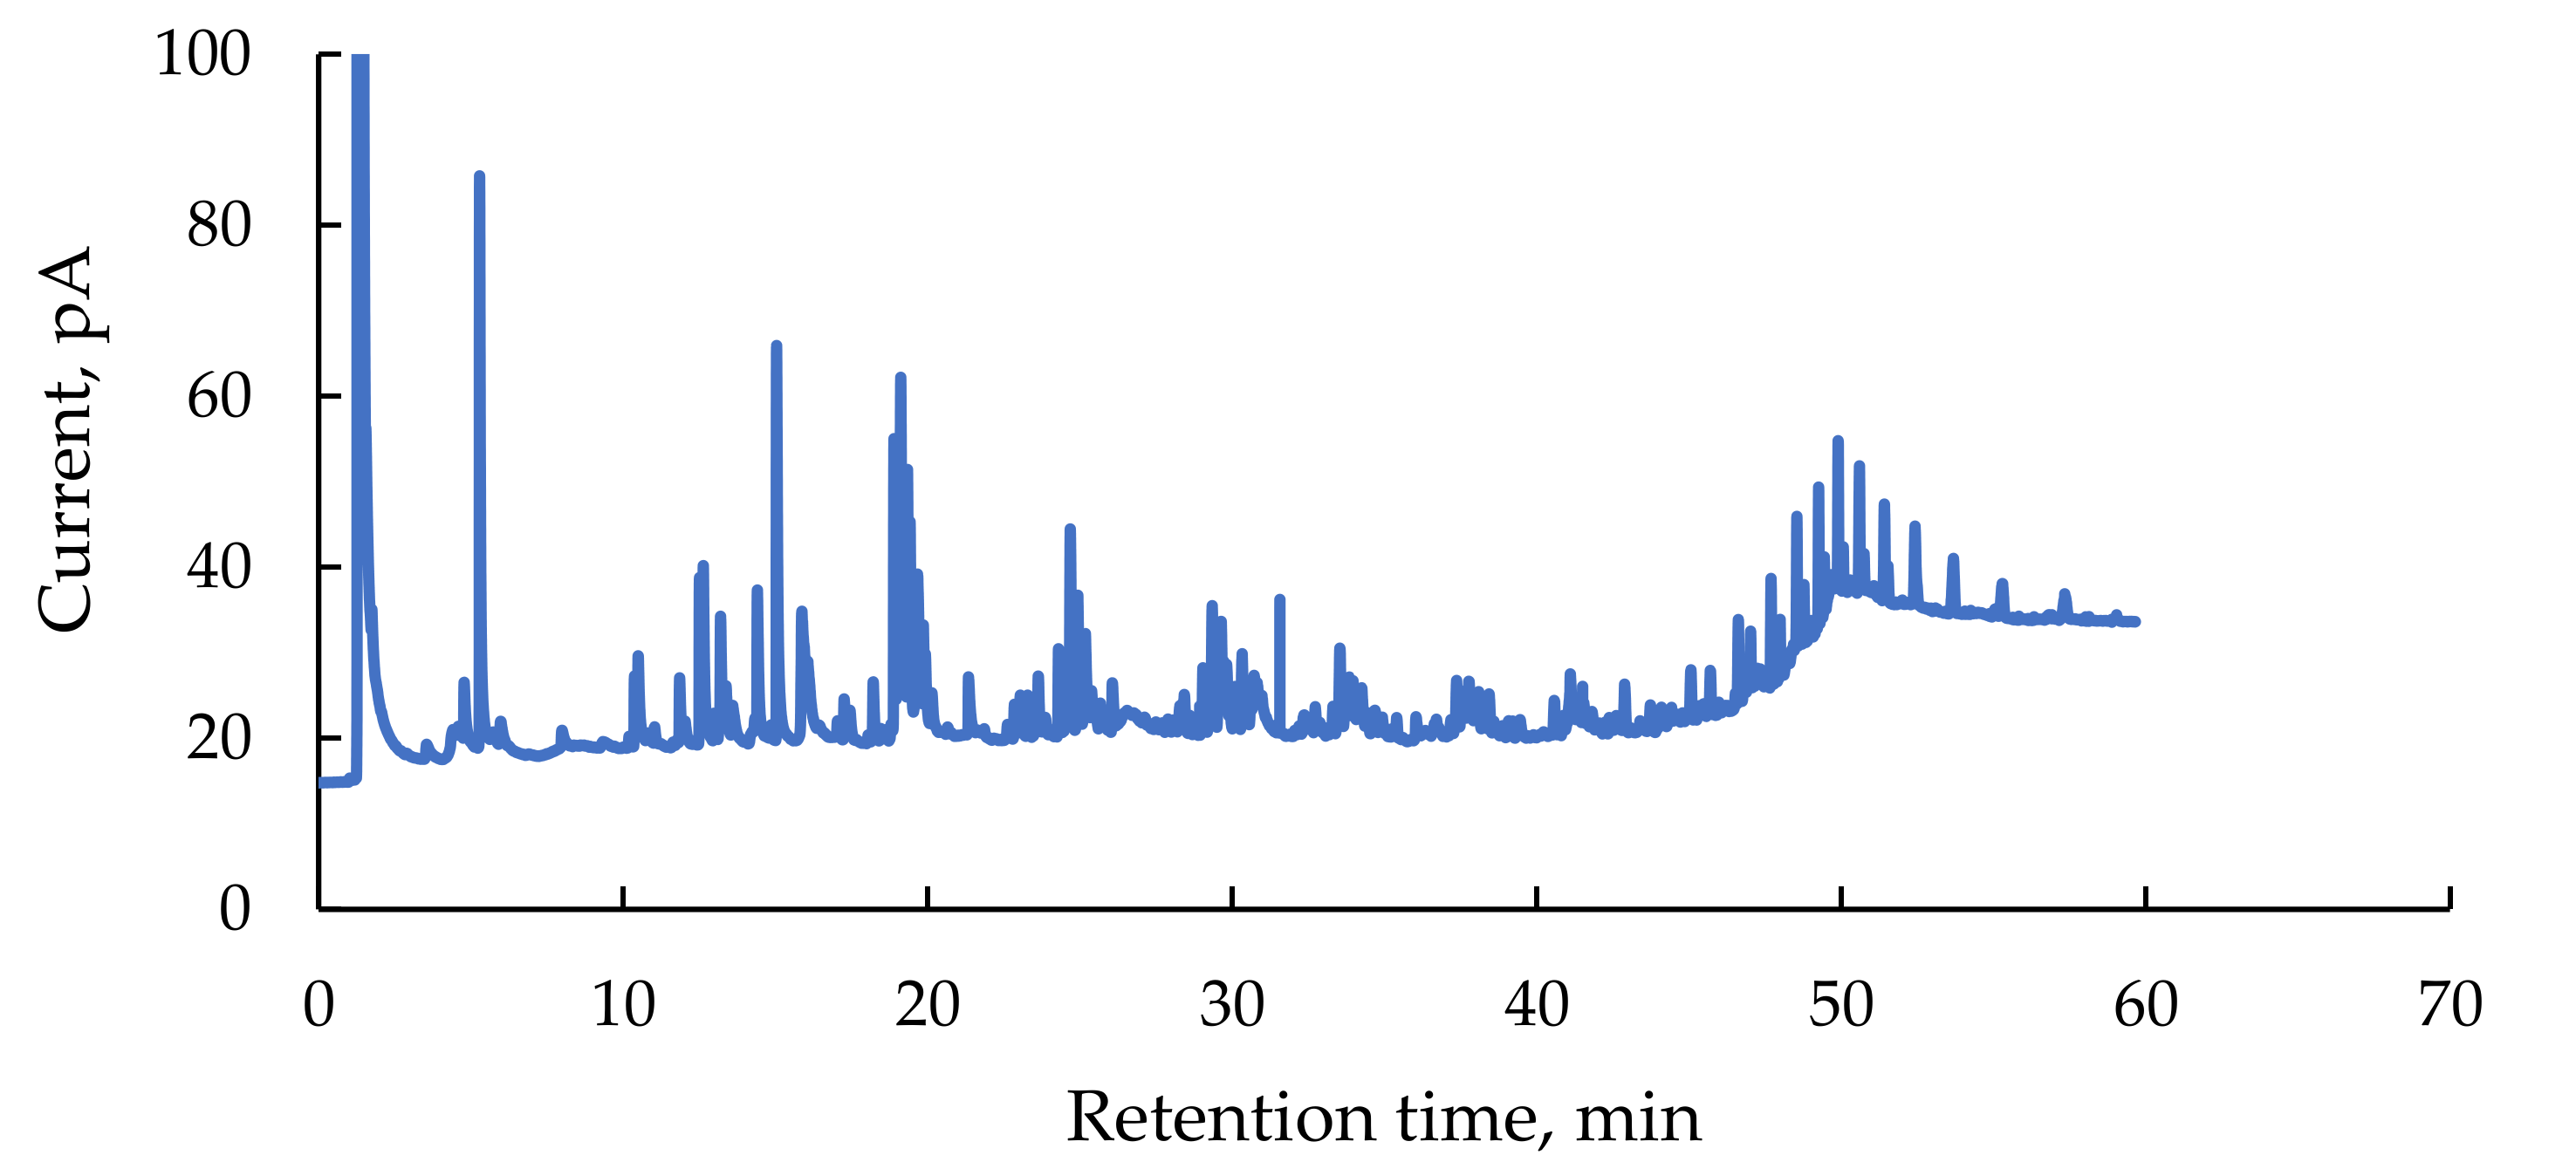
3.1.2. Organic Compounds in Flowback

The knowledge of organic composition of the flowback is important as organic compounds are partially responsible for well fouling after reinjection. Flowback contains fracking additives (biocides, surfactants, ethylene glycol and derivatives) and hydrocarbons originating from shales (aliphatic and aromatic hydrocarbons, heterocyclic and halogenated organics compounds). Several authors reported the presence of products resulted from chemical and microbiological degradation of fracturing fluids components [53,54]. In the obtained samples no oily layer was visible but after shaking a foam formed at the surface which suggest the presence of surfactants. Figure 2 shows a chromatogram of extractable organic compounds from flowback. The peaks are small and near to the baseline. Only 21 components have a positive library identification with a confidence level of 80% or higher. A semi-quantitative analysis was performed by comparing the individual peak area with the sum of areas of all identified compounds (see Table A3).
Concentration of the TOC in the studied flowback is 866 mg/L. For comparison, the TOC value in the flowback from the Marcellus shale is 720 mg/L [55] but it can reach up to 6000 mg/L. In flowback waters recovered from the Polish Łebień LE-2H well the TOC was in the range of 11–129 mg/L and from the Lubocino well–1680 mg/L [56]. The TOC value represents all organic compounds, but only low molecular weight organics remain in the flowback after thorough treatment. Components that are larger than 1 kDa, such as polyacrylamide and guar gum, are removed during coagulation-based processes. For this reason the low weight organic fraction extractable with DCM was studied in detail using gas chromatography coupled with mass spectroscopy. Among the identified ingredients are: n-alkanes, terpenoids or halogenated hydrocarbons. Similar compounds have been identified by other researchers [57,58,59]. A detailed discussion of individual compounds can be found in the Appendix (below the Table A3).

3.2. Coagulation and Filtration Process

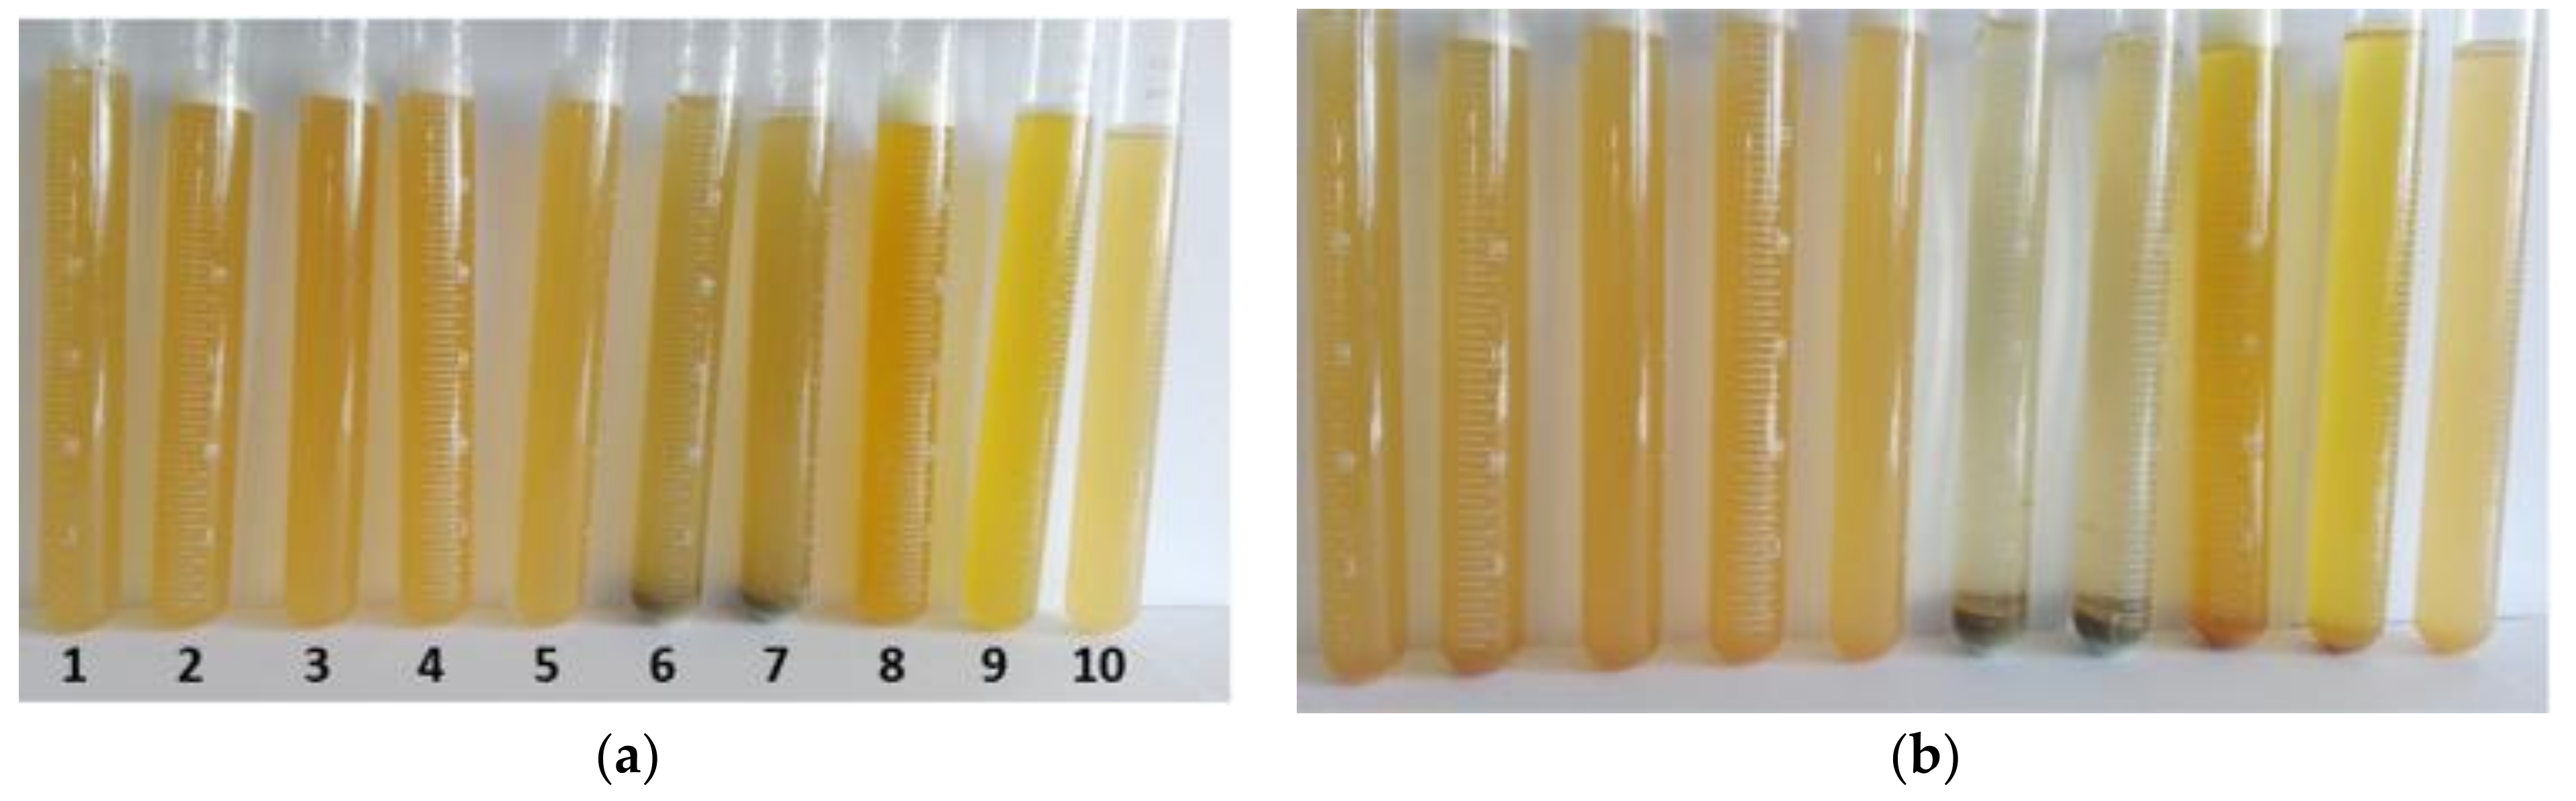
3.2.1. Selection of the Optimal Composition of Coagulant

Coagulation is an important technology for the removal of suspended solids from water and wastewater. There are so many factors influencing coagulation process that predicting the correct coagulant is very difficult, if not impossible. The most efficient way to do this is through the laboratory jar test [60,61].
The studied flowback water has a considerable turbidity of over 400 Formazin Turbidity Unit (FTU), which is promising for the coagulation process, which will result in obtaining water with much greater clarity. An effective coagulation process depends on many factors, and one of the basic factors is the application of an appropriate coagulant. Due to this fact, experiments were carried out to select the most appropriate coagulant for the investigated flowback water. Nine coagulants were tested and the result of the experiment is shown in Figure 3. PIX coagulants contain iron sulphates, chlorides and chlorosulphates and are especially recommended for removing phosphorus from sewage and for binding hydrogen sulphide, thanks to which they have anti-corrosive properties. Aluminum coagulants of PAX type (PAX18, PAXXL19F, PAXXL19H and PAXXL10) contain aluminum in the range from 5.0 to over 12.5%. Another group of aluminum coagulants is the SAX group, i.e., aqueous solutions of sodium aluminate with Al2O3 content from 18% to 28%. These coagulants are used in the treatment of municipal and industrial wastewater and are also used to correct the pH.
After measuring 0.15 mL of the appropriate coagulant, and then adding 30 mL of water very quickly, a slight turbidity of all solutions was observed. Immediate precipitation was observed in the samples with the SAX13 and SAX18 coagulant (Figure 3). The reference sample (first from the right) is a flowback water without any chemical additives. Throughout the experiment, this sample remained cloudy because the colloidal system responsible for the turbidity remained stable. Coagulants based on sodium aluminate, derived from the SAX group, proved to be the most effective.
After 30 min, there was already a significant decrease in the turbidity of the solution. Extending this time slightly affected the appearance of the other samples. After a very long inspection time of the process (20 h) in samples with SAX13 and SAX18 coagulants, the lowest turbidity was observed in the solutions above the precipitate.

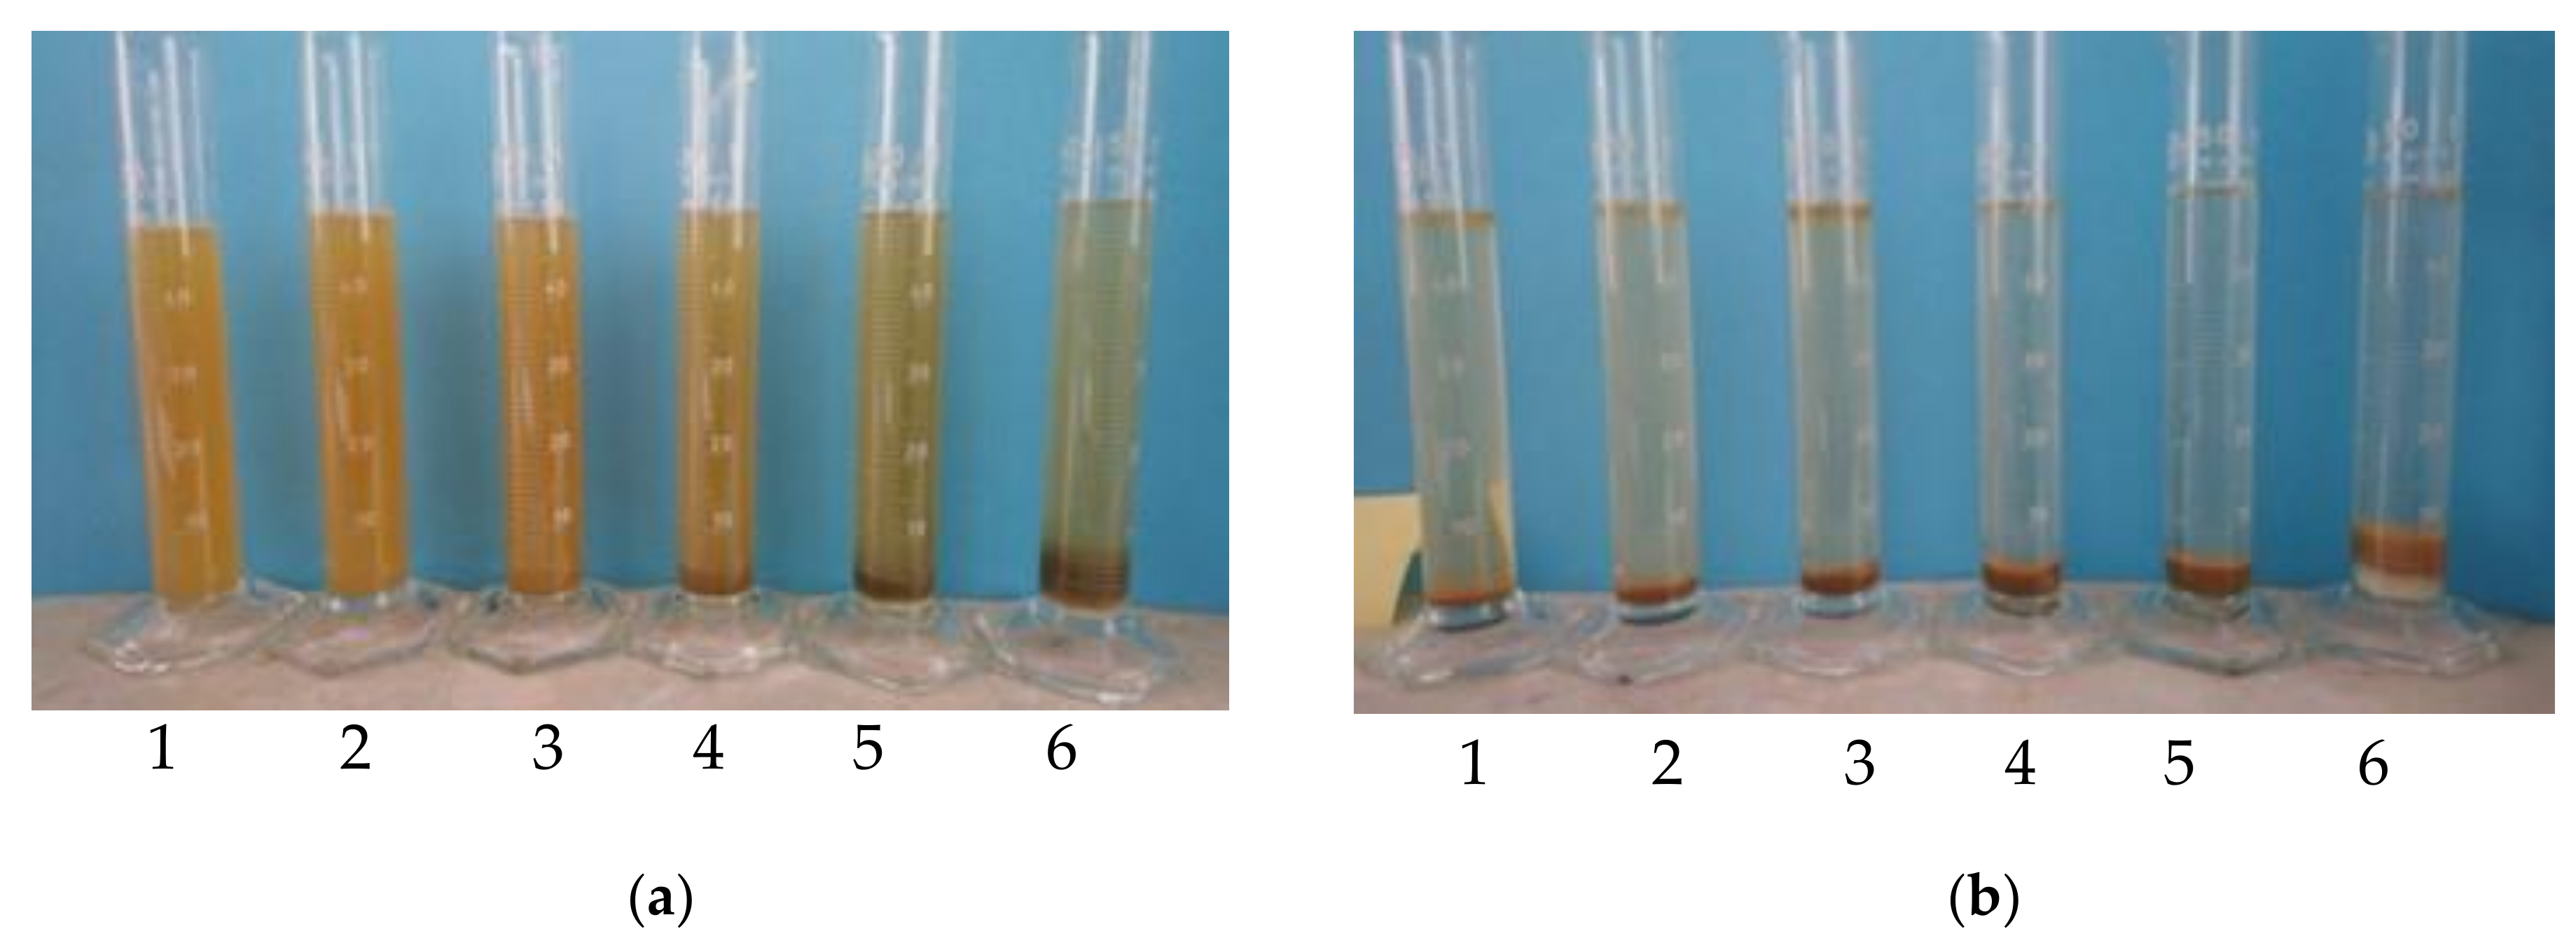
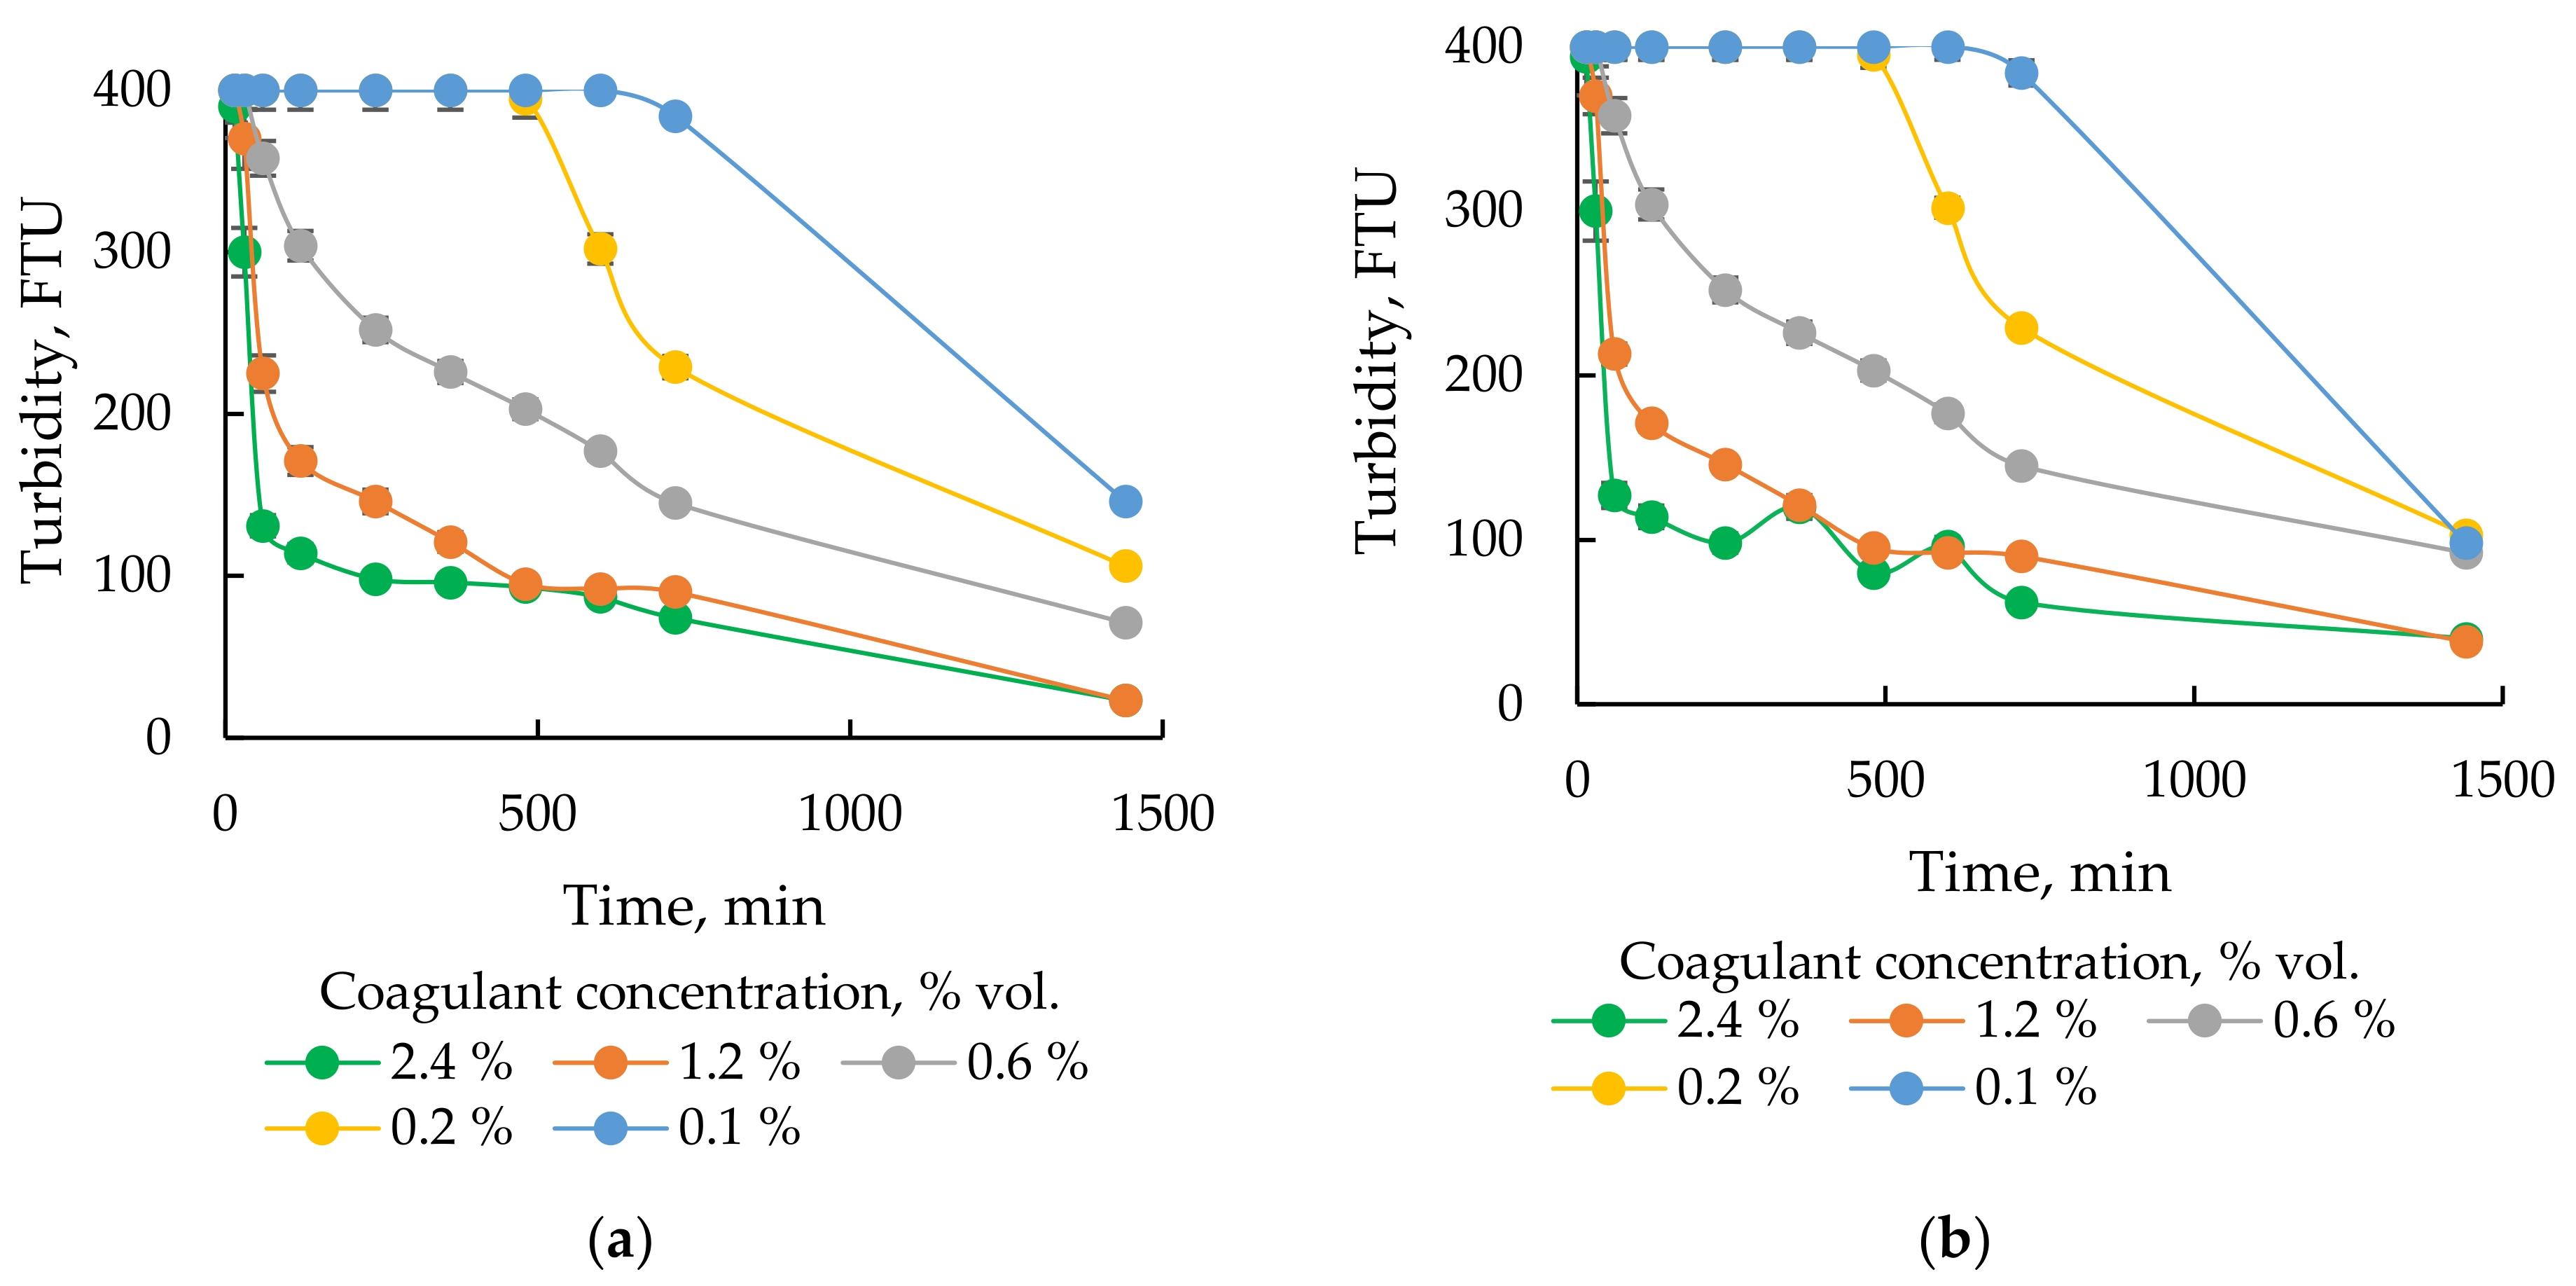
3.2.2. Selection of the Optimal Dose of Coagulant

The use of optimal doses of a specific coagulant, selected appropriately for specific flowback water, results in the removal of the maximum amount of colloidal particles and at the same time prevents the formation of big amounts of precipitate. Therefore, studies were carried out to select the optimal dose of coagulant for two coagulants, which in the initial selection gave the best coagulation effect, i.e., SAX13 and SAX18. The coagulation process was observed for each of the samples (Figure 4), which, depending on the dose of the coagulant, ran from 0 to 24 h (1440 min).
The effectiveness of the process was tested by monitoring the turbidity of the water above the precipitate and the volume of the precipitate. Figure 5 shows the change in turbidity versus the duration of the process for 6 different doses of the coagulant. As can be seen, the coagulation process for the two previously selected coagulants is very similar in time. However, the process involving the SAX18 coagulant is slightly more effective. The use of a higher dose of coagulants causes that the turbidity of the solution is much lower. The initial high turbidity of flowback water above 400 FTU is reduced to as much as 23 FTU (for SAX18) after 24 h of the process. The use of a dose of 1200 μL of coagulant per 50 mL of flowback water results in the formation of a large amount of undesirable precipitate. The use of smaller doses causes that the turbidity of the solution significantly decreases, and the amount of formed precipitate is smaller. With the dose of 600 μL of coagulant per 50 mL of flowback water, the amount of precipitate produced is approximately 2 times lower than with the dose of 1200 μL. Therefore it can be concluded that the flowback water coagulation process was optimal with the use of SAX18 coagulant with a coagulant concentration of 12 mL/L (1.2%vol) or 17.4 mg/L (density of SAX18 equals 1.45 g/L).
The optimal type of different coagulant agents were previously tested for oilfield produced waters. Dastgheib et al. [62] have verified coagulants like ferric chloride (FeCl3) and aluminum sulphate (Al2(SO4)3) by jar tests. Agarwal et al. [63] found poly aluminium chloride (PAC) to be suitable coagulant for flowback fluid. Hosny et al. [64] proved that chitosan from shrimp shells mixed with carboxy methyl cellulose as a coagulant allow to remove 99% of oil from oily produced water.
Sodium aluminate (SAX18 coagulant) is chemical of commercial importance due to the versatility of its technological applications. In water treatment systems NaAlO2 is used as an additive to water softening systems, as a coagulant for removing suspended solids, dissolved silica and also some metals like Cr, Ba, Cu [65]. Our research confirmed its effectiveness for flowback water. After 24 h of the process the turbidity is reduced from 400 to 23 FTU. A very likely reason for its effectiveness is that NaAlO2 (SAX13 and SAX18) allows coagulation/flocculation as well as pH correction to take place at the same time. Sodium aluminate can be used in low pH waters (investigated flowback water has pH in the range of 4–5) [61].

3.2.3. Filtration of Flowback Water after the Coagulation Process

The turbidity of the solution after the filtration process slightly decreased from 23 to 19 FTU. The progress of solids removal due to coagulation and filtration is well depicted in Figure 6 where dynamic light scattering (DLS) size distribution of suspended solids in raw and treated water is shown.
The untreated flowback contains numerous suspended solids with a wide range of particle size distribution. After the coagulation the size of suspended solids significantly decreases and after 24 h of sedimentation all aggregates larger than 30 nm are gravitationally settled. The in-situ hydrolysis of Al species facilitates the aggregation and separation of undissolved components. The applied microfiltration reduces the content of suspended matter, both organic and inorganic. The TOC decreases after filtration to 45 mg/L. The content of dissolved organic compounds (here considered as all DCM extractable compounds) in raw and filtered flowback remains practically unchanged and is approx 32 mg/L. The high initial value of TOC in the untreated flowback results from the presence of high molecular weight organics (mainly biopolymers and soluble microbial products). The size of suspended solids in the treated flowback is lower than 10 nm while Chen et al. [66] reports that particles smaller than 2 µm did not contribute to the near-wellbore zone permeability reduction during produced water reinjection. The treatment process did not lower significantly the concentration of TDS, the decrease is up to 2% wt. However, the concentration of scaling ions significantly decreases and so the concentration of SiO2 is reduced by 64%, Ba2+–66%, Fe2+–36%, Mn2+–65%, SO42—66%. The combined coagulation-filtration treatment allows to practically eliminate heavy metals from flowback reducing their content by 66% for Cd2+ up to 95% for As3+.

3.3. Flowback Reinjection for EOR

The presence of surfactant additives in flowback water encourages to its application for an enhanced oil recovery known as surfactant flooding. This reuse option saves costs through recovering and reusing chemicals. Sand packs flooding are summarized in Table 4.
Initial conditions in both sand packs were similar hence only composition of injected fluids affects the overall displacement efficiency. The quartz sand was pre-wetted with water and oil did not attach strongly to sand surface which explains the high primary oil recovery due to the gravitational force. Flooding with the treated flowback water allows for a slightly higher displacement efficiency than flooding with fresh water. Piston-like displacement is the main recovery mechanism. The highest oil recovery, up to 20% of original oil in place (OOiP), was obtained with first 200 mL of injected fluid. Profiles of displacement were similar in both cases. No emulsification was observed when surfactant-containing flowback contacted with oil which will facilitate the separation of liquids on the surface. The obtained recovery factors are similar to those reported by other researchers. Dai et al. [67] achieved up to 60% cumulative oil recovery when applied clear fracturing flowback fluid containing viscoelastic surfactants. This preliminary study confirms the suitability of treated flowback in EOR operations. Further experiments on core plugs are necessary to confirm these finding under reservoir conditions.

3.4. Filtration and Rheological Parameters of Flowback-Based Mud

As part of the project, research was carried out on the possibility of preparing drilling fluids based on brine. This brine (flowback) contains large amounts of potassium ions and polyvalent ions, especially calcium and magnesium. As most of the polymers currently used in drilling mud technology are not resistant to such high salt concentrations, the development of a salt-based mud is very difficult. Attempts to create a drilling fluid structure using cellulose polymers (CMC, PAC) have been unsuccessful. Slightly better results were obtained with the use of starch reagents (CMS), but still not satisfactory. The solution was to use a new polymer marked as a FGM.
In order to check the suitability of FGM as a structuring agent in the drilling mud, the rheological parameters of 1% FGM solutions in fresh water and in brine (flowback) were tested. The measurement results are presented in Table 5.
The results summarized in Table 5 shows that the FGM polymeric agent is resistant to salinity and enables the formation of a drilling fluid structure even in heavy brines containing high concentrations of calcium and magnesium ions. Therefore, it was decided to continue the research and develop a complete mud formula. Two solutions of FGM in brine (flowback), with concentrations of 1 and 2 wt.%, were prepared. For these solutions, marked as ‘+ FGM-1′ and ‘+ FGM-2′, respectively, rheological parameters were tested. On the basis of these solutions, two drilling fluids were prepared, differing in the concentration of FGM. Additionally, in the developed muds, a carbonate blocker was used to reduce filtration and as an agent improving the properties of the filter cake. Due to the very high concentration of chloride ions, flowback water is very corrosive. Therefore, an anti-corrosion agent was used in the mud recipe. Due to the high content of potassium ions, brine reduces the swelling of clayey rocks. Potassium ions are standardly used in drilling fluids as the most effective inorganic clay swelling inhibitor. Partially hydrolyzed polyacrylamide is used as a second polymeric clay hydration inhibitor. Unfortunately, in this case, its use is impossible. PHPA has -COO (carboxyl) groups and is not resistant to salts. Especially multivalent salts in high concentrations cause its degeneration and salting out. Therefore, a cationic oligomer designated Nano-Amine 016 was used as the second hydration inhibitor in the formulation of mud to be developed. The pH of the drilling muds was adjusted to pH = 9 with potassium carbonate. The polymeric agents used in the mud are fully biodegradable, but very high salinity and elevated pH practically prevent the growth of bacteria and biodegradation of the mud. Therefore, the use of biocides is not necessary. The developed mud recipes are presented in Table 3. Rheological parameters of FGM polymeric structural solutions and for the muds prepared on its basis are shown in Figure 7.
The conducted research has shown that drilling fluids prepared on the basis of brine (flowback) with the use of FGM as a structuring agent are characterized by good rheological parameters. It was found that the viscosities (plastic viscosity and apparent viscosity) of the FGM solutions are relatively low, while the strength parameters are relatively high. It is also advantageous that the low shear flow limit (LSYP) is relatively high. As a result, the mud can be used for horizontal drilling.
The increase in FGM concentration in the tested fluids causes the expected increase in rheological parameters. The increase in plastic viscosity is relatively small, while the increase in the yield point value (YP and LSYP) is relatively large. It is also observed that the remaining components of the mud only slightly increase the rheological parameters of the tested liquids. These phenomena are very beneficial because they allow to regulate the parameters of the mud by changing the concentration of only one component–FGM. Thanks to this, it is easy to select the parameters of the mud to the conditions in the hole during drilling.
The large amount of potassium and calcium ions from brine led to the assumption that the developed muds will effectively inhibit the hydration of clay rocks. Additionally, polymer inhibitors in the form of cationic oligomers (Nano-Amina 016) were used in the formulas of the developed muds. As a result, linear swelling (LST) tests were carried out on small rocks in the developed fluids. The test results for the untreated flowback brine and the Mud-1 are shown in Figure 8.
The conducted tests of the Miocene shale swelling under the influence of the tested liquids showed worse than the results recorded for the oil-dispersion muds (swelling at the level of 0.5–1.5%).
Additionally, the results of measurements of rheological parameters of the developed drilling fluids, carried out immediately after preparation and after 24 h, do not differ significantly. This means that the developed drilling fluids are stable over time. This is a very advantageous phenomenon, because the prepared mud immediately has the required parameters and can be used for drilling. The mud can also be prepared in advance and stored in reserve tanks without losing its properties and then used when needed.

4. Conclusions

(1)
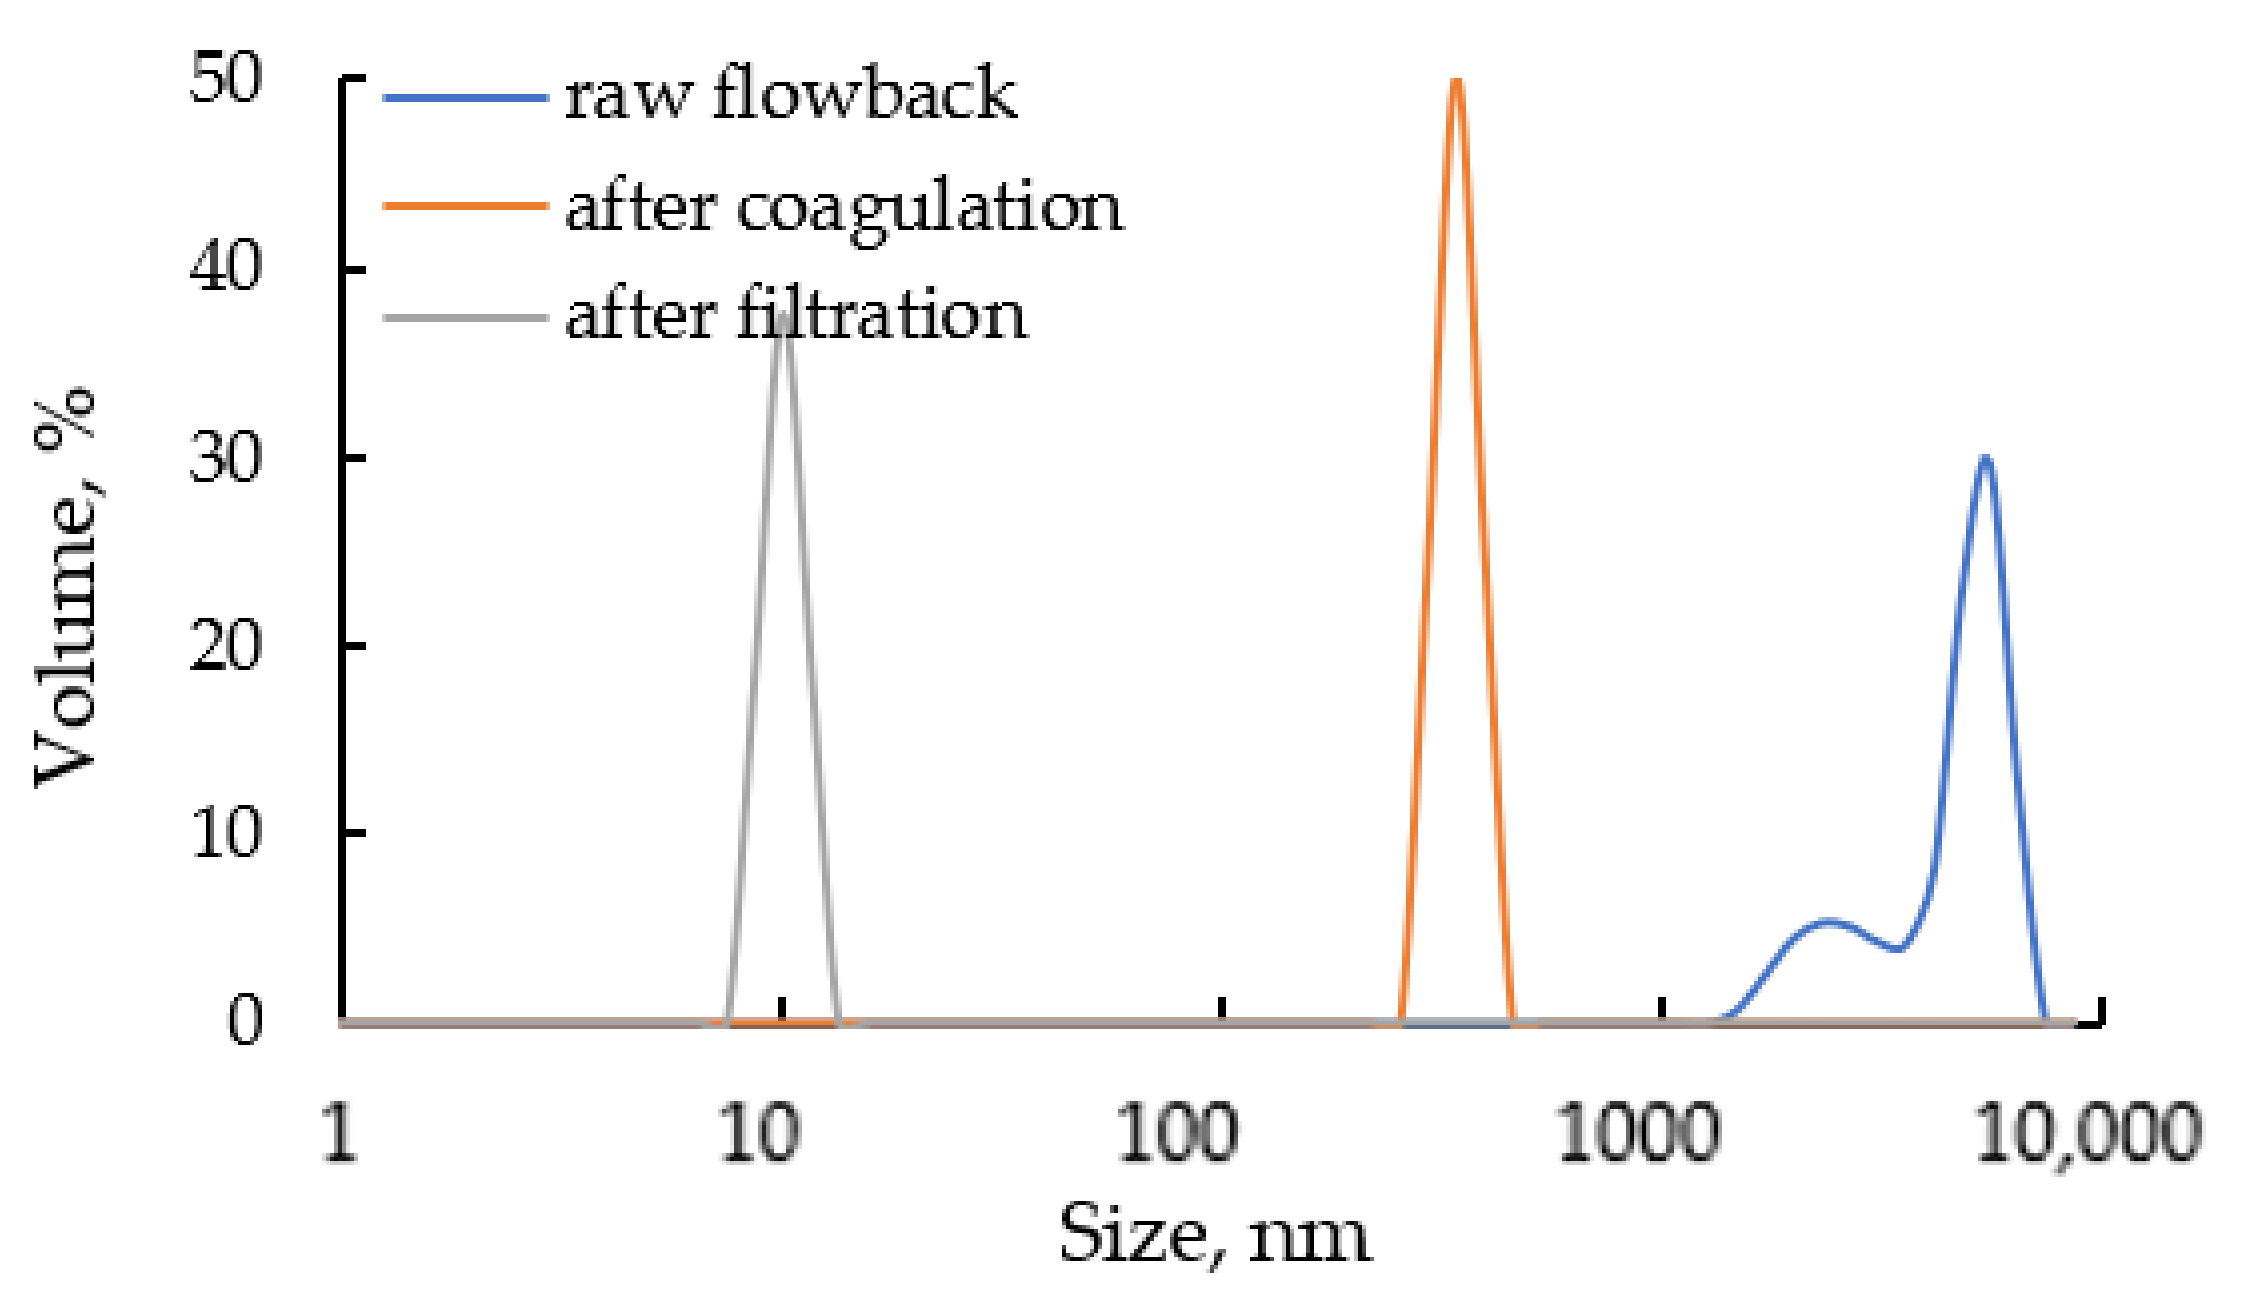
Coagulation and filtration are suitable treatment technologies for purification of recovered flowback water after completion of hydraulic fracturing before its further beneficial reuse. Due to the applied treatment the TOC in the flowback decreases by 95% and the concentration of scaling ions is reduced at least by half. The turbidity of raw flowback is over 400 FTU and after coagulation with SAX18 commercial coagulant based on NaAlO2 decreases to 23 FTU. The optimal concentration of SAX18 coagulant is 12 mL/L. The residual turbidity is possibly caused by dissolved silica (~22 mg/L) and the DLS measurement confirms the presence of suspended solids with particle size smaller than 10 nm.
(2)
The treated flowback water can be successfully reused for preparation of drilling muds and for tertiary oil recovery. The reuse system should be designed to meet the particular needs of a given reservoir or drilling operator. For reservoirs at the beginning stage of exploitation, when both new wells are drilled and the existing ones are fractured, the recovered flowback can be used to prepare drilling fluids. For mature fields, where only selected horizons are planned to be fractured, the flowback after fracturing completion may be reinjected into the formation to maintain the reservoir pressure. Treatment requirements are in these cases much lower than for its reuse in agriculture or its discharge to the environment.
(3)
Reinjection of reused flowback allows to improve the oil production process. The recovery of oil from sand packs was 7% higher for flooding with treated flowback than with fresh water. This suggests that surfactants present in the flowback water increase its sweep efficiency.
(4)
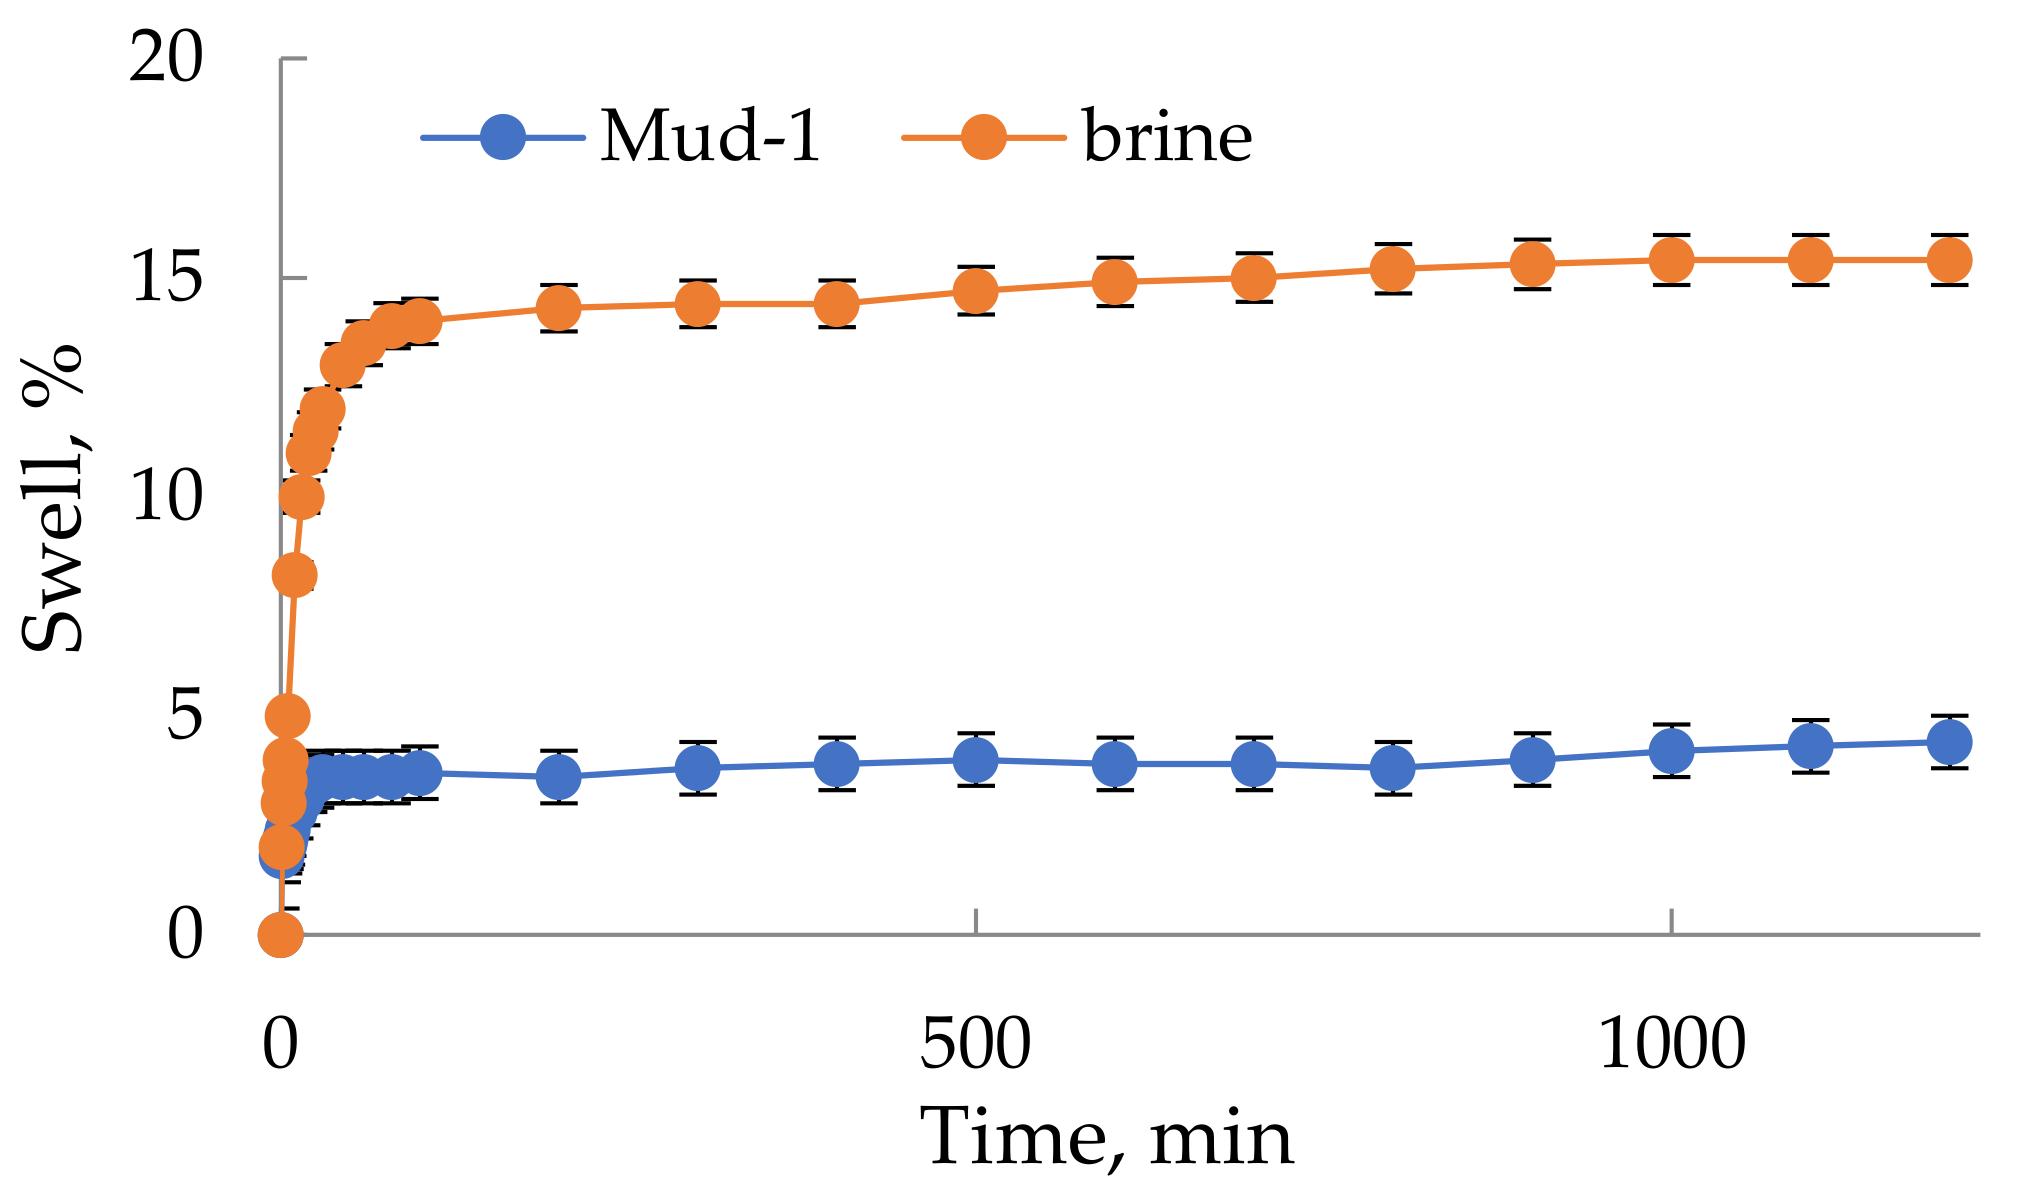
Drilling muds prepared using the untreated flowback exhibit sufficient filtration and rheological properties. Thus prepared drilling fluids can be applied both in vertical and horizontal wells and are especially recommended when drilling in clay rocks and salt domes. Main advantages of the proposed flowback reusing are smaller operational footprints and lowered water demands. Closed-loop water systems are crucial while moving towards a low-emissions oil industry.

Author Contributions

Conceptualization, Ł.Ł. and E.K.; methodology, E.K., S.W. and K.C.-L.; software, E.K.; validation, Ł.Ł. and E.K.; formal analysis, Ł.Ł.; investigation, E.K., K.C.-L. and S.W.; resources, Ł.Ł.; data curation, E.K. and K.C.-L.; writing—original draft preparation, E.K., K.C.-L. and S.W.; writing—review and editing, Ł.Ł., K.C.-L., E.K.; visualization, E.K., K.C.-L. and S.W.; supervision, Ł.Ł.; project administration, Ł.Ł.; funding acquisition, Ł.Ł. All authors have read and agreed to the published version of the manuscript.

Funding

The paper was performed within the frame of AGH-UST statutory research grant No.. 16.16.190.779 Faculty of Drilling, Oil and Gas, Department of Petroleum Engineering and Department of Drilling and Geoengineering.

Institutional Review Board Statement

Not applicable.

Informed Consent Statement

Not applicable.

Data Availability Statement

The data presented in this study are available on request from the corresponding author.

Conflicts of Interest

The authors declare no conflict of interest.

Appendix

Table A1. Characteristics of the tested coagulants.
Trade NamePhysicochemical ParametersChemical Composition
Aluminium coagulantsSAX13Colorless liquid,
pH approx. 12.5
Sodium aluminate (NaAlO2)
content: 27–30%
SAX18Colorless liquid,
pH approx. 12.5
Sodium aluminate (NaAlO2)
content: 18–28%
PAX18Light yellow liquid,
pH approx. 1.0
Polyaluminium chloride
(aluminum content: 9.0 ± 0.3%, chloride content: 21.0 ± 0.3%)
PAXXL19FSlightly cloudy, light gray liquid, pH approx. 4.0Polyaluminium chloride
(aluminum content: 8.5 ± 0.3%, chloride content: 5.5 ± 0.5%)
PAXXL19HSlightly cloudy, light gray liquid, pH approx. 3.5Polyaluminium chloride
(aluminum content: 12.5 ± 0.3%, chloride content: 8.5 ± 1.0%)
PAXXL10Colorless (to gray) liquid, pH approx. 2.0Polyaluminium chloride
(aluminum content: 5.0 ± 0.2%, chloride content: 11.5 ± 1.0%)
ALSColorless liquid, pH approx. 2.4Aluminum sulphate content: 25–28%
Iron coagulantsPIX113Dark brown liquid,
pH approx. 1
Iron (III) sulfate content: 50–35%,
Manganese (II) sulfate content: <0.25%
PIX116Brown liquid,
pH approx. 1
Iron (III) chloride content: 36–41%
Table A2. Selected parameters and composition of raw and treated flowback.
ParameterDateWater After Coagulation and Filtration Treatment
Unit1st Day 2019-12-103rd Day
2019-12-12
5th Day
2019-12-14
6th Day
2020-01-08
7th Day
2020-01-09
10th Day
2020-01-12
15th Day
2020-01-17
pH 6.915.815.194.485.214.824.085.00
Conductivity[mS/cm]65.1163.7183204216218219218
Density[kg/m3]1033.241103.821122.951158.371169.151181.551179.471179.89
Total dissolved solids[mg/L]42,964.2156,412.1173,956.8225,855.2237,974.7279,710.2268,463.8268,788.1
Mineralisation[mg/L]43,322.7156,467.1174,011.8225,855.2238,022.9279,751.2268,484.3268,800.3
General hardness[mg CaCO3/L]7607.751,788.361,505.783,992.692,443.1117,278.4100,693.9108,589
Non-carbonate hardness[mval/L]140.391033.961228.311679.181847.82344.222013.212171.79
H2SiO3[mg/L]100.3697.593.673.1976.0598.6760.1928.18
SiO2[mg/L]77.2757256.358.575.946.321.68
Na+[mg/L]597631,20137,35046,47550,66056,14053,22953,890
K+[mg/L]9135.005931.005028.003898.003527.004206.0030553182
Li+[mg/L]6.0942.7051.9771.7079.5486.8081.294.31
Ca2+[mg/L]262318,66721,77030,15632,71041,90236,17238,990
Mg2+[mg/L]258.21267.01747.02127.02632.03094.025382748
Ba2+[mg/L]2.9956.13016.92016.54041.551.20027.3813.16
Sr2+[mg/L]163.51134.01448.01926.02207.02692.023472346
Fe2+[mg/L]25.6111.7133.6154.9233.3196.7208.7128.33
Mn2+[mg/L]4.40728.19044.58053.89053.675.97069.425.28
Zn2+[mg/L]0.205.5714.547.6920.489.5410.1614.36
Cu2+[mg/L]0.1020.0100.3990.010<0.005<0.01<0.010.070
Ni2+[mg/L]0.0820.0320.0280.271<0.010.3050.0410.05
Co2+[mg/L]0.0190.0240.0670.028<0.010.1020.0310.01
Pb2+[mg/L]<0.0050.5380.8750.554<0.0050.2220.5460.10
Cd2+[mg/L]<0.0050.0400.0510.0080.073000.0090.0090.003
Al3+[mg/L]0.8570.010<0.01<0.01<0.01<0.010.6420.01
Cr3+[mg/L]<0.01<0.01<0.01<0.01<0.01<0.010.0130.01
V5+[mg/L]0.1800.3091.1000.3341.3853.2500.3710.20
Ti4+[mg/L]<0.01<0.01<0.01<0.01<0.01<0.01<0.010.29
As3+[mg/L]<0.05<0.05<0.050.210<0.05<0.050.360.02
Cl[mg/L]22,600.089,120.0105,510.0135,235.0145,290.0170,546.0164,885166,766
SO42−[mg/L]1291.002301.00393.002054.00225.80413.002087424.35
HCO32−[mg/L]717.0110.0110.041.096.582.04124.4
CO32−[mg/L]<0.5<0.5<0.5<0.5<0.5<0.5<0.5<0.5
PO43−[mg/L]<0.05<0.05<0.05<0.05<0.05<0.05<0.05<0.05
BO33−[mg/L]560.32303.01399.30178.98225.60205.09147.97167.95
HBO2[mg/L]417.44225.74297.48133.34168.07152.79110.24125.12
* Relative repeatability standard deviations for all elements detected with ICP-OES were very low, generally less than 4%.
Table A3. Individual organic compounds detected in flowback water.
Identified NameRetention Time, MinRelative Amount, %Quality of Fit, %
Octadecanoic acid 2,3-dihydroxypropyl ester35.8814.998
(+)−2-Bornanone18.793.297
endo-Borneol19.418.797
2,6,10,15-Tetramethylheptadecane 32.501.193
Nonadecane34.211.993
2-Hydroxy-3-methyl-2-cyclopenten-1-one 15.243.291
(1S)-1,3,3-trimethylnorbornan-2-ol20.115.291
Decahydro-1,5,5,8a-tetramethyl-[1R-(1α.,3aβ,4α,8aβ)]-1,4-methanoazulen-9-one 32.701.191
Eicosane34.241.191
4-(1-Hydroxy-1-methylethyl)-1-methylcyclohexanol23.2812.490
4,8,12,16-Tetraoxaeicosan-1-ol30.564.890
2-Hydroxy-3-ethyl-2-cyclopenten-1-one18.052.787
1-Methyl-4-(1-methylethyl)-3-cyclohexen-1-ol18.443.287
Tetradecane25.431.887
1-Iodoeicosane, 31.802.787
Furyl hydroxymethyl ketone16.9110.986
N-Butylbenzenesulfonamide, 30.488.581
Cyclopentanone7.801.880
2-Methyl-2-cyclopenten-1-one 11.331.980
1-(2-Furanyl)ethanone, 11.506.580
β-Acetylacrylic acid12.042.580
* The GC-MS is analytical technique with a high repeatability and the standard deviations for results obtained with this technique were lower than 3.1%.
Identified paraffinic hydrocarbons including nonadecane, eicosane and tetradecane are presumably natural hydrocarbons released from shales. In the available formulation of the fracturing fluid no friction reducers are reported but it is a common practice to use petroleum distillates to reduce the friction in the wellbore. Compounds like 2-bornanone, borneol and longiborneol are the terpene derivatives extracted from the waste peel of citrus fruits and used in the fracturing fluid as surfactants. Glyceryl monostearate is a non-ionic emulsifier and emulsion stabilizer. It could be a component of commercial surfactant mixture. Both linear and cyclic alkyl ethoxylates are present in the flowback. These compounds are common fracturing fluid additives and were previously reported in fracturing flowback water by Thurman et al. [57]. 1-iodoeicosane is a halogenated organic compound which is not originally added to the fracturing fluid. Luek et al. [58] explain the presence of halogen species in flowback as a result of biotic and abiotic reactions between additives and/or shale compounds. Murali-Mohan et al. [59] identified bacteria known to oxidize iodide in hydraulic fracturing wastewaters from Marcellus shale region. The resulted reactive iodine can subsequently react with dissolved organic matter.

References

  1. Silva, T.L.S.; Morales-Torres, S.; Castro-Silva, S.; Figueiredo, J.L.; Silva, A.M.T. An overview on exploration and environmental impact of unconventional gas sources and treatment options for produced water. J. Environ. Manag. 2017, 200, 511–529. [Google Scholar] [CrossRef]
  2. Hannibal, B.; Portney, K. The impact of water scarcity on support for hydraulic fracturing regulation: A water-energy nexus study. Energy Policy 2020, 146, 111718. [Google Scholar] [CrossRef]
  3. Suboyin, A.; Rahman, M.M.; Haroun, M. Hydraulic fracturing design considerations, water management challenges and insights for Middle Eastern shale gas reservoirs. Energy Rep. 2020, 6, 745–760. [Google Scholar] [CrossRef]
  4. Candia, E.; Seth, K. Water management. Water recycling enhances well economics. The American Oil&Gas Reporter. Available online: https://www.aogr.com/web-exclusives/exclusive-story/water-recycling-enhances-well-economics (accessed on 30 August 2021).
  5. Liden, T.; Santos, I.C.; Hildenbrand, Z.L.; Schug, K.A. Treatment modalities for the reuse of produced waste from oil and gas development. Sci. Total Environ. 2018, 643, 107–118. [Google Scholar] [CrossRef]
  6. Mantell, M. Produced water reuse and recycling challenges and opportunities across major shale plays. In Proceedings of the EPA Technical Workshops for the Hydraulic Fracturing Study: Water Resources Management, Arlington, VA, USA, 29–30 March 2011. [Google Scholar]
  7. Xiong, B.; Roman-White, S.; Piechowicz, B.; Miller, Z.; Farina, B.; Tasker, T.; Burgos, W.; Zydney, A.L.; Kumar, M. Polyacrylamide in hydraulic fracturing fluid causes severe membrane fouling during flowback water treatment. J. Membr. Sci. 2018, 560, 125–131. [Google Scholar] [CrossRef]
  8. Sitterley, K.A.; Rosenblum, J.; Ruyle, B.; Keliher, R.; Linden, K.G. Factors impacting electrocoagulation treatment of hydraulic fracturing fluids and removal of common fluid additives and scaling ions. J. Environ. Chem. Eng. 2020, 8, 103728. [Google Scholar] [CrossRef]
  9. Haghshenas, A.; Nasr-El-Din, H.A. Effect of dissolved solids on reuse of produced water at high temperature in hydraulic fracturing jobs. J. Nat. Gas Sci. Eng. 2014, 21, 316–325. [Google Scholar] [CrossRef]
  10. Nasim, E.; Clay, T.; Herron, K.; Adam, P.; Kenneth, C. Recycling fracturing flowback water for use in hydraulic fracturing: Influence of organic matter on stability of carboxyl-methyl-cellulose-based fracturing fluids. SPE J. 2016, 21, 1358–1369. [Google Scholar]
  11. Stewart, D. Beneficial reuse of produced and flowback water. In Proceedings of the US EPA Technical Workshop on Analytical Chemical Methods for Hydraulic Fracturing, Research Triangle Park, NC, USA, 25 February 2013. [Google Scholar]
  12. Li, R.; Yang, J.; Pan, J.; Zhang, L.; Qin, W. Effect of immobilization on growth and organics removal of chlorella in fracturing flowback fluids treatment. J. Environ. Manag. 2018, 226, 163–168. [Google Scholar] [CrossRef] [PubMed]
  13. Wang, Y.-K.; Kong, F.-X.; Yang, D.-M.; Liu, Q.; Lin, X.-F.; Chen, J.-F.; Zhang, Y. The synergistic effect of electrocoagulation coupled with E-peroxone process for shale gas fracturing flowback water treatment. Chemosphere 2020, 262, 127968. [Google Scholar] [CrossRef]
  14. Chang, H.; Li, T.; Liu, B.; Vidic, R.D.; Elimelech, M.; Crittenden, J.C. Potential and implemented membrane-based technologies for the treatment and reuse of flowback and produced water from shale gas and oil plays: A review. Desalination 2019, 455, 34–57. [Google Scholar] [CrossRef]
  15. Siyal, M.I.; Lee, C.K.; Park, C.; Khan, A.A.; Kim, J.O. A review of membrane development in membrane distillation for emulsified industrial or shale gas wastewater treatments with feed containing hybrid impurities. J. Environ. Manag. 2019, 243, 45–66. [Google Scholar] [CrossRef]
  16. Tavakkoli, S.; Lokare, O.R.; Vidic, R.D.; Khanna, V. A techno-economic assessment of membrane distillation for treatment of Marcellus shale produced water. Desalination 2017, 416, 24–34. [Google Scholar] [CrossRef]
  17. Kar, A.; Bahadur, V. Using excess natural gas for reverse osmosis-based flowback water treatment in US shale fields. Energy 2020, 196, 117145. [Google Scholar] [CrossRef]
  18. Kong, F.-X.; Sun, G.-D.; Chen, J.-F.; Han, J.-D.; Guo, C.-M.; Zhang, T.; Lin, X.-F.; Xie, Y.F. Desalination and fouling of NF/low pressure RO membrane for shale gas fracturing flowback water treatment. Sep. Purif. Technol. 2018, 195, 216–223. [Google Scholar] [CrossRef]
  19. Hickenbottom, K.L.; Hancock, N.T.; Hutchings, N.R.; Appleton, E.W.; Beaudry, E.G.; Xu, P.; Cath, T.Y. Forward osmosis treatment of drilling mud and fracturing wastewater from oil and gas operations. Desalination 2013, 312, 60–66. [Google Scholar] [CrossRef]
  20. Boschee, P. Produced and flowback water recycling and reuse: Economics, limitations, and technology. Oil Gas Facil. 2014, 3, 16–21. [Google Scholar] [CrossRef]
  21. Analysis of Hydraulic Fracturing Fluid Data from the FracFocus Chemical Disclosure Registry 1.0; U.S. Environmental Protection Agency, Office of Research and Development: Washington, DC, USA, 2015; EPA/601/R-14/003.
  22. Fink, J.K. Drilling Muds. In Petroleum Engineer’s Guide to Oil Feld Chemicals and Fuids; Gulf Professional Publishing: Boston, MA, USA, 2012; Volume 1, p. 59. [Google Scholar] [CrossRef]
  23. Xiao, H.; Liu, S.; Chen, Y.; Han, D.; Wang, D. Impacts of polypropylene glycol (PPG) additive and pH on tribological properties of water-based drilling mud for steel-steel contact. Tribol. Int. 2017, 110, 318–325. [Google Scholar] [CrossRef]
  24. Oetjen, K.; Giddings, C.G.; McLaughlin, M.; Nell, M.; Blotevogel, J.; Helbling, D.E.; Mueller, D.; Higgins, C.P. Emerging analytical methods for the characterization and quantification of organic contaminants in flowback and produced water. Trends Environ. Anal. Chem. 2017, 15, 12–23. [Google Scholar] [CrossRef]
  25. Swartwout, R.; Pearcy, R. Design and application of brine-based drilling fluids. In Proceedings of the International Petroleum Conference and Exhibition of Mexico, Villahermosa, Mexico, 5–7 March 1996. [Google Scholar]
  26. Zhou, H.; Deville, J.P.; Davis, C.L. Novel thermally stable high-density brine-based drill-in fluids for HP/HT applications. In Proceedings of the SPE Middle East Oil and Gas Show and Conference, Manama, Bahrain, 8–11 March 2015. [Google Scholar] [CrossRef]
  27. Huang, L.; Yu, M.; Miska, S.; Takach, N.; Green, A.; Bloys, B. Determination of safe salinity window in drilling shale formation. In Proceedings of the 46th US Rock Mechanics/Geomechanics Symposium, Chicago, IL, USA, 24–27 June 2012. [Google Scholar]
  28. Ezzat, A.M.; Gamal, M.; D’Angelo, S. High density brine-based drill-in fluid improved reservoir producibility in gas field offshore Egypt. In Proceedings of the SPE North Africa Technical Conference and Exhibition, Marrakech, Morocco, 12–14 March 2008. [Google Scholar] [CrossRef]
  29. Ribeiro, L.S.; Dantas, T.N.C.; Dantas-Neto, A.A.; Melo, K.C.; Moura, M.C.P.A.; Aum, P.T.P. The use of produced water in water-based drilling fluids: Influence of calcium and magnesium concentrations. Braz. J. Pet. Gas 2016, 10, 233–245. [Google Scholar] [CrossRef] [Green Version]
  30. Peacock, P. Beneficial use of produced water in the Indian Basin field: Eddy County, NM. In Proceedings of the Ground Water Protection Council Produced Water Conference, Colorado Springs, CO, USA, 16–17 October 2002. [Google Scholar]
  31. Michaelsen, J.; Bergu, B.; Marrelli, J.; Theobald, M. Subsea water injection-water quality management. In Proceedings of the Offshore Technology Conference, Houston, TX, USA, 2–5 May 2005. [Google Scholar] [CrossRef]
  32. Bader, M.S.H. Seawater versus produced water in oil-fields water injection operations. Desalination 2007, 208, 159–168. [Google Scholar] [CrossRef]
  33. He, M.; Lai, X.; Li, N.; Xiao, Y.; Shen, L.; Liu, X.; Ma, Z.; Wang, Y. Recovery and treatment of fracturing flowback fluids in the Sulige Gasfield, Ordos Basin. Nat. Gas Ind. B 2015, 2, 467–472. [Google Scholar] [CrossRef] [Green Version]
  34. Burnstad, R.G.; Martin, A.N.; Stemberger, D.J.; Purwanto, B. A case study of a mature field redevelopment using propped hydraulic fracturing. In Proceedings of the SPE Asia Pacific Oil and Gas Conference and Exhibition, Perth, Australia, 18–20 October 2004. [Google Scholar]
  35. Salah, M.; El-Sebaee, M.; Batmaz, T. Best practices and lessons learned from more than 1,000 treatments: Revival of mature fields by hydraulic fracturing in Khalda Ridge, Egypt’s Western Desert. In Proceedings of the SPE Annual Technical Conference and Exhibition, Dubai, United Arab Emirates, 26–28 September 2016. [Google Scholar] [CrossRef]
  36. Dai, C.; Wang, K.; Liu, Y.; Li, H.; Wei, Z.; Zhao, M. Reutilization of fracturing flowback fluids in surfactant flooding for enhanced oil recovery. Energy Fuels 2015, 29, 2304–2311. [Google Scholar] [CrossRef]
  37. Samanta, A.; Ojha, K.; Mandal, A. Enhanced recovery of oil by eco-friendly natural surfactant and polymer. In Proceedings of the Recent Trends in Engineering & Education, NITTTR, Kolkata, India, 28–29 January 2010. [Google Scholar]
  38. Mohd, T.A.T.; Taib, N.M.; Adzmi, A.F.; Nik Ab Lah, N.K.I.; Sauki, A.; Jaafar, M.Z. Evaluation of polymer properties for potential selection in enhanced oil recovery. Chem. Eng. Trans. 2018, 65, 343–348. [Google Scholar] [CrossRef]
  39. Puleo, V.; Sambito, M.; Freni, G. An environmental analysis of the effect of energy saving, production and recovery measures on water supply systems under scarcity conditions. Energies 2015, 8, 5937–5951. [Google Scholar] [CrossRef]
  40. Piazza, S.; Sambito, M.; Feo, R.; Freni, G.; Puleo, V. Optimal positioning of water quality sensors in water distribution networks: Comparison of numerical and experimental results. In Proceedings of the CCWI 2017–Computing and Control for the Water Industry, Sheffield, UK, 5–7 September 2017. [Google Scholar]
  41. Shubair, T.; Eljamal, O.; Khalil, A.; Matsunaga, N. Nitrate removal in porous media using nanoscale zero valent iron: Column experiment. In Proceedings of the International Exchange and Innovation Conference on Engineering & Sciences (IEICES), Fukuoka, Japan, 19–20 October 2017. [Google Scholar] [CrossRef]
  42. Eljamal, O.; Eljamal, R.; Maamoun, I.; Khalil, A.; Shubair, T.; Falyouna, O.; Sugihara, Y. Efficient treatment of ammonia-nitrogen contaminated waters by nano zero-valent iron/zeolite composite. Chemosphere 2021, 287, 131990. [Google Scholar] [CrossRef]
  43. Recommended Practice for Field Testing Water-Based Drilling Fluids; API Publishing Services: Washington, DC, USA, 2017.
  44. Welch, S.A.; Sheets, J.M.; Daly, R.A.; Hanson, A.; Sharma, S.; Darrah, T.; Olesik, J.; Lutton, A.; Mouser, P.J.; Wrighton, K.C.; et al. Comparative geochemistry of flowback chemistry from the Utica/Point Pleasant and Marcellus formations. Chem. Geol. 2021, 564, 120041. [Google Scholar] [CrossRef]
  45. Wang, H.; Lu, L.; Chen, X.; Bian, Y.; Ren, Z.J. Geochemical and microbial characterizations of flowback and produced water in three shale oil and gas plays in the central and western United States. Water Res. 2019, 164, 114942. [Google Scholar] [CrossRef]
  46. Haluszczak, L.O.; Rose, A.W.; Kump, L.R. Geochemical evaluation of flowback brine from Marcellus gas wells in Pennsylvania, USA. Appl. Geochem. 2013, 28, 55–61. [Google Scholar] [CrossRef]
  47. Fu, Y.; Jiang, Y.; Hu, Q.; Luo, T.; Li, Y.; Zhian, L.; Wang, Z.; Yin, X. Fracturing flowback fluids from shale gas wells in western chongqing: Geochemical analyses and relevance for exploration & development. J. Nat. Gas Sci. Eng. 2021, 88, 103821. [Google Scholar] [CrossRef]
  48. Lester, Y.; Ferrer, I.; Thurman, E.M.; Sitterley, K.A.; Korak, J.; Aiken, G.; Linden, K.G. Characterization of hydraulic fracturing flowback water in Colorado: Implications for water treatment. Sci. Total Environ. 2015, 512–513, 637–644. [Google Scholar] [CrossRef]
  49. Burnside, N.M.; Westaway, R.; Banks, D.; Zimmermann, G.; Hofmann, H.; Boyce, A.J. Rapid water-rock interactions evidenced by hydrochemical evolution of flowback fluid during hydraulic stimulation of a deep geothermal borehole in granodiorite: Pohang, Korea. Appl. Geochem. 2019, 111, 104445. [Google Scholar] [CrossRef]
  50. Jeng, A.S. Weathering of some Norwegian Alum Shales, II. Laboratory simulations to study the influence of aging, acidification and liming on heavy metal release. Acta Agric. Scand. B-Plant Soil Sci. 1992, 2, 76–87. [Google Scholar] [CrossRef]
  51. Chorghe, D.; Sari, M.A.; Chellam, S. Boron removal from hydraulic fracturing wastewater by aluminum and iron coagulation: Mechanisms and limitations. Water Res. 2017, 126, 481–487. [Google Scholar] [CrossRef]
  52. Ozkan, A.; Kaplan, B.M. Investigation of the effects on rheological and filtration properties of water-based drillingmud of boron minerals: An experimental study. Pamukkale Üniversitesi Mühendislik Bilimleri Dergisi 2019, 25, 884–888. [Google Scholar] [CrossRef] [Green Version]
  53. Sun, C.; Zhang, Y.; Alessi, D.S.; Martin, J.W. Nontarget profiling of organic compounds in a temporal series of hydraulic fracturing flowback and produced waters. Environ. Int. 2019, 131, 104944. [Google Scholar] [CrossRef] [PubMed]
  54. Kahrilas, G.A.; Blotevogel, J.; Corrin, E.R.; Borch, T. Downhole transformation of the hydraulic fracturing fluid biocide glutaraldehyde: Implications for flowback and produced water quality. Environ. Sci. Technol. 2016, 50, 11414–11423. [Google Scholar] [CrossRef] [Green Version]
  55. Jiang, Q.; Rentschler, J.; Perrone, R.; Liu, K. Application of ceramic membrane and ion-exchange for the treatment of the flowback water from Marcellus shale gas production. J. Membr. Sci. 2013, 431, 55–61. [Google Scholar] [CrossRef]
  56. Michel, M.; Rzeczek, L. Pre-treatment of flowback water to desalination. In Membranes and Membrane Processes in Environmental Protection. Monographs of the Environmental Engineering Committee; Polish Academy of Sciences: Warsaw, Poland, 2014; pp. 309–321. [Google Scholar]
  57. Thurman, E.M.; Ferrer, I.; Blotevogel, J.; Borch, T. Analysis of hydraulic fracturing flowback and produced waters using accurate mass: Identification of ethoxylated surfactants. Anal. Chem. 2014, 86, 9653–9661. [Google Scholar] [CrossRef]
  58. Luek, J.L.; Harir, M.; Schmitt-Kopplin, P.; Mouser, P.J.; Gonsior, M. Temporal dynamics of halogenated organic compounds in Marcellus Shale flowback. Water Res. 2018, 136, 200–206. [Google Scholar] [CrossRef]
  59. Murali-Mohan, A.; Hartsock, A.; Bibby, K.J.; Hammack, R.W.; Vidic, R.D.; Gregory, K.B. Microbial community changes in hydraulic fracturing fluids and produced water from shale gas extraction. Environ. Sci. Technol. 2013, 47, 13141–13150. [Google Scholar] [CrossRef] [PubMed]
  60. Pontius, F.W. Water Quality and Treatment, 4th ed.; McGraw-Hill Inc: New York, NY, USA, 1990. [Google Scholar]
  61. Leopold, P.; Freese, S. A Simple Guide to the Chemistry, Selection and Use of Chemicals for Water and Wastewater Treatment; WRC-Water Research Commission: Pretoria, South Africa, 2009; pp. 45–47. [Google Scholar]
  62. Dastgheib, S.A.; Knutson, C.; Yang, Y.; Salih, H.H. International Journal of Greenhouse Gas Control Treatment of produced water from an oilfield and selected coal mines in the Illinois Basin. Int. J. Greenh. Gas Control 2016, 54, 513–523. [Google Scholar] [CrossRef] [Green Version]
  63. Agarwal, P.; Gupta, A.; Dasgupta, S.; Thummar, D.; Satyarthi, R.S.; Joshi, M.; Chauhan, S.S.; Mishra, J.; Parasher, A.; Tiwari, S.; et al. Waste water treatment by chemical coagulation method-increasing output and reducing environmental impact. In Proceedings of the SPE International Conference and Exhibition on Health, Safety, Security, Environment, and Social Responsibility, Abu Dhabi, United Arab Emirates, 16–18 April 2018. [Google Scholar] [CrossRef]
  64. Hosny, R.; Fathy, M.; Ramzi, M.; Abdel Moghny, T.; Desouky, S.E.M.; Shama, S.A. Treatment of the oily produced water (OPW) using coagulant mixtures. Egypt. J. Pet. 2016, 25, 391–396. [Google Scholar] [CrossRef] [Green Version]
  65. Raymond, D.L. Water Quality and Treatment-A Handbook of Community Water Supplies, 5th ed.; McGraw-Hill, Inc: New York, NY, USA, 1999. [Google Scholar]
  66. Chen, P.; Willingham, T.; Al Sowaidi, A.; Stojkovic, D.; Brown, J. Solids loading assessment for produced water reinjection in a carbonate reservoir. In Proceedings of the Paper presented at the Abu Dhabi International Petroleum Exhibition & Conference, Abu Dhabi, United Arab Emirates, 18 November 2018. [Google Scholar] [CrossRef]
  67. Dai, C.; Wang, K.; Liu, Y.; Fang, J.; Zhao, M. Study on the reutilization of clear fracturing flowback fluids in surfactant flooding with additives for enhanced oil recovery (EOR). PLoS ONE 2014, 9, e113723. [Google Scholar] [CrossRef] [PubMed]
Figure 1. Temporal patterns of (a) major and (b) minor components in the flowback.
Energies 14 05921 g001
Figure 2. Gas chromatogram of the DCM extract obtained from flowback sample.
Energies 14 05921 g002
Figure 3. Coagulation process of flowback water with selected coagulants (1-ALS, 2-PAX18, 3-PAXXL10, 4-PAX 19F, 5-PAX19H, 6-SAX13, 7- SAX18, 8-PIX113, 9-PIX116, 10-flowback water as reference sample) after (a) 5 min (b) 60 min.
Energies 14 05921 g003
Figure 4. Influence of coagulant dose (1–50 μL, 2–100 μL, 3–200 μL, 4–300 μL, 5–600 μL and 6–1200 μL of SAX18 coagulant per 50 mL of flowback water) on the coagulation efficiency after (a) 30 min and (b) 1440 min.
Energies 14 05921 g004
Figure 5. Changes in turbidity depending on the duration of the coagulation process for coagulants (a) SAX18 and (b) SAX13.
Energies 14 05921 g005
Figure 6. Volume particle size distribution (based on DLS data) of solid particles suspended in raw and treated flowback.
Energies 14 05921 g006
Figure 7. Comparison of rheological parameters of tested fluids (a) plastic viscosity (PV), (b) apparent viscosity (AV), (c) field point (YP), (d) low shear rate field point (LSYP), (e) 10-s gel strength (1 cP = 1 mPa × s, 1 lb/100sq ft = 0.4788 Pa).
Energies 14 05921 g007
Figure 8. Linear swelling of Miocene shale under the influence of reservoir brine (flowback) and the developed Mud-1.
Energies 14 05921 g008
Table 1. Composition of the fracturing fluid used at the second stage of well stimulation.
FunctionComponentAmount of Additive, Per 1 m3 of Water
Bacteria controlreaction products of paraformaldehyde and 2-hydroxypropylamine (ratio 3:2), [MBO]0.1 L
Clay controlKCl20 kg
Buffering agentAmmonium acetate, acetic acid1 L
Gelling agentContains no hazardous substances–guar gum3.6 kg
Table 2. Composition of the fracturing fluid used at the third stage of well stimulation.
FunctionComponentAmount of Additive, Per 1 m3 of Water
Bacteria controlReaction products of paraformaldehyde and 2-hydroxypropylamine (ratio 3:2); [MBO]0.10 L
Clay controlKCl20 kg
Buffering agentAmmonium acetate, acetic acid1 L
Gelling agentContains no hazardous substances: guar gum3.6 kg
SurfactantIsopropyl alcohol, orange sweet, ext. (citrus terpenes)2.0 L
Buffering agentPotassium carbonate3.2 L
Breaker 1Ammonium persulfate0.48–1.0 kg
Breaker 2Sodium persulfate0.2–2.0 kg
Delayed x-linkerTriethanolamine zirconate, propanol, glycerine0.6 L
Instant X–linkerDisodium octaboratetetrahydrate3.6 L
Table 3. Chemical composition of the tested liquids.
ChemicalsBrine+FGM-1+FGM-2Mud-1Mud-2
Flowback brine10001000100010001000[L]
FGM-10201020[g/L]
Nano-Amine 016---11[g/L]
Block---100100[g/L]
K2CO3---to pH~9to pH~9
Antykor---55[g/L]
Table 4. Summary of flooding tests performed with fresh and flowback water.
ParameterFresh WaterFlowback Water
Sand pack porosity, %15.6 ± 0.914.5 ± 0.8
Residual water saturation, %21.2 ± 1.222.3 ± 0.9
Primary oil recovery (under the gravitational force), %18.7 ± 1.119.6 ± 1.3
Oil recovery after flooding, %33.5 ± 1.539.3 ± 1.5
Total oil recovery, %52.2 ± 3.558.9 ± 2.9
Table 5. Parameters of FGM solutions in water and in brine (flowback).
ParameterFGM Solution in Fresh WaterFGM Solution in Brine (Flowback)
Plastic viscosity, mPa × s1510
Apparent viscosity, mPa × s2720
Yield point, Pa2320
Low shear rate yield point, Pa86
Gel 10 s, Pa86.5
Gel 10 min, Pa97.5
Publisher’s Note: MDPI stays neutral with regard to jurisdictional claims in published maps and institutional affiliations.

