Article

Analysis of Hybrid and Plug-In Hybrid Alternative Propulsion Systems for Regional Diesel-Electric Multiple Unit Trains

by
Marko Kapetanović
1,*,
Mohammad Vajihi
2 and
Rob M. P. Goverde
1
1
Department of Transport and Planning, Delft University of Technology, P.O. Box 5048, 2600 GA Delft, The Netherlands
2
Department of Civil, Constructional and Environmental Engineering (DICEA), Sapienza University of Rome, Via Eudossiana 18, 00184 Rome, Italy
*
Author to whom correspondence should be addressed.
Energies 2021, 14(18), 5920; https://doi.org/10.3390/en14185920
Submission received: 22 July 2021 / Revised: 6 September 2021 / Accepted: 14 September 2021 / Published: 17 September 2021
(This article belongs to the Special Issue Energy Intensity of Transport and Environmentally Friendly Mobility)

Abstract

:
This paper presents a simulation-based analysis of hybrid and plug-in hybrid propulsion system concepts for diesel-electric multiple unit regional railway vehicles. These alternative concepts primarily aim to remove emissions in terminal stops with longer stabling periods, with additional benefits reflected in the reduction of overall fuel consumption, produced emissions, and monetary costs. The alternative systems behavior is modeled using a backward-looking quasi-static simulation approach, with the implemented energy management strategy based on a finite state machine control. A comparative assessment of alternative propulsion systems is carried out in a case study of a selected regional railway line operated by Arriva, the largest regional railway undertaking in the Netherlands. The conversion of a standard diesel-electric multiple unit vehicle, currently operating on the network, demonstrated a potential GHG reduction of 9.43–56.92% and an energy cost reduction of 9.69–55.46%, depending on the type of service (express or stopping), energy storage technology selection (lithium-ion battery or double-layer capacitor), electricity production (green or grey electricity), and charging facilities configuration (charging in terminal stations with or without additional charging possibility during short intermediate stops) used. As part of a bigger project aiming to identify optimal transitional solutions towards emissions-free trains, the outcomes of this study will help in the future fleet planning.

1. Introduction

The transport sector is facing numerous challenges in meeting the greenhouse gas (GHG) emissions reduction targets defined in various international treaties [1,2] and improving energy efficiency and reducing operational costs [3]. Achieving carbon-neutral railway operation by 2050 [4] is being mainly sought through the synergetic electrification of railway lines and production of traction electricity from renewables. While this instrument is economically viable for the highly utilized main corridors, regional railway lines, which is the main subject in this study, require identification of alternative options for the predominantly diesel traction. Replacing the typically employed diesel multiple units (DMU) with battery-electric multiple unit (BEMU) [5,6,7,8] and/or fuel-cell multiple unit (FCMU) vehicles [9,10,11] offers a potentially carbon-neutral final solution for catenary-free operation. However, a “zero-one” transition such as this is hindered by numerous aspects related primarily to the vehicle range, technology maturity and availability, relatively high hydrogen and accompanying infrastructure costs, as well as the long lifecycle of the existing diesel-driven rolling stock. Thus, this dynamic transition process requires further exploitation of DMUs, while constantly improving their energy and environmental performance by implementing novel technological solutions in order to meet increasingly stringent emission reduction requirements.
Vehicle hybridization, achieved by adding an energy storage system (ESS), enables the storing of braking energy and support to the internal combustion engine (ICE), resulting in a significant reduction in fuel consumption and related emissions [12]. Hybrid and plug-in hybrid propulsion systems are increasingly being developed and used in road transport with the aim to improve vehicle fuel economy [13] and reduce emissions [14]. A number of hybrid electric vehicles (HEV) and plug-in hybrid electric vehicles (PHEV) became commercially available over the last two decades [15,16], which is likewise reflected in the extensive research efforts on their development as reported in the literature [17]. Despite potentially great benefits from DMU hybridization, as confirmed in several research projects [18,19,20,21], hybridization of railway powertrains is still in the early development stages. Due to a comparably smaller market for railway vehicles, only a small number of hybrid DMUs exist [22,23,24,25,26], mainly as prototypes. Plug-in hybrid systems offer further exploitation of the benefits offered by the ESS using an external electric power source for their charging during stabling periods. However, practical implementation of a plug-in hybrid concept in the railway sector is limited to shunting locomotives thus far [27,28,29,30], with no reported applications nor literature concerning commercial passenger transport. Utilization of fast charging facilities in stations is considered mainly for BEMUs operation, as a complement to partially electrified regional railway lines [31,32,33,34,35] or in tram networks [36], which represent other use cases than the main subject of the present study.
Energy management strategies (EMS) are the main driver of the fuel economy in hybrid vehicles. Consequently, the reported literature on hybrid DMUs focusses primarily on their development and implementation. Their aim is to minimize energy consumption by managing the power flows from different energy sources in the system. Dynamic programming (DP), as a global optimization method, is widely used in EMS optimization for hybrid railway vehicles [37,38,39]. It was also used in deriving a fuel-optimal combined driving and energy management strategy [40]. Although DP allows for deriving a globally optimal EMS, it is mainly employed for off-line controller optimization, with several drawbacks hindering its real-time applications. These include its requirements for perfect information on the future duty cycle, the extensive calculation time, frequent switches in power distribution, and the inability to deal with variables that include counters due to its non-causal nature, i.e., propagation backward in time. Therefore, the EMS obtained from the DP is mainly used in defining other causal controllers [41], or as a benchmark in evaluating real-time algorithms [42,43]. The equivalent consumption minimization strategies (ECMS) [44] and Pontryagin’s minimum principle (PMP) optimal control strategies [45,46] belong to a group of instantaneous optimization methods that can be used in defining causal controllers. The effectiveness of these methods depends on how the future driving conditions and critical parameters, namely the equivalent coefficient in ECMS and the initial value of the co-state in PMP, are estimated [47]. Additionally, whether a certain EMS can be used online is decided by computation cost and storage memory requirement [48], posing additional challenges in practical applications of such causal controllers. Compared to the previous optimization-based methods, rule-based (RB) algorithms use event-triggered Boolean rules in determining the power ratio between different power sources in the system. These rules can be derived from heuristics or fuzzy rules based on experts’ knowledge [49]. Although RB algorithms cannot guarantee optimality, they were widely used in defining real-time EMSs [50,51], mainly due to their low computation time and easy implementation, while also showing promising benefits in terms of fuel savings and emissions reduction.
The present paper contributes to a bigger project realized in cooperation with Arriva, the largest regional railway undertaking (RU) in the Netherlands, aiming to specify and assess potential innovations in reducing total GHG emissions on a regional non-electrified network in the provinces of Friesland and Groningen. Additionally, requirements of emission-free and noise-free operation in terminal station areas with longer stabling periods (above 5 min) are imposed for the current DMU fleet, with foreseen operation until 2035. The development of detailed simulation models is required to incorporate numerous factors and case-specific constraints affecting trains’ performance, and to capture their technological and operational characteristics. With this in mind, and considering previously discussed aspects and identified knowledge gaps, the main contributions of this paper are twofold:
  • A method to support a hypothetical conversion of a conventional regional DMU vehicle to its hybrid and plug-in hybrid counterparts, equipped with the prominent ESS technologies and newly developed causal and easy-to-implement real-time power control, allowing for a realistic estimation of fuel savings;
  • A comparative analysis of alternative propulsion systems in a case study of a selected benchmark vehicle and railway line in the northern Netherlands, providing the railway undertaking with an assessment of potential benefits in terms of reduction of produced GHG emissions and energy costs.
The remainder of the paper is organized as follows. Section 2 presents a description of standard, hybrid, and plug-in hybrid propulsion systems. A detailed simulation model and the real-time power control are presented in Section 3. A Dutch case study comprising of different systems, railway services, and charging scenarios is given in Section 4, followed by a discussion in Section 5. The concluding remarks and future work efforts are outlined in Section 6.

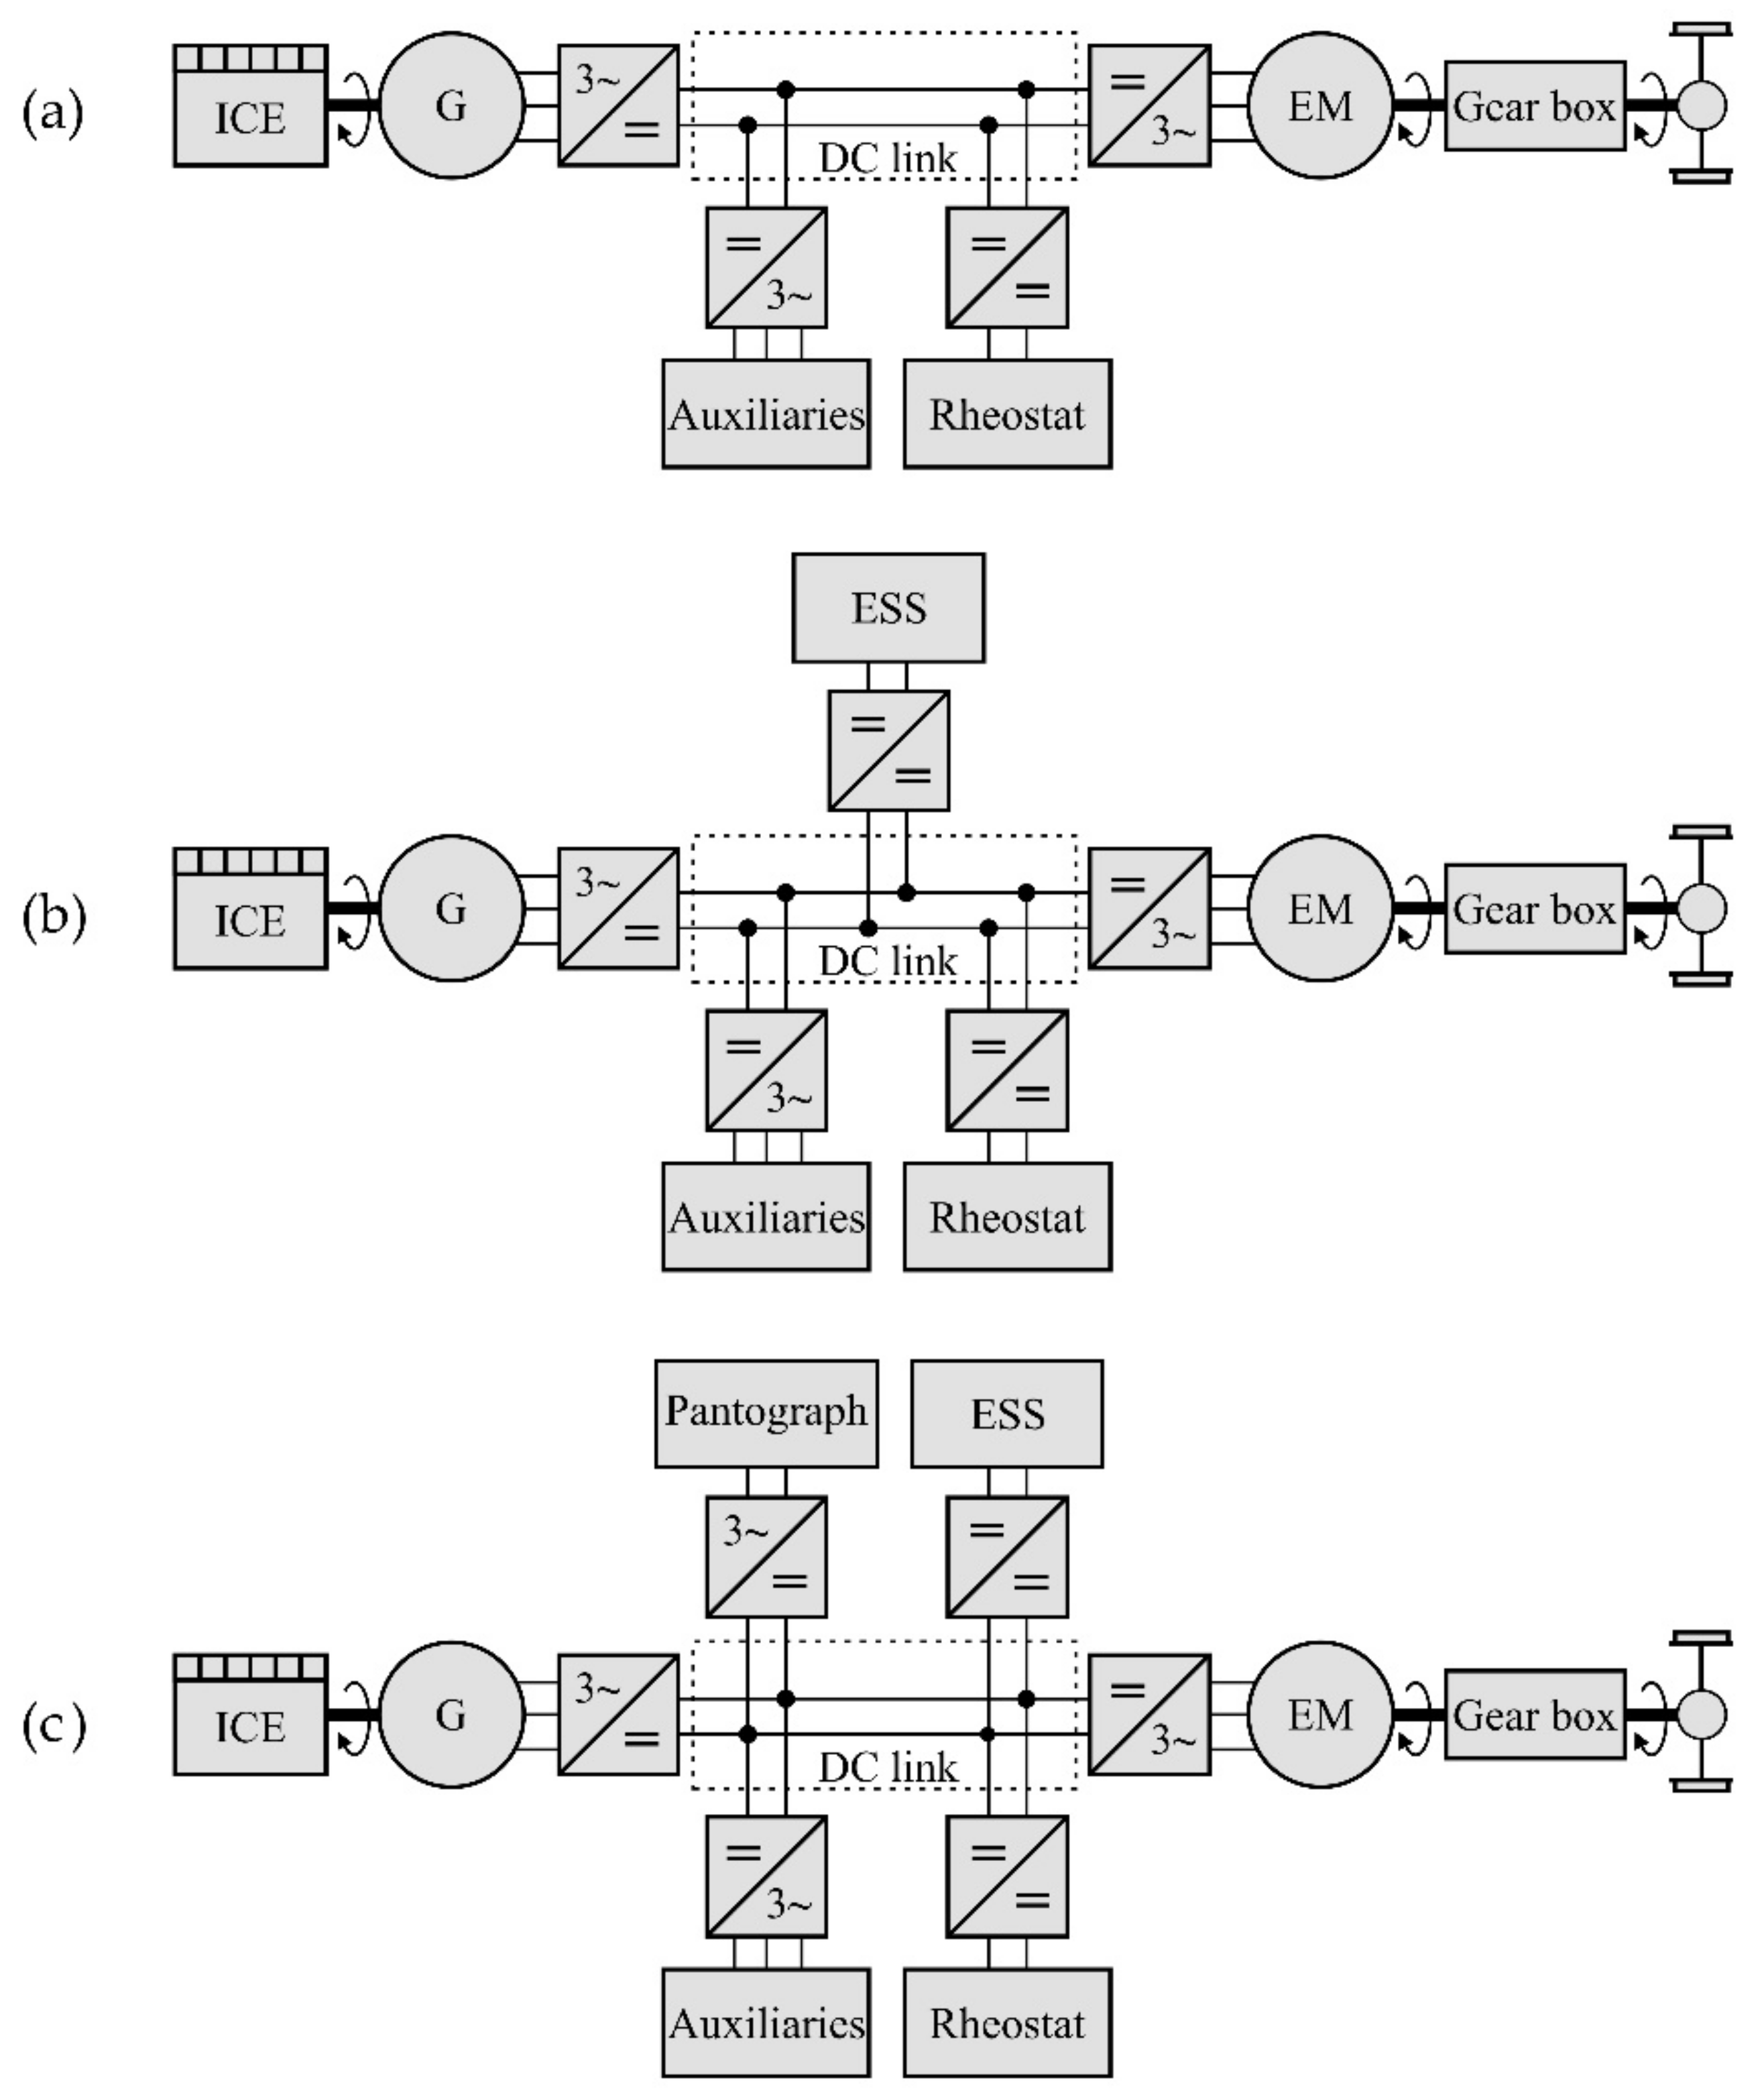
2. Configuration of Standard, Hybrid, and Plug-In Hybrid Propulsion Systems

Various propulsion system configurations can be found in regional DMU vehicles based on their type of power transmission from the ICE to the wheels, i.e., an electrical, hydraulic, or mechanical transmission [52]. We limit our analysis to electrical transmission, namely to diesel-electric multiple units (DEMU), as the only traction option present in the northern Netherlands. The power-plant of a standard DEMU (Figure 1a) consists of an ICE powering an AC electric generator (G). The diesel generator (ICE-G) set powers an AC electric motor (EM) via the rectifier and inverter. With EM acting as a generator during braking, the regenerated energy is, in this case, dissipated through a braking resistor (rheostat), connected to the DC link via a DC/DC converter. We assume total electrification of mechanical auxiliaries, such as hydraulic pump and compressor, with auxiliary systems connected to the DC link via a DC/AC inverter.
Hybridization of a DEMU can be accomplished with a properly sized and implemented ESS. Numerous ESS technologies have emerged in the transport sector [53]. In order to assess the influence of the ESS technology selection for a hybrid diesel-electric multiple unit (HDEMU), we considered the two alternative ESSs that are especially suited for onboard railway applications: Lithium-ion batteries (LB) and double-layer capacitors (DLC) [54]. Compared to LBs, which are characterized by a high energy density, limited power density, and relatively short lifetime, DLCs feature a high number of duty cycles, low energy density, and a high-power density that allows the ESS to store all the energy coming from regenerative braking in a short time period, and to release it to the EM during acceleration [55]. There are different approaches to ESS implementation into the system, i.e., by a direct connection to the DC link [56,57] or via bidirectional DC/DC converters [51]. As the application of the DC/DC converter provides the ability to achieve an active control of each power source and match its voltage to the DC bus voltage [47], we adopted the latter approach (Figure 1b).
Typically, PHEVs use an electric vehicle supply equipment (EVSE) port and corresponding connector for charging the ESS. For further conversion to a plug-in hybrid diesel-electric multiple unit (PHDEMU), we considered adding a pantograph (or a contact shoe) connected to the DC link via a line inductor in case of a DC external power grid, or via a transformer and AC/DC converter in case of an AC external power source (Figure 1c).

3. Modeling and Control of Alternative Propulsion Systems

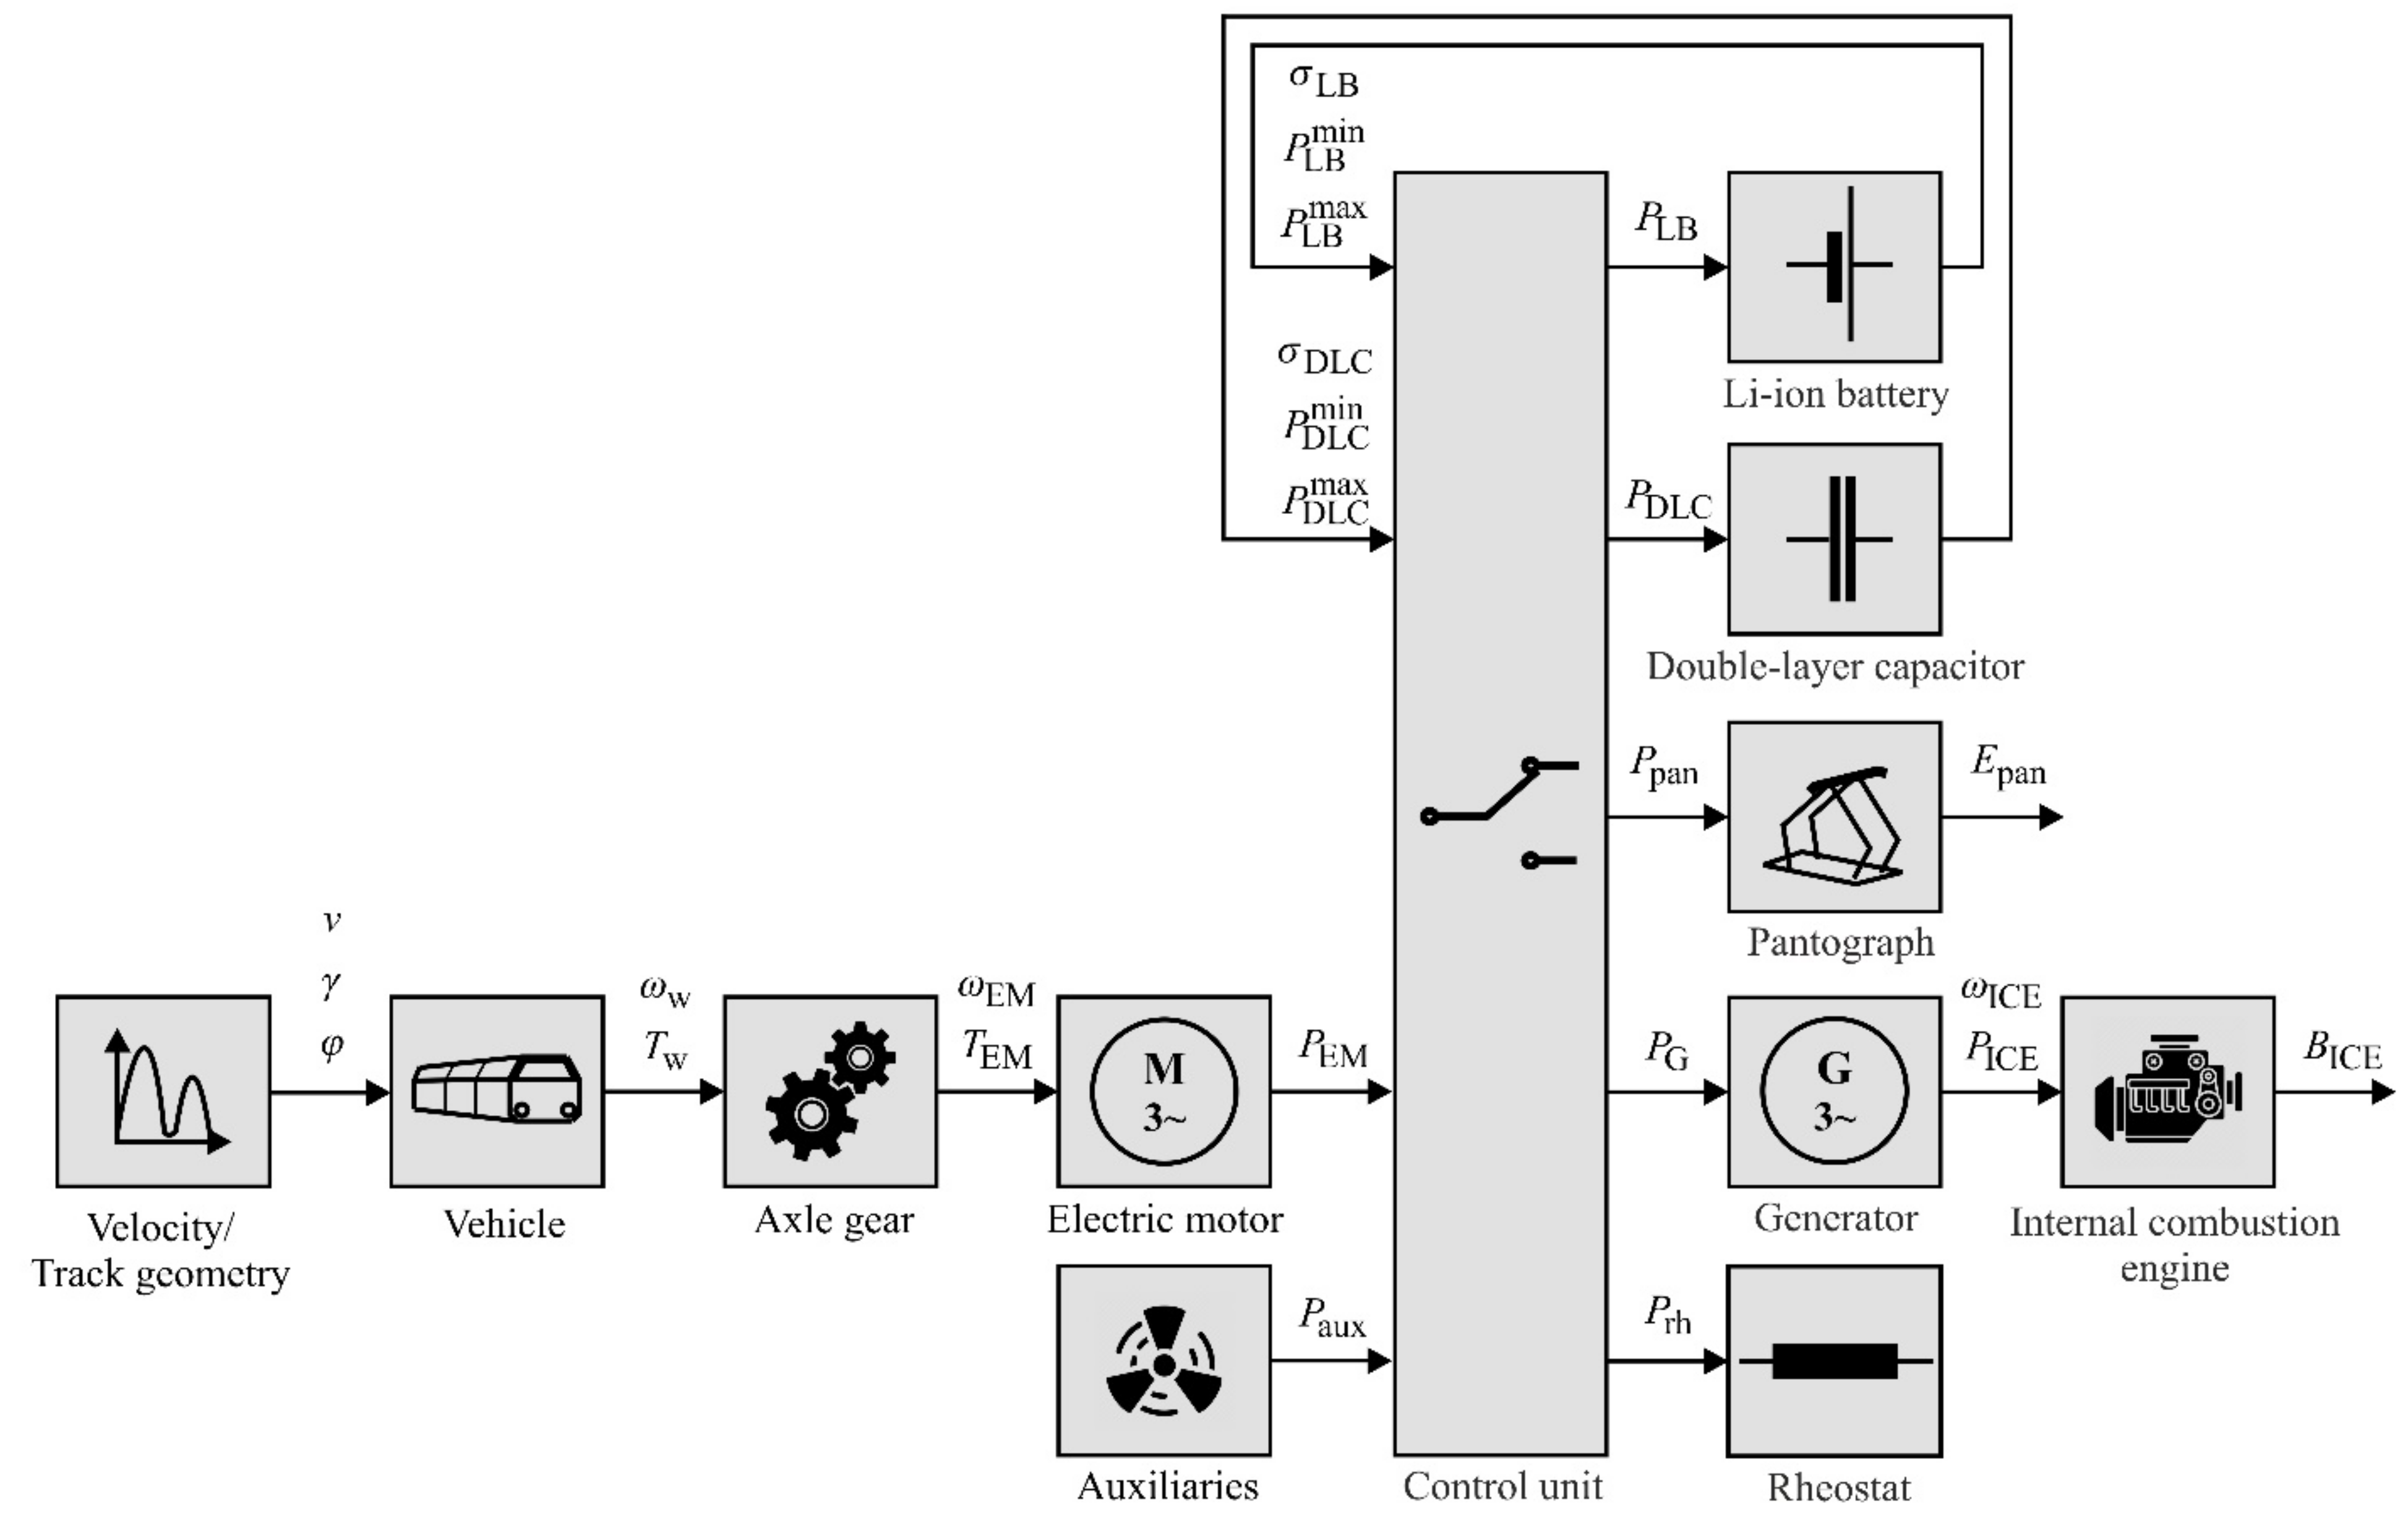
3.1. Simulation Model

A backward-looking quasi-static simulation approach [43,58] was adopted in modeling the dynamics of the previously described system architectures. The simulation model was developed in the MATLAB®/Simulink© environment using the OPEUS Simulink toolbox [59]. The model of a hybrid DEMU [37] was extended to include different power sources (i.e., ICE, pantograph, LB, and DLC) and to capture the dynamics of ESSs using typically available parameters published by the manufacturers. The simulation model (Figure 2) allowed for the simulation of different configurations by disconnecting components not included in the respective system. According to the backward orientation of the model, the inputs encompass the train velocity and geometry profiles of the track, and the main outputs are cumulative fuel and electricity demand. The arrows designate the numerical evaluation sequence, opposite to the physical power flow. Due to the high efficiencies of the power converters, their dynamics were omitted in the model, with their efficiencies assumed to be ~100%. However, they were considered in the physical system for controlling the power flows and dispatching different system components according to the implemented energy management strategy (see Section 3.2). The braking rheostat was used only for assessing the balance of power flows in the system. The description of the low-order models for the system components is provided in the remainder of this section.

3.1.1. Vehicle

With the given velocity and track geometry profiles as input signals, the tractive or braking effort at the wheel F w   N is determined by
F w v t = m v · a t + R v v t + R g ( γ s t ) + R c ( ϕ s t )
with
R v v t = r 0 + r 1 · v t + r 2 · v t 2
R g ( γ s t ) = m v · g · sin ( γ s t )
R c ( ϕ s t ) = m v · 4.91 ϕ 30 if   ϕ < 300   m m v · 6.3 ϕ 55 if   ϕ 300   m
where t   s is the time; v   m / s is the vehicle velocity; s = 0 t v τ d τ   m is the distance travelled; a = d v / d t   [ m / s 2 ] is the acceleration; m v   kg is the total mass of the vehicle, i.e., m v = 1 + λ · m tare + m pax , where λ denotes the factor accounting for rotating masses, m tare   kg the vehicle tare weight, and m pax   kg the cumulative passengers weight. The vehicle resistance R v   N includes roll resistance and air resistance, modelled using the Davis equation [60], with vehicle-specific coefficients r 0   N , r 1   N / m / s , and r 2   [ N / m / s 2 ] ; R g   N is the grade resistance, with g = 9.81   m / s 2 denoting the gravitational acceleration, and γ   rad the angle of the slope [61]; and the curve resistance R c   N is calculated using Roeckl’s formula [62], with ϕ   m denoting the curve radius. With the given wheel diameter, d w   m , and the vehicle velocity, v , the torque at the wheel, T w   Nm , and its rotational speed, ω w   rad / s , can be calculated by [37,43].
T w = F w · d w 2
ω w = 2 · v d w .

3.1.2. Axle Gear

The power from the EM shaft to the wheels is transmitted via the axle gear, with the constant gear ratio i ag and the constant efficiency of the gearbox η ag . The torque T EM   Nm and the rotational speed ω EM   rad / s at the mechanical input of the axle gear result from [37,43].
T EM = T w i ag · η ag if   T w 0 T w · η ag i ag if   T w < 0
ω EM = ω w · i ag .

3.1.3. Electric Motor

Based on the operation mode (motor or generator), and with the EM efficiency η EM = f EM T EM ,   ω EM determined by a linear 2D-interpolation in the efficiency map, the electric power of the electric motor P EM   W can be determined by [37,43].
P EM = T EM · ω EM η EM if   T EM 0 T EM · ω EM · η EM if   T EM < 0 .

3.1.4. Auxiliaries

The total auxiliaries power P aux   W is modelled as the sum of the constant term P aux , const   W , representing constant consumers, such as lighting and the heating, ventilation and air conditioning (HVAC) system, and the variable term, which accounts for the cooling power [58], where we introduce the coefficient p cool , representing the proportion of the total traction power required for cooling the main traction components, i.e.:
P aux t = P aux , const + p cool · P EM t .

3.1.5. Diesel Generator Set

The diesel generator (ICE-G) set is the prime mover in all the propulsion system configurations considered. Given the requested power from the ICE-G set (electrical output power of the generator) P G   W , the mechanical output power of the ICE P ICE   W is calculated by:
P ICE = P G η G ,
where the efficiency η G = f G T G ,   ω ICE is determined by a linear 2D-interpolation in the efficiency map of the generator. The existence of a DC link between the ICE-G and the EM allows for the independent rotational speed of the EM and ICE-G set, with the optimal ICE-G set rotational speed ω ICE   rad / s pre-calculated using the Nelder-Mead simplex method [63] for different possible levels of requested power, while accounting for the efficiency of the generator and ICE-specific fuel consumption. With the specific fuel consumption, ψ = f ICE P ICE , ω ICE   kg / Ws , determined by a 2D-interpolation of the static ICE map, and the density of the fuel, ρ   kg / l , the cumulative ICE fuel consumption B ICE   l follows from [37,43].
B ICE t = 0 t P ICE τ · ψ τ ρ d τ .

3.1.6. Pantograph

A pantograph is introduced in PHDEMU configurations for connecting to the grid and charging the ESS during stops. With the power received via pantograph P pan   W , the total electrical energy consumed E pan   Ws at time instant t results from:
E pan t = 0 t P pan τ d τ .

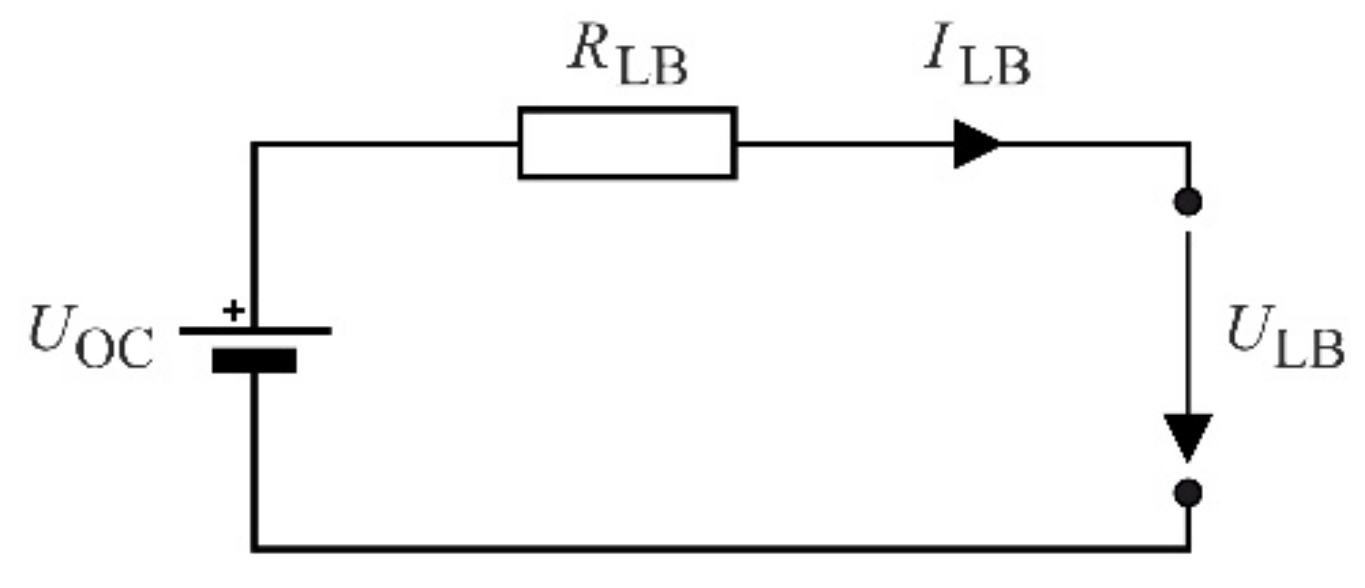
3.1.7. Lithium-Ion Battery

The simplified simulation model of a lithium-ion battery (LB) reflects the equivalent electrical circuit presented in Figure 3. It comprises of a state-of-charge (SoC)-dependent voltage source, U OC   V , and a constant internal resistance, R LB   Ω , which account for ohmic losses and depend on the direction of the battery current I LB   A , i.e., charging or discharging phase.
Given the power provided from the battery P LB   W , battery SoC σ LB 0 , 1 , open circuit voltage U OC , and an internal resistance R LB , the battery current and terminal voltage U LB   V are defined by [64]:
I LB t = U OC σ LB t U OC σ LB t 2 4 · P LB t · R LB I LB t 2 · R LB I LB t
U LB t = U OC σ LB t R LB I LB t · I LB t .
With the initial SoC σ LB 0 and nominal battery capacity Q LB   As , the battery SoC at time instant t results from:
σ LB t = σ LB 0 1 Q LB · 0 t I LB τ d τ .
We limited the maximum (discharging) power P LB max   W and minimum (charging) power P LB min   W by the maximum and minimum current, I LB max   A and I LB min   A , respectively, while keeping the limits of the SoC σ σ LB min , σ LB max , battery voltage U LB U LB min , U LB max , and satisfying the limitations defined by the manufacturer, i.e.:
P LB max t = ( U OC σ LB t R LB dch · I LB max t ) · I LB max t
P LB min t = ( U OC σ LB t R LB ch · I LB min t ) · I LB min t
with
I LB max t = min U OC σ LB t U LB min R LB dch , σ LB t σ LB min · Q LB Δ t , I LB max , dch t  
I LB min t = max U OC σ LB t U LB max R LB ch , σ LB t σ LB max · Q LB Δ t , I LB max , ch t   ,
where · t   s is the simulation (integration) time step, and I LB max , dch and I LB max , ch are the maximum discharging and charging current defined by the manufacturer, respectively. Typically, peak (pulse) current values exceeding a defined threshold are allowed for a short amount of time, preventing the damaging of LB. Therefore, we define the last term in (19) and (20) by:
I LB max , dch t = I LB peak , dch if   t cnt dch t < t peak dch I LB cont , dch if   t cnt dch t t peak dch
I LB max , ch t = I LB peak , ch if   t cnt ch t < t peak ch I LB cont , ch if   t cnt ch t t peak ch ,
where I LB cont , dch   A and I LB cont , ch   A are the allowed maximum continuous discharging/charging current values given by the manufacturer; I LB peak , dch   A and I LB peak , ch   A are the peak (pulse) discharging/charging current values provided by the manufacturer, allowed for the limited time period t peak dch   s and t peak ch   s ; t cnt dch   s and t cnt ch   s are the introduced discharging/charging counters increased in every time step by the sample time as long as the current value exceeds the allowed maximum continuous values, which are reset in case of a switch between discharging and charging phases. We did not consider the thermal dynamics of the LB, as these characteristics are hardly available, and we assumed that the thermal limitations on the LB were satisfied with the previously defined constraints on the maximum power.

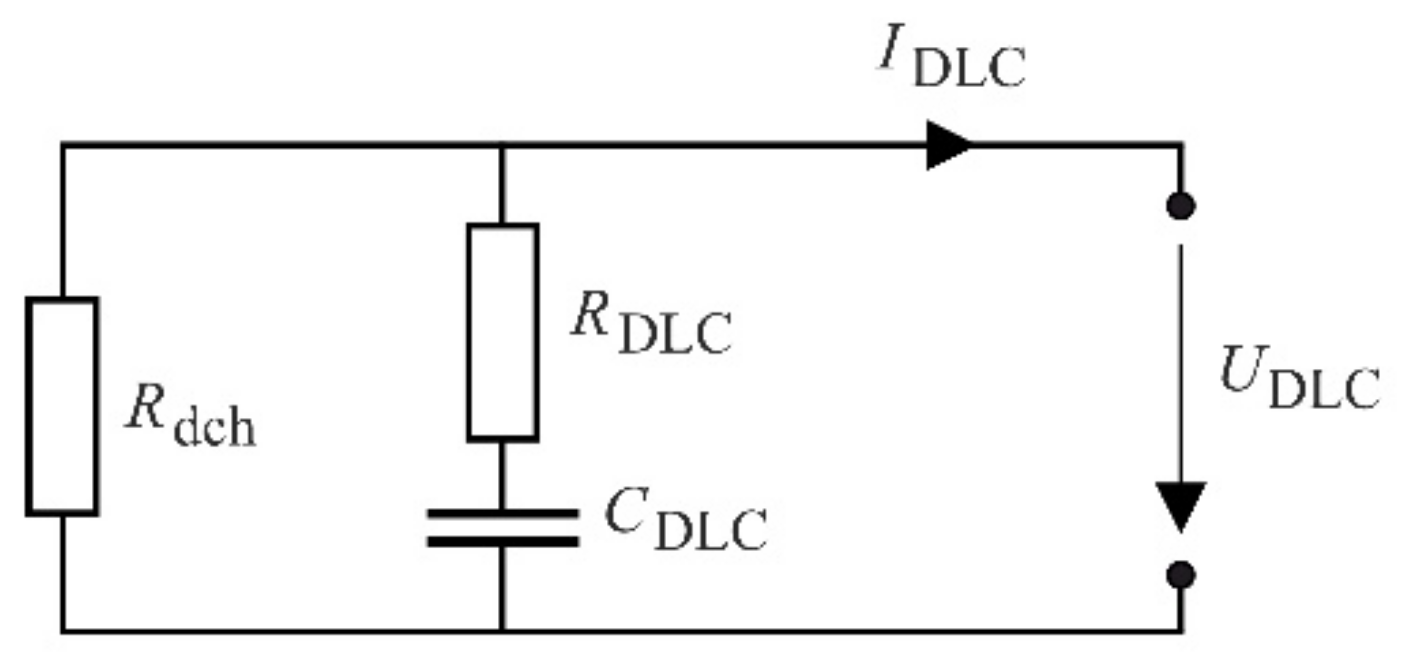
3.1.8. Double-Layer Capacitor

The DLC can be represented with the equivalent electrical circuit shown in Figure 4. It is comprised of an internal resistance R DLC   Ω in series with a capacitance C DLC   F , both in parallel to a self-discharging resistance R dch   Ω . Due to the large value of R dch and a duty cycle characterized by short steady-state times, the losses caused by the self-discharging resistance can be neglected [43], thus preventing the necessity of additional filtering capacitance for braking the algebraic loop [65].
Compared to the LB, the DLC has a unique electrostatic energy storage characteristic with its SoC σ DLC being linearly related to its terminal voltage U DLC   V [48], which then can be determined by:
U DLC σ DLC t = σ DLC t · U DLC max U DLC min + U DLC min ,
where U DLC min   V and U DLC max   V are the maximum and minimum voltage of DLC, respectively. Similar to the LB model, the DLC current I DLC   A results from:
I DLC t = U DLC σ DLC t U DLC σ DLC t 2 4 · P DLC t · R DLC 2 · R DLC .
With the initial SoC σ DLC 0 , and using (23) and (24), the resulting SoC follows from:
σ DLC t = σ DLC 0 1 C DLC · U DLC max U DLC min · 0 t I DLC τ d τ .
The maximum and minimum power of the DLC ( P DLC max   W and P DLC min   W , respectively) are limited by the current of the DLC. Either the maximum (minimum) current is reached in order to keep the voltage constrained U DLC U DLC min , U DLC max , or the maximum (minimum) permitted current for the DLC is reached, i.e.:
P DLC max t = U DLC σ DLC t · I DLC max t
P DLC min t = U DLC σ DLC t · I DLC min t
with
I DLC max t = min U DLC σ DLC t U DLC min · C DLC Δ t , I DLC max , dch
I DLC min t = max U DLC σ DLC t U DLC max · C DLC Δ t , I DLC max , ch ,
where I DLC max , dch   A and I DLC max , ch   A are the maximum discharging and charging current values provided by the manufacturer, respectively.

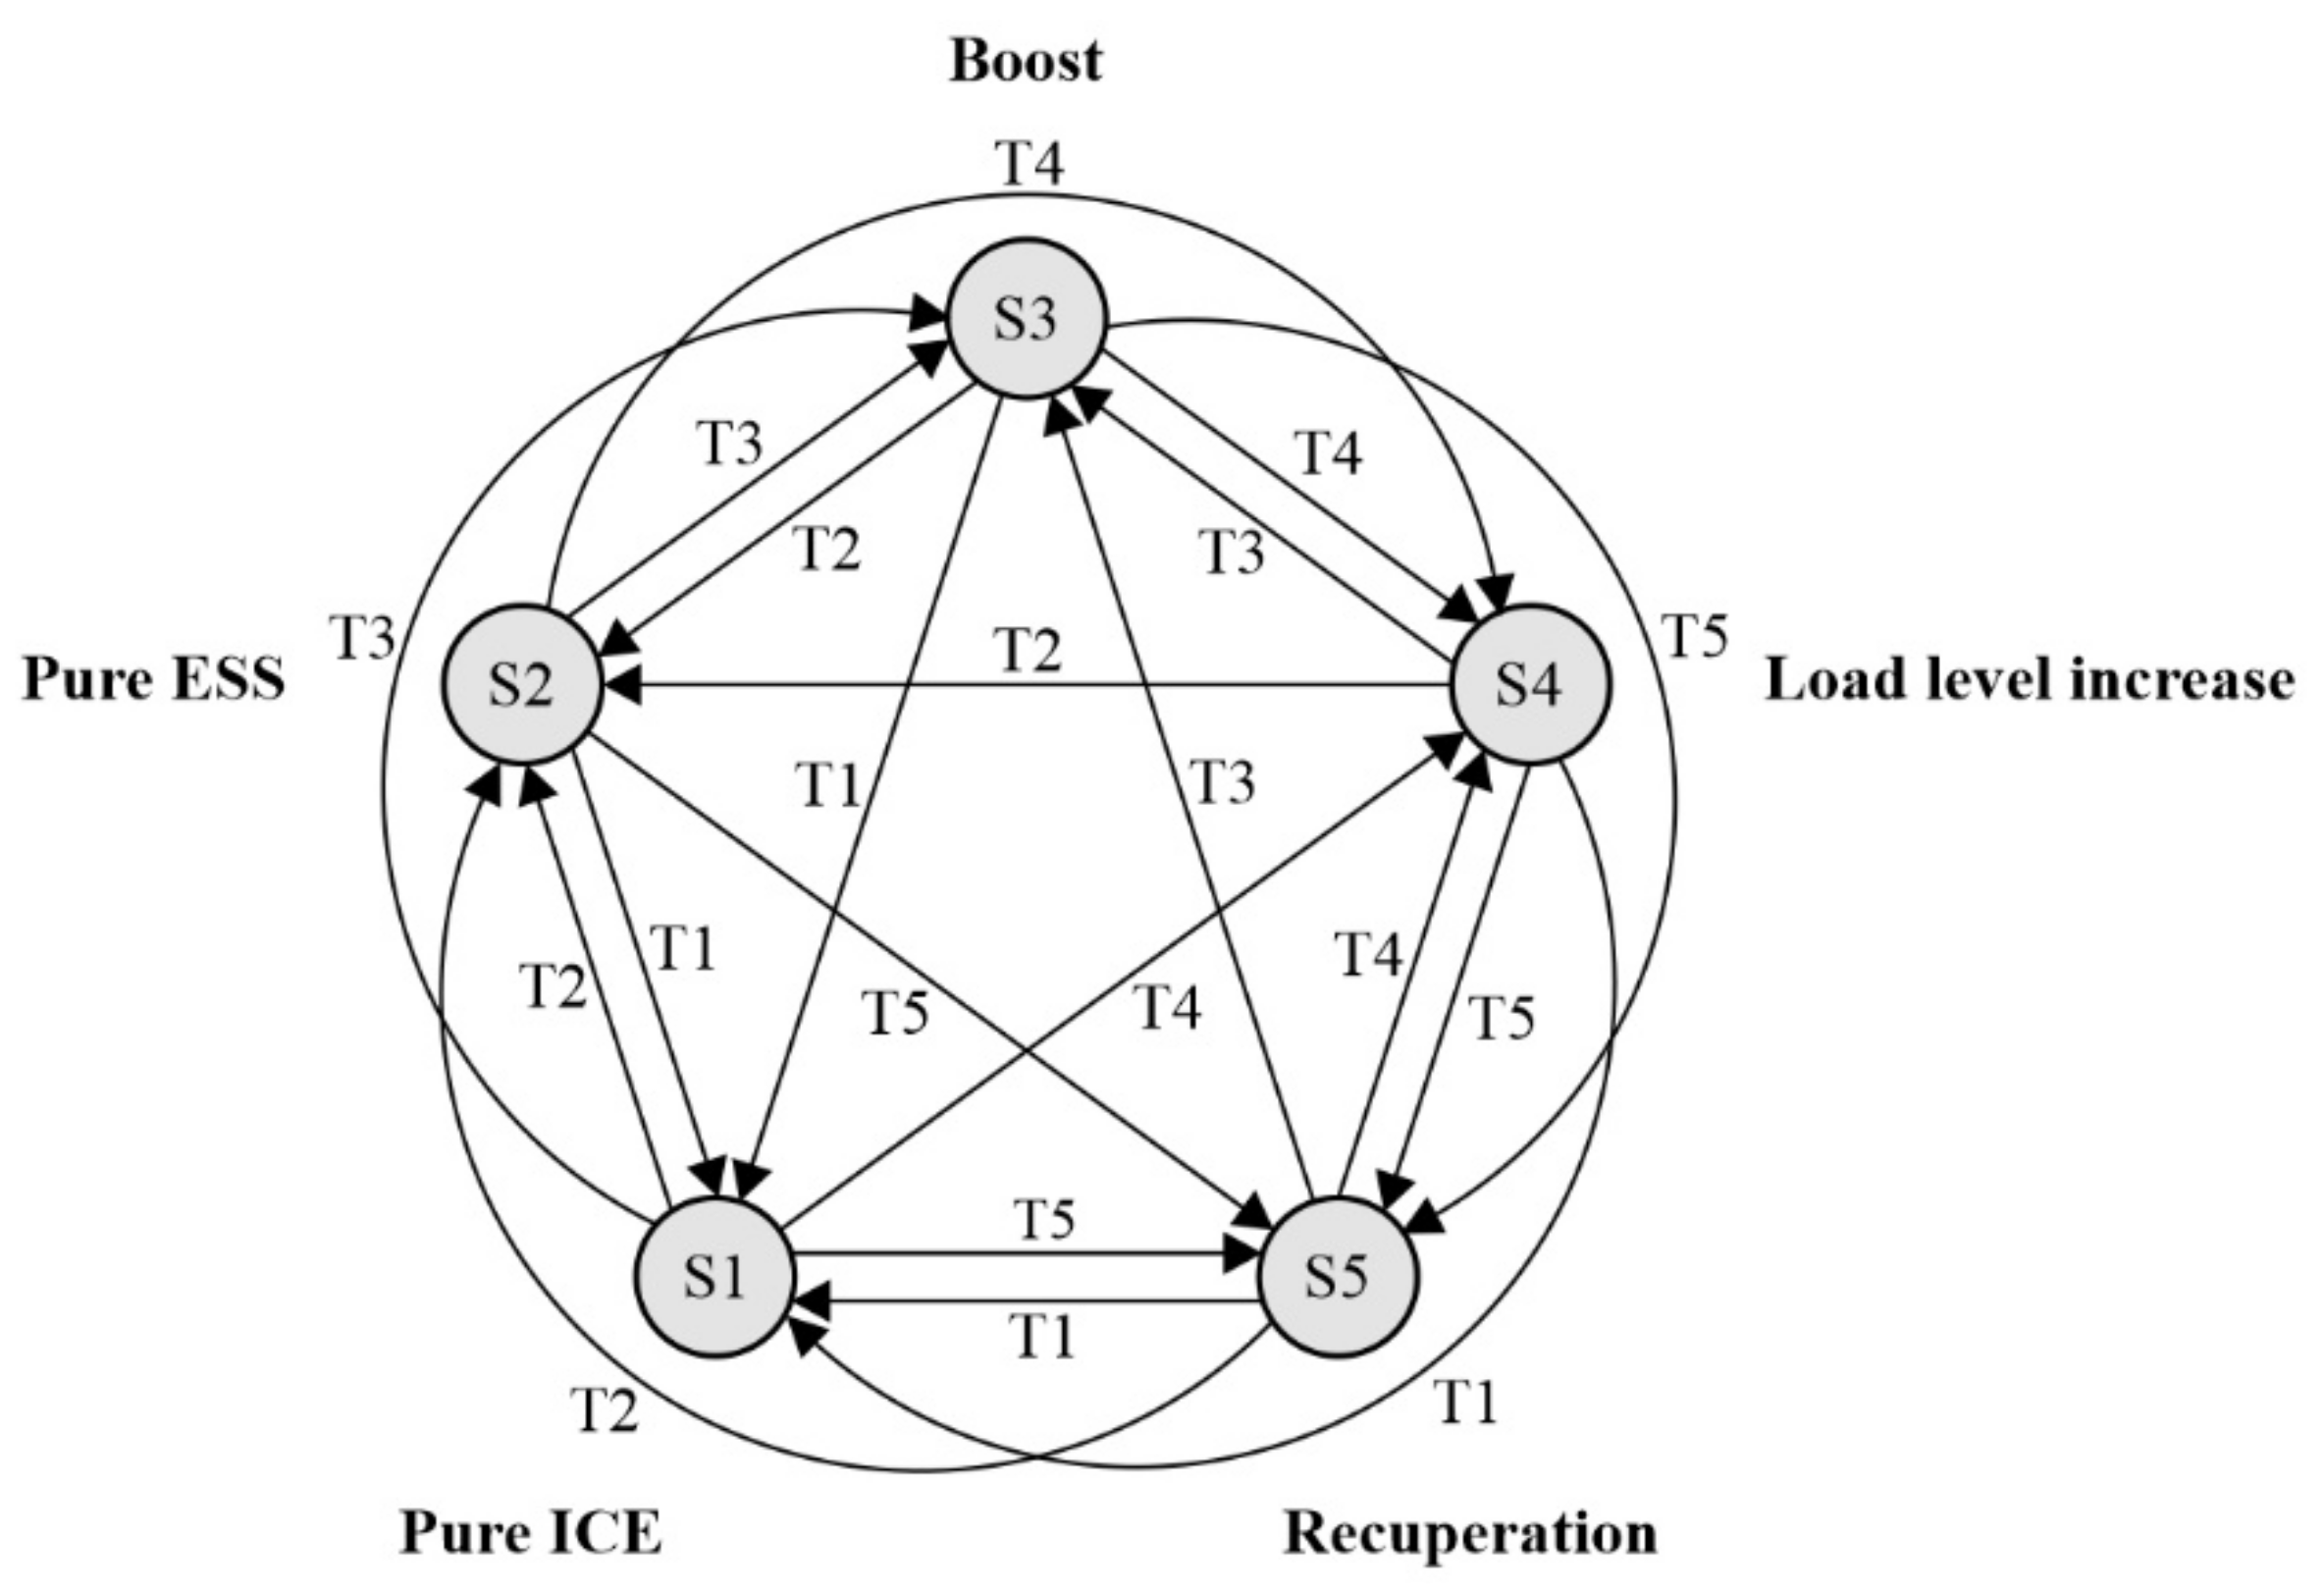
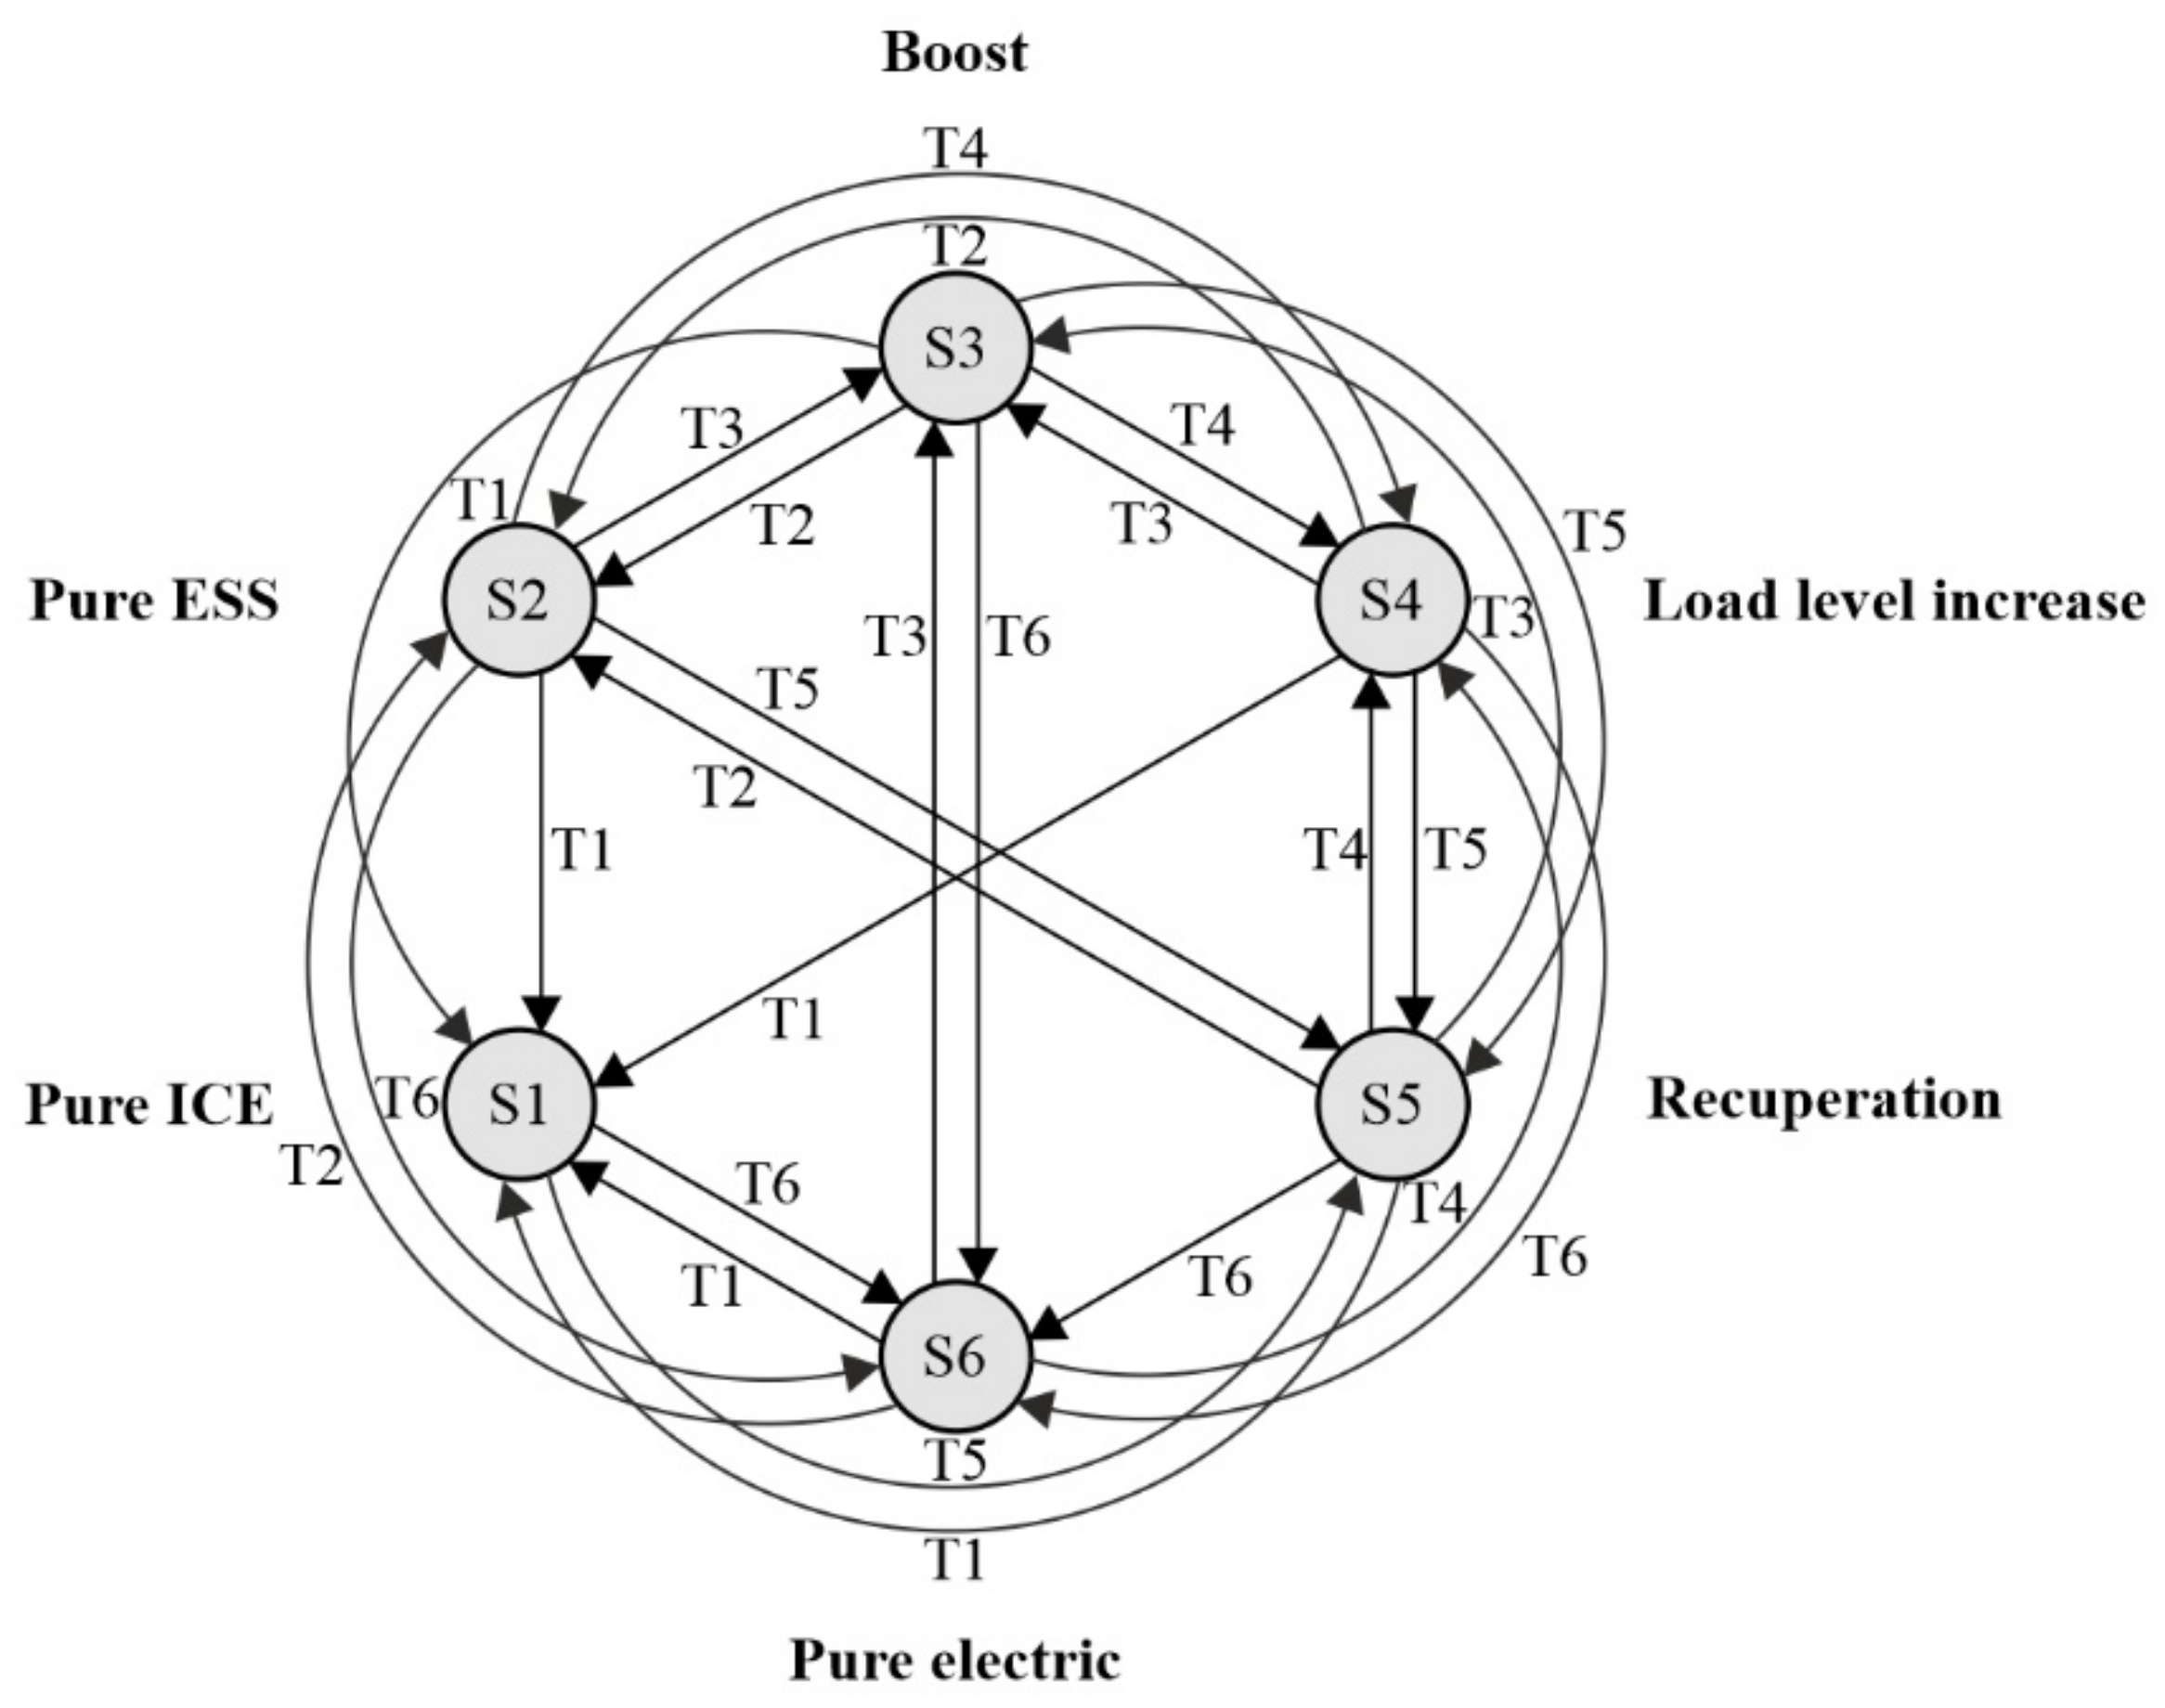
3.2. Energy Management Strategy

The aim of the EMS implemented in the control unit (see Figure 2) is to distribute total demanded power for traction and auxiliaries between different power sources in the system, while satisfying the following requirements, according to the level of priority:
  • Removing emissions and noise in terminal stops by switching off the ICE and supplying auxiliary systems from an ESS or electric power grid;
  • Improving fuel economy by maximizing regenerative braking energy and its later use in powering traction and auxiliary systems;
  • Increasing overall ICE-G efficiency by avoiding low load operation;
  • Supporting ICE-G by an ESS during high power demand phases (acceleration).
In order to fulfill these requirements, a real-time control based on a finite state machine (FSM) was proposed for both HDEMU and PHDEMU configurations, which is applicable to any of the two considered ESS technologies, i.e., ESS LB , DLC . FSM controls can provide effective and implementable management of complex systems, such as hybrid railway vehicles [66,67]. They can be easily programmed in microcontrollers [68], which are then used for dispatching different power sources in the system by controlling their unidirectional or bi-directional converters. The presented EMS thus allows for realistic and achievable estimations of potential fuel savings for the different configurations considered in this paper.

3.2.1. FSM Control for HDEMU Vehicle

The FSM control for HDEMU is shown in Figure 5. It consists of five states (S1–S5) representing typical operation modes of a propulsion system, and corresponding triggers (T1–T5) covering all theoretically possible transitions between states, irrespective of the degree of hybridization, i.e., relative ICE-G set to ESS power ratio. A line-specific critical track section between the defined critical position, s cr   m , and the position of the terminal stop, s ts   m , was introduced to ensure a maximally charged ESS when reaching the terminal stop. ESS discharge processes were disabled in this section and ESS was being charged from regenerative braking energy and/or ICE-G set. Additionally, a SoC limit σ ESS lim σ ESS min , σ ESS max was defined to prevent excessive ESS charge from ICE-G set and the dissipation of braking energy. Both, s cr and σ ESS lim were calibrated from an estimated duty cycle for a particular railway line and vehicle configuration. To avoid frequent switches between ESS charging and discharging operation modes that might cause damage and degradation, a hysteresis cycle for the SoC, σ ESS hyst σ ESS min , σ ESS lim , was implemented by introducing a dynamic binary indicator F l a g t 0 , 1 , with F l a g 0 = 0 . An optimal level of electrical power from the ICE-G set P G opt   W corresponds to its optimal efficiency region. Power flows corresponding to the different states and the triggers for the transition to each particular state were defined as follows.
Under the pure ICE state (S1), total demanded power P dem t = P EM t + P aux t is provided by ICE-G set, and the ESS converter is switched off. Depending on the requested power level and ESS characteristics (maximum power), this state is active if ESS reaches its SoC limiting values and/or the vehicle is located within the critical track section, i.e.:
T 1 : ( P dem t P G opt σ ESS t = σ ESS min s cr s t < s ts ) 0 P dem t < P G opt P dem t P ESS max t σ ESS t σ ESS lim s cr s t < s ts P dem t < P G opt P dem t > P ESS max t σ ESS t σ ESS lim
S 1 : P ESS t = 0 P G t = P dem t F l a g t = F l a g t Δ t .
In the pure ESS state (S2), the ESS provides the total requested power, with ICE running with no load on idling speed, or switched off if the terminal stop is reached. This state is enabled outside of the critical track section and its activation depends on the SoC value and the implemented hysteresis, defined by:
T 2 : 0 P dem t P ESS max t s t < s cr s t = s ts ( F l a g t Δ t = 0 F l a g t Δ t = 1 σ ESS t σ ESS min + σ ESS hyst )
S 2 : P ESS t = P dem t P G t = 0 F l a g t = 0 .
Similar as in the previous state, the boost state (S3) is enabled outside of the critical track section, and for particular SoC values and implemented hysteresis cycle. In this state, ESS provides support for the ICE-G set by providing a portion of high requested power, i.e.:
T 3 : P dem t > P G opt P dem t > P ESS max t σ ESS t > σ ESS min s t < s cr s t = s ts ( F l a g t Δ t = 0 F l a g t Δ t = 1 σ ESS t σ ESS min + σ ESS hyst )
S 3 : P ESS t = min P ESS max t ,   P aux t , P dem t P ICE opt P G t = P dem t P ESS t F l a g t = 0 .
Under the load level increase state (S4), which features a low power demand, the ICE-G set provides the excess power that is used for recharging the ESS, defined by:
T 4 : P dem t < P G opt P dem t > P ESS max t σ ESS t < σ ESS lim 0 P dem t < P G opt P dem t P ESS max t σ ESS t < σ ESS lim s cr s t < s ts F l a g t Δ t = 1 σ ESS t < σ ESS min + σ ESS hyst
S 4 : P ESS t = max P ESS min t , P dem t P G opt P G t = P dem t P ESS t F l a g t = 1 .
The recuperation state (S5) is active during braking, with the negative power values at the DC link, which is used for recharging the ESS. The power distributed to the ESS is limited with its maximum charging power, with the excess power dissipated at the braking rheostat, and ICE running with no load at idling speed, i.e.:
T 5 : P dem t < 0
S 5 : P ESS t = max P ESS min t , P dem t P G t = 0 F l a g t = F l a g t Δ t .

3.2.2. FSM Control for PHDEMU Vehicle

The FSM control for PHDEMU is shown in Figure 6. The previously defined FSM control was extended with the additional state (S6) for the operational mode in stations equipped with charging facilities, together with the corresponding transition conditions.
The EMS is defined by introducing a binary indicator b el s t 0 , 1 , to represent the track electrification status. Operational characteristics related to the critical track section were removed due to the existence of external power sources in terminal stops, resulting in the following transition triggers:
T 1 : b el s t = 0 P dem t P G opt σ ESS t = σ ESS min P dem t < P G opt P dem t > P ESS max t σ ESS t σ ESS lim
T 2 : b el s t = 0 0 P dem t P ESS max t F l a g t Δ t = 0 F l a g t Δ t = 1 σ ESS t σ ESS min + σ ESS hyst
T 3 : b el s t = 0 P dem t > P G opt P dem t > P ESS max t σ ESS t > σ ESS min F l a g t Δ t = 0 F l a g t Δ t = 1 σ ESS t σ ESS min + σ ESS hyst
T 4 : b el s t = 0 P dem t < P G opt P dem t > P ESS max t σ ESS t < σ ESS lim 0 P dem t < P G opt P dem t P ESS max t F l a g t Δ t = 1 σ ESS t < σ ESS min + σ ESS hyst
T 5 : P dem t < 0
T 6 : b el s t = 1 .
The power distribution for the states S1–S5 remained the same as in the previous case. Under the newly added pure electric state (S6), the ICE is switched off in case of a stop duration longer than 5 min, or switched to idle operation with no load otherwise. Depending on the maximum power from the grid P pan max   W and the maximum charging power of ESS, electric power from the grid is used for supplying the auxiliaries and recharging the ESS, i.e.:
S 6 : P ESS t = max P ESS min t , P dem t P pan max P G t = 0 P pan t = P dem t P ESS t F l a g t = F l a g t Δ t .

4. Case Study of the Dutch Northern Regional Railway Lines

The simulation methodology proposed in the previous section was applied in estimating the energy consumption for each of the considered alternative propulsion systems, followed by the calculation of related GHG emissions and energy costs. The following sub-sections provide the description of the selected benchmark DEMU and railway line, followed by a detailed comparative analysis of the different scenarios.

4.1. Benchmark Railway Vehicle

A two-coach DEMU of the type Gelenktriebwagen (GTW) 2/6 from the Swiss manufacturer Stadler, currently employed on the network by the RU Arriva Nederland, was selected as the benchmark vehicle for this study. The power-module of GTW 2/6 is located between the two passenger coaches and contains two identical propulsion systems, shown in Figure 1a. Simulation parameters for a standard GTW 2/6 DEMU are given in Table 1. The EM, G, and ICE characteristic maps for the GTW 2/6 were reconstructed using data provided in [69], with the available efficiency map of EM linearly scaled in order to comply with the maximum requested power for traction and auxiliaries, the maximum available power from ICE-G set at the DC link (Figure 7a), and an ICE-specific fuel consumption map (Figure 7b) reconstructed using similarly sized ICE and Willan’s lines technique [70].
Commercially available LB or DLC modules with proven railway applications were considered for DEMU hybridization in order to obtain as realistic estimations as possible. A Toshiba SCiB™ module, type 1–23, contains 24 Li-ion cells, arranged in 2 parallel branches with 12 cells in series. The cells are based on a Li nickel manganese cobalt oxide (NMC) chemistry with a Li titanium oxide (LTO) anode, which offers a good compromise between energy density, power density, and achievable lifetime [73,74]. Due to the unavailability of the open-circuit voltage characteristic as a function of SoC, the function from [75] was adopted and scaled according to voltage limits for the SCiB™ module (Figure 7c). A BMOD0063 module from the manufacturer Maxwell Technologies was selected as the DLC technology. It contains 48 cells, with 6 parallel series of 8 cells each, and it is especially suited for heavy-duty transport applications, such as trains and buses [76]. Detailed characteristics of the selected LB and DLC modules are given in Table 2.
The total required number of modules was derived from the energy requirement of supplying the auxiliaries in terminal stops according to the extended layover time in terminal stops of 30 min, resulting in 28 LB modules and 179 DLC modules. Train weight was adjusted to account for the added ESSs. An additional weight of 1000 kg was assumed for the converters and other equipment and 150 kg for the pantograph. Since the additional mass affects both acceleration and braking performance, it was accounted for in the velocity profile calculation and simulations for each of the alternative vehicle configurations.

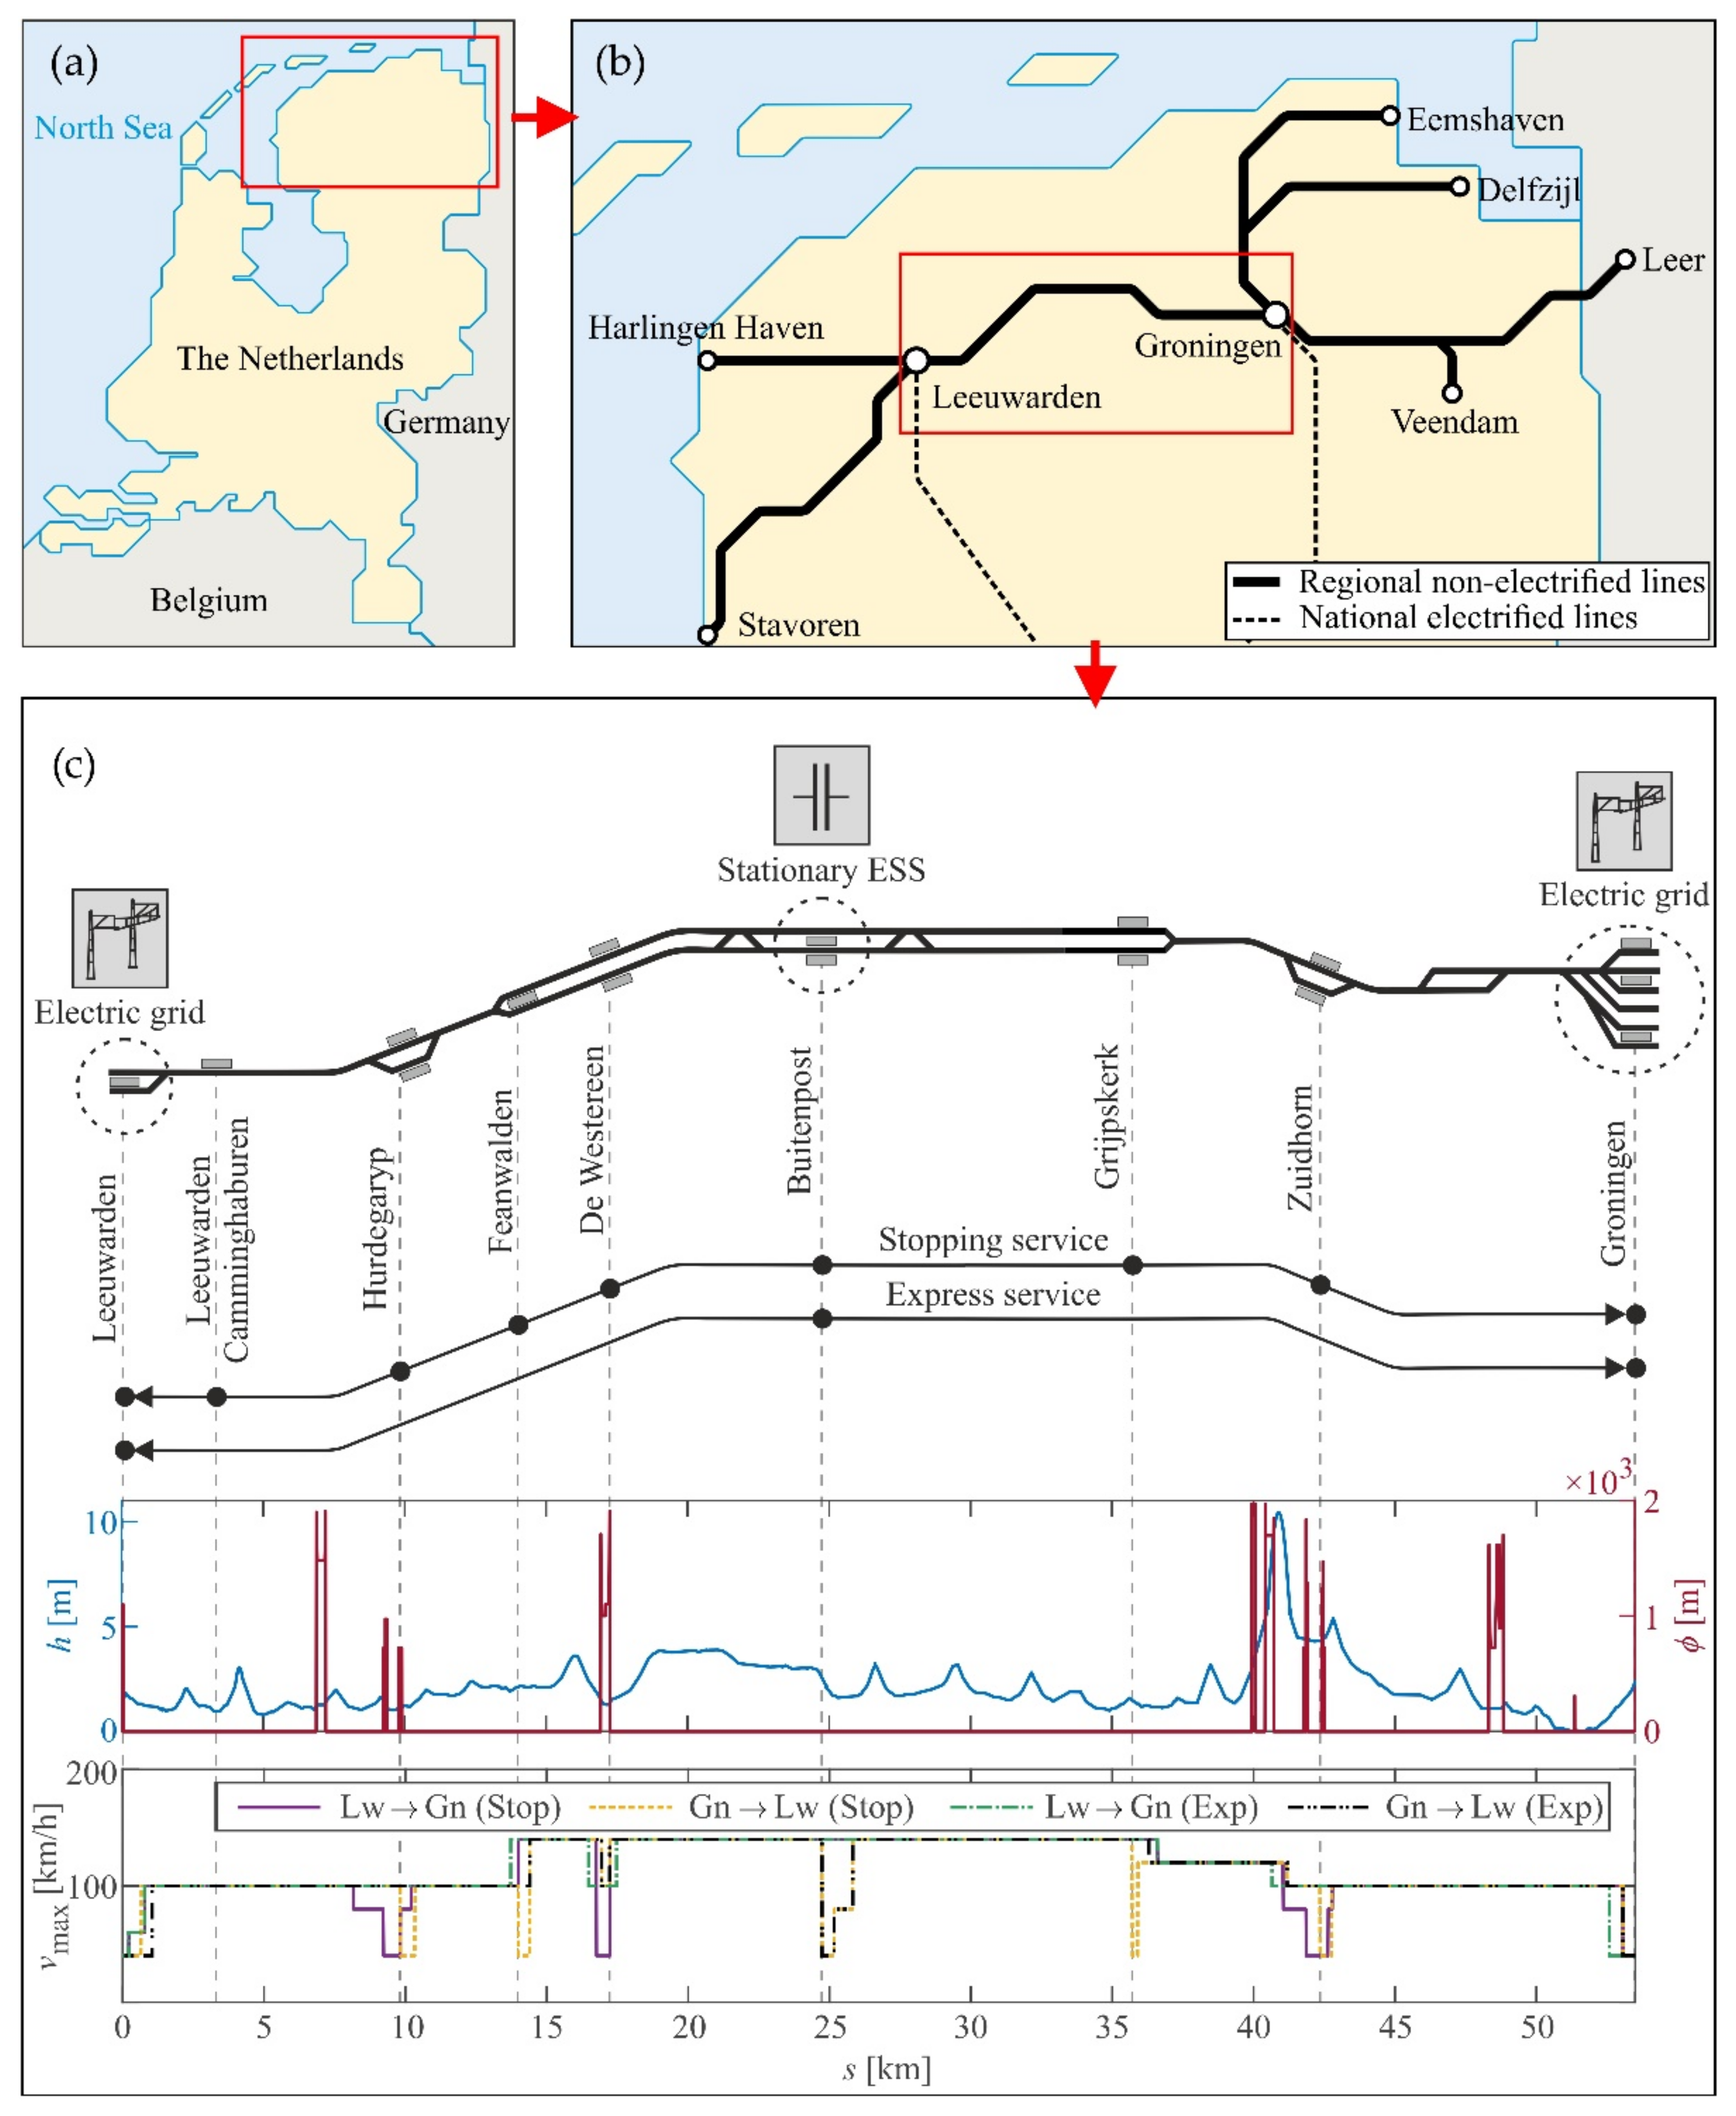
4.2. Benchmark Railway Line Selection

The main railway line on the network between the cities Leeuwarden and Groningen was selected for the train simulations (Figure 8). Compared to the rest of the network, the provision of the two different services on this line (stopping and express) allowed for an impact assessment of the stopping frequency on the total energy consumption. Two different scenarios were considered for the plug-in hybrid concepts regarding the charging facilities location:
  • Charging facilities located only in terminal stations with long layover times;
  • Charging facilities located in terminal stations and an additional fast charging facility located in Buitenpost, a common short stop for the two services.
The vehicle round trip, based on the actual periodic timetable and rolling stock circulation plan (Table 3), was analyzed to account for the difference in line resistances and maximum speed limits for the two opposite directions. A dwell time of 30 s was presumed for all intermediate stops. For the scenarios including the additional charging location in Buitenpost, this time was extended to 2 min at this particular stop.

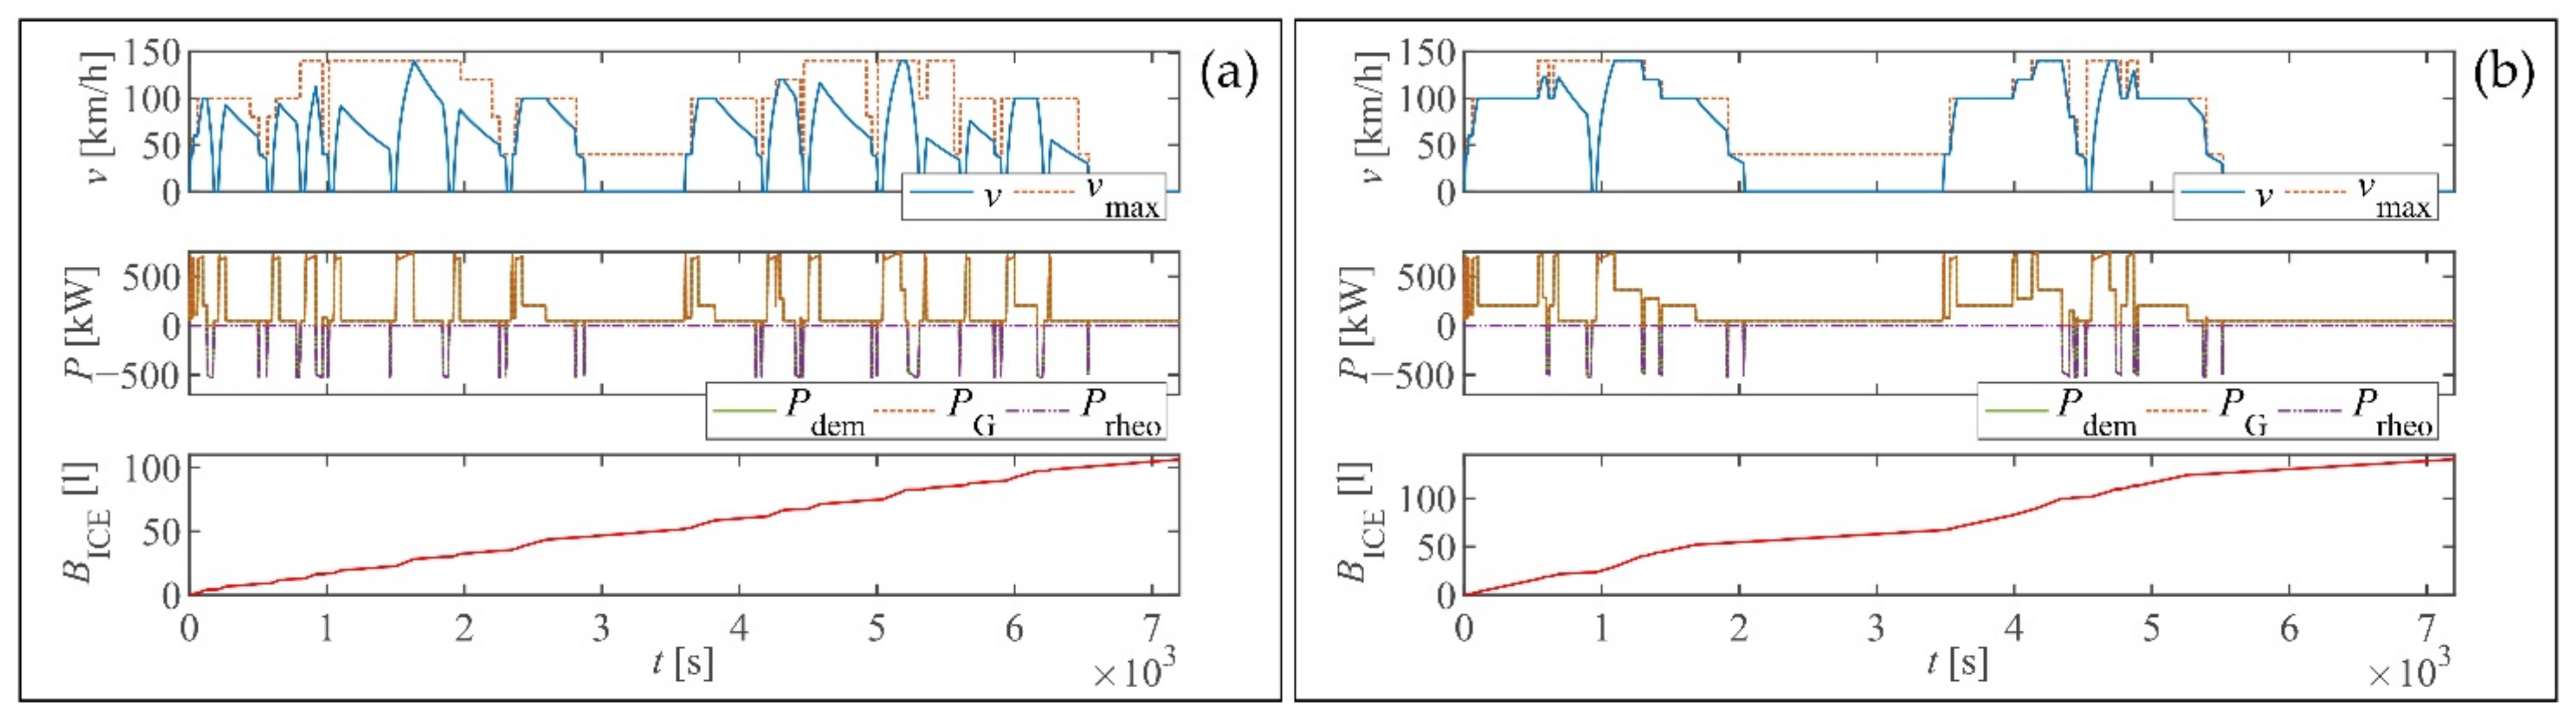
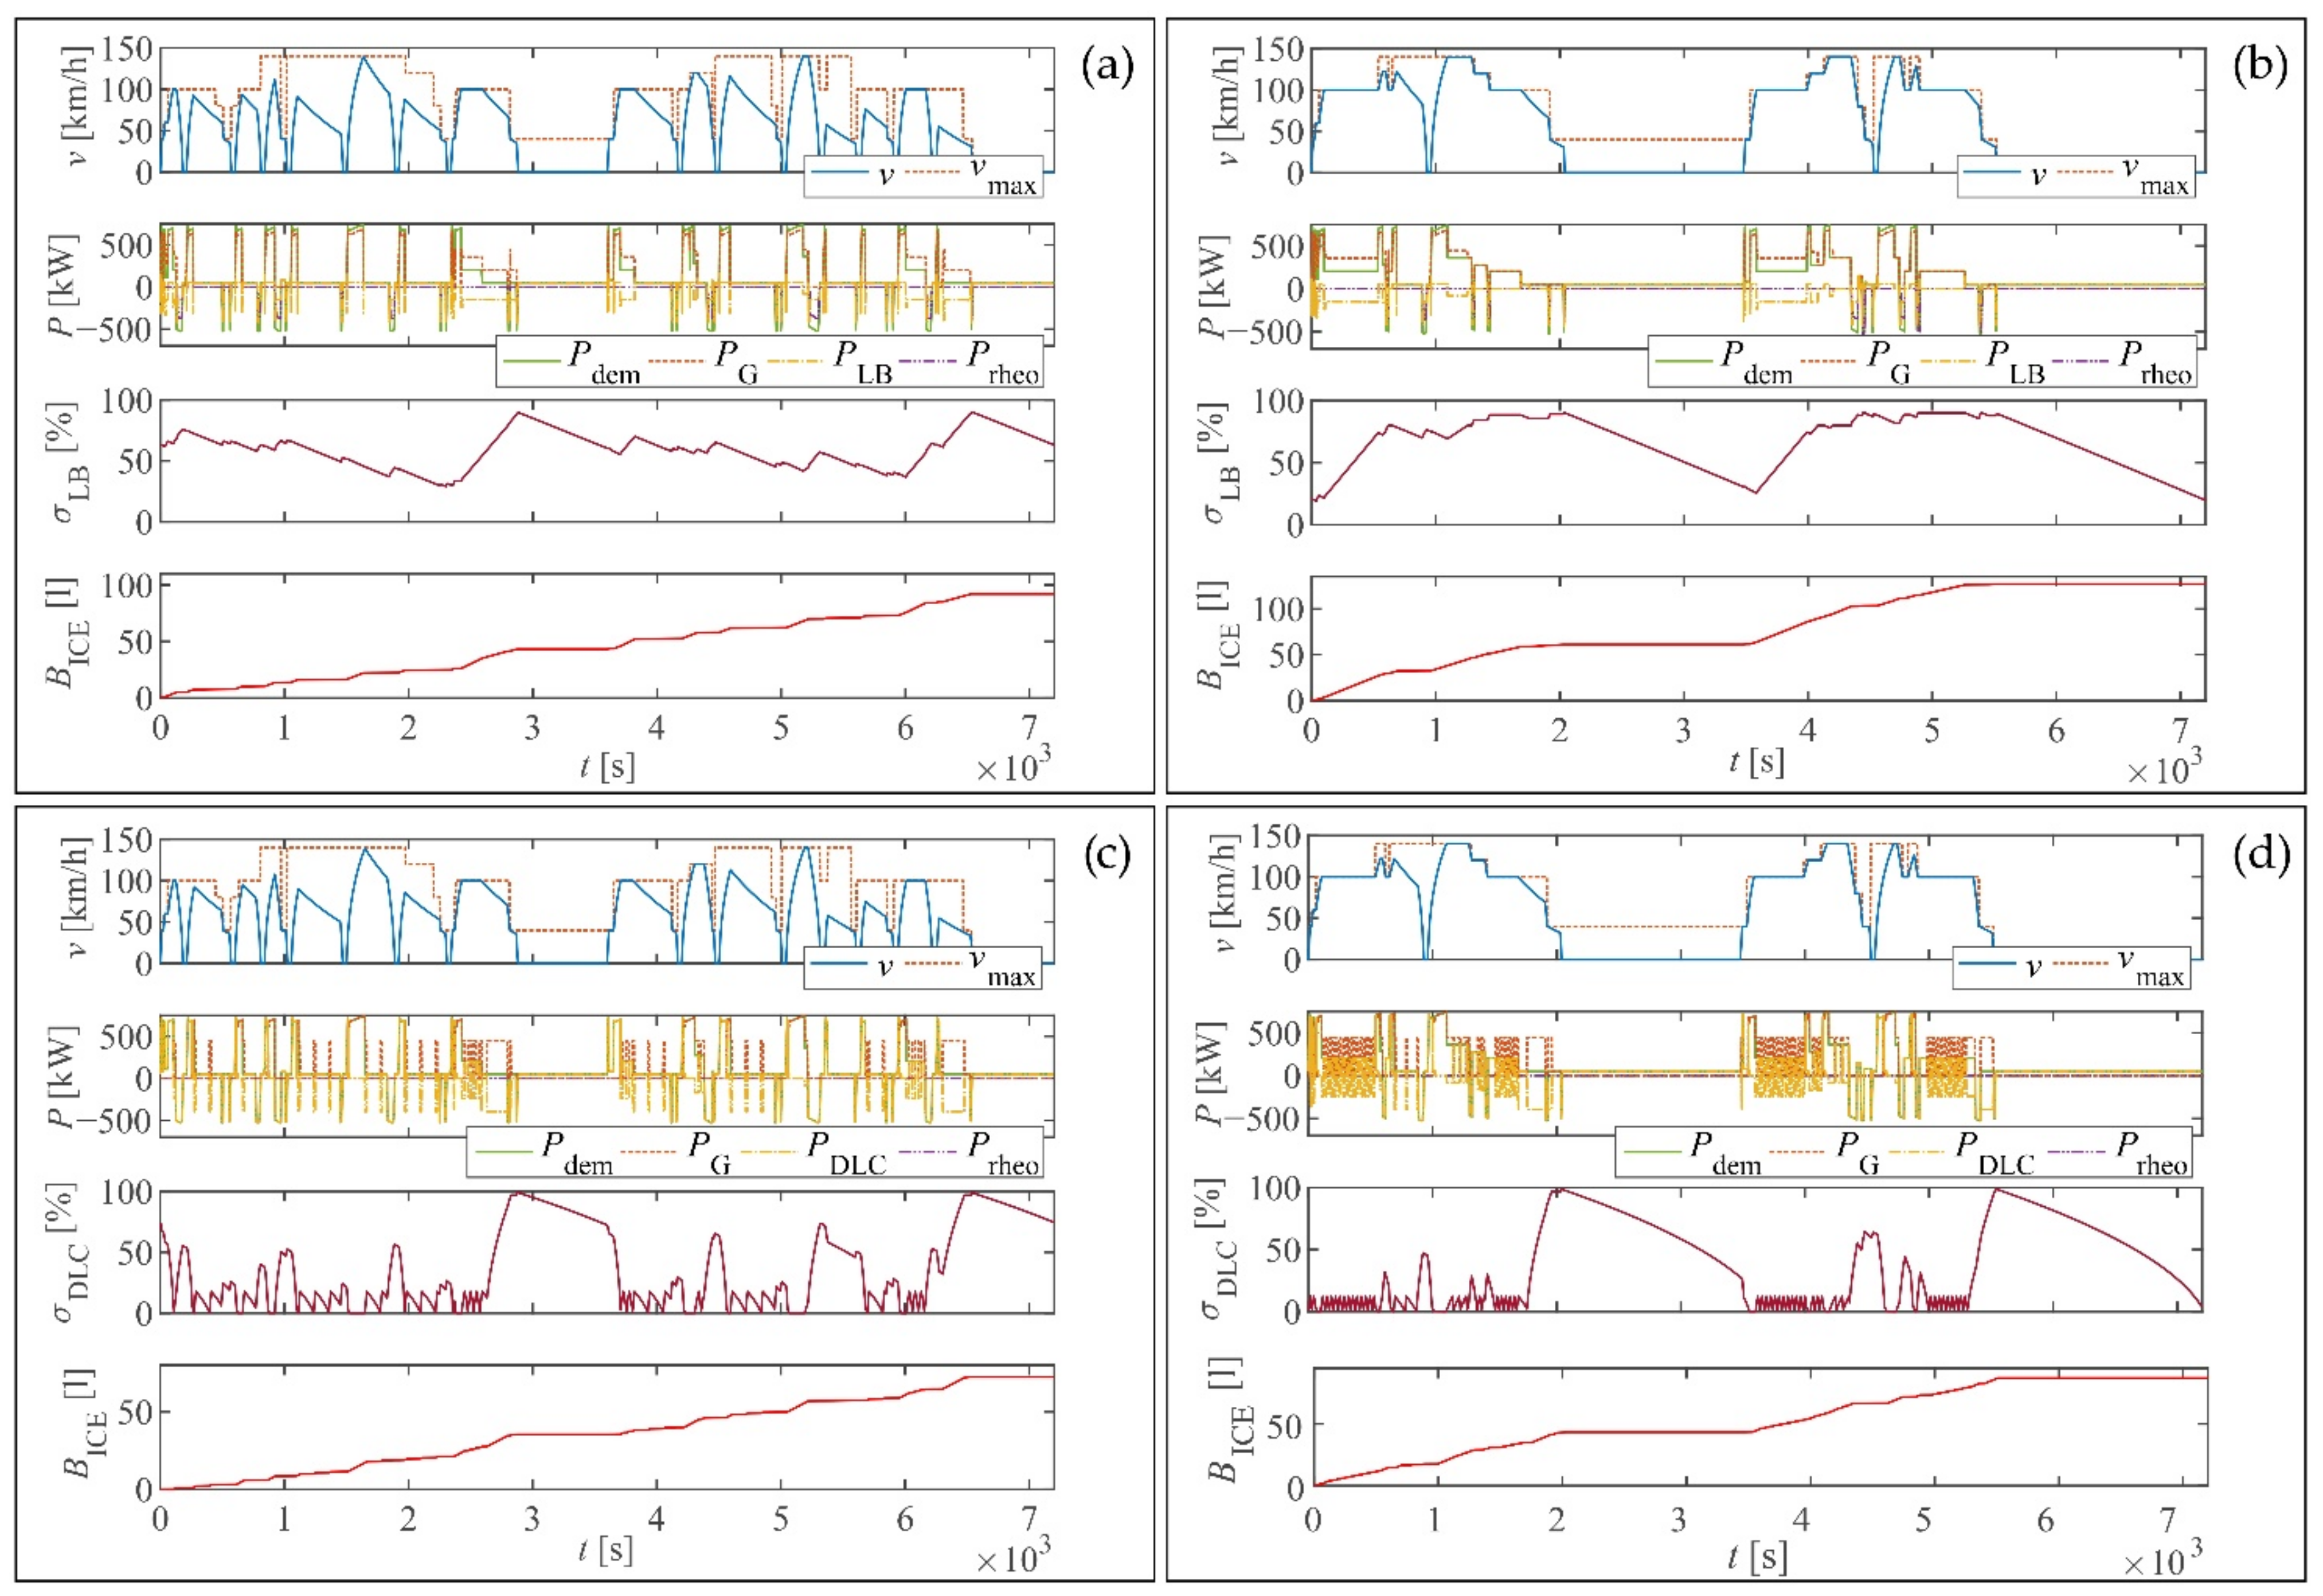
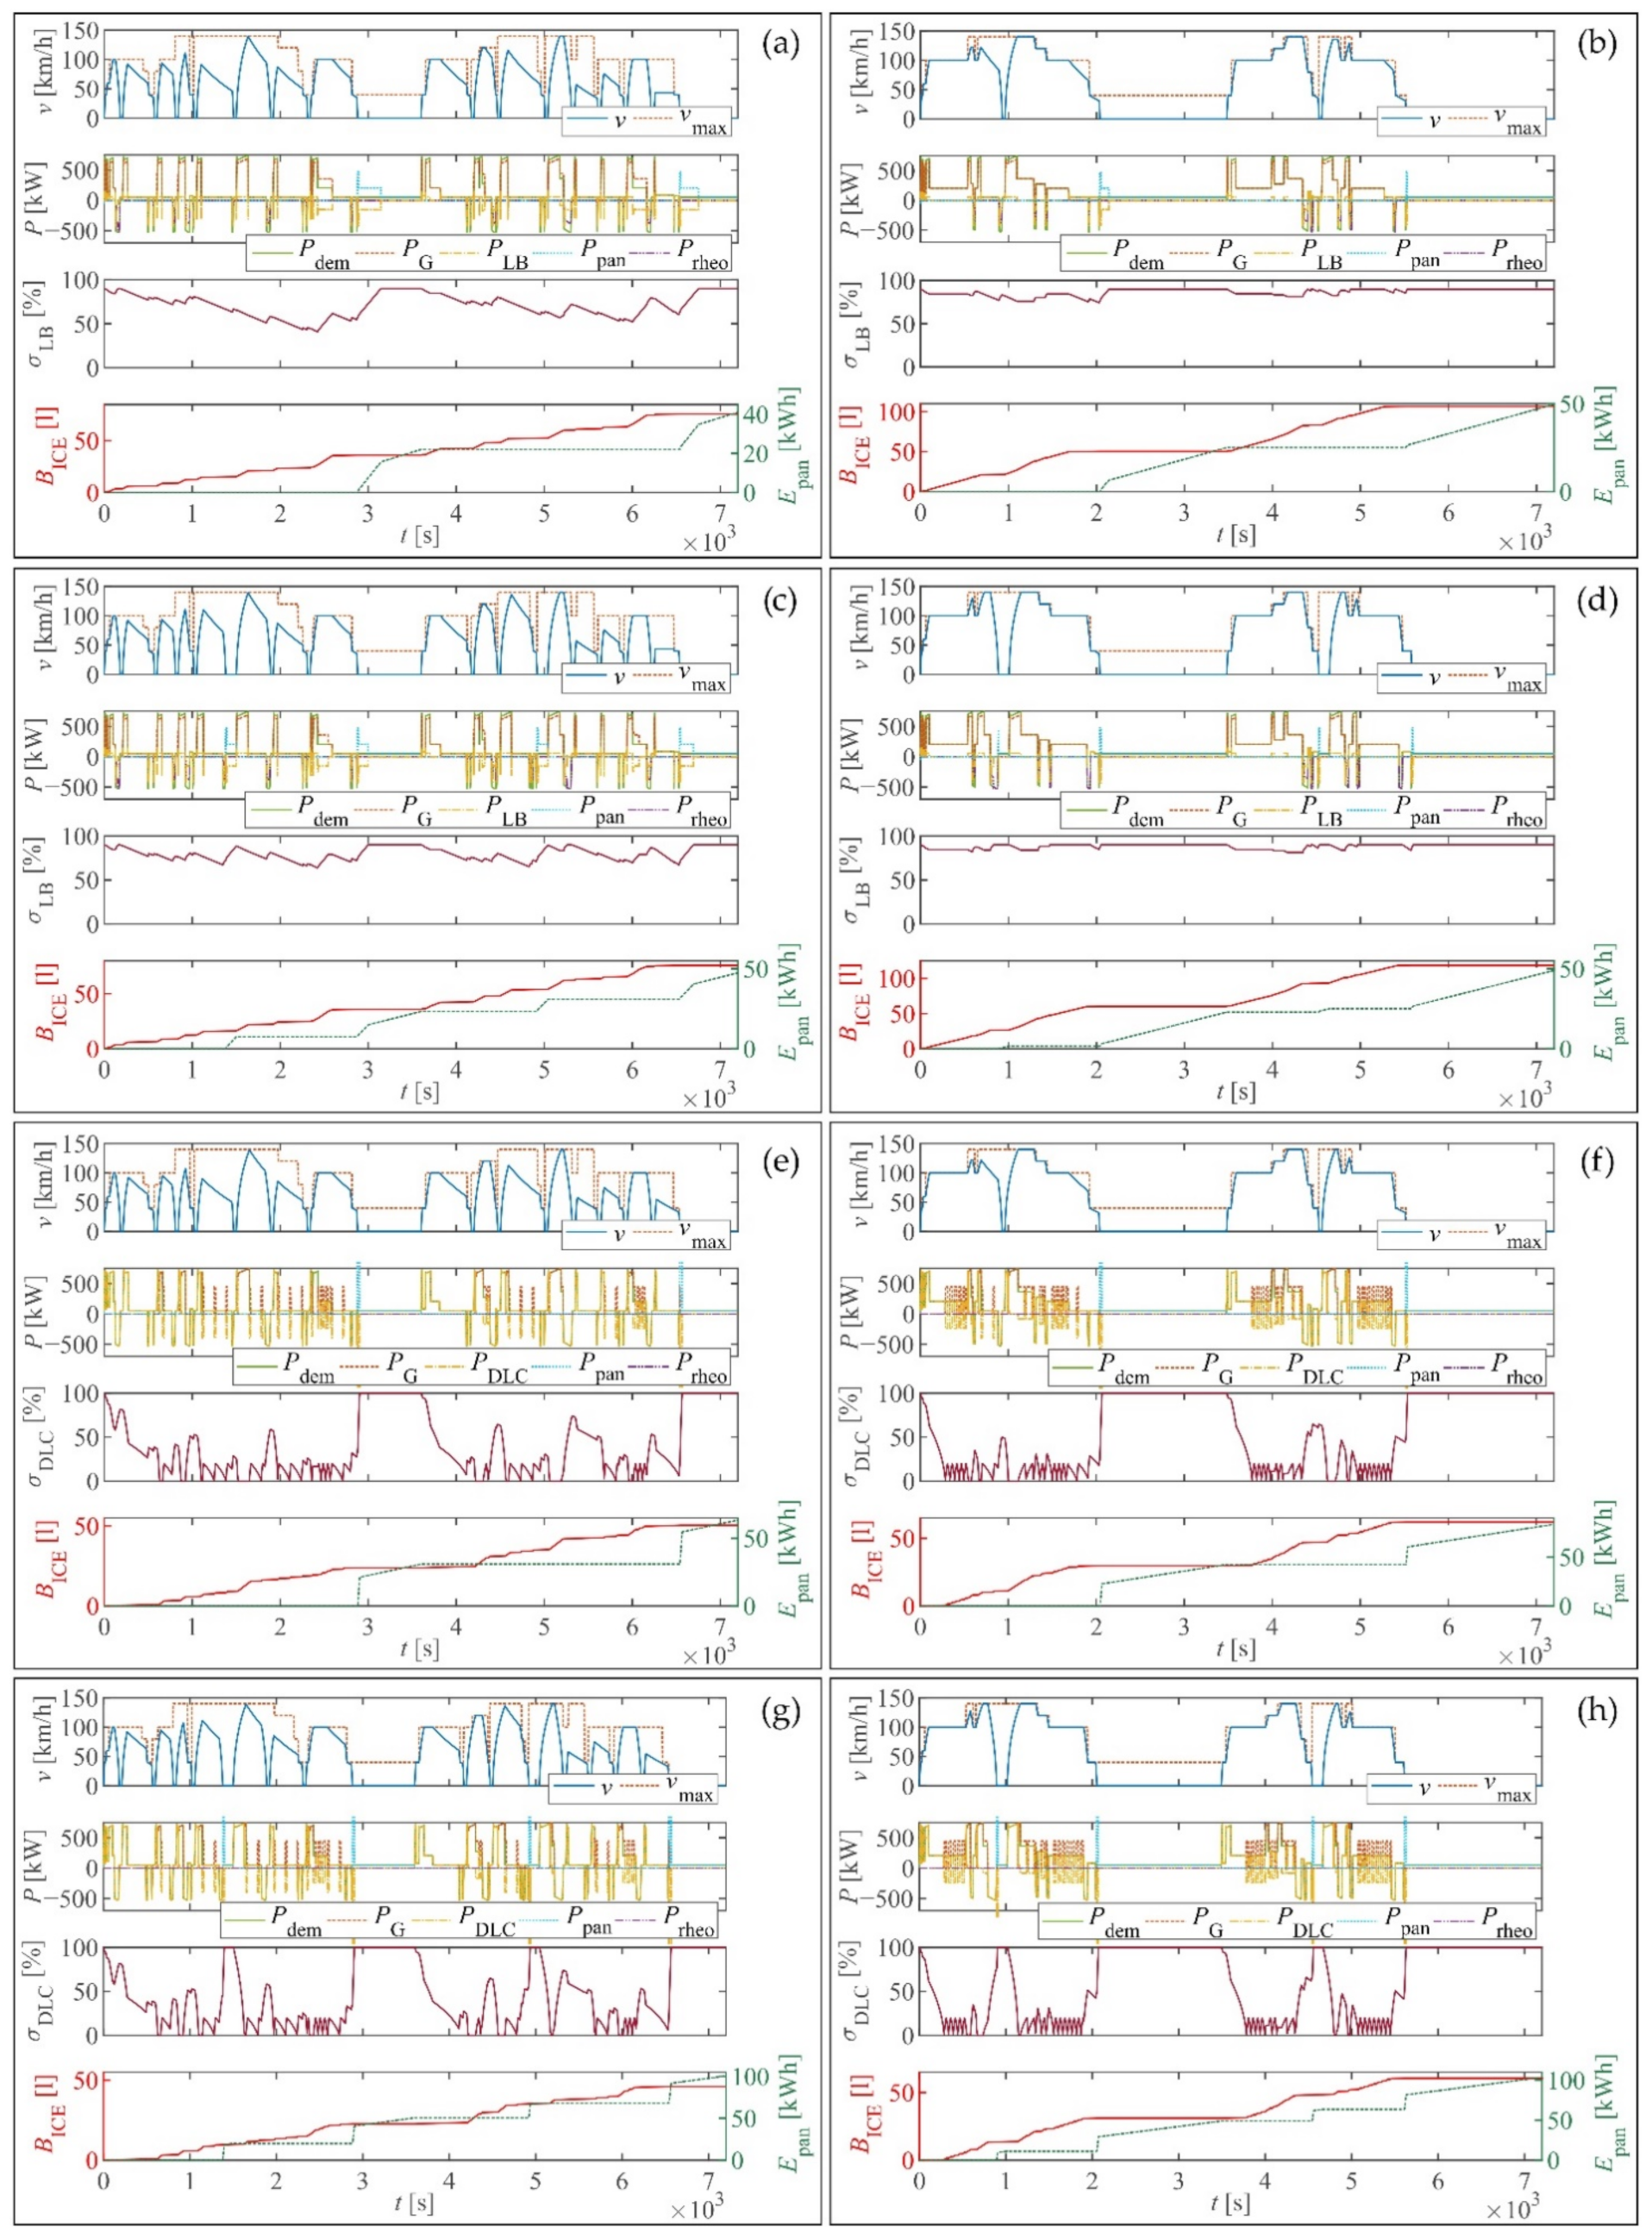
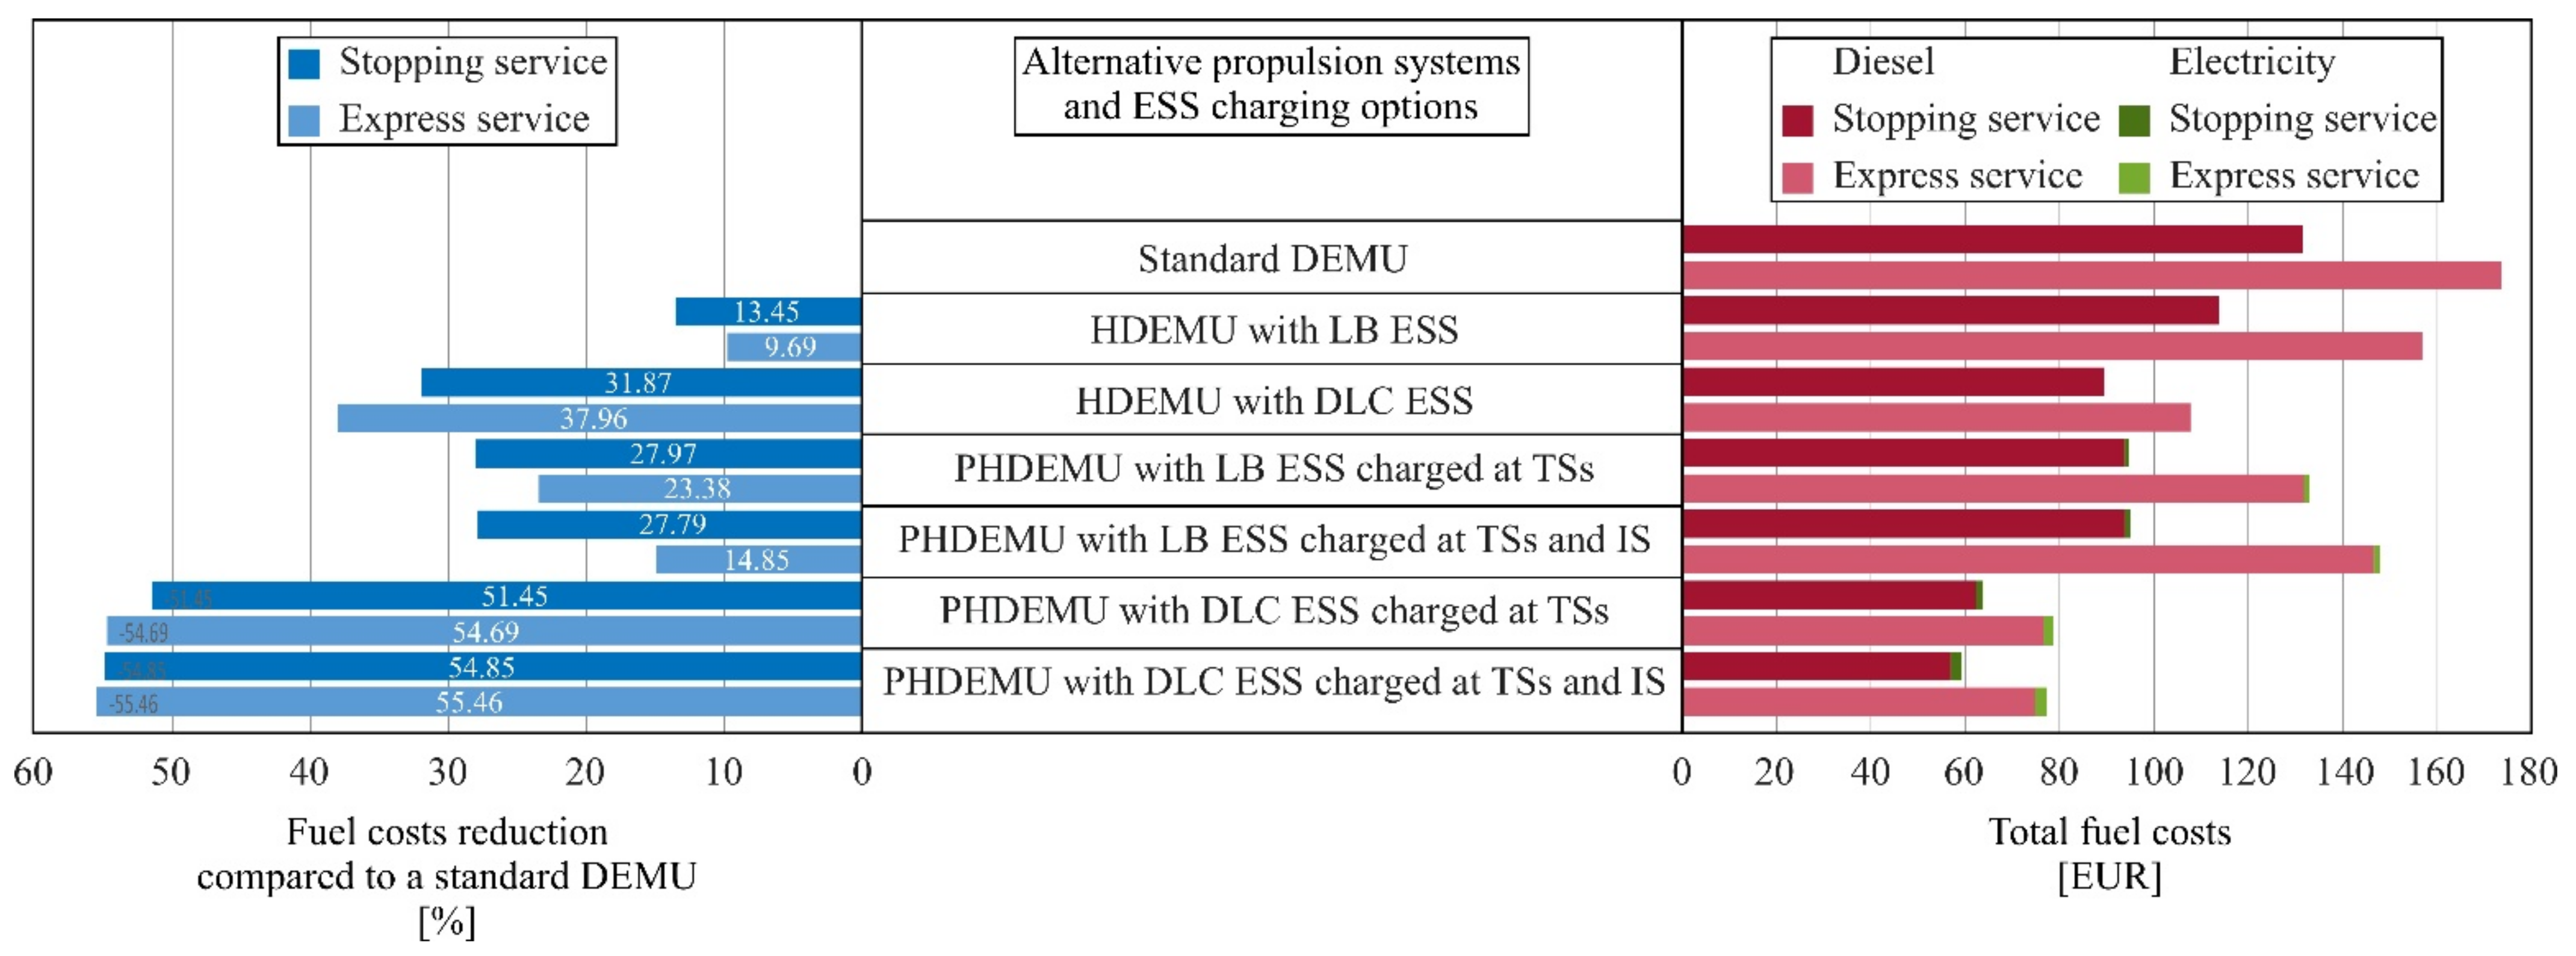
4.3. Comparative Assessment Results

Energy consumption for each of the alternative scenarios was estimated using the MATLAB®/Simulink© simulation model described in Section 3, with the adopted fixed time step Δ t = 0.1   s , the ode3 (Bogacki-Shampine) solver used for numerical integration, and implemented hysteresis cycles of σ LB hyst = 5 % and σ DLC hyst = 20 % for LB and DLC, respectively. Due to its causal nature, the proposed FSM control cannot guarantee the SoC sustenance. Therefore, each HDEMU and PHDEMU configuration was simulated twice, with the initial SoC set to σ ESS = 50 % , and then replaced with the final value obtained in the first simulation run. This allowed for a fair comparison between different configurations. The maximum power from the grid P pan max was determined from the national railway traction grid characteristics, namely 1500 V DC voltage and current limitation of 2000 A [77]. To account for a difference in weight due to additional components, optimized vehicle speed profiles that comply with the timetable, vehicle, and track parameters were pre-calculated using a bi-section algorithm [78] for each vehicle configuration. For the sake of brevity, detailed simulation results are given in Appendix A (Figure A1, Figure A2 and Figure A3), with the main results summarized in Table 4.
The obtained energy consumption was used afterwards in quantifying the total GHG emissions and energy costs, using a consumption-based approach [79], by multiplying the amount of fuel or electricity consumed with the corresponding emission factor and unit cost, respectively. A well-to-wheel approach [80] was adopted in deriving the emission factors to allow for a credible comparison between GHG emissions of different energy carriers, namely diesel fuel and electricity in our case, and to comply with the international norms [81]. Emission factors and energy prices representative for the Netherlands and the year 2020 were used to reflect the analyzed case study and to account for the most recent trends. An emission factor for diesel with 2.6% biofuel content of 3.23 kgCO2e/l and for grey electricity reflecting a national power mix of 0.556 kgCO2e/kWh [82] were assumed. Since all national trains on the electrified lines run on the electricity produced from wind power since 2017 [83], an alternative scenario considered the utilization of green electricity coming from the same source, with the emission factor equal to zero. For the calculation of energy costs, an average diesel price of 1.237 EUR/l [84] and a railway traction electricity price of 0.024137 EUR/kWh [77] were adopted.
The estimated GHG emissions (Table 4) showed significant benefits from hybridization, primarily as a consequence of reduced diesel consumption. Both total GHG emissions for each alternative scenario and estimated relative emissions reduction compared to the standard DEMU are shown in Figure 9. Emission reductions compared to a standard DEMU vehicle range between 9.43% and 56.92%, depending on the type of service and vehicle/charging configuration. The results indicated the stopping pattern, ESS technology selection, and the charging facilities location had a considerable influence. In general, a positive effect from further conversion of a particular hybrid vehicle to its plug-in hybrid counterpart was observed. The DLC ESS demonstrated better performance compared to the LB ESS, both in hybrid and plug-in hybrid alternatives, mainly due to its higher power density and the ability to recuperate total available regenerative braking energy. While the additional charging location at the intermediate stop resulted in further emission reductions for the DLC-based ESS, it showed negative effects for the LB ESS. Finally, utilization of green instead of grey electricity contributed to a further emission reduction of ~6–8% and ~10–16% for PHDEMUs with LB and DLC-based ESS, respectively.
Similar to the GHG emissions, results on energy costs (Table 4 and Figure 10) indicated higher benefits from DLC-based configurations, with cost reductions of 31.87–55.46% compared to 9.69–27.97% savings for vehicles with LB ESS, and with plug-in hybrid vehicles showing better performance than their hybrid counterparts for each scenario. The same negative effect from an additional charging facility in the intermediate stop for PHDEMU with LB ESS was observed. In general, energy cost savings resulted predominantly from the reduction in diesel consumption and a high diesel-to-electricity price ratio.

5. Discussion

The results of the comparative analysis indicate promising potential benefits from the hybridization of a DEMU. A further conversion to its plug-in hybrid counterpart allowed for significantly greater energy savings and the reduction in GHG emissions and costs in all scenarios. The results also provided insight into numerous interrelated factors influencing the vehicle performance, which are further elaborated in this section.
The comparison of estimated energy consumption for the stopping and express service showed considerable impact on the stopping frequency and applied timetable. While frequent stops in the first case offered a higher amount of braking energy, they also required more energy for the high-power acceleration phases. Even though these energy levels were much lower for the considered express service with only one intermediate stop, the obtained total energy demand was higher in all analyzed scenarios. This was mainly due to the short running times defined by the timetable, requiring vehicles running at the maximum speed and preventing them from using the benefits of coasting operation (see speed diagrams in Appendix A). Energy-efficient timetabling approaches [85] could potentially contribute to revising the existing timetable and reducing the overall energy demand for train operation.
The selection of ESS technology plays an important role in defining future powertrain solutions, as identified in the results for HDEMU and PHDEMU vehicles. The DLC-based ESS demonstrated significantly better performance compared to the LB, mainly as a consequence of the differences in their physical characteristics. Due to the low power density, the LB ESS could not cover high power fluctuations, both during traction and braking phases, causing a lack of support to the ICE and significant dissipation of braking energy. On the other hand, DLC allowed for recuperation of total regenerative braking energy and ICE operation in the most-efficient region. However, due to its low energy density, and considering the main criteria in sizing the ESS, it comes at the price of a high total weight, reaching almost 11 tonnes in this case. This raises the question of the feasibility of such a solution, requiring further investigation into the physical constraints [86], including the available volumetric space on the vehicle and maximum axle load as defined by EN 15528 [87], which, in our case, was 20 tonnes corresponding to the track category C for the Northern lines [77]. Combining the individual benefits of LBs and DLCs into a hybrid ESS [88] could be an effective approach in overcoming the limitation of a single-technology ESS. However, this raises significant challenges in terms of the optimal sizing, the complexity of energy management, and the integration of such a solution into the system.
The identified impact of infrastructure and vehicle characteristics, applied timetable, and technology selection imply the need for a comprehensive line-by-line and vehicle-by-vehicle analysis in the case of heterogeneous rolling stock fleets operating on multiple lines. Additionally, external factors and their variability, such as ambient temperature and number of passengers, should be considered. Variations in the number of passengers during the day, and the ambient temperature depending on the season, could potentially have a significant influence on the auxiliaries power load and the overall energy consumption.
Emissions from train operation not only arise due to the fuel or electricity consumption, but also result from a number of direct and indirect sources, including vehicle production and infrastructure construction [89]. Although international standards on emissions calculation and declaration [81] stipulate consideration of only well-to-wheel emissions, the emissions resulting from the production and disposal/replacement of additional system components, including ESSs and stationary charging facilities in our case, should be identified. For instance, recent studies estimated GHG emissions from battery production for electric cars to be in the span of 150–200 kgCO2e per kWh of battery capacity [90], contributing 31–46% to the total GHG impact from vehicle production [91]. Even though these relative contributions would be significantly lower for railway vehicles due to their much higher utilization and longer life cycle, further investigation in terms of detailed life cycle assessment (LCA) [92] is needed in order to assess the overall environmental impact of a particular solution.
Similar to the GHG emissions, next to the fuel/energy-related costs, other investment costs will occur when rolling out a new propulsion system concept. These monetary costs are related to a particular technology and its lifetime, and include initial, maintenance, and replacement costs. Considering the obtained fuel savings for different solutions, high vehicle utilization, and foreseen operation for the next 15 years, it can be assumed that the investment costs would be compensated with the energy savings in a relatively short period of time. However, a comprehensive life cycle costs (LCC) analysis [93] would allow for identification of overall costs and benefits in this investment decision process.

6. Conclusions

This paper presented a comparative assessment of standard, hybrid, and plug-in hybrid propulsion system alternatives for regional diesel-electric multiple unit vehicles. The analysis encompassed the development of a detailed simulation model, which considered different energy storage technologies, namely lithium-ion battery and double-layer capacitor, and the real-time energy management strategies based on finite state machines. Focusing on the regional railway services in the Netherlands, we investigated the hypothetical conversion of a conventional benchmark vehicle found on the network, and provided a simulation-based assessment in terms of overall energy consumption, related greenhouse gas emissions, and monetary costs. With the energy storage systems sized to ensure emission-free and noise-free train operation in terminal stations, the results indicated higher potential benefits from implementing the double-layer capacitor instead of the lithium-ion battery, with an identified need for further investigation on its practical implementation due to the high associated weight. Compared to the standard vehicle, these benefits are reflected in emissions and cost reduction that exceeded 55% for certain scenarios. Positive effects from further conversion of a hybrid to a plug-in hybrid system were observed, with significant impacts of the stopping patterns (type of service), timetable, and the charging facilities configuration.
The presented research is part of a larger project aiming to identify optimal solutions for reducing the total well-to-wheel and life cycle emissions on the regional non-electrified network in the northern Netherlands by analyzing different technical, operational, and policy measures. In this context, extensions of the present work will consider remaining rolling stock and lines, as well as testing and validation of the proposed method using field test data. Further extensions to the current research will include investigation of hydrogen-powered propulsion systems and upstream processes related to the production of alternative fuels, such as biofuels and hydrogen, through a detailed well-to-wheel analysis. The overall impact of vehicle production or refurbishment will be evaluated through LCA and LCC approaches.

Author Contributions

Conceptualization, M.K. and M.V.; methodology, M.K.; software, M.K.; validation, M.K.; writing—original draft preparation, M.K., M.V. and R.M.P.G.; writing—review and editing, M.K., M.V. and R.M.P.G.; visualization, M.K.; supervision, R.M.P.G. All authors have read and agreed to the published version of the manuscript.

Funding

This research received no external funding.

Data Availability Statement

All data is contained within the article.

Acknowledgments

This work is supported by Arriva Personenvervoer Nederland B.V. within the Ph.D. project “Improving sustainability of regional railway services”. The second author would like to thank the Sapienza University of Rome for the support from the PhD student mobility program no. 1879, and the Delft University of Technology for hosting the research visit.

Conflicts of Interest

The authors declare no conflict of interest.

Nomenclature

Abbreviations
ACAlternating current
BEMUBattery-electric multiple unit
DCDirect current
DEMUDiesel-electric multiple unit
DLCDouble-layer capacitor
DMUDiesel multiple unit
DPDynamic programming
ECMSEquivalent consumption minimization strategy
EMElectric motor
EMSEnergy management strategy
ESSEnergy storage system
EVSEElectric vehicle supply equipment
FCMUFuel-cell multiple unit
FSMFinite state machine
GGenerator
GHGGreenhouse gasses
GTWGelenktriebwagen
HDEMUHybrid diesel-electric multiple unit
HEVHybrid electric vehicle
HVACHeating, ventilation, and air conditioning
ICEInternal combustion engine
ISIntermediate stop
LBLithium-ion battery
LCALife cycle assessment
LCCLife cycle costs
LTOLi titanium oxide
NMCNickel manganese cobalt
PHDEMUPlug-in hybrid diesel-electric multiple unit
PHEVPlug-in hybrid electric vehicle
PMPPontryagin’s minimum principle
RBRule-based
RURailway undertaking
SoCState-of-charge
TSTerminal stop
Parameters
a max Maximum acceleration m / s 2
a min Maximum deceleration m / s 2
C DLC Capacitance of the double-layer capacitor F
d w Wheel diameter m
E DLC Energy content of the double-layer capacitor Kwh
E LB max Energy content of the battery Kwh
E LB use Usable energy content of the battery Kwh
F w max Maximum (starting) tractive effort at the wheel N
g Gravitational acceleration m / s 2
i ag Constant gear ratio -
I DLC max , ch Allowed maximum charging current for double-layer capacitor A
I DLC max , dch Allowed maximum discharging current for double-layer capacitor A
I LB cont , ch Allowed maximum continuous charging current of the battery A
I LB cont , dch Allowed maximum continuous discharging current of the battery A
I LB peak , ch Allowed peak (pulse) charging current of the battery A
I LB peak , dch Allowed peak (pulse) discharging current of the battery A
m DLC Weight of the double-layer capacitor kg
m LB Weight of the battery kg
m pax Total weight of passengers kg
m tare Empty vehicle mass kg
m v Total vehicle mass kg
P aux , const Constant auxiliaries power W
p cool Cooling power coefficient -
P EM rated Rated power of the electric motor W
P G opt Optimal level of electrical power from the diesel generator W
P ICE rated Rated power of the internal combustion engine W
P pan max Maximum power from the charging grid W
Q LB Nominal capacity of the battery As
R dch Self-discharging resistance of the double-layer capacitor Ω
R DLC Internal resistance of the double-layer capacitor Ω
R LB ch Battery internal resistance during charging Ω
R LB dch Battery internal resistance during discharging Ω
r 0 Davis equation coefficient (constant term) N
r 1 Davis equation coefficient (linear term) N / M / S
r 2 Davis equation coefficient (quadratic term) [ N / M / S 2 ]
s cr Line-specific critical track section m
s ts Position of the terminal stop m
t peak ch Time limit for the allowed battery pulse charging current s
t peak dch Time limit for the allowed battery pulse discharging current s
U DLC max Maximum voltage of the double-layer capacitor V
U DLC min Minimum voltage of the double-layer capacitor V
U LB max Maximum battery voltage V
U LB min Minimum battery voltage V
v max Maximum velocity m / s
Δ t Simulation (integration) time step s
η ag Constant efficiency of the gearbox -
λ Rotating mass factor -
ρ Fuel density kg / L
σ ESS hyst Energy storage system hysteresis cycle for the state-of-charge -
σ ESS lim State-of-charge limit for the energy storage system -
σ ESS min Minimum state-of-charge for the energy storage system -
σ LB max Maximum battery state-of-charge -
σ LB min Minimum battery state-of-charge -
Dynamic variables
a Vehicle acceleration [ m / s 2 ]
b el Binary indicator for the track electrification status -
B ICE Total fuel consumption L
E pan Total electrical energy consumption Ws
F l a g Binary indicator for the state-of-charge hysteresis cycle -
F w Tractive/braking effort at the wheel N
I DLC Current of the double-layer capacitor A
I DLC max Maximum current of the double-layer capacitor A
I DLC min Minimum current of the double-layer capacitor A
I LB Battery current A
I LB max Maximum battery current A
I LB max , ch Maximum battery charging current defined by the manufacturer A
I LB max , dch Maximum battery discharging current defined by the manufacturer A
I LB min Minimum battery current A
P aux Total auxiliaries power W
P dem Total requested power for traction and auxiliaries W
P DLC Power of the double-layer capacitor W
P DLC max Maximum power of the double-layer capacitor W
P DLC min Minimum power of the double-layer capacitor W
P EM Electric power of the electric motor W
P ESS max Maximum power of the energy storage system W
P ESS min Minimum power of the energy storage system W
P G Electrical output power of the generator W
P ICE Mechanical output power of the internal combustion engine W
P LB Power of the battery W
P LB max Maximum power of the battery W
P LB min Minimum power of the battery W
P pan Electric power received via pantograph W
R c Curve resistances N
R g Grade resistances N
R LB Battery internal resistance Ω
R v Vehicle resistances N
s Distance traveled m
t Time s
t cnt ch Battery pulse charging time counter s
t cnt dch Battery pulse discharging time counter s
T EM Torque at the mechanical output of the electric motor Nm
T w Torque at the wheel Nm
U DLC Terminal voltage of the double-layer capacitor V
U LB Battery terminal voltage V
U OC Battery open circuit voltage V
v Vehicle velocity m / s
γ Angle of the slope rad
η EM Efficiency of the electric motor -
η G Efficiency of the generator -
σ DLC State-of-charge of the double-layer capacitor -
σ LB Battery state-of-charge -
ϕ Curve radius m
ψ Specific fuel consumption Kg / Ws
ω EM Rotational speed of the electric motor rad / s
ω ICE Rotational speed of the internal combustion engine rad / s
ω w Rotational speed of the wheel rad / s

Appendix A

Figure A1. Simulation results for a standard DEMU vehicle on (a) stopping service and (b) express service.
Energies 14 05920 g0a1
Figure A2. Simulation results for a HDEMU vehicle on stopping and express service, respectively: (a,b) with LB ESS; and (c,d) with DLC ESS.
Energies 14 05920 g0a2
Figure A3. Simulation results for a PHDEMU vehicle on stopping and express service, respectively: (a,b) LB ESS with charging at TSs; (c,d) LB ESS with charging at TSs and IS; (e,f) DLC ESS with charging at TSs; and (g,h) DLC ESS with charging at TSs and IS.
Energies 14 05920 g0a3

References

  1. UN. Kyoto Protocol to the United Nations Framework Convention on Climate Change, Kyoto. 1998. Available online: https://unfccc.int/resource/docs/convkp/kpeng.pdf (accessed on 22 January 2021).
  2. UN. Paris Agreement, Paris. 2015. Available online: https://unfccc.int/sites/default/files/english_paris_agreement.pdf (accessed on 22 January 2021).
  3. Di Domenico, G.C.; Dick, C.T. Methods of Analyzing and Comparing Energy Efficiency of Passenger Rail Systems. Transp. Res. Rec. 2015, 2475, 54–62. [Google Scholar] [CrossRef] [Green Version]
  4. UIC; CER. Moving Towards Sustainable Mobility: A Strategy for 2030 and Beyond for the European Railway Sector, Paris. 2012. Available online: http://www.cer.be/sites/default/files/publication/CER-UIC_Sustainable_Mobility_Strategy_-_SUMMARY.pdf (accessed on 28 January 2021).
  5. RailwayTechnology. Bombardier Talent 3 Battery Train. Available online: https://www.railway-technology.com/projects/bombardier-talent-3-battery-train/ (accessed on 5 April 2021).
  6. Siemens. Desiro ML ÖBB Cityjet eco for ÖBB Personenverkehr AG. Available online: https://assets.new.siemens.com/siemens/assets/api/uuid:b26911b1-2b0e-48b4-b593-81adbf032d75/db-desiro-ml-oebb-cityjet-eco-e.pdf (accessed on 5 April 2021).
  7. Siemens. Mireo Plus B Ortenau for SFBW, Baden-Württemberg, Germany. Available online: https://assets.new.siemens.com/siemens/assets/api/uuid:636c61e0-bd2d-4f97-a2c7-78e690792a44/mors-b10022-00dbmireoplusortenauenus-72_original.pdf (accessed on 5 April 2021).
  8. RailTech. Stadler Gets First Order for Akku Battery-Powered Trains. Available online: https://www.railtech.com/rolling-stock/2019/06/20/stadler-gets-first-order-for-akku-battery-powered-trains/?gdpr=accept (accessed on 5 April 2021).
  9. Alstom. Alstom’s Hydrogen Train Enters Regular Passenger Service in Austria. Available online: https://www.alstom.com/press-releases-news/2020/9/alstoms-hydrogen-train-enters-regular-passenger-service-austria (accessed on 5 April 2021).
  10. FuelCellWorks. Siemens Mireo Plus H Fuel Cell Hydrogen Train—The Middle Distance Champion. Available online: https://fuelcellsworks.com/news/siemens-mireo-plus-h-fuel-cell-hydrogen-train-the-middle-distance-champion/ (accessed on 5 April 2021).
  11. IRJ. Zillertalbahn Hydrogen Train Design Revealed. Available online: https://www.railjournal.com/fleet/zillertalbahn-hydrogen-train-design-revealed/ (accessed on 5 April 2021).
  12. Bai, S.; Liu, C. Overview of energy harvesting and emission reduction technologies in hybrid electric vehicles. Renew. Sustain. Energy Rev. 2021, 147, 111188. [Google Scholar] [CrossRef]
  13. Fuhs, A. Hybrid Vehicles, 1st ed.; CRC Press: Boca Raton, FL, USA, 2008. [Google Scholar] [CrossRef]
  14. Doucette, T.T.; McCulloch, M.D. Modeling the prospects of plug-in hybrid electric vehicles to reduce CO2 emissions. Appl. Energy 2011, 88, 2315–2323. [Google Scholar] [CrossRef]
  15. Orecchini, F.; Santiangeli, A. Automakers’ powertrain options for hybrid and electric vehicles. In Electric and Hybrid Vehicles; Elsevier: Amsterdam, The Netherlands, 2010; pp. 579–636. [Google Scholar]
  16. Orecchini, F.; Santiangeli, A.; Dell’Era, A. EVs and HEVs using lithium-ion batteries. In Lithium-Ion Batteries; Elsevier: Amsterdam, The Netherlands, 2014; pp. 205–248. [Google Scholar]
  17. Williamson, S.S. Energy Management Strategies for Electric and Plug-in Hybrid Electric Vehicles; Springer: New York, NY, USA, 2013. [Google Scholar]
  18. EC. Public Report: Ultra Low Emission Vehicle—Transport Using Advanced Propulsion 2 (ULEV-TAP II); EC: Erlangen, Germany, 2005. [Google Scholar]
  19. Marsilla, M. CleanER-D Deliverable 7.5.4: Future Scenarios and Recommendations for Implementation of Hybrid Solutions. 2013. Available online: http://www.cleaner-d.eu/deliverables.htm (accessed on 9 February 2021).
  20. Hillmansen, S.; Roberts, C.; Mcgordon, A.; Jennings, P. Concept Validation for Hybrid Trains. Final Report DfTRG/0078/2007, Birmingham. 2008. Available online: https://www.birmingham.ac.uk/Documents/college-eps/railway/Hybirdconceptfinal5.pdf (accessed on 14 February 2021).
  21. Hillmansen, S.; Roberts, C.; Mcgordon, A.; Jennings, P. DMU Hybrid Concept Evaluation. Final Report DfTRG/0078/2007, Birmingham. 2009. Available online: https://www.birmingham.ac.uk/Documents/college-eps/railway/HybridRailReportDMUV1.pdf (accessed on 14 February 2021).
  22. Railway Gazette International. Hybrid Drive Demonstrates 15% Fuel Saving. Available online: https://www.railwaygazette.com/news/traction-rolling-stock/single-view/view/hybrid-drive-demonstrates-15-fuel-saving.html (accessed on 17 May 2021).
  23. Fujii, T.; Teraya, N.; Osawa, M. Special edition paper Development of an NE train. JR EAST Tech. Rev. 2004, 4, 62–70. Available online: https://www.jreast.co.jp/e/development/tech/pdf_4/Tech-no.4-62-70.pdf (accessed on 2 April 2021).
  24. Shiraki, N.; Satou, H.; Arai, S. A hybrid system for diesel railcar series Ki-Ha E200. In Proceedings of the 2010 International Power Electronics Conference—ECCE ASIA, Sapporo, Japan, 21–24 June 2010; pp. 2853–2858. [Google Scholar] [CrossRef]
  25. Engel, B.; Soefker, C. The Innovative Traction System with the Flywheel of the LIREXTM. In Proceedings of the World Congress on Railway Research, Cologne, Germany, 25–29 November 2001. [Google Scholar]
  26. Research and Technology Centre of Deutsche Bahn AG. Applications for energy storage flywheels in vehicles of Deutsche Bahn AG. In Proceedings of the World Congress on Railway Research, Cologne, Germany, 25–29 November 2001. [Google Scholar]
  27. INSIDEEVs. Meet Audi’s Plug-In Hybrid Locomotive. Available online: https://insideevs.com/news/328130/meet-audis-plug-in-hybrid-locomotive/ (accessed on 1 June 2021).
  28. Alstom. Alstom to Supply Two H3 Hybrid Shunting Locomotives for Audi. Available online: https://www.alstom.com/press-releases-news/2015/2/alstom-to-supply-two-h3-hybrid-shunting-locomotives-for-audi (accessed on 1 June 2021).
  29. Alstom. Alstom to Deliver Two Prima H3 Shunting Locomotives to Metrans. Available online: https://www.alstom.com/press-releases-news/2016/2/alstom-to-deliver-two-prima-h3-shunting-locomotives-to-metrans (accessed on 1 June 2021).
  30. Railcolor News. Romania’s First Hybrid Locomotive Design Plugs-in to Sustainability. Available online: https://railcolornews.com/2018/02/28/ro-romanias-first-hybrid-locomotive-design-plugs-in-to-sustainability/ (accessed on 1 June 2021).
  31. Masatsuki, I. Development of the Battery Charging System for the New Hybrid Train that Combines Feeder Line and the Storage Battery. In Proceedings of the 2010 International Power Electronics Conference—ECCE ASIA, Sapporo, Japan, 21–24 June 2010; pp. 3128–3135. [Google Scholar] [CrossRef]
  32. Masatsuki, I. Development of Catenary and Battery powered hybrid railcar system. In Proceedings of the 9th World Congress on Railwau Reearch, Lille, France, 22–26 May 2011. [Google Scholar]
  33. Hirose, H.; Yoshida, K.; Shibanuma, K. Development of catenary and storage battery hybrid train system. In Proceedings of the 2012 Electrical Systems for Aircraft, Railway and Ship Propulsion, Bologna, Italy, 16–18 October 2012; pp. 1–4. [Google Scholar] [CrossRef]
  34. Kono, Y.; Shiraki, N.; Yokoyama, H.; Furuta, R. Catenary and storage battery hybrid system for electric railcar series EV-E301. In Proceedings of the 2014 International Power Electronics Conference (IPEC-Hiroshima 2014—ECCE ASIA), Hiroshima, Japan, 18–21 May 2014; pp. 2120–2125. [Google Scholar] [CrossRef]
  35. Shiraki, N.; Tokito, K.; Yokozutsumi, R. Propulsion system for catenary and storage battery hybrid electric railcar series EV-E301. In Proceedings of the 2015 International Conference on Electrical Systems for Aircraft, Railway, Ship Propulsion and Road Vehicles (ESARS), Aachen, Germany, 3–5 March 2015; pp. 1–7. [Google Scholar] [CrossRef]
  36. Mwambeleko, J.J.; Kulworawanichpong, T. Battery electric multiple units to replace diesel commuter trains serving short and idle routes. J. Energy Storage 2017, 11, 7–15. [Google Scholar] [CrossRef]
  37. Kapetanović, M.; Núñez, A.; van Oort, N.; Goverde, R.M.P. Reducing fuel consumption and related emissions through optimal sizing of energy storage systems for diesel-electric trains. Appl. Energy 2021, 294, 117018. [Google Scholar] [CrossRef]
  38. Sorrentino, M.; Serge Agbli, K.; Hissel, D.; Chauvet, F.; Letrouve, T. Application of dynamic programming to optimal energy management of grid-independent hybrid railcars. Proc. Inst. Mech. Eng. Part F J. Rail Rapid Transit 2021, 235, 236–247. [Google Scholar] [CrossRef]
  39. Ogawa, T.; Yoshihara, H.; Wakao, S.; Kondo, K.; Kondo, M. Energy consumption analysis of FC-EDLC hybrid railway vehicle by dynamic programming. In Proceedings of the European Conference on Power Electronics and Applications, Aalborg, Denamrk, 2–5 September 2007; pp. 1–8. [Google Scholar] [CrossRef]
  40. Leska, M.; Aschemann, H. Fuel-optimal combined driving strategy and energy management for a parallel hybrid electric railway vehicle. In Proceedings of the 20th International Conference on Methods and Models in Automation and Robotics, MMAR 2015, Miedzyzdroje, Poland, 24–27 August 2015; pp. 1127–1132. [Google Scholar] [CrossRef]
  41. Peng, H.; Li, J.; Thul, A.; Deng, K.; Ünlübayir, C.; Lowenstein, L.; Hameyer, K. A scalable, causal, adaptive rule-based energy management for fuel cell hybrid railway vehicles learned from results of dynamic programming. eTransportation 2020, 4, 100057. [Google Scholar] [CrossRef]
  42. Leska, M.; Prabel, R.; Aschemann, H.; Rauh, A. Optimal Operating Strategy for Hybrid Railway Vehicles based on a Sensitivity Analysis. IFAC Proc. Vol. 2014, 47, 942–947. [Google Scholar] [CrossRef] [Green Version]
  43. Leska, M.; Aschemann, H.; Melzer, M.; Meinert, M. Comparative Calculation of the Fuel-Optimal Operating Strategy for Diesel Hybrid Railway Vehicles. Int. J. Appl. Math. Comput. Sci. 2017, 27, 323–336. [Google Scholar] [CrossRef] [Green Version]
  44. Torreglosa, J.P.; Jurado, F.; García, P.; Fernández, L.M. Hybrid fuel cell and battery tramway control based on an equivalent consumption minimization strategy. Control. Eng. Pract. 2011, 19, 1182–1194. [Google Scholar] [CrossRef]
  45. Peng, H.; Li, J.; Löwenstein, L.; Hameyer, K. A scalable, causal, adaptive energy management strategy based on optimal control theory for a fuel cell hybrid railway vehicle. Appl. Energy 2020, 267, 114987. [Google Scholar] [CrossRef]
  46. Liu, J.; Wu, X.; Li, H.; Qi, L. An optimal method of the energy consumption for fuel cell hybrid tram. Int. J. Hydrogen Energy 2020, 45, 20304–20311. [Google Scholar] [CrossRef]
  47. Zhang, W.; Li, J.; Xu, L.; Ouyang, M. Optimization for a fuel cell/battery/capacity tram with equivalent consumption minimization strategy. Energy Convers. Manag. 2017, 134, 59–69. [Google Scholar] [CrossRef]
  48. Li, H.; Ravey, A.; N’Diaye, A.; Djerdir, A. Online adaptive equivalent consumption minimization strategy for fuel cell hybrid electric vehicle considering power sources degradation. Energy Convers. Manag. 2019, 192, 133–149. [Google Scholar] [CrossRef]
  49. Lanneluc, C.; Pouget, J.; Poline, M.; Chauvet, F.; Gerbaud, L. Optimal Energy Management of a Hybrid Train: Focus on Saving Braking Energy. In Proceedings of the 2017 IEEE Vehicle Power and Propulsion Conference (VPPC), Belfort, France, 11–14 December 2017; pp. 1–6. [Google Scholar] [CrossRef]
  50. Dittus, H.; Hülsebusch, D.; Ungethüm, J. Reducing DMU fuel consumption by means of hybrid energy storage. Eur. Transp. Res. Rev. 2011, 3, 149–159. [Google Scholar] [CrossRef] [Green Version]
  51. García-Garre, A.; Gabaldón, A. Analysis, Evaluation and Simulation of Railway Diesel-Electric and Hybrid Units as Distributed Energy Resources. Appl. Sci. 2019, 9, 3605. [Google Scholar] [CrossRef] [Green Version]
  52. Spiryagin, M.; Cole, C.; Sun, Y.Q.; McClanachan, M.; Spiryagin, V.; McSweeney, T. Design and Simulation of Rail Vehicles, 1st ed.; Taylor & Francis Group, LLC: Boca Raton, FL, USA, 2014. [Google Scholar]
  53. Vazquez, S.; Lukic, S.M.; Galvan, E.; Franquelo, L.G.; Carrasco, J.M. Energy storage systems for transport and grid applications. IEEE Trans. Ind. Electron. 2010, 57, 3881–3895. [Google Scholar] [CrossRef] [Green Version]
  54. Ghaviha, N.; Campillo, J.; Bohlin, M.; Dahlquist, E. Review of Application of Energy Storage Devices in Railway Transportation. Energy Procedia 2017, 105, 4561–4568. [Google Scholar] [CrossRef]
  55. Meinert, M.; Prenleloup, P.; Schmid, S.; Palacin, R. Energy storage technologies and hybrid architectures for specific diesel-driven rail duty cycles: Design and system integration aspects. Appl. Energy 2015, 157, 619–629. [Google Scholar] [CrossRef]
  56. Xu, L.; Mueller, C.D.; Li, J.; Ouyang, M.; Hu, Z. Multi-objective component sizing based on optimal energy management strategy of fuel cell electric vehicles. Appl. Energy 2015, 157, 664–674. [Google Scholar] [CrossRef]
  57. Cipek, M.; Pavković, D.; Kljaić, Z.; Mlinarić, T.J. Assessment of battery-hybrid diesel-electric locomotive fuel savings and emission reduction potentials based on a realistic mountainous rail route. Energy 2019, 173, 1154–1171. [Google Scholar] [CrossRef]
  58. Pröhl, L. OPEUS Deliverable DO2.1—OPEUS Simulation Methodology, EU-Project OPEUS (S2R-OC-CCA-02-2015); University of Rostock: Rostock, Germany, 2017. [Google Scholar]
  59. Pröhl, L. OPEUS Deliverable DO2.2—OPEUS Simulation Tool, EU-Project OPEUS (S2R-OC-CCA-02-2015); University of Rostock: Rostock, Germany, 2017. [Google Scholar]
  60. Davis, W.J. The tractive resistance of electric locomotives and cars. Gen. Electr. Rev. 1926, 29, 685–707. [Google Scholar]
  61. Brünger, O.; Dahlhaus, E. Running time estimation. In Railway Timetabling & Operations; Hansen, I.A., Pachl, J., Eds.; Eurailpress: Hamburg, Germany, 2014; pp. 65–89. [Google Scholar]
  62. Huerlimann, D.; Nash, A. Opentrack-Simulation of Railway Networks, User Manual Version 1.3.; ETH Zurich, Institute for Transportation Planning and Systems: Zurich, Switzerland, 2003. [Google Scholar]
  63. Leska, M.; Gruning, T.; Aschemann, H.; Rauh, A. Optimization of the longitudinal dynamics of parallel hybrid railway vehicles. In Proceedings of the 2012 IEEE International Conference on Control Applications, Dubrovnik, Croatia, 3–5 October 2012; pp. 202–207. [Google Scholar] [CrossRef]
  64. Prohl, L.; Aschemann, H. Grey Wolf optimisation of an operating strategy for energy storage systems in electrically driven railway vehicles. In Proceedings of the 18th European Control Conference ECC, Naples, Italy, 25–28 June 2019; pp. 1908–1913. [Google Scholar] [CrossRef]
  65. Schmid, S.; Ebrahimi, K.; Pezouvanis, A.; Commerell, W. Model-based comparison of hybrid propulsion systems for railway diesel multiple units. Int. J. Rail Transp. 2017, 6, 16–37. [Google Scholar] [CrossRef] [Green Version]
  66. Han, Y.; Meng, X.; Zhang, G.; Li, Q.; Chen, W. An energy management system based on hierarchical control and state machine for the PEMFC-battery hybrid tramway. In Proceedings of the IEEE Transportation Electrification Conference and Expo, Asia-Pacific (ITEC Asia-Pacific), Harbin, China, 7–10 August 2017; pp. 1–5. [Google Scholar] [CrossRef]
  67. Yan, Y.; Huang, W.; Liu, J.; Li, Q.; Chen, W. The Control Strategy of Fuel Cell Hybrid Tram Based on State Machine Control. In Proceedings of the IEEE Sustainable Power and Energy Conference (iSPEC), Beijing, China, 21–23 November 2019; pp. 699–703. [Google Scholar] [CrossRef]
  68. Li, Q.; Yang, H.; Han, Y.; Li, M.; Chen, W. A state machine strategy based on droop control for an energy management system of PEMFC-battery-supercapacitor hybrid tramway. Int. J. Hydrogen Energy 2016, 41, 16148–16159. [Google Scholar] [CrossRef]
  69. Paukert, H. CleanER-D Deliverable 7.2.1: Detailed Specification: Parameters Definition. 2011. Available online: http://www.cleaner-d.eu/deliverables.htm (accessed on 9 January 2021).
  70. Pourabdollah, M.; Murgovski, N.; Grauers, A.; Egardt, B. Optimal Sizing of a Parallel PHEV Powertrain. IEEE Trans. Veh. Technol. 2013, 62, 2469–2480. [Google Scholar] [CrossRef] [Green Version]
  71. Giro Batalla, R.; Feenstra, M. Energy Consumption in GTW DMU Trains—ECO Driving; Project Statement; Arriva Nederland: Sunderland, UK, 2012. [Google Scholar]
  72. Stadler Bussnang AG. GTW DMU-2 2/6 and GTW 2/8 Low-Floor for Arriva, Netherlands. Available online: https://www.stadlerrail.com/media/pdf/garr1008e.pdf (accessed on 15 January 2021).
  73. Takami, N.; Inagaki, H.; Tatebayashi, Y.; Saruwatari, H.; Honda, K.; Egusa, S. High-power and long-life lithium-ion batteries using lithium titanium oxide anode for automotive and stationary power applications. J. Power Sources 2013, 244, 469–475. [Google Scholar] [CrossRef]
  74. Toshiba. SCiBTM Rechargeable Battery. Available online: https://www.global.toshiba/ww/products-solutions/battery/scib.html (accessed on 16 February 2021).
  75. SAFT; UNEW. OPEUS Deliverable D6.1—Innovative Technologies Outlook Update. EUproject OPEUS (S2R-OC-CCA-02-2015). 2017. Available online: https://projects.shift2rail.org/s2r_ip4_n.aspx?p=OPEUS (accessed on 16 February 2021).
  76. Maxwell. 125 Volt Transportation Module. 2021. Available online: https://www.maxwell.com/products/ultracapacitors/125v-tran-modules# (accessed on 16 February 2021).
  77. ProRail. Network Statement 2020. Available online: https://www.prorail.nl/siteassets/homepage/samenwerken/vervoerders/documenten/network-statement-2020-prorail-version-1.6.pdf (accessed on 21 March 2021).
  78. Leska, M.; Gruning, T.; Aschemann, H.; Rauh, A. Optimal trajectory planning for standard and hybrid railway vehicles with a hydro-mechanic transmission. In Proceedings of the European Control Conference ECC, Zurich, Switzerland, 17–19 July 2013; pp. 4550–4555. [Google Scholar] [CrossRef]
  79. Kirschstein, T.; Meisel, F. GHG-emission models for assessing the eco-friendliness of road and rail freight transports. Transp. Res. Part B Methodol. 2015, 73, 13–33. [Google Scholar] [CrossRef]
  80. Hoffrichter, A.; Miller, A.R.; Hillmansen, S.; Roberts, C. Well-to-wheel analysis for electric, diesel and hydrogen traction for railways. Transp. Res. Part D Transp. Environ. 2012, 17, 28–34. [Google Scholar] [CrossRef]
  81. CEN. Standard EN 16258: Methodology for Calculation and Declaration of Energy Consumption and GHG Emissions of Transport Services (Freight and Passengers). Available online: https://standards.cen.eu/dyn/www/f?p=204:110:0::::FSP_PROJECT:32935&cs=12646506D5D79DADCB74CA2C32A2DAA45 (accessed on 3 March 2021).
  82. CO2emissiefactoren. 2020 List of CO2 Emission Factors [in Dutch]. Available online: https://www.co2emissiefactoren.nl/wijzigingen-overzicht/ (accessed on 9 May 2021).
  83. EcoWatch. Dutch Trains Are World’s First to Run on 100% Wind Power. Available online: https://www.ecowatch.com/dutch-trains-wind-energy-2187547588.html (accessed on 29 March 2021).
  84. CBS. Pump Prices for Motor Fuels; Location Gas Station, Fuel Type [in Dutch]. Available online: https://opendata.cbs.nl/statline/?ts=1585295852166#/CBS/nl/dataset/81567NED/table (accessed on 1 May 2021).
  85. Scheepmaker, G.M.; Goverde, R.M.P.; Kroon, L.G. Review of energy-efficient train control and timetabling. Eur. J. Oper. Res. 2017, 257, 355–376. [Google Scholar] [CrossRef] [Green Version]
  86. Hoffrichter, A.; Roberts, C.; Hillmansen, S. Conceptual propulsion system design for a hydrogen-powered regional train. IET Electr. Syst. Transp. 2016, 6, 56–66. [Google Scholar] [CrossRef] [Green Version]
  87. CEN. EN 15528: Railway Applications—Line Categories for Managing the Interface Between Load Limits of Vehicles and Infrastructure. 2015. Available online: https://www.en-standard.eu/din-en-15528-railway-applications-line-categories-for-managing-the-interface-between-load-limits-of-vehicles-and-infrastructure/ (accessed on 21 February 2021).
  88. Peng, F.; Zhao, Y.; Chen, T.; Zhang, X.; Chen, W.; Zhou, D.; Li, Q.F. Development of robust suboptimal real-time power sharing strategy for modern fuel cell based hybrid tramways considering operational uncertainties and performance degradation. Appl. Energy 2018, 226, 503–521. [Google Scholar] [CrossRef]
  89. Esters, T.; Marinov, M. An analysis of the methods used to calculate the emissions of rolling stock in the UK. Transp. Res. Part D Transp. Environ. 2014, 33, 1–16. [Google Scholar] [CrossRef]
  90. Romare, M.; Dahllöf, L. The Life Cycle Energy Consumption and Greenhouse Gas Emissions from Lithium-Ion Batteries. 2017. Available online: http://www.energimyndigheten.se/globalassets/forskning--innovation/transporter/c243-the-life-cycle-energy-consumption-and-co2-emissions-from-lithium-ion-batteries-.pdf (accessed on 20 June 2021).
  91. Ellingsen, L.A.W.; Singh, B.; Strømman, A.H. The size and range effect: Lifecycle greenhouse gas emissions of electric vehicles. Environ. Res. Lett. 2016, 11, 054010. [Google Scholar] [CrossRef]
  92. Jones, H.; Moura, F.; Domingos, T. Life cycle assessment of high-speed rail: A case study in Portugal. Int. J. Life Cycle Assess. 2017, 22, 410–422. [Google Scholar] [CrossRef]
  93. García Márquez, F.P.; Lewis, R.W.; Tobias, A.M.; Roberts, C. Life cycle costs for railway condition monitoring. Transp. Res. Part E Logist. Transp. Rev. 2008, 44, 1175–1187. [Google Scholar] [CrossRef]
Figure 1. Simplified schematic representation of (a) standard, (b) hybrid, and (c) plug-in hybrid system architectures for a diesel-electric multiple unit vehicle.
Energies 14 05920 g001
Figure 2. Layout of the simulation model for the assessment of the alternative diesel-electric multiple-unit propulsion system configurations.
Energies 14 05920 g002
Figure 3. Equivalent electrical circuit for the lithium-ion battery-based energy storage system.
Energies 14 05920 g003
Figure 4. Equivalent electrical circuit for the double-layer capacitor-based energy storage system.
Energies 14 05920 g004
Figure 5. Finite state machine control for hybrid propulsion system.
Energies 14 05920 g005
Figure 6. Finite state machine control for plug-in hybrid propulsion system.
Energies 14 05920 g006
Figure 7. (a) Efficiency map of an electric motor; (b) specific fuel consumption of an internal consumption engine; and (c) lithium-ion battery module open circuit voltage as a function of state-of-charge.
Energies 14 05920 g007
Figure 8. (a) Position and (b) schematic representation of the Northern lines in the Netherlands; and (c) track layout for the railway line Leeuwarden-Groningen with indicated locations for charging facilities, stops for stopping and express service, track geometry, and maximum allowed speed.
Energies 14 05920 g008
Figure 9. Total GHG emissions depending on the propulsion system, charging location, and electricity production configurations; and estimated potential reduction compared to a standard diesel-electric multiple unit.
Energies 14 05920 g009
Figure 10. Estimated fuel costs for different propulsion system and charging location configuration, and potential reduction compared to a standard diesel-electric multiple unit.
Energies 14 05920 g010
Table 1. Standard GTW 2/6 DEMU simulation parameters.
ParameterUnitValueDescription
m tare t70.4Tare weight 1
λ -0.05Rotating mass factor 2
m pax t7Total passengers weight 3
r 0 N1001Davis equation coefficient (constant term) 2
r 1 N/(km/h)22.3Davis equation coefficient (linear term) 2
r 2 N/(km/h)20.1Davis equation coefficient (quadratic term) 2
d w m0.86Powered wheel diameter 4
i ag -1.7218Axle gear ratio 5
η ag -0.97Axle gear efficiency 6
v max km/h140Maximum velocity 4
a max m/s21.05Maximum acceleration 2
a min m/s2−1Maximum deceleration 2
F w max kN80Maximum (starting) tractive effort at the wheel 4
P w max kW600Maximum power at the wheel 4
P EM rated kW2 × 400EM rated power 1
P ICE rated kW2 × 390ICE rated power 1
P aux , const kW50Constant auxiliaries power 3
p cool -0.01Cooling power coefficient 3
ρ g/L825Fuel density (diesel) 6
Source: 1 Giro Batalla and Feenstra [71]; 2 Personal communication with Arriva; 3 Assumed values; 4 Stadler Bussnang AG [72]; 5 Calculated as the ratio between the maximum rotational speed of the GTW’s EM provided in [71] and the maximum rotational speed of the wheel derived from the maximum vehicle speed; 6 Adopted from Prohl [59].
Table 2. Parameters of the selected lithium-ion battery and double-layer capacitor modules.
ParameterUnitValueDescription
LB module 1
Q LB Ah45Nominal capacity
I LB cont , ch / I LB cont , dch A−160/160Minimum/maximum continuous current
I LB peak , ch / I LB peak , dch A−350/350Minimum/maximum pulse current
t peak dch / t peak dch s10Allowed time for pulse current
U LB min / U LB max V18/32.4Minimum/maximum voltage
R LB ch / R LB dch Ω0.006Internal resistance charge/discharge
σ LB min / σ LB max %10/90Minimum/maximum SoC 2
E LB max kWh1.24Energy content
E LB use kWh0.922Usable energy content 3
m LB kg15Weight
DLC module 4
C DLC F63Rated capacitance
I DLC max , ch / I DLC max , dch A−240/240Minimum/maximum continuous current
U DLC min / U DLC max V12.5/125Minimum/maximum voltage
R DLC Ω0.018Internal resistance
E DLC kWh0.14Energy content
m DLC kg61Weight
Source: 1 Extracted value from specifications and data sheets in [74] unless otherwise indicated; 2 Adopted values for simulation purposes; 3 Based on allowed SoC range; 4 Extracted values from specifications and data sheets in [76].
Table 3. Distance between stops and departure times for the line Leeuwarden (Lw) to Groningen (Gn).
StationDistance (km)Departure Time (hh:mm)
Stopping Service 1Express Service
Lw → GnGn → LwLw → GnGn → Lw
Leeuwarden0hh: 51hh + 2:40 (arrival)hh: 44hh + 2:16 (arrival)
Leeuwarden C.3.34hh: 54hh + 2:35--
Hurdegaryp9.83hh + 1:01hh + 2:30--
Feanwalden14.00hh + 1:05hh + 2:25--
De Westereen17.24hh + 1:08hh + 2:20--
Buitenpost24.74hh + 1:16hh + 2:15hh + 1:00hh + 2:00
Grijskerk35.71hh + 1:23hh + 2:06--
Zuidhorn42.35hh + 1:30hh + 2:01--
Groningen54.05hh + 1:39 (arrival)hh + 1:51hh + 1:18 (arrival)hh + 1:42
Source: 1 Stopping service departure times also reported in [37].
Table 4. Energy consumption, GHG emissions, and energy costs for standard, hybrid, and plug-in hybrid vehicle configurations.
ServiceConfigurationESSCharging Option 1Energy ConsumptionGHG Emissions 2
[kgCO2e]
Energy Costs
[EUR]
Fuel
[L]
Electricity
[kWh]
StoppingDEMU--106.31-343.38131.51
HDEMULB-92.01-297.19113.82
DLC-72.43-233.9589.60
PHDEMULBTSs75.7741.01267.54 (244.74)94.72
TSs + IS75.8447.44271.34 (244.96)94.96
DLCTSs50.3863.43197.99 (162.73)63.85
TSs + IS46.04100.55204.62 (148.71)59.38
ExpressDEMU--140.40-453.49173.67
HDEMULB-126.80-409.56156.85
DLC-87.11-281.37107.76
PHDEMULBTSs106.6149.61371.93 (344.35)133.07
TSs + IS118.5849.84410.72 (383.01)147.89
DLCTSs61.9883.48246.61 (200.20)78.68
TSs + IS60.49104.81253.66 (195.38)77.36
Note: 1 TS: Terminal stop, IS: Intermediate stop; 2 The values in brackets were calculated for the scenarios that consider green electricity for ESS charging.
Publisher’s Note: MDPI stays neutral with regard to jurisdictional claims in published maps and institutional affiliations.

