
Hydrogen as Energy Sources—Basic Concepts


Abstract
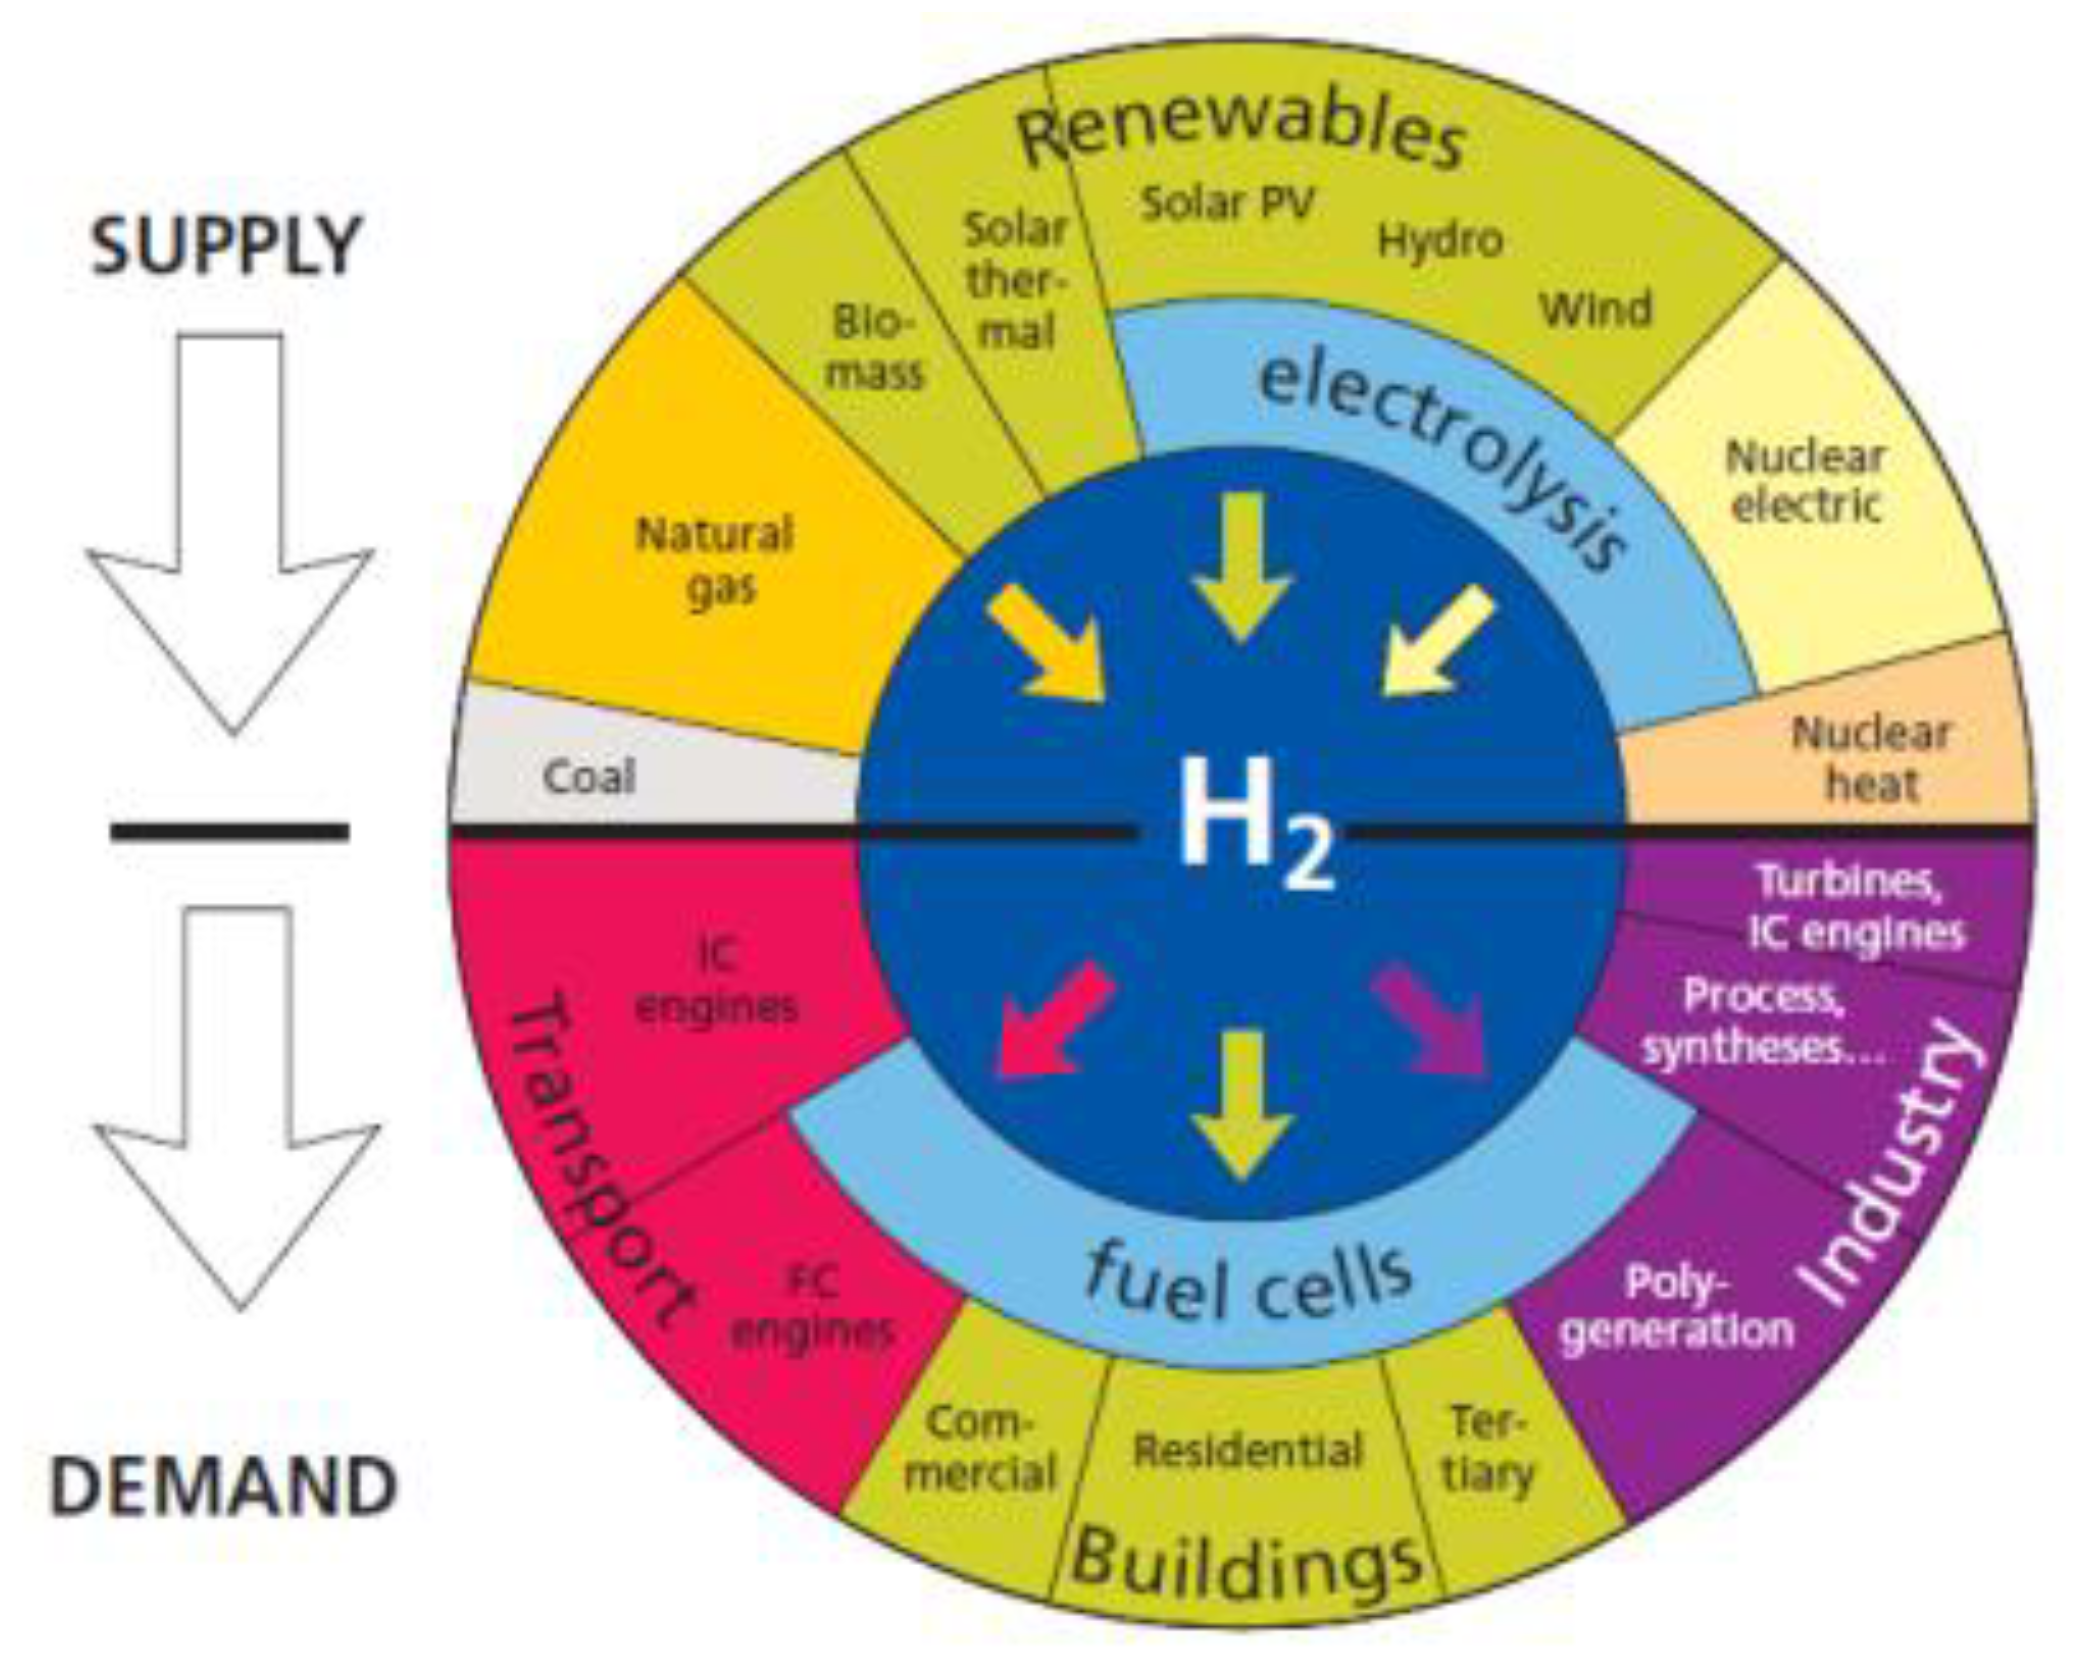
:1. Introduction
2. Hydrogen Production
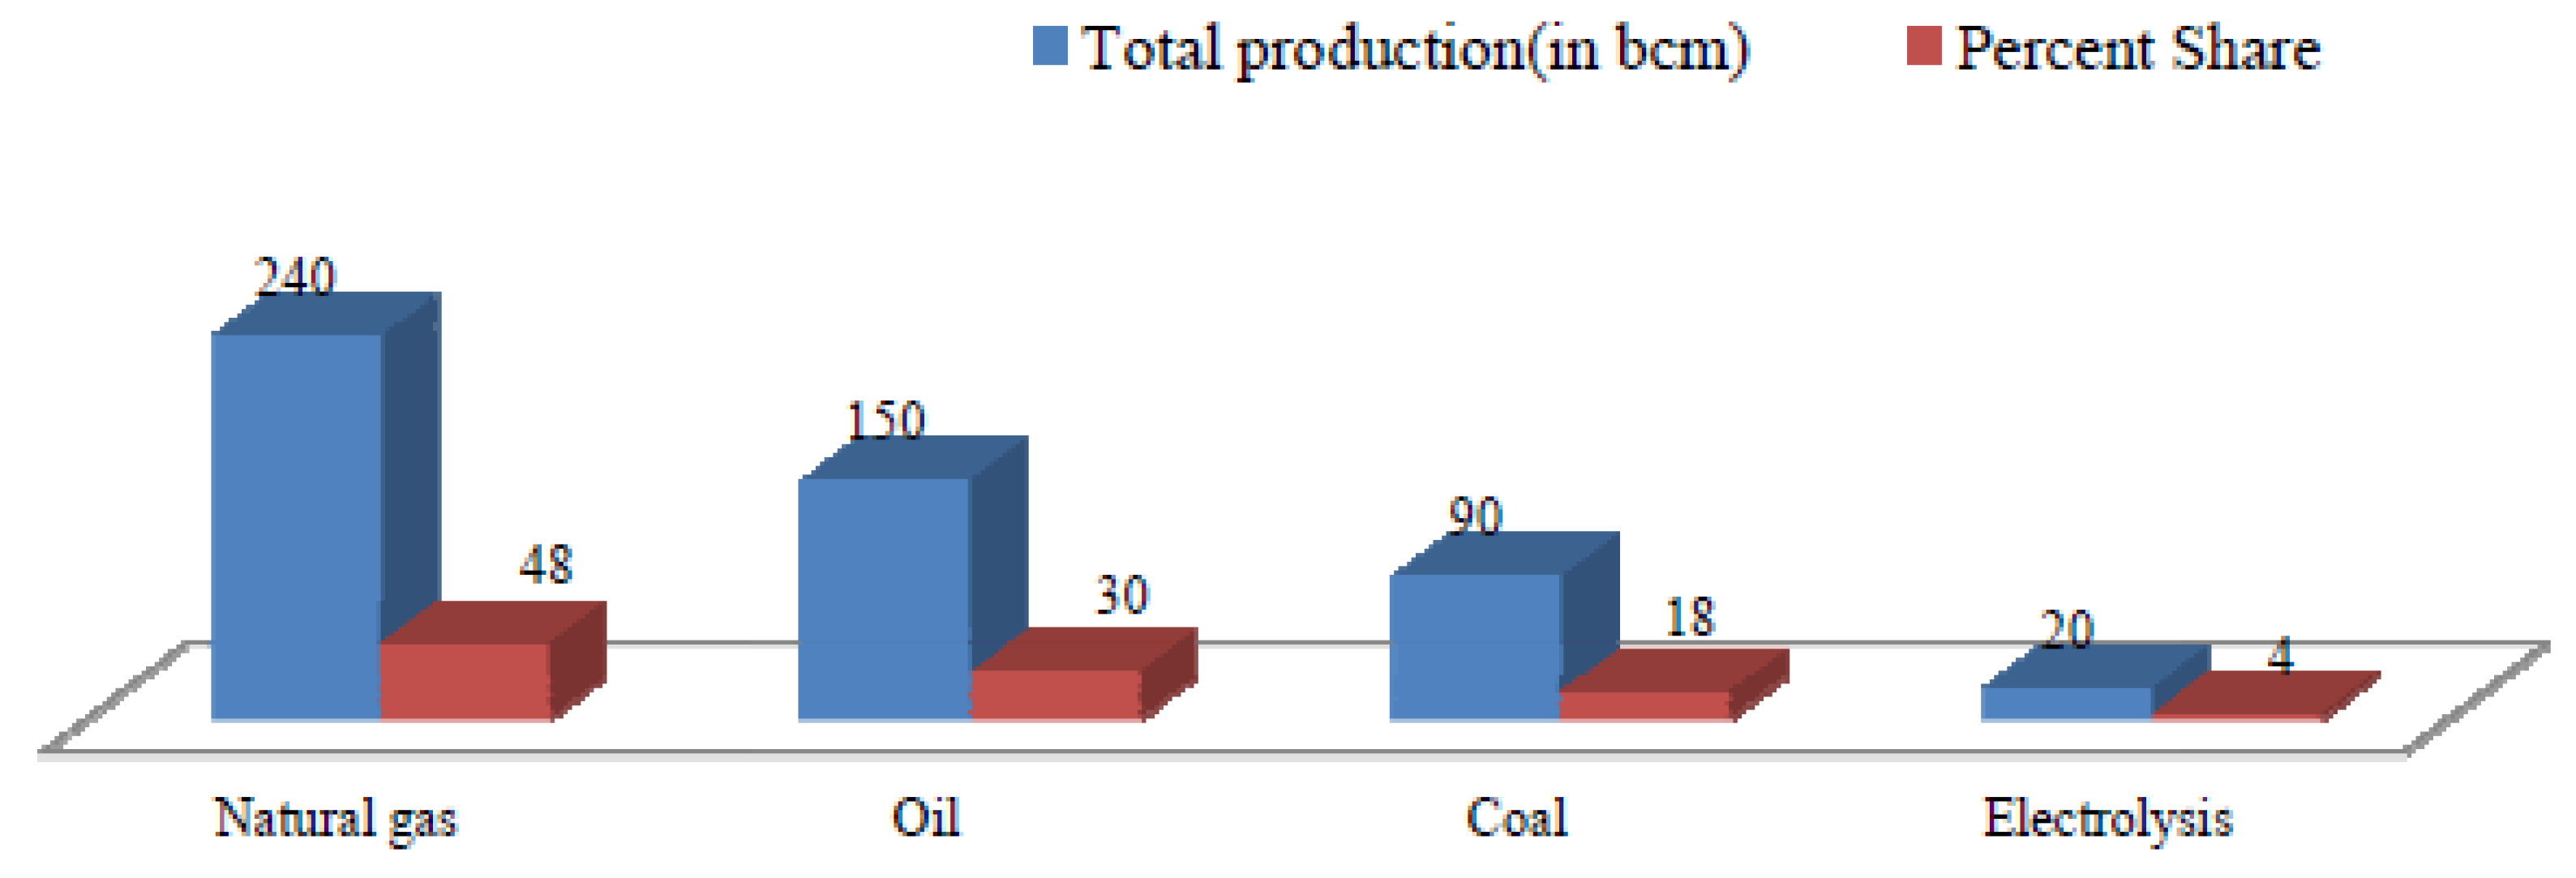
2.1. Hydrogen Production of Coal and Natural Gas
2.2. Biological Hydrogen Production
- Direct bio photolysis of water using green algae. The conversion of water to hydrogen by green algae may be represented by the following general reaction:2H2O + light energy → 2H2 + O2
- Indirect bio photolysis of water using blue-green algae (cyanobacteria). The reaction for hydrogen formation from water by cyanobacteria can be represented by following reactions:and12H2O + 6CO2 + light energy → C6H12O6 + 6O2C6H12O6 + 12H2O + lightenergy → 12H2 + 6CO2
- Photodecomposition of organic compounds by photosynthetic of purple non-sulfur bacteria the reaction is as follows:CH3COOH + 2H2O + lightenergy → 4H2 + 2CO2
- The anaerobic fermentation of carbohydrate (or organic wastes) produces intermediates, such as low molecular weight organic acids, which are then converted into hydrogen by photosynthetic bacteria in the second step in a photo-bioreactor. The overall reactions of the process can be represented as:Stage I. Dark fermentation:C6H12O6 + 2H2O → 2CH3COOH + 2CO2 + 4H2Stage II. Photo-fermentation (photosynthetic bacteria):2CH3COOH + 4H2O → 8H2 + 4CO2
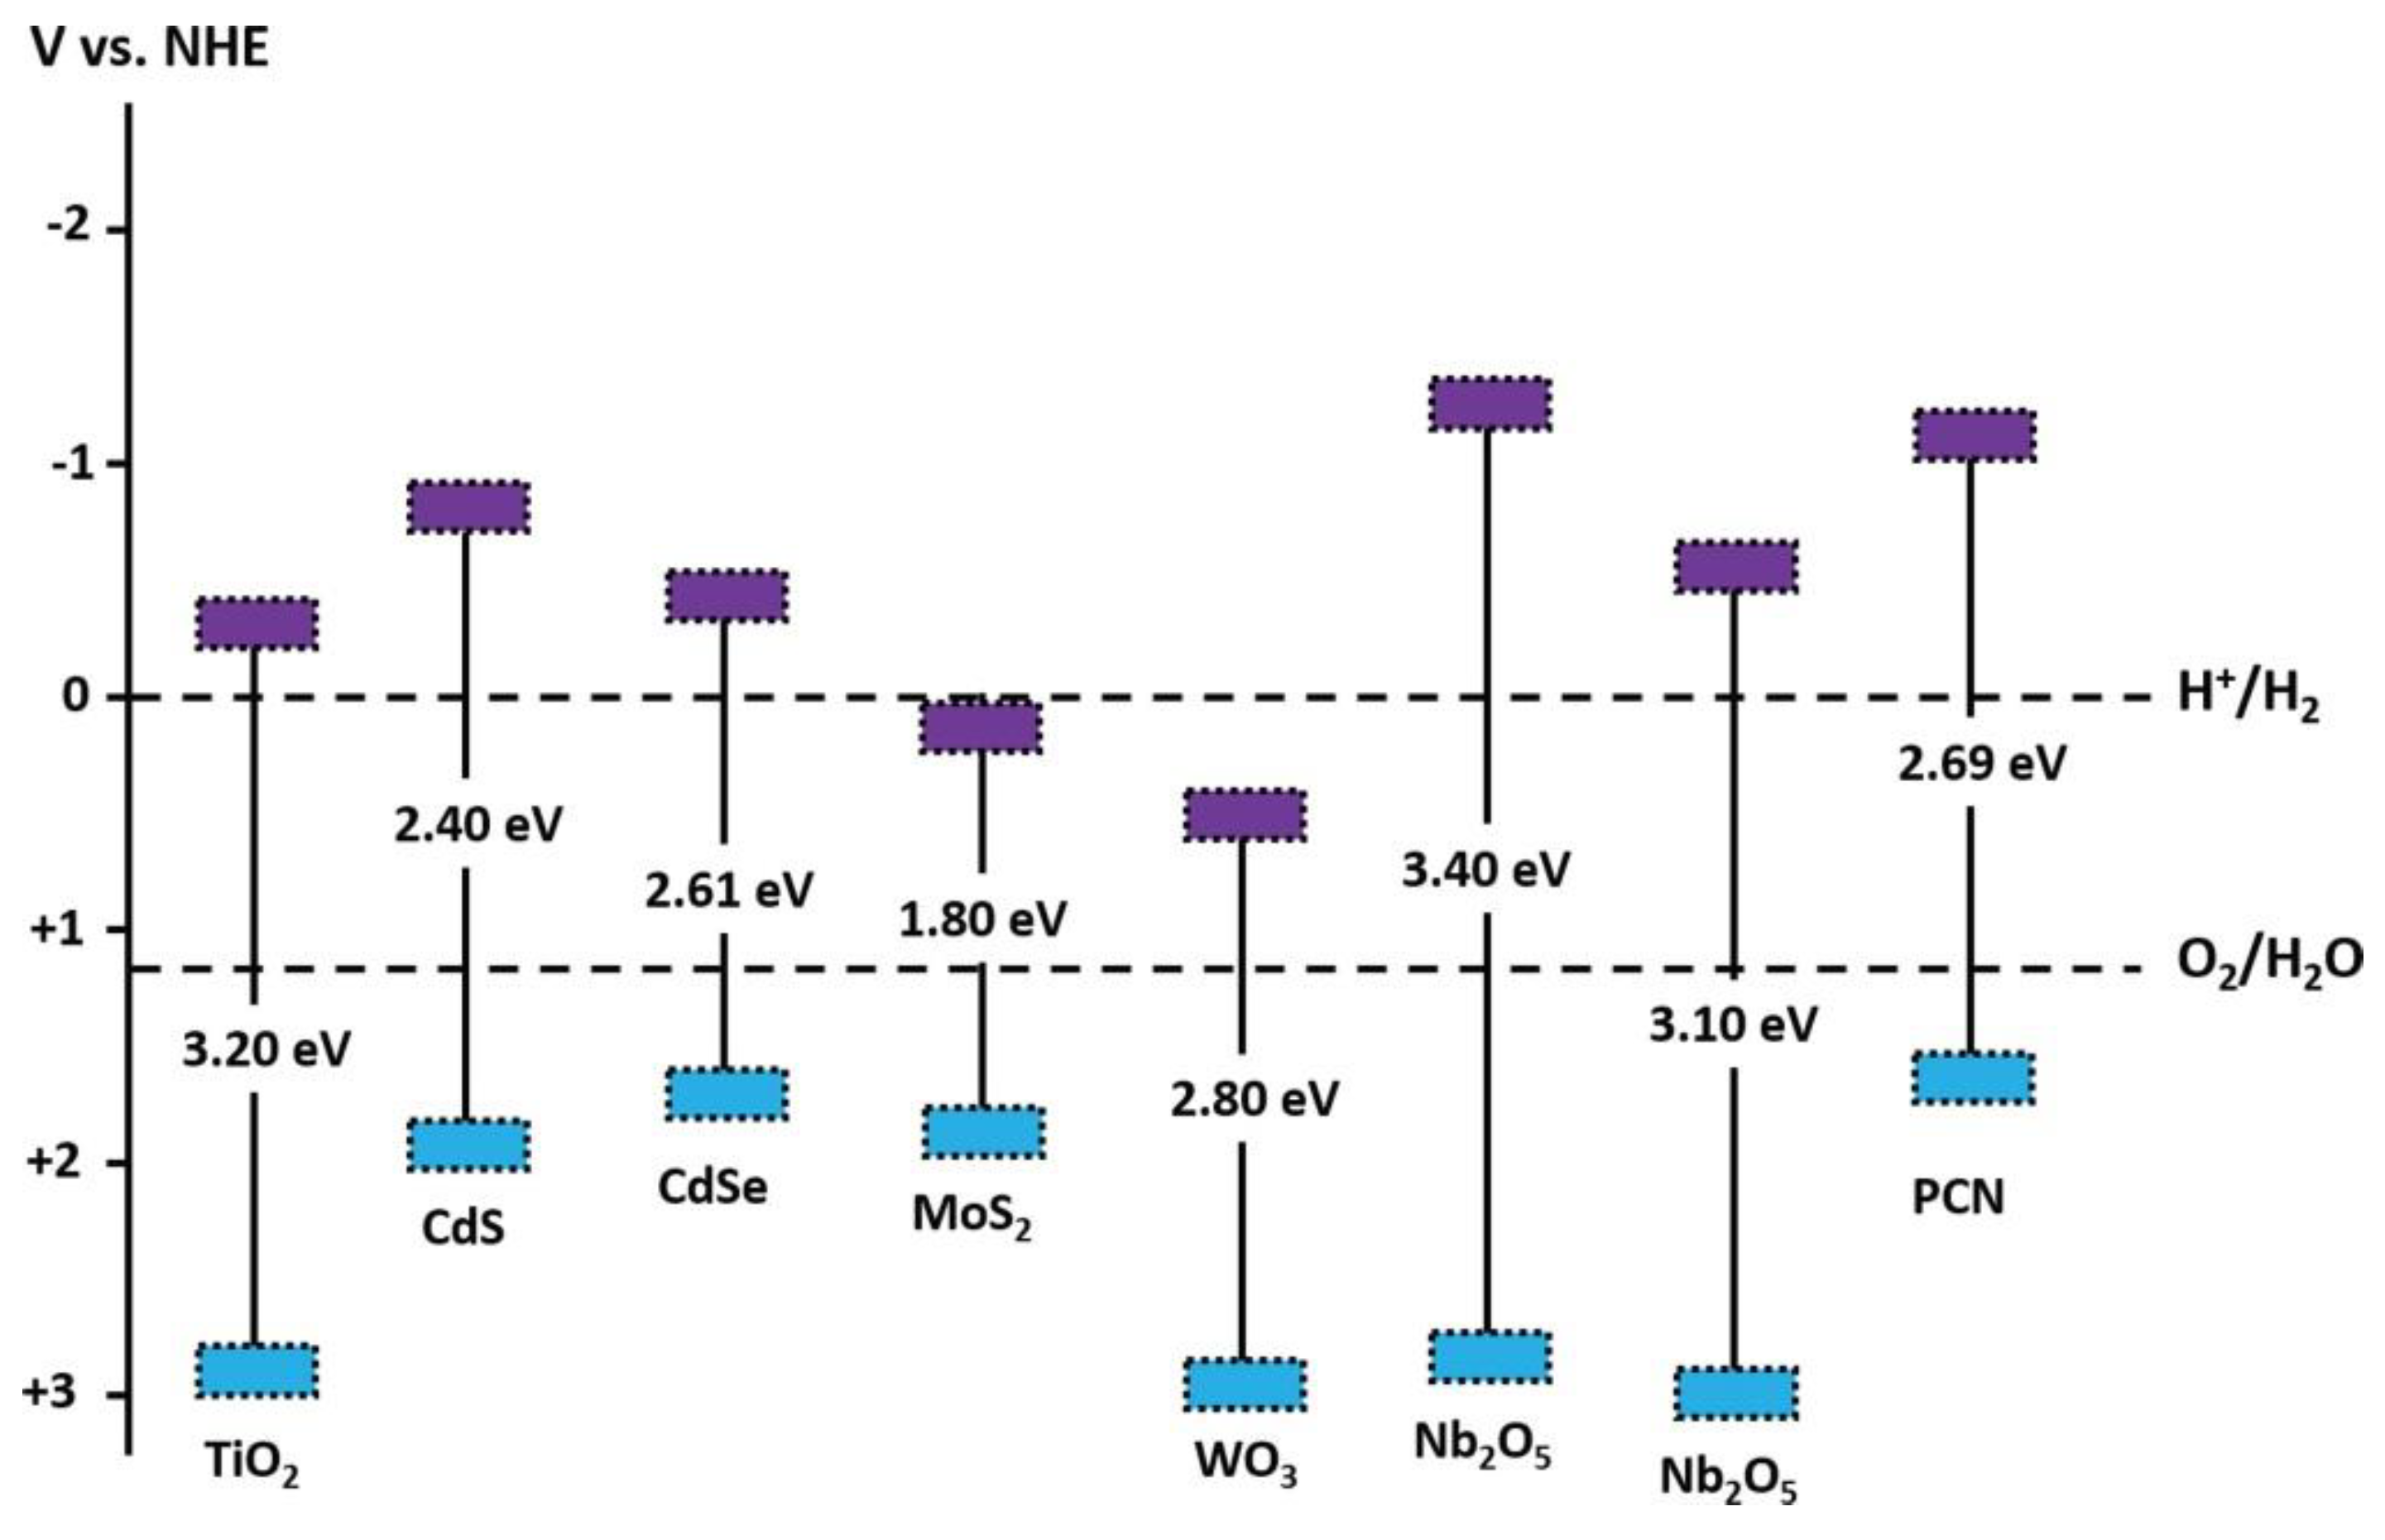
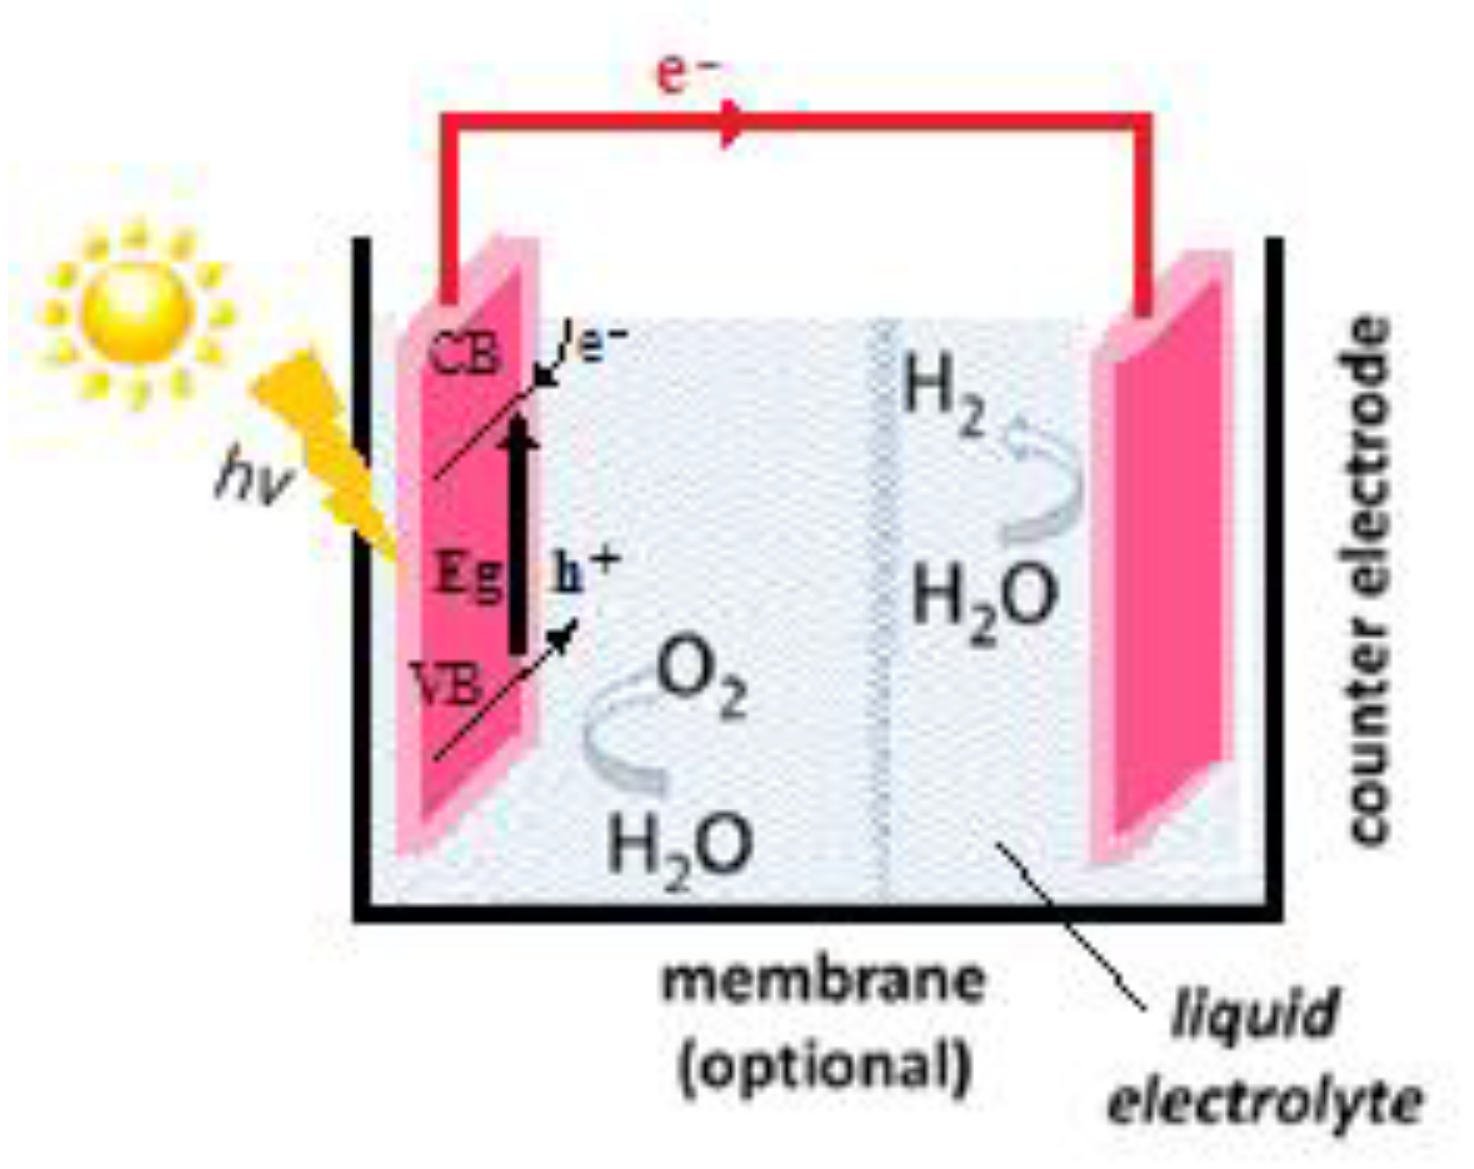
2.3. Hydrogen Production by Water Splitting
- Light absorption and generation of electron/hole pairs at the photo anode,
- Light-driven reaction at the photo anode,
- Light-driven reaction at the cathode,
- The overall reaction is:
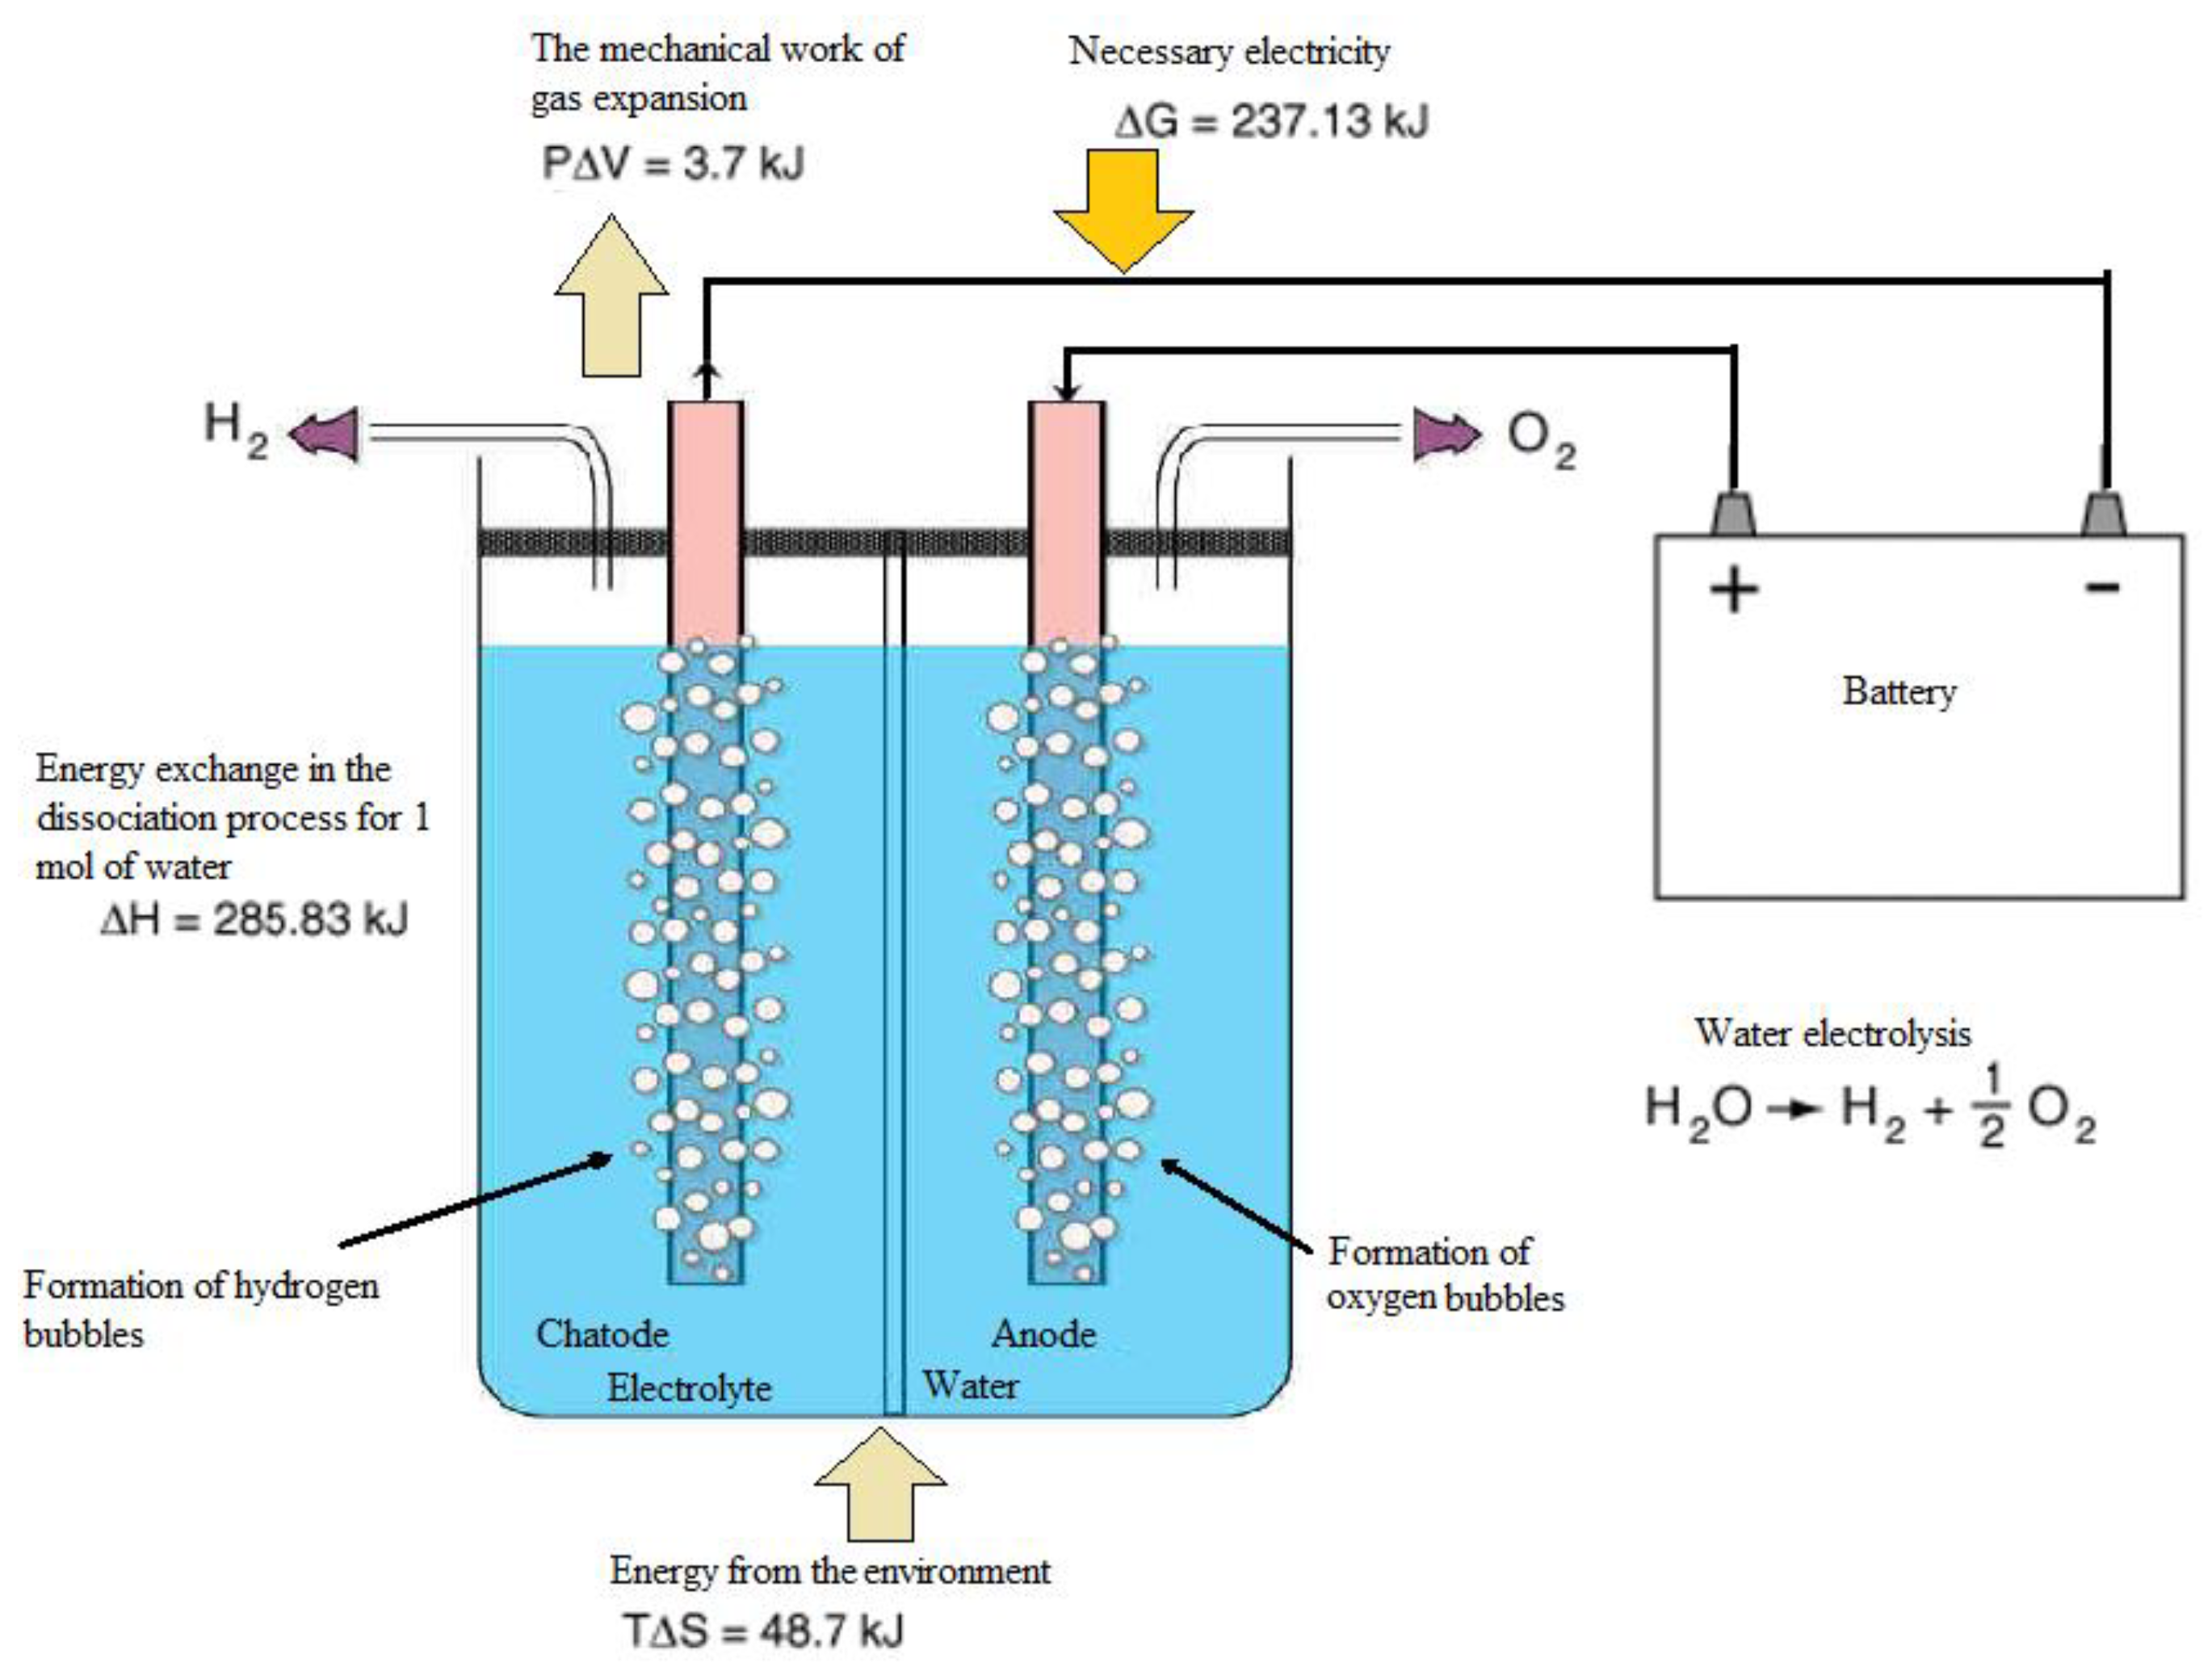
2.4. Water Electrolysis
2.4.1. Thermodynamics of Electrochemical Processes
2.4.2. Electrolysis Law
2.4.3. Thermodynamics of Water Electrolysis
2.4.4. Electrochemical Efficiency and Specific Electricity Consumption
2.5. Hydrogen Efficiency of Current Technologies Production
3. Hydrogen Conversion
3.1. Direct Combustion
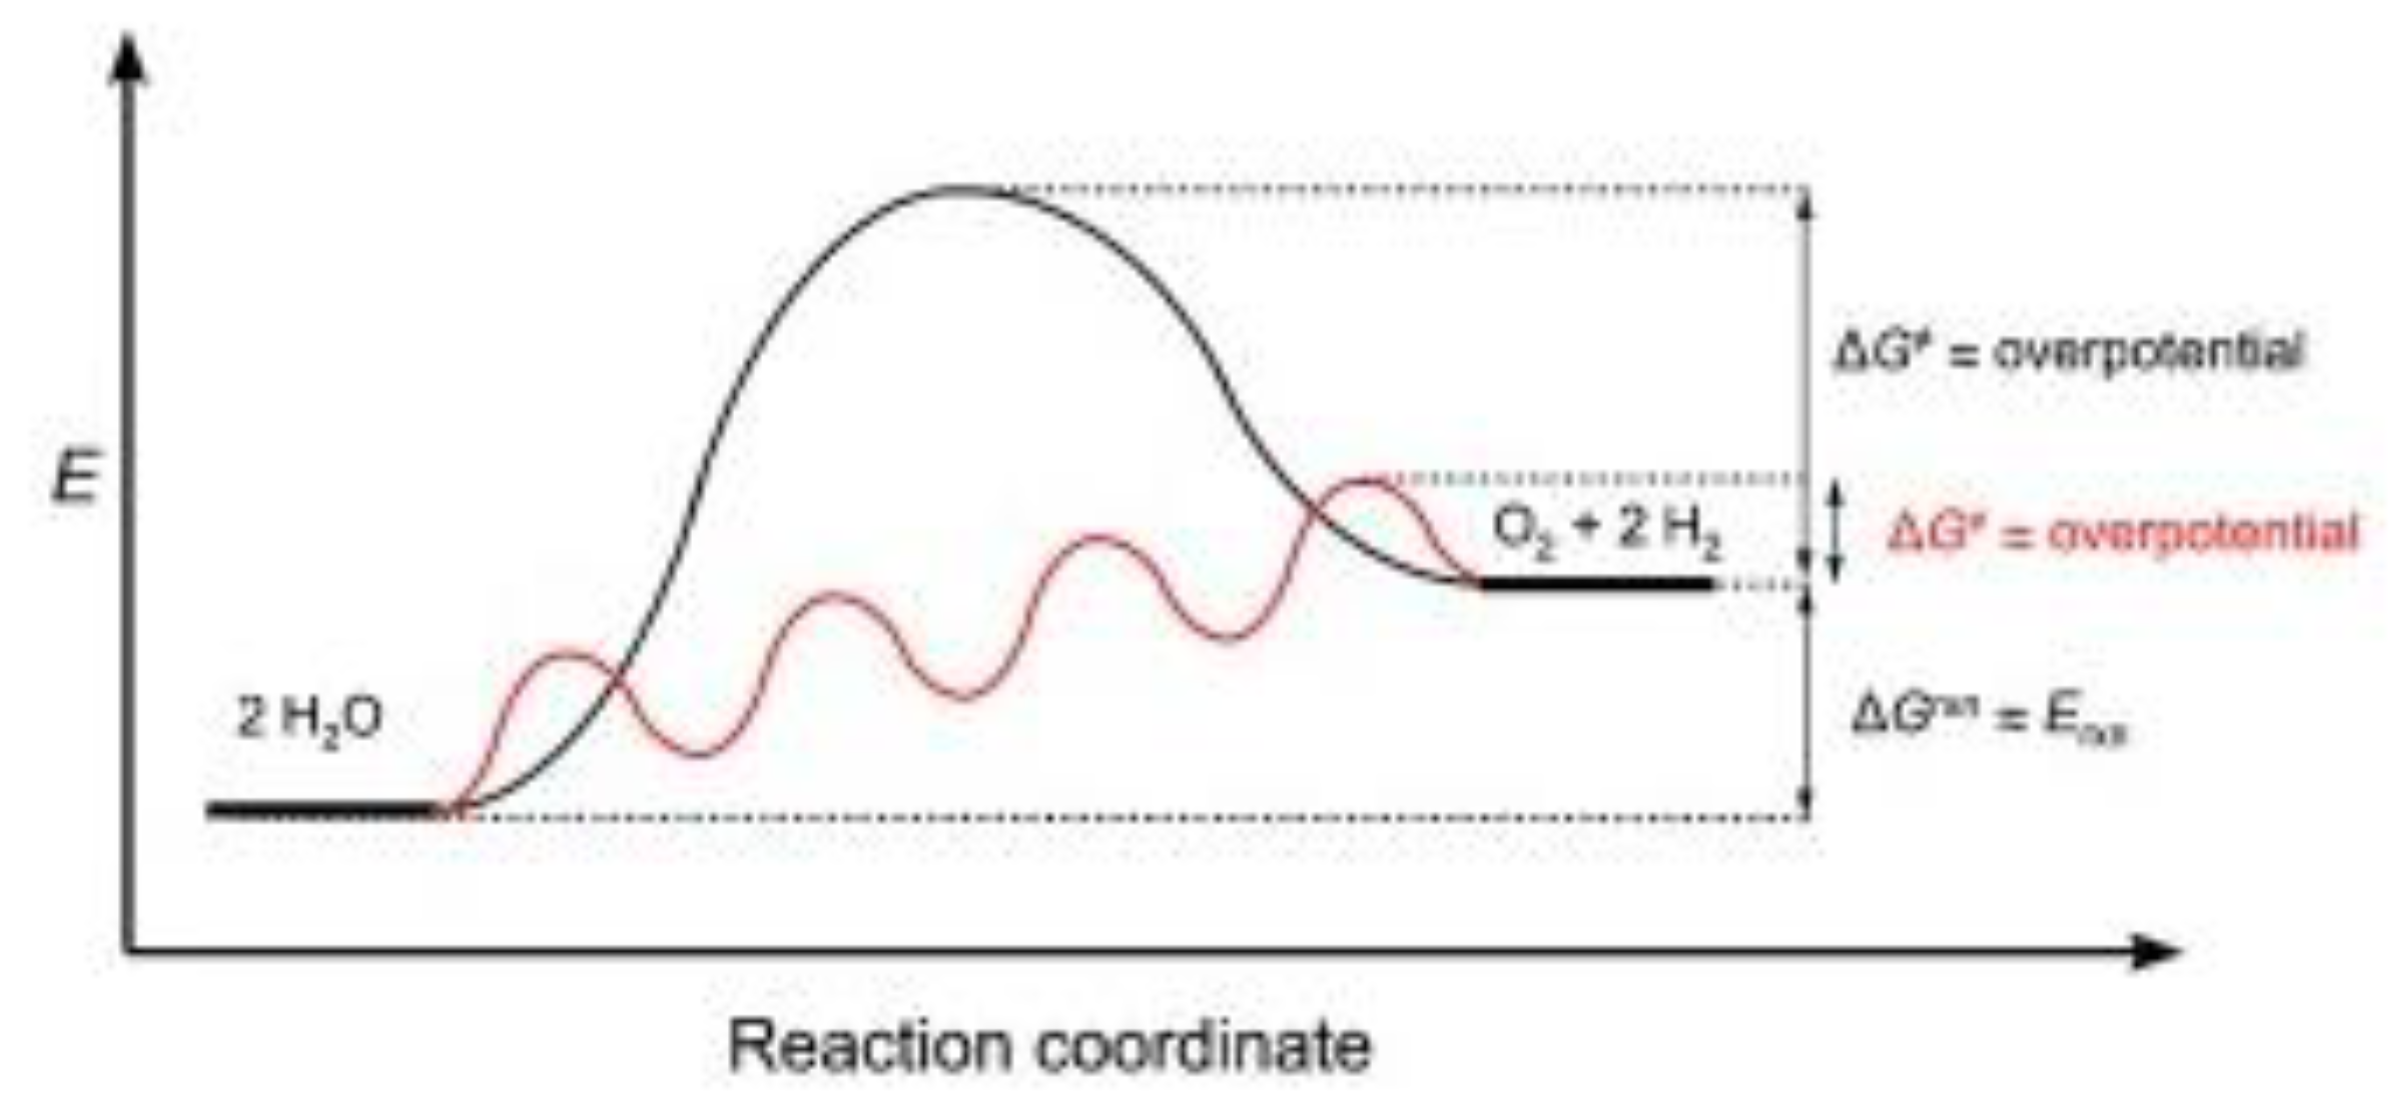
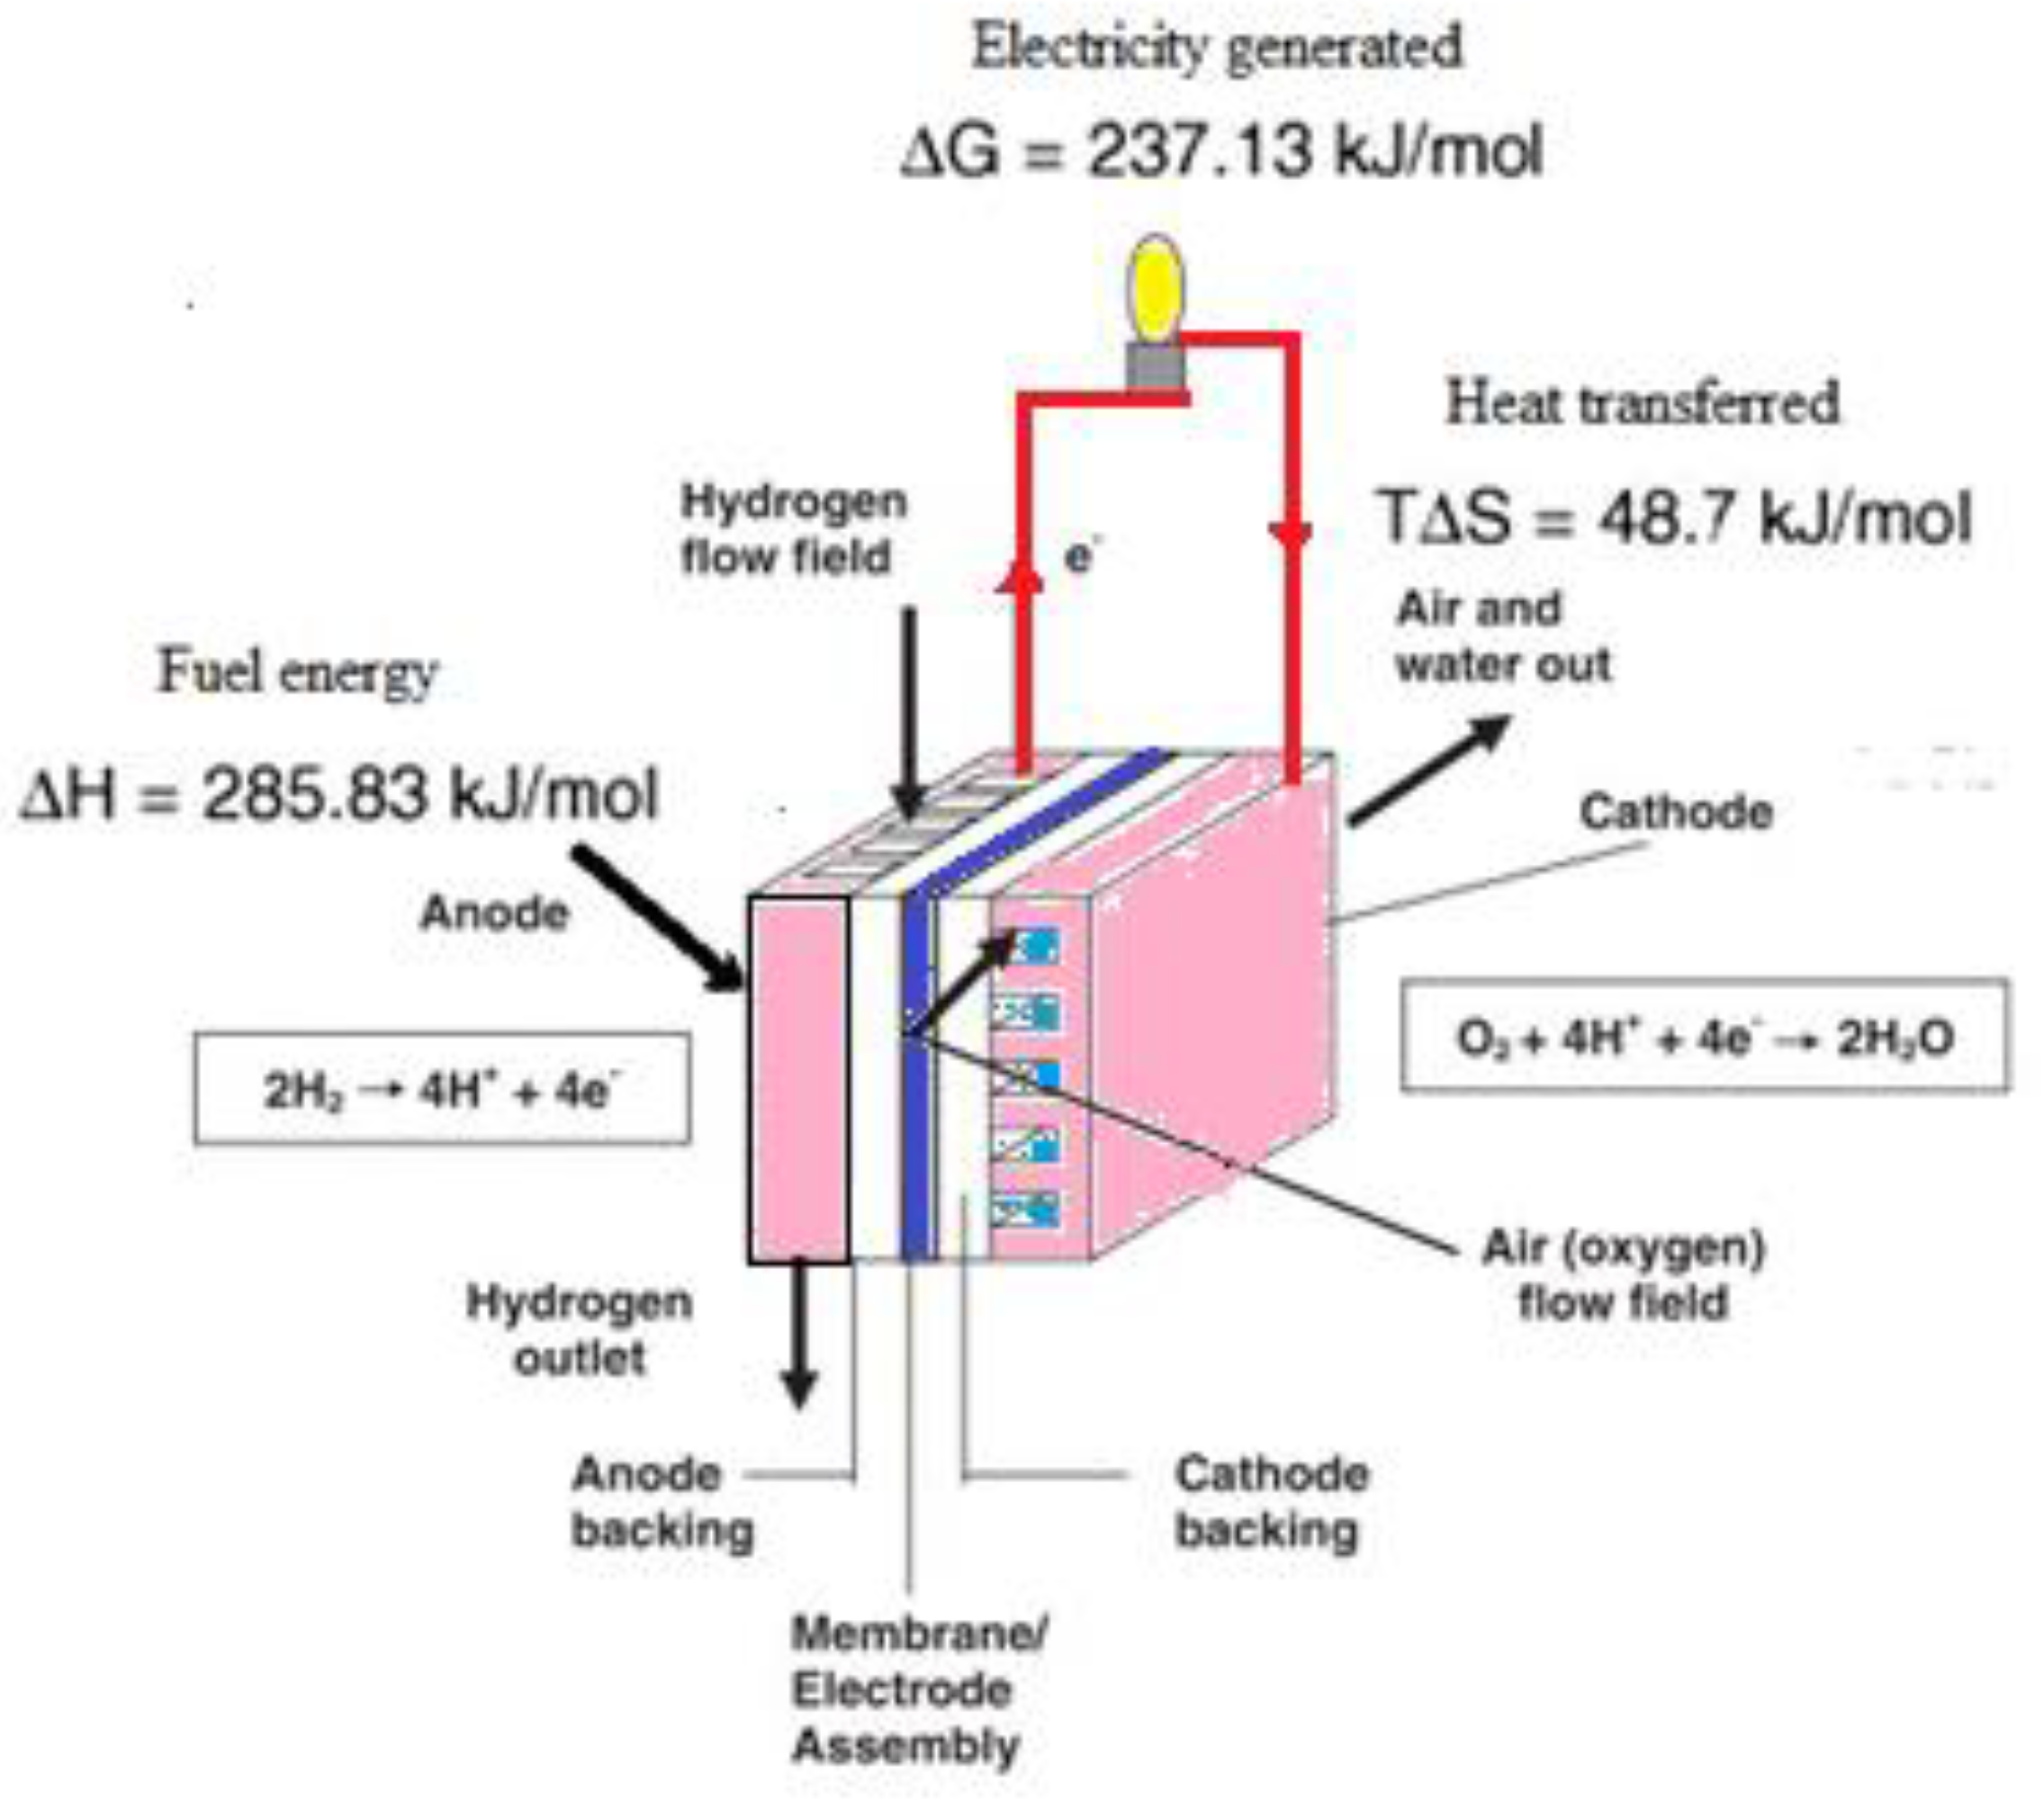
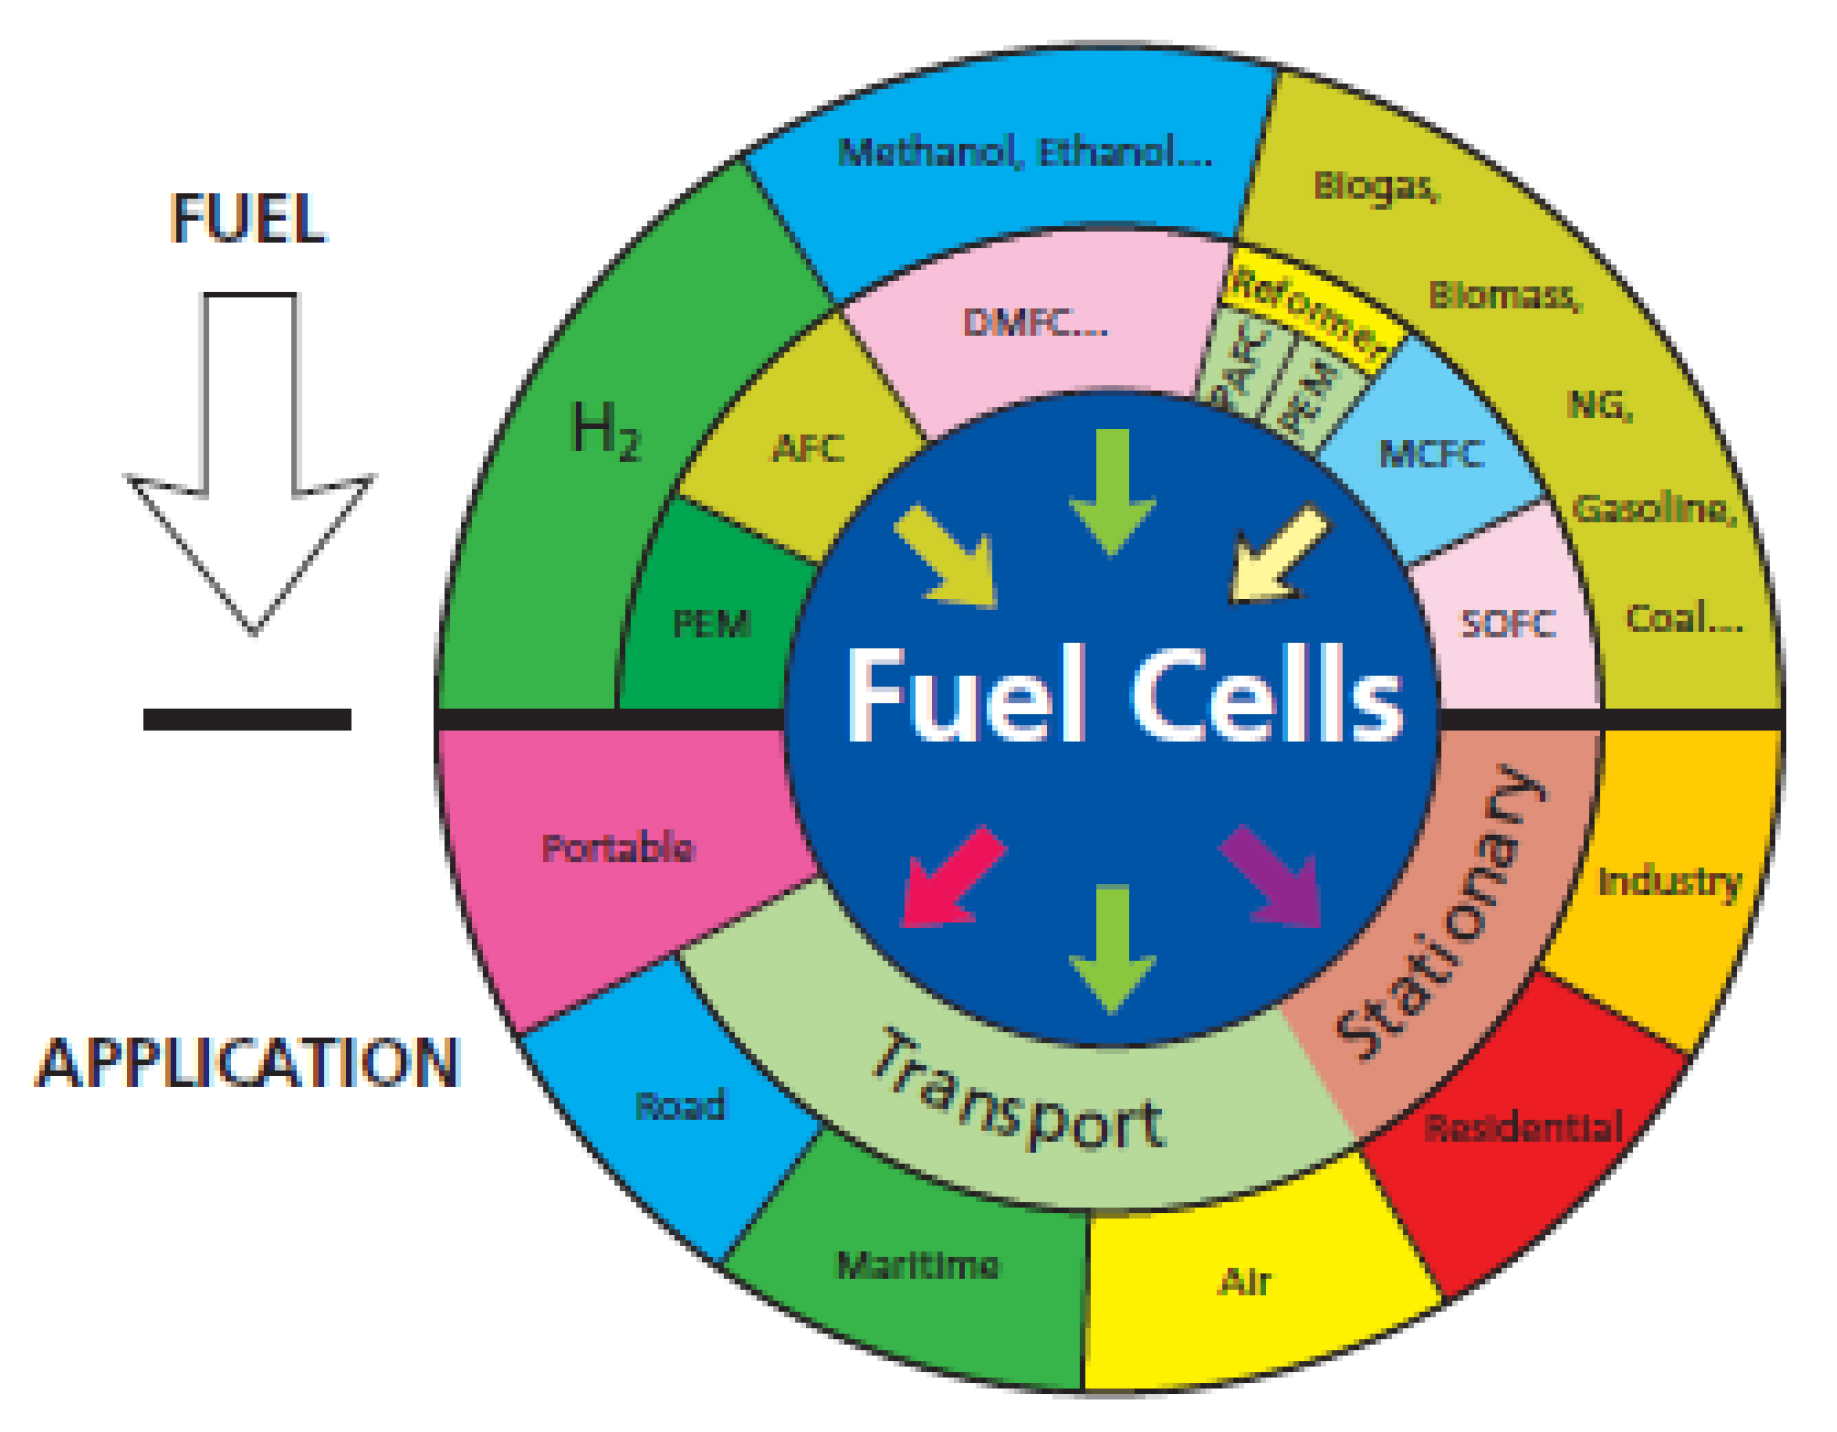
3.2. Fuel Cells
3.2.1. Thermodynamic Analysis of the Fuel Cell
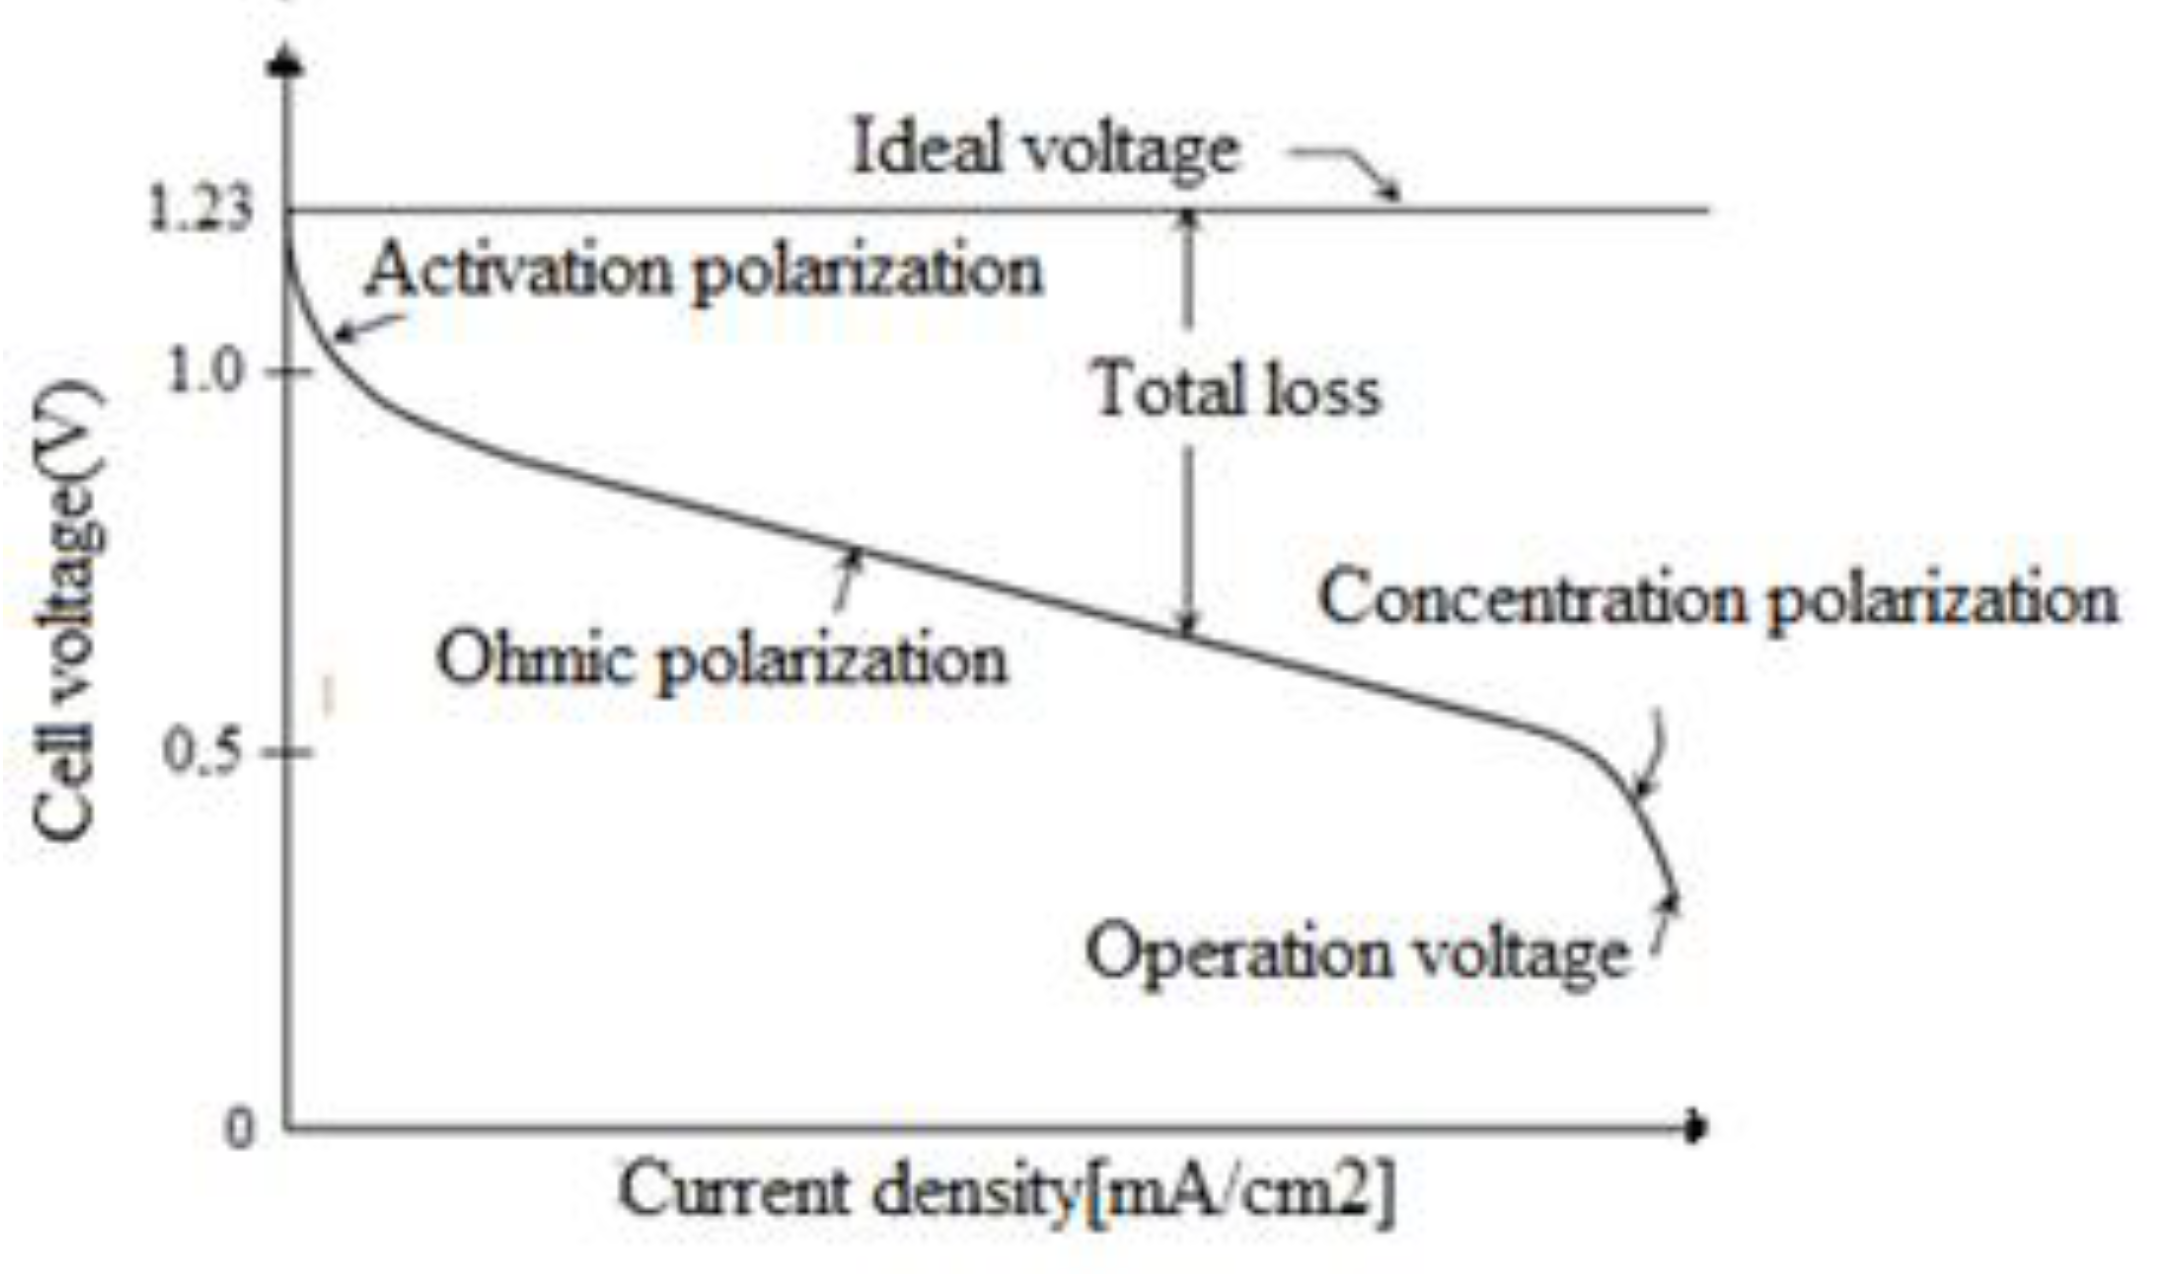
3.2.2. External Characteristics of the Fuel Cell
- (a)
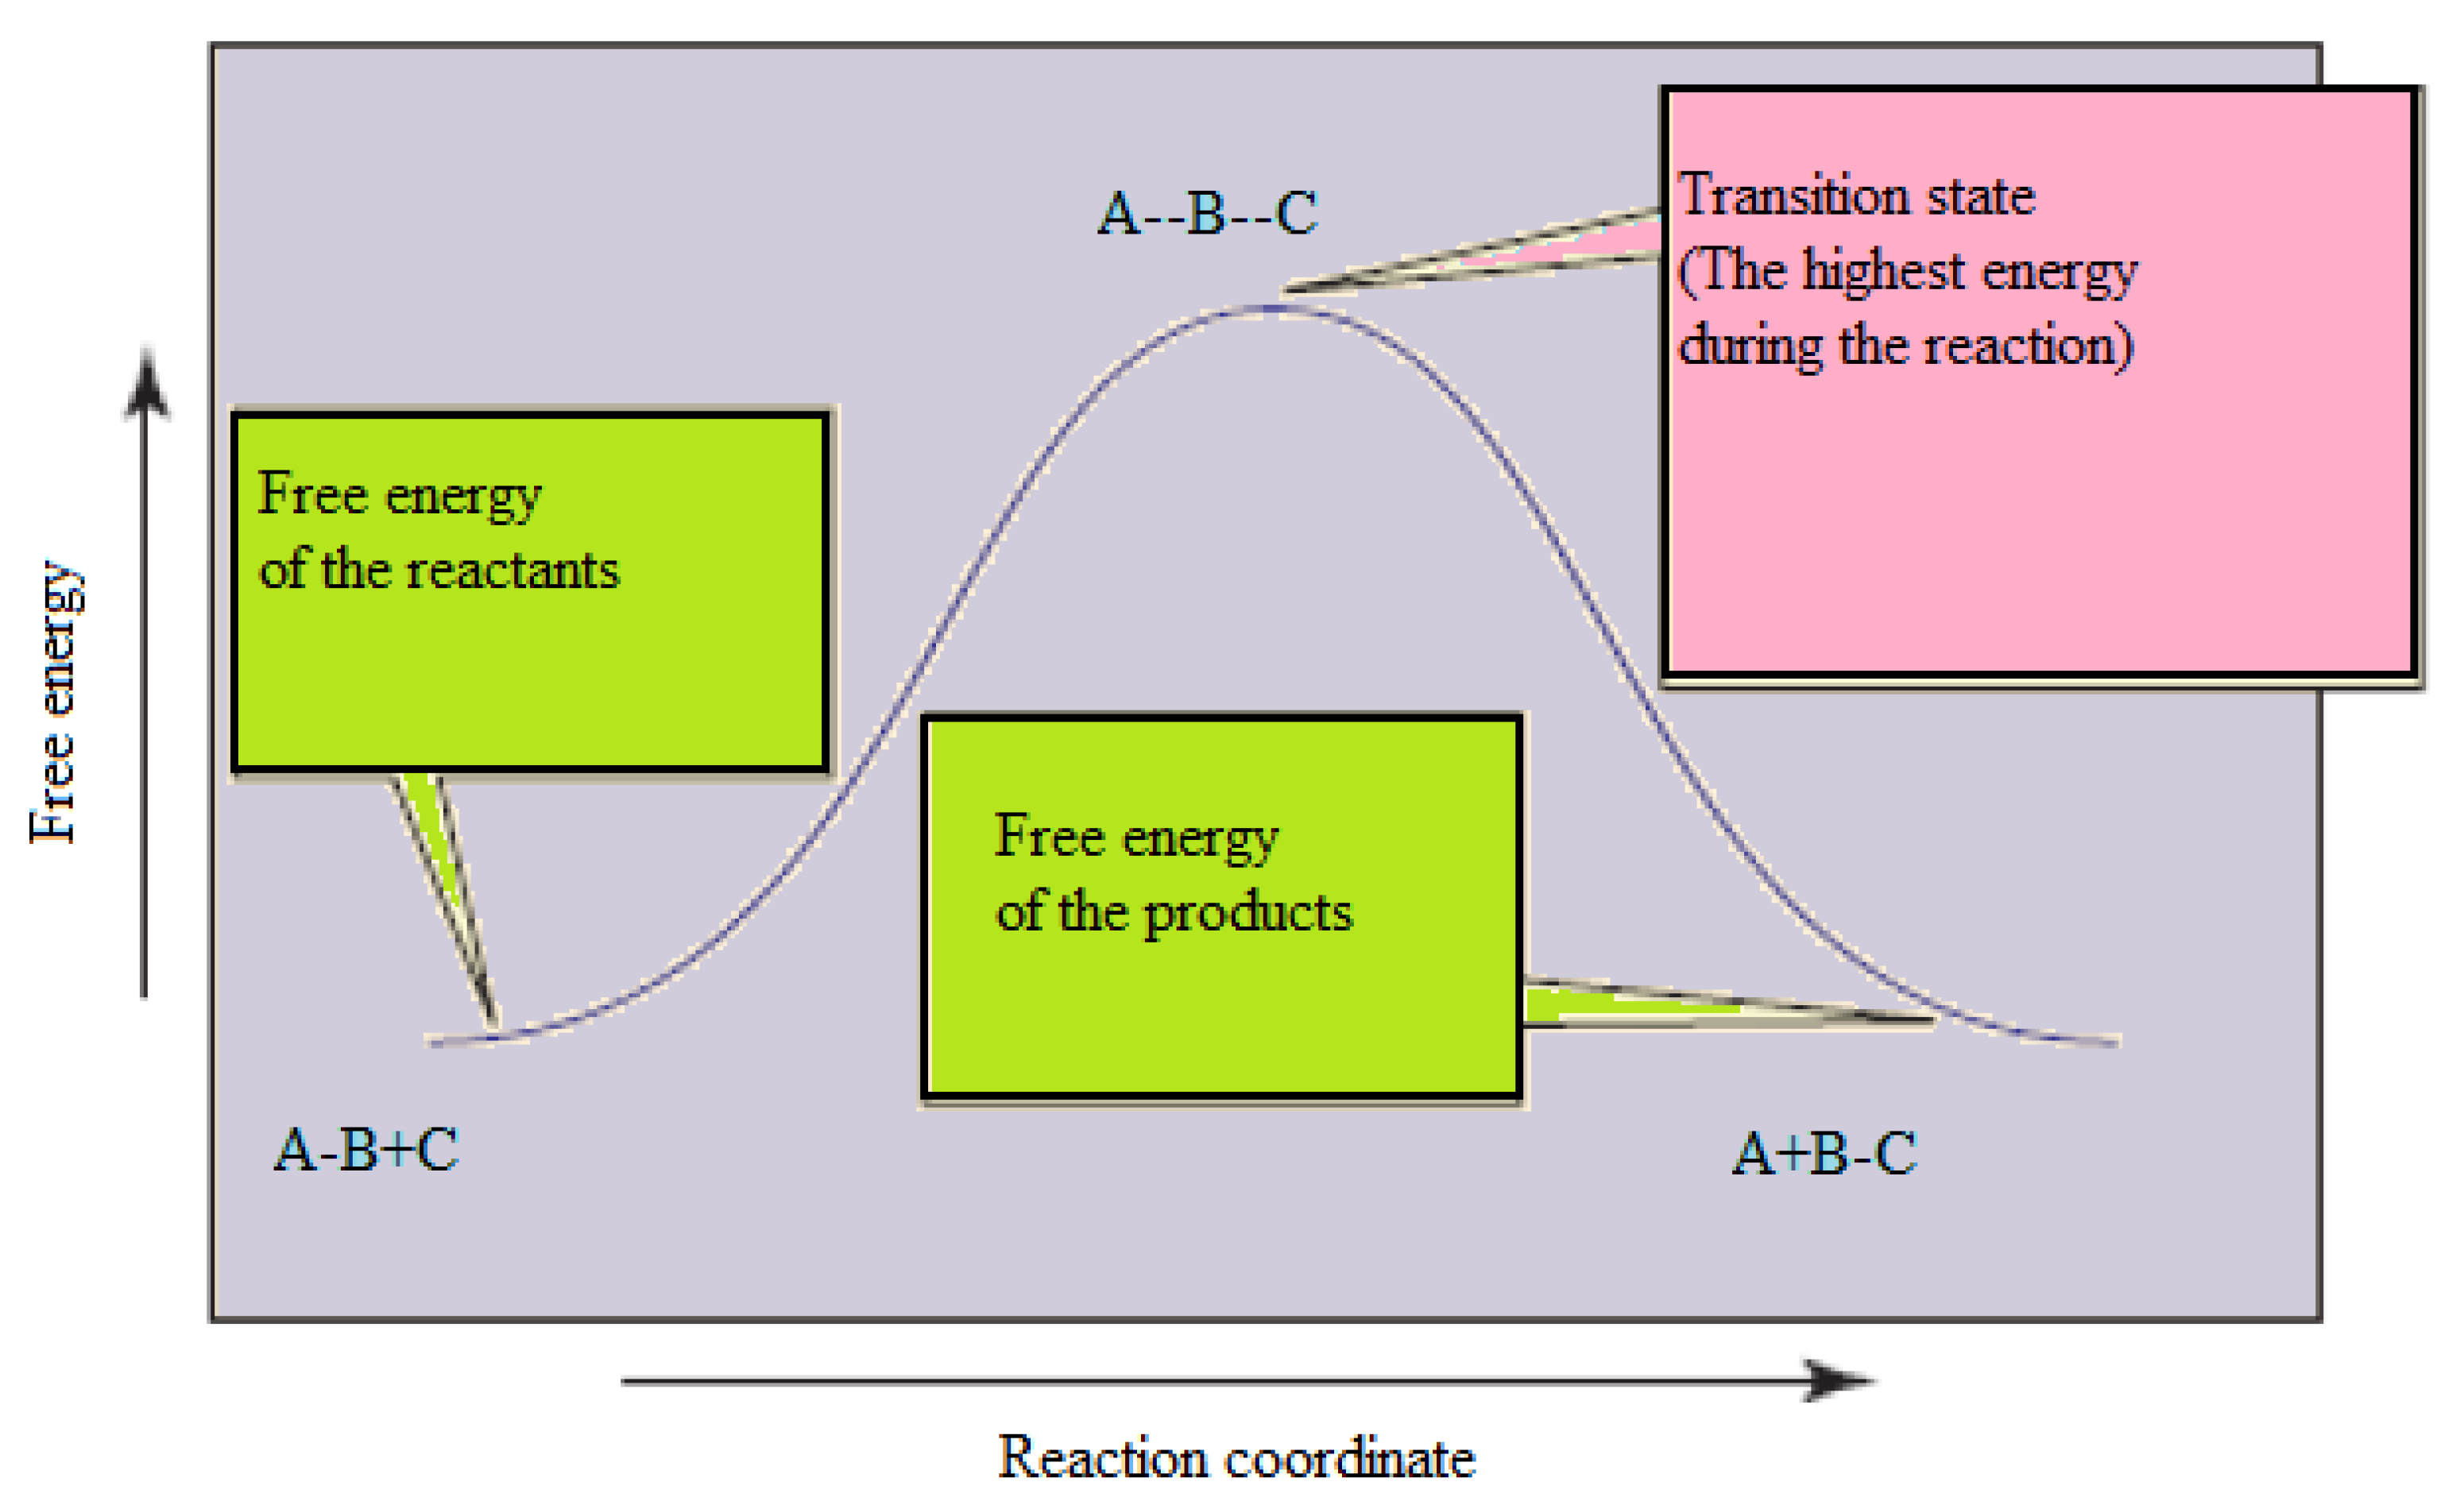
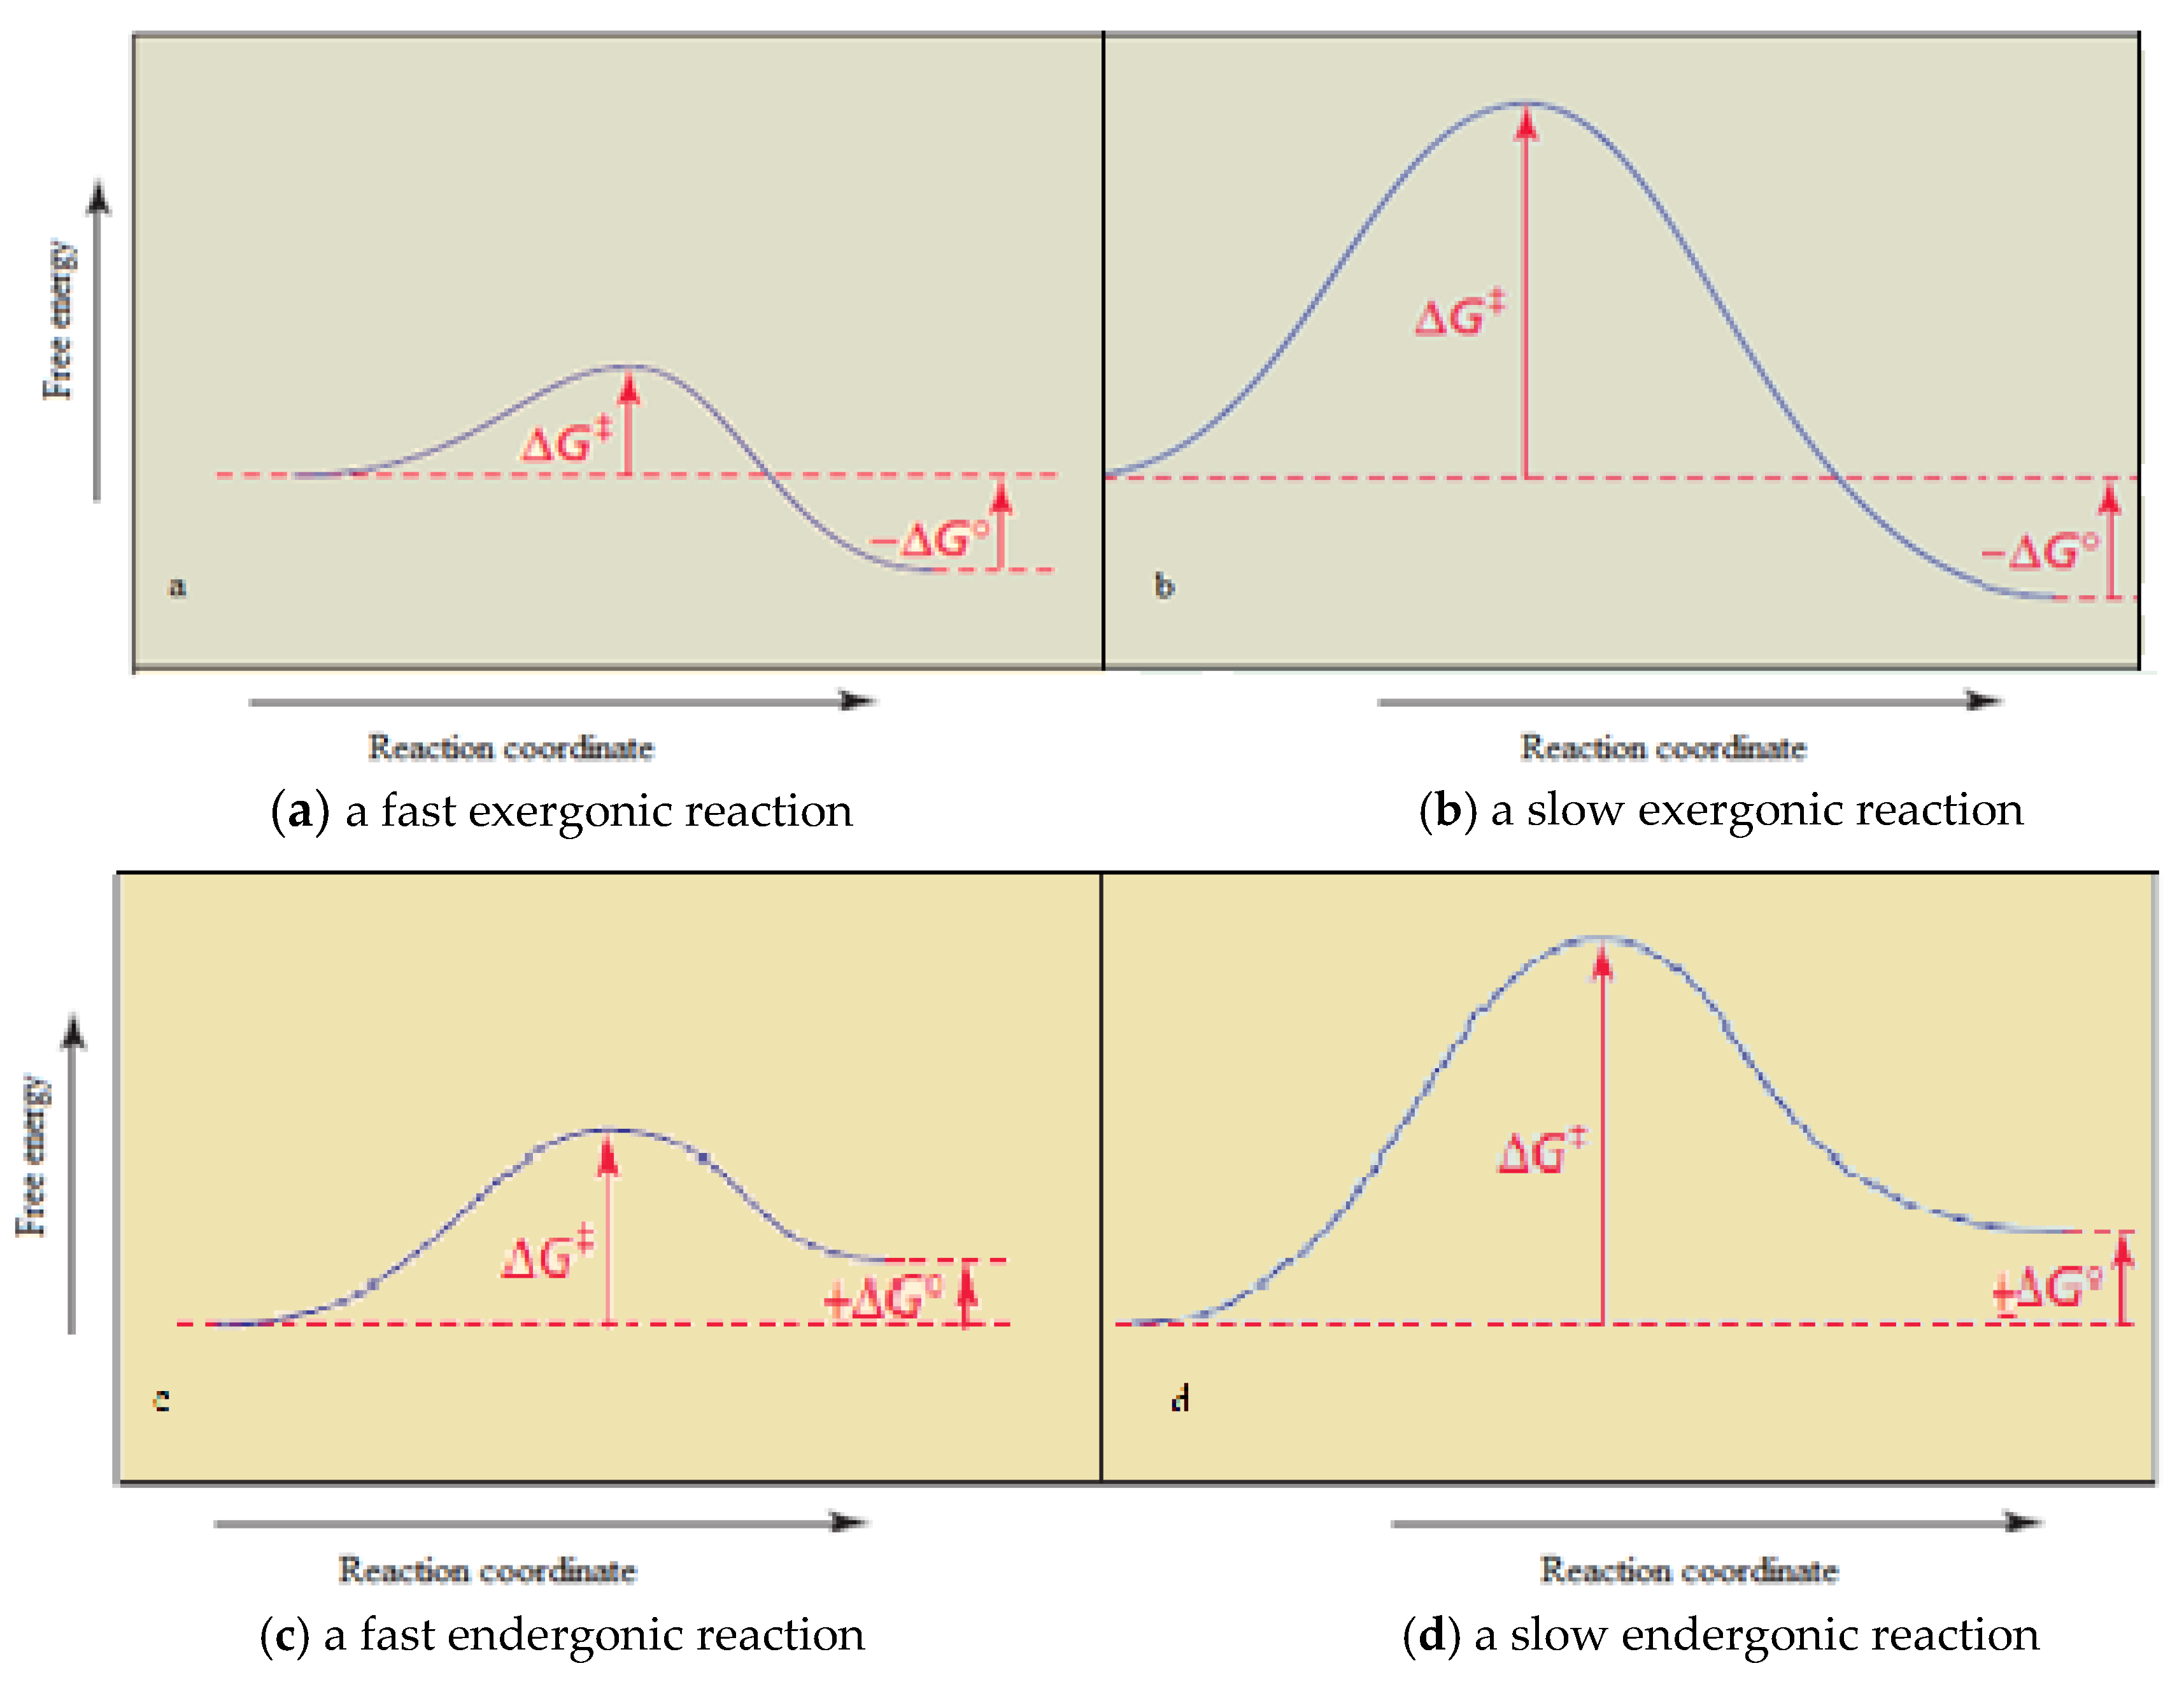
- Activation polarization. Activation Loss- as I expressed it in the paper [19]-“is directly related to the velocities of the electrochemical reactions at the surface of the electrodes through which the transfer of electrons occurs. Activation loss occurs because the chemical process initially has not begun even when the necessary reversible voltage is supplied; the electrode reactions are at zero or inherently slow. Free energy of activation is an energy barrier to the reaction that has to be overcome by reactive speciesand it depends on the catalytic properties of the electrode materials. The relationship for calculating this loss is given by the Tafel equation”:where: α—is the electron transfer coefficient of the reaction to the electrode approached, —is the density of the transferred current and —is current density related to activation losses.
- (b)
- Ohmic polarization. The Ohmic polarization as I expressed it in the paper [19] “occurs due to the resistance to ion flux in the electrolyte and the electrical resistance of the electrode materials with relation”:Dominants are Ohm losses through electrolyte. For example, the area specific ionic resistance of alkaline fuel cell can be calculated by dividing the thickness of the electrolyte layer by the ionic conductivity of the alkaline solution (ionic conductivity as a function of temperature T and molarity M) or of the PEM fuel cell can be calculated by dividing the membrane thickness by the conductivity of the membrane.
- (c)
- Concentration polarization as I expressed it in the paper [19] “means the loss of voltage due to not being able to maintain the initial concentration of the reactants consumed at the reaction electrode. Concentration polarization can be attributed to some processes, for example slow diffusion of gas into the pores of the electrodes, the diffusion of reactants/products by electrolyte to/from the electrochemical reaction site. At high current densities, the slow transport of either reactants or products to and from the electrochemical reaction site is a pivotal contribution to concentration polarization. The relationship of this loss is given by the equation:where: —is defined as the current at which the fuel is consumed at a rate equal to the maximum supply flow”.
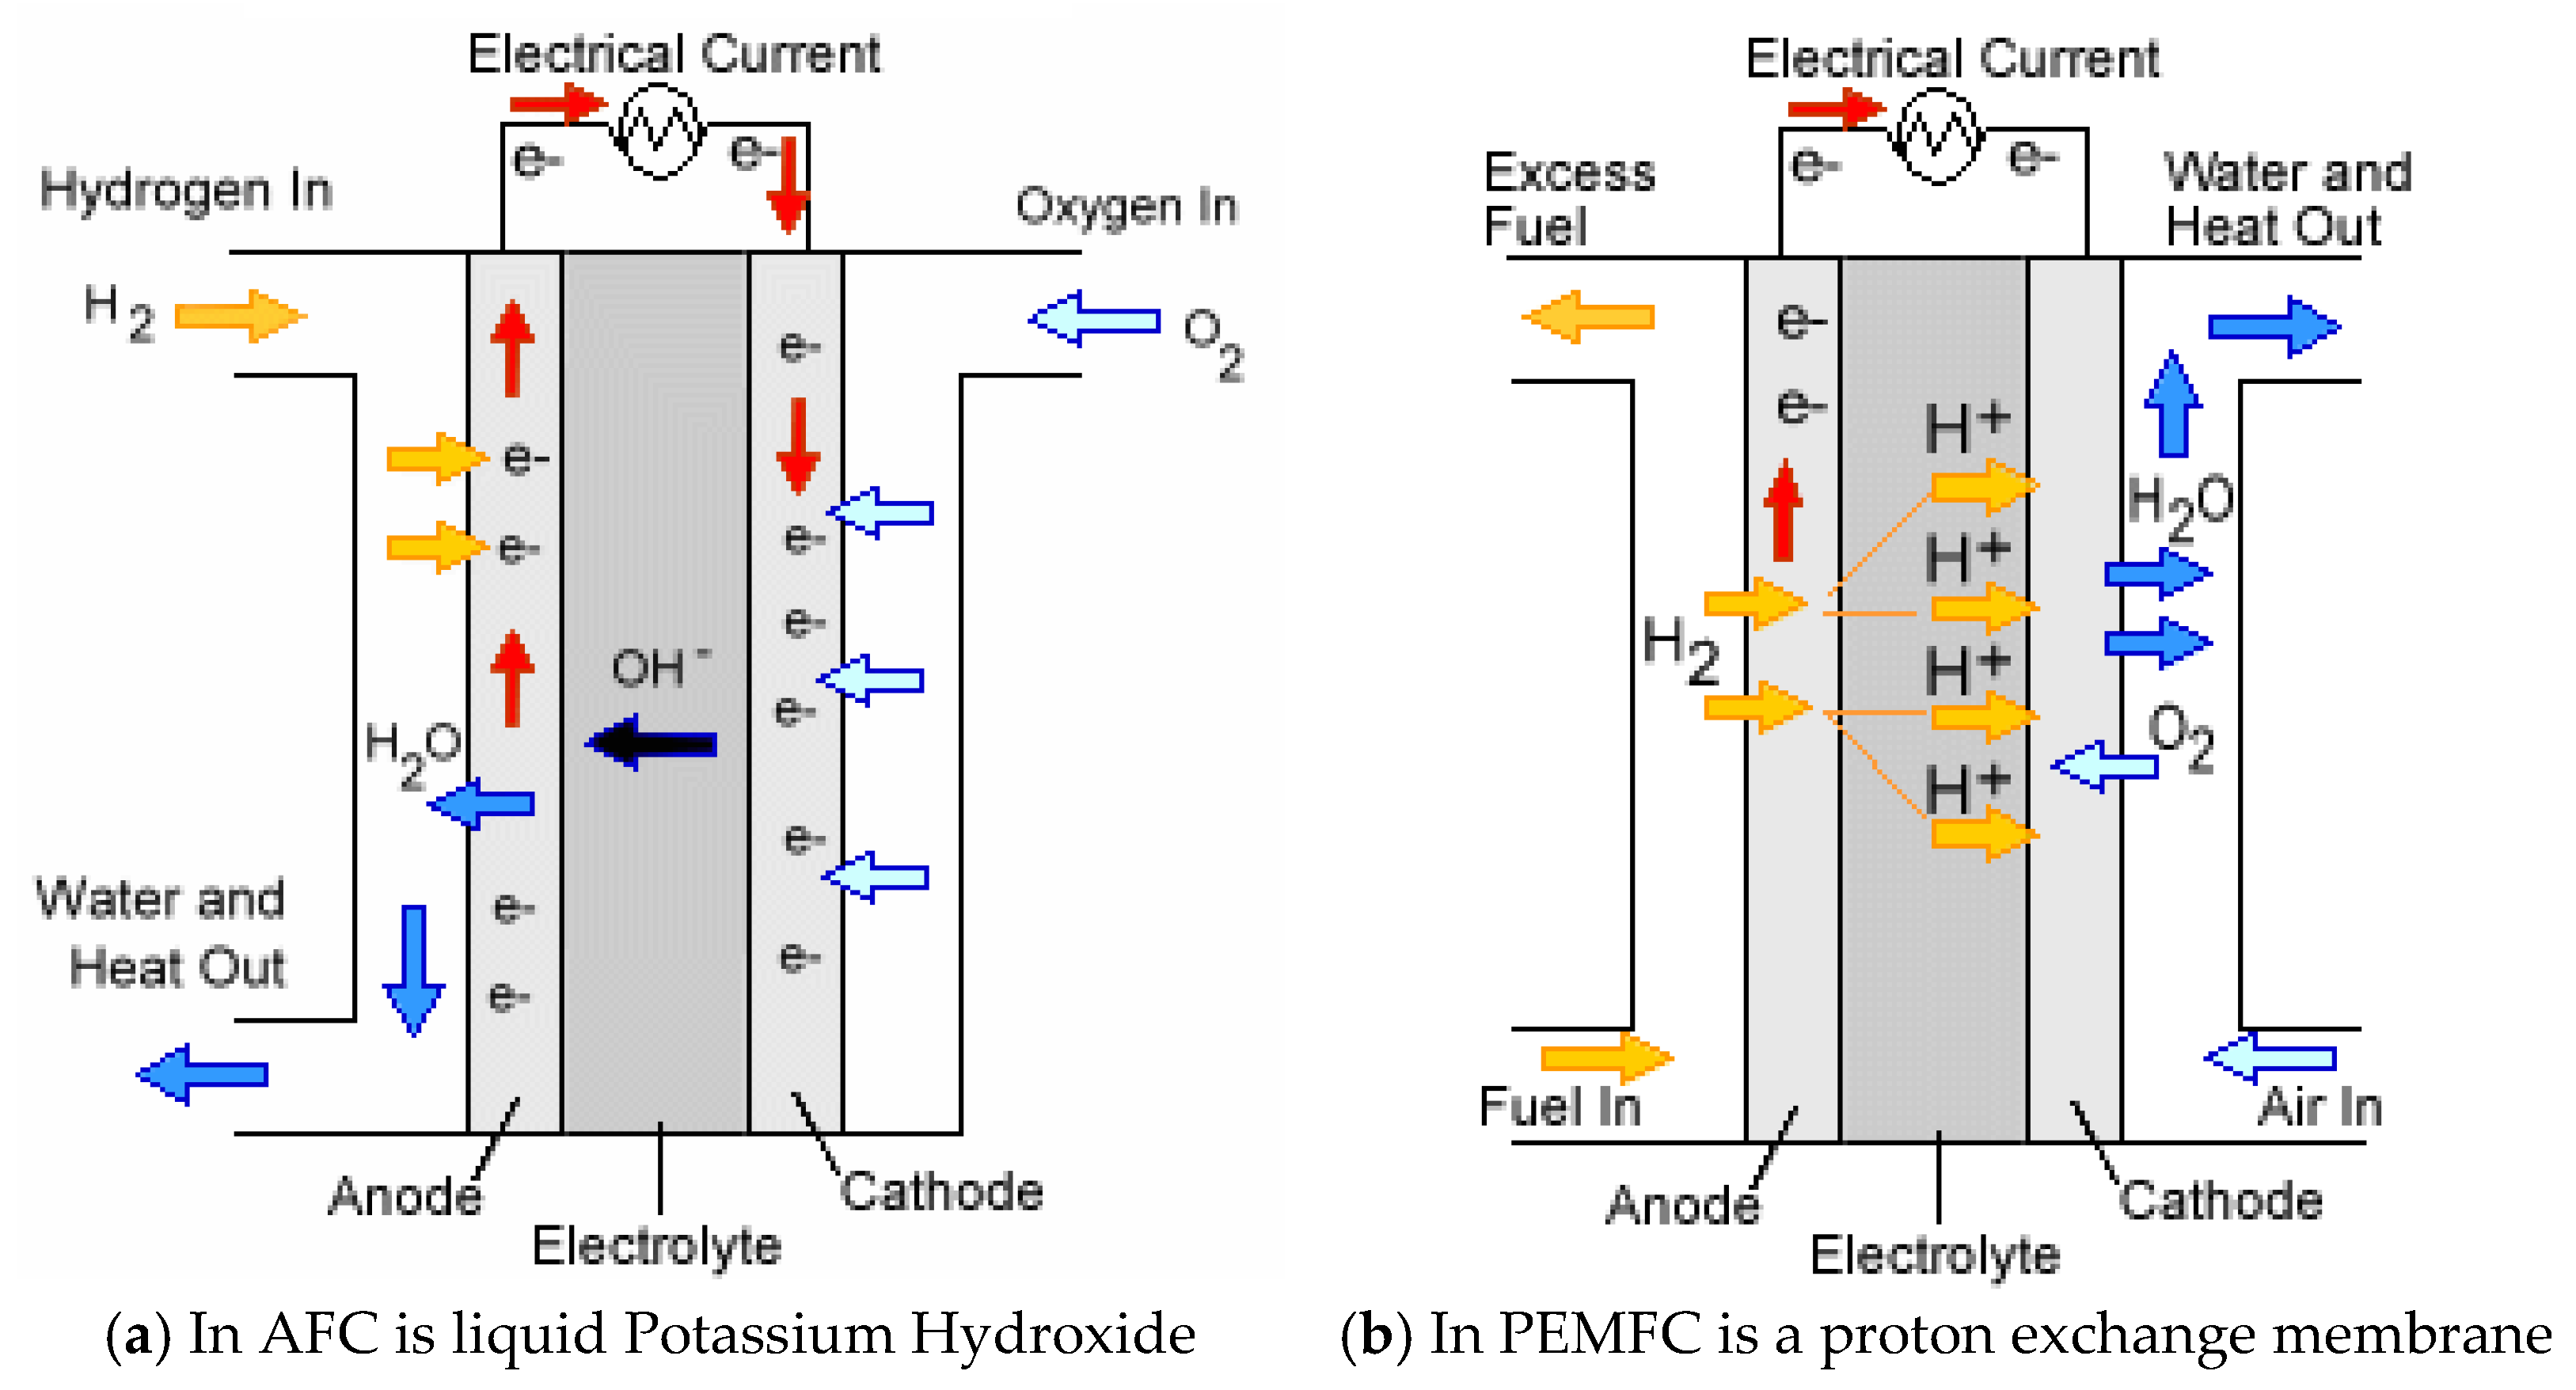
- Low temperature fuel cells are AFC (Alkaline Fuel Cell), PEMFC (Polymer Electrolyte Fuel Cell), DMFC (Direct Methanol Fuel Cell) and PAFC (Phosphoric Acid Fuel Cell).
- High temperature fuel cells operate at 600–1000 ° C. These are of two types: MCFC (Molten Carbnate Fuel Cell) and SOFC (Solid Oxide Fuel Cell).
3.2.3. Applications of Fuel Cells
4. Conclusions
Funding
Conflicts of Interest
References
- European Commission. Directorate-General for Energy and Transport-Hydrogen Energy and Fuel Cells-A Vision of Our Future; Office for Official Publications of the European Communities: Luxembourg, 2003; ISBN 92-894-5589-6. [Google Scholar]
- The Fuel Cells and Hydrogen Joint Undertaking (FCH JU). Available online: https://www.fch.europa.eu/fchju-projects/h2020 (accessed on 2 August 2021).
- Hydrogen and Fuel Cell Technologies Office. Available online: https://www.energy.gov/eere/fuelcells/hydrogen-production-natural-gas-reforming (accessed on 2 August 2021).
- Das, D.; Veziroglu, T.N. Advances in biological hydrogen production processes. Int. J. Hydrog. Energy 2008, 33, 6046–6057. [Google Scholar] [CrossRef]
- Ampelli, C.; Centi, G.; Passalacqua, R.; Perathoner, S. Electrolyte-less design of PEC cells for solar fuels: Prospects and openissues in the development of cells and related catalytic electrodes. Catal. Today 2016, 259, 246–258. [Google Scholar] [CrossRef]
- Wijayantha, K.G.U.; Auty, D.H. Twin Cell Technology for Hydrogen Generation. In Encyclopedia of Materials: Science and Technology, 2nd ed.; Elsevier: Oxford, UK, 2005; pp. 1–5. [Google Scholar]
- Adriana Urdă- Curs 5. Echilibrul Chimic și Viteza de Reacție în Procesele Chimice- University courses and teaching materials -Procese Catalitice în Protecţia Mediului; Editura Universităţii din Bucureşti: Bucharest, Romania, 2005; 164p. (In Romanian) [Google Scholar]
- Khan Academy. Available online: https://www.khanacademy.org/science/biology/energy-and-enzymes/free-energy-tutorial/a/gibbs-free-energy (accessed on 2 August 2021).
- Badea, N.; Badea, G.V. Surseregenerabile de Energie; Editura Fundaţiei Universitare “Dunărea de Jos” din Galaţi: Galati, Romania, 2017; 360p, ISBN 978-973-627-594-4. [Google Scholar]
- Dupont, V. Steam reforming of sunflower oil for hydrogen gas production/oxidación catalítica del aceite de girasol en la producción del gas hidrógeno/reformage à la vapeur de l’huile de tournesol dans la production de gaz hydrogène. Helia 2007, 30, 103–132. [Google Scholar] [CrossRef]
- Hydrogen Tools. Available online: https://h2tools.org (accessed on 2 August 2021).
- Shivaprasad, K.V.; Rajesh, R.; Wogasso, W.A.; Nigatu, B.; Addisu, F. Usage of hydrogen as a fuel in spark ignition engine. In IOP Conference Series: Materials Science and Engineering; IOP Publishing: Bristol, UK, 2018; Volume 376, p. 012037. [Google Scholar]
- Osama, H. Ghazal-A comparative evaluation of the performance of different fuelinduction techniques for blends hydrogene-methane SI engine. Int. J. Hydrog. Energy 2013, 38, 6848–6856. [Google Scholar] [CrossRef]
- Negurescu, N.; Pana, C.; Cernat, A. Aspects of Using Hydrogen in SI Engine. Univ. Politehnica Buchar. Sci. Bull. Ser. D Mech. Eng. 2012, 74, 11–20, ISSN 1454-2358. [Google Scholar]
- Brayek, M.; Jemni, M.A.; Driss, Z.; Kantchev, G.; Abid, M.S. Study of Spark-Ignition Engine Fueled with Hydrogen Produced by the Reaction Between Aluminum and Water in Presence of KOH. Arab. J. Sci. Eng. 2019, 44, 695–705. [Google Scholar] [CrossRef]
- Al-Baghdadi, M.A.S. Hydrogen–ethanol blending as an alternative fuel of spark ignition engines. Renew. Energy 2003, 28, 1471. [Google Scholar] [CrossRef]
- Earth Science Australia. Available online: http://earthsci.org/mineral/energy/fuelcell/fuelcell.html (accessed on 2 August 2021).
- Hermann, A.; Chaudhuri, T.; Spagnol, P. Bipolar plates for PEM fuel cells: A review. Int. J. Hydrog. Energy 2005, 30, 1297–1302. [Google Scholar] [CrossRef]
- Nicolae, B.; Vlad, B.G. Low Emission Infrastructure for Powered EVs. In Proceedings of the 2019 Electric Vehicles International Conference (EV), Icpe Solar Park, Bucharest, Romania, 3–4 October 2019. [Google Scholar]
- Ehsani, M.; Gao, Y.; Longo, S.; Ebrahimi, K.M. Modern Electric, Hybrid Electric, and Fuel Cell Vehicles-Fundamentals, Theory, and Design; CRC Press: Boca Raton, FL, USA, 2005; ISBN 0-8493-3154-4. [Google Scholar]
- Onovwionaa, H.I.; Ugursal, V.I. Residential cogeneration systems: Review of the current technology. Renew Sust. Energy Rev. 2006, 10, 389–431. [Google Scholar] [CrossRef]
- Pade, L.L.; Schröder, S.T. Fuel cell based micro-combined heat and power under different policy frameworks—An economic analysis. Energy Convers. Manag. 2013, 66, 295–303. [Google Scholar] [CrossRef] [Green Version]
- Badea, N.; Paraschiv, I.; Oanca, M. Micro CHP with fuel cell for boiler supply. In Proceedings of the 4th International Symposium on Electrical and Electronics Engineering (ISEEE), Galaţi, Romania, 11–13 October 2013. [Google Scholar]


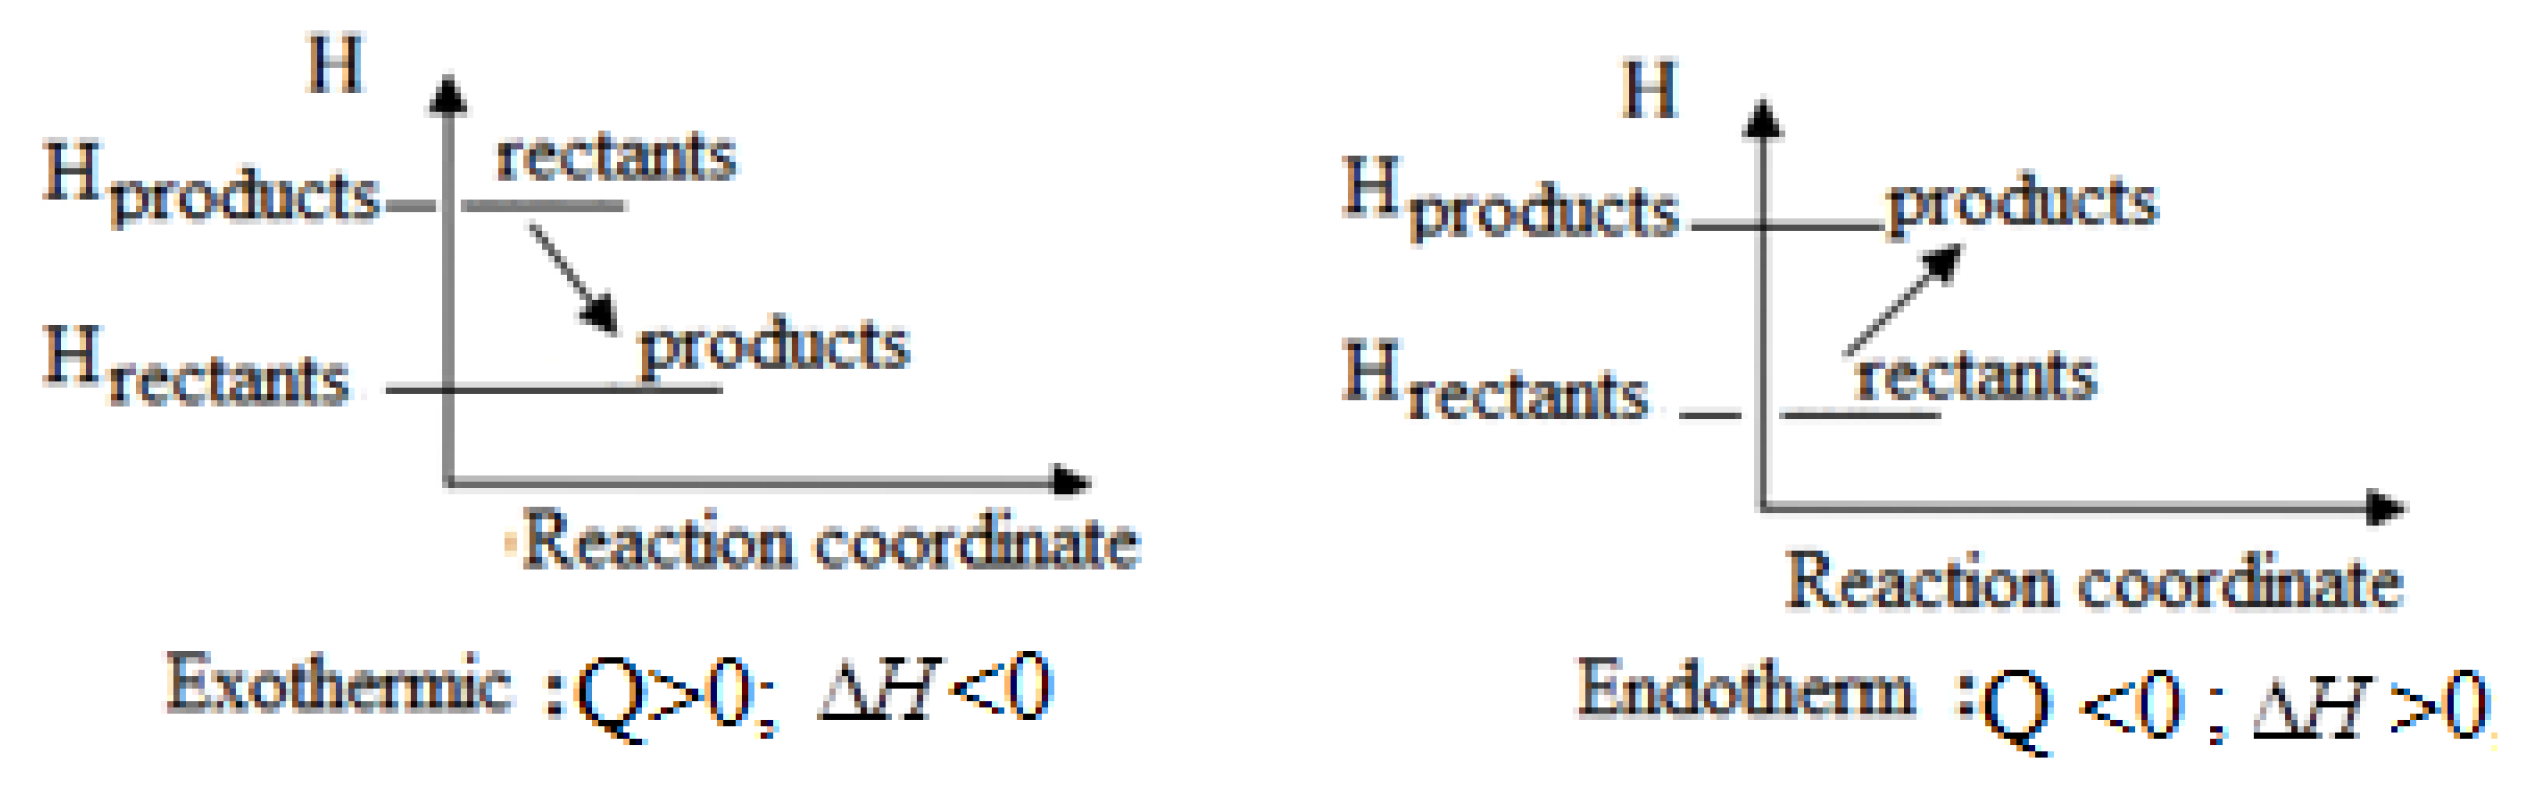
| H2O | H2 | 0.5O2 | Final-Initial Difference | |
|---|---|---|---|---|
| Enthalpy [kJ] | −285.83 | 0 | 0 | ΔH = 285.83 |
| Entropy [J/°K] | 69.91 | 130.68 | 0.5 × 205.14 | ΔS = 48.7 |
| Production Process | Natural Gas Reformation | Electrolysis of Water | Coal Gasification | Gasification of Biomass |
|---|---|---|---|---|
| Energy inputs, Gross units | ||||
| Wood, kg | - | - | - | 13.49 |
| Natural gas, Nm3 | 4.50 | - | - | 0.17 |
| Electricity, kWh | 0.57 | 50.00 | - | 0.98 |
| Coal, kg | - | - | 8.51 | - |
| The energy equivalent of the inputs | ||||
| Wood, kWh | - | - | - | 73 |
| Natural gas, kWh | 46 | - | 2 | |
| Electricity, kWh | 1 | 50 | - | 1 |
| Coal, kWh | - | - | 65 | - |
| Energy outputs, Gross units | ||||
| Hydrogen, kg | 1 | 1 | 1 | 1 |
| Electricity, kWh | - | - | 3.18 | - |
| The energy equivalent of the outputs | ||||
| Hydrogen, kWh | 33 | 33 | 33 | 33 |
| Electricity, kWh | - | - | 3.17 | - |
| Conversion efficiency | 72.0% | 66.8% | 55.9% | 44.0% |
| H2 | 0.5O2 | H2O | Final-Initial Difference | |
|---|---|---|---|---|
| Enthalpy [kJ] | 0 | 0 | −285.83 | ΔH = −285.83 |
| Entropy [J/°K] | 130.68 | 0.5 × 205.14 | 69.91 | ΔS = −48.7 |
| Substance | State of Chemical Element * | |||
|---|---|---|---|---|
| Oxygen | O(g) | 0 | 0 | 0 |
| Hydrogen | H(g) | 0 | 0 | 0 |
| Carbon | C(s) | 0 | 0 | 0 |
| The water | H2O(l) | −286.2 | −0.01641 | −237.3 |
| The water | H2O(g) | −242 | −0.045 | −228.7 |
| Methane | CH4(g) | −74.9 | −0.081 | −50.8 |
| Methanol | CH3OH(l) | −238.7 | −0.243 | −166.3 |
| Ethanol | C2H5OH(l) | −277.7 | −0.345 | −174.8 |
| Carbon monoxide | CO(g) | −111.6 | 0.087 | −137.4 |
| Carbon dioxide | CO2 | −393.8 | 0.003 | −394.6 |
| Ammonia | NH3(g) | −46.05 | −0.099 | −16.7 |
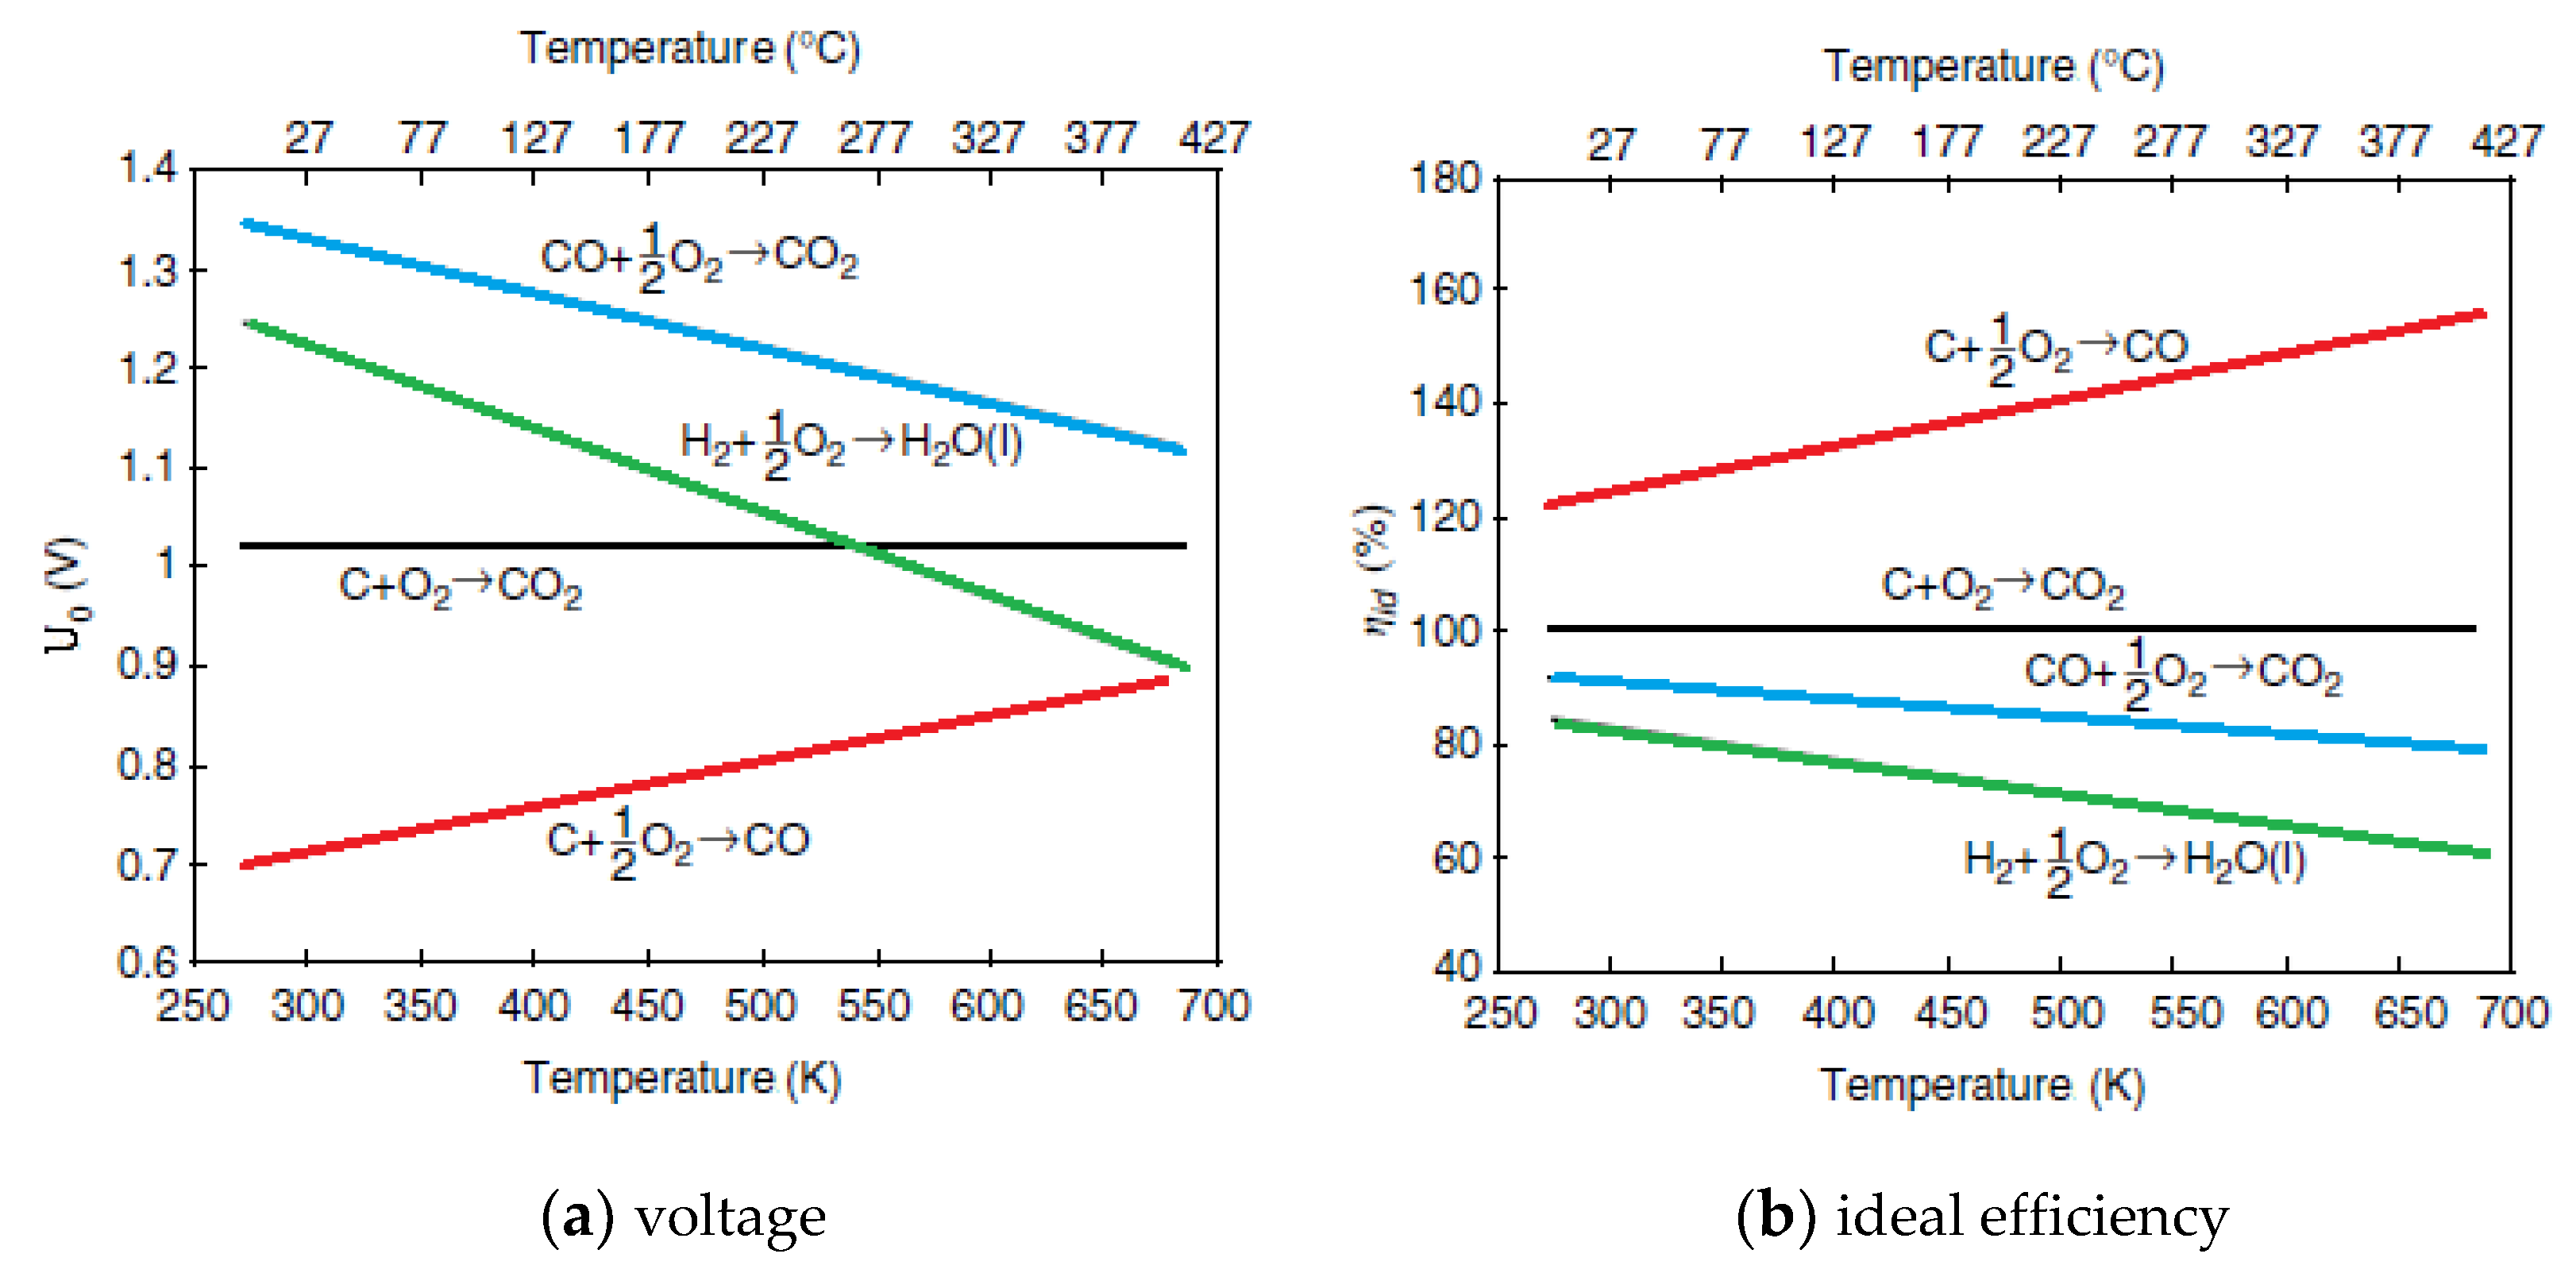
| Reaction | z | |||||
|---|---|---|---|---|---|---|
| H2 +O2 H2O (l) | −286.2 | −0.01641 | −237.3 | 2 | 1.23 | 83 |
| H2 +O2H2O (g) | −242 | −0.045 | −228.7 | 2 | 1.19 | 94 |
| C +O2CO (g) | −111.6 | 0.087 | −137.4 | 2 | 0.71 | 124 |
| C + O2CO2 (g) | −393.8 | 0.003 | −394.6 | 4 | 1.02 | 100 |
| CO +O2CO2 (g) | −279.2 | −0.087 | −253.3 | 2 | 1.33 | 91 |
| AFC | PEMFC | DMFC | PAFC | MCFC | SOFC | |
|---|---|---|---|---|---|---|
| Operating temperature (°C) | <100 | 60–100 | 60–120 | 160–220 | 600–800 | 800–1000 |
| The electrolyte load carrier | ||||||
| Electrolyte type | lichid | Solid | solid | lichid | lichid | Solid |
| Anode reactions | ||||||
| Cathode reactions | ||||||
| Applications | Transport The space program Military field Energy storage systems | Electricity and heat production in decentralized stationary energy systems | Electricity and heat production in decentralized stationary energy systems and transport (trains, ships, …) | |||
| Power realized | 5–150 kW | 5–250 kW | 5 kW | 50 kW–11 MW | 100 kW–2 MW | 100–250 kW |
| Year | % of New Car by Zero–Carbon | % of Fleet Fuelled by Hydrogen | Average CO2 Reduction | CO2/Year Avoided (MtCO2) |
|---|---|---|---|---|
| 2020 | 5 | 2 | 2.8 g/km | 15 |
| 2030 | 25 | 15 | 21.0 g/km | 112 |
| 2040 | 35 | 32 | 44.8 g/km | 240 |
Publisher’s Note: MDPI stays neutral with regard to jurisdictional claims in published maps and institutional affiliations. |
© 2021 by the author. Licensee MDPI, Basel, Switzerland. This article is an open access article distributed under the terms and conditions of the Creative Commons Attribution (CC BY) license (https://creativecommons.org/licenses/by/4.0/).
Share and Cite
Badea, N.I. Hydrogen as Energy Sources—Basic Concepts. Energies 2021, 14, 5783. https://doi.org/10.3390/en14185783
Badea NI. Hydrogen as Energy Sources—Basic Concepts. Energies. 2021; 14(18):5783. https://doi.org/10.3390/en14185783
Chicago/Turabian StyleBadea, Nicolae I. 2021. "Hydrogen as Energy Sources—Basic Concepts" Energies 14, no. 18: 5783. https://doi.org/10.3390/en14185783
APA StyleBadea, N. I. (2021). Hydrogen as Energy Sources—Basic Concepts. Energies, 14(18), 5783. https://doi.org/10.3390/en14185783