1. Introduction
The integration of distributed energy resources (DERs) into distribution networks has significantly increased with the growing demand for uninterrupted and clean power for sustainable energy supply. However, it is imperative to disconnect the DERs from the rest of the network during an unintentional islanding event owing to (1) safety concerns for working personnel and DERs, (2) uncoordinated protection, (3) loss of control over frequency and voltage, and (4) inadequate grounding [
1,
2]. According to the IEEE standards, the islanded DER should be disconnected from the rest of the network within 2 s [
3].
Several islanding detection methods (IDMs) have been developed, which can be broadly grouped as centralized and local methods [
4]. The centralized IDMs use communication channels and advanced signal processing techniques to detect islanding events [
5]. The schemes identify the islanding event by using a communication network between the DERs and the substation. These methods include power line carrier communication [
6], supervisory control and data acquisition systems, wide area phasor estimation, remote-end measurements [
7], and transfer trip [
8]. The centralized IDMs have a very small NDZ and hence offer high reliability and security. However, they are not preferred because of their complex structure, high implementation cost, and possible communication failure [
9].
The local IDMs monitor the electrical parameters retrieved at the terminal of the targeted DERs or PCC. Variations in the parameters beyond a pre-specified threshold value depict an islanding event. The local IDMs can be further classified into active and passive IDMs [
9,
10,
11,
12,
13,
14,
15,
16,
17,
18,
19,
20]. In active IDMs, a small disturbance is injected into the electrical networks, and the signal is measured and analyzed at the terminal of DERs or PCC. During normal operation, the main utility maintains the parameters close to nominal values, and the small disturbance cannot significantly affect the parameters. However, when islanding events occur, the injected disturbance has a significant effect on the network parameters [
9]. The active IDMs are relatively slow compared to centralized IDMs owing to the intrinsic reaction time of the power system. A few important active IDMs are the active frequency drift (AFD) [
10], impedance measurement method [
11], and Sandia frequency shift (SFS) [
12]. Various active IDMs are developed for inverter interfaced DERs by modifying their control system. These IDMs either introduce positive feedback of voltage, increase reactive and real power references [
13,
14], or inject d-axis current [
1]. The active IDMs have a very small NDZ. However, they have various drawbacks which include (1) reduced power quality, (2) complex controller modifications for inverter interfaced DERs, (3) unwanted transient behavior, and (4) performance reduction in case of multiple DERs [
2].
Passive IDMs use a fixed or an adaptive threshold value on time and/or frequency domain signatures to differentiate between islanding and non-islanding events. The threshold-based time-domain passive IDMs [
15,
16] are easy to implement and economical; however, they have a significantly larger NDZ. The frequency-domain passive IDMs [
9,
17,
18], employ signal processing methods to obtain islanding signatures. The passive IDMs have convincing performances in the situations of large power mismatches. However, the performance decreases significantly if the mismatch is small. Moreover, the selection of a threshold value for all operating conditions is a challenging task.
To overcome the issues of passive IDMs, modified passive IDMs have been developed [
18,
19,
20,
21,
22]. In these IDMs, firstly, the signal processing schemes are employed to extract the distinct features from the power system parameters; afterward, artificial intelligence/machine learning techniques are used to differentiate islanding patterns from non-islanding ones. The methods include random forest [
19], probabilistic neural networks [
20], artificial neural networks [
21,
22], and support vector machine [
23].
The above-presented IDMs have tried to improve detection performance from different aspects. However, each method has some limitations; centralized IDMs are complex, uneconomical, and prone to communication failure, whereas active IDMs deteriorate the power quality. Passive IDMs have low speed and a large NDZ. Besides, some methods are only applicable to inverter-based DERs. Therefore, it is vital to design a comprehensive and intelligent islanding detection scheme that upholds its performance for all types of system operating conditions and DERs.
This paper develops an intelligent islanding detection scheme (IIDS)-based on the empirical wavelet transform (EWT) and long short-term memory (LSTM) networks. First, the three-phase voltage signal is retrieved at the terminal of a targeted DER unit or PCC. Then, the EWT is used to decompose the three-phase voltage signal into empirical modes (EM). Next, the Hilbert transform is employed to compute the instantaneous amplitudes and instantaneous frequencies of each phase. Afterward, the joint instantaneous amplitude and frequency are calculated from the amplitudes and frequencies of the three phases. Later, various statistical features are extracted from the joint instantaneous amplitude and frequency. Finally, the features along with the three-phase voltage signals are input to the LSTM network to differentiate between islanding and non-islanding events.
The main contributions of this study are as follows:
- (1)
Intelligent islanding detection: An IIDS based on EWT and LSTM is proposed. The concept of EWT is extended for islanding detection problems. Unlike existing methods, the proposed scheme extracts the features using signal-adaptive filter banks
- (2)
Long short-term temporal features: The proposed scheme employs an LSTM network for extracting the long and short-term temporal dependencies from the three-phase voltage to improve the islanding detection performance
- (3)
Comprehensive Islanding Detection Method: Extensive simulations are conducted on two standard distribution networks, and the results confirm that the proposed IIDS has a very small NDZ and can differentiate islanding events from non-islanding event and faults. Furthermore, the proposed IIDS is applicable to both synchronous-based DERs and inverter-based DERs.
Comparisons with traditional artificial intelligence techniques show that the proposed IIDS has superior performance under perfect as well as noisy measurements. Furthermore, tests on various LSTM network architectures validate that the proposed architecture offers superior training and testing accuracies.
The rest of the paper is structured as follows:
Section 2 introduces background theory.
Section 3 provides the details of the proposed IIDS.
Section 4 describes the test system and islanding data generation.
Section 5 presents the simulation results. Finally, the paper is summarized in
Section 6.
3. Proposed Intelligent Islanding Detection Scheme
The study develops an IIDS-based on the EWT and LSTM. First, the three-phase voltage signal, retrieved at the terminal of a targeted DER unit or PCC, is decomposed into EMs. Next, the instantaneous amplitudes and instantaneous frequencies of EMs for each phase is computed by Hilbert transform. Afterward, joint instantaneous amplitude and frequency are calculated from the amplitudes and frequencies of the three phases. Later, various statistical features are extracted from the joint instantaneous amplitude and frequency. Finally, the features and the three-phase voltage signals are input into LSTM networks to distinguish the islanding events from non-islanding events.
This section first describes the EWT for islanding detection. Then, the structure of the LSTM network for islanding detection is presented.
3.1. EWT for Islanding Detection
The proposed IIDS uses three-phase voltage signals as the input to detect the islanding events. However, the EWT cannot be applied to three-phase signals without some modifications. Therefore, to extend the idea of EWT for three-phase voltage signals, we employ the concept of multichannel signals [
25]. First, the EMs of each phase voltage signal are obtained by using EWT. Then, the Hilbert transform is used to calculate the instantaneous amplitude and frequency of each phase, which are combined to compute the joint instantaneous amplitude and frequency at each EM. The criteria of obtaining joint instantaneous amplitude and frequency are that the frequencies of the EMs falling in the same frequency level for each individual phase must be very close to each other. Therefore, the critical task is to find the matched EMs for the three-voltage signals. The three-phase voltage signal at the terminals of a DER can be represented as
where
and
represent the voltages of phase
a,
b, and
c. respectively. As EWT constructs signal-adaptive wavelet-filters, the EMs corresponding to different phases may differ in number and frequency range. This creates problems in obtaining joint instantaneous amplitude and frequency. To overcome this issue, we used the mean spectrum magnitude of the three-phase voltage, which can be obtained as follows [
25]:
where
is the Fourier spectrum of voltage for phase
k and
is the mean spectrum. The mean spectrum is then used to design the adaptive wavelet filters. The means spectrum ensures that each phase has an equal number of EMs and same frequency range within an EM. Once the mean spectrum is obtained, the wavelet filters are designed to decompose the voltage signal of each phase into EMs.
The first three EMs contains most of the signal information, so this study uses only the first three modes for islanding detection. The decomposed three-phase voltage signal
v(
t) can be represented as follows:
where
show the
Mx empirical mode of phase
k. Once the signal is decomposed into narrow frequency modes, then Hilbert transform is applied to obtain the instantaneous amplitude and frequency of each EM. The instantaneous amplitude
of an EM
Mx of phase
k is given as
where
represents the Hilbert transform operator. The instantaneous phase
and instantaneous frequency
can be obtained from Equations (18) and (19), respectively:
The instantaneous amplitude
A(
t) and instantaneous frequency
f(
t) of the three-phase voltage signal
v(
t) can be described as follows:
The columns of Equations (20) and (21) represent the instantaneous amplitudes and frequencies at different oscillatory levels, respectively.
Finally, the instantaneous amplitudes and frequencies of all the three phases are combined to calculate joint instantaneous amplitude and frequency [
25]:
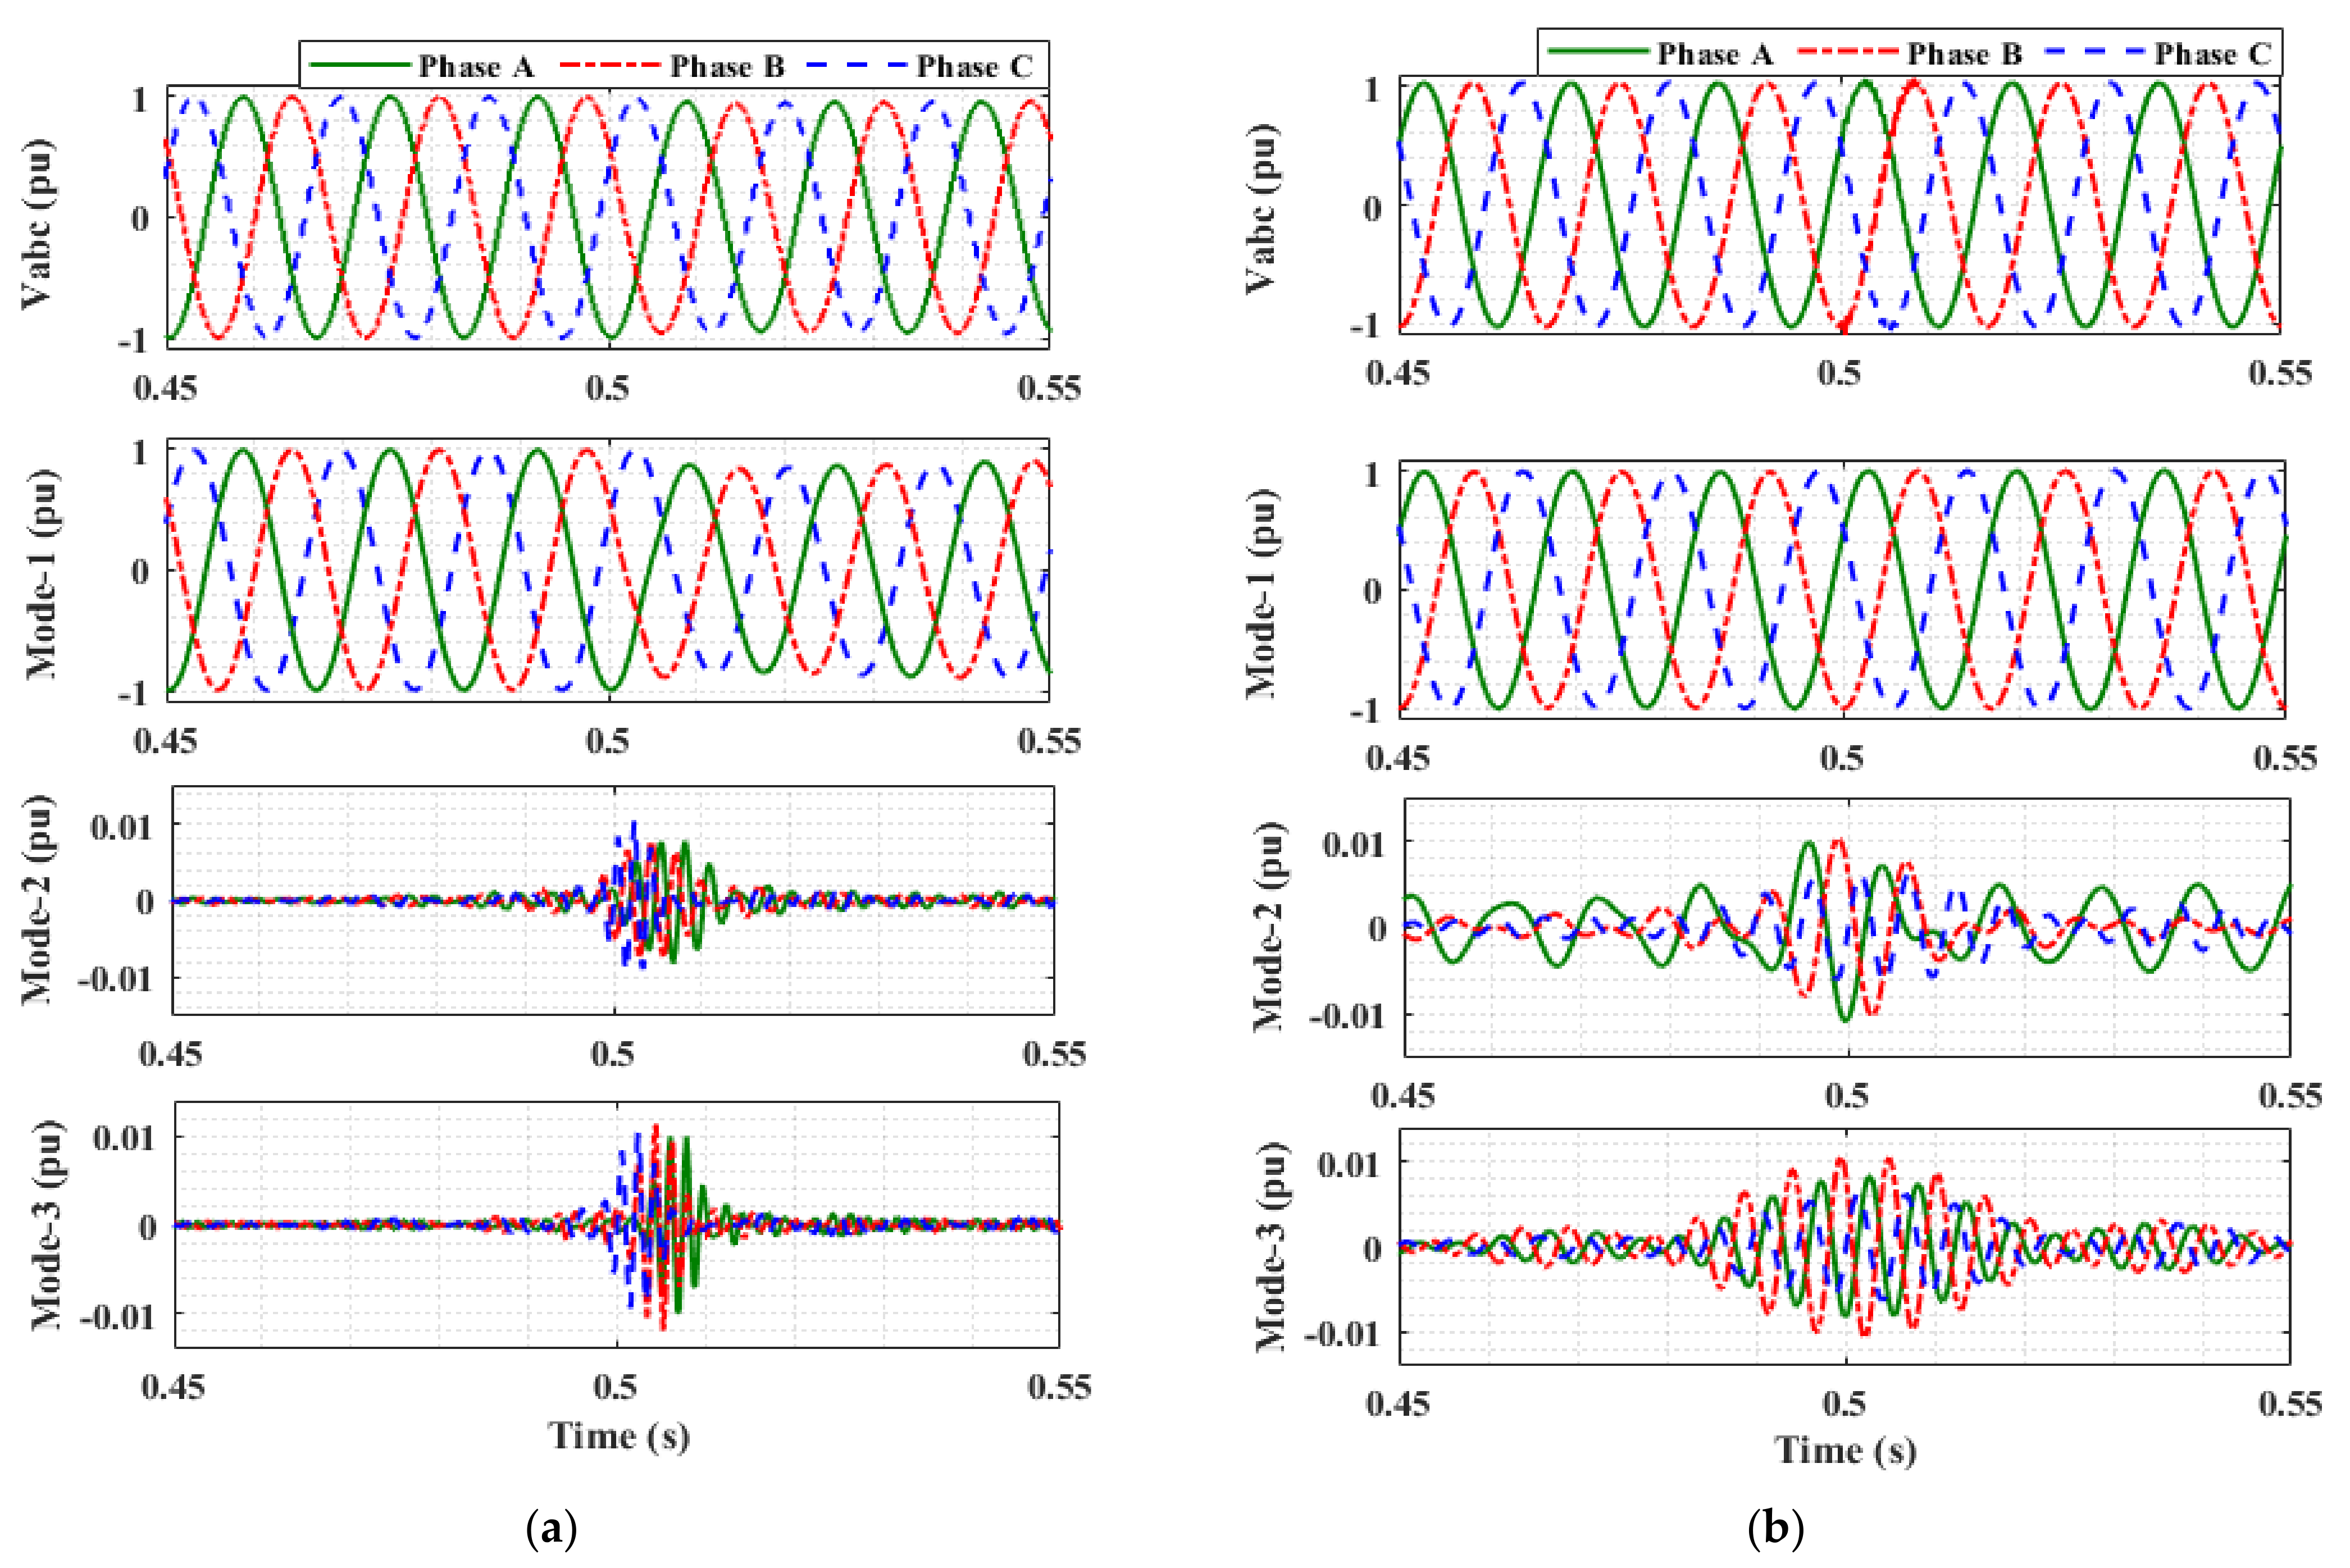
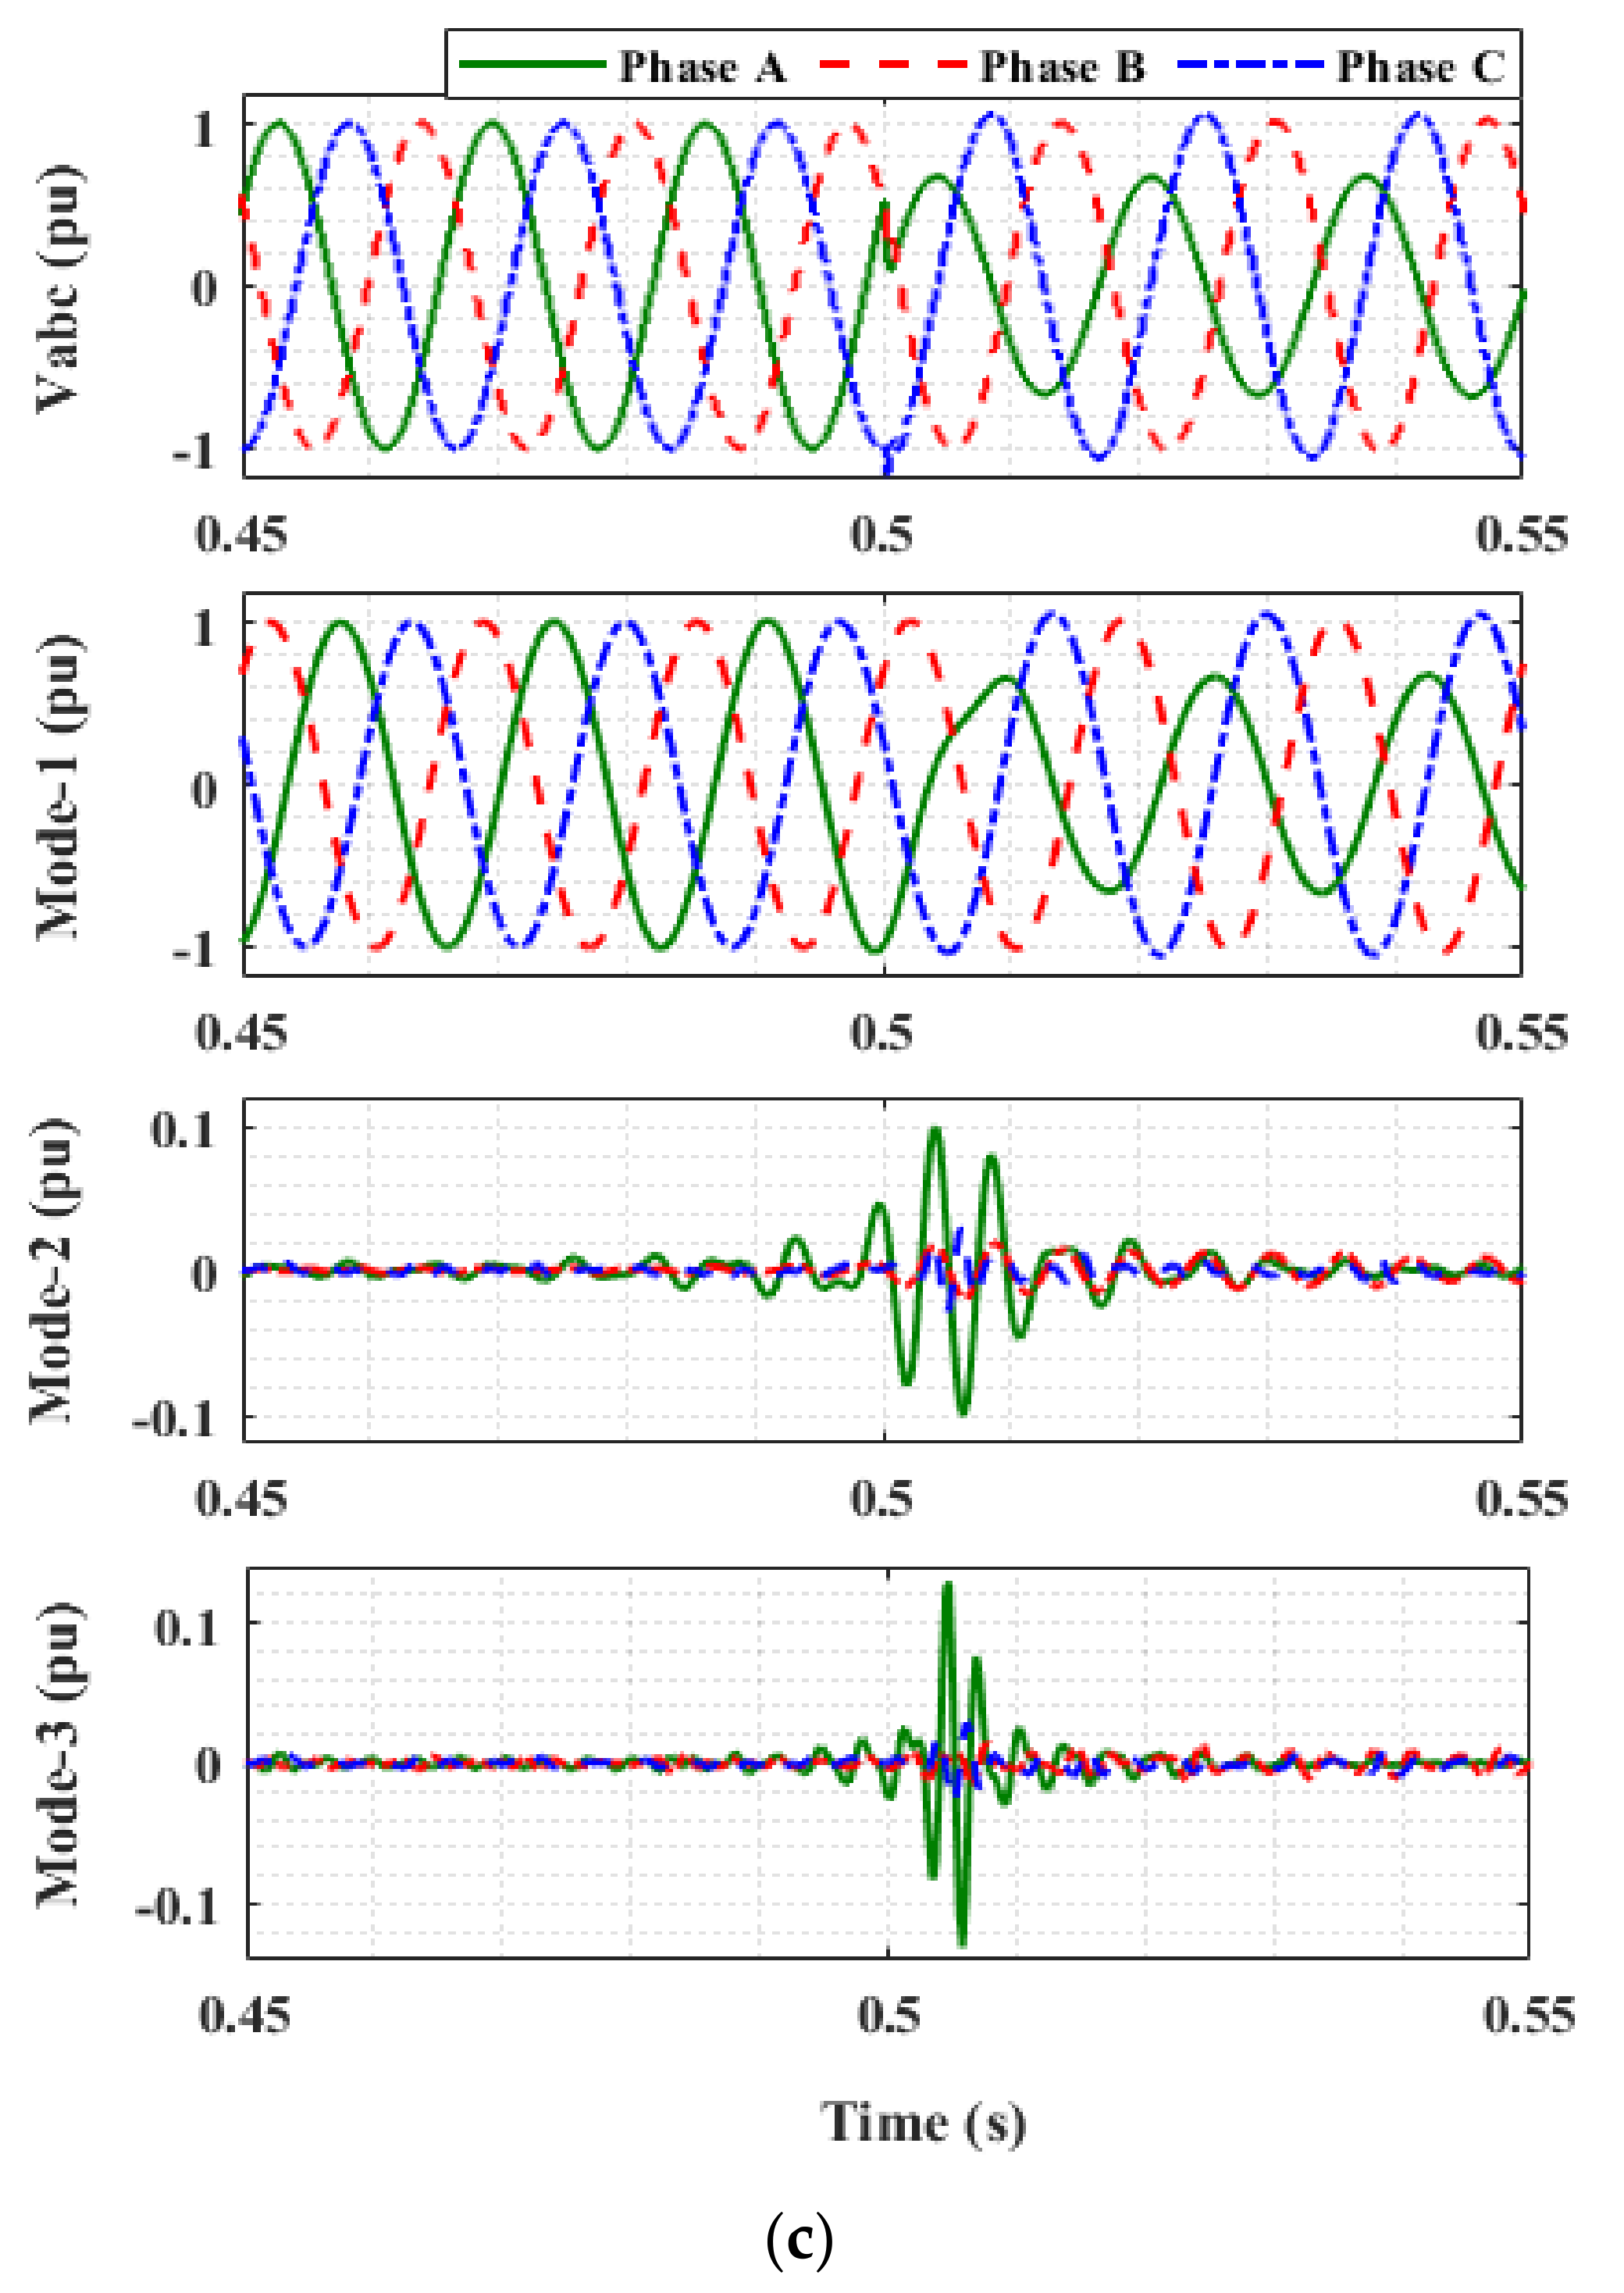
The first three modes of the three-phase voltage signal under different switching and islanding events are shown in
Figure 2. All the events are simulated at 0.5 s. It can be seen from the figure that the EMs obtained during an islanding event have different frequency ranges than the capacitor switching and fault cases. Therefore, the EWT provides an intuitive way to decompose the three-phase voltage signal for islanding detection.
3.2. Feature Extraction
Once the joint instantaneous amplitudes and frequencies of the first three EMs of the three-phase voltage are obtained, the next step is to extract the suitable features. In the proposed IIDS, we extract a series of statistical features from the joint instantaneous amplitude and phase of the first three EMs to develop the input feature vector for the LSTM network. Precisely, this study extracts the following features from the joint instantaneous amplitudes of EMs.
Similarly, to include the information about the frequency components, the following features are obtained from the joint instantaneous phase:
These features are extracted from the first three EMs; therefore, for each cycle of the three-phase voltage signal 3 (EMs) × 8 (features) = 24 features are calculated. These generated features are later input into the LSTM network to distinguish the islanding events from the non-islanding ones.
3.3. LSTM Structure for Islanding Detection
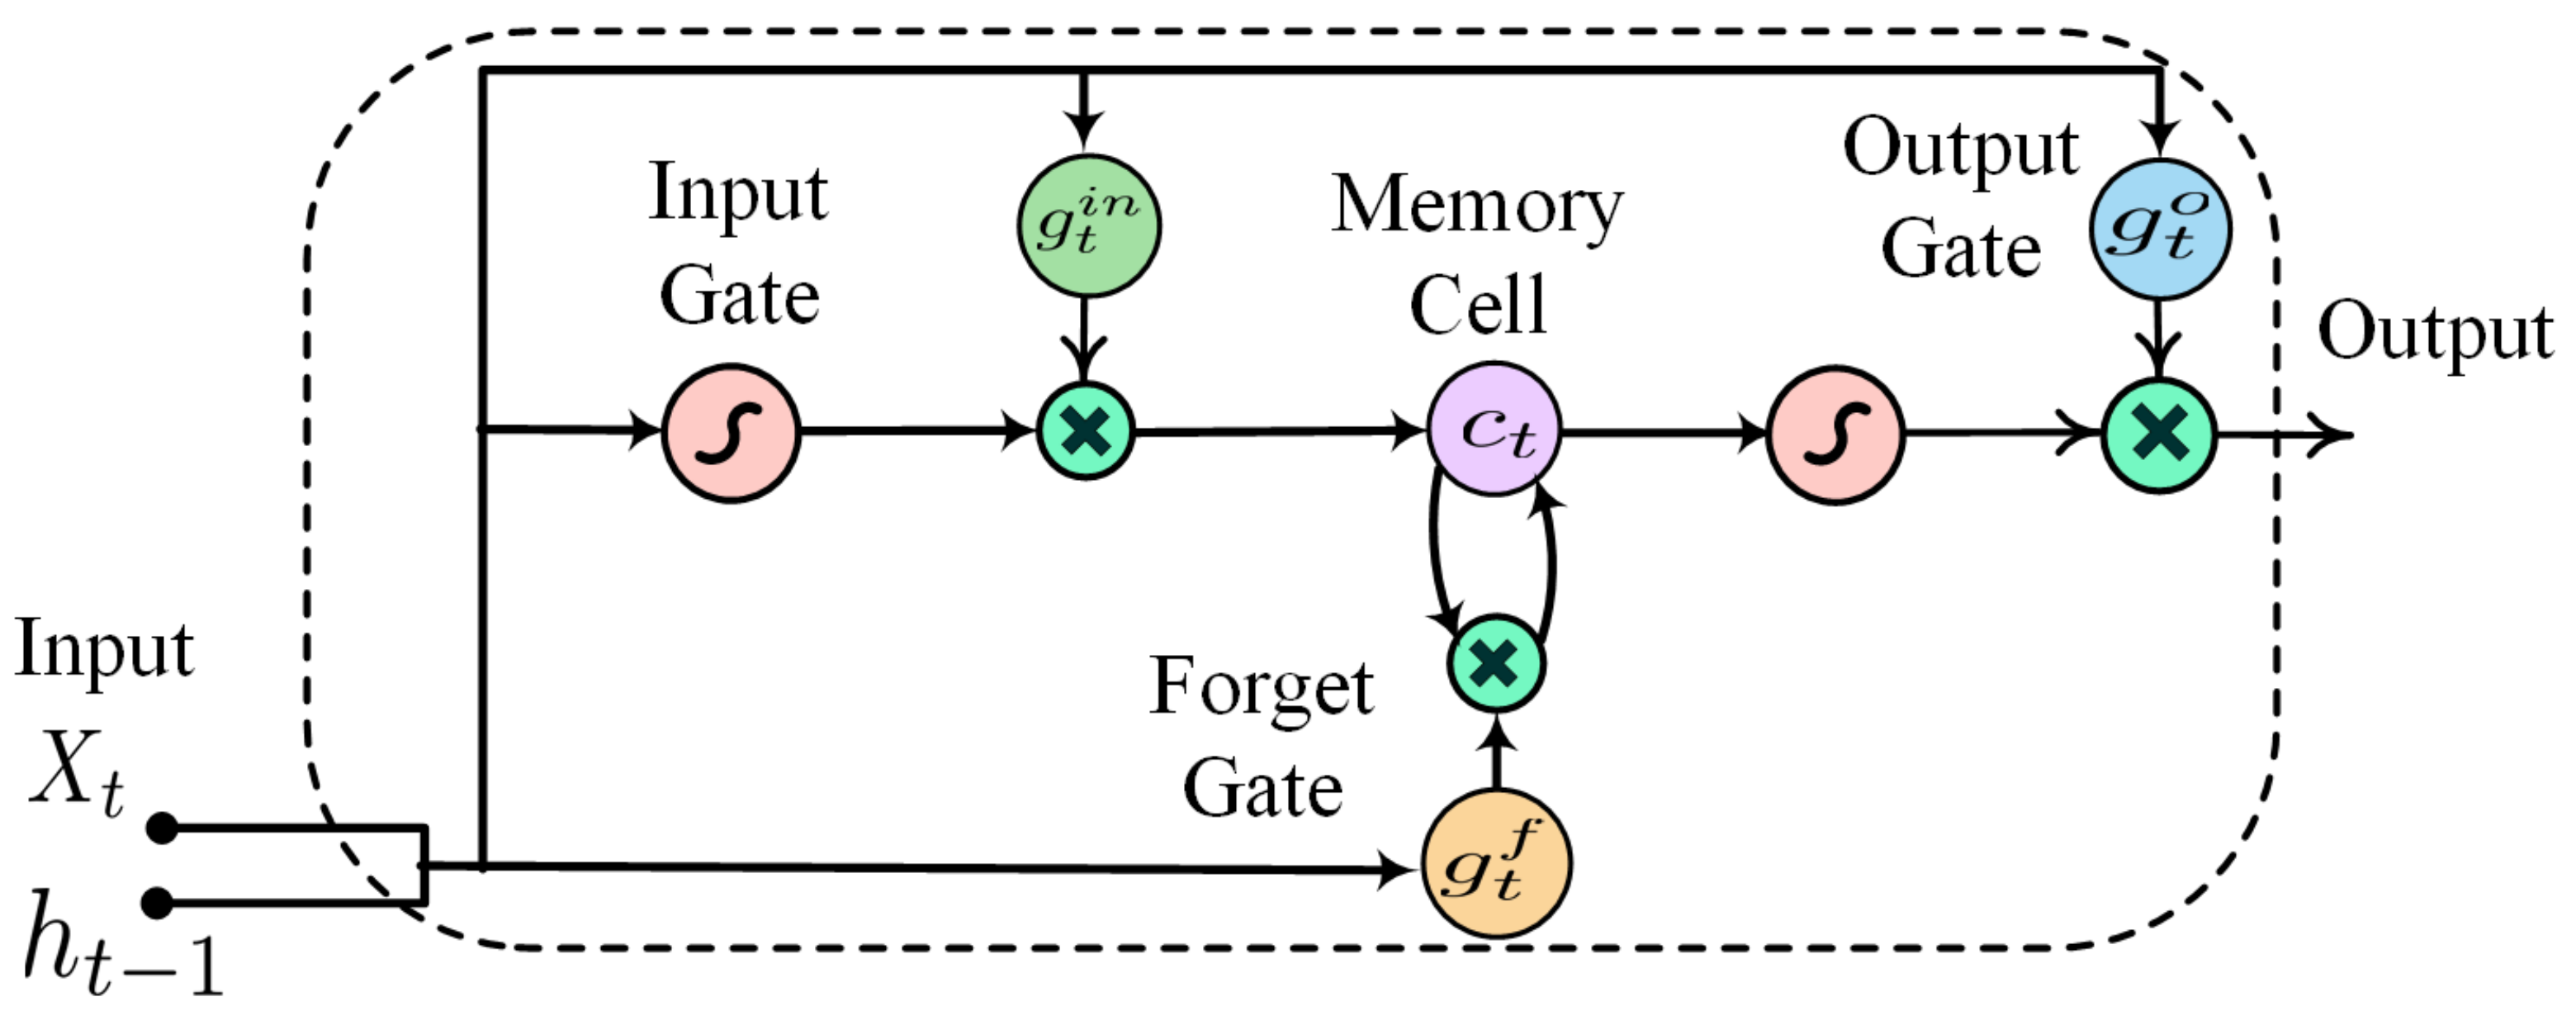
LSTMs are a type of RNN with multiple memory units between the input and output. They are extensively employed for time series modeling and classification. The implementation of LSTMs only involves simple algebraic equations, providing a fast computation speed. This feature makes LSTMs capable of handling data in real-time.
The proposed IIDS is developed based on the assumption that the three-phase voltage measurements can immediately indicate the occurrence of islanding events in the system. This assumption is extensively accepted in the literature [
9,
10,
11,
12,
13,
14,
15,
16,
17,
18,
19,
20]. The proposed IIDS is developed using one cycle of three-phase voltage measurement and the EWT-based extracted features.
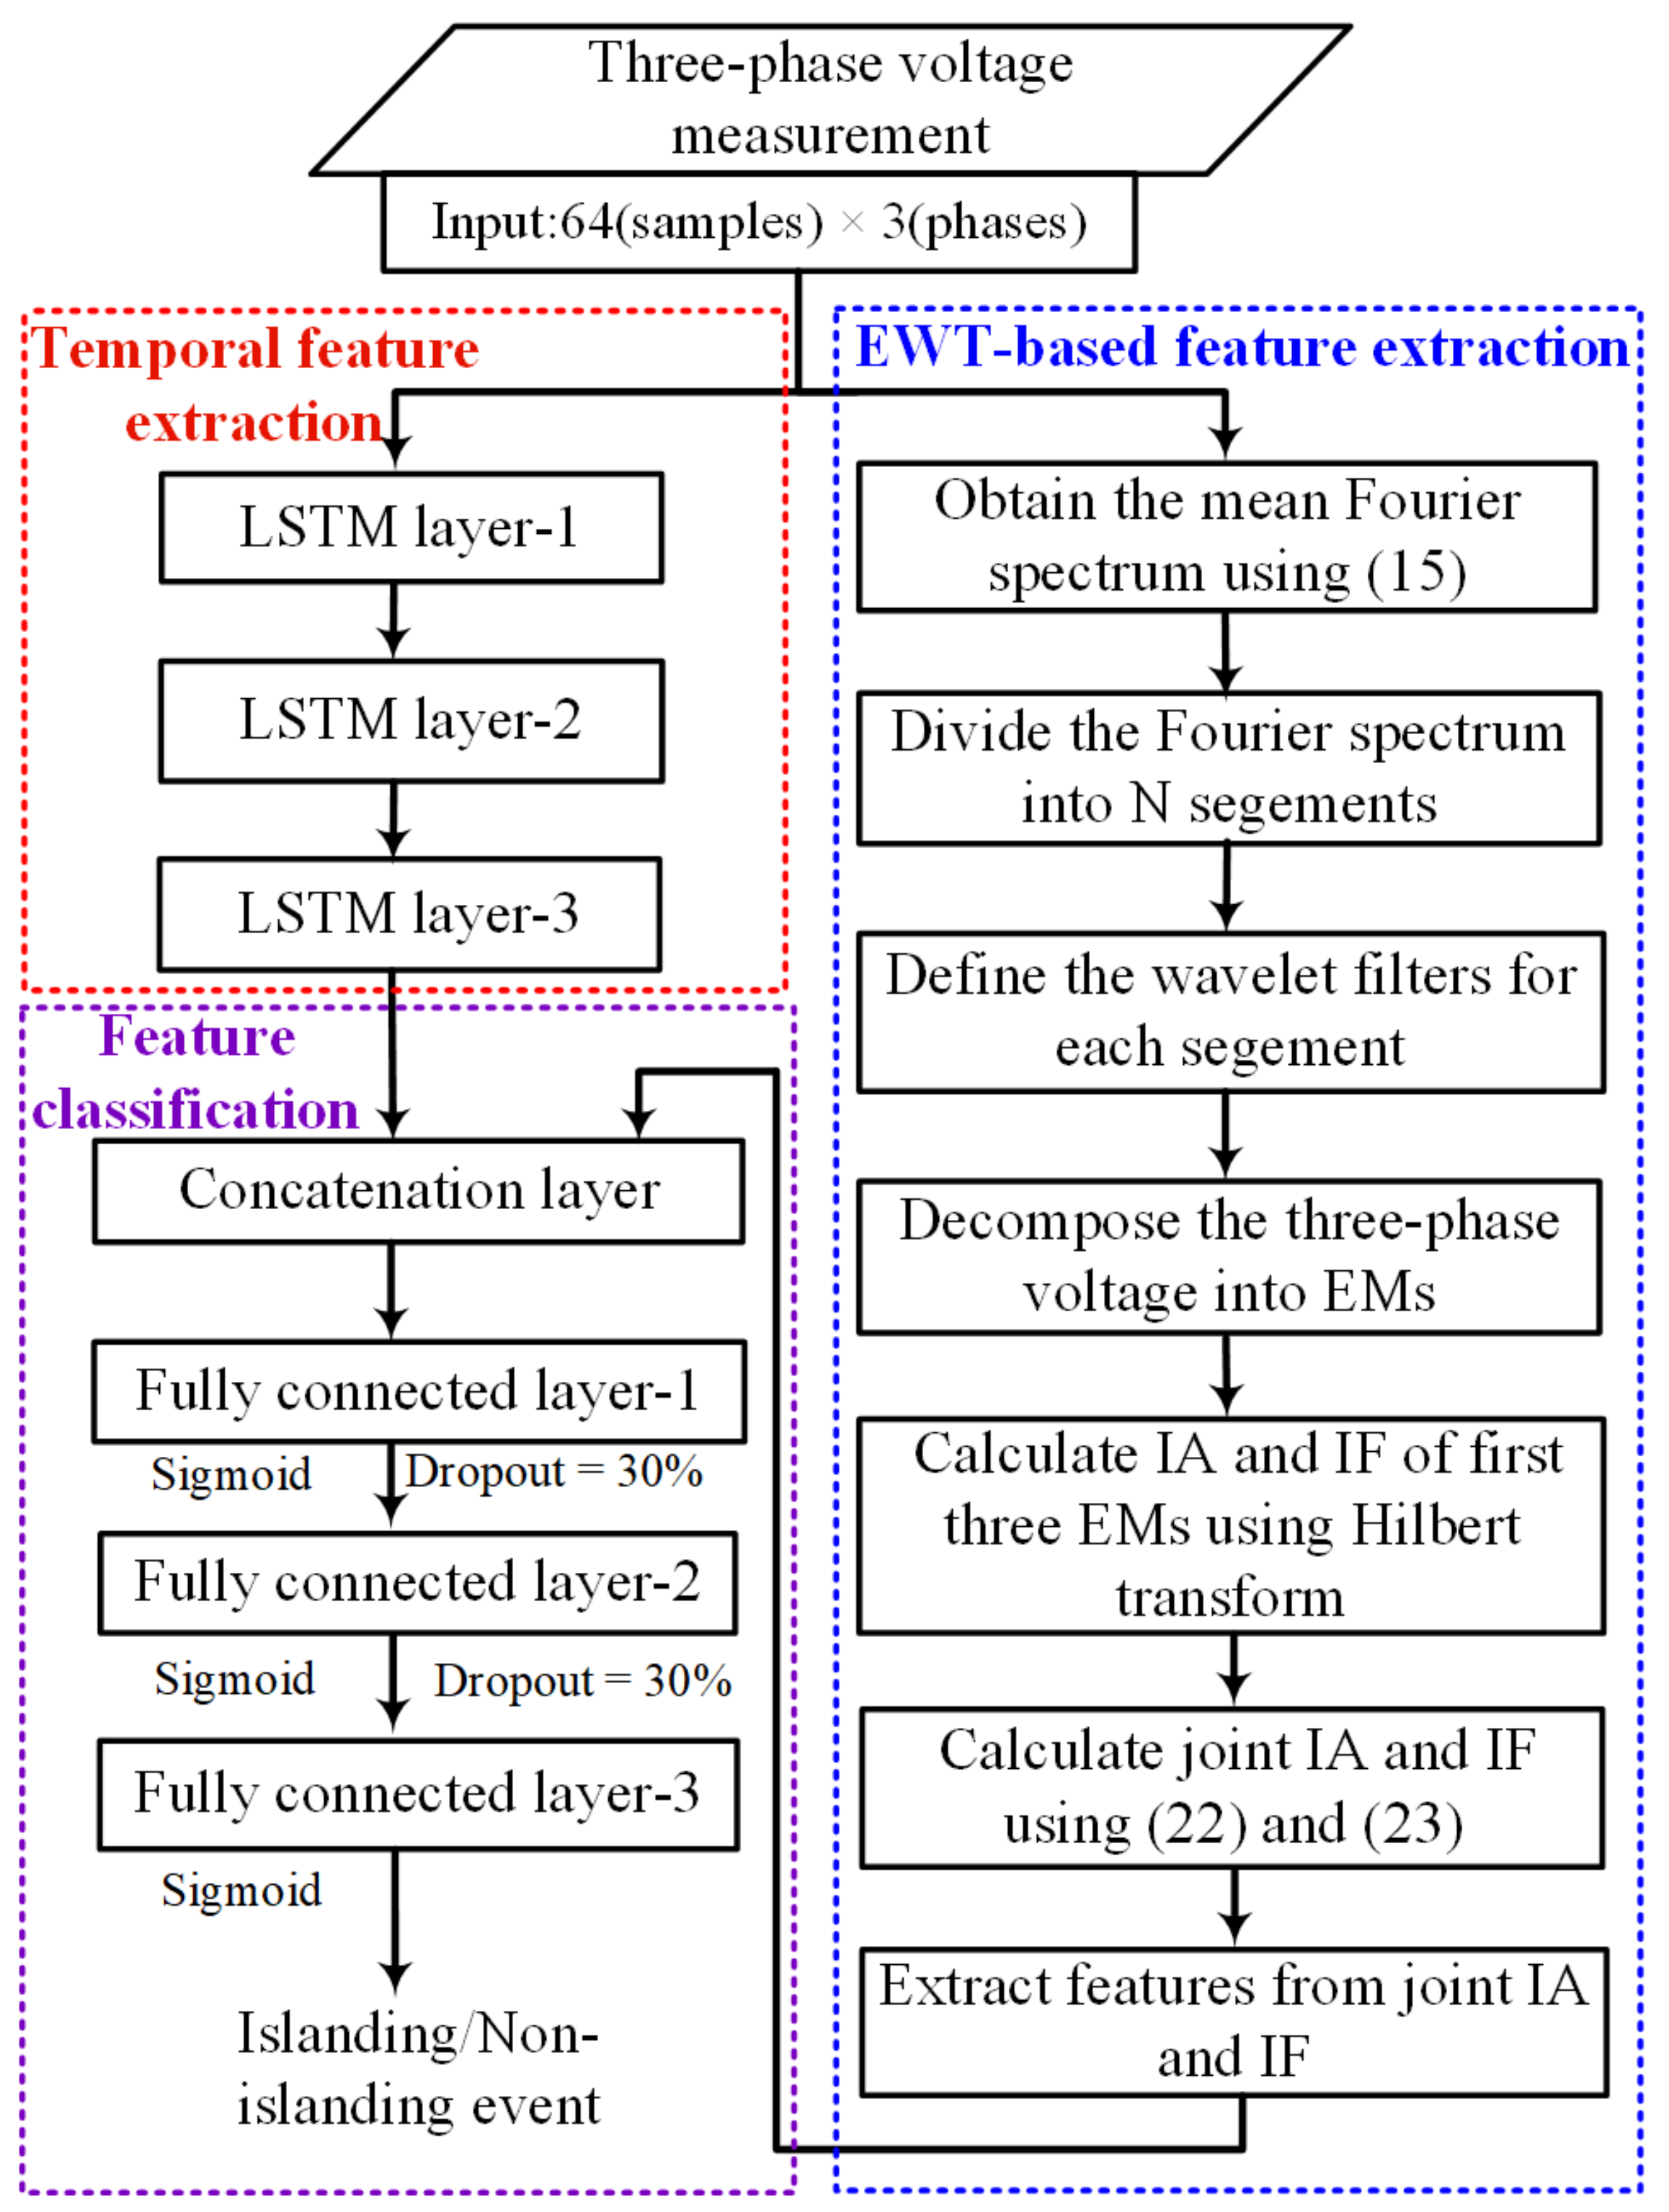
The proposed IIDS is constructed using LSTM memory units and FC layers. The structure of the network used in this study is shown in
Figure 3. In the network, we use three LSTM layers, and three FC layers to process the three-phase voltage signals and EWT features. The first LSTM layer maps the three-phase voltage sequence to a higher dimension space, the next LSTM unit is employed to extract the short and long-term temporal dependencies from the input sequence, and the last LSTM layer converts the dependencies to single dimension vector. Afterward, a depth concatenation layer combines the EWT based features with the output of the last LSTM layer. The first two FC layers abstract the features, and the last one outputs whether or not the islanding event occurs in the power system. The use of FC layers increases the risk of over-fitting. Therefore, a dropout layer is used in the structure, which discards some features (30% in this study). The discarded features do not participate in the result computation process.
4. Test System and Islanding Data Generation
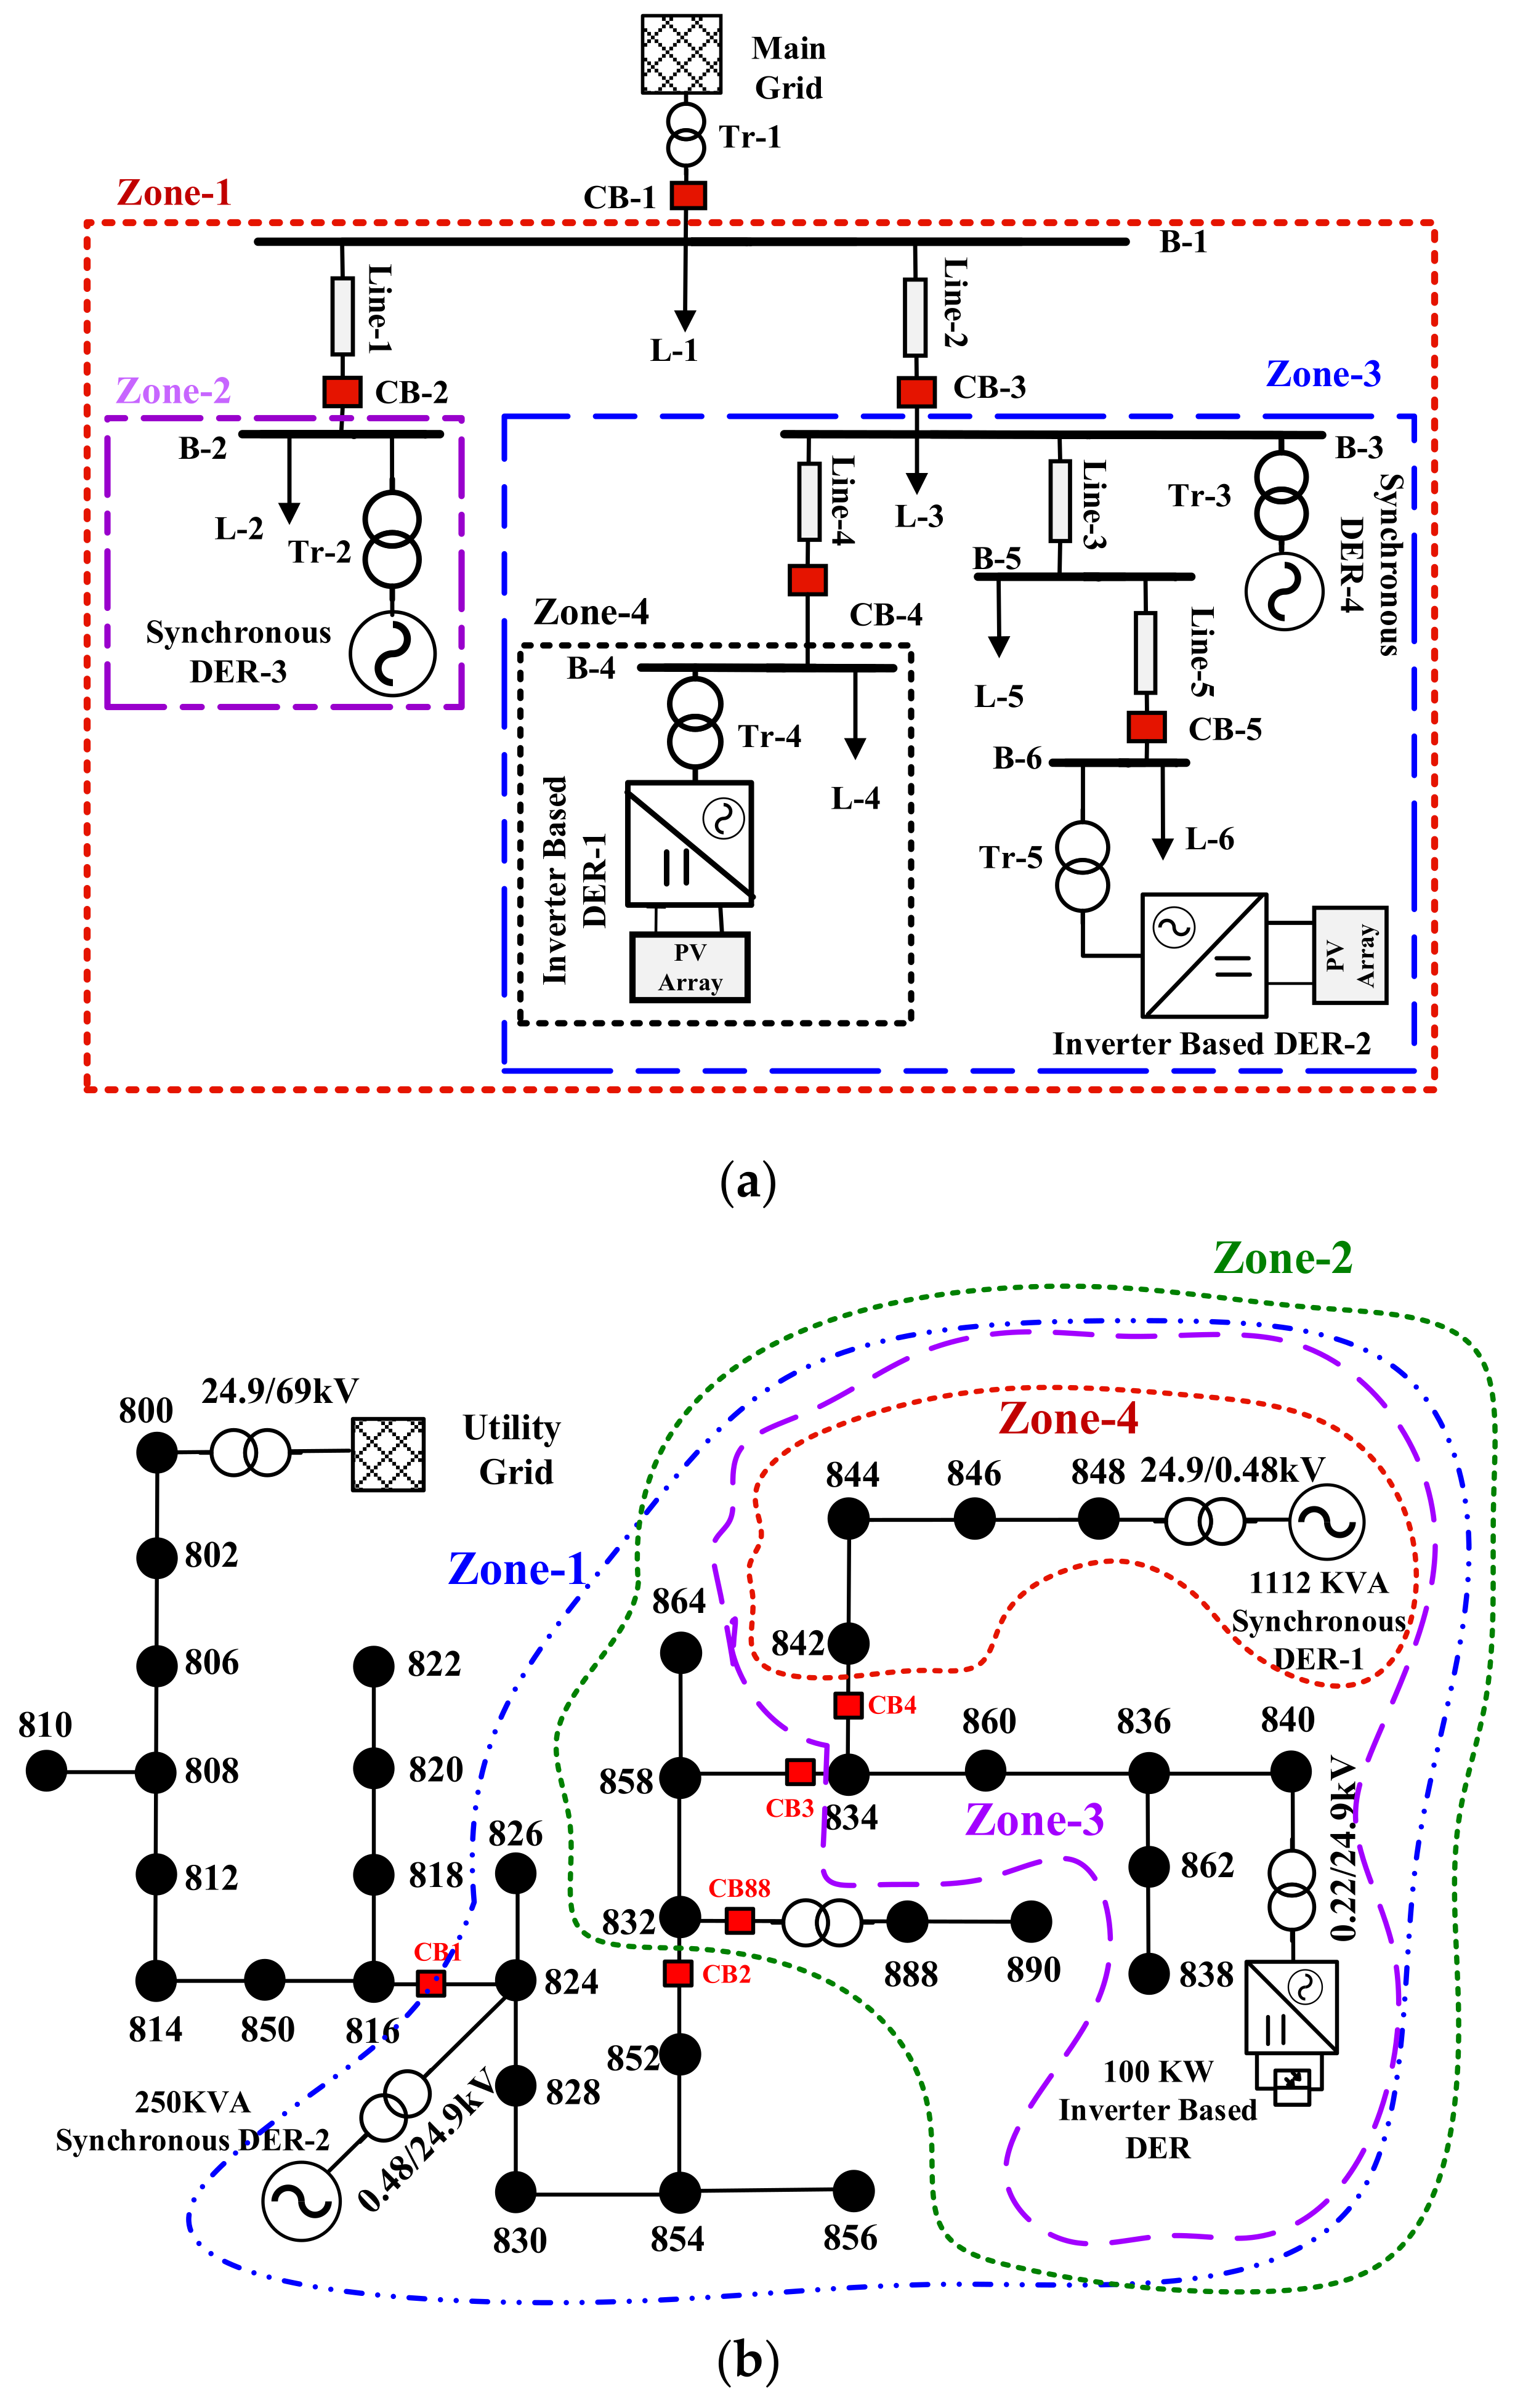
To validate the effectiveness of the proposed IIDS, various non-islanding and islanding events are analyzed on two standard test systems. The single line diagrams of the test systems along with the possible islanding zones are shown in
Figure 4. The first test system contains two inverters based DERs and two synchronous machines based DERs. The detailed information of the first test system has been obtained from [
2]. The other system is the modified IEEE 34-node radial distribution system with three DERs, which have been used in [
15]. The test systems were implemented in MATLAB/SIMULINK, and the proposed LSTM network was constructed in python.
Several islanding scenarios were simulated by varying the active and reactive power demand and load types of each islanded zone. The islanding events within a zone were generated by opening the circuit breaker that connects the zone to the rest of the network. Similarly, the non-islanding conditions were generated by simulating: load and capacitor bank switching, induction motor starting, and distribution line switching. Moreover, to distinguish the islanding events from fault events, permanent faults were simulated at various points on the network under different fault impedances from 0 to 100 Ω. A description of all the simulated events are provided in
Table 1. A total of 1764 islanding and 399 non-islanding events were generated for the first test system, whereas 1650 islanding and 847 non-islanding events were generated for the IEEE-34 node test system.
The generated data of each test system was randomly divided into testing and training datasets in the ratio of 1:3. The training dataset was used to train the weights and biases of the LSTM network, and the testing cases were employed to evaluate the performance of the trained network.
5. Simulation Results and Discussion
To evaluate the efficiency of the proposed IIDS, the above-generated datasets were employed to train and test the LSTM network structure. In the training phase, 70% of the data were used. To remove the bias in the data, the non-islanding data samples were duplicated. The training was accomplished using the Adam optimization algorithm with a mini-batch size of 64.
After obtaining the three-phase voltage signals, the continuous signal was sampled at 3840 Hz. The IIDS was then employed to detect the islanding events in the network. The performance of the proposed IIDS was validated by using three different indices: accuracy, recall, and precision. These indices are obtained as follows:
where
CDIS is the number of correctly detected islanding samples;
TIS is the total number of available islanding samples;
NDAI is the number of non-islanding cases detected as islanding cases;
IDAN is the number of islanding cases detected as non-islanding; and
TNS is the total number of samples.
To validate the effectiveness, we compared the results obtained from the proposed IIDS with the support vector machine (SVM), artificial neural networks (ANN), and Random Forests (RF). The features extracted through the EWT were used as input to these classifiers. The proposed IIDS and the other three intelligent classifiers were constructed with Keras (a Python Toolbox). The following subsection presents various kind of simulation results for the test systems given in the previous section.
5.1. Performance on IEC Microgrid
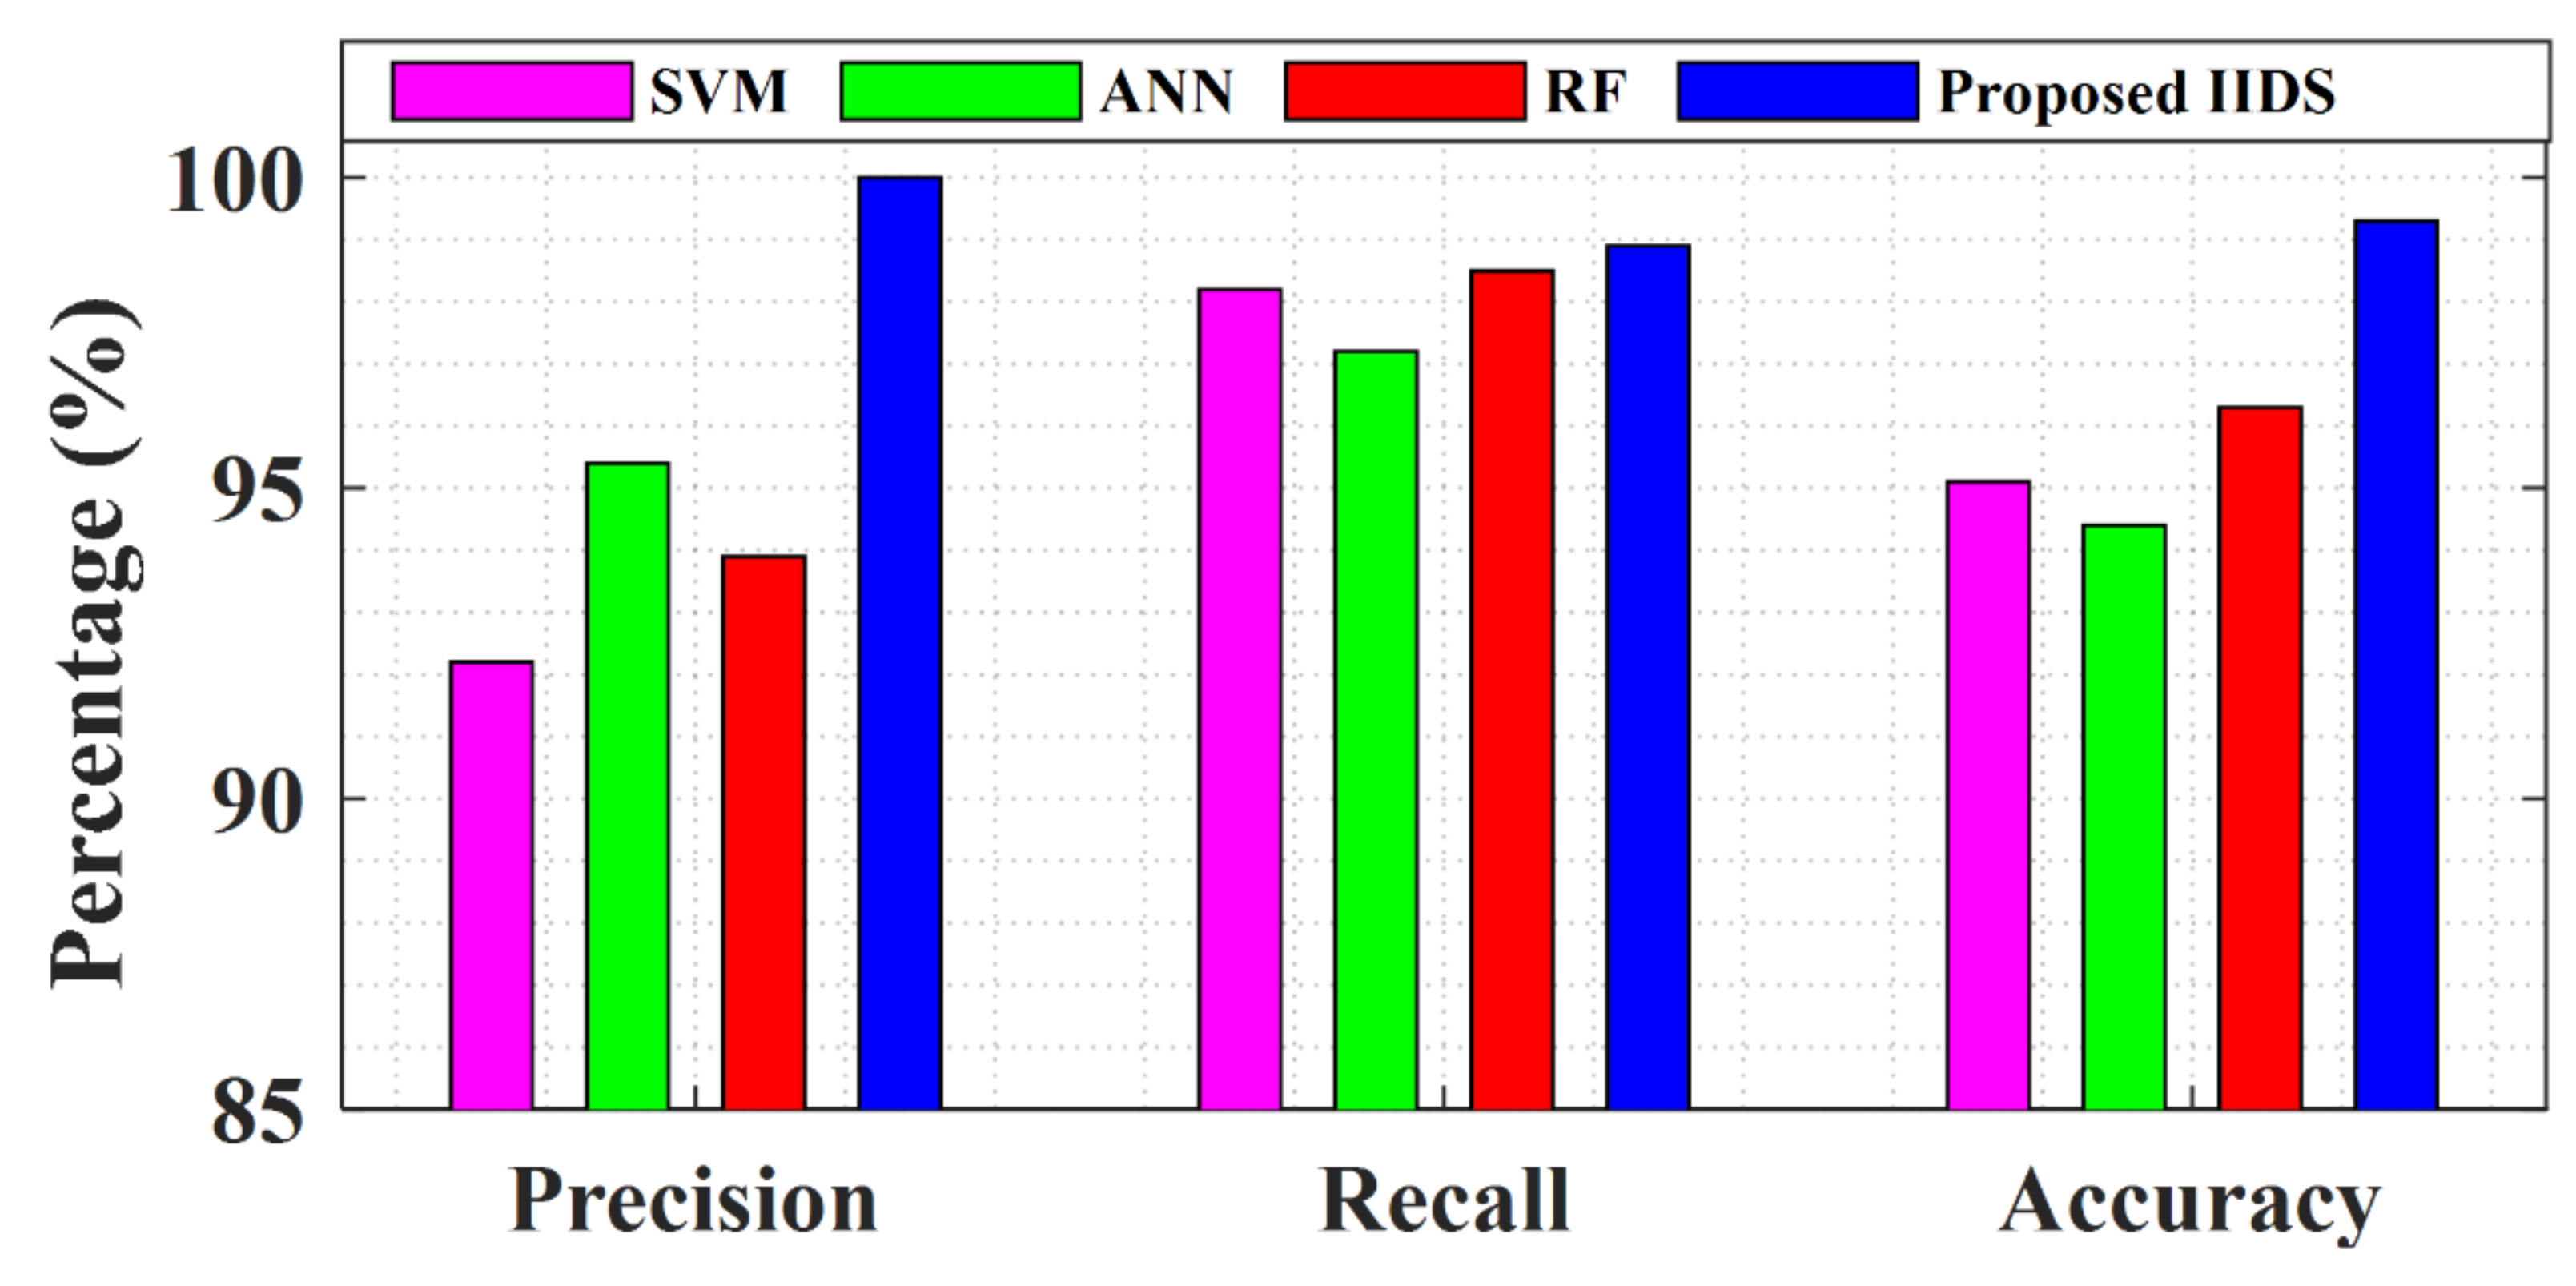
The performance of the proposed IIDS along with those of the SVM, RF, and ANN for the IEC microgrid is shown in
Figure 5. The results show that the precision of the proposed IIDS is 100%, i.e., none of the non-islanding events were miss-detected as islanding events, whereas the ANN, SVM, and RF had precisions of 92.2%, 95.4%, and 93.7%, respectively. The recall of the proposed scheme was 98.9%. The recall index shows the ability of a method to detect islanding events. Although the recalls of the SVM and RF is very close to the proposed IIDS, the accuracies and precisions of these methods were much smaller. This means that the SVM and RF had the ability to detect the islanding events correctly, but they could not differentiate between the switching/fault events and islanding events. The overall performance of the methods can be depicted in terms of accuracy. The accuracy of the proposed IIDS was 99.30%, whereas the ANN, RF, and SVM had accuracies of 94.4%, 96.3%, and 95.1%, respectively. Therefore, it can be concluded that the proposed IIDS has a better performance than the ANN, SVM, and RF. The improvement in the performance is due to the addition of LSTM layers to the network, which extract the temporal dependencies of the three-phase voltage signal. In summary, the proposed IIDS not only detects the islanding events successfully but also can differentiate the islanding events from the switching events and short-circuit faults.
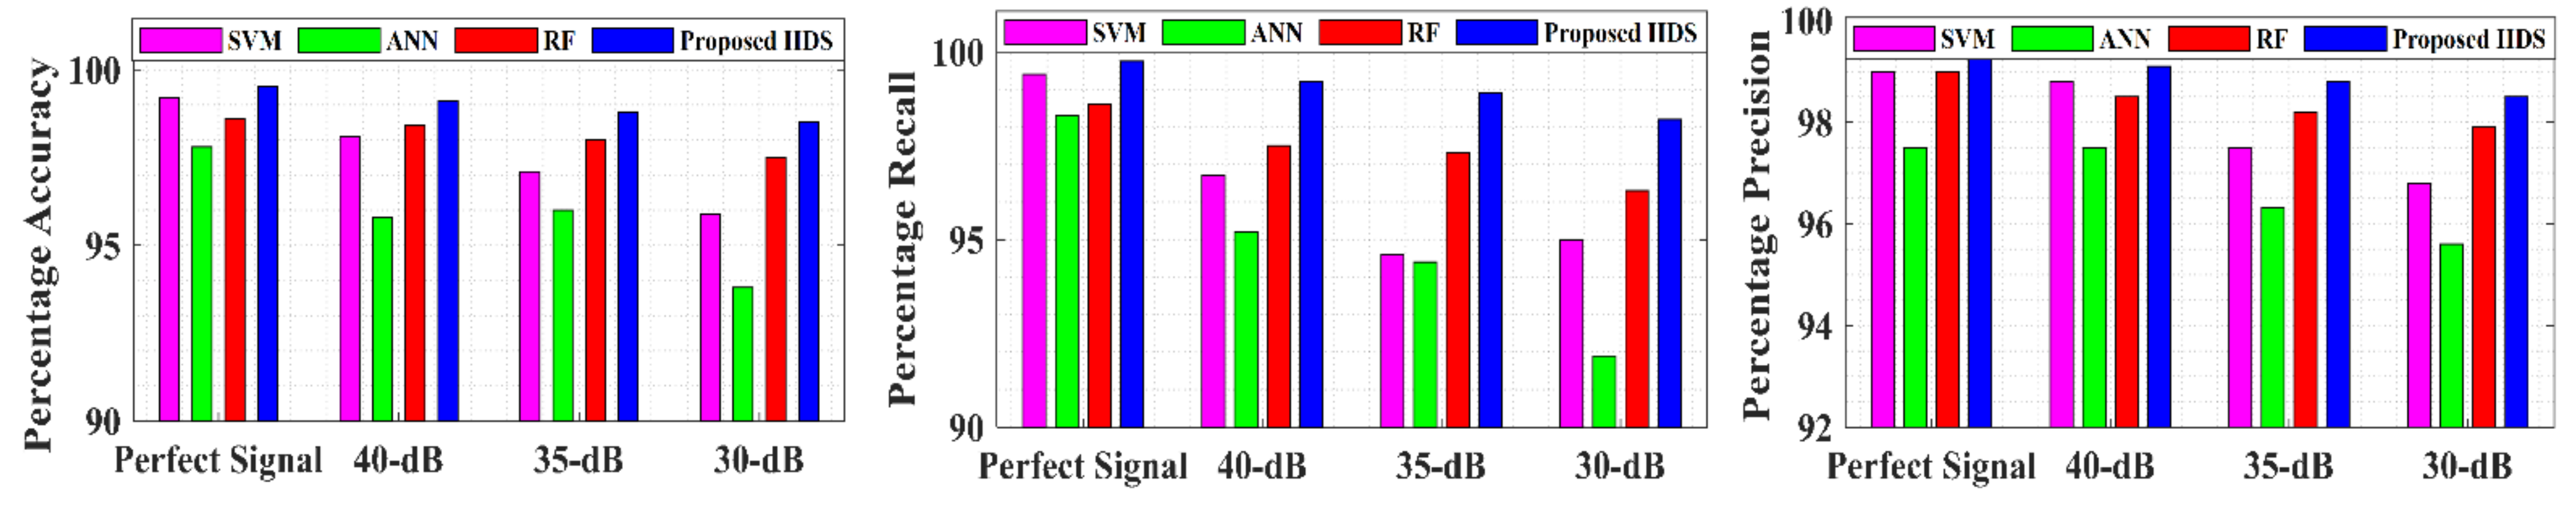
5.2. Effect of Noise
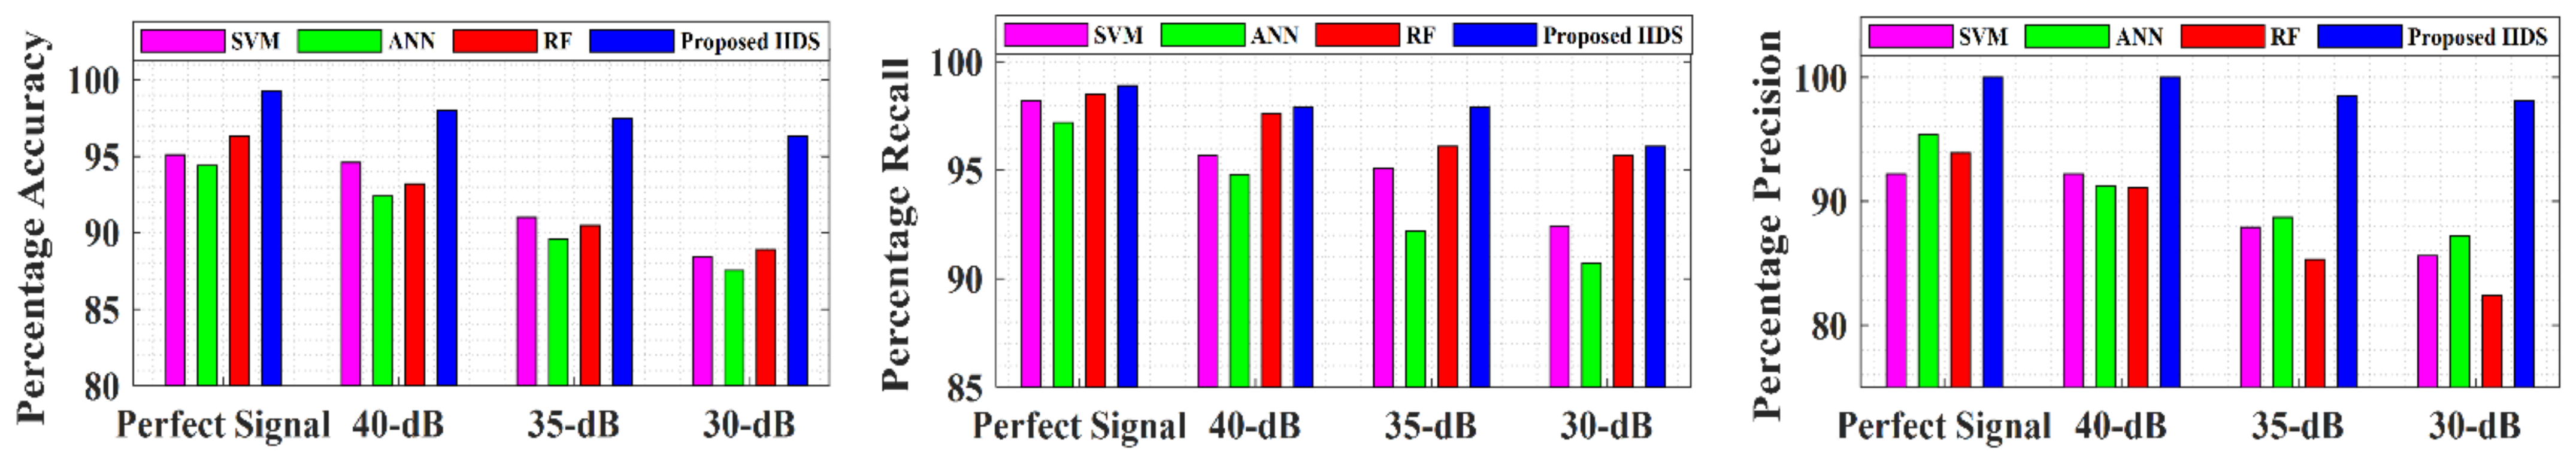
The impact of noise on the performance of the proposed IIDS was also investigated. To simulate the effect of noise, we added white Gaussian noise to the three-phase voltage measurement. Specifically, the simulations were performed with signal-to-noise ratios of 30-, 35-, and 40-dB. The proposed LSTM network and the other three networks were trained with the noisy data. The performance of the proposed IIDS along with the comparison is shown in
Figure 6.
The simulation results show that the proposed IIDS has better performance than the SVM, RF, and ANN for the noisy three-phase voltage signal. In the worst-case scenario (30-dB), the performance indices of the proposed IIDS are higher than 95%. In contrast, the noisy voltage measurement has a significant impact on the performance of the SVM, ANN, and RF. In summary, the proposed scheme can detect the islanding events under measurement uncertainties.
5.3. LSTM Network Structure
This study uses the LSTM network, which comprises of three LSTM layers and three FC layers for islanding detection. The number of layers is an important parameter that significantly affects the performance of a network structure. In this study, various network structures were designed by changing the number of LSTMs layers and FC layers to inspect the relationship between islanding detection accuracy and LSTM network structure. The simulation parameters and training data were kept the same for all the structures. The accuracy of the structures for islanding detection is presented in
Table 2. It can be observed from the table that three LSTM layers with three FC layers provide the most accurate results on the testing dataset. Although the increase in the number of LSTMs layers yields better training accuracy, the additional layers may introduce an over-fitting problem to the structure, worsening the performance on the testing dataset.
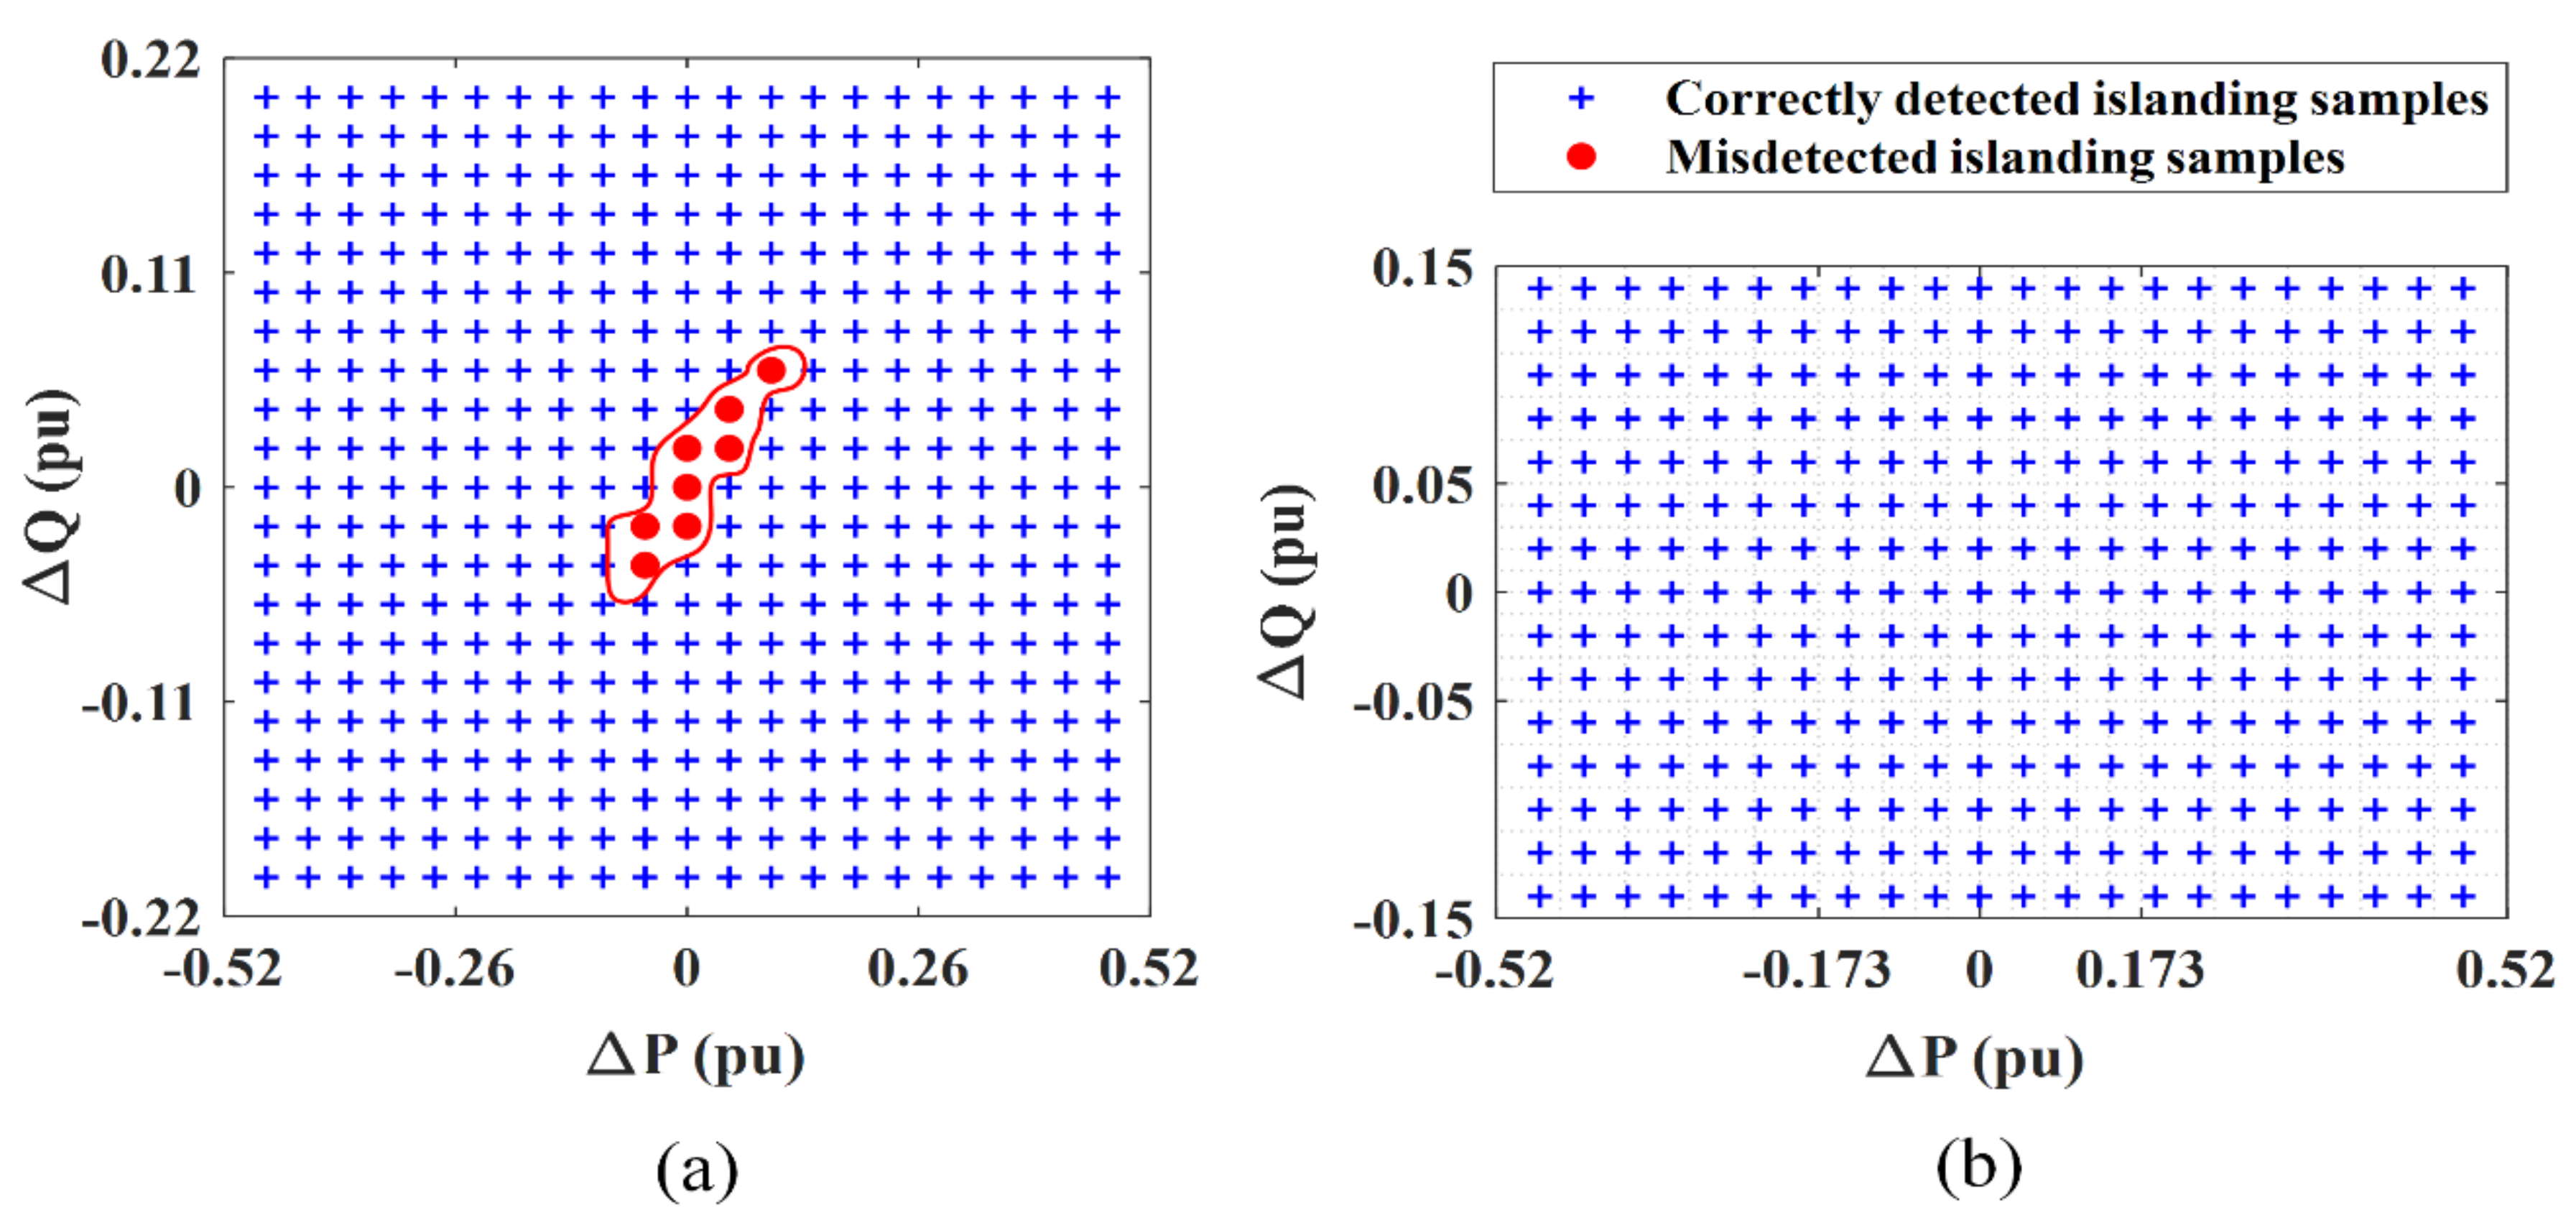
5.4. Non-Detection Zone
The NDZ is an important index for assessing the performance of an IDM. The NDZ is the area in the ∆P-∆Q plan in which an IDM fails to identify the islanding events. Therefore, to determine the NDZ of the proposed IIDS for synchronous based DERs, 441 power mismatch events on the IEC test systems were simulated. The results obtained from the proposed IIDS are shown in
Figure 7a. The symbols “+” characterize the correctly identified islanding events (432 cases) and the dots “⦁” indicate the islanding events that are not correctly detected by the proposed IIDS. Only eight (8) islanding events out of 441 were undetected. Similarly, the NDZ of the proposed IIDS for inverter-based DERs is shown in
Figure 7b. In this case, 345 power mismatch events were simulated, and all the events were successfully detected by the proposed scheme. Therefore, it can be concluded that the proposed IIDS has a very small NDZ and can successfully detect islanding events under small power mismatch conditions.
5.5. Performance on Modified IEEE-34 Node System
To evaluate the generality of the proposed IIDS, a modified IEEE 34-node system was also simulated. Using a procedure similar to the one that was performed on the IEC microgrid, the islanding data, which was generated according to
Table 1, was divided into training and testing datasets. The performance indices are shown in
Figure 8. It can be observed from the results that the proposed IIDS provides a better performance than the ANN, SVM, and RF for perfect as well as noisy three-phase voltage measurement.
It can be concluded from the results that the proposed IIDS can be used for any smart distribution network for islanding detection.


