
Palladium-Functionalized Graphene for Hydrogen Sensing Performance: Theoretical Studies


Abstract
1. Introduction
2. Computational Method
3. Results and Discussion
4. Conclusions
Author Contributions
Funding
Acknowledgments
Conflicts of Interest
References
- Ji, H.; Zeng, W.; Li, Y. Gas sensing mechanisms of metal oxide semiconductors: A focus review. Nanoscale 2019, 11, 22664–22684. [Google Scholar] [CrossRef] [PubMed]
- Gupta, A.; Pandey, S.S.; Nayak, M.; Maity, A.; Majumder, S.B.; Bhattacharya, S. Hydrogen sensing based on nanoporous silica-embedded ultra dense ZnO nanobundles. RSC Adv. 2014, 4, 7476–7482. [Google Scholar] [CrossRef]
- Kaskhedikar, N.A.; Maier, J. Lithium Storage in carbon nanostructures. Adv. Mater. 2009, 21, 2664–2680. [Google Scholar] [CrossRef]
- Zhu, Y.; Murali, S.; Cai, W.; Li, X.; Suk, J.W.; Potts, J.R.; Ruoff, R.S. Graphene and graphene oxide: Synthesis, properties, and applications. Adv. Mater. 2010, 22, 3906–3924. [Google Scholar] [CrossRef]
- Wang, Y.; Li, Z.; Wang, J.; Li, J.; Lin, Y. Graphene and graphene oxide: Biofunctionalization and applications in biotechnology. Trends Biotechnol. 2011, 29, 205–212. [Google Scholar] [CrossRef]
- Esrafili, M.D.; Dinparast, L. The selective adsorption of formaldehyde and methanol over Al- or Si-decorated graphene oxide: A DFT study. J. Mol. Graph. Model. 2018, 80, 25–31. [Google Scholar] [CrossRef] [PubMed]
- Novoselov, K.S.; Geim, A.K.; Morozov, S.V.; Jiang, D.; Zhang, Y.; Dubonos, S.V.; Grigorieva, I.V.; Firsov, A.A. Electric field in atomically thin carbon films. Science 2004, 306, 666–669. [Google Scholar] [CrossRef]
- Li, X.; Wang, X.; Zhang, L.; Lee, S.; Dai, H. Chemically derived, ultrasmooth graphene nanoribbon semiconductors. Science 2008, 319, 1229–1232. [Google Scholar] [CrossRef]
- Neto, A.H.C.; Guinea, F.; Peres, N.M.R.; Novoselov, K.; Geim, A.K. The electronic properties of graphene. Rev. Mod. Phys. 2009, 81, 109–162. [Google Scholar] [CrossRef]
- Lahiri, J.; Lin, Y.; Bozkurt, P.; Oleynik, I.; Batzill, M. An extended defect in graphene as a metallic wire. Nat. Nanotechnol. 2010, 5, 326–329. [Google Scholar] [CrossRef]
- Choi, H.J.; Jung, S.-M.; Seo, J.-M.; Chang, D.W.; Dai, L.; Baek, J.-B. Graphene for energy conversion and storage in fuel cells and supercapacitors. Nano Energy 2012, 1, 534–551. [Google Scholar] [CrossRef]
- Bonaccorso, F.; Colombo, L.; Yu, G.; Stoller, M.; Tozzini, V.; Ferrari, A.C.; Ruoff, R.S.; Pellegrini, V. Graphene, related two-dimensional crystals, and hybrid systems for energy conversion and storage. Science 2015, 347, 1246501. [Google Scholar] [CrossRef] [PubMed]
- Kamat, P.V. Graphene-based nanoassemblies for energy conversion. J. Phys. Chem. Lett. 2011, 2, 242–251. [Google Scholar] [CrossRef]
- Yoon, H.J.; Jun, D.H.; Yang, J.H.; Zhou, Z.; Yang, S.S.; Cheng, M.M.-C. Carbon dioxide gas sensor using a graphene sheet. Sens. Actuators B Chem. 2011, 157, 310–313. [Google Scholar] [CrossRef]
- Zhang, B.; Cui, T. An ultrasensitive and low-cost graphene sensor based on layer-by-layer nano self-assembly. Appl. Phys. Lett. 2011, 98, 073116. [Google Scholar] [CrossRef]
- Rad, A.S. Density functional theory study of the adsorption of MeOH and EtOH on the surface of Pt-decorated graphene. Phys. E Low-Dimens. Syst. Nanostruct. 2016, 83, 135–140. [Google Scholar] [CrossRef]
- Hughes, Z.E.; Walsh, T.R. Computational chemistry for graphene-based energy applications: Progress and challenges. Nanoscale 2015, 7, 6883–6908. [Google Scholar] [CrossRef] [PubMed]
- Perreault, F.; Faria, A.F.; Elimelech, M. Environmental applications of graphene-based nanomaterials. Chem. Soc. Rev. 2015, 44, 5861–5896. [Google Scholar] [CrossRef] [PubMed]
- Prezhdo, O.V.; Kamat, P.V.; Schatz, G.C. Virtual issue: Graphene and functionalized graphene. J. Phys. Chem. C 2011, 115, 3195–3197. [Google Scholar] [CrossRef]
- Wanno, B.; Tabtimsai, C. A DFT investigation of CO adsorption on VIIIB transition metal-doped graphene sheets. Superlattices Microstruct. 2014, 67, 110–117. [Google Scholar] [CrossRef]
- Sun, Y.; Chen, L.; Zhang, F.; Li, D.; Pan, H.; Ye, J. First-principles studies of HF molecule adsorption on intrinsic graphene and Al-doped graphene. Solid State Commun. 2010, 150, 1906–1910. [Google Scholar] [CrossRef]
- Ri, N.-C.; Wi, J.-H.; Kim, N.-H.; Ri, S.-I. First principles study on the structural, electronic, and transport properties of the Armchair Graphane, fluorographene, fluorographane/graphene heterostructure nanoribbons terminated by H and F atoms. Phys. E Low-Dimens. Syst. Nanostruct. 2019, 108, 226–232. [Google Scholar] [CrossRef]
- Song, E.H.; Wen, Z.; Jiang, Q. CO Catalytic oxidation on copper-embedded graphene. J. Phys. Chem. C 2011, 115, 3678–3683. [Google Scholar] [CrossRef]
- Zhang, T.; Xue, Q.; Shan, M.; Jiao, Z.; Zhou, X.; Ling, C.; Yan, Z. Adsorption and catalytic activation of O2 molecule on the surface of Au-doped graphene under an external electric field. J. Phys. Chem. C 2012, 116, 19918–19924. [Google Scholar] [CrossRef]
- Ma, L.; Zhang, J.-M.; Xu, K.-W.; Ji, V. A first-principles study on gas sensing properties of graphene and Pd-doped graphene. Appl. Surf. Sci. 2015, 343, 121–127. [Google Scholar] [CrossRef]
- Li, Y.; Zhou, Z.; Yu, G.; Chen, W.; Chen, Z. CO catalytic oxidation on iron-embedded graphene: Computational quest for low-cost nanocatalysts. J. Phys. Chem. C 2010, 114, 6250–6254. [Google Scholar] [CrossRef]
- Huang, C.; Ye, X.; Chen, C.; Lin, S.; Xie, D. A computational investigation of CO oxidation on ruthenium-embedded hexagonal boron nitride nanosheet. Comput. Theor. Chem. 2013, 1011, 5–10. [Google Scholar] [CrossRef]
- Wu, M.; Cao, C.; Jiang, J.Z. Electronic structure of substitutionally Mn-doped graphene. New J. Phys. 2010, 12, 063020. [Google Scholar] [CrossRef]
- Gupta, A.; Gangopadhyay, S.; Gangopadhyay, K.; Bhattacharya, S. Palladium-functionalized nanostructured platforms for enhanced hydrogen sensing. Nanomater. Nanotechnol. 2016, 6, 40. [Google Scholar] [CrossRef][Green Version]
- Gupta, A.; Srivastava, A.; Mathai, C.J.; Gangopadhyay, K.; Gangopadhyay, S.; Bhattacharya, S. Nano porous palladium sensor for sensitive and rapid detection of hydrogen. Sens. Lett. 2014, 12, 1279–1285. [Google Scholar] [CrossRef]
- Gupta, A.; Parida, P.K.; Pal, P. Functional Films for Gas Sensing Applications: A Review; Springer: Singapore, 2019. [Google Scholar]
- Alfano, B.; Polichetti, T.; Miglietta, M.L.; Massera, E.; Schiattarella, C.; Ricciardella, F.; Di Francia, G. Fully eco-friendly H 2 sensing device based on Pd-decorated graphene. Sens. Actuators B Chem. 2017, 239, 1144–1152. [Google Scholar] [CrossRef]
- Singla, M.; Jaggi, N. Enhanced hydrogen sensing properties in copper decorated nitrogen doped defective graphene nanoribbons: DFT study. Phys. E Low-Dimens. Syst. Nanostruct. 2021, 131, 114756. [Google Scholar] [CrossRef]
- Bakhshi, F.; Farhadian, N. Co-doped graphene sheets as a novel adsorbent for hydrogen storage: DFT and DFT-D3 correction dispersion study. Int. J. Hydrogen Energy 2018, 43, 8355–8364. [Google Scholar] [CrossRef]
- Zhou, Q.; Yong, Y.; Ju, W.; Su, X.; Li, X.; Wang, C.; Fu, Z. DFT study of the adsorption of 2, 3, 7, 8-tetrachlorodibenzofuran (TCDF) on vacancy-defected graphene doped with Mn and Fe. Curr. Appl. Phys. 2018, 18, 61–67. [Google Scholar] [CrossRef]
- Orazi, V.; Ambrusi, R.; Marchetti, J.; Pronsato, M. DFT study of the hydrogen adsorption and storage on Ni4 cluster embedded in multivacancy graphene. Int. J. Hydrogen Energy 2020, 45, 30805–30817. [Google Scholar] [CrossRef]
- Tian, W.; Zhang, Y.; Wang, Y.; Liu, T.; Cui, H. A study on the hydrogen storage performance of graphene–Pd(T)–graphene structure. Int. J. Hydrogen Energy 2020, 45, 12376–12383. [Google Scholar] [CrossRef]
- Gecim, G.; Ozekmekci, M.; Fellah, M. Ga and Ge-doped graphene structures: A DFT study of sensor applications for methanol. Comput. Theor. Chem. 2020, 1180, 112828. [Google Scholar] [CrossRef]
- Zheng, N.; Yang, S.; Xu, H.; Lan, Z.; Wang, Z.; Gu, H. A DFT study of the enhanced hydrogen storage performance of the Li-decorated graphene nanoribbons. Vacuum 2020, 171, 109011. [Google Scholar] [CrossRef]
- Ostad, F.Z.; Ghazi, M.; Javan, M.; Izadifard, M. DFT study of Ptn, Pdn, and Irn (n = 5, 6) clusters adsorbed on graphene: Structural and electronic properties. Phys. B Condens. Matter 2019, 575, 411678. [Google Scholar] [CrossRef]
- Montejo-Alvaro, F.; Rojas-Chávez, H.; Román-Doval, R.; Mtz-Enriquez, A.; Cruz-Martínez, H.; Medina, D. Stability of Pd clusters supported on pristine, B-doped, and defective graphene quantum dots, and their reactivity toward oxygen adsorption: A DFT analysis. Solid State Sci. 2019, 93, 55–61. [Google Scholar] [CrossRef]
- Amaya-Roncancio, S.; Blanco, A.G.; Linares, D.; Sapag, K. DFT study of hydrogen adsorption on Ni/graphene. Appl. Surf. Sci. 2018, 447, 254–260. [Google Scholar] [CrossRef]
- Cui, H.; Zhang, X.; Chen, D.; Tang, J. Pt & Pd decorated CNT as a workable media for SOF2 sensing: A DFT study. Appl. Surf. Sci. 2018, 471, 335–341. [Google Scholar] [CrossRef]
- Cheng, J.; Hu, D.; Yao, A.; Gao, Y.; Asadi, H. A computational study on the Pd-decorated ZnO nanocluster for H2 gas sensing: A comparison with experimental results. Phys. E Low-Dimens. Syst. Nanostruct. 2020, 124, 114237. [Google Scholar] [CrossRef]
- Khodadadi, Z. Evaluation of H2S sensing characteristics of metals–doped graphene and metals-decorated graphene: Insights from DFT study. Phys. E Low-Dimens. Syst. Nanostruct. 2018, 99, 261–268. [Google Scholar] [CrossRef]
- Kohn, W.; Sham, L. Self-consistent equations including exchange and correlation effects. Phys. Rev. 1965, 140, A1133. [Google Scholar] [CrossRef]
- Frisch, M.J.; Trucks, G.W.; Schlegel, H.B.; Scuseria, G.E.; Robb, M.A.; Cheeseman, J.R.; Scalmani, G.; Barone, V.; Petersson, G.A.; Nakatsuji, H.; et al. Gaussian 09, Revision d. 01; Gaussian Inc.: Wallingford, CT, USA, 2009. [Google Scholar]
- O’Boyle, N.M.; Tenderholt, A.L.; Langner, K. cclib: A library for package-independent computational chemistry algorithms. J. Comput. Chem. 2008, 29, 839–845. [Google Scholar] [CrossRef]
- Foresman, J.B. Exploring Chemistry with Electronic Structure Methods: A Guide to Using Gaussian, 2nd ed.; Gaussian Inc.: Pittsburgh, PA, USA, 1996. [Google Scholar]
- Kulkarni, B.S.; Krishnamurty, S.; Pal, S. Probing Lewis acidity and reactivity of Sn- and Ti-beta zeolite using industrially important moieties: A periodic density functional study. J. Mol. Catal. A Chem. 2010, 329, 36–43. [Google Scholar] [CrossRef]
- Modi, C.K.; Trivedi, P.M.; Chudasama, J.A.; Nakum, H.D.; Parmar, D.K.; Gupta, S.; Jha, P.K. Zeolite-Y entrapped bivalent transition metal complexes as hybrid nanocatalysts: Density functional theory investigation and catalytic aspects. Green Chem. Lett. Rev. 2014, 7, 278–287. [Google Scholar] [CrossRef]
- Geerlings, P.; De Proft, A.F.; Langenaeker, W. Conceptual density functional theory. Chem. Rev. 2003, 103, 1793–1874. [Google Scholar] [CrossRef]
- Parr, R.G.; Szentpály, L.V.; Liu, S. Electrophilicity index. J. Am. Chem. Soc. 1999, 121, 1922–1924. [Google Scholar] [CrossRef]
- Janak, J.F. Proof that∂E/∂ni = ε in density-functional theory. Phys. Rev. B 1978, 18, 7165–7168. [Google Scholar] [CrossRef]
- Pearson, R.G. Chemical hardness and density functional theory. J. Chem. Sci. 2005, 117, 369–377. [Google Scholar] [CrossRef]
- Pearson, R.G. The electronic chemical potential and chemical hardness. J. Mol. Struct. TheoChem. 1992, 255, 261–270. [Google Scholar] [CrossRef]
- Nobel, N.; Bamba, K.; Patrice, O.; Ziao, N. NBO population analysis and electronic calculation of four azopyridine ruthenium complexes by DFT method. Comput. Chem. 2017, 5, 51–64. [Google Scholar] [CrossRef]
- Pan, S.; Solà, M.; Chattaraj, P.K. On the validity of the maximum hardness principle and the minimum electrophilicity principle during chemical reactions. J. Phys. Chem. A 2013, 117, 1843–1852. [Google Scholar] [CrossRef] [PubMed]
- Pearson, R.G. The principle of maximum hardness. Accounts Chem. Res. 1993, 26, 250–255. [Google Scholar] [CrossRef]
- Mao, S.; Zhou, H.; Wu, S.; Yang, J.; Li, Z.; Wei, X.; Wang, X.; Wang, Z.; Li, J. High performance hydrogen sensor based on Pd/TiO2 composite film. Int. J. Hydrogen Energy 2018, 43, 22727–22732. [Google Scholar] [CrossRef]
- Raghu, S.; Ramaprabhu, S. Nanostructured palladium modified graphitic carbon nitride–High performance room temperature hydrogen sensor. Int. J. Hydrogen Energy 2016, 41, 20779–20786. [Google Scholar] [CrossRef]
- Hadipour, N.L.; Peyghan, A.A.; Soleymanabadi, H. Theoretical study on the Al-doped ZnO nanoclusters for CO chemical sensors. J. Phys. Chem. C 2015, 119, 6398–6404. [Google Scholar] [CrossRef]
- Yong, Y.; Jiang, H.; Lv, S.; Cao, J.; Li, X. The cluster-assembled nanowires based on M12N12 (M = Al and Ga) clusters as potential gas sensors for CO, NO, and NO2 detection. Phys. Chem. Chem. Phys. 2016, 18, 21431–21441. [Google Scholar] [CrossRef] [PubMed]
- Bhuvaneswari, R.; Nagarajan, V.; Chandiramouli, R. First-principles insights on the electronic and field emission properties of Ga and Al doped germanium nanocones. J. Electron Spectrosc. Relat. Phenom. 2018, 227, 15–22. [Google Scholar] [CrossRef]
- Beheshtian, J.; Peyghan, A.A.; Bagheri, Z. Detection of phosgene by Sc-doped BN nanotubes: A DFT study. Sens. Actuators B Chem. 2012, 171–172, 846–852. [Google Scholar] [CrossRef]
- Savin, A.; Becke, A.D.; Flad, J.; Nesper, R.; Preuss, H.; Von Schnering, H.G. A new look at electron localization. Angew. Chem. Int. Ed. 1991, 30, 409–412. [Google Scholar] [CrossRef]
- Becke, A.D.; Edgecombe, E.K. A simple measure of electron localization in atomic and molecular systems. J. Chem. Phys. 1990, 92, 5397–5403. [Google Scholar] [CrossRef]
- Silvi, B.; Savin, A. Classification of chemical bonds based on topological analysis of electron localization functions. Nature 1994, 371, 683–686. [Google Scholar] [CrossRef]
- Fuentealba, P.; Chamorro, E.; Santos, J.C. Chapter 5 Understanding and using the electron localization function. In Theoretical Aspects of Chemical Reactivity; 2007; Elsevier: Amsterdam, The Netherlands; Volume 19, pp. 57–85. [Google Scholar] [CrossRef]


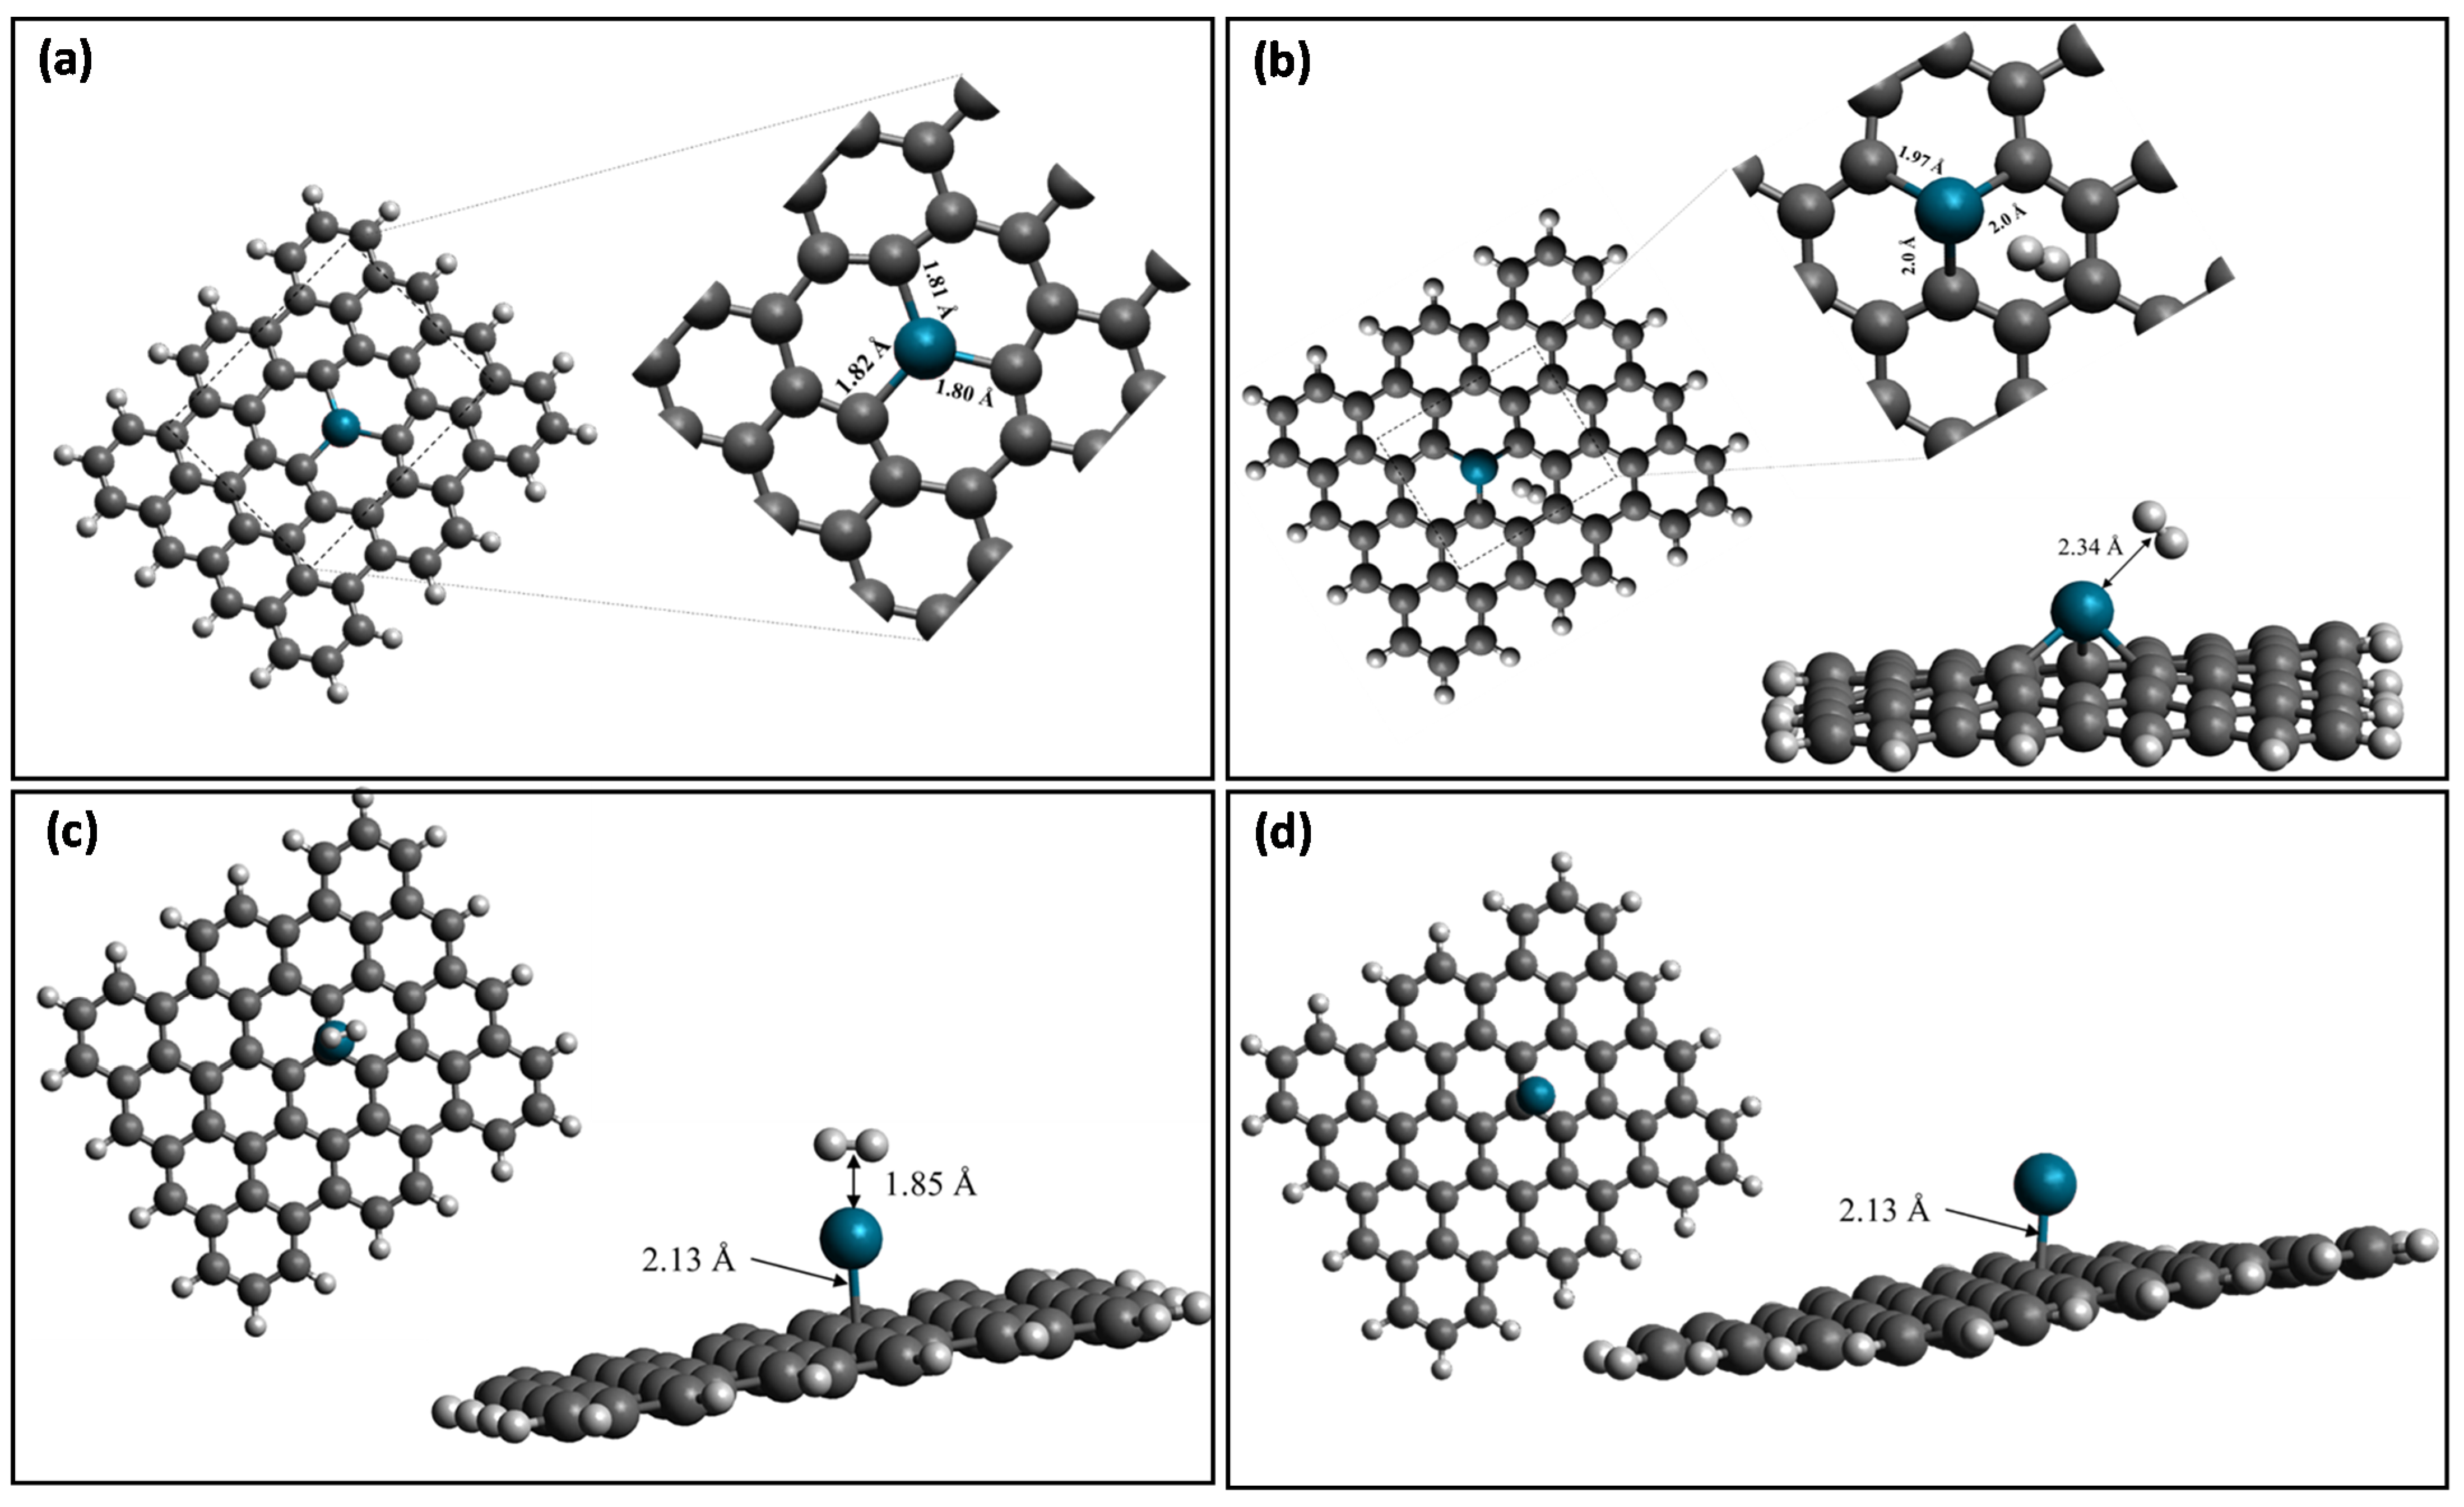
| Properties | Pd-Doped Graphene | H2 Adsorbed on Pd-Doped Graphene | |
|---|---|---|---|
| Distances (Å) | Pd-C | 1.80, 1.81,1.82Å | 1.97 Å, 2.0 Å, 2.0 Å |
| Pd-H | 2.34 Å | ||
| H-H | 0.74 | 0.759 | |
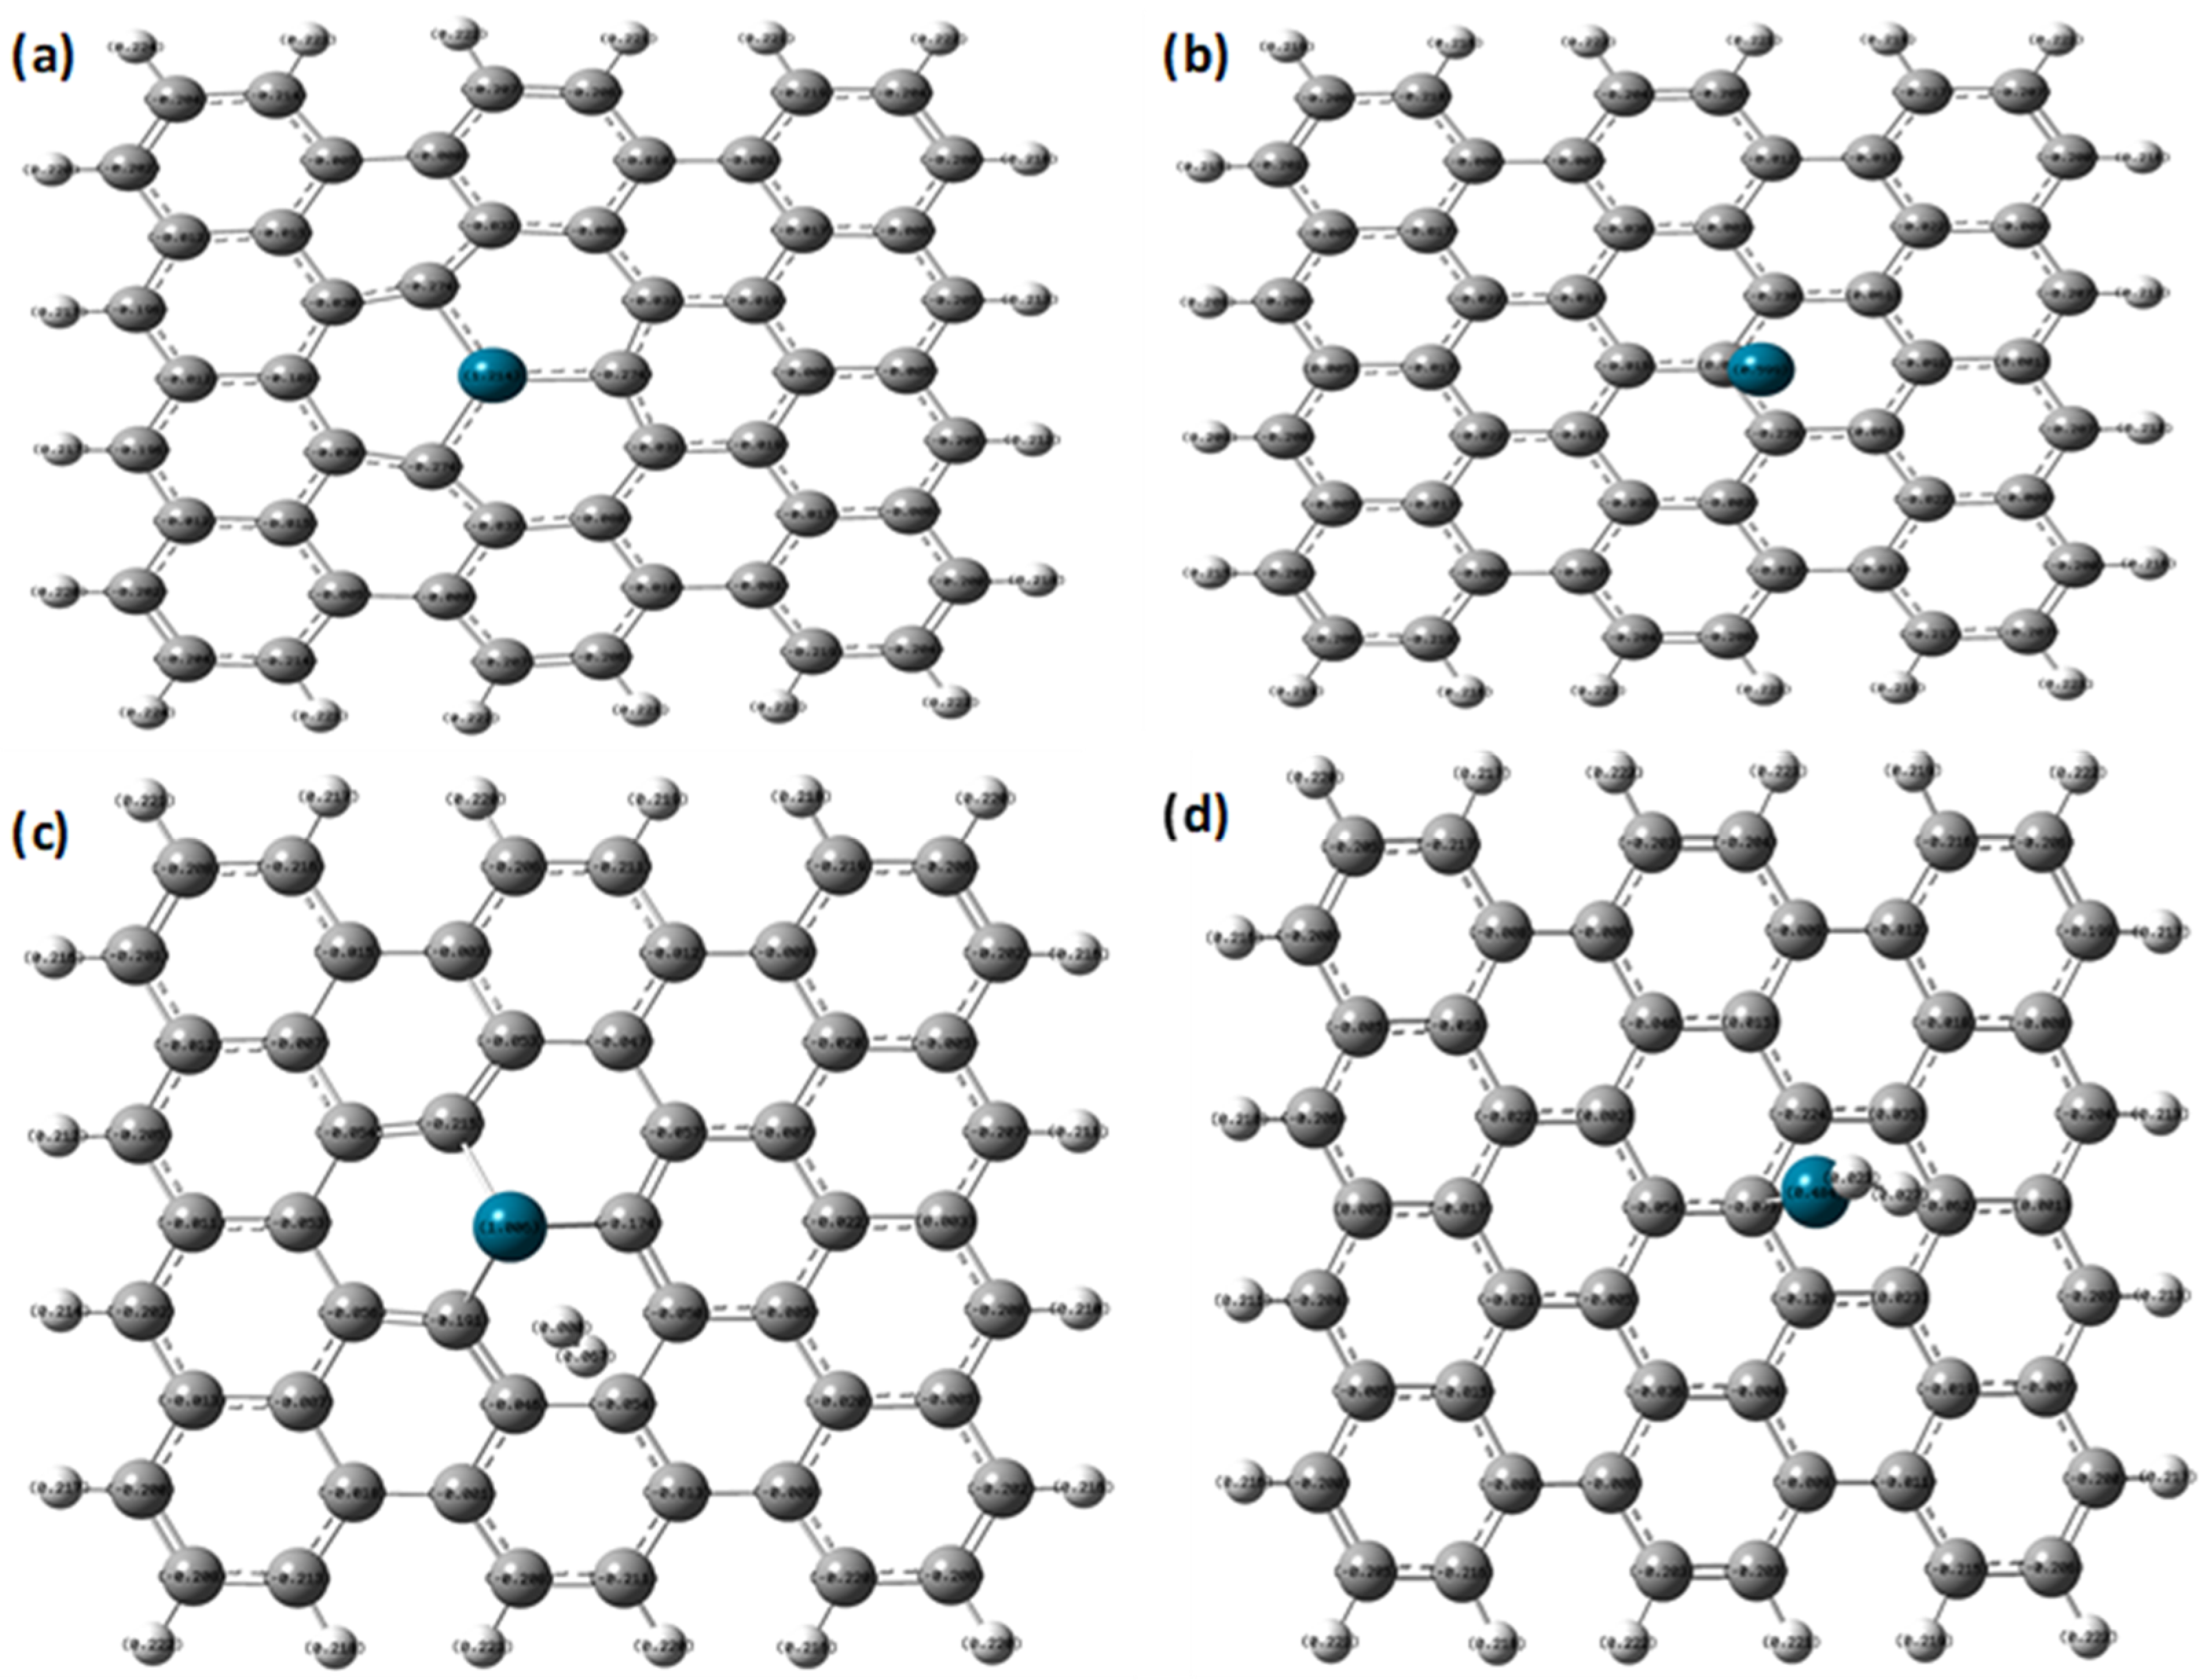
| NBO charges (e) | Pd atom | 1.214 | 1.006 |
| C atoms (bonded with Pd) | −0.274, −0.274, −0.274 | −0.215, −0.174, −0.191 | |
| Adsorbed H2 molecule | ---- | 0, 0.067 | |
| Adsorption energies (eV) | ∆E | ---- | −4.3 |
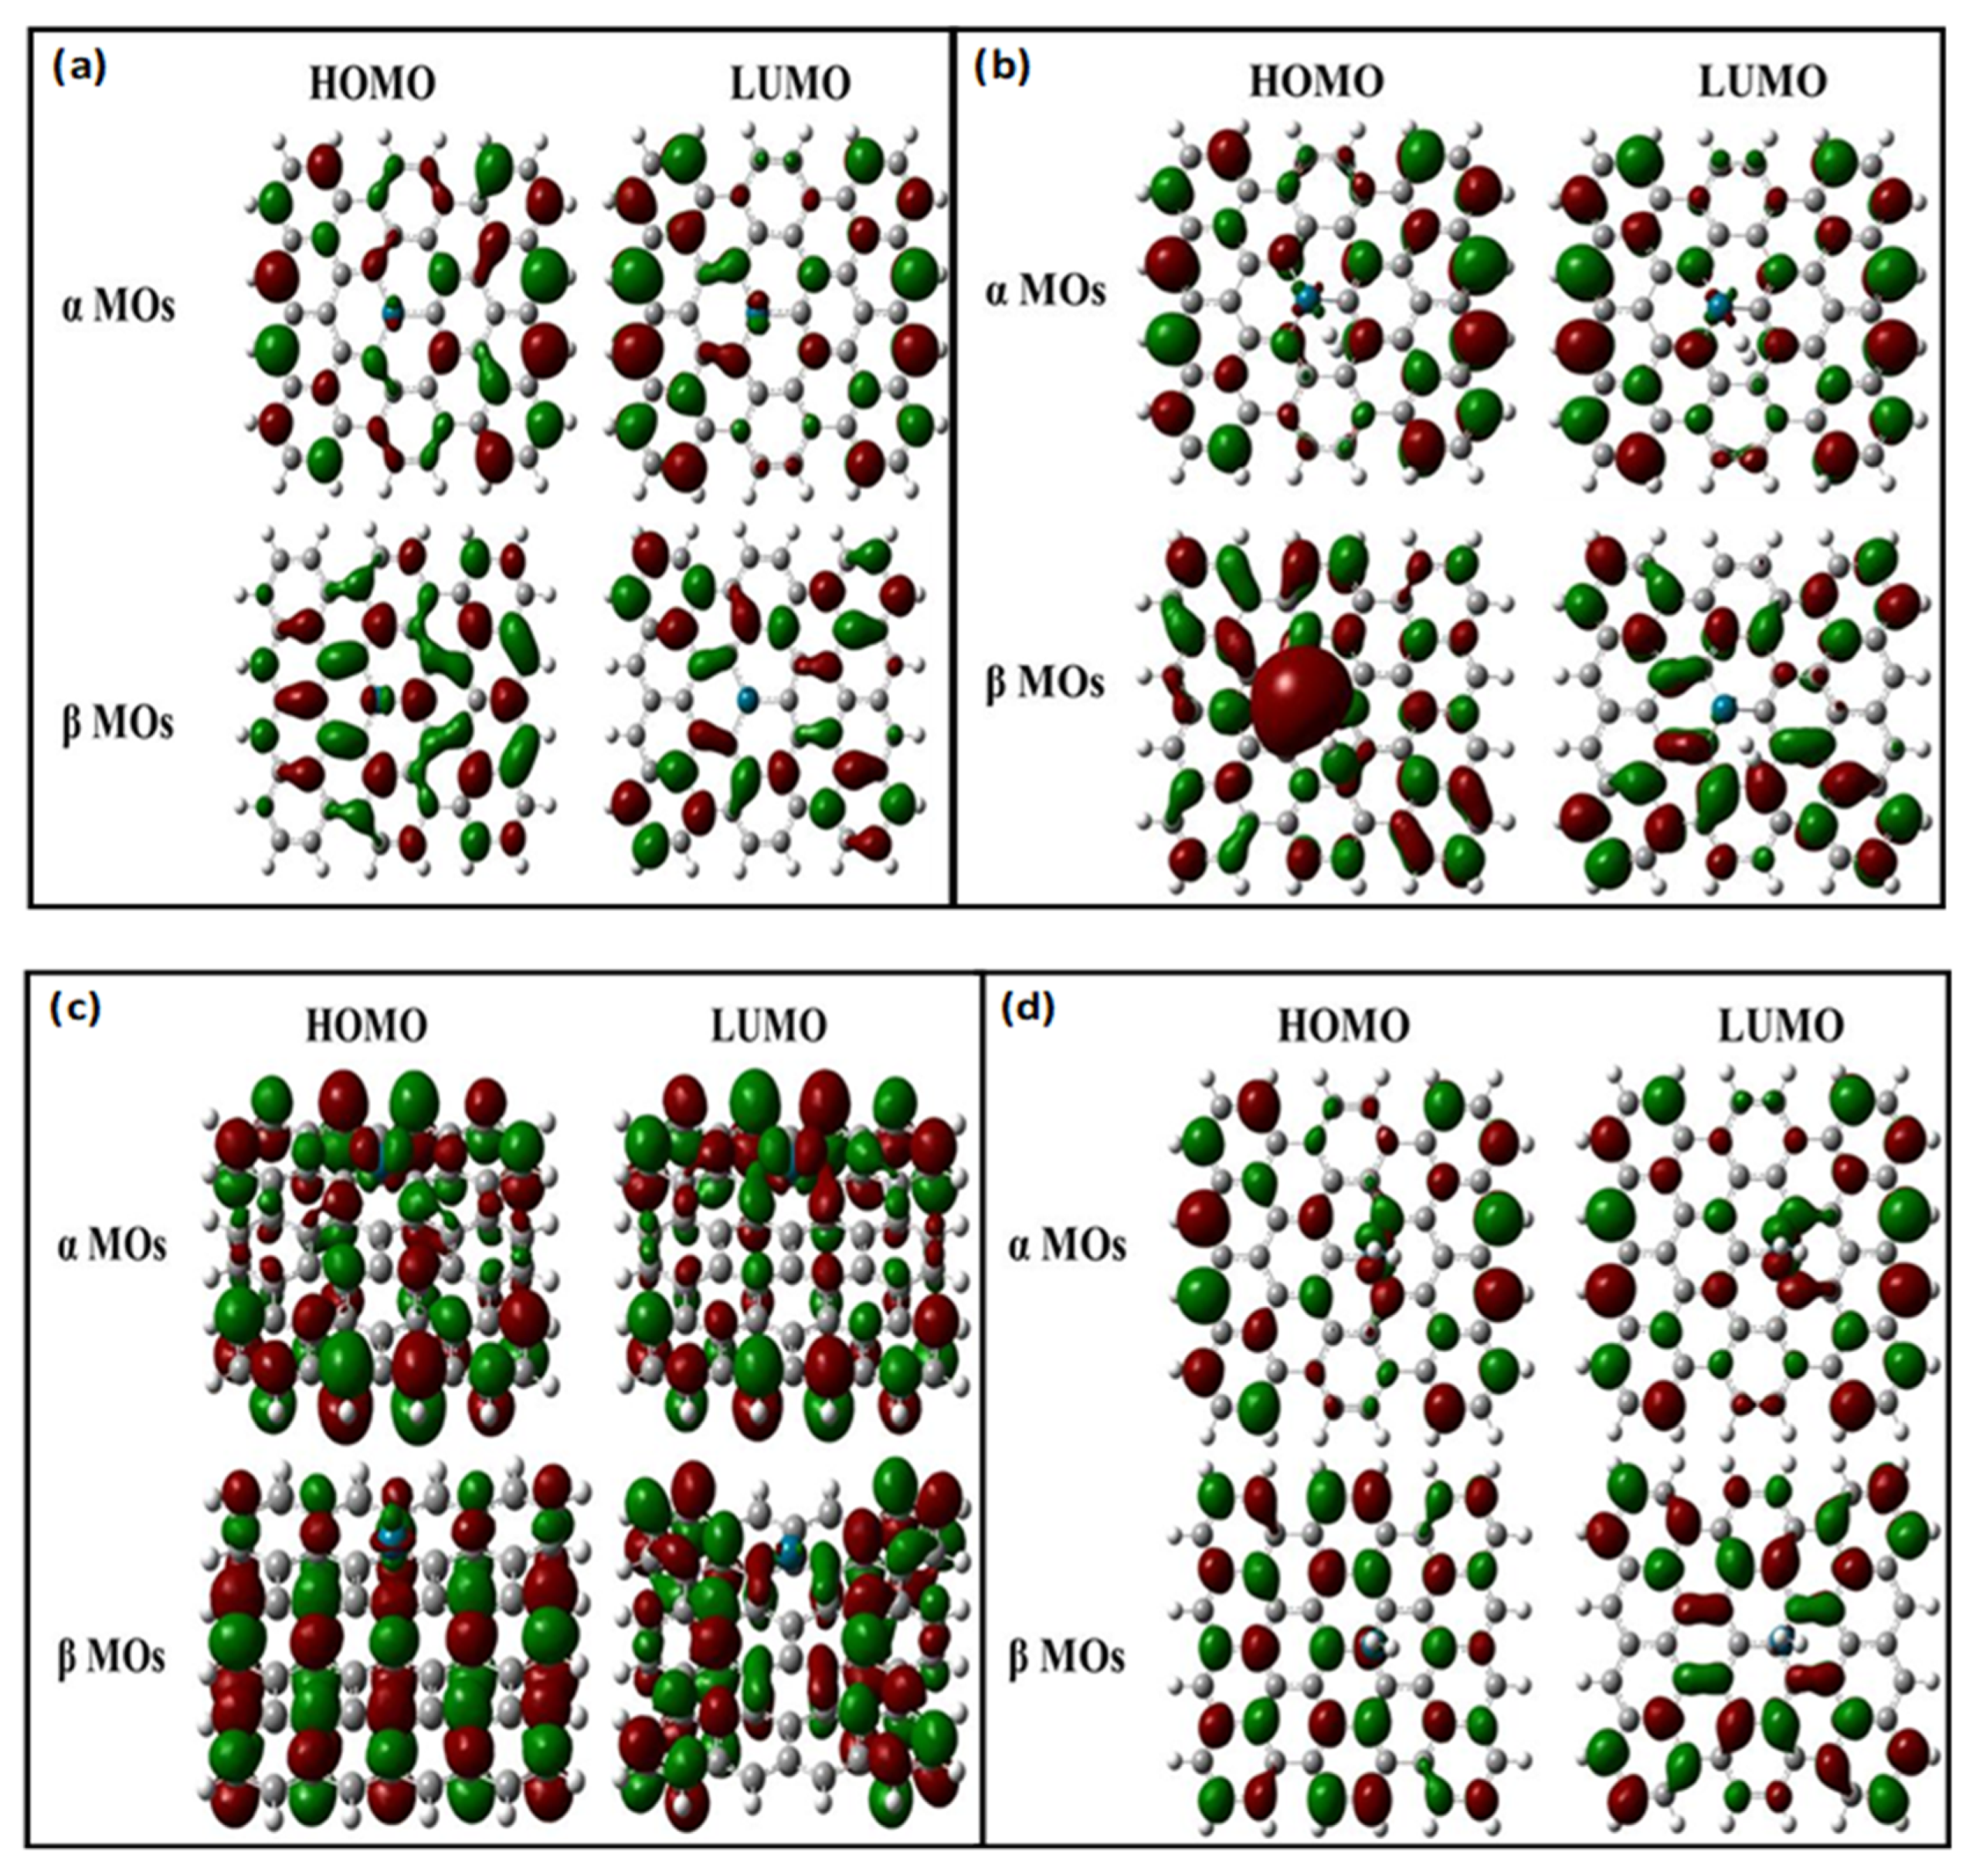
| α MOs (eV) | HOMO | −4.171 | −3.999 |
| LUMO | −3.611 | −3.511 | |
| HLG | 0.56 | 0.488 | |
| Chemical Hardness | 0.28 | 0.244 | |
| Chemical Potential | −3.891 | −3.755 | |
| Electronegativity | 3.891 | 3.755 | |
| Electrophilicity | 27.035 | 28.893 |
| Properties | Pd-Decorated Graphene | H2 Adsorbed on Pd-Decorated Graphene | |
|---|---|---|---|
| Distances (Å) | Pd-C | 2.13 | 2.13 |
| Pd-H | -- | 1.85 | |
| H-H | 0.74 | 0.803 | |
| NBO charges (e) | Pd atom | 0.599 | 0.484 |
| C atoms (bonded with Pd) | 0.006 | −0.073 | |
| Absorbed H2 molecule | - | 0.023, 0.027 | |
| Adsorption energies (eV) | ∆E | −0.44 | |
| α MOs (eV) | HOMO | −4.008 | −3.937 |
| LUMO | −3.499 | −3.414 | |
| HLG | 0.509 | 0.477 | |
| Chemical Hardness | 0.254 | 0.238 | |
| Chemical Potential | −3.754 | −3.676 | |
| Electronegativity | 3.754 | 3.676 | |
| Electrophilicity | 27.741 | 28.388 |
Publisher’s Note: MDPI stays neutral with regard to jurisdictional claims in published maps and institutional affiliations. |
© 2021 by the authors. Licensee MDPI, Basel, Switzerland. This article is an open access article distributed under the terms and conditions of the Creative Commons Attribution (CC BY) license (https://creativecommons.org/licenses/by/4.0/).
Share and Cite
Kishnani, V.; Yadav, A.; Mondal, K.; Gupta, A. Palladium-Functionalized Graphene for Hydrogen Sensing Performance: Theoretical Studies. Energies 2021, 14, 5738. https://doi.org/10.3390/en14185738
Kishnani V, Yadav A, Mondal K, Gupta A. Palladium-Functionalized Graphene for Hydrogen Sensing Performance: Theoretical Studies. Energies. 2021; 14(18):5738. https://doi.org/10.3390/en14185738
Chicago/Turabian StyleKishnani, Vinay, Anshul Yadav, Kunal Mondal, and Ankur Gupta. 2021. "Palladium-Functionalized Graphene for Hydrogen Sensing Performance: Theoretical Studies" Energies 14, no. 18: 5738. https://doi.org/10.3390/en14185738
APA StyleKishnani, V., Yadav, A., Mondal, K., & Gupta, A. (2021). Palladium-Functionalized Graphene for Hydrogen Sensing Performance: Theoretical Studies. Energies, 14(18), 5738. https://doi.org/10.3390/en14185738