Article

Air Pollutant Emission Abatement of the Fossil-Fuel Power Plants by Multiple Control Strategies in Taiwan

1
Department of Environmental Engineering, National Cheng Kung University, Tainan 701, Taiwan
2
Research Center for Climate Change and Environment Quality, National Cheng Kung University, Tainan 701, Taiwan
3
Department of Safety Health and Environmental Engineering, National Yunlin University of Science and Technology, Yunlin 640301, Taiwan
*
Author to whom correspondence should be addressed.
Energies 2021, 14(18), 5716; https://doi.org/10.3390/en14185716
Submission received: 16 August 2021 / Revised: 5 September 2021 / Accepted: 7 September 2021 / Published: 10 September 2021

Abstract

:
This study is an investigation of air pollutant emission abatement in the electricity generation sector from fossil-fuel power plants in Taiwan in 2014 and 2018. PM concentrations are determined by the results of regular tests, while SOx and NOx are determined by continuous emission monitoring systems (CEMS) of flue gas from power plants. The results indicate that electricity generation from fossil-fuel power plants increased by 13.8% from 2014 to 2018. However, emissions of air pollutants from fossil-fuel power plants declined during this period. The results indicate that the annual emissions of SOx, NOx, and PM were 40,826, 59,196, and 5363 tons per year (TPY), respectively, in 2014. The emissions decreased to 30,097 TPY (28% reduction) for SOx, 48,530 TPY (18% reduction) for NOx, and 4496 TPY (16% reduction) for PM in 2018. The ensemble mean values of each air pollutant emission factor also decreased significantly. SOx emissions decreased from 0.2443 to 0.1583 mg/kWh (35% reduction). NOx emissions decreased from 0.3542 to 0.2552 g/kWh (28% reduction). PM emissions decreased from 0.0321 to 0.0236 mg/kWh (26.5% reduction). The results indicated that phasing out of high-pollutant generating units and switching the fuel from coal to natural gas could abate the emissions of SOx and PM, and NOx emissions could be abated by introducing control devices. In addition, new power generation sectors will be constructed and equipped with ultra-low emission control systems to reduce air pollution and create a cleaner and healthier electricity generation system in Taiwan.

1. Introduction

Electricity has been a critical element in modern countries around the world for centuries. There are multiple ways to generate electricity from various power sources. Fossil-fuel power generation has been the most popular process by which to generate electricity in most countries in the last few centuries. However, there are many environmental impacts accompanying generation of power from fossil fuels. Air pollution is the most critical issue due to adverse health effects caused by particulate matter, SOx, NOx, heavy metals, PAHs, etc. Air pollutant emissions from fossil fuels used for power generation processes also cause photochemical smog, loss of visibility, acid rain, and greenhouse gases, which also have significant environmental impacts. In 2019, global energy consumption totaled 584 × 1018 joules with fractions of 33% from oil, 24% from gas, 27% from coal, 5.3% from renewable sources, 6.4% from hydropower, and 4.3% from nuclear plants [1]. These data indicate that fossil fuels accounted for 84% of the total energy consumption in 2019. In the electricity power generation sector, fossil fuels contributed approximate 64% (17,604 terawatt) in 2018 (BP, 2020). There were 80 million tons (Mt) of SO2, 107 Mt of NOx, and 35 Mt of PM2.5 emitted into the global atmosphere from the energy sector in 2015, and power plants accounted for 33%, 14%, and 6.5%, respectively [2].
In Taiwan, energy consumption totaled 4.81 × 10¹⁸ joules in 2019, which was approximately 1% of the total global energy consumption. It presents a large industrial area, abundant population, and consumes much energy per capita. The energy consumption profile indicated that 40% was derived from oil, 34% from coal, 17% from natural gas, and 9% from non-fossil fuels [3]. However, the profile in the electricity power generation sector indicated that 37% came from coal, 1.8% from oil, and 38% from natural gas. Huge consumption of fossil fuels leads to the extensive release of air pollutants, air toxics, and greenhouse gases. The air pollutant emission inventory in Taiwan (TEDS) indicated that the emissions from the fossil-fuel power generation sector contributed 1.6% of the PM, 39% of the SOx, and 21% of the NOx emissions at the national level in 2016 [4]. The public is requiring that the government and power plant managers abate the emissions from the fossil-fuel power generation sector and improve air quality as soon as possible.
The air pollution caused by fossil-fuel power plants is a critical issue in many countries around the world. It causes serious local impacts on both people and the environment. Each year, approximately seven million premature deaths are recorded globally due to effects of air pollution [5], and the loss of working days also impacts both productivity and the economy [6]. In 2013, there was a 7% GDP (gross domestic product) loss due to local air pollution that caused health risks [7]. The air pollutants released by coal power generation lead to symptoms of respiratory illness, cancer, cardiovascular disease, preterm delivery, neurologic effects, damage to reproductive health, lowered life expectancy, and adult and infant mortality [8,9]. Living near coal power plants has been found to be associated with numerous adverse public health impacts, including all-cause and premature mortality, respiratory disease and lung cancer, cardiovascular disease, poorer child health, and higher infant mortality [10]. China has been estimated to have 670,000 premature deaths annually [11], and India has been estimated to have 80,000–115,000 deaths [12] related to coal power generation. In the US, the transition to the production of electricity from coal to natural gas is a continuous process and occurs all the time. In addition, SO2 emission control systems were installed to reduce exposure to SO2. This was associated with a reduced asthma disease burden in the form of hospitalizations and emergency room visits [13].
Reducing air pollutant emissions from the fossil-fuel power generation sector has been a strategy in air quality management policies in many countries since the last century. Retirement of old power plants and the use of new technologies in power generation units together with air pollution control technologies, clean fuel, and fuel-switching have been successfully applied in many countries to reduce emissions [14,15]. The strategy in China has been to introduce the concept of ultra-low emissions from power plants, which reduced emissions of SO2, NOx, and PM by 65%, 60%, and 72%, respectively, from 2014 to 2017 [16]. The ultra-low emission strategy thus reduced air pollutant emissions significantly [17,18,19]. Some strategies have been applied to reduce emissions from coal-fired power plants. The results of evaluations of these strategies indicated a 10% decrease in local and regional airborne PM2.5 concentrations and inorganic precursors of PM in South Korea [20]. Fuel switching is also a popular strategy to reduce air pollutant emissions at the global level. In the USA, in 2019, approximately 67% of electricity is generated by fossil fuels, including 33% natural gas, 32%, coal, and 0.6% petroleum. However the fraction of coal used in electricity generation has decreased significantly in recent years [21].
The European Union set a goal that by 2030 primary energy consumption would be reduced to 30% of that used in 1990. The fossil-fuel (main from coal) consumption for electricity increased from 61.6% (123.3 TWh) in 2016 to 63.6% (137.3 TWh) in 2017 [22]. Although the energy efficiency has increased, energy consumption and electricity demand are still increasing globally. This could be attributed to the electricity used in buildings for lighting and air condition appliances, residential electricity demand, the industrial sector for productions, and transportation for rail and motor vehicles [23].
In Taiwan, the government adopted energy policies related to the power supply that changed the fraction to 50% from natural gas, 27% from coal, 20% from renewable energy, and about 3% from others [3]. Natural gas is a well known, cleaner fossil fuel, but it also causes emissions of air pollutants, especially NOx emissions. However, the air pollution problem has become a public concern, which has pushed the government to adopt several strategies to continuously reduce air pollutant emissions from the power generation sector in the last decade. These strategies include retirement of aged, polluting power generation units fueled by coal and oil, construction of new LNG power generators, construction of new coal power generators with ultra-low emission technology, and improvements in the air pollution control efficiency of existing units. These programs have reduced emissions of PM, SOx, and NOx from power generation sectors and obviously improved air quality in Taiwan during the last ten years.
Fossil fuels can be depleted in the future. Renewable energy (bioenergy, solar energy, wind energy, geothermal energy, ocean, hydropower, etc.) [24,25] and cleaner energy (hydrogen energy, fuel cells, etc.) [26,27] could be alternative fuels for fossil-fuel energy, which can also eliminate the risk of energy depletion and global warming.
In addition, CO2 and climate change are important issues for power plants. Some new concepts have been introduced: selective configuration of exhaust gas recirculation systems to reduce CO2 emission in the natural gas combined-cycle power plants [28], and CO2 capture and reduction via different methods [29,30].
In Taiwan, the renewable energy will contribute 20% of the nation’s energy requirement by 2025 [3]. A solar radiation power plant is set to provide 2802 to 20,000 MW (20 GW) during 2018 to 2025, and wind power generation may increase to 5 GW by 2025 [3]. Cleaner electricity production is an important issue for government, which needs to reduce excessive air pollution and fossil-fuel effects on climate change.
In the present study, emission abatement of SOx, NOx, and PM from fossil-fuel-based electricity power generation plants in Taiwan was investigated. Data from 2014 and 2018 were used to evaluate the effectiveness of various control strategies in terms of achieving the goal of cleaner electricity generation in Taiwan. In addition, the potential abatement of air pollutant emissions by 2025 due to switching from coal-fired power generation units to natural gas for the purpose of electricity generation was also investigated.

2. Experimental Procedure

2.1. Power Plant Operating Data

In Taiwan, most power plants are managed by the Taipower Company, which is a government-owned organization. In 2018, the Taipower Co. produced approximately 78% of the electricity in Taiwan. There are nine private power companies that contribute approximately 22% of the electricity generated. Taipower Co. operated 59 fossil-fuel units in 2014 (21 coal-fired units, 6 oil-fired units, and 32 LNG-fired units) and 59 units in 2018 (24 coal-fired units, 4 oil-fired units, and 31 LNG-fired units), as shown in Table 1. The power generation profile changed during this period due to implementation of various programs.
This study investigates the characteristics of air pollutant emissions, carried out by analyzing the public database for specific power plants in Taiwan. In Taiwan, each power generation unit is required by law to periodically submit its operational records to the Environmental Protection Administration. These data include emissions, operation hours, and loading. More detailed data are released from various management offices of the power plants.
In 2014, there were 6 oil-fueled generator units, 21 coal-fired units, and 32 LNG-fueled units in operation. All oil-fueled units are to be shut down and dismantled by 2025, and the number of LNG-fueled units will increase based on the energy policies.
The data from 59 generation units in 13 power plants represented approximately 75% of the total power generation and 95% of the coal-fired generation capacity in 2018. Figure 1 shows the trend of the electricity generation profiles in Taiwan.

2.2. Air Pollutant Emission Data

Air pollutant emission data for NOx and SOx emissions for each power plant were derived from the emissions reporting system managed by the Taiwan EPA [33]. All coal-fired units are required by law to be equipped with CEMS and to submit reports. Most emission data were calculated from CEMS records and air pollution fee records. The CEMS system follows the criteria established by the United States Environmental Protection Agency (USEPA) and United Kingdom in Europe [34,35]. The oil-based and LNG-based units are not required to have CEMS; therefore, their emission data were estimated using periodic source testing records. The CEMS database was developed by the Taiwan EPA in 2003. CEMS data comprise dependable hourly averages.
However, there is not a CEM system providing mass PM emissions data in Taiwan. The mass PM emissions data from each unit under consideration were therefore derived from regular source test data. Thus, the data quality was not as good as that for SOx and NOx.

2.3. Emissions Factor for Each Power Plant

The emissions factor for power plants is typically expressed as the weight of pollutants divided by a unit of electricity generated, as follows:
EF (g/kWh) = (Wi/EPj),
where Wi is the pollutant emissions per year (g/year) (i is for PM, SOx, and NOx); EPj is the electricity generated (kWh/year), where j represents oil, LNG, and coal combustion. Based on the CEMS criteria, the uncertainty of emission factors were less than 20%.

3. Results and Discussion

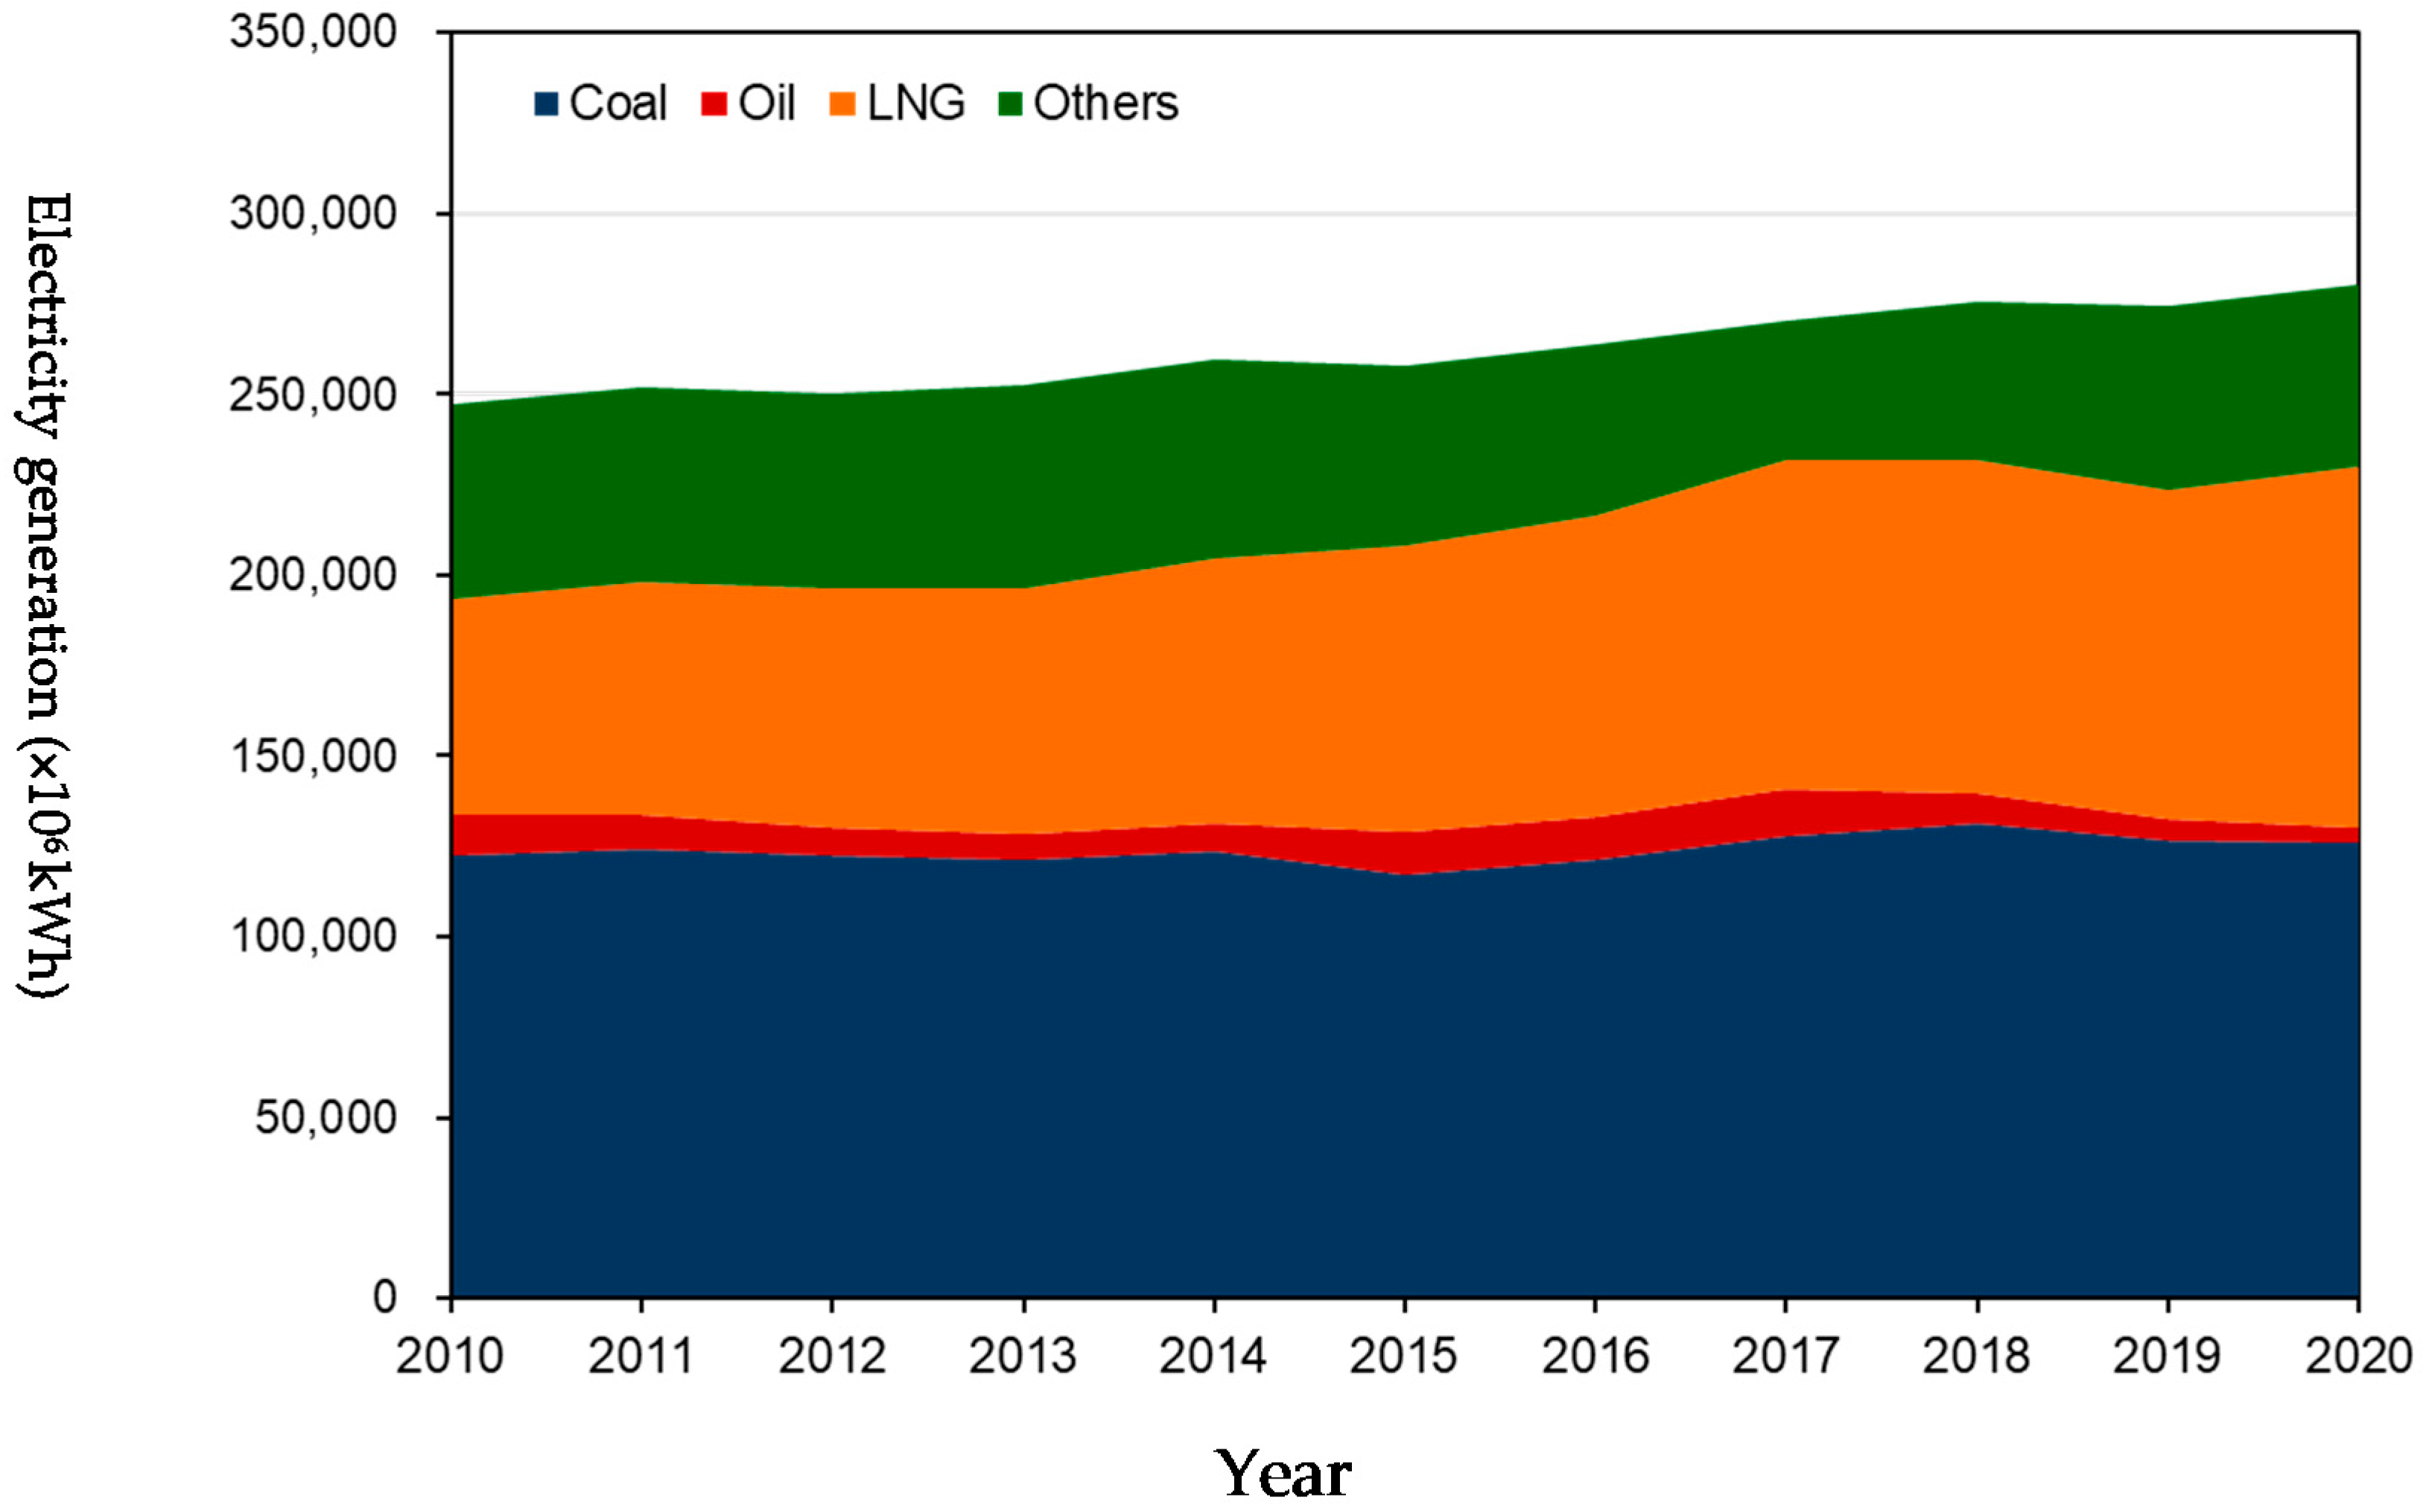
3.1. Air Pollutant Emissions from Different Fuel-Based Power Generation Units

In Taiwan, power plant emissions contributed approximately 36–41% (30,097–43,663 TPY) for SOx, 31.1–35.5% (48,530–66,656 TPY) for NOx, and 9.6–12.8% (4496–5422 TPY) for PM in the stationary sources category in 2010, 2014, and 2018, as shown in Table 2.
The annual electricity generated from various fuel-based units in the last ten years grew by 13.4% in Taiwan, as shown in Figure 1. In 2014, the total electricity generated was approximately 219.2 × 10⁹ kWh (2.9% from oil, 37.5% from coal, 32.3% from LNG, and 28.3% from others). In 2018, the total electricity generated was approximately 233.3 × 10⁹ kWh (2.8% from oil, 38.8% from coal, 38.6% from LNG, and 19.8% from others). The growing demand for electricity has placed much pressure on power generation management, especially as it relates to air pollution abatement.
In 2014, the annual electricity generated from various fuel-based units was 47.5% (coal), 3.1% (oil), and 28.1% (LNG), respectively. Coal was the dominant source of electricity in Taiwan before the energy transformation policy was enacted.
In 2018, the fraction of electricity generated comprised 47.6% (coal), 3.0% (oil), and 33.5% (LNG), respectively. However, the fraction of the annual electricity generated from coal and LNG increased. During these years, the energy transformation program authorized the demolition of two aged oil-fueled units, two aged coal-fired units, and three aged LNG-fueled units. At the same time, four coal-fired units and one LNG-fueled unit were retrofitted, and the performance of air pollution control devices was evaluated and improved. One LNG-fueled unit was introduced into the fossil-fuel power generation system. The fraction of various fuels applied for generating electricity changed, which also altered the air pollution emissions accordingly. The output of electricity fueled by LNG increased by 27% from 2014 to 2018. The output of coal-based electricity generated also gradually increased during this period.
Annual emissions of PM, SOx, and NOx in 2014 and 2018 from various fuel-based units are shown in Table 2. Annual emissions of SOx, NOx, and PM were reduced by 26%, 18%, and 16% from 2014 to 2018, respectively. In terms of the SOx emissions, major abatement of emissions was contributed by coal-based units with 7361 TPY (ton per year) and oil-fueled units with 3406 TPY. However, the emissions from LNG-fueled units increased slightly with 38 TPY due to incremental increases in natural gas consumption. In terms of NOx emissions, a major reduction in emissions was also contributed by coal-fired units with 13,254 TPY. The emissions from oil-fueled units and LNG-fueled units increased, with 592 and 1997 TPY, respectively. In terms of PM emissions, a major reduction in emissions was contributed by coal-fired units, with 868 TPY, and a minor reduction in emissions contributed by LNG-fueled units, with 28 TPY. The emissions from oil-based units increased slightly, with 30TPY.
The results indicate that the emissions of these three air pollutants were contributed mostly by coal-fired units, which were the dominant sources in the fossil-fuel power generation category in Taiwan. However, the NOx emissions were increased by oil-fueled and LNG-fueled units. This means that reductions by improving the efficiency of NOx emissions from coal-based units were offset by incremental increases in emissions from LNG-fueled and oil-fueled units. Resulting from its high air pollution emission and older electric generation system, the oil power plant will be phased out after 2025.

3.2. Air Pollutant Emission Factors from Electricity Generation Units

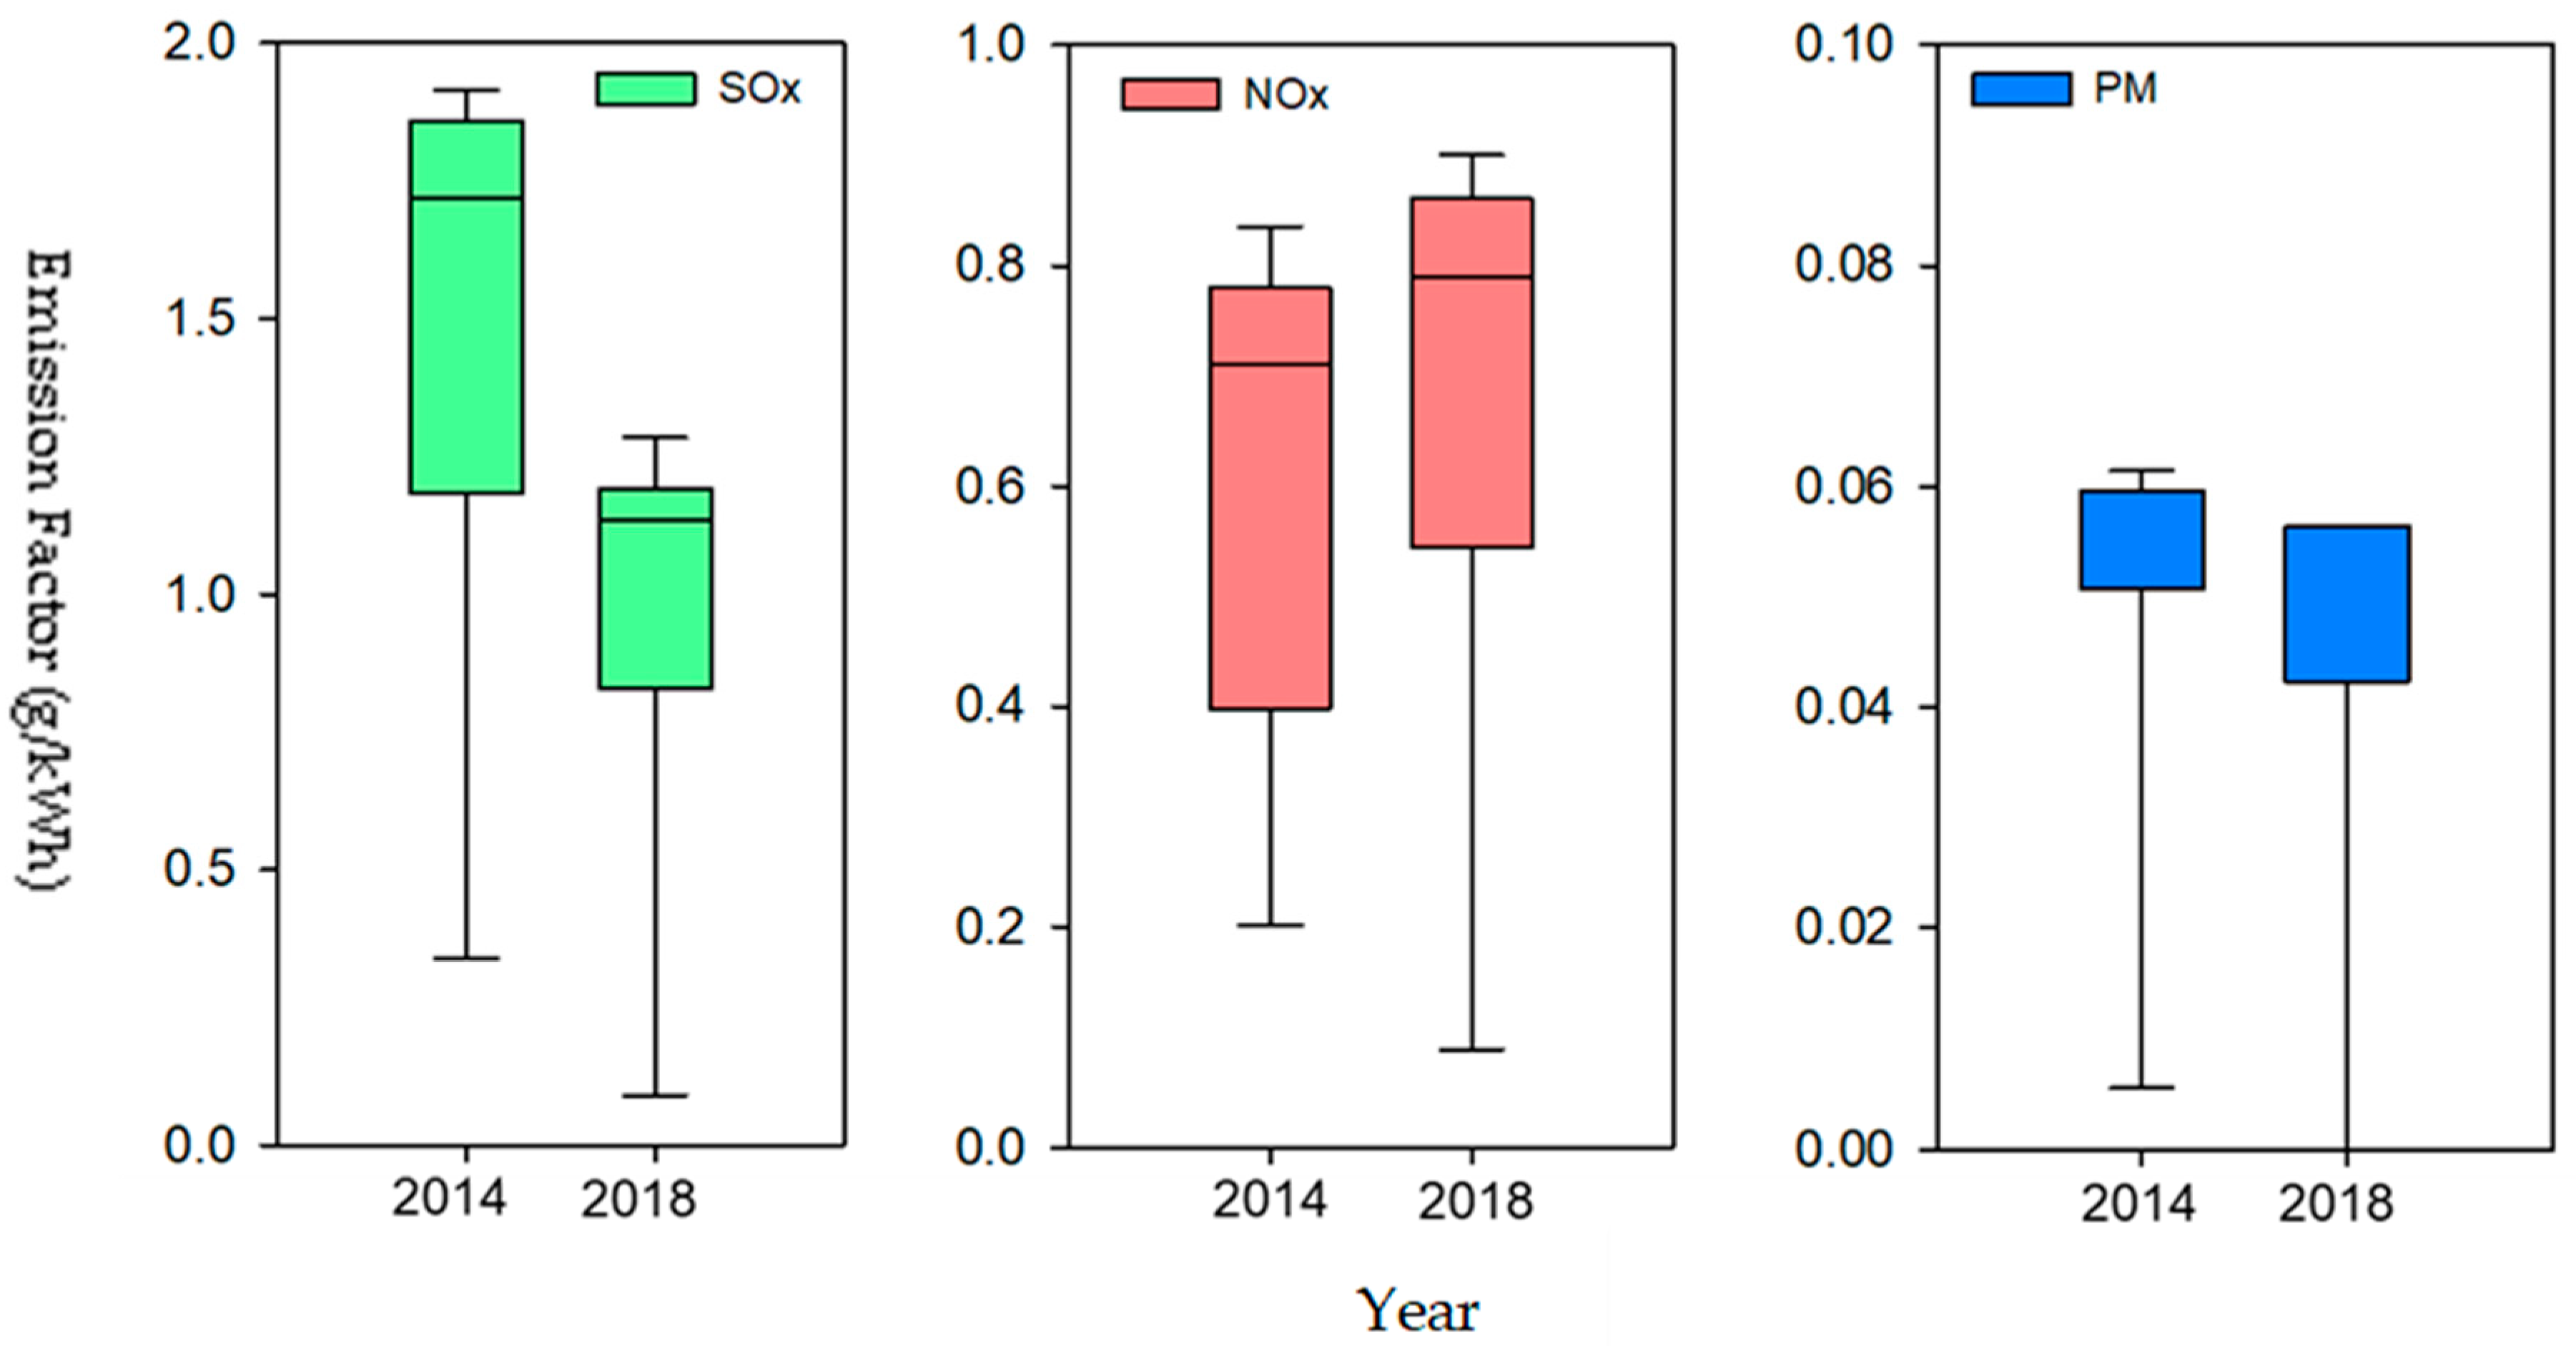
3.2.1. Coal-Fired Generation Units

The air pollutant emission factors for the coal-fired generation units are shown in Figure 2.
In 2014, the SO2 emission factor from each generation unit ranged between 0.105 and 0.742 g/kWh, with an average of 0.362 g/kWh, reflecting a 7.07-fold difference. The emission factor for NOx from each generation unit ranged between 0.235 and 0.566 g/kWh, with an average of 0.428 g/kWh, reflecting a 2.41-fold difference. The PM emission factor from each generation unit ranged between 0.023 and 0.049 g/kWh, with an average of 0.044 g/kWh, reflecting a 2.13-fold difference.
In 2018, the SO2 emission factor from each generation unit ranged between 0.080 and 0.412 g/kWh, with an average of 0.251 g/kWh, reflecting a 5.15-fold difference. The NOx emission factor from each generation unit ranged between 0.093 and 0.408 g/kWh, with an average of 0.273 g/kWh, reflecting a 4.39-fold difference. The PM emission factor from each generation unit ranged between 0.002 and 0.043 g/kWh, with an average of 0.032 g/kWh, reflecting a 21.5-fold difference.
The maximum SOx, NOx, and PM emission factor decreased by approximately 44.5, 27.8, and 12.0% from 2014 to 2018, respectively. The ensemble mean values for the SOx, NOx, and PM emission factors were 30.5, 36.0, and 28.0%, in descending order, respectively. The NOx emissions improved significantly. These results indicate that retirement of the old polluting units and introduction of new coal-fired generation units with high performance air pollutant control devices could clearly reduce the emissions of SOx and NOx.
However, significant variations in the pollutant control efficiency among the various units were observed.

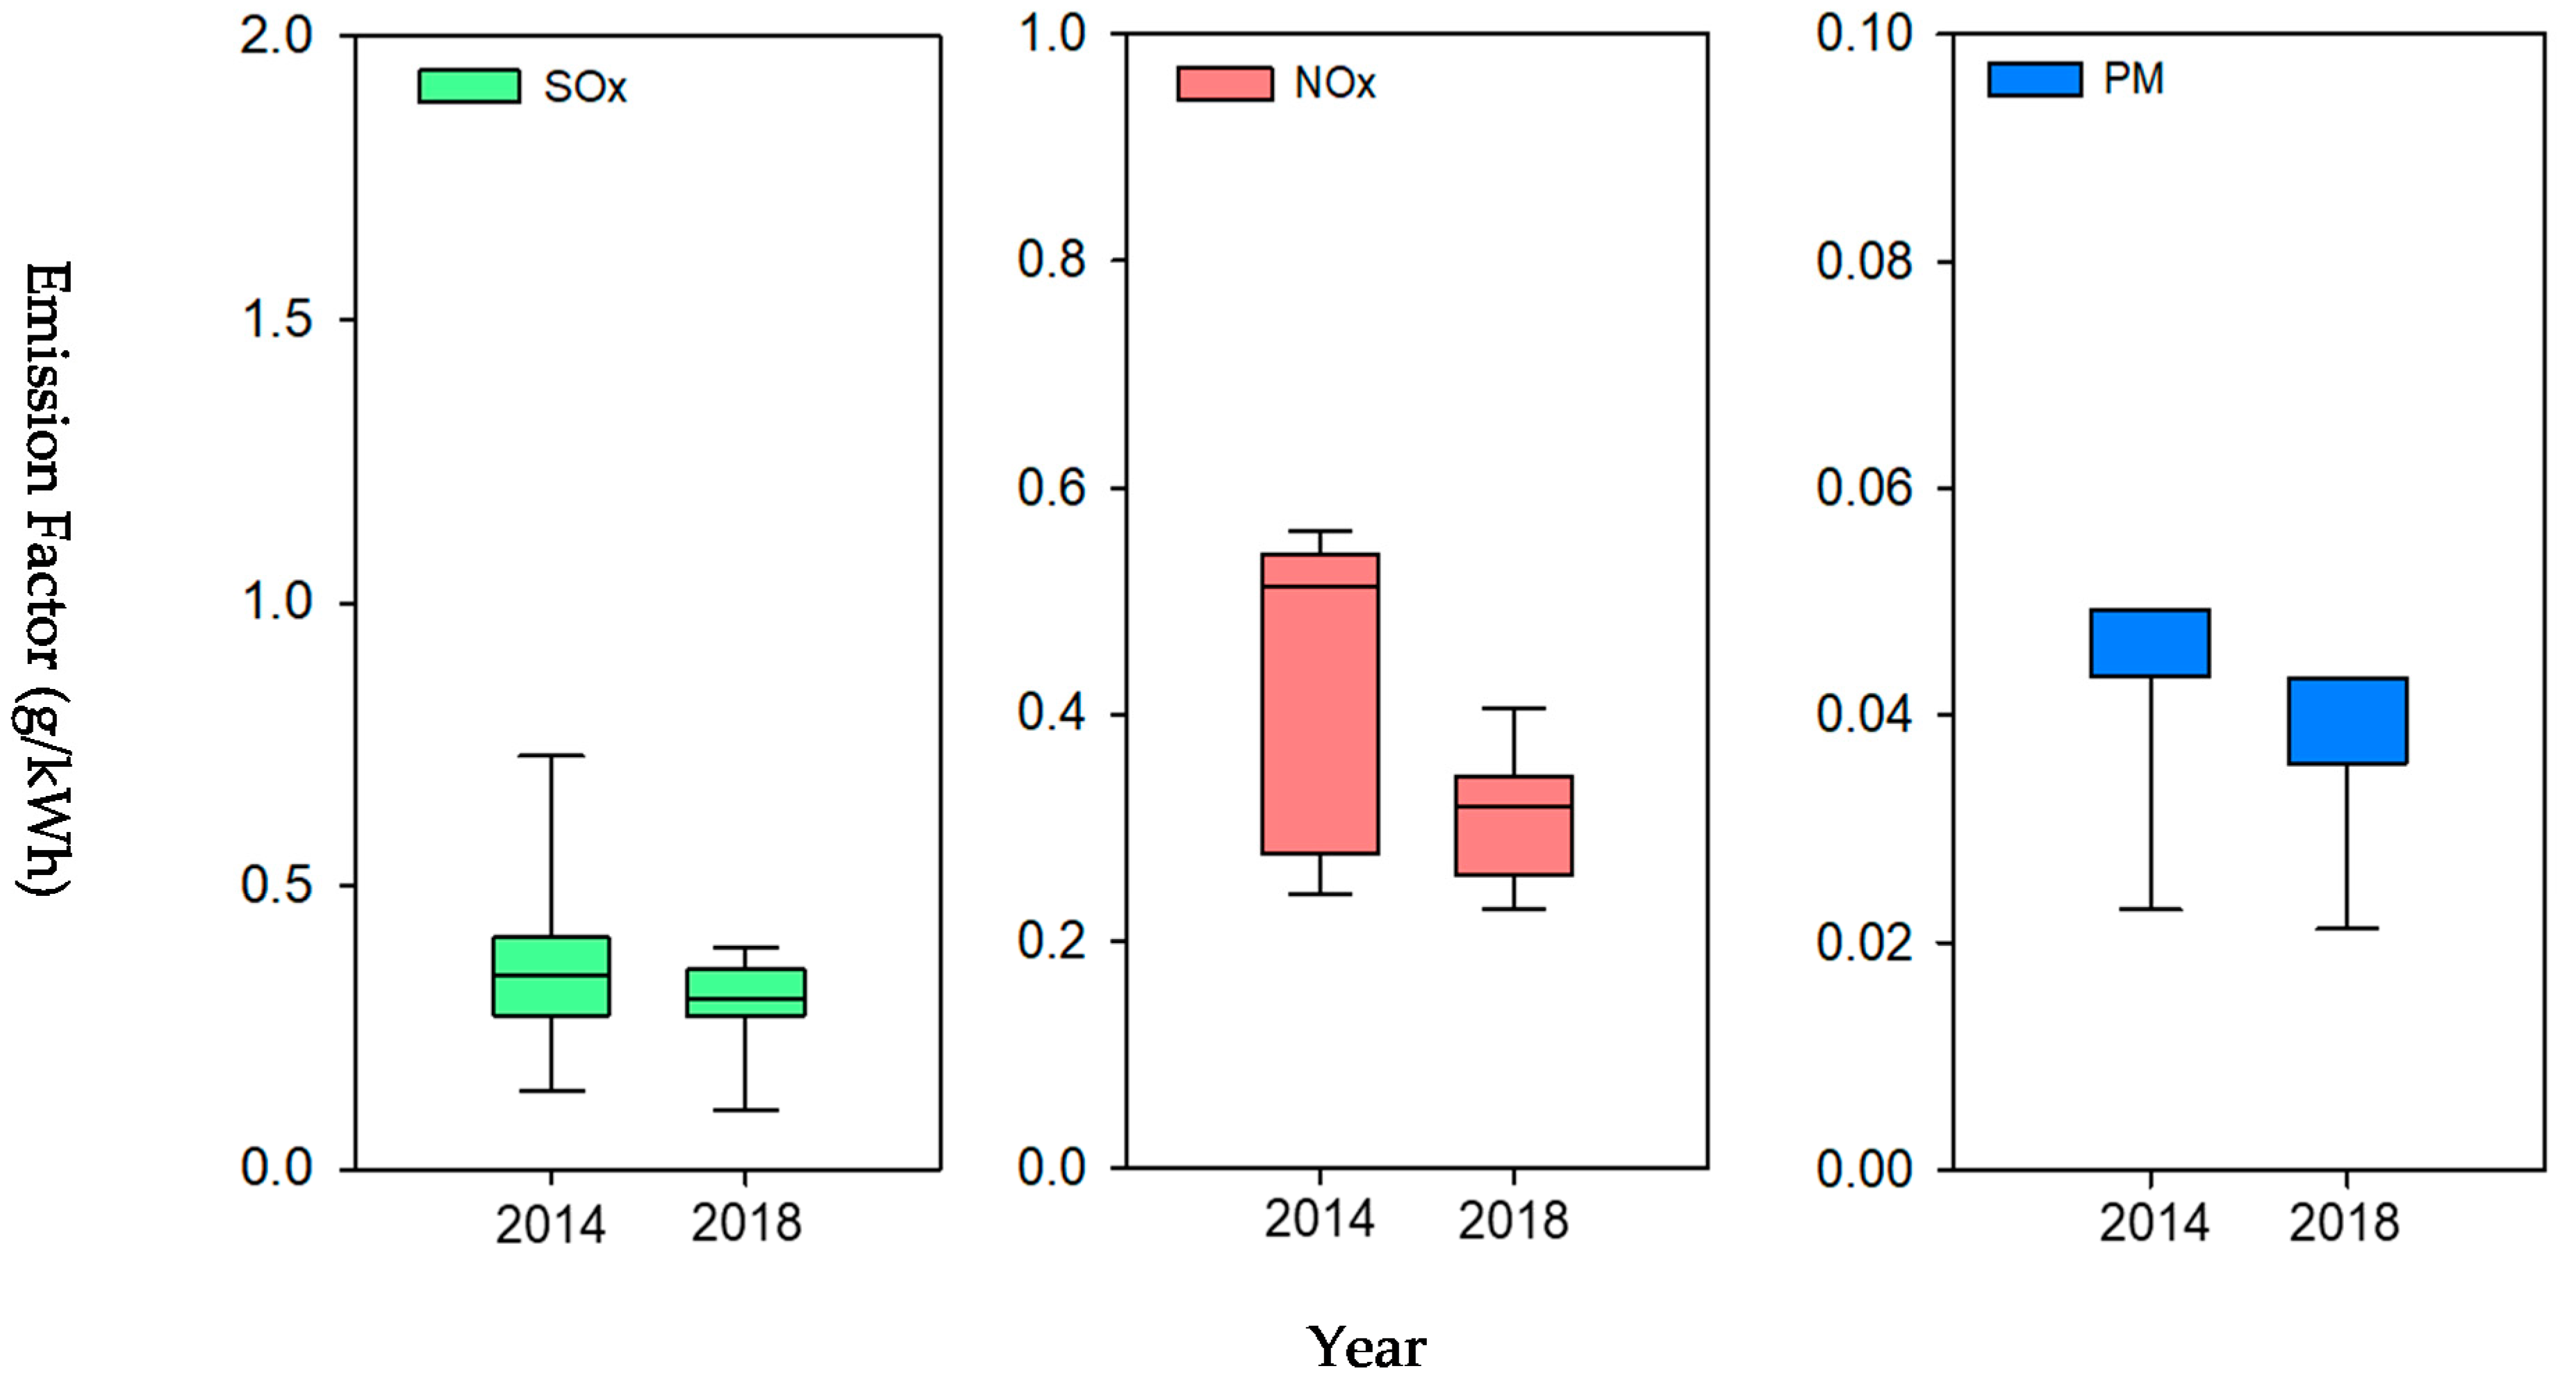
3.2.2. LNG-Fueled Generation Units

The air LNG-fuel pollutant emission factors are shown in Figure 3. In 2014, the SO2 emission factor from each generation unit ranged between N.D. (not detected) and 0.021 g/kWh, with an average of 0.0015 g/kWh. The NOx emission factor from each generation unit ranged between 0.047 and 1.122 g/kWh, with an average of 0.272 g/kWh, reflecting a 23.71-fold difference. The PM emission factor from each generation unit ranged between N.D. and 0.046 g/kWh, with an average of 0.018 g/kWh. However, the SOx emission factor from the LNG-fuel generation units was very low compared to those of coal-fired units. It was surprising that the PM in the LNG-fuel emissions was unexpectedly high. The maximum value of LNG-fired generation units was approximately equal to the level of the coal-fired unit in 2014.
In 2018, the SOx emission factor from each LNG-fuel generation unit ranged between N.D. and 0.019 g/kWh, with an average of 0.0016 g/kWh. The NOx emission factor from each generation unit ranged between 0.072 and 0.403 g/kWh, with an average of 0.200 g/kWh, reflecting a 5.60-fold difference. The PM emission factor from each generation unit ranged between 0.003–0.038 g/kWh, with an average of 0.014 g/kWh, reflecting a 12.67-fold difference.
The average SOx and NOx emission factor did not appear to change between 2014 and 2018. The average value of the PM emission factor dropped by 26.1%. The maximum NOx and PM emission factors decreased by approximately 64.1% and 16.9% from 2014 to 2018, respectively. The NOx and PM emissions improved significantly due to the retirement of old, highly polluting LNG-fired generation units.
Figure 4 shows the pollutant emissions per kWh for the different fossil fuels. In 2014, the SO2 electric generation emissions were 1.635 g/kWh; NOx emissions were 0.658 g/kWh, and PM emissions were 0.054 g/kWh for the oil power plants. In 2018, the SO2 emissions were 1.157 g/kWh; NOx emissions were 0.805 g/kWh, and PM emissions were 0.056 g/kWh for oil-powered plants. Based on the pollution emissions in 2014, the emission factors decreased by 29.2%, increased by 22.3% for NOx, and exhibited a slight increase of 3.7% for PM compared with those in 2018.
These data indicate that air pollutant emission abatement was significant. Implementation of abatement programs could lead to clean electricity generation and improve air quality in Taiwan. However, significant variations in pollutant control efficiency among the various generation units were observed.

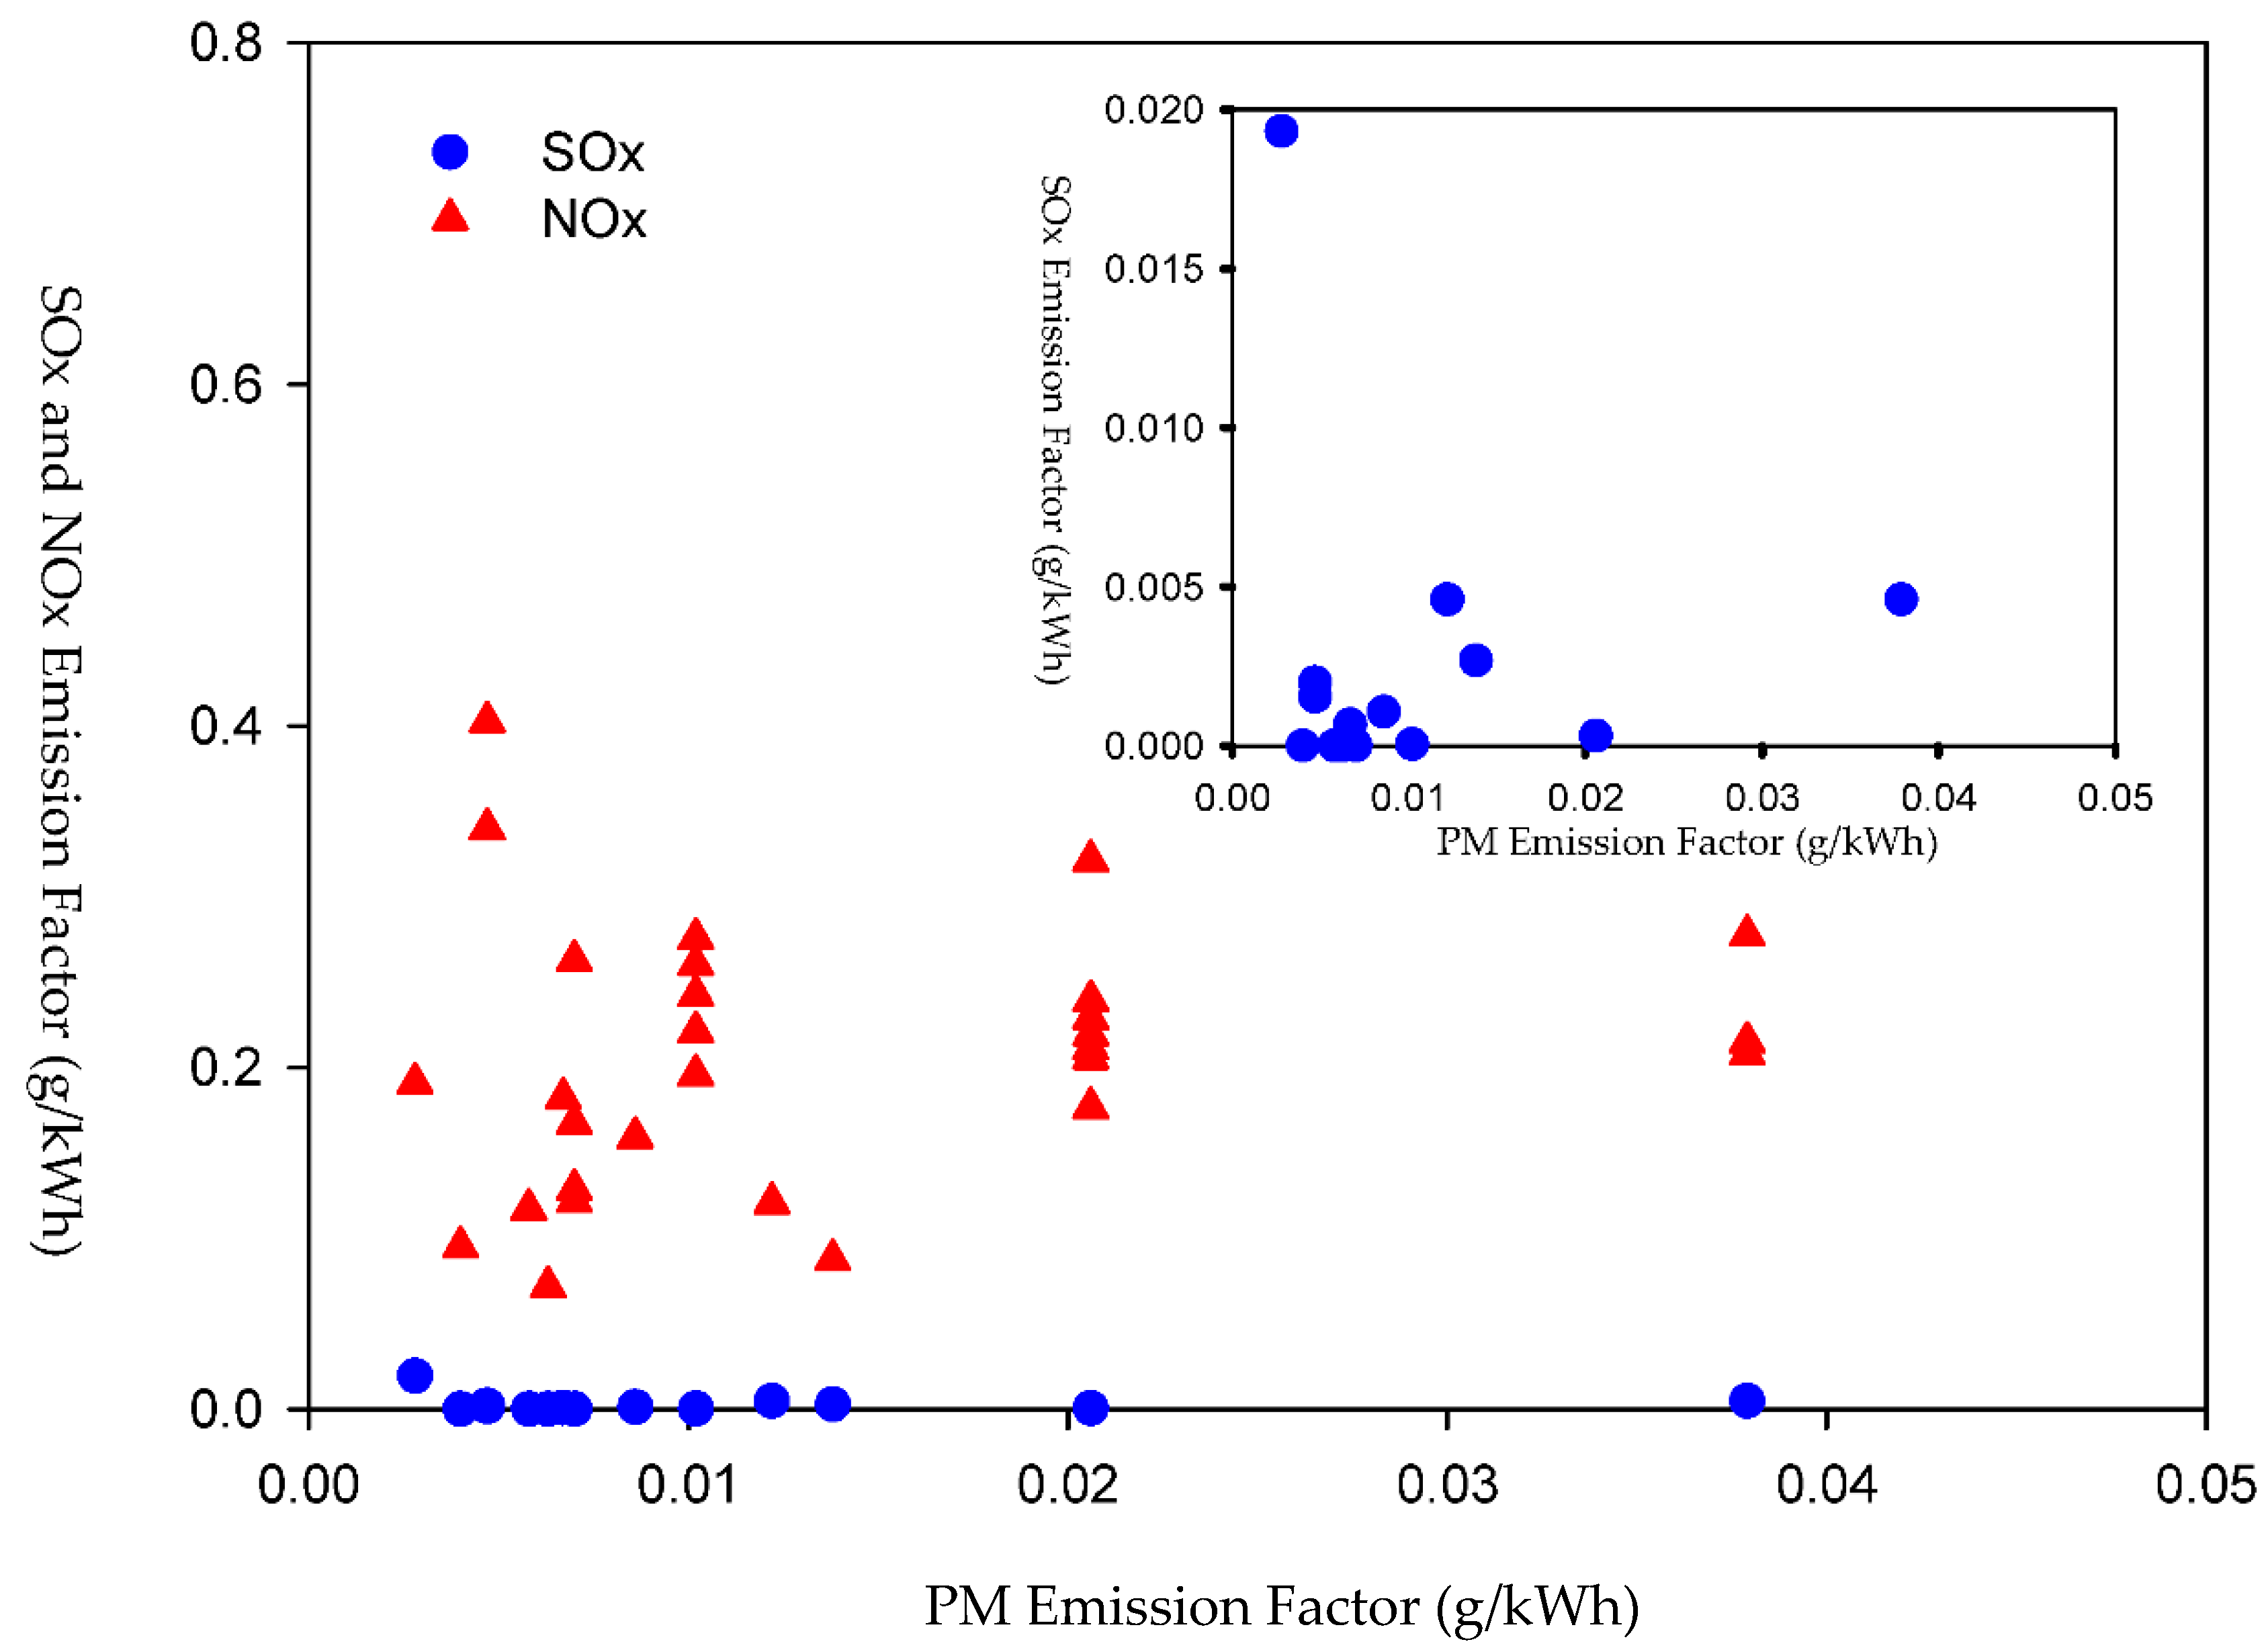
3.3. Emission Characteristics of Different Power Plants

Emissions of air pollutants from fossil-fueled electricity generation units depend on many parameters. The type of fuel, the capacity of the generation unit, the combustion technology, air pollution control devices, and operation management strongly influence emissions [21].
In this study, the relationship between the PM–SOx–NOx emission factors were examined to evaluate the overall potential co-benefiting effects of these control strategies on air pollution abatement.
The capacities of the coal-fired and LNG-fueled power generation units were classified into three categories: category-I (C-I < 400 MW), category-II (C-II: 400–600 MW), and category-III (C-III > 600 MW). There were no data for the C-I group in Taiwan. The electricity generation of the coal power plant for groups C-II and C-III was 64,028.9 and 22,475.6 kWh, respectively, in 2014. The electricity generation of the coal power plant for groups C-II and C-III was 53,828.4 and 42,119.6 kWh, respectively, in 2018. In Taiwan, the generation units corresponding to groups C-II and C-III accounted for around 74.0% and 26.0% of total fossil-fueled electricity generation in 2014, and 56.1% and 43.9% in 2018, respectively.
The emission factors for the various air pollutants are shown in Figure 5.
The PM emission factors for the C-II and C-III coal-fired power generation units were 0.0460 and 0.0311 g/kWh in 2014, and 0.0415 and 0.0162 g/kWh in 2018, respectively. The SOx emission factor of for the C-II and C-III coal-fired power generation units were 0.4055 and 0.2095 g/kWh in 2014 and 0.3203 and 0.1442 g/kWh in 2018. For the coal-fired generation units, the NOx emission factors for C-II and C-III were 0.5634 and 0.2595 g/kWh in 2014, respectively, and were 0.3329 and 0.1810 g/kWh in 2018. The NOx emission factors for groups C-II and C-III both decreased significantly. The maximum SOx and NOx values for the coal-fired generation units decreased significantly, which means the local impacts on air quality were improved.
For the LNG-fueled units, groups C-I, C-II, and C-III were 15,123.1, 24,608.2, and 32,594.9 kWh, respectively, in 2014. In 2018, the electricity generation from LNG-fueled plants was 14,136.0, 28,674.0, and 45,543.3 kWh, corresponding to C-I, C-II and C-III, respectively, in 2018. Most of the LNG-fueled units emitted less PM (< 0.04 g-PM /kWh) and SOx (<0.005 g-SOx /kWh). The NOx emission factors ranged from 0.072 to 0.403 g-NOx/kWh. Some LNG-fueled generation units emitted large amounts of NOx due to a lack of a NOx control system.
The PM emission factor for the LNG-fueled power generation units from groups C-I, C-II, and C-III were 0.0345, 0.0083, and 0.0141 g/kWh, respectively, in 2014 and were 0.0202, 0.0085 and 0.0146 g/kWh in 2018, respectively. The PM emission factor decreased slightly only in group C-I.
For the LNG-fueled generation units, the NOx emission factors for C-I, C-II, and C-III were 0.4775, 0.1545, and 0.2061 g/kWh in 2014 and were 0.1971, 0.1783, and 0.2231 g/kWh in 2018, respectively. The NOx emission factor in group C-I decreased significantly, but it slightly increased in C-II and C-III.
In the LNG-fueled power generation units, the SOx emission factors for groups C-I, C-II, and C-III were 0.00041, 0.00310, and 0.00054 g/kWh, respectively, in 2014 and were 0.00197, 0.00206, and 0.00086 g/kWh, respectively, in 2018. The SOx emission factor did not change significantly.
The results indicate that large capacity units had a higher PM and NOx emissions for LNG power plants. In the early stage, the LNG power plants were not equipped with the air pollution control system. After 2014, the stringent emission standards were conducted, and then the older LNG power plants were equipped with the NOx emission control system and reduced NOx, but they did not have control systems for PM and SOx emission. Larger capacity LNG systems were constructed and permitted before 2014, and air pollution control devices will be retrofitted in the next future year.
In the case of the coal-fired power plants, the large capacity units had low air pollution emissions due to higher combustion efficiency and better air pollution control systems [36]. The new source emission standards for coal-fired power plants in the US are 0.0408 g/kWh for PM, 0.1814 mg/kWh for SO2, and 0.4899 mg/kWh for NOx [37]. In 2018, the average PM emissions for US coal-fired power plants was 0.0236 g/kWh; SO2 was 0.1583 g/kWh, and NOx was 0.2552 g/kWh (EIA, 2021) [14]. Compared with the US, the coal-fired units in Taiwan in 2018 had higher emissions than those in the US by 1.34-fold for PM, 1.59-fold for SO2, and 1.07-fold for NOx, respectively. The results indicate that the air pollution control efficiency for coal-fired power plants in Taiwan should be further improved to reduce the emissions of PM and SOx even though the improvements between 2014 and 2018 were obvious.
Figure 6 compares the PM emission factor with the SOx and NOx emission factors for the coal-fired power plants. The results indicate that the PM emission factor had a correlation with SOx (r = 0.70) emissions and a slight correlation with NOx (r = 0.41) emissions.
Figure 7 compares the PM emission factor with the SOx and NOx emission factors for the LNG-fueled generation units. There was no clear correlation between the PM and SOx emission factors (r = −0.11) and only a slight correlation with NOx (r = 0.54). PM emissions may be correlated with SOx or NOx emissions due to fuel effects, control technology, or other parameters [38,39,40]. However, no clear trends were observed among these data.

3.4. Air Pollution Emissions and Control Equipment

The emission factors were grouped into various categories by air pollution control devices, as shown in Table 3.
In oil-fueled generation units, a low NOx burner and over-fire air are usually applied for combustion modifications, and an electrostatic precipitator with an efficiency in the range of 89.5–91.9% is used for PM control. The average emission factors for SOx and PM are higher than those of the coal-fired and LNG-fueled generation units.
Most LNG-fueled units are equipped with low NOx burners (LNBs) to reduce NOx emissions. Since 2014, many LNG-fueled units have been retrofitted and equipped with selected catalytic reduction (six sets) or dry low NOx combustion systems (DLN) associated with the SCR process (five units). Some units have added steam/water injection processes (three units) or are equipped with LNB and steam and water injection (SWI) (three units). In the case of LNG-fueled generation units, NOx emissions from an SWI-equipped system may as high as five times the emissions that of an LNB only or an LNB- and SWI-combined system. The least NOx emissions could be achieved by combining an LNB and SCR. PM emissions appeared to drop simultaneously. However, the NOx emission factor for an LNG-fueled system was still higher (1.42 times) than that of the group C-III coal-fired unit in 2018. The NOx control efficiency of LNG-fueled units should be further improved in the future.
Among coal-fired generation systems, 17 units were equipped with an LNB, OFA, SCR, EP, and wet flue gas desulfurization (WFGD). There were five units equipped with an LNB, OFA, SCR, a baghouse filter (BF), and WFGD for air pollution control. Three units applied SCR, EP, and WFGD. Two units applied EP and WFGD.
The exhaust control systems presented different emission factors. For SOx abatement, the performance was in the following order: CS-III (LNB+OFA+SCR+BF+SWFGD) > CS-II (LNB+OFA+SCR+EP+WFGD) > CS-I (SCR+EP+WFGD). For NOx control, the order was CS-III > CS-I > CS-II. For PM control, the performance of CS-III was much better than that of CS-I and CS-II.
Owing to the high pollutant emissions of oil power plants, they will be phased out after 2025. In addition, the older coal fire power plants will be replaced by new generation sets and equipped with new air pollution control systems to achieve the low air pollutant emissions. The number of LNG power plants will increase, while the number of coal consumption and coal generation power plants will decrease. National energy policies are forcing the increased capacity of LNG power plants—up to 50% of electricity power generation systems after 2025. Therefore, the energy safety and security stockpiles should be taken into consideration by government. In the policy statement, there is at least a 7-day requirement for stockpiles in 2019, increasing to at least a 14-day stockpile requirement in 2027. In addition, the storage capacity required is at least 15 days in 2019 and will be at least 24 days in 2027 [41].

4. Conclusions

In Taiwan, the goal of energy policy is to transition to low risk and low pollution emissions. Several programs have been implemented since 2010, which have resulted in improvements in air pollution control. From 2014 to 2018, there was a 13.8% increment increase in electricity generation from the power generation sector. However, the annual air pollutant emissions from the fossil-fueled power generation sector decreased from 2014 to 2018. The abatement in 2018 was 28% for SOx, 18% for NOx, and 16% for PM, compared to 2014. The integrated emission factors of these air pollutants were also significantly reduced. The emission factors of SOx, NOx, and PM decreased by 35%, 28%, and 26%, respectively. Integration of these measures, including adoption of more stringent emission standards for new sources, phasing out of high emissions power generation units, retrofitting of air pollution control devices on existing units, and construction of new LNG-fueled generation units, all resulted in improvements in air pollutant emissions by fuel switch and multiple approach.
In Taiwan, energy policy still reflects dependence on fossil fuel to supply the demand for electricity in the future. Air pollution caused by coal-fired and LNG-fueled power plants will still be a critical concern in air quality management. These data indicate that more efficient air pollutant control systems should be applied to reduce the emissions of SOx, NOx, and PM from the fossil-fuel power generation sector. In addition, electrical-supply energy policies are setting a goal of at least 20% from renewable energy and 50% from LNG after 2025. Some infrastructure, such as LNG terminals, storage systems, transmission and distribution networks, are important works to ensure electricity supply stability in the future.

Author Contributions

Conceptualization, J.-H.T. and H.-L.C.; methodology, S.-H.C. and H.-L.C.; software, S.-H.C. and S.-F.C.; validation, S.-H.C. and H.-L.C.; formal analysis, J.-H.T. and H.-L.C.; investigation, S.-H.C. and H.-L.C.; resources, J.-H.T.; data curation, S.-H.C. and H.-L.C.; writing—original draft preparation, H.-L.C. and J.-H.T.; writing—review and editing, J.-H.T.; visualization, J.-H.T.; supervision, J.-H.T.; project administration, J.-H.T. and H.-L.C.; funding acquisition, J.-H.T. All authors have read and agreed to the published version of the manuscript.

Funding

Environmental Protection Administration and Ministry of Science and Technology, Republic of China (Taiwan).

Institutional Review Board Statement

Not applicable.

Informed Consent Statement

Not applicable.

Data Availability Statement

The authors confirm that the data supporting the findings of this study are available within the article. Data sharing is not applicable.

Acknowledgments

The authors express their sincere thanks to the Environmental Protection Administration and Ministry of Science and Technology, Republic of China (Taiwan) for research funding support (MOST-107-EPA-F-011-003, and MOST 104-2221-E-006-020-MY3).

Conflicts of Interest

The authors declare no conflict of interest.

References

  1. BP (British Petroleum). BP Statistical Review of World Energy. 2020. Available online: https://www.bp.com/content/dam/bp/business-sites/en/global/corporate/pdfs/energy-economics/statistical-review/bpstats-review-2018-coal.pdf (accessed on 5 May 2021).
  2. International Energy Agency (IEA). Energy and Air Pollution. In World Energy Outlook Special Report 2016; IEA: Paris, France, 2016; Available online: https://www.iea.org/reports/energy-and-air-pollution (accessed on 10 September 2020).
  3. Bureau of Energy (BOE). Ministry of Economic Affairs. Available online: https://www.moeaboe.gov.tw/ECW/populace/home/Home.aspx (accessed on 29 November 2020).
  4. Taiwan Environmental Protection Agency (TEPA). Taiwan Air Pollutants Emission Data System. 2021. Available online: https://teds.epa.gov.tw/Introduction.aspx (accessed on 26 May 2021).
  5. WHO Regional Office for Europe; OECD. Economic Cost of the Health Impact of Air Pollution in Europe: Clean Air, Health and Wealth; WHO Regional Office for Europe: Copenhagen, Denmark, 2015. [Google Scholar]
  6. European Environment Agency (EEA). Air Quality in Europe–2018 Report; EEA: Copenhagen, Denmark, 2018. [Google Scholar]
  7. The World Bank. The Cost of Air Pollution: Strengthening the Economic Case for Action; The World Bank: Washington, DC, USA, 2016. [Google Scholar]
  8. Burt, E.; Orris, P.; Buchanan, S. Scientific Evidence of Health Effects from Coal Use in Energy Generation; University of Illinois at Chicago School of Public Health: Chicago, IL, USA, 2013. [Google Scholar]
  9. Hendryx, M.; Zullig, K.J.; Luo, J. Impacts of coal use on health. Annu. Rev. Public Health 2020, 41, 397–415. [Google Scholar] [CrossRef] [PubMed] [Green Version]
  10. Kravchenko, J.; Lyerly, H.K. The impact of coal-powered electrical plants and coal ash impoundments on the health of residential communities. N. C. Med. J. 2018, 79, 289–300. [Google Scholar] [CrossRef] [PubMed]
  11. Jing, L. 670,000 Smog-Related Deaths a Year: The Cost of China’s Reliance on Coal. South China Morning Post. 5 November 2014. Available online: https://www.scmp.com/news/china/article/1632163/670000-deaths-year-costchinas-reliance-coal (accessed on 5 October 2020).
  12. Biswas, T. Study estimates health impact of coal based power plants in India. BMJ 2013, 346, f2187. [Google Scholar] [CrossRef] [PubMed]
  13. Casey, J.A.; Su, J.G.; Henneman, L.R.F.; Zigler, C.; Neophytou, A.M.; Catalano, R.; Gondalia, R.; Chen, Y.T.; Kaye, L.; Moyer, S.S.; et al. Improved asthma outcomes observed in the vicinity of coal power plant retirement, retrofit and conversion to natural gas. Nat. Energy 2020, 5, 398–408. [Google Scholar] [CrossRef] [PubMed]
  14. U.S. EIA (Energy Information Adminstration). Changes in Coal Sector Led to Less SO2 and NOx Emissions from Electric Power Industry. 2021. Available online: https://www.eia.gov/todayinenergy (accessed on 20 February 2021).
  15. USEPA. Energy and the Environment: Reduce the Environmental Impact of Your Energy Use. 2021. Available online: https://www.epa.gov/energy/reduce-environmental-impact-your-energy-use (accessed on 2 July 2021).
  16. Tang, L.; Qu, J.; Mi, Z.; Bo, X.; Chang, X.; Anadon, L.D.; Wang, S.; Xue, X.; Li, S.; Wang, X.; et al. Substantial emission reductions from Chinese power plants after the introduction of ultra-low emissions standards. Nat. Energy 2019, 4, 929–938. [Google Scholar] [CrossRef]
  17. Chen, X.; Liu, Q.; Sheng, T.; Li, F.; Xu, Z.; Han, D.; Zhang, X.; Huang, X.; Fu, Q.; Cheng, J. A high temporal-spatial emission inventory and updated emission factors for coal-fired power plants in Shanghai, China. Sci. Total Environ. 2019, 688, 94–102. [Google Scholar] [CrossRef] [PubMed]
  18. Zhang, Y.; Bo, X.; Zhao, Y.; Nielsen, C.P. Benefits of current and future policies on emissions of China’s coal-fired power sector indicated by continuous emission monitoring. Environ. Pollut. 2019, 251, 415–424. [Google Scholar] [CrossRef] [PubMed]
  19. Ruan, R.; Liu, H.; Tan, H.; Yang, F.; Li, Y.; Duan, Y.; Zhang, S.; Lu, X. Effects of APCDs on PM emission: A case study of a 660MW coal-fired unit with ultralow pollutants emission. Appl. Therm. Eng. 2019, 155, 418–427. [Google Scholar] [CrossRef]
  20. Shon, Z.H.; Kang, M.; Park, G.; Bae, M. Impact of temporary emission reduction from a large-scale coal-fired power plant on air quality. Atmos. Environ. X 2020, 5, 100056. [Google Scholar] [CrossRef]
  21. U.S. EIA (Energy Information Administration). Electricity Explained: Electricity and the Environment. 9 December 2020. Available online: https://www.eia.gov/energyexplained/electricity/electricity-and-the-environment.php (accessed on 15 June 2021).
  22. Marrasso, E.; Roselli, C.; Sasso, M. Electric efficiency indicators and carbon dioxide emission factors for power generation by fossil and renewable energy sources on hourly basis. Energy Convers. Manag. 2019, 196, 1369–1384. [Google Scholar] [CrossRef]
  23. USEIA. Global Electricity Consumption Continues to Rise Faster than Population. 2020. Available online: https://www.eia.gov/todayinenergy/detail.php?id=44095 (accessed on 1 September 2021).
  24. International Renewable Energy Agency (IRENA). Renewable Energy Sources. 2021. Available online: https://www.irena.org/ (accessed on 1 September 2021).
  25. Sher, F.; Yaqoob, A.; Saeed, F.; Zhang, S.; Jahan, Z.; Klemes, J.J. Torrefied biomass fuels as a renewable alternative to coal in co-firing for power generation. Energy 2020, 209, 11844. [Google Scholar] [CrossRef]
  26. Al-Sharaa, N.K.; Sher, F.; Iqbal, S.Z.; Curnick, O.; Chen, G.Z. Design and optimization of electrochemical cell potential for hydrogen gas production. J. Energy Chem. 2021, 52, 421–427. [Google Scholar] [CrossRef]
  27. Sher, F.; Al-Sharaa, N.K.; Iqbal, S.Z.; Jahan, Z.; Chen, G.Z. Enhancing hydrogen production from steam electrolysis in molten hydroxides via selection of non-precious metal electrodes. Int. J. Hydrogen Energy 2020, 45, 28260–28271. [Google Scholar] [CrossRef]
  28. Qureshi, Y.; Ali, U.; Sher, F. Part load operation of natural gas fired power plant with CO2 capture system for selective exhaust gas recirculation. Appl. Therm. Eng. 2021, 190, 116808. [Google Scholar] [CrossRef]
  29. Al-Juboori, O.; Sher, F.; Rahman, S.; Rasheed, T.; Chen, G.Z. Electrochemical Production of Sustainable Hydrocarbon Fuels from CO2 Co-electrolysis in Eutectic Molten Melts. ACS Sustain. Chem. Eng. 2020, 8, 12877–12890. [Google Scholar] [CrossRef]
  30. Ishaq, H.; Ali, U.; Sher, F.; Anus, M.; Imran, M. Process analysis of improved process modifications for ammonia-based post-combustion CO2 capture. J. Environ. Chem. Eng. 2021, 9, 104928. [Google Scholar] [CrossRef]
  31. Taiwan Power Company (TPC). Information Disclosure. 2020. Available online: https://www.taipower.com.tw/TC/pageList.aspx (accessed on 10 December 2020).
  32. Taiwan Power Company (TPC). History of Net Power Generation and Purchased by TPC. 2021. Available online: https://www.taipower.com.tw/TC/Chart.aspx?mid=194 (accessed on 5 May 2021).
  33. Taiwan Environmental Protection Agency (TEPA). Taiwan Continuous Emission Monitoring Data System. 2020. Available online: https://cems.epa.gov.tw/home/Downloads (accessed on 20 November 2020).
  34. USEPA. Current Knowledge of Particulate Matter (PM) Continuous Emission Monitoring; Final Report EPA-454/R-00-039; U.S. Environmental Protection Agency: Research Triangle Park, NC, USA, 2000.
  35. UK Environment Agency (UKEA). Performance Standards and Test. Procedures for Continuous Emission Monitoring Systems: For. Gaseous, Particulate and Flow-Rate Monitoring Systems; Version 3.5; UKEA: London, UK, 2016. [Google Scholar]
  36. International Energy Agency (IEA). Technology Roadmap: High.-Efficiency, Low-Emissions Coal-Fired Power Generation; IEA: Paris, France, 2012; Available online: https://iea.blob.core.windows.net/assets/c43bc244-0050-45ec-807c-d870ae9241a7/TechnologyRoadmapHighEfficiencyLowEmissionsCoalFiredPowerGeneration_WEB_Updated_March2013.pdf (accessed on 10 September 2020).
  37. USEPA. 40 CFR Appendix Table 1 to Subpart UUUUU of Part 63—Emission Limits for New or Reconstructed EGUs; USEPA: Washington, DC, USA, 2015.
  38. Zhang, X. Emission Standards and Control of PM2.5 from Coal-Fired Power Plant; IEA Clean Coal Centre: London, UK, 2016; Available online: https://www.researchgate.net/profile/Xing-Zhang/publication/337446167_Emission_standards_and_control_of_PM25_from_coal-fired_power_plant/links/5ee23b50299bf1faac4b069a/Emission-standards-and-control-of-PM25-from-coal-fired-power-plant.pdf (accessed on 10 September 2020).
  39. ERIA (Economic Research Institute for ASEAN and East Asia). Improving Emission Regulations for Coal-Fired Power Plants in ASEAN; ERIA: Jakarta, Indonesia, 2017. [Google Scholar]
  40. EEA (European Environment Agency). EMEP/EEA Air Pollutant Emission Inventory Guidebook 2019; EEA: Copenhagen, Denmark, 2019; Available online: https://www.eea.europa.eu/publications/emep-eea-guidebook-2019 (accessed on 10 September 2020).
  41. Bureau of Energy (BOE). Ministry of Economic Affairs. Stable Supply of Natural Gas. 2021. Available online: https://www.moeaboe.gov.tw/ECW/english/content/Content.aspx?menu_id=8677 (accessed on 31 August 2021).
Figure 1. Profiles of power generation in Taiwan [32].
Energies 14 05716 g001
Figure 2. SOx, NOx, and PM emission factors for coal-fired generation units in Taiwan.
Energies 14 05716 g002
Figure 3. SOx, NOx, and PM emission factors for LNG generation units in Taiwan.
Energies 14 05716 g003
Figure 4. SOx, NOx, and PM emission factors for oil generation units in Taiwan.
Energies 14 05716 g004
Figure 5. SOx, NOx, and PM emission factors for coal- and LNG-fired power generation units based on capacity at 2014 and 2018.
Energies 14 05716 g005
Figure 6. Relationships among PM, SOx, and NOx emission factors for coal-fired power generation units.
Energies 14 05716 g006
Figure 7. Relationships among PM, SOx, and NOx emission factors for LNG-fueled power generation units.
Energies 14 05716 g007
Table 1. Profiles of fossil-fuel power generation capacity in Taiwan [31].
YearItemsOil *LNGCoalTotal
# of generation units6322159
2010Capacity of unit (MW)375–500246.8–755.8251–660
Installed capacity (MW)2750.015,746.6311,320.329,816.93
Electricity generation (109 kWh) 7.7958.083.82149.61
# of generation units6322159
2014Capacity of unit (MW)375–500246.8–755.8300–660
Installed capacity (MW)2750.015,746.6311,320.329,816.93
Electricity generation (109 kWh) 6.2470.9282.37159.52
# of generation units4312459
2018Capacity of unit (MW)500251.4–892.6500–800
Installed capacity (MW)2000.016,475.4313,720.332,195.73
Electricity generation (109 kWh)6.5990.1090.52187.21
#: number of generation units; * The liquid fuel power plant will be phased out in 2025.
Table 2. Air pollution emission (TPY) from the fossil-fuel power generation sector in Taiwan.
Year 2010 2014 2018
PollutantsSOxNOxTPMSOxNOxPMSOxNOxPM
Oil9427421726210,143.1 4222.5 301.1 6736.7 4814.4 330.6
LNG755815,47273389.3 16,374.4 1309.7 127.2 18,370.9 1281.8
Coal26,67846,977442730,593.8 38,598.9 3751.7 23,232.7 25,344.8 2884.0
Sum43,66366,656542240,826.3 59,195.8 5362.5 30,096.6 48,530.0 4496.4
SOx and NOx were determined using a CEMS, and PM was determined by a regular test of emission sources.
Table 3. Air pollutant emission factors (g/kWh) for the fossil-fuel power generation sector in Taiwan.
Emission Factor (g/kWh) 2014 2018
APCDSOxNOxPMSOxNOxPM
OilLNB + OFA + EP1.6356 ± 0.33670.6581 ± 0.20180.0543 ± 0.00551.1573 ± 0.09130.8049 ± 0.08910.0564
LNB0.0026 ± 0.00620.1961 ± 0.10240.0122 ± 0.00870.0017 ± 0.00480.1962 ± 0.08270.0116 ± 0.0065
SWI0.00071.0188 ± 0.09420.0456 ± 0---
LNGLNB+SWI0.00070.2081 ± 0.05050.0456 ± 00.0046 ± 00.2334 ± 0.03840.0379 ± 0
LNB+SCR0.00030.15210.01600.0027 ± 0.00170.1514 ± 0.04360.0095 ± 0.0039
CS-I0.3283 ± 0.01650.6859 ± 0.47050.0358 ± 0.00880.3322 ± 0.02680.2587 ± 0.01330.0358
CoalCS-II0.3660 ± 0.17510.4452 ± 0.12740.0440 ± 0.01010.2855 ± 0.09860.3145 ± 0.05700.0379 ± 0.0084
CS-III---0.0830 ± 0.00260.1065 ± 0.00960.0027 ± 0.0007
APCD: air pollution control device. LNB: low NOx burner. OFA: over-fired air. SWI: steam and water injection. SCR: selective catalytic reactor. CS-I: SCR + EP + WFGD; CS-II: LNB + OFA + SCR + EP + WFGD; CS-III: LNB + OFA + SCR + BF + SWFGD. EP: electric precipitator. WFGD: wet flue gas desulfurization. BF: bag filter.
Publisher’s Note: MDPI stays neutral with regard to jurisdictional claims in published maps and institutional affiliations.

