Article

Model-Based Energy Path Analysis of Tip-In Event in a 2WD Vehicle with Range-Extender Electric Powertrain Architecture

by
Raja Mazuir Raja Ahsan Shah
1,*,
Richard Peter Jones
2,
Caizhen Cheng
3,
Alessandro Picarelli
4,
Abd Rashid Abd Aziz
5 and
Mansour Al Qubeissi
1
1
Research Institute for Clean Growth and Future Mobility, Coventry University, Coventry CV1 5FB, UK
2
School of Engineering, Warwick University, Coventry CV4 7AL, UK
3
Great Wall Motors, Shanghai, 201800, China
4
Claytex Services Limited, Leamington Spa CV32 6EL, UK
5
Institute of Transport Infrastructure for Smart Mobility, Universiti Teknologi Petronas, Seri Iskandar 32610, Malaysia
*
Author to whom correspondence should be addressed.
Energies 2021, 14(18), 5696; https://doi.org/10.3390/en14185696
Submission received: 2 August 2021 / Revised: 3 September 2021 / Accepted: 7 September 2021 / Published: 10 September 2021

Abstract

:
Vehicle driveability is one of the important attributes in range-extender electric vehicles due to the electric motor torque characteristics at low-speed events. Physical vehicle prototypes are typically used to validate and rectify vehicle driveability attributes. However, this can be expensive and require several design iterations. In this paper, a model-based energy method to assess vehicle driveability is presented based on high-fidelity 49 degree-of-freedom powertrain and vehicle systems. Multibody dynamic components were built according to their true centre of gravity relative to the vehicle datum to provide an accurate system interaction. The work covered a frequency of less than 20 Hz. The results consist of the components’ frequency domination, which was structured and examined to identify the low-frequency resonances sensitivity based on different operating parameters such as road surface coefficients. An energy path method was also implemented on the dominant component by decoupling its compliances to study the effect on the vehicle driveability and low-frequency resonances. The outcomes of the research provided a good understanding of the interaction across the sub-systems levels. The powertrain rubber mounts were the dominant component that controlled the low-frequency resonances (<15.33 Hz) and can change the vehicle driveability quality.

1. Introduction

According to the International Energy Agency [1], the global volume of electric vehicles (EVs) in 2030 is forecasted to reach 245 million, an increase from 7.2 million in 2019. The market demand for the type of EV varies based on several factors, such as the vehicle’s range and price. One of the EV architectures that can increase the vehicle range is a range-extender electric vehicle (REEV). A report by Grand View Research [2] estimated the REEVs would have a market growth of 100% in 2026 compared to 2018. REEVs use an electric motor (EM) for the sole propulsion of the vehicle, and range-extenders (REx), such as an internal combustion (IC) engine or a microturbine generator to charge the battery energy storage (BES) or to provide the electrical energy to the EM through power electronics hardware [3].
One of the issues with REEVs is that it contributes to a higher vehicle mass (due to the REx and BES components), thus negatively affecting vehicle dynamics [4]. Milliken and Milliken [5] established four important criteria that influence the driver’s perception, such as ride, handling, performance, and driveability. The ride attribute refers to the vertical responses of the vehicle when driven on different road surface coefficients (mu) [6]. The handling attribute relates to the lateral responses due to the transverse wheel motion to the direction of the vehicle, such as lane change and cornering [7]. The refinement of handling quality and ride comfort is a continuous process through the vehicle development stage to determine the optimum vehicle set-up between these vehicle attributes. For instance, Liu et al. [8] established this process using the kinematics and compliance rigs, suspension dynamometer testing, and other testing equipment. On the other hand, the vehicle performance attribute describes the powertrain (PT) capability to meet specific loads at anticipated speeds. It uses the gear ratios strategies [9] and the shift quality [10] to achieve the vehicle system targets and has less dependency on the ride and handling attributes. In terms of vehicle driveability, which is the main focus of this work, Atabay et al. [11] indicated that the driveability attribute reflects the vehicle longitudinal responses to torque demand in the form of throttle pedal excitation under specific driving conditions.
According to Dorey and Holmes [12], vehicle driveability typically focuses on low-speed vehicle events such as acceleration/deceleration, which is one of the important factors for continuous product decision making and has demanding characteristics at the vehicle system level. Previously, the process of vehicle driveability assessment used a prototype vehicle. This process occurred at the later stage of the vehicle development; therefore, it was challenging to rectify any design issue. To meet the future REEVs market demands and challenges, advanced simulation tools have been used to study vehicle driveability in the early stage of the vehicle development process, as performed by Wang et al. [13]. The implementation of a model-based method in REEVs highlights the complex nonlinear system interaction under torque demand and identifies the factors associated with vehicle driveability concerns. For instance, Ciceo et al. [14] used the model-based method to design and validate the control strategy of the electric PT system to improve vehicle driveability. The model-based method in REEVs can also study the low-frequency resonances below 20 Hz that influence the vehicle driveability behaviour [15]. Previous studies showed that the arrangement of IC engine mounts could influence vehicle driveability and low-frequency resonances [16]. A previous study by Shah et al. [17] also highlighted the vehicle shuffle frequency resonances migration due to the throttle responses at low-speed events due to the torque amplification. The vehicle frequency resonances are expected to be similar in REEVs due to the high EM torque at the low-speed region [18]. Literature shows that the high EM torque excitation at vehicle low-speeds causes a complex interaction between the sub-system components, such as the driveline system [19,20] and the 6-degree-of-freedom (DoF) rubber mounts [21] that dominate the vehicle’s low shuffle frequency resonances. Similar to ride comfort, the irregularities of road friction coefficient (mu) can also influence the low-frequency resonances. The definition of road mu is based on contact of two surfaces that generates motion resistance, and it varies from almost 0 (polished ice) to above 1.0 (dry asphalt) [22]. For instance, Ivanoz et al. [23] investigated the torque compensation for the driveline system on a polished ice road to improve the vehicle driveability. Also, a split-mu road surface test, where a vehicle is driven on two different road mu on the left and right side of the wheels, has the same influence on the driveline response [24,25]. However, no studies have been performed to identify other dominant components on different road mu under high torque excitation, to the best of the authors’ knowledge.
Another method that can be employed to analyse the component behaviour is a transfer path analysis (TPA). The TPA method is used to study the mechanical vibration of a system and determine the dominant components that control the system response [26]. Most of the TPA studies on vehicle systems were focused on high-frequency vibration, as discussed in [27,28,29,30]. From the literature, only Jimbo et al. [31] have used the TPA method to analyse the behaviour of the vehicle driveability during acceleration based on an experimental method. The TPA method also allowed for a couple-decouple process of the compliances to identify the shuffle frequency domination and to determine the tuning parameters for the driveability refinement [32]. Zhang et al. [33] also used the couple-decouple method to identify the dominant mode for ride and handling characteristics of the 7-DoF vehicle systems based on suspension system elements. Nevertheless, the coupling-decoupling of compliance properties have not been emphasised to understand their influence on the vehicle system behaviour.
This paper presents the model-based method for vehicle driveability study of REEV model at low-speed events. It consists of a high-torque powertrain excitation simulation on different road mu and identifies the dominant component for the low-frequency resonances. Also, the model-based method is used to study the energy flow from a throttle pedal input to a vehicle body and define the transfer function that controls the longitudinal vehicle response. The coupling-decoupling of the dominant component and its properties will be performed to investigate their influence on vehicle driveability and low-frequency resonances using an energy path analysis (EPA) method derived from the TPA method and discussed in Section 2.3.

2. System Model and Methodology for Vehicle Driveability Study

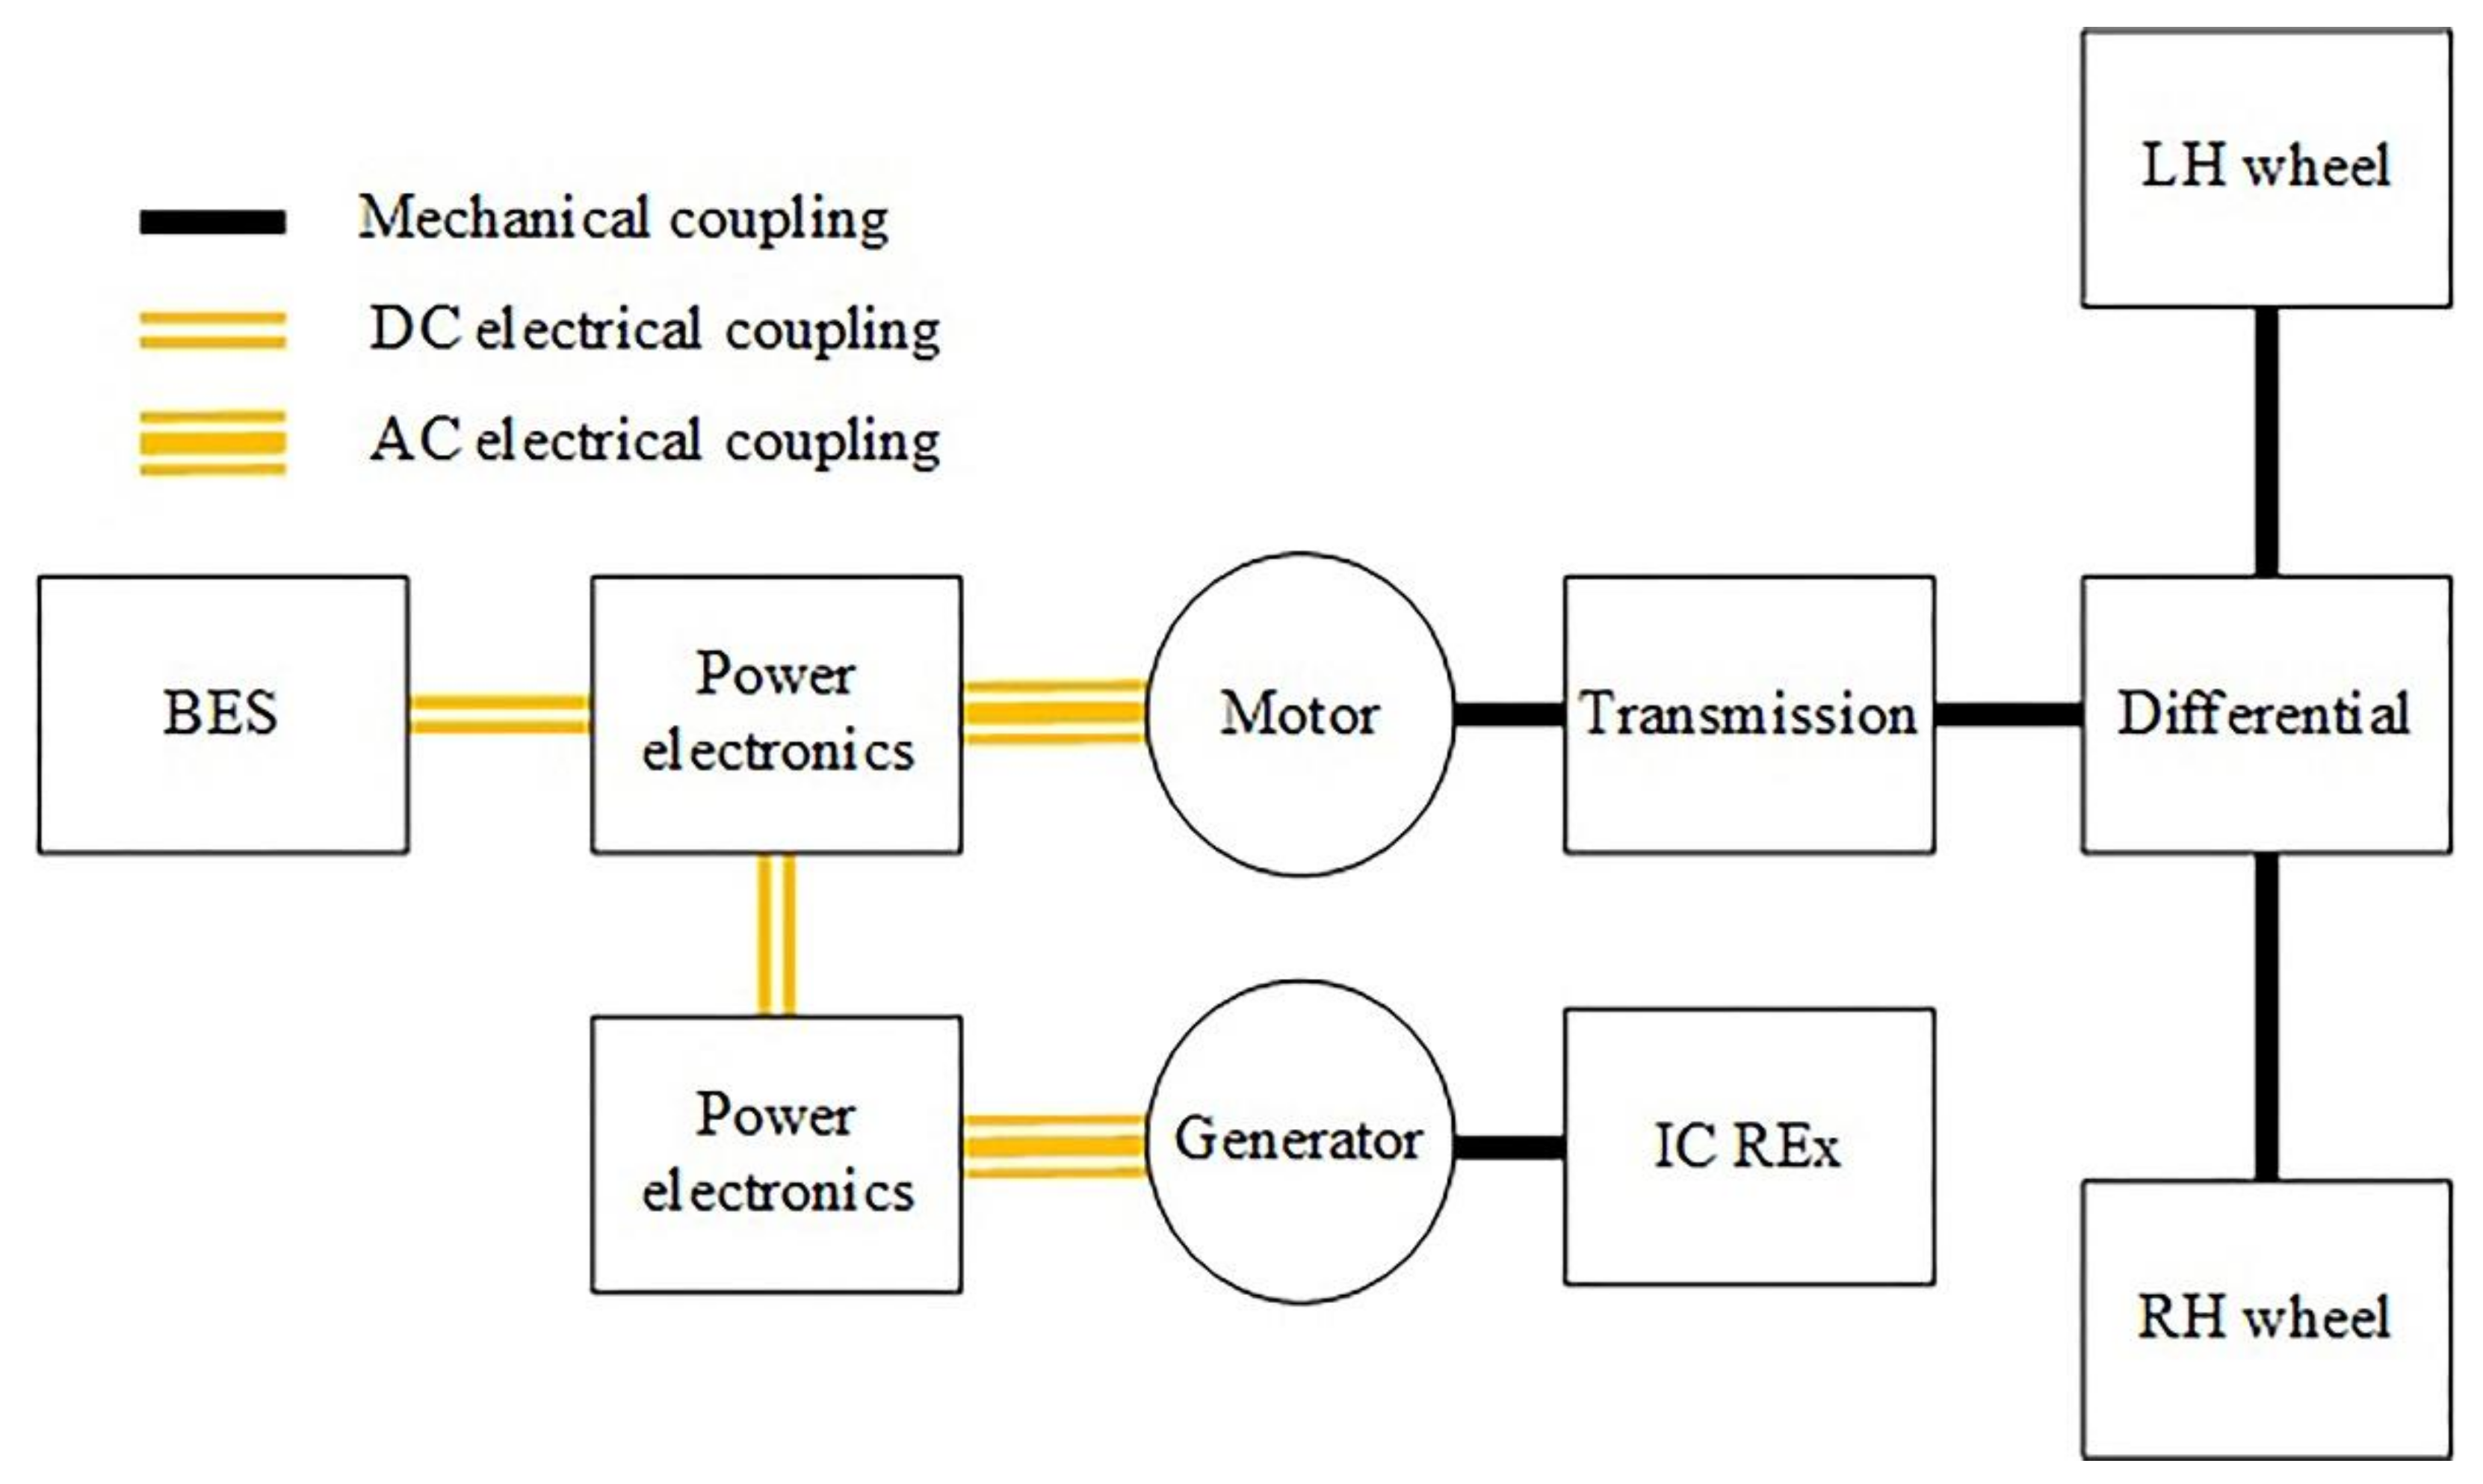
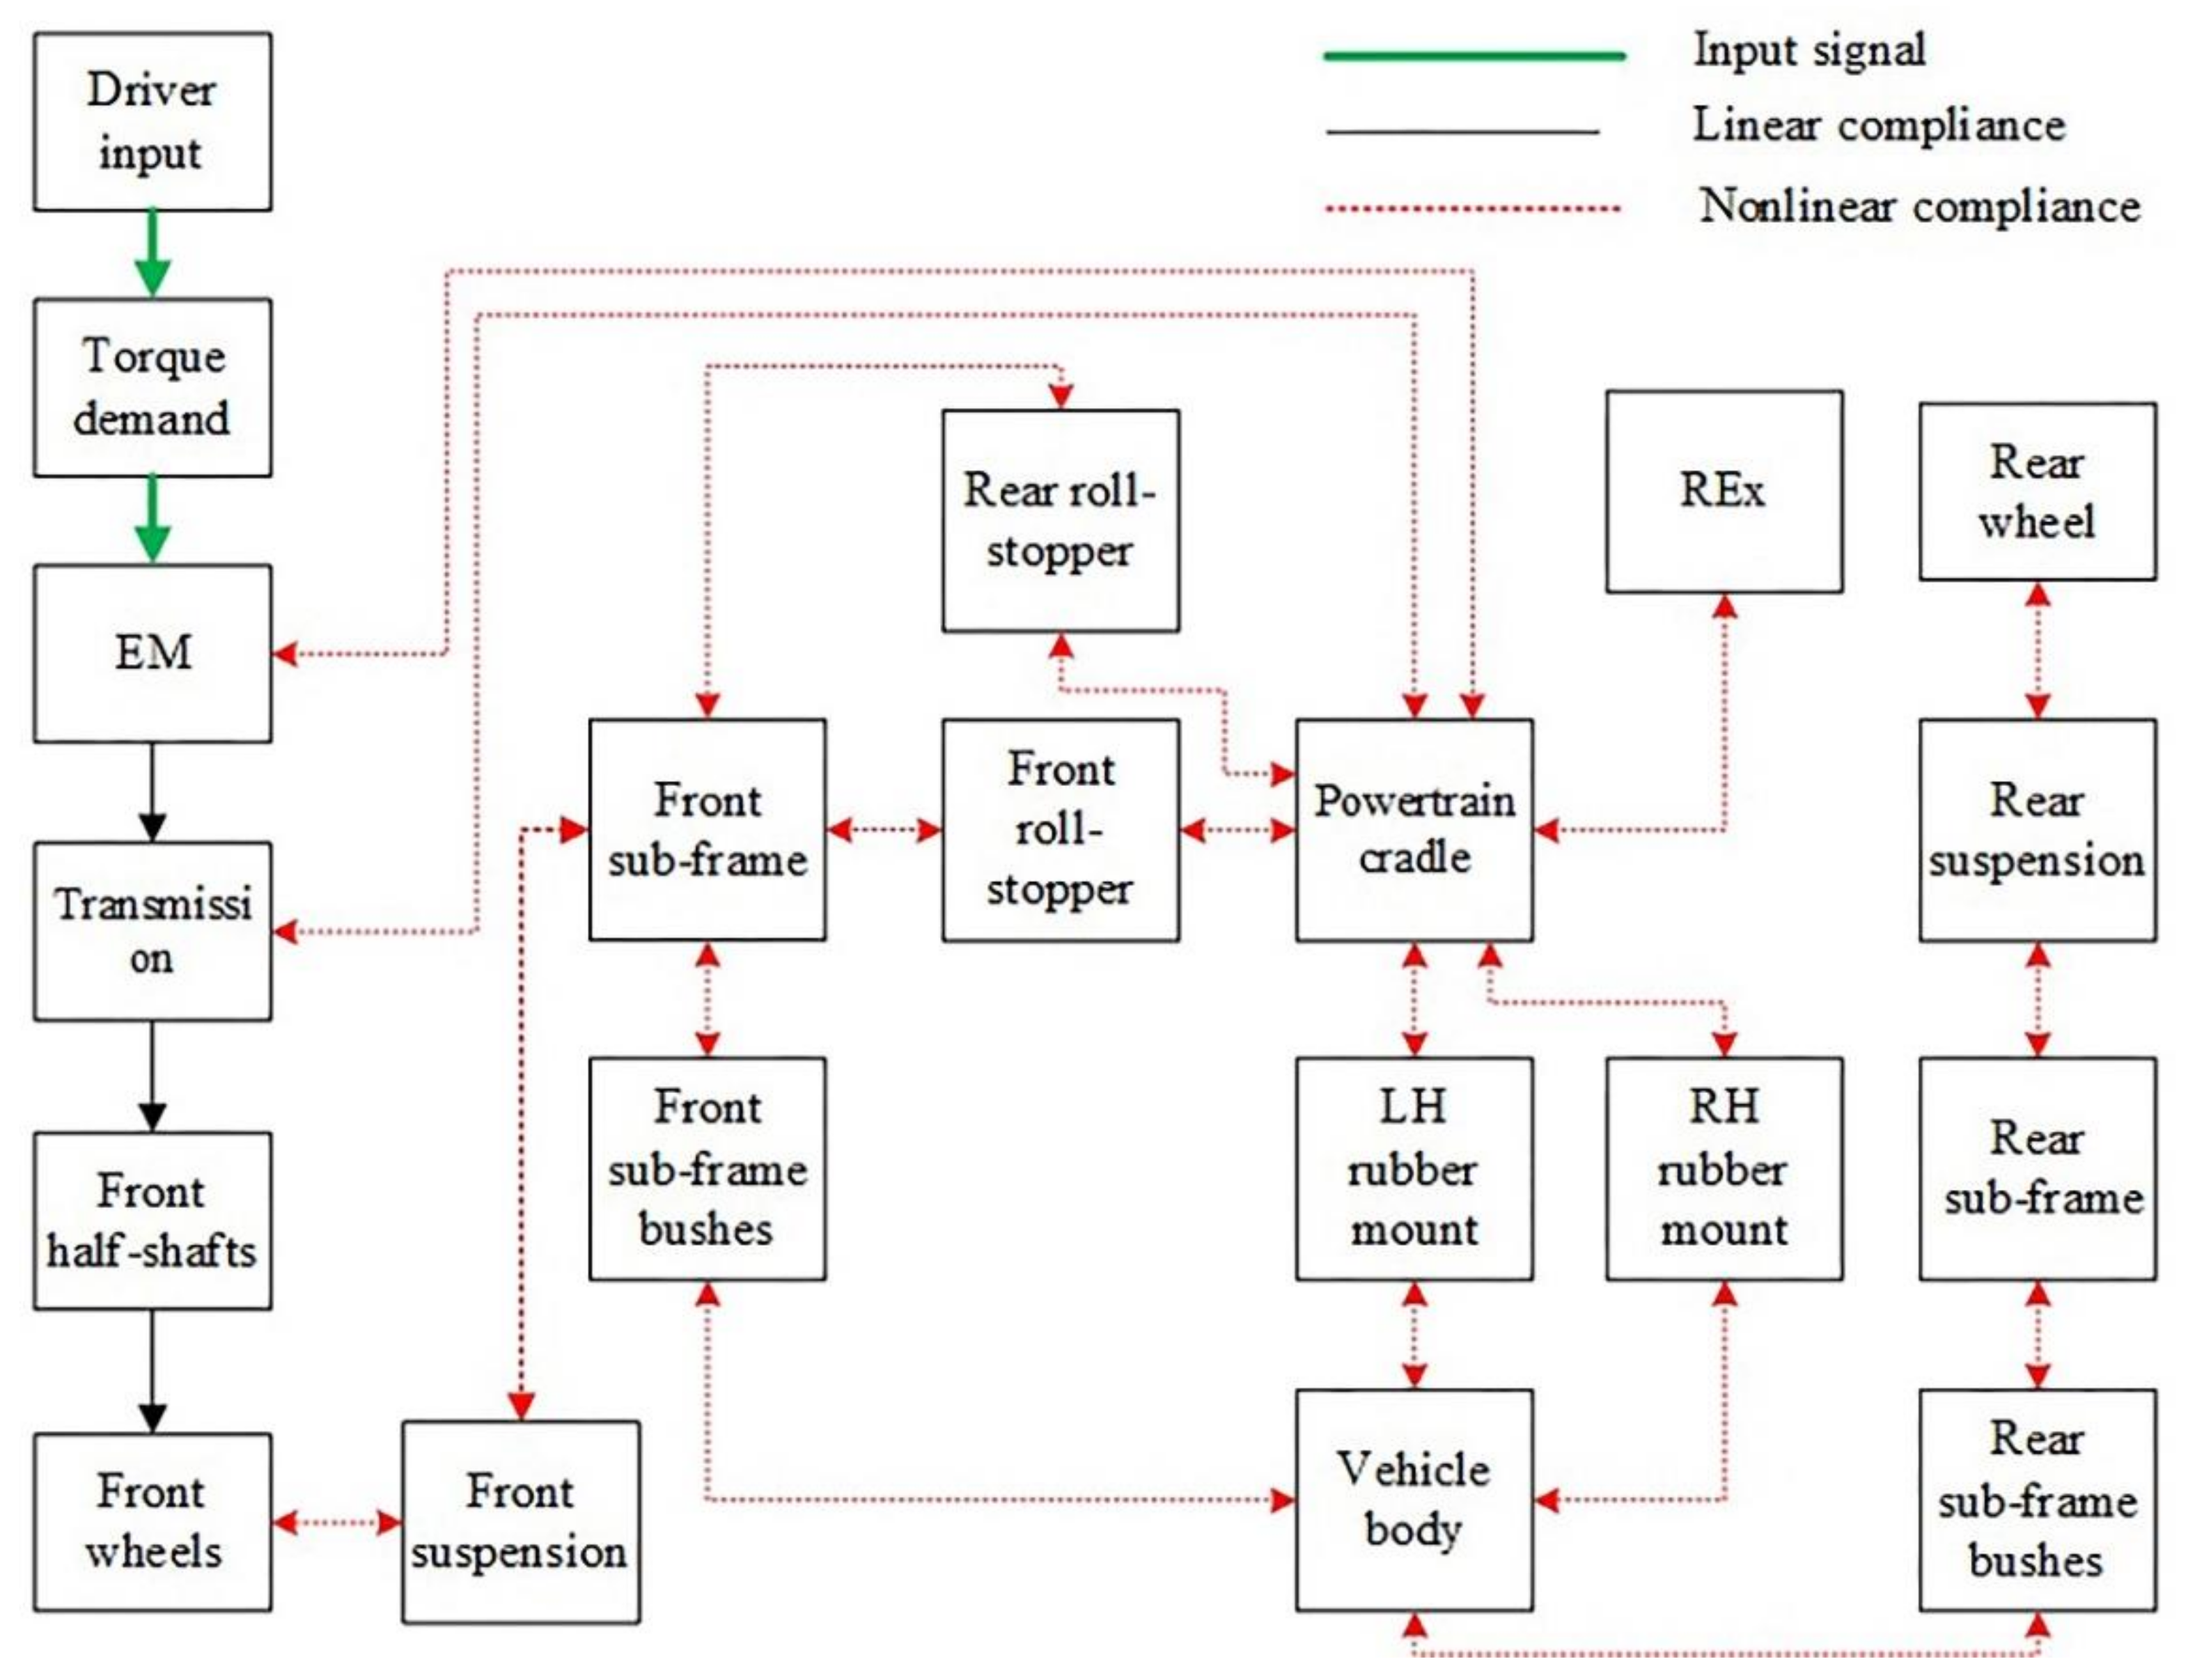
2.1. REEV Model Architecture

The study was based on a previous study performed by Shah et al. [34] using an IC engine propulsion four-wheel-drive (4WD) vehicle architecture. The 4WD vehicle model was correlated with a full nonlinear ADAMS (commercial multibody dynamics simulation tool) vehicle model and vehicle test data. In this study, the vehicle architecture was replaced with a two-wheel-drive (2WD) vehicle architecture by removing the rear drivetrain system and the IC engine propulsion system. The concept of REEV uses the EM as the sole propulsion of the vehicle and an IC engine as the REx to charge the BES or provide the electrical energy to the propulsion system through power electronics hardware, as shown in Figure 1. Other sub-system arrangements remained the same as 4WD vehicle architecture.
Figure 2 shows the block diagram of the high fidelity 49-DoF REEV model with linear and nonlinear compliances connected between the components. All PT (EM and REx) components were mounted on a structural PT cradle and to the vehicle structural components using a right-hand (RH) rubber mount, a left-hand (LH) rubber mount, a front roll-stopper, and a rear roll-stopper. The DoF of rubber mounts was reduced to three, namely longitudinal, yaw, and pitch directions that have significant effects on the low-frequency resonances [35]. Other linear and nonlinear compliances were fixed in the longitudinal direction that dominated the vehicle driveability response.
A REEV high-fidelity model was constructed based on Figure 2 using a multibody dynamic library in DYMOLA, a commercial multiphysics modelling tool. All rotational compliances from the EM to the front wheels were linear. Other vehicle compliances were nonlinear based on actual measurements to capture the actual interaction within the sub-system components. The RH rubber mount and the LH rubber mount consisted of longitudinal nonlinear stiffness properties, yaw, and pitch linear stiffness properties, as shown in Figure 3a. Both RH and LH rubber mounts were connected to the front subframe and vehicle body. The PT cradle pitch was controlled by the front and rear roll-stoppers and consisted of a nonlinear rubber bush, rod, and linear rubber bush, as shown in Figure 3b. The nonlinear rubber bush and the linear rubber bush were connected to the PT cradle and the front subframe, respectively. The nonlinear stiffness properties and the linear properties of PT rubber mounts and roll-stopper rubber bushes are shown in Table 1 and Figure 3c.
Figure 4a shows that the model front subframe and rear subframe have the same bush arrangement. The front subframe was connected to the vehicle body using four bushes; bush_1–2 at the top-end position and bush_3–4 at the low-end position. Also, the rear subframe was connected to the vehicle body using the same four bushes (bush_1–4). In Figure 4b, the front RH and LH suspensions were connected to the front wheels and the front subframe, and the rear RH and LH suspensions were connected to the rear wheels and the rear subframe. The subframe bushes and the properties of the suspension are shown in Table 2 and Figure 4c.
Pacejka tyre model was used to excite the REEV model in a longitudinal direction using two inputs, namely wheel slip ratio and normal load. The wheel slip ratio, sw, is defined by Equation (1) [36], where Va is the actual vehicle speed. The normal load, Fz, can be calculated based on the dynamic weight transfer acting on the wheel and given by Equation (2), where ax is the vehicle longitudinal acceleration, Fz′ is the initial normal load, h is the vehicle body centre of gravity (CoG) relative to the front wheel centre in the z-axis direction, and l is the wheelbase (distance between the front wheel centre and the rear wheel centre in the y-axis direction). The tyre model coefficient was parameterised from the experiment data from the tyre supplier. The vehicle parameters are listed in Table 3.
sw = (rew/Va) − 1,
Fz = Fz′ + ms ax (h/l),
To simulate the effect of multibody dynamics, all components were built to their actual CoG using Cartesian coordinates about the front RH wheel coordinate, as shown in Table A1.

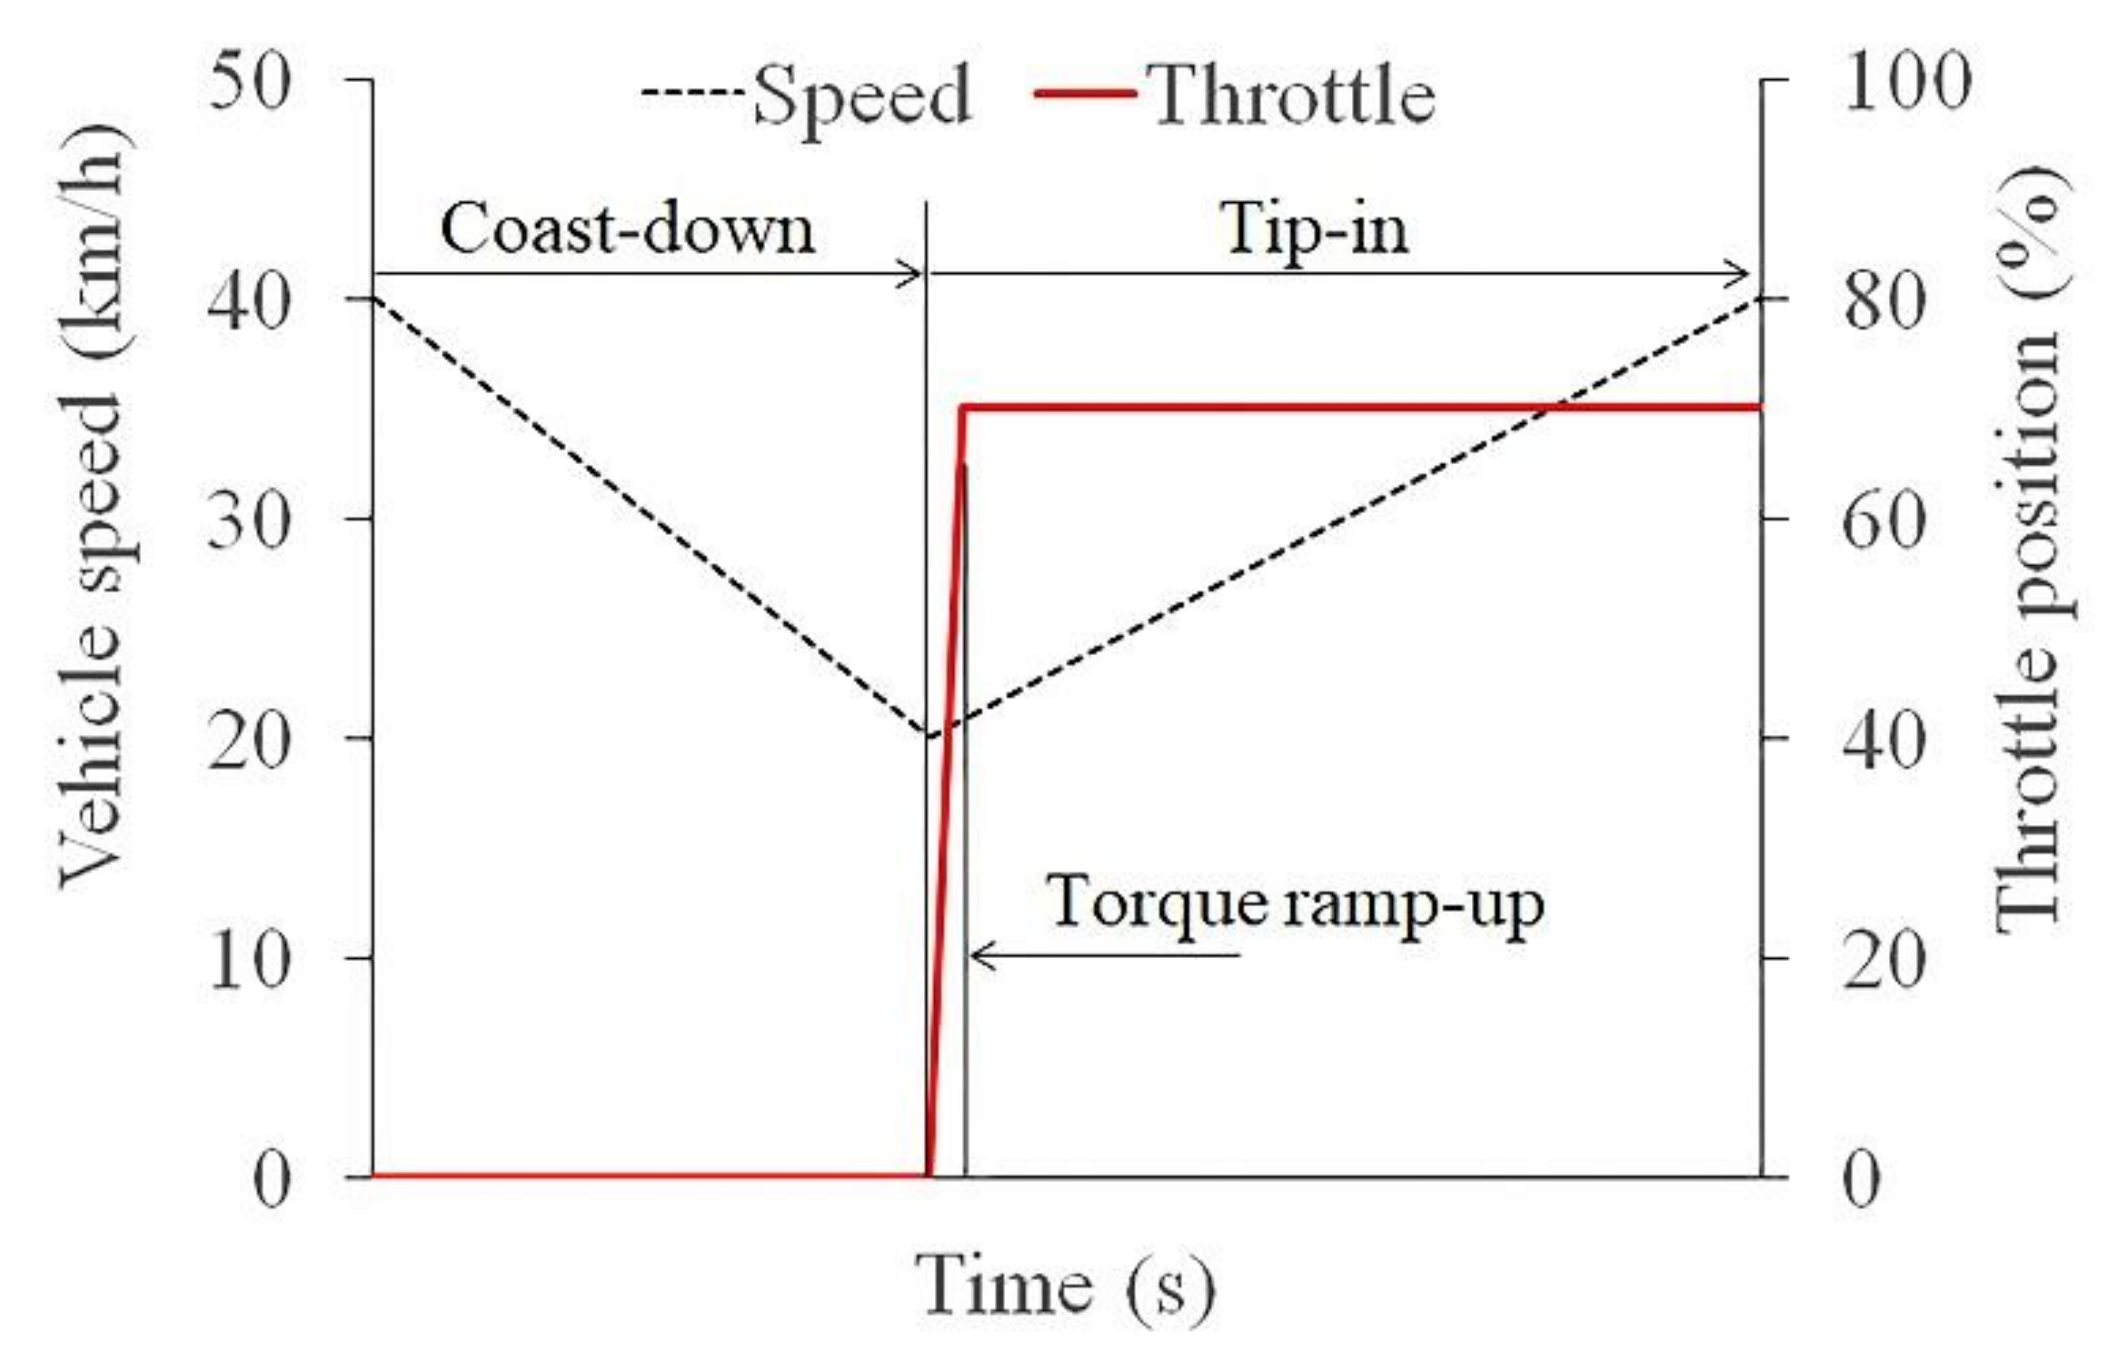
2.2. Throttle Pedal Excitation
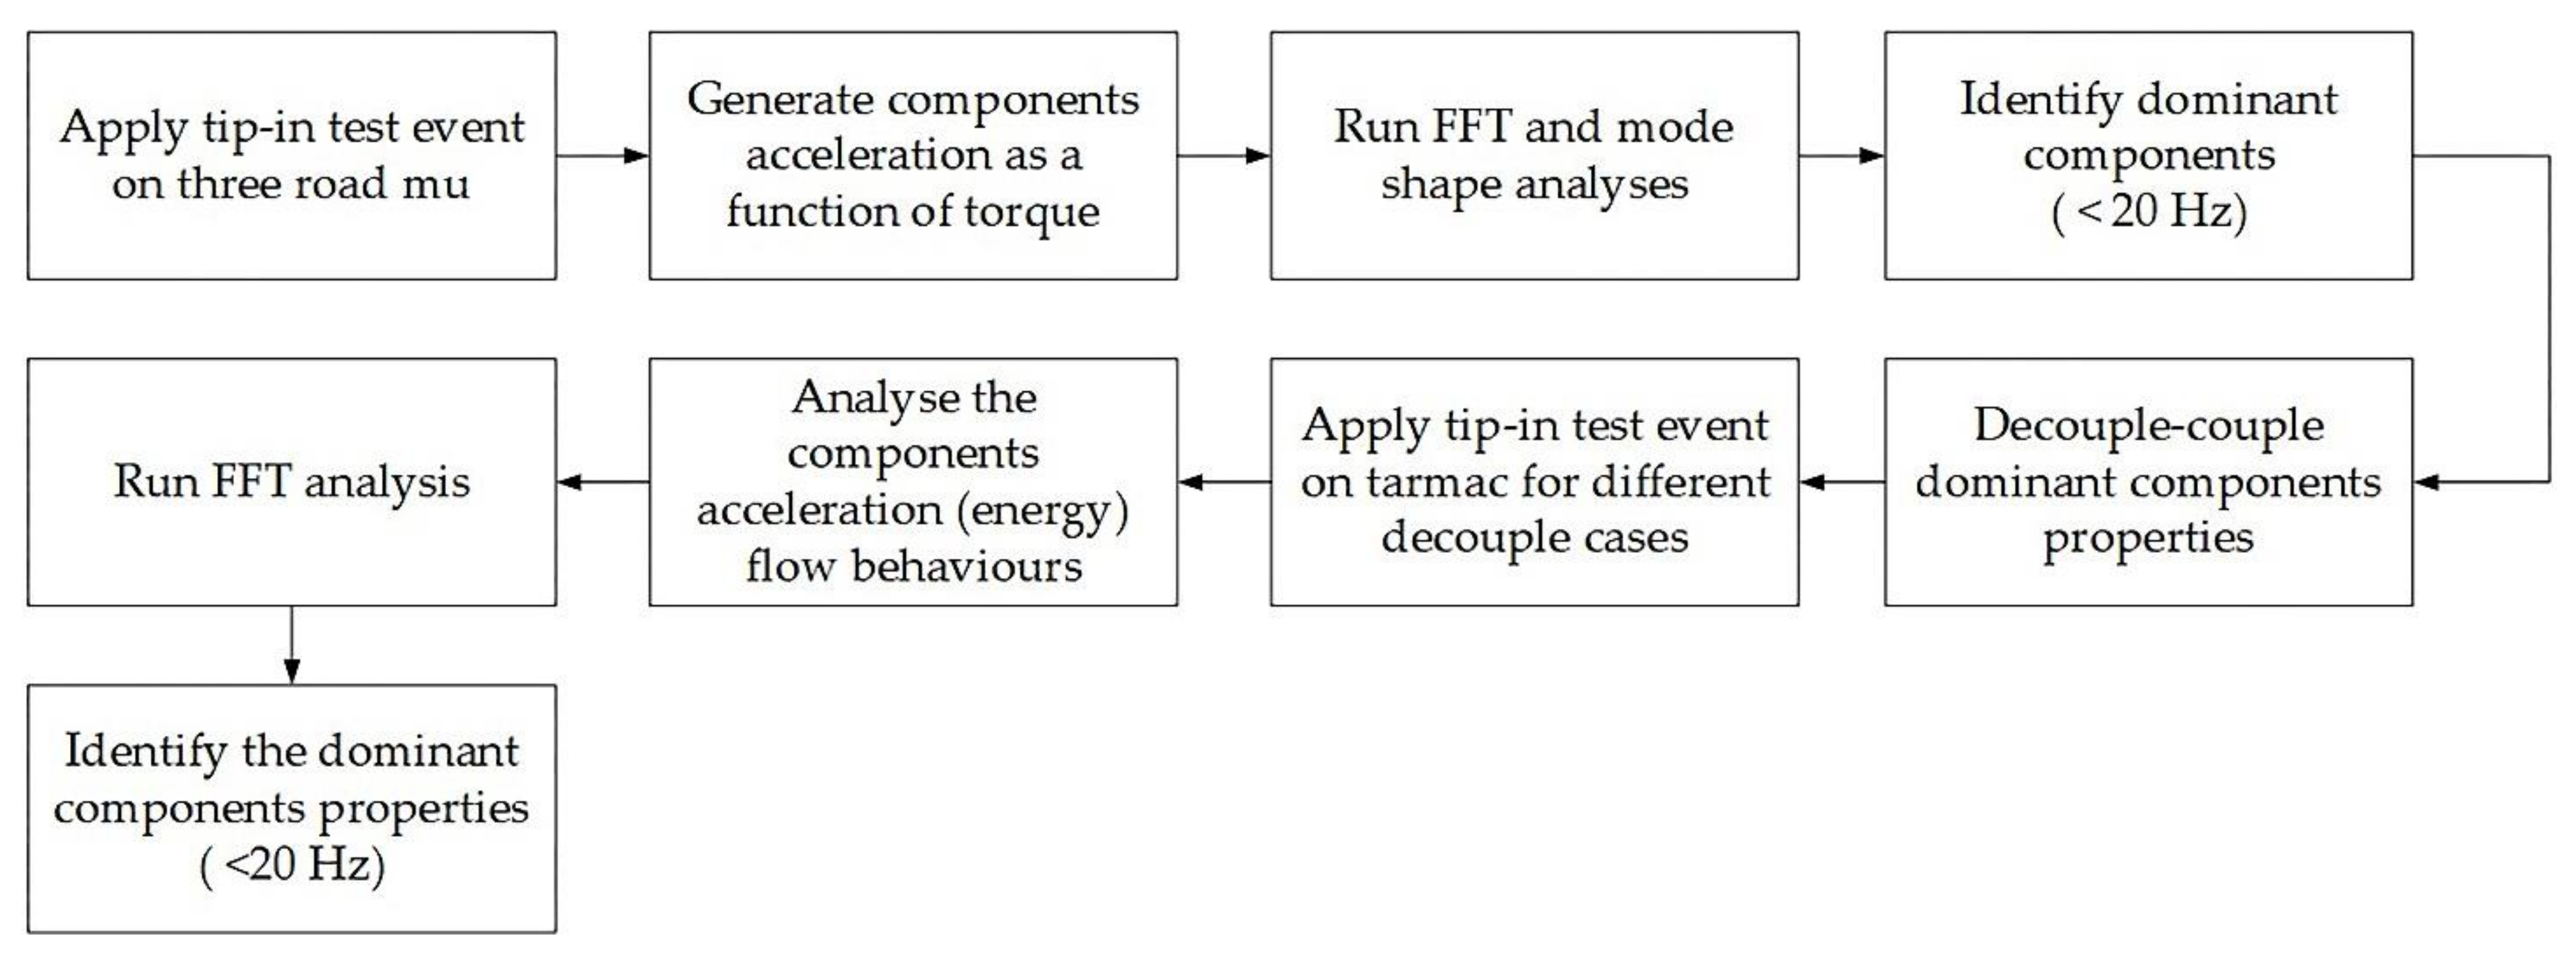
One of the effective methods to excite the vehicle for the driveability study is a tip-in event to obtain the maximum torque excitation from the EM to the half-shaft [37,38]. In this study, the initial vehicle speed was set at 40 km/h and coasted down to 20 km/h. Subsequently, 70% throttle position was applied within 0.12 s (second) rate and kept constant until the REEV model reached 40 km/h. Figure 5 shows the simulation procedures of the tip-in event for the REEV driveability study. Three types of road mu were used on the vehicle driveability analysis, namely tarmac, polished ice, and split–mu, as shown in Table 4. From the simulation, the investigation will be concentrated on the interaction between the PT cradle and structural vehicle components, namely the front subframe and rear subframe. The low-frequency resonances of each of the compliances will also be investigated.
The EM torque required to excite the model can be defined from Equation (3).
τ em = ( m t   ( a x + g   C rr ) + 0.5   ρ   C d   V a 2 )   r ew ,
where mt is the vehicle’s total mass as described in Equation (4).
mt = ms +mfw + mrw,
The vehicle frequency migration, fm, is calculated using Equation (5), where kv_e is the vehicle effective stiffness.
f m = k v _ e / m t ,
A mode shape analysis was also performed to study the vehicle driveability behaviour of three road mu. The dynamic equations for rotating and multibody dynamic components are given by Equations (6) and (7), respectively, to form a square matrix.
F w   ( t ) = m n   x ¨   + B n   x . + C n   x
τ em   ( t ) = J z   θ ¨ + D z   θ . + K z   θ  
where m, J, B, D, C and K are the component mass, shaft inertia, compliance damping, shaft damping, compliance spring stiffness and shaft stiffness, respectively. n and z are the number of mass and rotating components. The REEV model was linearised using the DYMOLA linearisation facilities to generate an A matrix to obtain an eigenvector, v and an eigenvalue, using Equation (8) to identify the dominant components for the low-frequency resonances on each of the road mu.
A   v   = λ   v ,

2.3. EPA Method

The EPA method was used to excite the vehicle system from the EM as the energy source to other sub-systems, as shown in Figure 6. The complex energy flow from the EM to the front subframe and then to the vehicle body was generated via the rubber mounts (RH and LH) and the roll-stoppers (front and rear). The reaction of the front wheel on the contact patch with the front subframe and its nonlinear compliances was combined with the EM energy flow. Both torque flows were transferred again to the vehicle body and subsequently to the rear subframe and the rear wheel. All component torque flows were represented by components’ acceleration. The frequency analysis using fast Fourier Transform (FFT) was performed throughout the system to determine the dominant components that produce low-frequency resonances (<20 Hz). These EPA results were used as a reference model. The next process was to decouple the dominant components’ properties and run the same EPA method. The results were compared with the reference model to understand their influence on the energy flow behaviour that leads to the low-frequency resonances.

3. Results

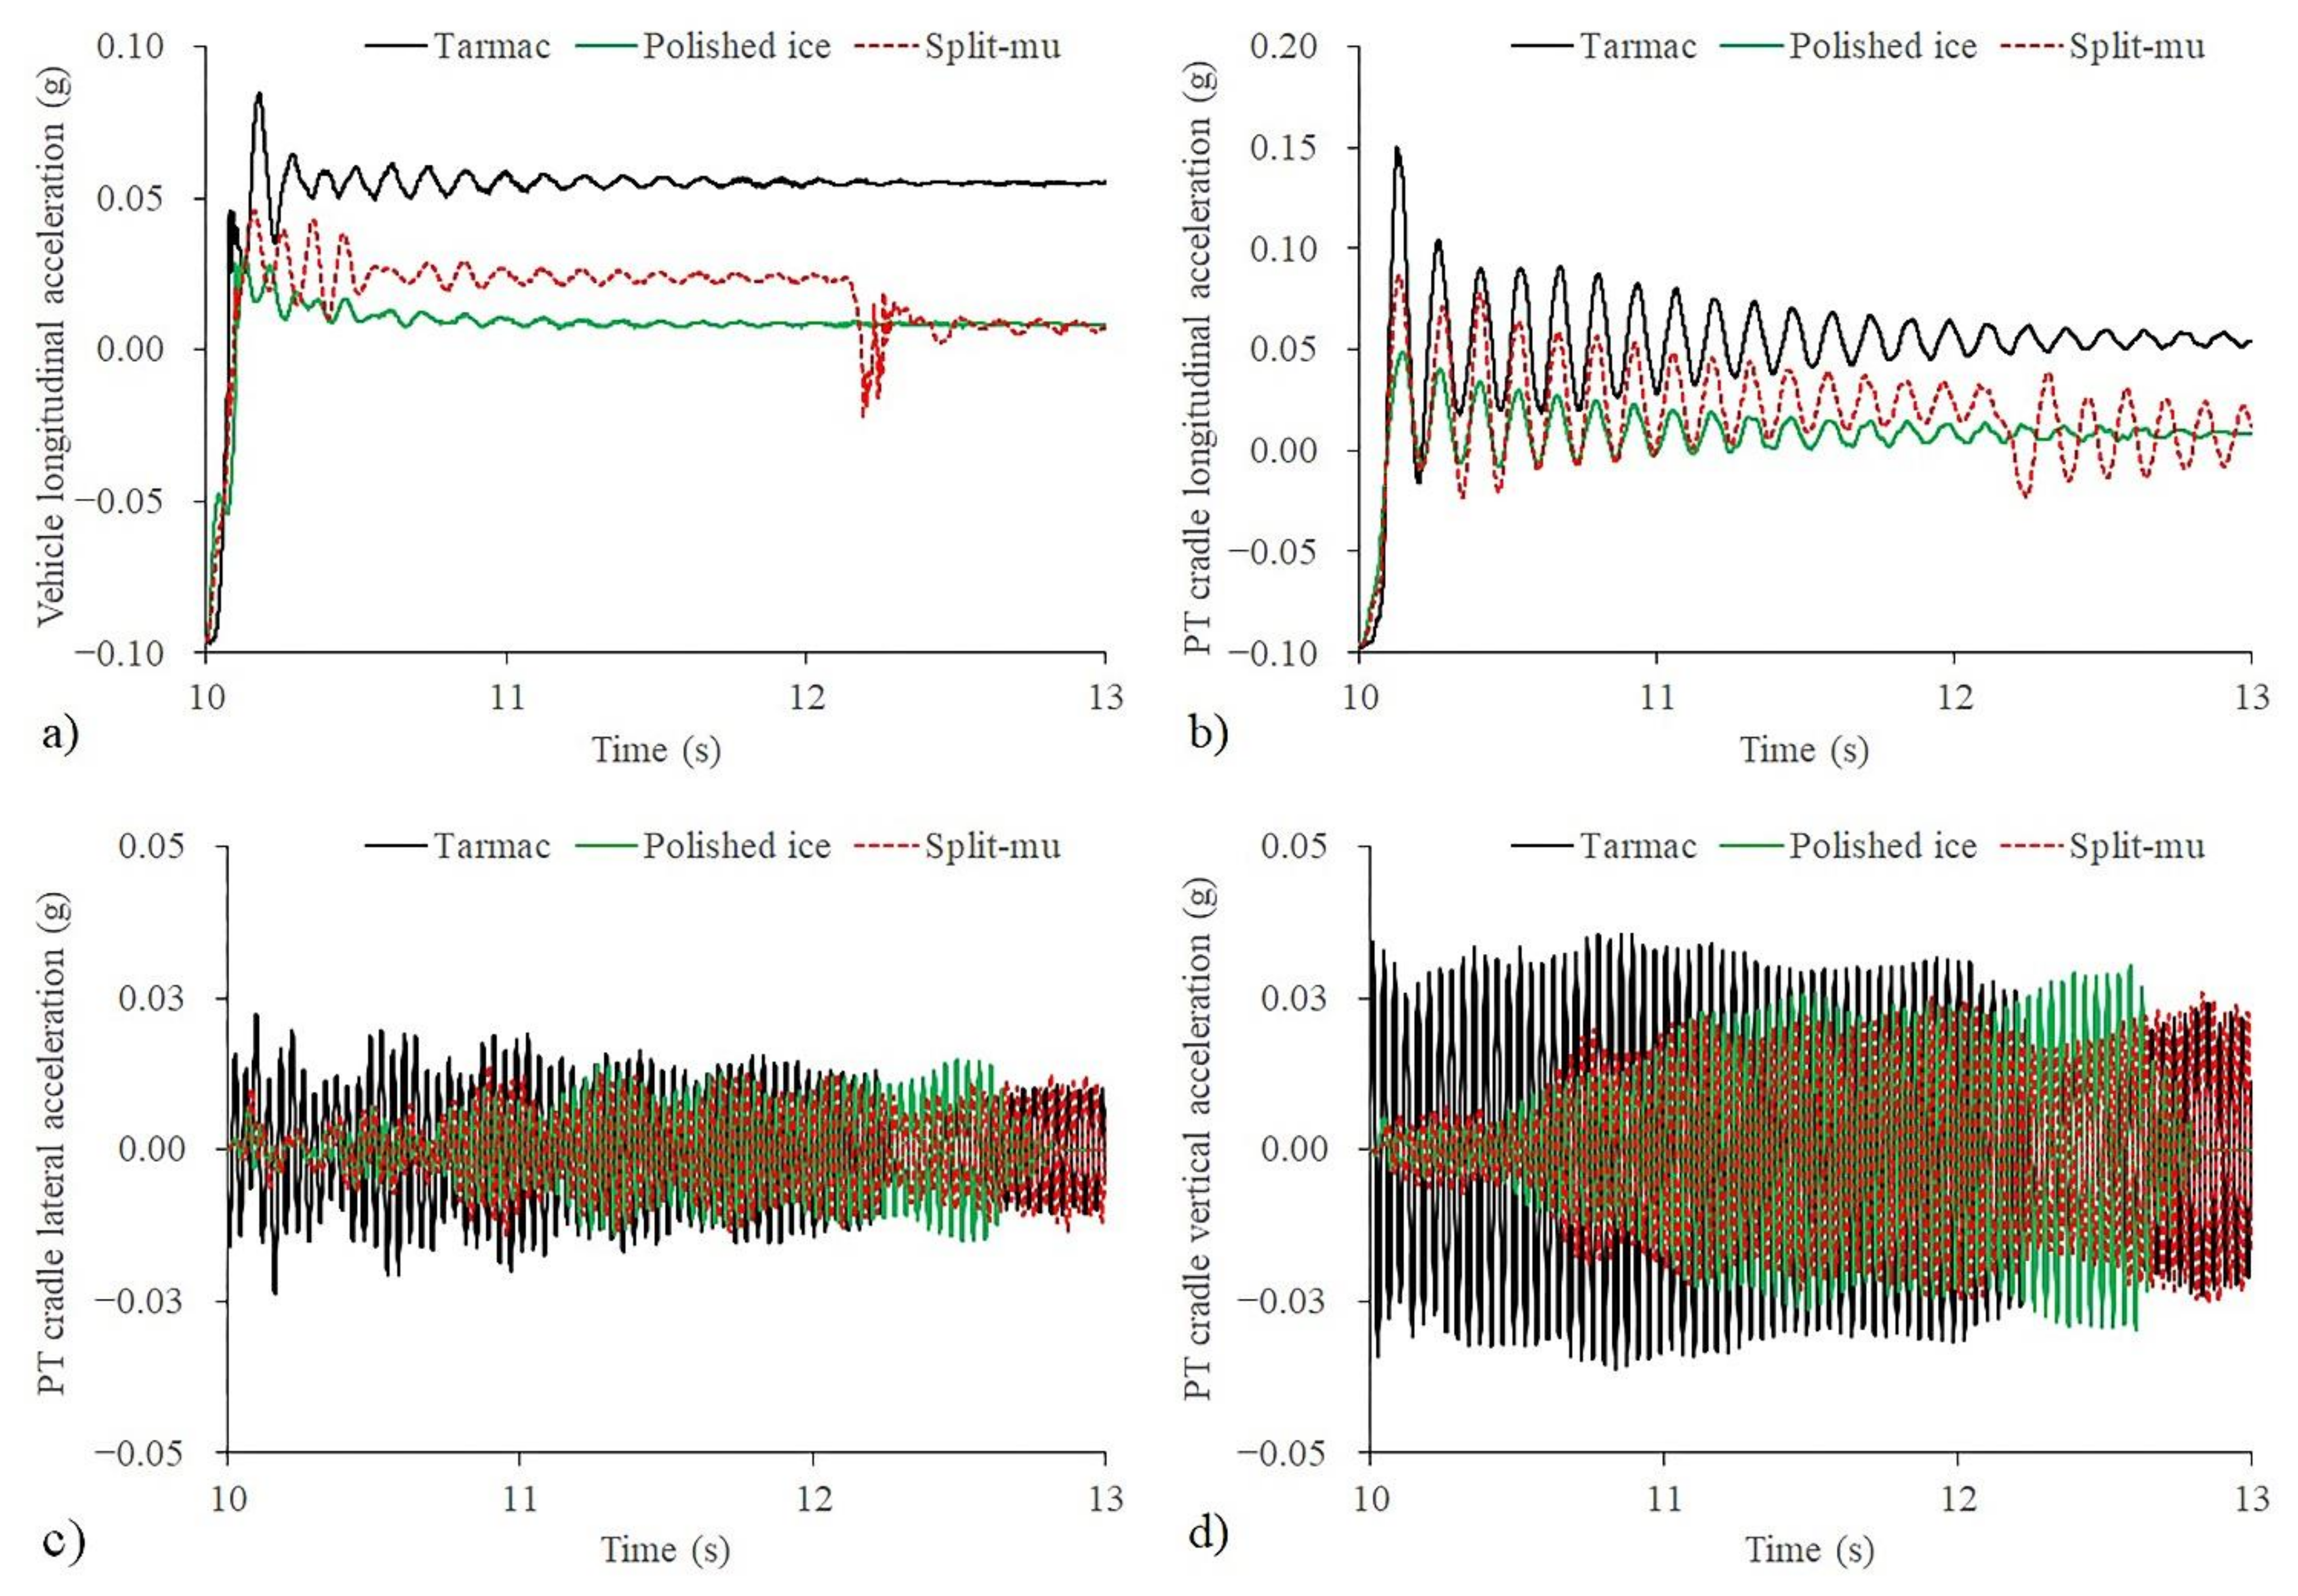
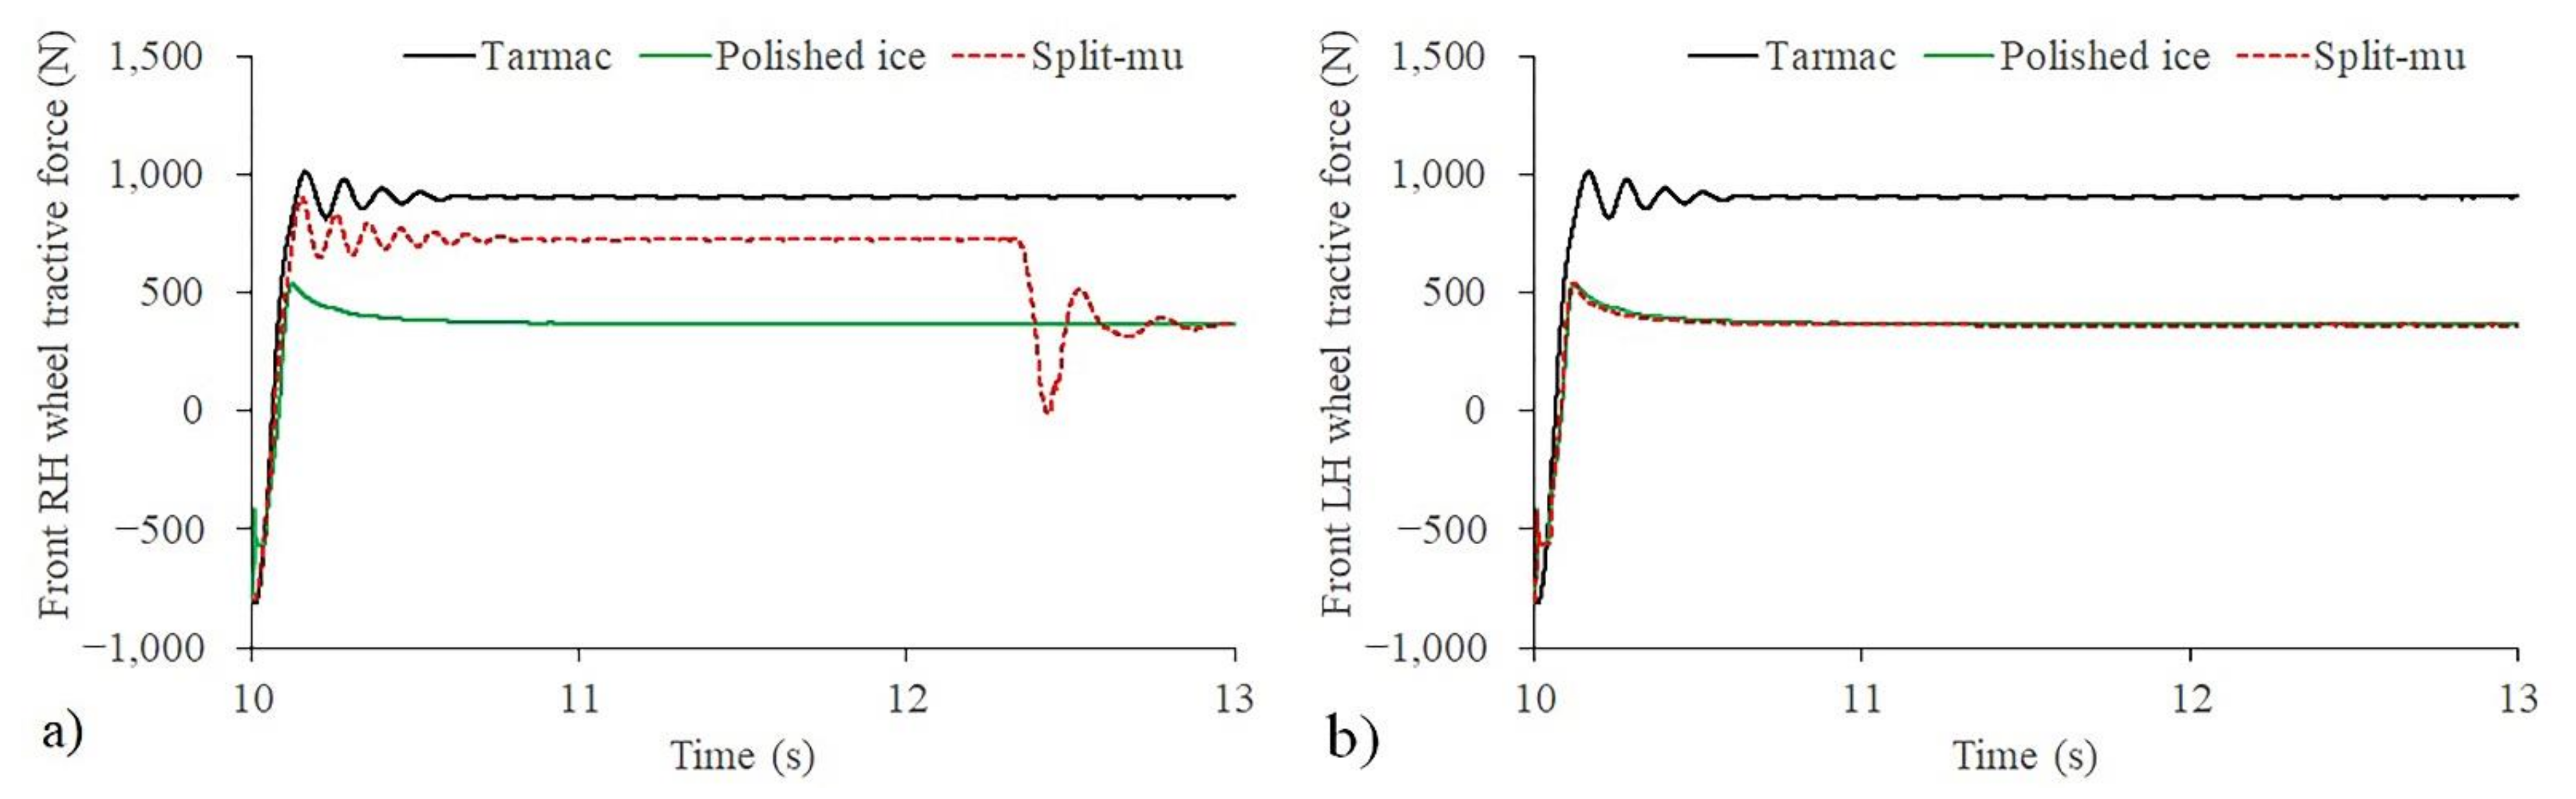
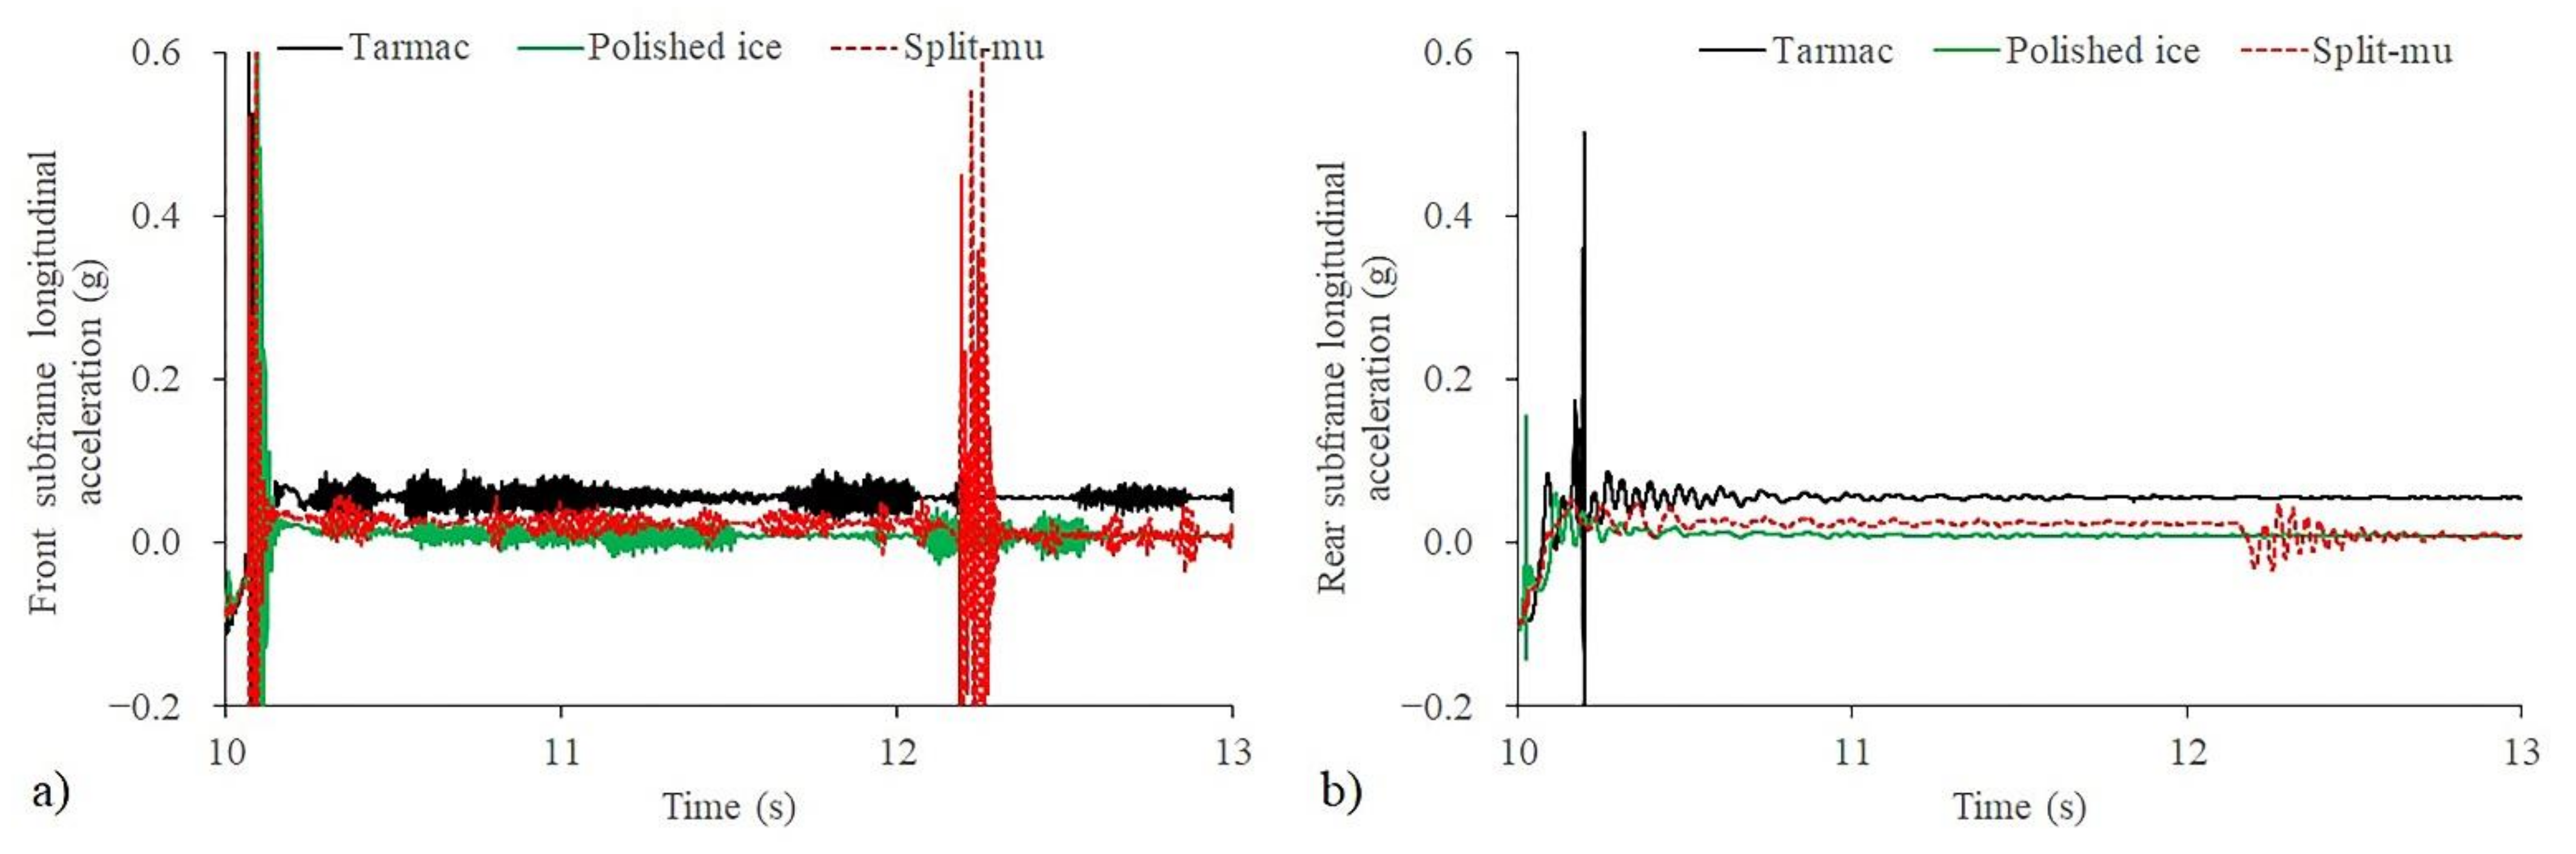
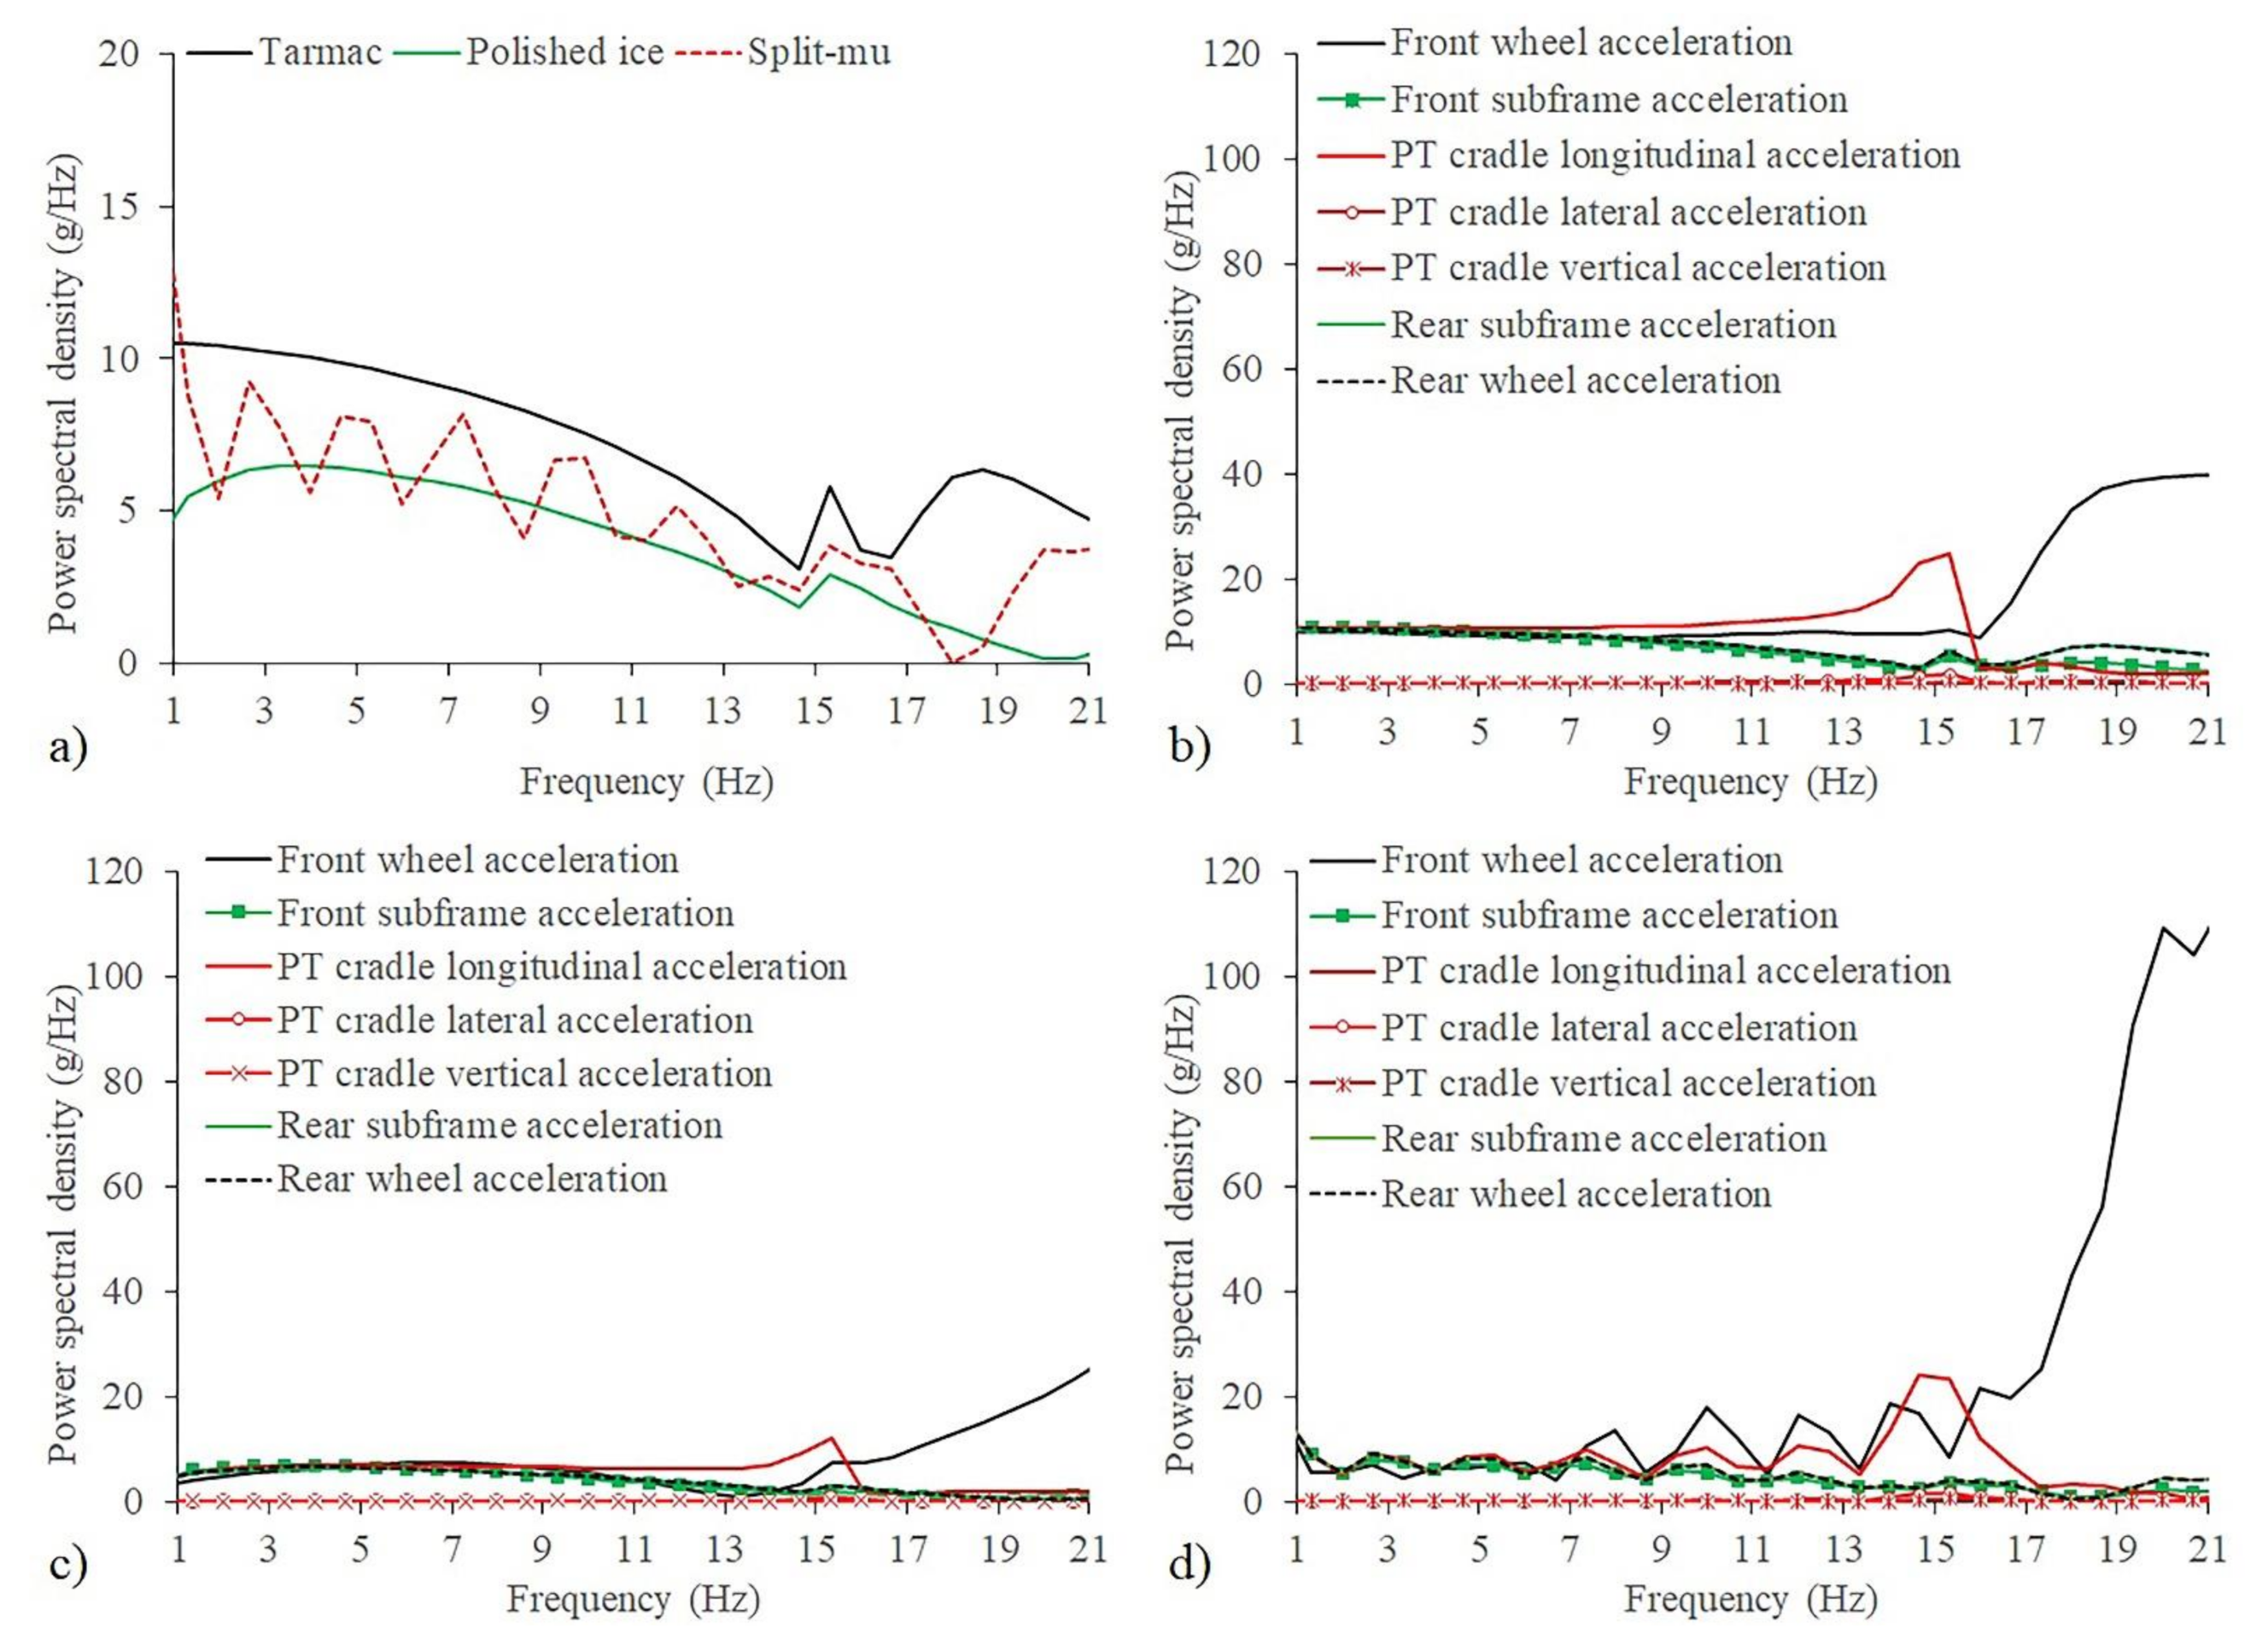
3.1. REEV Model on Three Road Mu

In Figure 7a, the vehicle body longitudinal on the tarmac is higher as the half-shaft can wind up at a faster rate and helped the front wheels to gain better traction compared to polished ice and split-mu. It can be observed that during torque ramp-up, an acceleration dip occurred on all roads mu particularly on the tarmac. The PT cradle acceleration responses in longitudinal, lateral, and vertical directions are shown in Figure 7b–d. Similar to the vehicle body longitudinal acceleration, the PT cradle longitudinal acceleration was higher on the tarmac compared to the polished ice and the split-mu. All component accelerations were measured in gravitational acceleration (1 g = 9.81 m/s2).
Each of the PT cradle longitudinal acceleration responses generated a low-frequency resonance of 15.3 Hz with an additional frequency on the split-mu surface. This is due to the weight surge event as a result of the front RH and the LH wheels operated at a different wheel slip ratio when the EM reached its maximum rotor speed (see Figure 8). In terms of the PT cradle lateral acceleration, the values were relatively small compared to the longitudinal acceleration and more responsive on the tarmac. These responses showed that the lateral excitation was adequately controlled by the rubber mount yaw properties. The vertical acceleration was more responsive on all road mu compared to the lateral acceleration due to the fast EM torque excitation. The front and rear roll-stoppers minimised the magnitude of the vertical acceleration to the adequate level that might affect the vehicle ride attribute [39].
The front subframe and the rear subframe longitudinal acceleration responses are shown in Figure 9. On the polished ice, the front wheel and the rear wheel tractive forces were slightly damped by the front subframe bushes. As the EM torque increased, the front subframe bushes properties could not cope with the high force transfer rate; subsequently became rigid and generated a higher amplitude and oscillation. It was suggested that this response caused the acceleration dip during torque ramp-up on the vehicle body and also existed on the tarmac and split-mu. A judder was apparent, particularly on the tarmac due to the mechanical coupling where the high-frequency vibration was transmitted to the front subframe through the rear roll-stopper bushes. It can also be observed in Figure 9b that the rear subframe nonlinear bushes characterised the vehicle body longitudinal acceleration response. On the tarmac, the rear subframe produced high excitation during torque ramp-up but reduced significantly on the low friction surfaces as the effect of the bushes nonlinearity.
The fast Fourier transform (FFT) method determined the power spectral density of the vehicle body response and the dominant components, as shown in Figure 10. It can be observed that the vehicle body’s low-frequency resonances on all road mu were dominantly controlled by the PT cradle and the front wheel longitudinal accelerations. For instance, on the tarmac, the vehicle body longitudinal acceleration produced low-frequency resonances of 15.33 Hz and 18.66 Hz, which were similar to the PT cradle longitudinal and the front wheel longitudinal accelerations low-frequency resonances, respectively. In terms of the vehicle body longitudinal acceleration on the polished ice, these low-frequency resonances were only controlled by the PT cradle longitudinal acceleration. As the result of a complex interaction between the front RH wheel and the LH wheel on the split-mu, the vehicle body longitudinal acceleration response produced eight low-frequency resonances; 2.66 Hz, 4.66 Hz, 7.33 Hz, 10 Hz, 12 Hz, 14 Hz, and 20 Hz that was controlled by the front wheel longitudinal acceleration, and 15.33 Hz that was controlled by the PT cradle longitudinal acceleration.
Using the mode shape analysis method, the eigenvalue, the eigenvectors, and the magnitude were obtained for the linearised REEV model with no EM torque input on different road mu, as shown in Figure 11. The linearisation of the REEV model produced similar results to the steady-state and transient-state conditions, where the PT cradle longitudinal properties and the front wheel altered the mode shape array and amplitudes on different road mu for every eigenvalue.

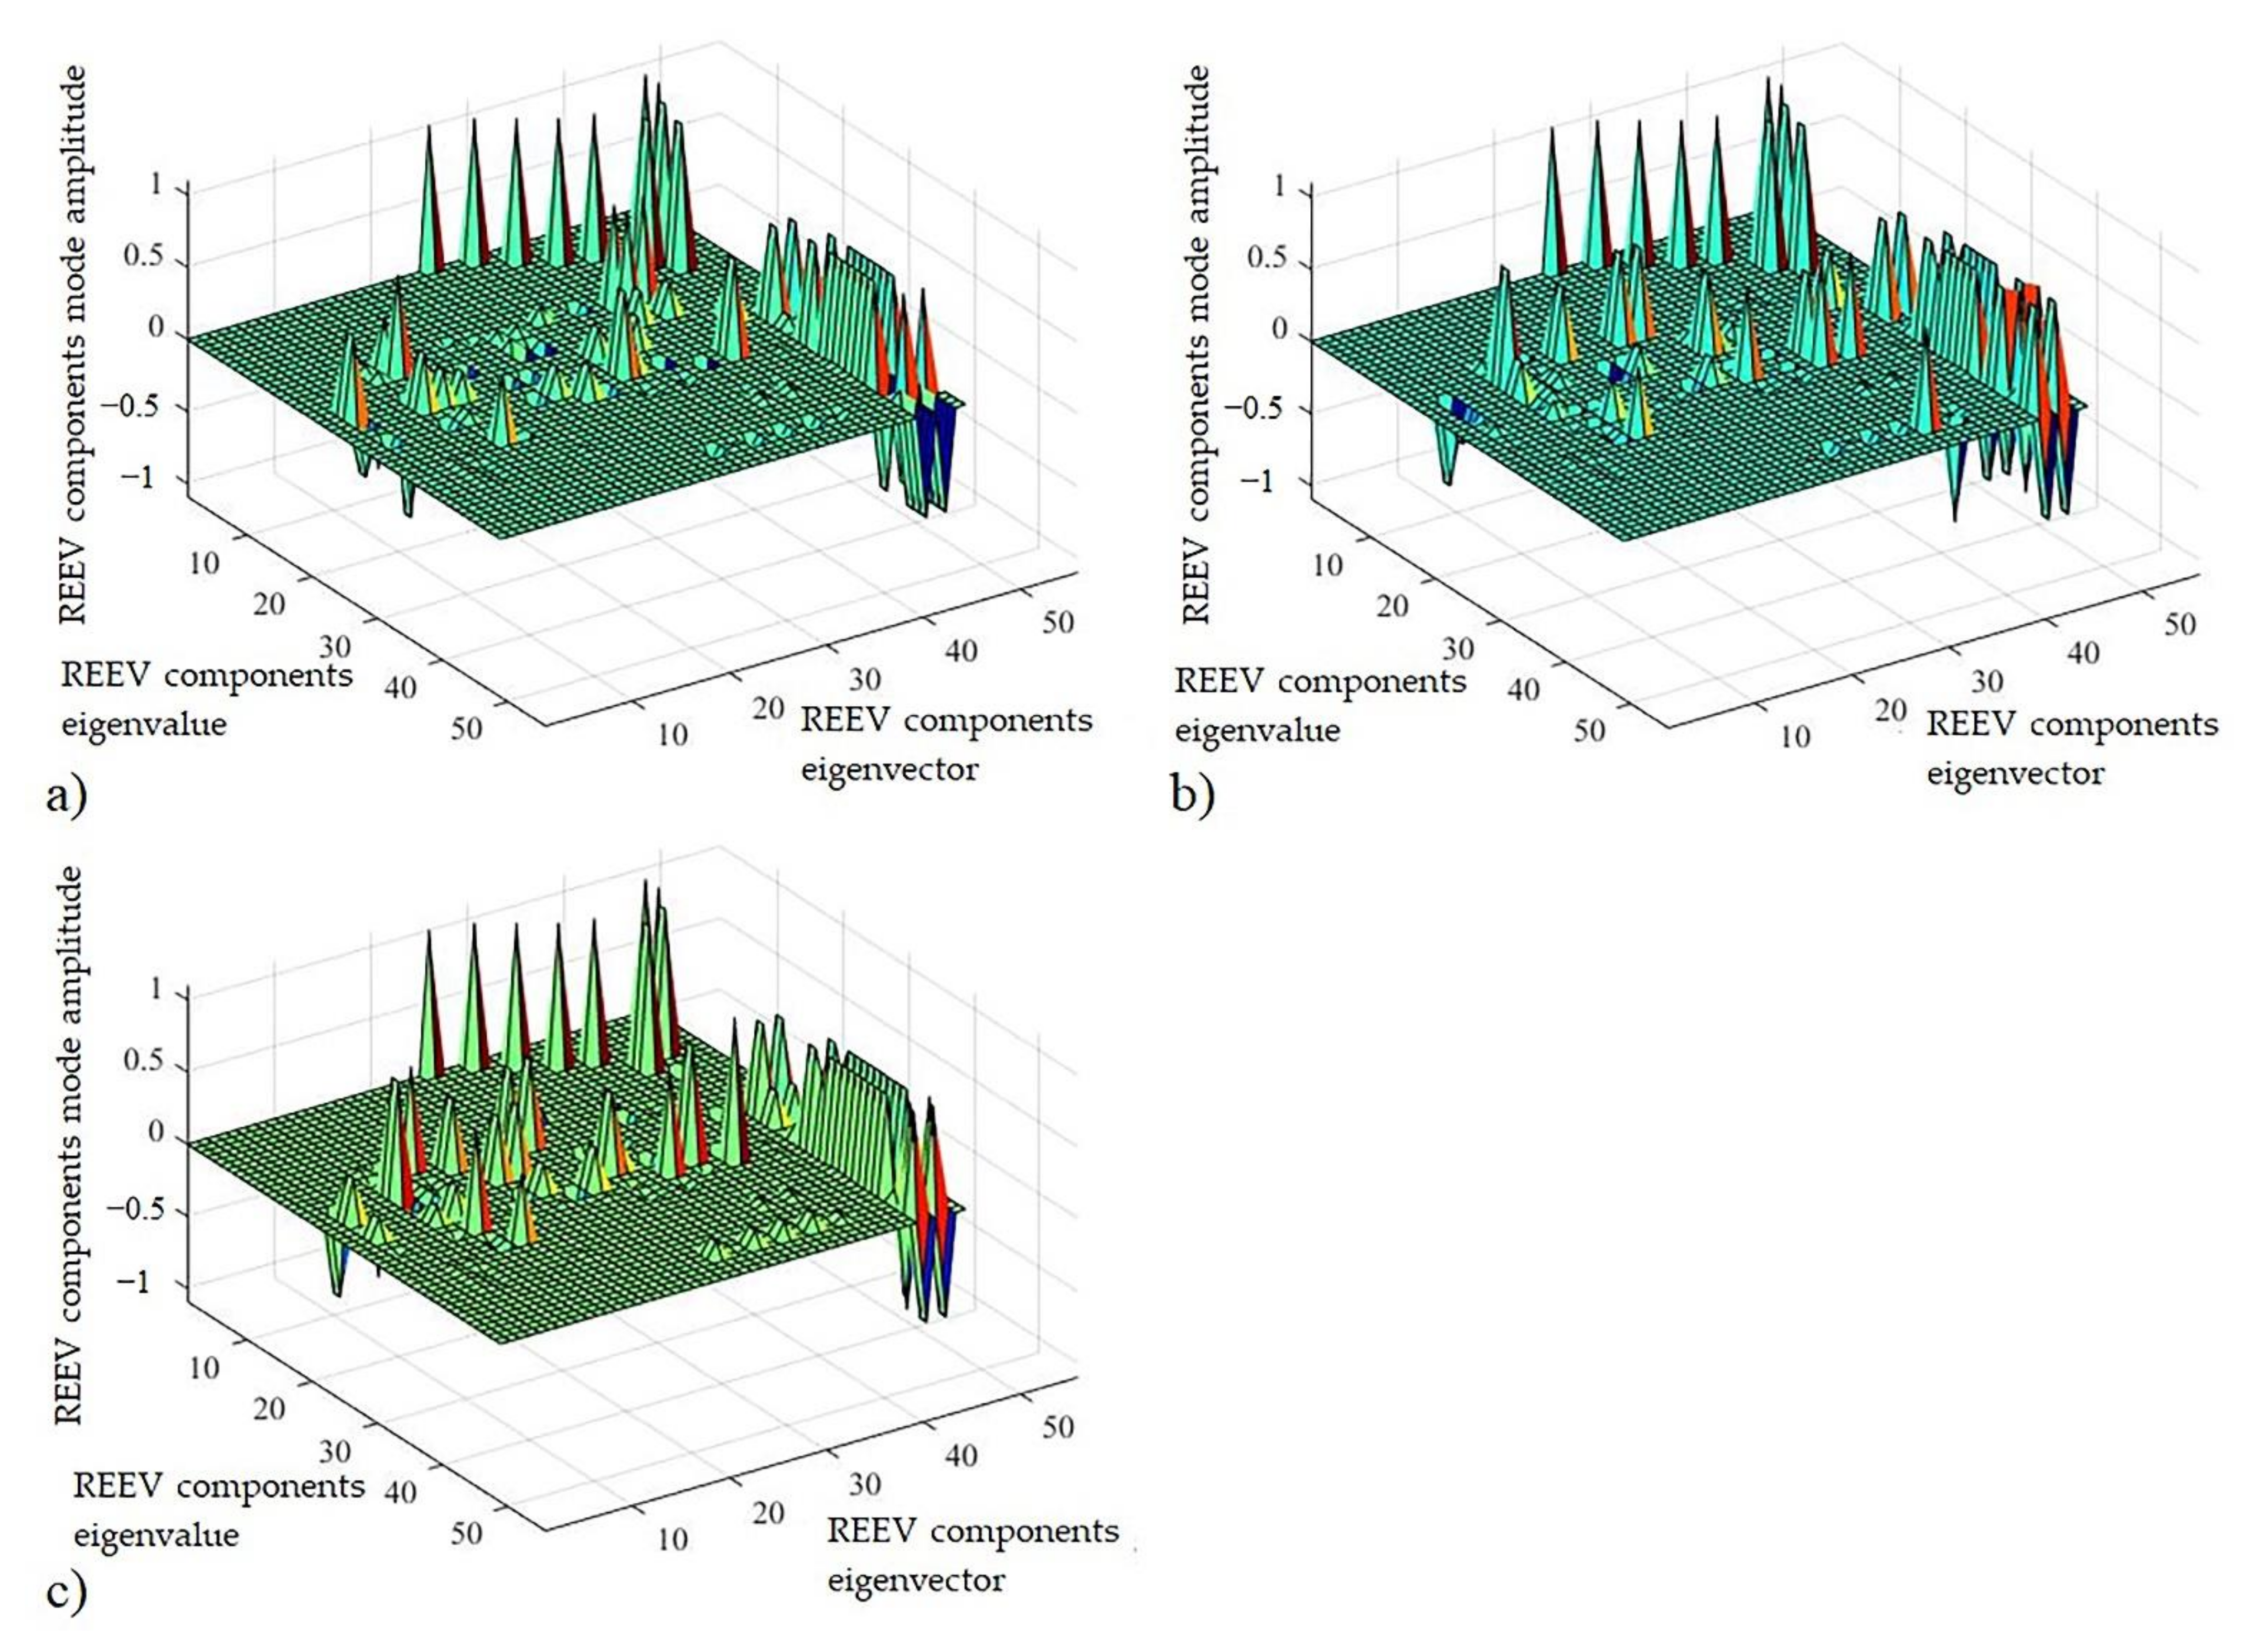
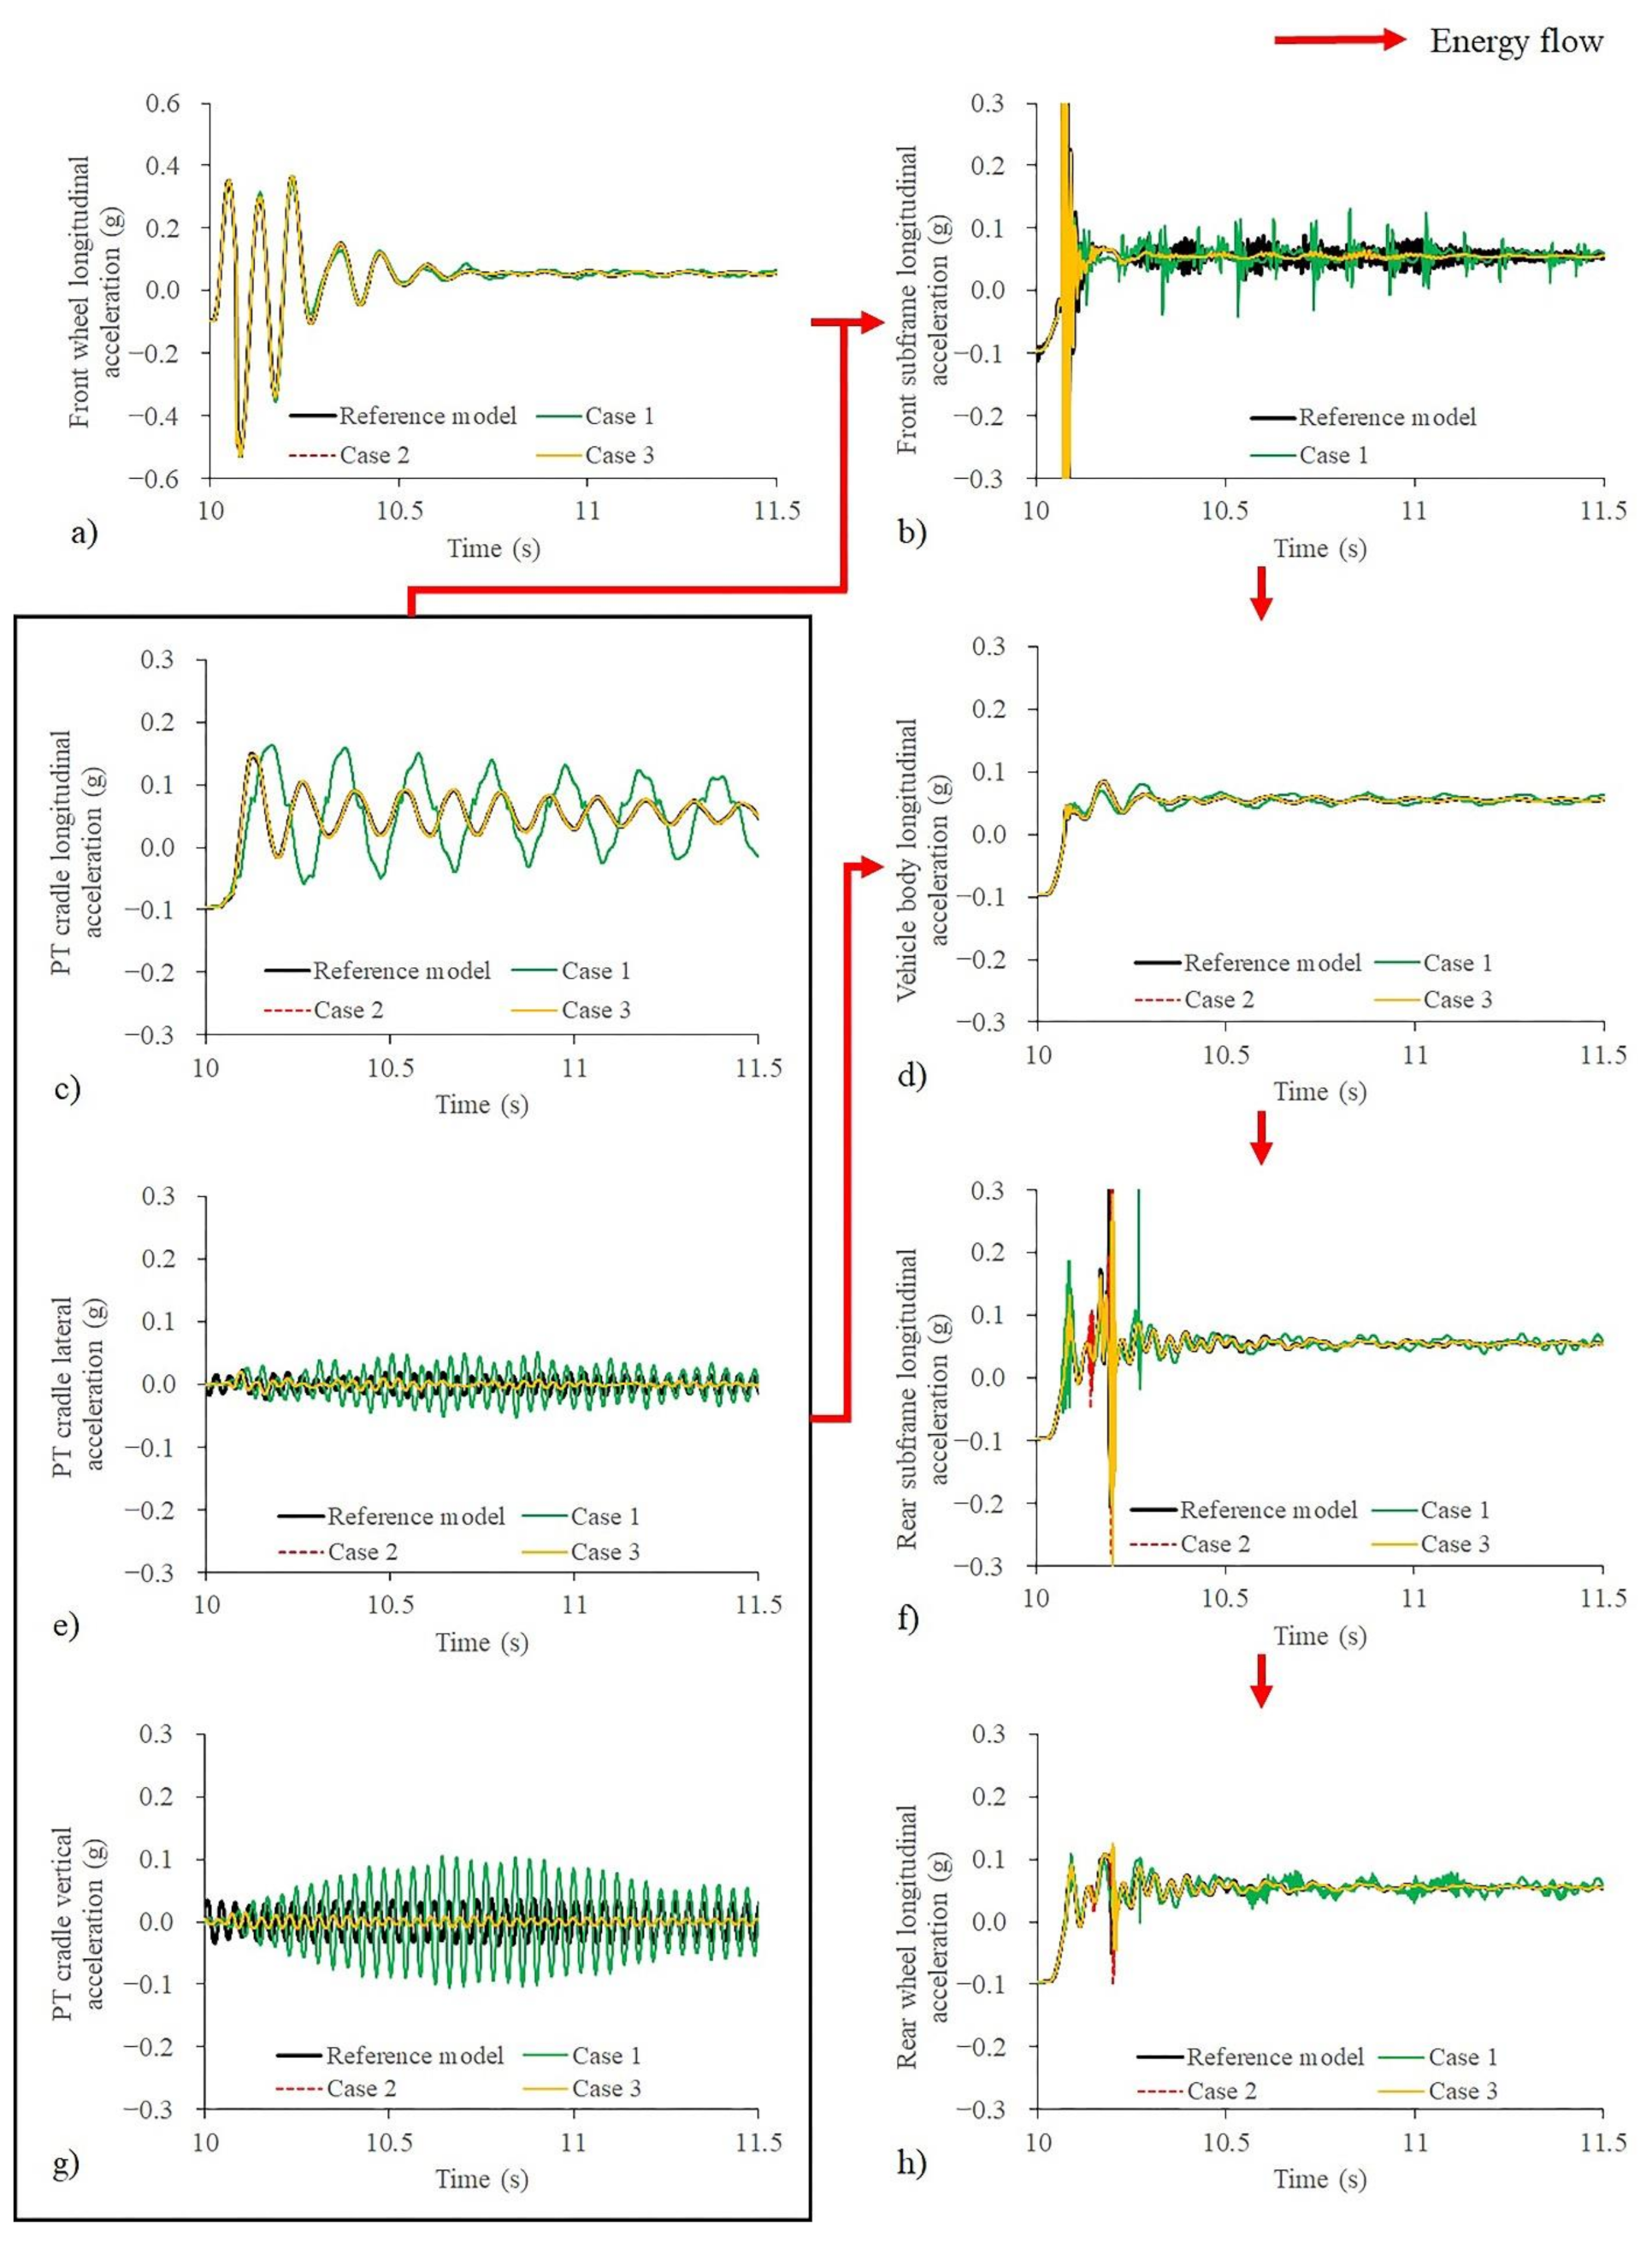
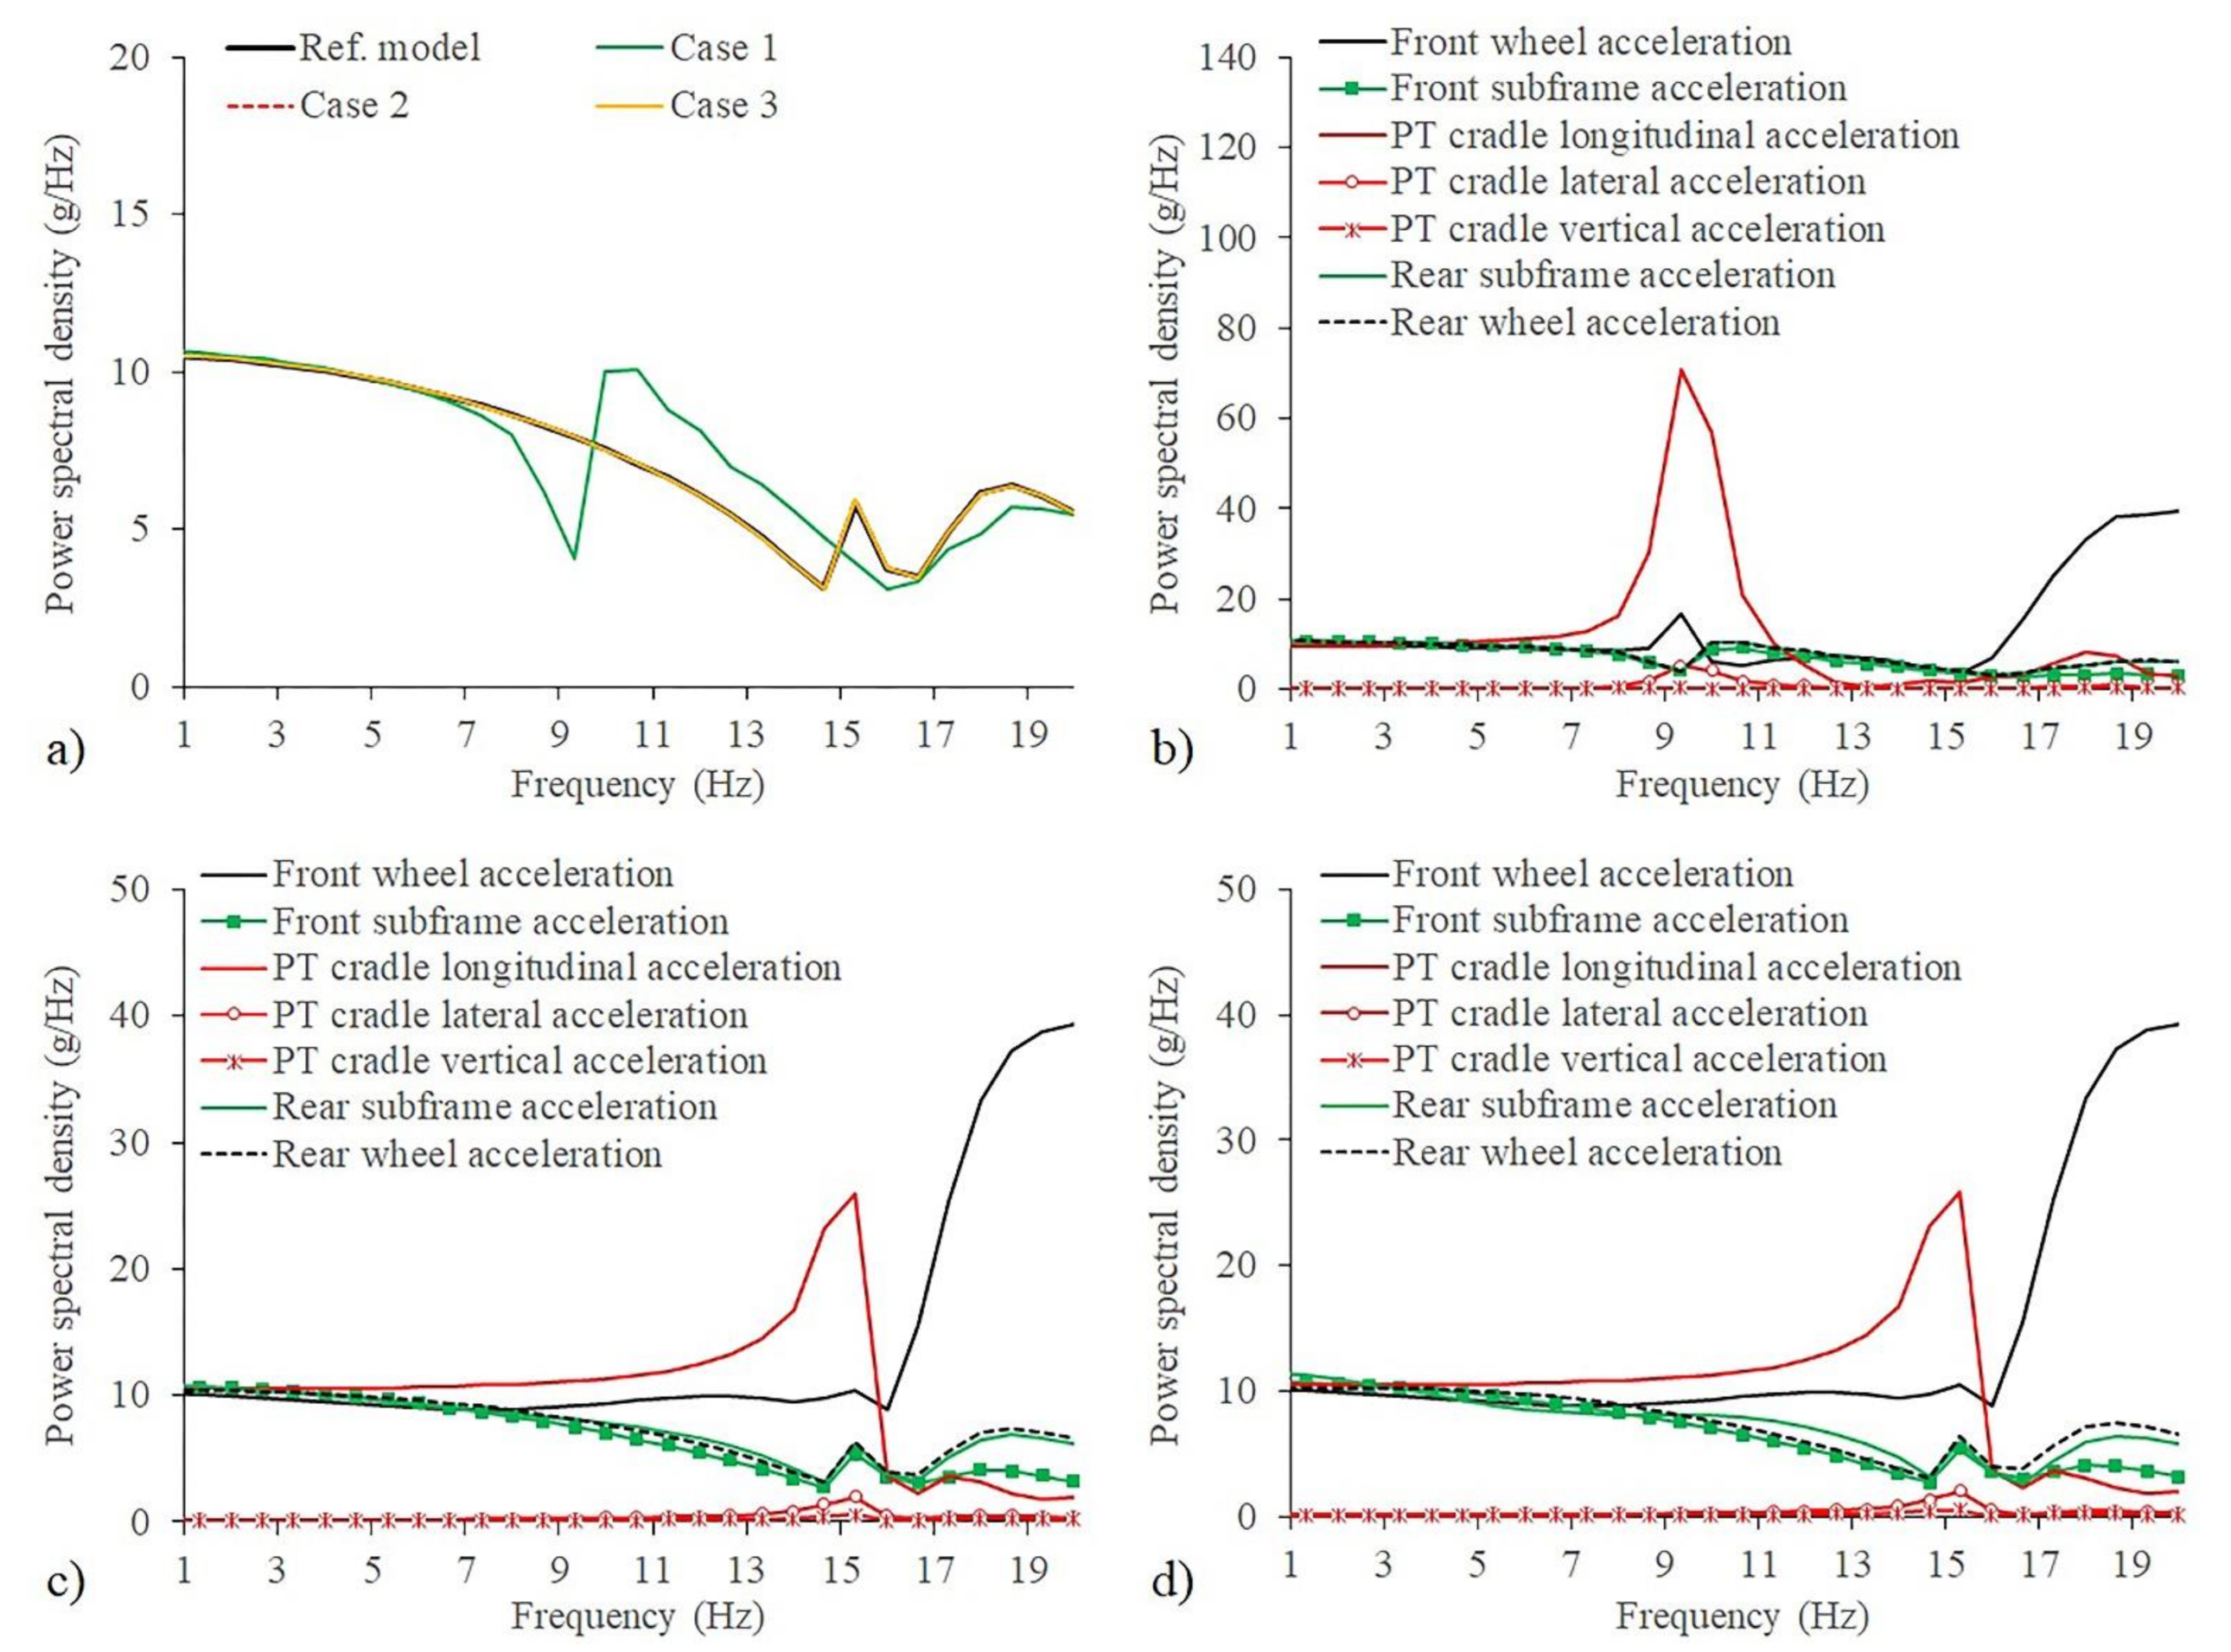
3.2. EPA on Decoupled Dominant Components

From the analysis on three road mu, it has been identified that the PT cradle has the dominant effect on the vehicle body driveability and low-frequency resonances, which aligns with the literature. The importance of 3-DOF rubber mounts and roll-stoppers concerning the vehicle driveability was investigated further by decoupling their properties from the REEV model on the tarmac and compared to the reference REEV model. To implement the EPA method, five case studies were investigated, as shown in Table 5 with the same tip-in test event.
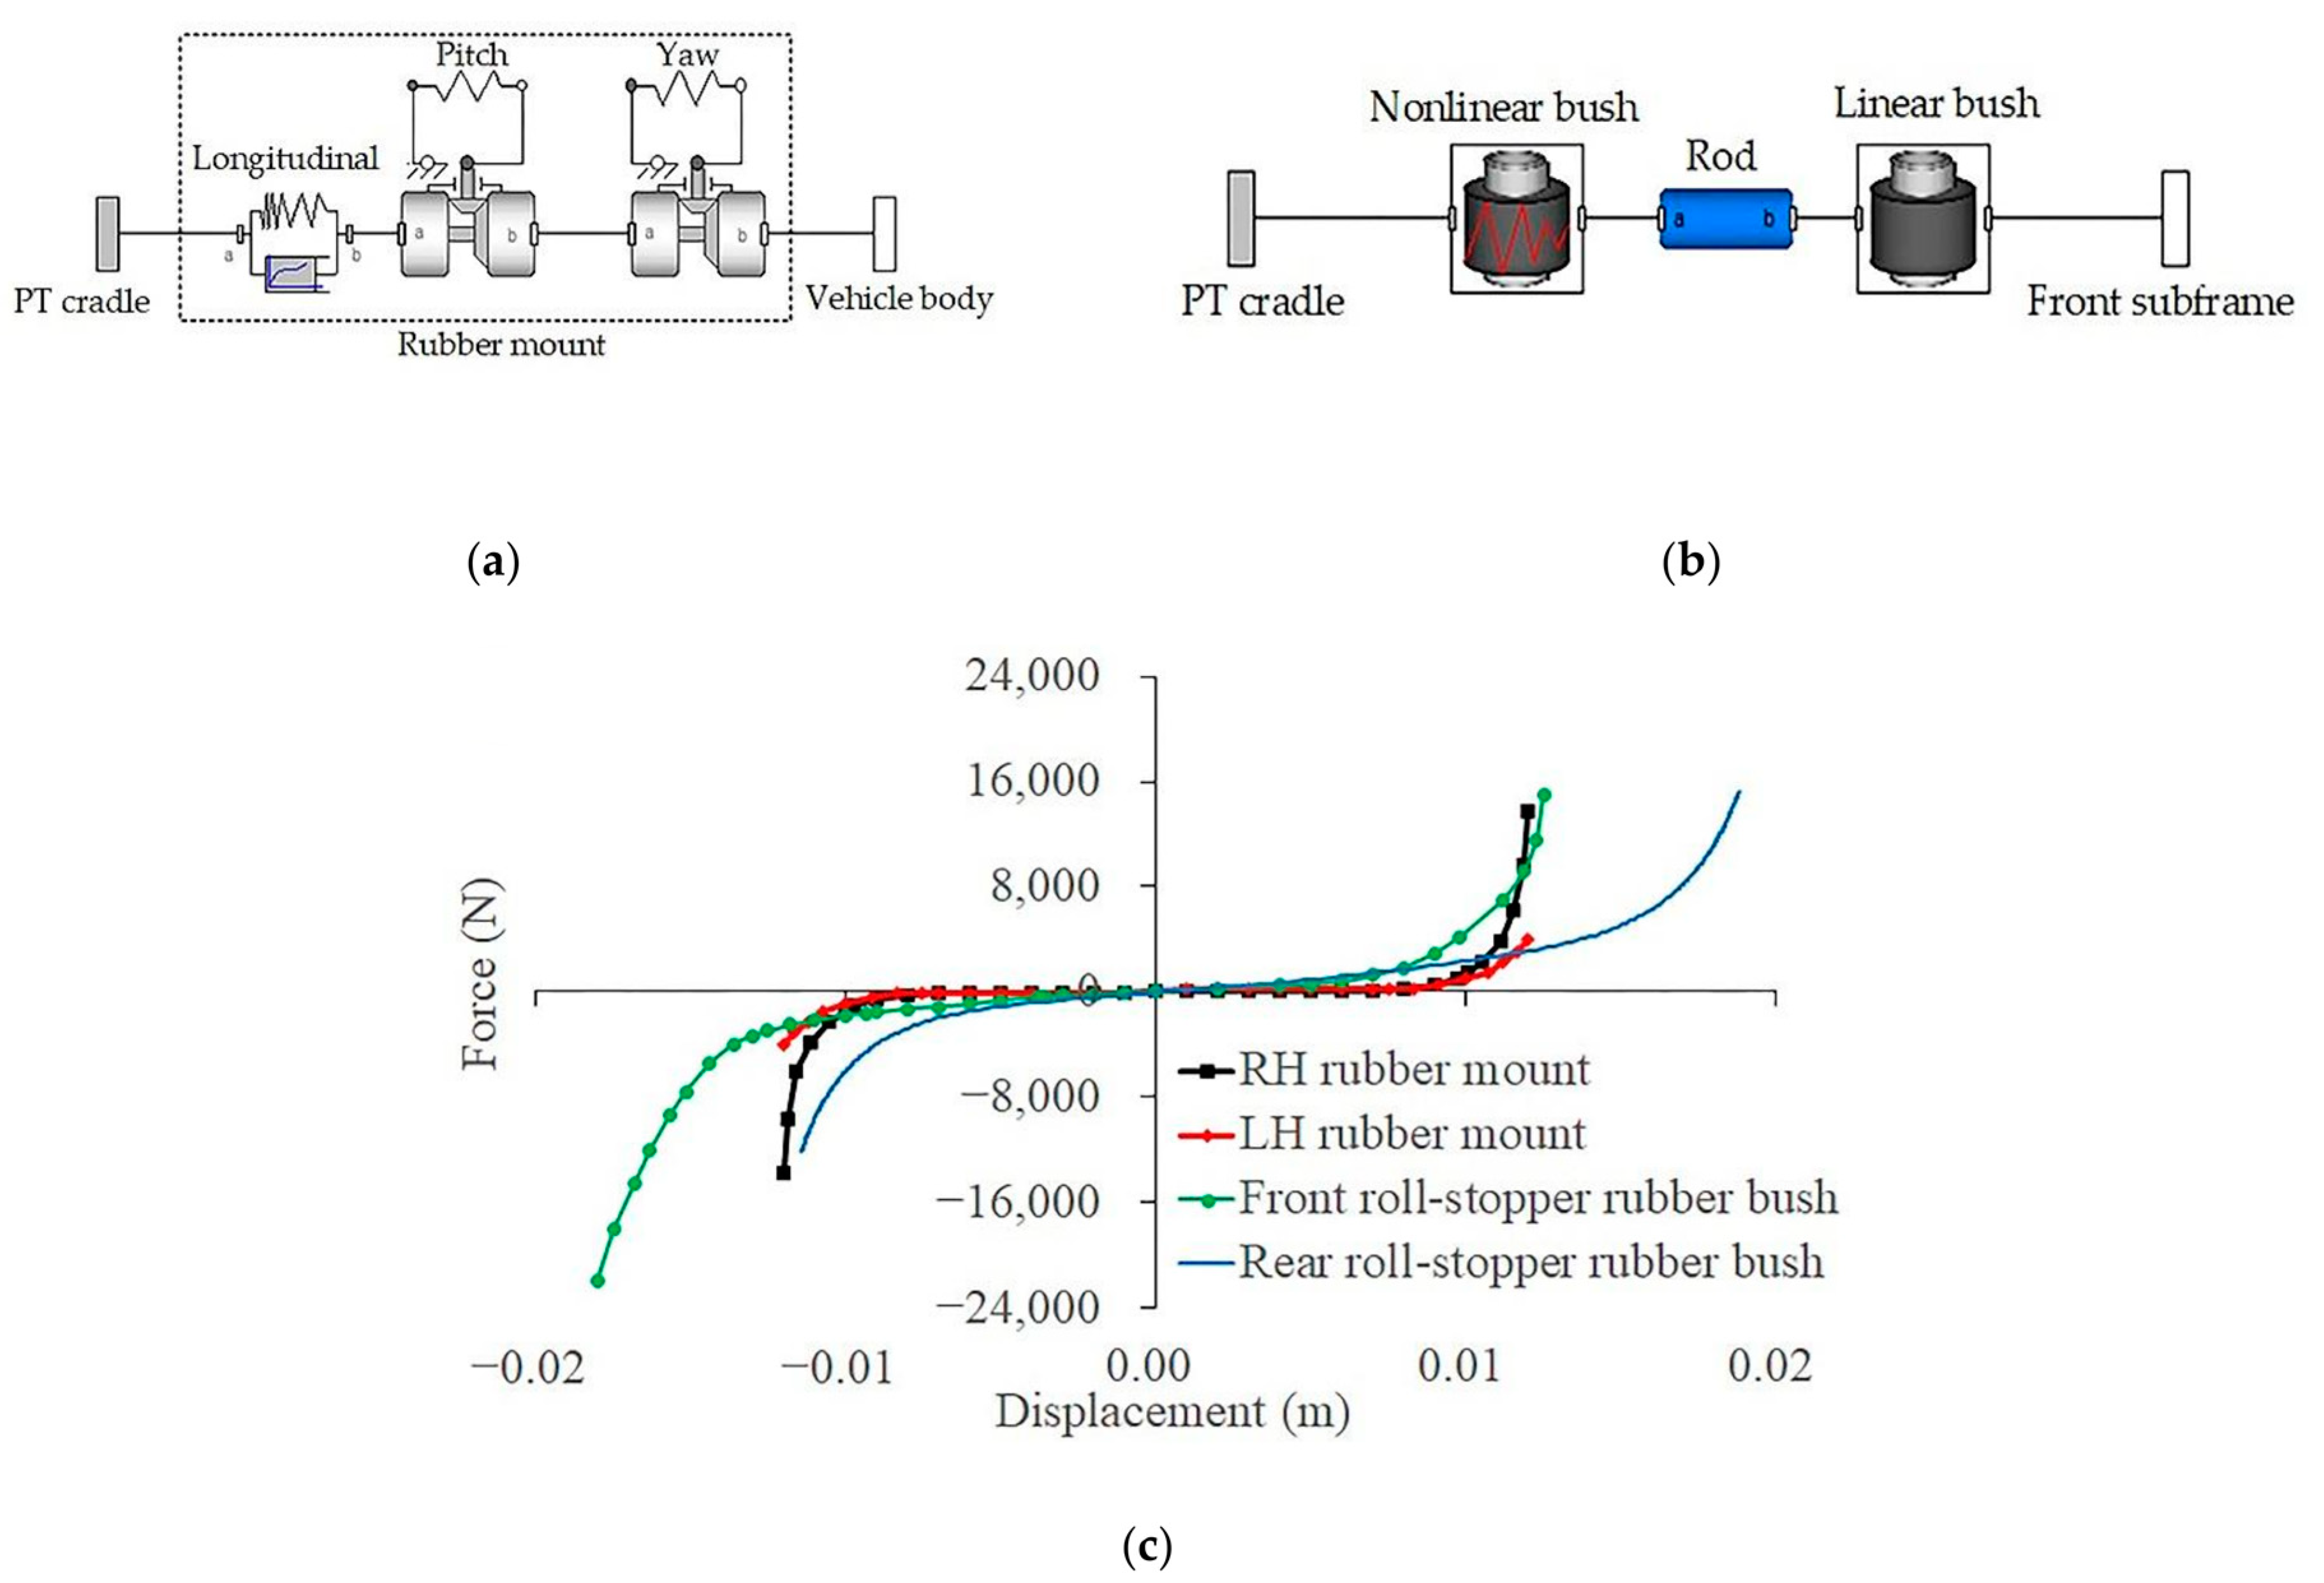
  • RH and LH Rubber Mounts Properties (Case 1–3)
From Figure 12a, the RH and LH rubber mount longitudinal properties and the PT cradle longitudinal acceleration response were significantly characterised. The amplitude and the damping ratio of PT cradle longitudinal acceleration response were substantially changed and developed a frequency migration. The effect of the rubber mount’s yaw and pitch properties on the PT cradle longitudinal acceleration response was minimal and negligible. In terms of the PT cradle lateral and vertical acceleration, the decoupled rubber mounts longitudinal properties also provided similar responses as shown in Figure 12b,c.
Through the rest of Figure 12, the decoupled of all rubber mount properties have less influence on the front wheel longitudinal acceleration. This is because the PT cradle was not directly connected to the front wheel, where the force intensity was considerably low and damped by the front wheel and the front suspension. However, without the rubber mount longitudinal properties, the front subframe longitudinal acceleration was more responsive compared to the other two properties. The vehicle body longitudinal acceleration response was altered, corresponding to the front subframe and the PT cradle responses by decoupling the rubber mount longitudinal properties. The vehicle body longitudinal acceleration response also required a longer settling time and generated a lower frequency resonance. The acceleration dip was still present in all decoupled rubber mount properties cases. The nonlinear rear subframe bushes were affected by the decoupling of rubber mount longitudinal properties compared to the yaw and pitch properties, with higher amplitude and a lower damping ratio. A similar effect on the rear suspension was also observed where it excited the rear wheel with a low damping ratio.
In Figure 13a, the decoupled rubber mount longitudinal properties produced a vehicle body low-frequency resonance of 10.66 Hz. However, the decoupled rubber mount yaw and pitch properties migrated the vehicle body’s low-frequency resonance to 15.33 Hz. Figure 13b,c provide the low-frequency resonances sensitivity for each of the dominant components’ acceleration magnitude corresponding to the decoupled rubber mount properties. In all cases, the low-frequency resonances were controlled by the PT cradle longitudinal acceleration, and the front wheel longitudinal acceleration dominated the vehicle body’s low-frequency resonances above 16.66 Hz.

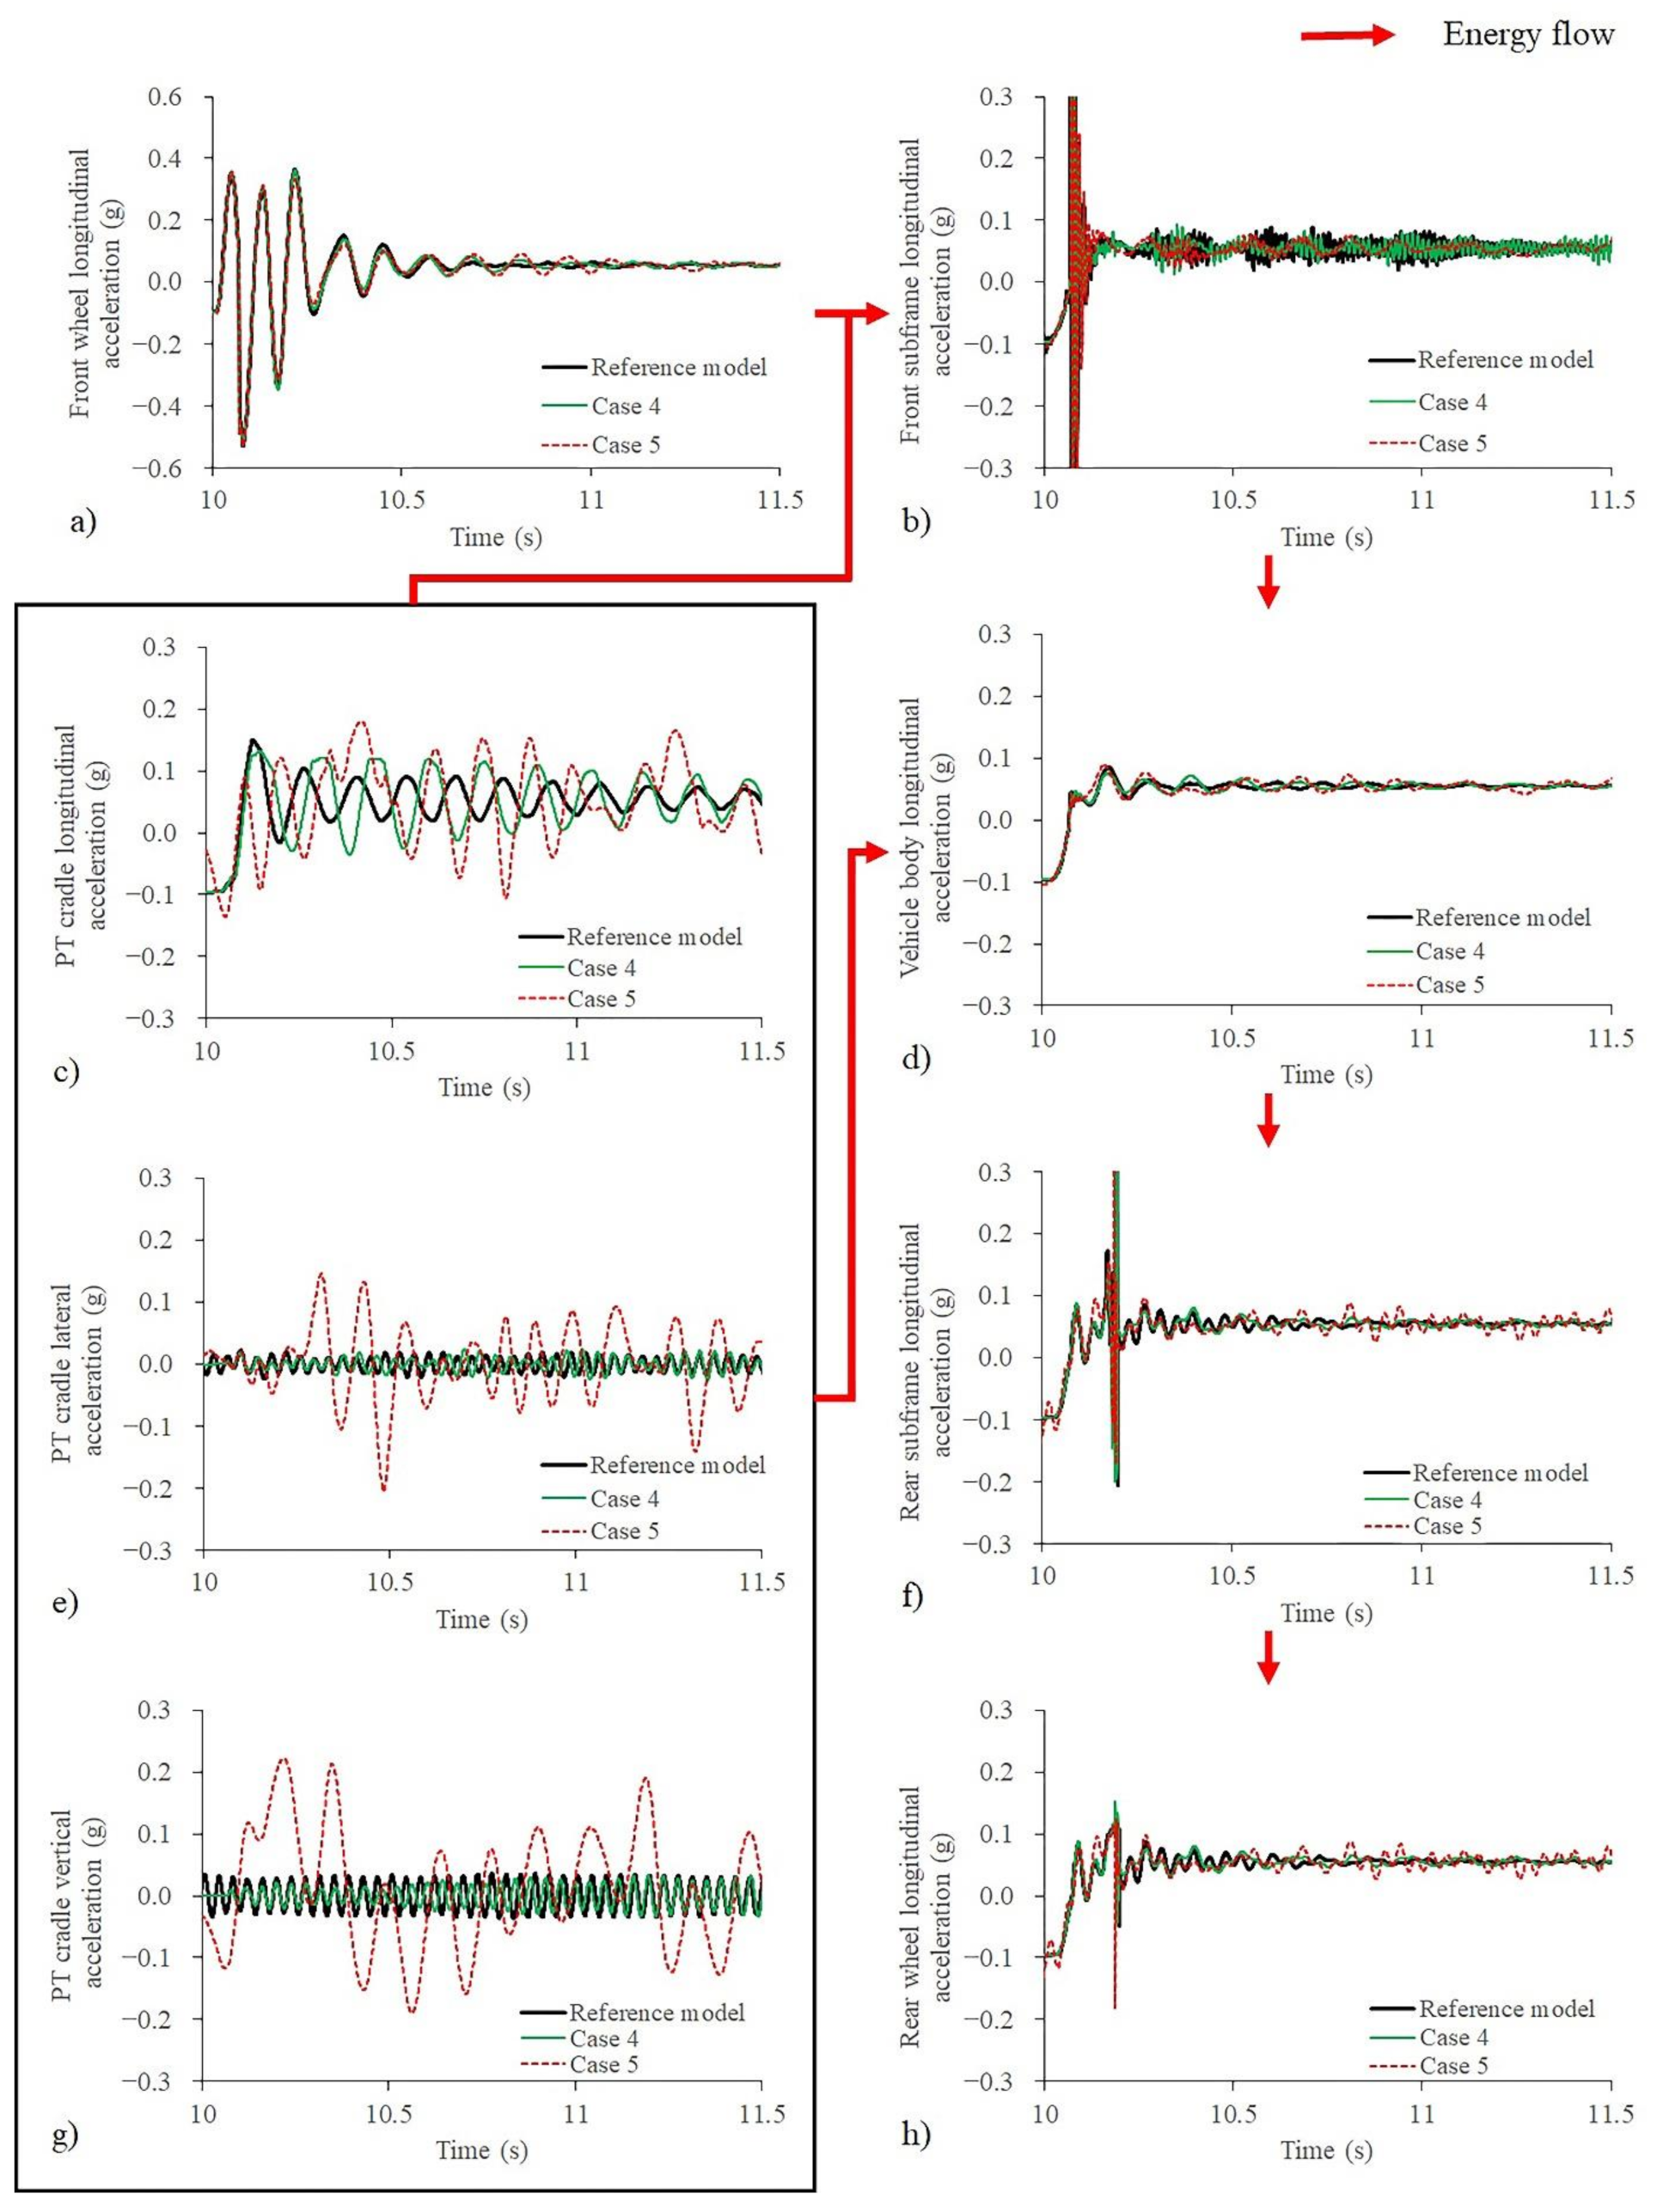
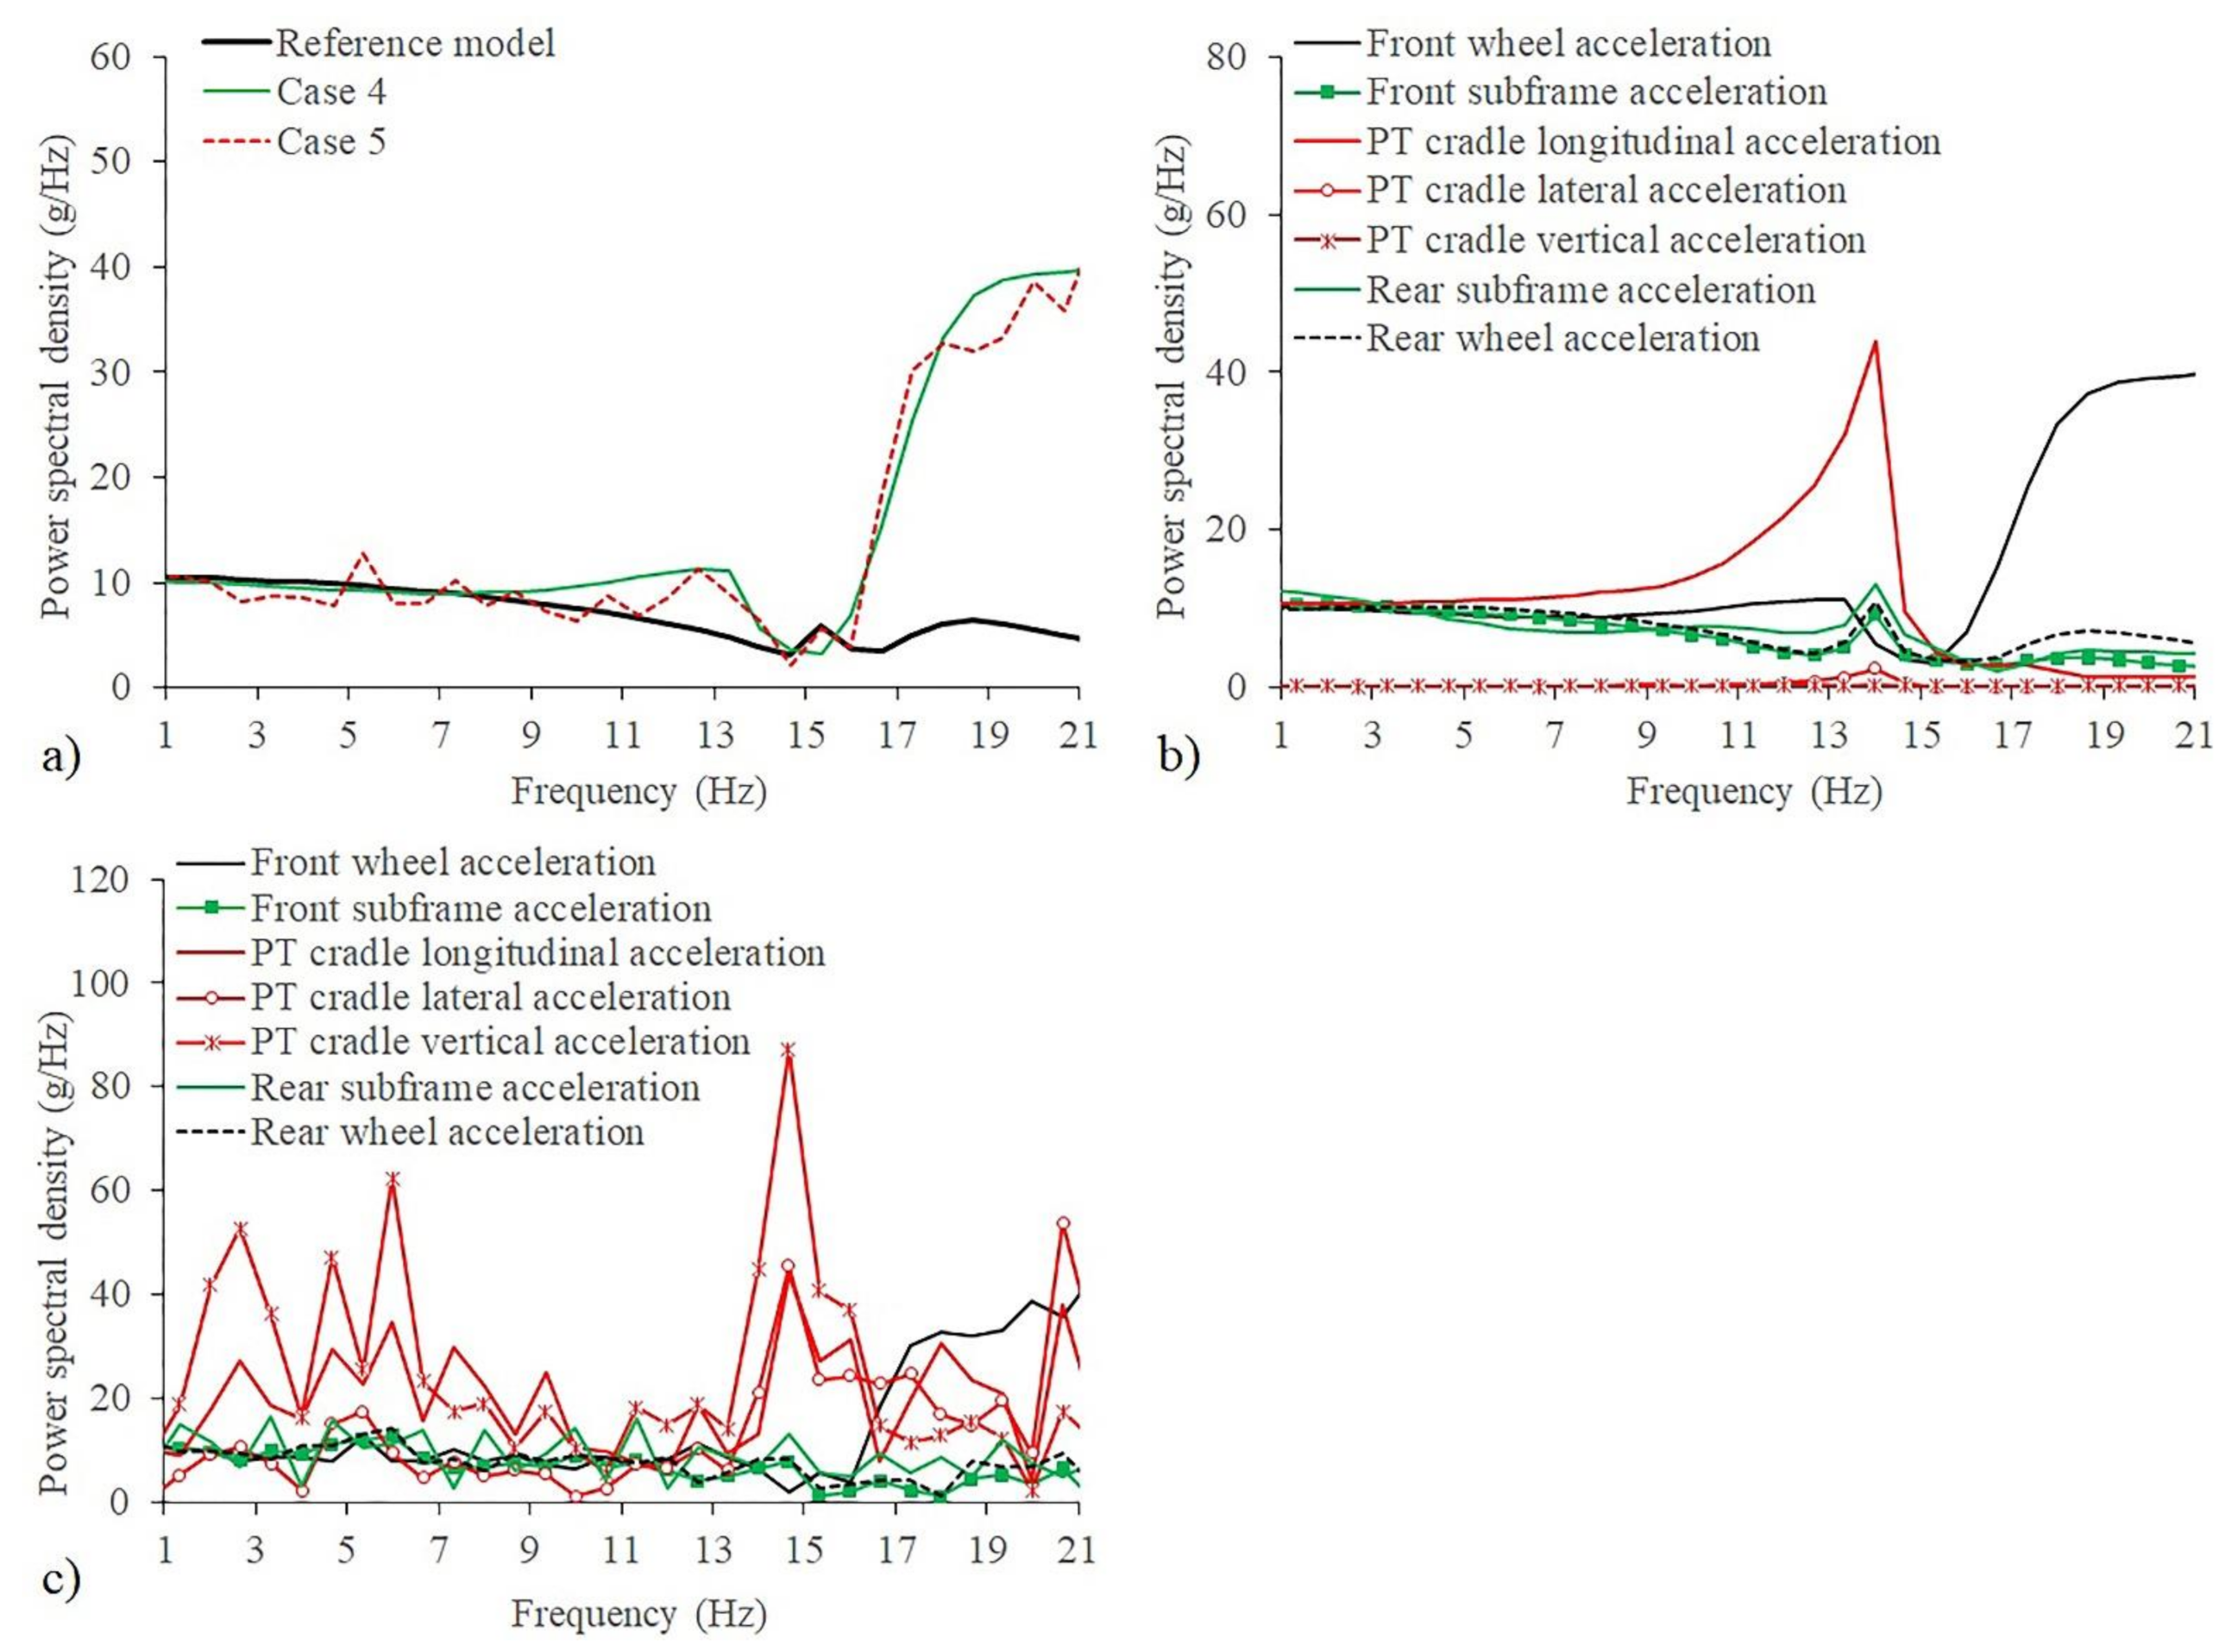
3.3. Front and Rear Roll-Stoppers (Case 4–5)

The components acceleration energy path and the influence of front and rear roll-stoppers on vehicle driveability can be observed in Figure 14a–h. The PT cradle was pitched enormously without the rear roll-stopper and changed the acceleration low-frequency resonances in all directions. The decoupling of the front roll-stopper also caused an aggressive PT cradle longitudinal acceleration response but has a marginal effect in the lateral and vertical accelerations. The differences in PT cradle acceleration can be attributed to the different mounting positions of the front and rear roll-stoppers.
The differences of front wheel longitudinal acceleration for both roll-stoppers were not significant compared to the reference model within 10.6 s of the excitation but changed the response subsequently due to the higher force excitation from the PT cradle, which was then transferred to the front subframe. By decoupling the front roll-stopper, the front subframe generated a high frequency during the tip-in event and suggested that the rear roll stopper has a rigid connection between the PT cradle and the front subframe through the nonlinear bushes. The decoupled of both roll-stoppers also caused a phase shift between the vehicle body and the reference model. From the power spectral density analysis in Figure 15a, the vehicle body’s low-frequency resonance migrated from 15.33 Hz to 13.33 Hz and was dominated by the PT cradle longitudinal acceleration, as shown in Figure 15b. On the other hand, the decoupled rear roll-stopper, as shown in Figure 15c, migrated the vehicle body’s low-frequency resonance from 15.33 Hz to 2.0 Hz, 3.33 Hz, 5.33 Hz, 7.33 Hz, 10.66 Hz, 12.66 Hz that were dominated by the PT cradle vertical acceleration, and to 7.33 Hz, 8.66 Hz that were dominated by the PT cradle longitudinal acceleration. Other low-frequency resonances were controlled by the front-wheel longitudinal acceleration.

4. Conclusions

The model-based EPA method was a useful tool to determine the responses of dominant components acceleration on the vehicle body acceleration. These parameters can then be tuned for vehicle driveability refinement. Based on the road mu simulations, the relationships between the dominant components have been established. For example, the relationship between the front wheel and the PT cradle, due to the longitudinal responses. The front wheel produced one low-frequency resonance of 18.66 Hz on the tarmac and eight low-frequency resonances of 2.66 Hz, 4.66 Hz, 7.33 Hz, 10 Hz, 12 Hz, 14 Hz, and 20 Hz on the split-mu. On the other hand, the PT cradle longitudinal acceleration produced only one low-frequency resonance of 15.33 Hz on the tarmac, the polished ice, and the split-mu. The mode shape analysis method has provided a good insight into the components and the compliances responses under different road conditions, which was also shown by the influence of PT cradle longitudinal acceleration and front wheels. The level of coupling between the torsional components and the chassis components was sensitive to the low surface coefficient, where it has changed the components’ responses.
The EPA method identified the unwanted characteristics of the vehicle acceleration, such as the acceleration dip as a result of the interaction within the vehicle system, such as the front suspension and the subframe bushes. The decoupled simulation method was significant to determine the design requirement of the dominant components such as rubber mount, front roll-stopper, and rear roll-stopper. Without the rubber mount longitudinal properties, the vehicle body produced a low-frequency resonance of 10.66 Hz dominated by the PT cradle longitudinal acceleration. The vehicle body’s low-frequency resonances were migrated by decoupling the rubber mount yaw and pitch properties to 15.33 Hz dominated by PT cradle longitudinal acceleration; to 18.66 Hz dominated by the front wheel.
The absence of the front roll-stopper caused the vehicle body’s low-frequency resonance to migrate from 15.33 Hz to 13.33 Hz. This frequency migration was influenced by the PT cradle longitudinal acceleration. The decoupled rear roll-stopper migrated the vehicle body’s low-frequency resonance from 15.33 Hz to eight frequencies; 2.0 Hz, 3.33 Hz, 5.33 Hz, 7,33 Hz, 10.66 Hz and 12.66 Hz controlled by the PT cradle vertical acceleration; 7.33 Hz and 8.66 Hz controlled by the PT cradle longitudinal acceleration. Other frequencies (>17 Hz) were controlled by the front wheel.
The longitudinal and the pitch responses of the PT cradle were seen to have the predominant effect on the vehicle body’s longitudinal acceleration behaviour either in the time domain or frequency domain, which has been highlighted for detailed attention of the hardware tuning.

Author Contributions

Conceptualisation, R.M.R.A.S.; Formal analysis, R.M.R.A.S.; Funding acquisition, M.A.Q.; Investigation, R.M.R.A.S.; Methodology, R.M.R.A.S.; Project administration, R.M.R.A.S.; Resources, R.M.R.A.S.; Software, R.M.R.A.S. and A.P.; Validation, R.M.R.A.S.; Visualization, R.M.R.A.S.; Writing—original draft, R.M.R.A.S. and R.P.J.; Writing—review & editing, R.M.R.A.S., R.P.J., C.C., A.P., A.R.A.A. and M.A.Q. All authors have read and agreed to the published version of the manuscript.

Funding

This research was funded by the European Commission, KA107 British Council grant numbers: 2020-1-UK01-KA107-078517.

Institutional Review Board Statement

Not applicable.

Informed Consent Statement

Not applicable.

Data Availability Statement

Not applicable.

Conflicts of Interest

On behalf of all the authors, the corresponding author states that there is no conflict of interest.

Appendix A

Table A1. Cartesian coordinates of REEV components and compliances in mm.
ParametersXYZ
Front RH wheel (datum)0.00.00.0
Front LH wheel0.01596.00.0
Vehicle body1000.0798.0−500.0
Front subframe1000.0798.00.0
Front subframe bush 1630.2253.7222.7
Front subframe bush 2630.21349.7222.7
Front subframe bush 31510.2440.7−14.3
Front subframe bush 41510.21162.7−14.3
Powertrain cradle877.6766.5255.3
Front roll stopper rod853.6287.7661.6
Front roll-stopper bush to powertrain cradle756.1287.7648.8
Front roll-stopper bush to vehicle body950.9287.7674.7
Rear roll stopper rod1082.7498.120.6
Rear roll-stopper bush to powertrain cradle1024.2498.111.7
Rear roll-stopper bush to front subframe1141.7498.129.5
RH rubber mount862.2266.2542.2
LH rubber mount923.21259.7470.5
Rear subframe2000.0798.0−500.0
Rear subframe bush 11800.0498.0−200.0
Rear subframe bush 21800.01098.0−200.0
Rear subframe bush 32200.01098.0−200.0
Rear subframe bush 42200.0498.0−200.0
Rear RH wheel3000.01.3−500.0
Rear LH wheel3000.01594.7−500.0

References

  1. International Energy Agency. Global EV Outlook 2020; International Energy Agency: Paris, France, 2020. [Google Scholar]
  2. Electric Vehicle Range Extender Market Size, Share & Trends Analysis Report by Product, by Vehicle (Passenger, Commercial), by Component (Battery Pack, Power Converter), And Segment Forecasts, 2018–2025. Available online: https://www.grandviewresearch.com/industry-analysis/electric-vehicle-ev-range-extender-market (accessed on 10 July 2021).
  3. Shah, R.M.R.A.; McGordon, A.; Rahman, M.; Amor-Segan, M.; Jennings, P. Characterisation of micro turbine generator as a range extender using an automotive drive cycle for series hybrid electric vehicle application. Appl. Therm. Eng. 2021, 184, 116302. [Google Scholar] [CrossRef]
  4. Crolla, D.A.; Cao, D. The impact of hybrid and electric powertrains on vehicle dynamics, control systems and energy regeneration. Veh. Syst. Dyn 2012, 50, 95–109. [Google Scholar] [CrossRef] [Green Version]
  5. Milliken, W.F.; Milliken, D.L. Race Car Vehicle Dynamic; Society of Automotive Engineers: Warrendale, PA, USA, 1995. [Google Scholar]
  6. Loprencipe, G.; Zoccali, P. Ride Quality Due to Road Surface Irregularities: Comparison of Different Methods Applied on a Set of Real Road Profiles. Coatings 2017, 7, 59. [Google Scholar] [CrossRef] [Green Version]
  7. Kim, D.; Min, K.; Kim, H.; Huh, K. Vehicle sideslip angle estimation using deep ensemble-based adaptive Kalman filter. Mech. Syst. Signal Process. 2020, 144, 106862. [Google Scholar] [CrossRef]
  8. Liu, C.; Zhou, J.; Gerhard, A.; Kubenz, J.; Prokop, G. Characterization of the Vehicle Roll Movement with the Dynamic Chassis Simulator. In Vehicle and Automotive Engineering 2; Springer Science and Business Media LLC: Berlin, Germany, 2018; pp. 129–141. [Google Scholar]
  9. Gao, B.; Liang, Q.; Xiang, Y.; Guo, L.; Chen, H. Gear ratio optimization and shift control of 2-speed I-AMT in electric vehicle. Mech. Syst. Signal Process. 2015, 50, 615–631. [Google Scholar] [CrossRef]
  10. Li, G.; Görges, D. Optimal control of the gear shifting process for shift smoothness in dual-clutch transmissions. Mech. Syst. Signal Process. 2018, 103, 23–38. [Google Scholar] [CrossRef]
  11. Atabay, O.; Ötkür, M.; Ereke, I.M. Model based predictive engine torque control for improved drivability. Proc. Inst. Mech. Eng. Part D J. Automob. Eng. 2018, 232, 1654–1666. [Google Scholar] [CrossRef]
  12. Dorey, R.E.; Holmes, C.B. Vehicle Driveability—Its Characterisation and Measurement. In International Congress & Exposition; Detroit SAE International: Detroit, MI, USA, 1999; p. 8. [Google Scholar]
  13. Wang, W.; Cao, L.; Qu, F. Driving Performance Test of Plug-in Hybrid Electric Vehicle Based on AVL-DRIVE. In Proceedings of the 2019 5th International Conference on Control, Automation and Robotics (ICCAR), Beijing, China, 19–22 April 2019; pp. 771–775. [Google Scholar]
  14. Ciceo, S.; Mollet, Y.; Sarrazin, M.; Gyselinck, J.; Auweraer, H.V.d.; Martiş, C. Model-based design and testing for electric vehicle driveability analysis. In Proceedings of the 2016 IEEE 16th International Conference on Environment and Electrical Engineering (EEEIC), Florence, Italy, 7–10 June 2016; pp. 1–4. [Google Scholar]
  15. Pawar, J. Low Frequency Powertrain and Vehicle System Dynamics; University of Warwick: Coventry, UK, 2009. [Google Scholar]
  16. Wang, D.; Jiang, M.; He, K.; Li, X.; Li, F. Study on vibration suppression method of vehicle with engine start-stop and automatic start-stop. Mech. Syst. Signal Process. 2020, 142, 106783. [Google Scholar] [CrossRef]
  17. Shah, R.M.B.R.A.; Jones, R.P.; Pawar, J. System modelling and analysis of the driveability response of 4WD vehicle. Int. Rev. Mech. Eng. 2012, 6, 595–601. [Google Scholar]
  18. Ehsani, M.; Gao, Y.; Longo, S.; Ebrahimi, K. Modern Electric, Hybrid Electric, and Fuel Cell Vehicles, 3rd ed.; CRC Press: Boca Raton, FL, USA, 2018. [Google Scholar]
  19. Hao, D.; Zhao, C.; Huang, Y. A Reduced-Order Model for Active Suppression Control of Vehicle Longitudinal Low-Frequency Vibration. Shock Vib. 2018, 2018, 1–22. [Google Scholar] [CrossRef]
  20. Scamarcio, A.; Gruber, P.; de Pinto, S.; Sorniotti, A. Anti-jerk controllers for automotive applications: A review. Annu. Rev. Control 2020, 50, 174–189. [Google Scholar] [CrossRef]
  21. Johnson, S.R.; Subhedar, J.W. Computer Optimization of Engine Mounting Systems, 3rd ed. In International Conference on Vehicle Structural Mechanics Michigan; USA SAE International: Warrendale, PA, USA, 1979; p. 8. [Google Scholar]
  22. Road and Pavement Maintenance, Road Safety, Mobility and Transport, European Commission. Available online: https://ec.europa.eu/transport/road_safety/specialist/knowledge/road/managing_safety_of_roads_through_their_whole_life/road_and_pavement_maintenance_en (accessed on 29 July 2021).
  23. Ivanov, V.; Savitski, D.; Shyrokau, B. A Survey of Traction Control and Antilock Braking Systems of Full Electric Vehicles with Individually Controlled Electric Motors. IEEE Trans. Veh. Technol. 2015, 64, 3878–3896. [Google Scholar] [CrossRef]
  24. Zhang, J.L.; Yin, C.L.; Zhang, J.W. Improvement of drivability and fuel economy with a hybrid antiskid braking system in hybrid electric vehicles. Int. J. Automot. Technol. 2010, 11, 205–213. [Google Scholar] [CrossRef]
  25. Oleksowicz, S.; Burnham, K.; Phillip, N.; Barber, P.; Curry, E.; Grzegozek, W. Regenerative Braking Control for High Level Deceleration on Low Mu Surface. SAE Int. J. Altern. Powertrains 2015, 4, 209–224. [Google Scholar] [CrossRef]
  26. Van der Seijs, M.V.; de Klerk, D.; Rixen, D. General framework for transfer path analysis: History, theory and classification of techniques. Mech. Syst. Signal Process. 2016, 68, 217–244. [Google Scholar] [CrossRef]
  27. Acri, A.; Nijman, E.; Offner, G. Influences of system uncertainties on the numerical transfer path analysis of engine systems. Mech. Syst. Signal Process. 2017, 95, 106–121. [Google Scholar] [CrossRef]
  28. Diez-Ibarbia, A.; Battarra, M.; Palenzuela, J.; Cervantes-Madrid, G.; Walsh, S.; De-La-Cruz, M.; Theodossiades, S.; Gagliardini, L. Comparison between transfer path analysis methods on an electric vehicle. Appl. Acoust. 2017, 118, 83–101. [Google Scholar] [CrossRef] [Green Version]
  29. Zhang, Y.; Huang, X.; Zhao, Q. Sensitivity analysis for vibration transfer path systems with non-viscous damping. J. Vib. Control 2010, 17, 1042–1048. [Google Scholar] [CrossRef]
  30. Haeussler, M.; Kobus, D.; Rixen, D. Parametric design optimization of e-compressor NVH using blocked forces and substructuring. Mech. Syst. Signal Process. 2021, 150, 107217. [Google Scholar] [CrossRef]
  31. Jimbo, T.; Hibino, R.; Yamaguchi, H.; Matsunaga, H.; Otsubo, H. Multiway analysis of vehicle acceleration behavior. In Proceedings of the ISMA, Leuven, Belgium, 15–17 September 2014; p. 2014. [Google Scholar]
  32. Hibino, R.; Jimbo, T.; Yamaguchi, H.; Tsurumi, Y.; Otsubo, H.; Kato, S. Clarification of Transient Characteristics by Coupled Analysis of Powertrains and Vehicles. SAE Int. J. Passeng. Cars-Mech. Syst. 2016, 9, 216–226. [Google Scholar] [CrossRef]
  33. Zhang, N.; Chen, T.; Zheng, M.; Luo, L.; Liu, P. Real-time identification of vehicle body motion-modes based on motion-mode energy method. Mech. Syst. Signal Process. 2020, 143, 106843. [Google Scholar] [CrossRef]
  34. Shah, R.M.B.R.A.; Cheng, C.; Jones, R.P.; Pawar, J. Modelling of 4WD vehicle driveability during tip-in/tip-out events. In Proceedings of the 22nd International Symposium on Dynamics of Vehicle on Road and Tracks, Manchester, UK, 14–19 August 2011; p. 85. [Google Scholar]
  35. Yoon, H.-W.; Bang, J.-H.; Park, J.-H. Development of Engine Mount System for Low Frequency Vibration Improvement. In SAE World Congress & Exhibition; Detroit SAE International: Detroit, MI, USA, 2008; p. 10. [Google Scholar]
  36. Sun, J.; Xue, X.; Cheng, K.W.E. Fuzzy Sliding Mode Wheel Slip Ratio Control for Smart Vehicle Anti-Lock Braking System. Energies 2019, 12, 2501. [Google Scholar] [CrossRef] [Green Version]
  37. List, H.O.; Schoeggl, P. Objective Evaluation of Vehicle Driveability. In International Congress & Exposition; Detroit SAE International: Detroit, MI, USA, 1998; p. 9. [Google Scholar]
  38. Krenz, R.A. Vehicle Response to Throttle Tip-In/Tip-Out. In Proceedings of the SAE Surface Vehicle Noise and Vibration Conference, Dearborn, MI, USA, 15 May 1985; pp. 793–800. [Google Scholar]
  39. Pazooki, A.; Rakheja, S.; Cao, D. Modeling and validation of off-road vehicle ride dynamics. Mech. Syst. Signal Process. 2012, 28, 679–695. [Google Scholar] [CrossRef] [Green Version]
Figure 1. The basic architecture of REEV with an electric motor, generator, IC engine REx, BES, and power electronics.
Energies 14 05696 g001
Figure 2. Block diagram of 2WD REEV system architecture interaction.
Energies 14 05696 g002
Figure 3. PT cradle mounting models: (a) 3-DOF RH and LH rubber mounts; (b) longitudinal front and rear roll-stopper rubber bushes and rigid rod; (c) longitudinal nonlinear stiffness properties.
Energies 14 05696 g003
Figure 4. Longitudinal nonlinear compliance models: (a) front and rear subframe with bushes; (b) front and rear suspensions; (c) stiffness properties.
Energies 14 05696 g004
Figure 5. Tip-in test event for REEV driveability analysis at 70% throttle position.
Energies 14 05696 g005
Figure 6. EPA process to determine the dominant component low-frequency resonances.
Energies 14 05696 g006
Figure 7. Tip-in event components acceleration on different road mu: (a) vehicle body longitudinal; (b) PT cradle longitudinal; (c) PT cradle lateral; (d) PT cradle vertical.
Energies 14 05696 g007
Figure 8. Tip-in event tractive force on different road mu: (a) front RH wheel; (b) front LH wheel.
Energies 14 05696 g008
Figure 9. Tip-in event longitudinal acceleration on different road mu: (a) front subframe; (b) rear subframe.
Energies 14 05696 g009
Figure 10. Tip-in event low-frequency resonances of component acceleration: (a) vehicle body longitudinal on different road mu; (b) dominant component on the tarmac; (c) dominant components on polished ice; (d) dominant components on split-mu.
Energies 14 05696 g010
Figure 11. Mode shape analysis of linearised REEV model on; (a) tarmac; (b) polished ice; (c) split-mu.
Energies 14 05696 g011
Figure 12. Tip-in event components accelerations EPA on the tarmac and decoupled PT cradle rubber mount properties: (a) front wheel longitudinal; (b) front subframe longitudinal; (c) PT cradle longitudinal; (d) vehicle body longitudinal; (e) PT cradle lateral; (f) rear subframe longitudinal; (g) PT cradle vertical acceleration; (h) rear wheel longitudinal.
Energies 14 05696 g012
Figure 13. Tip-in event low-frequency resonances on the tarmac: (a) vehicle body; (b) case 1; (c) case 2; (d) case 3.
Energies 14 05696 g013
Figure 14. Tip-in event components accelerations EPA on the tarmac and decoupled PT cradle rubber mount properties: (a) front wheel longitudinal; (b) front subframe longitudinal; (c) PT cradle longitudinal; (d) vehicle body longitudinal; (e) PT cradle lateral; (f) rear subframe longitudinal; (g) PT cradle vertical acceleration; (h) rear wheel longitudinal.
Energies 14 05696 g014
Figure 15. Tip-in event low-frequency resonances on the tarmac: (a) vehicle body; (b) case 4; (c) case 5.
Energies 14 05696 g015
Table 1. Linear stiffness and damping properties of PT cradle rubber mounts and roll-stopper rubber bushes.
ComponentsMass (kg)PropertiesValuesUnits
RH rubber mount Damping190N·s/m
0.1Pitch stiffness1.528 × 10−2N·m/°
Yaw stiffness3.898 × 10−1N·s/m
LH rubber mount Damping100N·s/m
0.1Pitch stiffness1.528 × 10−2N·m/°
Yaw stiffness3.898 × 10−1N·m/°
Front roll-stopper rubber bush0.13Stiffness1 × 108N/m
Damping60N·s/m
Rear roll-stopper rubber bush Stiffness1 × 108N/m
0.13Damping130N·s/m
Table 2. Linear damping properties of subframe bushes and suspensions.
ComponentsValuesUnits
Front subframe bush_1–21.81 × 10³N·s/m
Front subframe bush_3–41.01 × 10³N·s/m
Rear subframe bush_1–45.5 × 10²N·s/m
Front RH and LH suspensions3.5 × 102N·s/m
Rear RH and LH suspensions2.5 × 102N·s/m
Table 3. 2WD REEV parameters.
ParametersSymbolsValuesUnits
Frontal areaA2.5m2
Coefficient of dragCd0.3
Vehicle body (including BES) massms1670.5kg
PT massmpt251.3kg
Front subframe massmfsf38.7kg
Rear subframe massmrsf15.6kg
Front tyre massmfw41.6kg
Rear tyre massmrw38.2kg
Static weight distribution 57:43
Maximum EM torqueτem320N·m
Transmission 7.139Total ratio
Differential type 50:50Open
Tyre rolling resistanceCrr0.018
Effective tyre rolling radiusrew0.3415m
Table 4. Three road mu values for driveability analysis of REEV.
Road SurfacesRight WheelsLeft Wheels
Tarmac0.850.85
Polished ice0.100.10
Split-mu0.850.10
Table 5. Case studies of PT cradle mounting properties decoupled process. ✓ symbol is to retain their properties.
Case StudiesRH/LH Rubber Mount PropertiesFront Roll-Stopper PropertiesRear Roll-Stopper Properties
LongitudinalYawPitchLongitudinalLongitudinal
Case 1decoupled
Case 2decoupled
Case 3decoupled
Case 4decoupled
Case 5decoupled
Publisher’s Note: MDPI stays neutral with regard to jurisdictional claims in published maps and institutional affiliations.

