Article

Hydrothermal Carbonization of Chemical and Biological Pulp Mill Sludges

by
Clara Lisseth Mendoza Martinez
*,
Ekaterina Sermyagina
and
Esa Vakkilainen
School of Energy Systems, LUT University, Yliopistonkatu 34, 53850 Lappeenranta, Finland
*
Author to whom correspondence should be addressed.
Energies 2021, 14(18), 5693; https://doi.org/10.3390/en14185693
Submission received: 9 August 2021 / Revised: 7 September 2021 / Accepted: 7 September 2021 / Published: 10 September 2021
(This article belongs to the Special Issue Renewable Energy Solutions for Baltic–Nordic Region 2021)

Abstract

:
A modern pulp mill generates a variety of different by-products and waste streams, some of these can be recycled, refined, sold, or used on-site for energy production. However, some, such as chemical and biological sludges produced in wastewater treatment cannot be reused or disposed of easily, mainly due to their high moisture content and poor drying characteristics. Tightening legislation regarding waste disposal as well as the growing need to increase the process efficiencies of pulp mills act as driving forces to find environmentally friendly and energy-efficient techniques for pulp mill sludge treatment. This study summarizes the current methods for pulp mill sludge handling and evaluates the potential of hydrothermal carbonization (HTC), a conversion process through which wet organic substrates can be transformed into a carbonaceous material (hydrochar). Depending on the process parameters, the material’s structure is modified, enabling hydrochar use in energy, soil conditioning and adsorption applications. The sludges were hydrothermally carbonized at 180, 200, 220 and 240 °C for 3 h. The hydrochar and liquid products’ main properties were analyzed. Their potential applications were also evaluated. The effective treatment of sludges from the pulp industry with HTC could transform energy-demanding waste into a value-added source of materials.

Graphical Abstract

1. Introduction

Industrial waste disposal is an important global issue, and one where a poor solution may cause both health hazards and environmental damage. Much of this waste has the potential to provide extra value, either in the form of chemical compounds or energy. The forest industry, for instance, generates abundant waste, the majority of which is often reused or recovered on site, and methods for generating additional revenue streams from these residues have been studied comprehensively [1,2,3]. At the same time, some side streams from the forest industry, such as sludge from pulp mill effluent treatment systems are more difficult to use. The pulp and paper industry uses a variety of raw materials, such as wood, recycled paper, fillers, gums, glues and colorants, among others. The processing of these materials generates sludges composed of fibers, cellulosic materials, clays, chemical products of coagulation and micro-organisms. Sludges are mainly produced in the primary (chemical) and secondary (biological) waste treatment. In the two-step process, wastewater passes through the primary and secondary clarifiers, producing primary and secondary sludge (also known as a biosludge), respectively. The most common method for primary clarification is sedimentation, where solids settle down to the bottom of a tank and are then removed. The overflow from the primary clarifier is then pumped through the secondary clarifier, where micro-organisms consume the waste as well as oxygen, releasing carbon dioxide and water [4]. The characteristics of the sludge vary according to the type of product manufactured, raw material, and the technologies used in different stages of production within the mill.
In 2020, a downward trend in the market for printing paper was accelerated, especially in North America. Although the industry has had to change and redirect production to meet the changing demand, the volume of global pulp and paper production is still considerable. In 2019, world paper production reached 405 Mt, while chemical pulp reached 148 Mt, with USA (28%), Brazil (12%) and China (6.6%) as the largest pulp producers. The significant production volumes of the pulp and paper industry result in the generation of correspondingly large volumes of sludges. According to [5], approximately 0.2–0.6 tons of wet sludge are generated per ton of air-dried cellulose. The sludge is typically incinerated in the pulp mill boilers or disposed of by means of landfilling. Alternative sludge management options include composting, land-spreading to improve soil fertility, ethanol production, animal feed, pelletization, ceramic and construction materials, and lightweight aggregate [6]. Two framework directives provide the basis for European waste legislation: the Council Directives on Waste 75/442/EEC (amended by 91/156/EEC) and Hazardous Waste 91/689/EEC [7], which set the requirements for the permission and operation of waste disposal facilities, and deal with disposal options for specific types of waste within the European Union. Moreover, different countries also have their own waste management regulations. Several countries have already implemented waste legislation and imposed higher taxes to restrict landfilling and encourage the development of more sustainable waste management practices [7].
Tightening legislation has increased interest in alternative sludge disposal options and solving the related problems. Problematic characteristics, such as high moisture content (85–90%) and the presence of different hazard compounds such as chlorine, make sludge a challenging fuel for incineration in boilers, while the high inorganic and heavy metals content may limit its potential use as a fertilizer [8]. Typically, mills spend more than half of the total wastewater treatment cost on sludge handling and dewatering. Hydrothermal carbonization (HTC) is a thermochemical process that converts wet biomass to a higher quality material under heat and pressure. HTC offers a promising alternative by converting wet sludge into a hydrochar material for upgrading other production lines that fulfil the environmental regulations [9,10]. Thus, the product represents an additional profitable product, or if used on site it can be combusted more efficiently in the boiler than raw sludge for increased power generation. Since HTC is not affected by high feedstock moisture content, the energy consumption is reduced due to elimination of the pre-drying requirement. Moreover, HTC increases the hydrophobicity of the feedstock [3], which may have an economical advantage due to lower energy consumption during the post-drying stage. Additionally, lower impact (sludging, corrosion) on the boilers when the treated sludge’s destination is incineration may be reduced, which is related to lower equipment maintenance cost.
The HTC process takes place at relatively low temperatures, usually in the range of 180–260 °C for at least five minutes but up to several hours in a closed system under autogenous pressures of 1–5 MPa and external heat supply [3,11]. By-products of the process include an energy-dense solid called hydrochar, aqueous compounds (HTC liquor) and gaseous streams (mainly CO2) [3]. Depending on the process conditions, HTC liquor contains up to 15% of the initial carbon, mainly in the form of acetic and formic acid compounds [12]. Other individual high-value chemicals are also usually found in HTC liquor, e.g., furfurals, phenols and fatty acids [13]. The hydrochar typically holds from 55% to 90% of the initial mass of the feedstock and 80% to 95% of its energy content.
Several studies have evaluated the potential uses of pulp mill sludge, such as a low-cost adsorbent for metal removal [14,15], soil amendment agent, and fertilizer [16,17], showing attractive and positive results. The impact of the combustion of the sludge has also been highly investigated [18,19]. Moreover, studies have reported that HTC has the potential to upgrade sludge characteristics by reducing chlorine, sodium and potassium contents, thereby reducing the ash-related problems [20]. Additionally, such processing decreases the amount of suspended solids and increases the biological decomposition of the sludge filtrate [21].
HTC pilot plants are already operating and the world’s first full-scale HTC facility was built recently in Finland, based on green technology to recycle wet pulp mill residual flows into useful energy and agricultural nutrients. The annual CO2 emissions of the mill is projected to decrease by over 2500 tons with the HTC technology [22]. Due to the relative novelty of the HTC process as a sludge management technology, the detailed reaction mechanisms and properties of the different sludge types are not yet fully understood, and only a few comprehensive reports on the potential of hydrochar and HTC liquor have been published, mainly for mixed sludge from pulp and board mill [21,23]. This work determines the effect and significance of reaction temperatures during the HTC of primary and secondary sludges of a Finnish pulp and paper mill. The study also provides an extended characterization of the hydrochar and HTC liquor that was produced. Such information can be used to optimize the integration of HTC and wastewater treatment within mills, evaluate the potential efficient application of the products generated and report the overall feasibility of HTC treatment on a Finnish pulp and paper mill sludges.

2. Materials and Methods
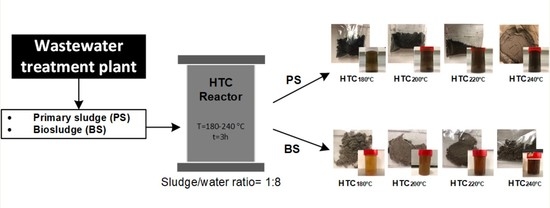
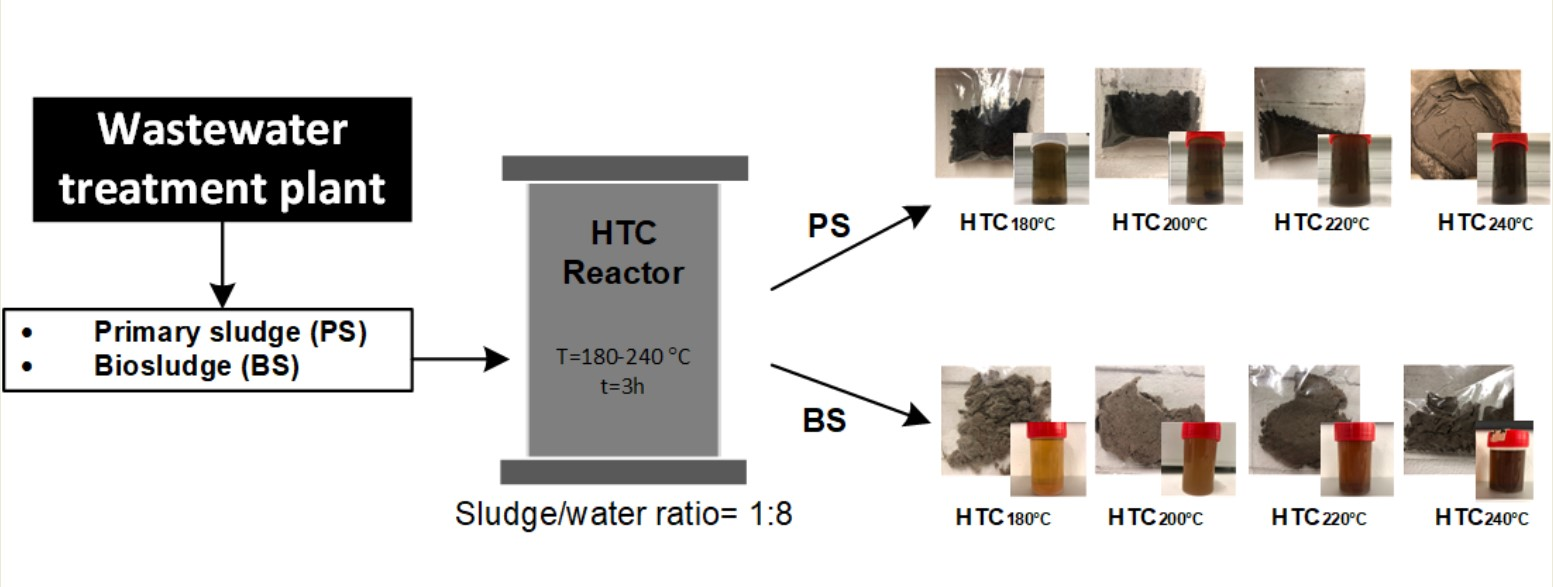
2.1. Sampling

The primary sludge (PS) and biosludge (BS) investigated in the present study were obtained from a wastewater treatment plant of the UPM Kaukas pulp and paper mill located in Lappeenranta, Finland. The sampling period of the sludges represented the normal process operating conditions of the mill. After sampling, the samples were stored in several polyethylene buckets in a freezer (−10 °C) prior to analysis, to avoid or minimize biological, chemical, and physical changes that can occur between the time of collection and the experimental procedures.

2.2. Hydrothermal Carbonization

Hydrothermal carbonization of sludge samples was performed in the laboratory facilities of Lappeenranta-Lahti University of Technology LUT, Finland in four main stages: feedstock preparation and characterization, HTC treatment, liquid–solid separation, and product characterization. The experimental procedure and process parameters’ behavior (pressure and temperature) are depicted in Figure 1. The reactor was loaded with a 1:8 dry sample to water ratio (constant mass of 50 g of sludge on dry basis (db) or 98.4 g and 96.1 g on wet basis (wb) for PS and BS, respectively). The individual experiments were produced at reaction temperatures of 180, 200, 220 and 240 °C and a residence time of three hours, which is considered to be a typical representative retention time for reactions [2,3,24]. The process parameters were selected in accordance to different literature reports [3,25,26], which concluded that a 1:8 ratio enhances the decomposition reaction, which leads to a higher mass loss and heating value when compared to lower ratios. Additionally, Mohammed et al. (2020) [27] reported an optimal HTC process biomass/water ratio of 0.114 (~1:8) for lignocellulose waste biomass. According to Mäkelä et al. (2015), [10] reaction temperature governs HTC reactions and has 3–7 times more effect on the products’ properties than residence time; thus, the scope of this article focused on the temperature effect of the HTC on the studied samples.
HTC experiments were performed in a stainless-steel batch reactor with an inner volume of approximately 1 L (705 mm height and 42 mm inner diameter) with a flange connection at the top and screw closing at the bottom. The inner reactor temperature was monitored with two thermocouples located at 245 mm and at 645 mm from the top of the reactor. An additional thermocouple measured the temperature of the outer surface of the reactor. The pressure measurement was collected by a pressure sensor, which had a pressure relief valve (set point pressure 40 bar, maximum temperature 300 °C) for safety purposes. The heat demand for the process was provided by a heating jacket, which consisted of electric resistance wire elements surrounded by a ceramic fiber insulation and an outer steel cover. The software utilized as a device control and measurement of the operating parameters was the National Instruments LabVIEW. The required temperature level inside the reactor during the period studied was maintained with a proportional-integral-derivative (PID) controller.
After HTC, the solid–liquid product was released from the reactor tube. The solid product was separated by vacuum filtration using a Büchner funnel with a Whatman glass microfiber filter paper of grade GF/A (pore size: 1.6 μm). Liquid product was collected in plastic vials and stored in a refrigerator (+4 °C) until analysis. All tests were carried out at least in duplicate and the average values for mass yields were used.

2.3. Analytical Methods

The solid samples were first dried overnight at 105 ± 5 °C until constant mass according to the EN 14774-2 (SFS, 2010) standard procedure. The American Society for Testing and Materials typically evaluates the ash content (AC) under two standard temperatures, 815 ℃ and 550 °C [28]. The different ashing temperatures influence the inorganic solid content and composition due to the presence of volatile substances. Thus, both feedstock and hydrocarbonized sludge samples were characterized by proximate analysis in accordance with DIN EN 15148:2010-03 (2010), DIN EN 14775:2010-04 (2010) and ISO 1171:2010 standard procedures for volatile matter (VM), AC550°C (550 ± 5 °C) and AC815°C (815 ± 10 °C), respectively. Fixed carbon (FC) was calculated by subtracting the sum of the VM and AC550°C (550 ± 5 °C) percentage in db from 100%, calculated by DIN EN standard procedures. The silica content of the hydrochar was measured according to the Technical Association of the Pulp and Paper Industry (TAPPI) T245 cm-98 (1998).
Trace elements (Al, Ag, Cd, Co, Cr, Cu, Fe, K, Mg, Mn, Mo, Na, Ni, P, Pb, Si, U, V, Zn) were determined via inductively coupled plasma-optical emission spectrometry (ICP-OES). Solid and HTC liquor samples were digested for 20 min with the addition of HCl and HNO3. The actual measurement was done with the iCAP 6000 analyzer (Thermo Fisher Scientific Inc., Waltham, MA, USA). Solid samples were centrifuged for 10 to 20 min at 5000 rpm before digestion to determine the dissolved trace element concentrations.
The content of five major elements in solid samples: carbon (C), oxygen (O), hydrogen (H), nitrogen (N) and sulfur (S) in the organic phase was measured in accordance with ISO standard 16948 (SFS, 2015) and ISO 16994 (SFS, 2016), using a LECO CHN628 Series Elemental Determinator coupled with a 628S Sulfur Add-On Module. Prior to the analysis, the standard samples (ethylenediaminetetraacetic acid for CHN and coal for S measurements) were analyzed to verify the experimental error within ±1% for the elements. For CHN analysis, approximately 30 mg of solid sample (db) was fed into the combustion chamber, while the sulfur content was determined by burning approximately 50 mg of solid sample (db) at 1350 °C within the sulfur module. The oxygen content was calculated by subtracting the sum of the weight percentages of the major elements and ash on a dry basis from 100%. The molar ratios of oxygen and hydrogen to carbon were also determined.
The higher heating values (HHV) of the solid samples were determined according to DIN EN 14918:2014-08 (2014) standard procedure, in duplicate, using an adiabatic oxygen-bomb calorimeter. The lower heating value (LHV) and net heating value (NHV) was determined according to Equations (1) and (2) [29], respectively, and energy densification (ED) according to Equation (3):
LHV daf = HHV daf [ 600 9 H 100 ]
NHV daf = [ LHV daf ( 1 MC ) ( 600 MC ) ]
ED = HHV daf hydrochar db HHV daf feedstock db
where H is the hydrogen content (%); MC is the moisture content (wt%); and LHV is the lower heating value (kcal∙kg−1).
Fourier-transform infrared spectroscopy (FTIR) analysis for solid samples was performed with a Frontier MIR/FIR spectrometer (PerkinElmer Inc., Waltham, MA, USA) coupled with a universal diamond crystal ATR module in the range of 400–4000 cm−1 with a resolution of 4 cm−1.
The morphology of the samples was examined by scanning electron microscopy (SEM) using a Hitachi SU3500 microscope. Images were taken with a backscattered electron (BSE) detector.
X-ray diffractograms (XRD) were obtained using a D8 Advance (Bruker) X-ray powder diffractometer with Cu Kα monochromatic radiation, and θ-2θ geometry was used to analyze all samples. The X-ray diffractograms patterns were obtained in the 2θ range of 10–50° in step-scanning mode with a step length of 0.0204° and step-counting time of 0.725 s.
Together with the metal analysis, the non-volatile residue (NVR) content, pH and total organic carbon (TOC) were also determined for the HTC liquor. The samples were filtered twice using a grade GF/F microfiber filter with a pore size of 0.7 μm in order to reduce the presence of hydrochar particles and to protect the analysis equipment from damage. For the analysis of the NVR content, approximately 4 mL of the liquid samples were used. Once all the samples were weighed, the crucibles were placed in an oven and kept at a temperature of 105 ± 5 °C for 24 h, where the volatile material are then evaporated, leaving the non-volatile residues present in the liquid phase. NVR is defined as in Equation (4) [3].
NVR = ( M l _ o u t ) ( M l _ i n ( M l _ o u t ) ) 10 6 [ mg L 1 ]
where Ml_out (L) is the sample after drying and Ml_in (L) is the liquid collected from the HTC process.
The pH analysis was performed with a digital pH meter; triplicate readings were taken per sample and the average values were used. For TOC analysis, a Shimadzu TOC-Lcph/cpn analyzer unit with a dilution function in the range of 10–100 mg∙L−1 was used according to EN 1484-H3 standard procedure.
The chemical oxygen demand (COD) is based on an oxidizing agent under acidic conditions that can fully oxidize any organic compound to carbon dioxide. The COD of liquid samples was measured with test cuvettes (Hach Lange GmbH, Berlin, Germany), containing all needed reagents (potassium dichromate, sulfuric acid, and mercury sulfate) to prevent any interference with oxidizable inorganic compounds. COD cuvettes of 1500 mg∙L−1 were used. The cuvettes are heated for two hours at 150 °C after the sample was added. Finally, the COD values were determined spectrophotometrically with the photometer, HACH DR/2010 with a 620 nm wavelength.

3. Results

3.1. Properties of the Sludge Feedstock and Hydrochar

The proximate and elemental composition analyses along with the heating values of solid samples are listed in Table 1.
High moisture content is an important feature of both primary and biosludge. After sample collection, the moisture was at a level of 97 wt% and 92 wt% for untreated PS and BS, respectively, without the dewatering process. Biosludge is inherently difficult to dewater due to its gel-like structure consisting largely of extra-cellular polymeric substances and high interstitial water, i.e., water stored within the sludge flocs by capillary forces and chemically bound intracellular water [30]. The hydrochars of PS and BS were dried in a furnace and then kept in a controlled environment to measure the water absorption. The results shown in Table 1 indicate that HTC increases the hydrophobicity of both sludges, indicating a potential to produce materials that consume less energy when dried for energy application. The increment in the hydrophobicity with the reaction severity is an indicator of the re-duction in the hydroxyl groups responsible for the adsorption of moisture [31]. PS reported a lower hydrophobicity increment compared to BS probably because of the fibrous structure, which makes the degradation of hydroxyl groups difficult.
The volatile matter decreased in HTC treatment, with the decrease in the most severe treatment reaching 16 wt% and 12 wt% with the BS and PS, respectively, mostly due to different reactions to the sludge structural composition. Those reactions are enhanced by the increment in water ion production during HTC and are typically known to proceed via hydrolysis, decarboxylation, polymerization, dehydration and aromatization of lignocellulosic material components [32]. Simultaneously, the fixed carbon of hydrochars increased by approximately 14 wt% (BS) and 9 wt% (PS) from the untreated to HTC240°C sample. The FC increase being less than the VM decrease indicates that volatiles were also converted into liquids and/or gaseous products. The sludge also contains several inorganic materials that are problematic due to corrosion impact, harmful emissions, and untreated elements before disposal. The ash content of BS samples was approximately twice that of PS, that is, between 17–21 wt% for BS in comparison to 5–9.3 wt% for PS samples.
High contents of carbon and hydrogen were found for BS and PS, mainly due to the presence of organic fibrous materials that account for 40% to 60% of the composition at the end of the treatment process [33]. The H content may be related as constituents of the C chains of cellulose fibers. HTC treatment increased the C content of the hydrochars from BS and PS by approximately 7.8 wt% and 3.5 wt%, respectively, while there were no significant changes in the H content of all hydrochar samples. HTC treatment at 240 °C reduced the oxygen content of untreated sludges from 24.02 wt% to 15.59 wt% and 42.53 wt% to 39.63 wt% of BS and PS, respectively.
To evaluate the degree of coalification of the HTC hydrochars, the van Krevelen diagram was used, as presented in Figure 2. The hydrogen to carbon (H/C) and oxygen to carbon (O/C) atomic ratios diminished from 1.84 and 0.78 for untreated PS to 1.62 and 0.67 for HTC240°C PS, and from 1.54 and 0.4 for untreated BS to 1.29 and 0.22 for HTC240°C BS, respectively. The reaction pathways can also be observed in Figure 2. Dehydration and demethylation reactions became the dominant pathways with increasing HTC temperatures, while the role of decarboxylation had a relatively small effect on sludge H/C and O/C variation with increasing HTC temperature. Lower H/C and O/C atomic ratios are considered favorable due to increasing HHV [3,34]. As shown in Figure 2, the H/C and O/C atomic ratios of the BS hydrochars were close to those of lignite and coal. The nitrogen and sulfur contents were higher in BS, probably due to micro-organisms in the sample that convert organic compounds into carbon dioxide, water, sulfate, phosphate and nitrate compounds [35]. With increased reaction severity, a significant reduction in N and S from the untreated to the HTC240°C samples was observed: 1.37% and 0.2% (BS), and 0.43% and 0.18% (PS) for N and S, respectively. The elemental N and S are converted into environmentally harmful and corrosive NOx and SOx during combustion. During HTC, organic N compounds hydrolyze and dissolve in the liquid phase, especially at high HTC temperatures, while S in pulp and paper mill partially leaches into hot liquid during hydrothermal leaching [36]. Thus, HTC technology has the potential to produce a clean high-value energy material.
The energy released in a combustion process is usually quantified by the heating value, which is defined as the amount of heat given off by the complete combustion of a unit of volume or mass of the fuel. A high HHV typically correlates with a high content of carbon and hydrogen. A high carbon fraction also correlates with a high FC content, which enhances radiation heat transfer in the furnace, but also requires increased residence time to achieve complete combustion. Table 1 shows the calorific values of the sludge samples. The HHV increases with increasing reaction severity by up to 1 MJ kg dry−1 and 5 MJ kg dry−1 for PS and BS, respectively. The HHV values found for sludge dry matter are similar or higher than those of the sawdust and cones of wood discarded in pulp mills (16–19 MJ kg dry−1) [37], which are already used in power generation.

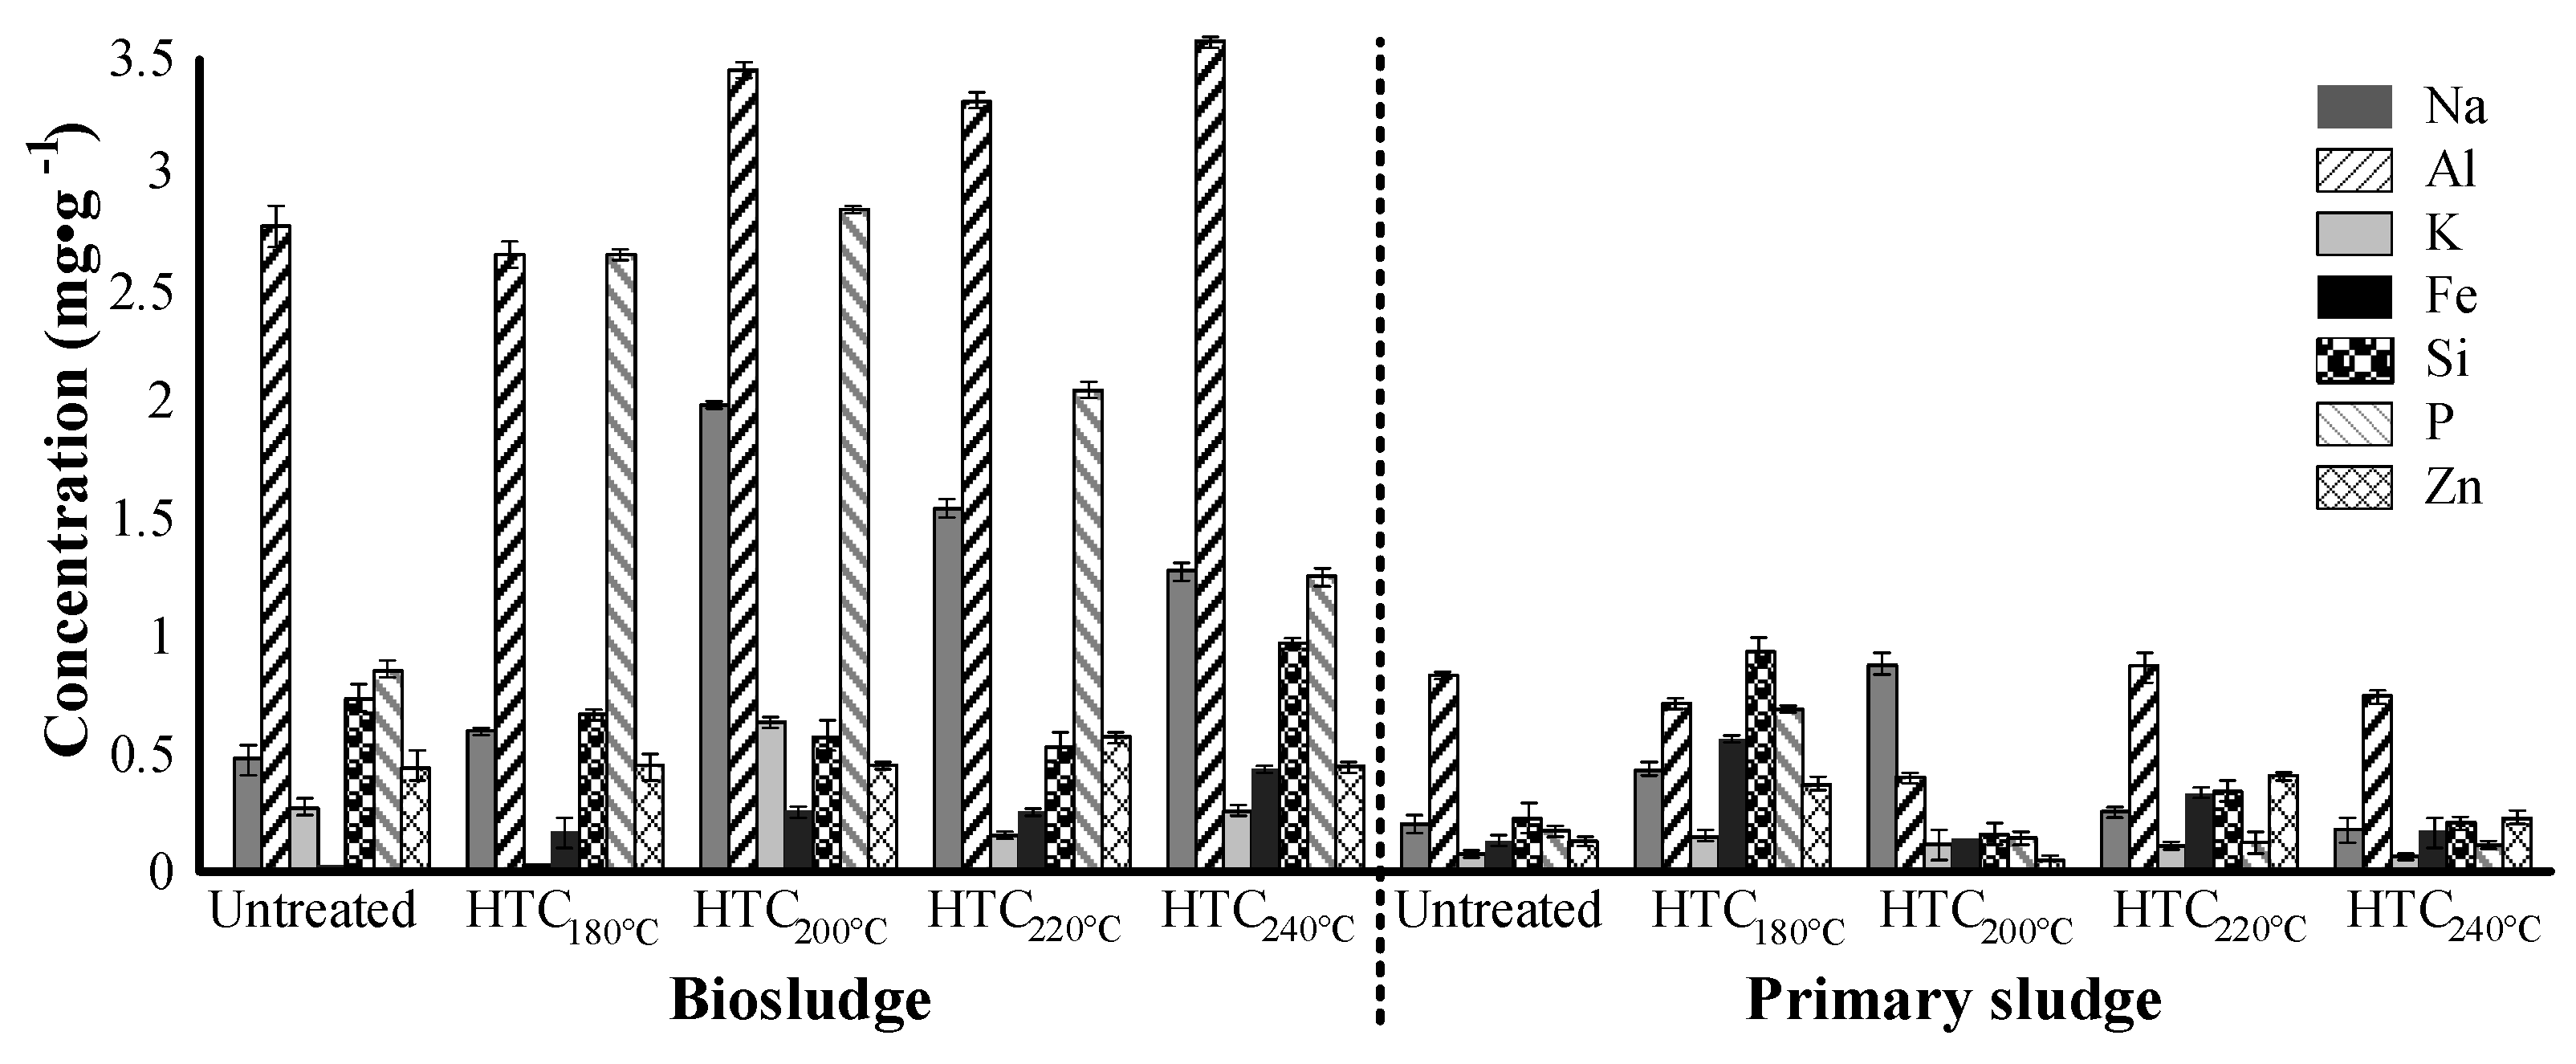
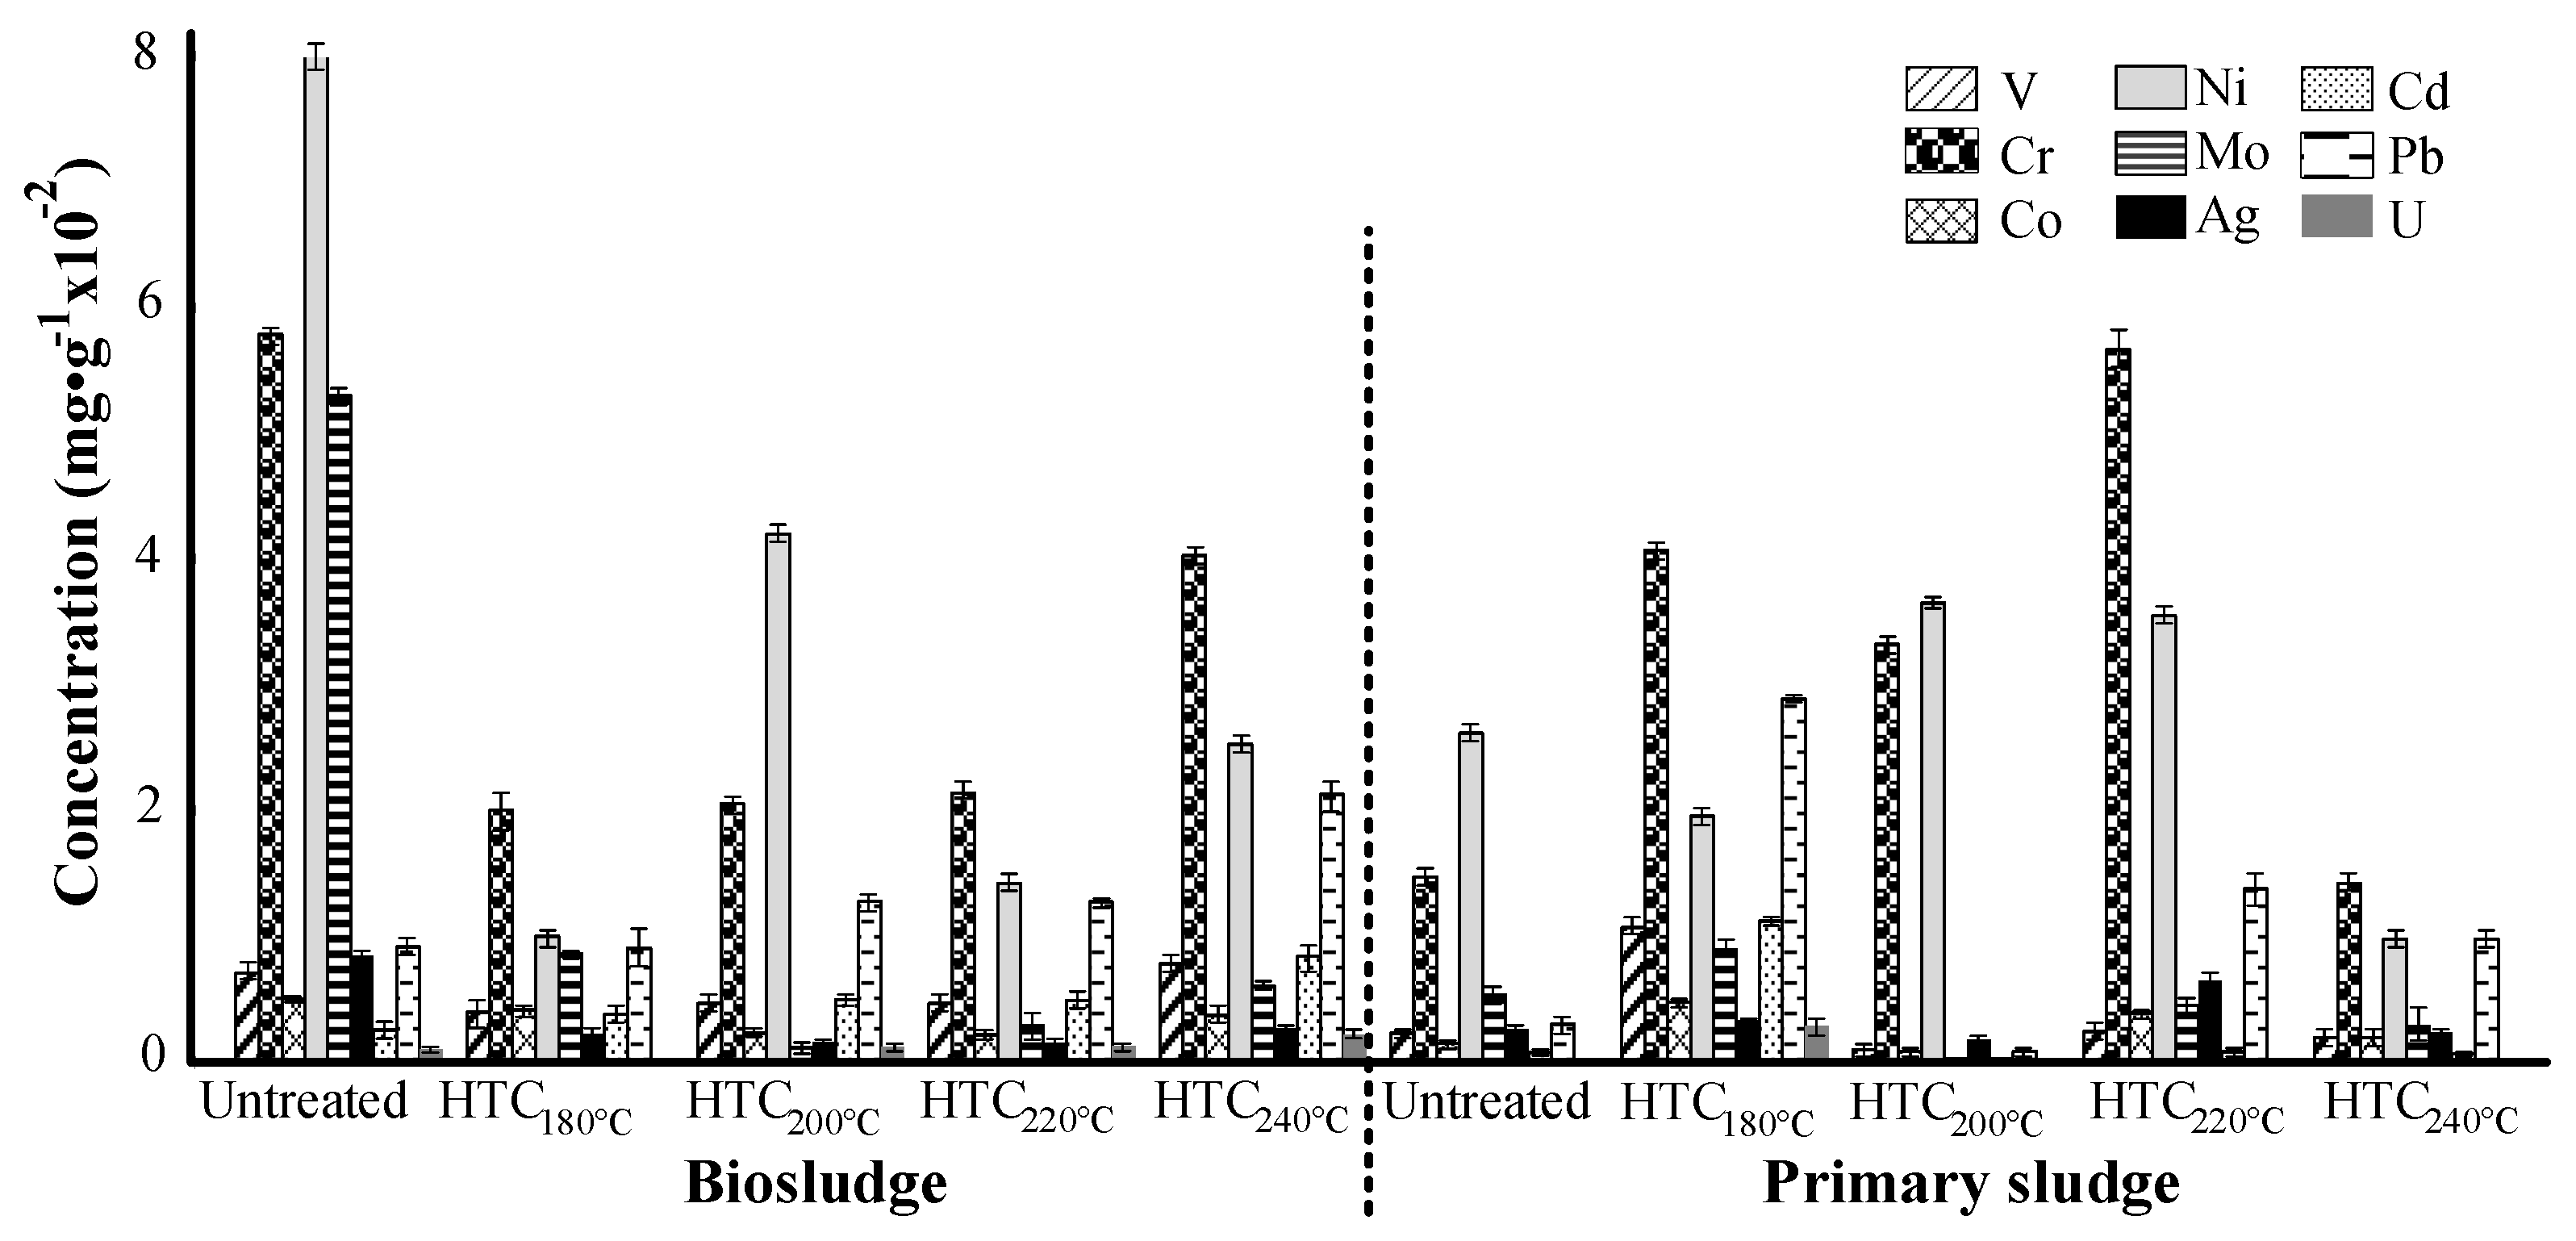
3.2. Inorganic Element Characterization

The concentrations of inorganic element traces including heavy metals are shown in Figure 3 and Figure 4. High concentrations of phosphorus, aluminium and sodium were detected in both samples, a similar trend was reported in [15,16]. Biosludge-derived hydrochar had clearly higher total concentrations of Na, Al, K, Si, P, Zn, Ni, Cr, Pb, Mo, V, Cd, Co, U and Ag than the primary sludge hydrochar, with the exceptions of Fe and V, Cd and Pb at HTC180°C. The HTC treatment concentrated several of these compounds, while others were removed from the final material. In general, the concentration of Na, Al, Fe, K, Si, P, Zn, Cd and Pb increases with HTC temperature severity in both sludge types, while most of the heavy metals were progressively removed. Interestingly, the P and Na in both PS and BS, and Si and Cr in PS, are initially concentrated at HTC180°C before being systematically removed with increasing reaction severity. The opposite behavior was observed for Si, Ni, Cr in BS and Al in PS, which are initially removed at HTC180°C to then be readsorbed by the hydrochar. The concentration variations in some of the HTC liquor inorganic element traces are shown in Figure 5, which allows us to explain the metal variation in the hydrochar composition. In HTC liquors, increased concentrations of Si, Mg, K, Fe (BS) and Al (PS) were observed at HTC180°C–200°C before being gradually removed at higher temperatures. Significant amounts of phosphorus in the hydrochar and aqueous phases indicate the presence of orthophosphate and long-chain polyphosphates. These have been determined to be the prevalent forms of phosphate in raw sludge, while inorganic orthophosphates are dominant after HTC [38]. Considering the increasing concentration of Al and Si, bonds between P and aluminosilicate or iron may be formed at low temperatures, and slowly removed at higher temperatures [38].
Sodium aluminum silicates may be found in the samples, which can cause fouling of the evaporators, while phosphorus can accumulate in the lime cycle and create the need for additional make-up lime [39]. However, recovery boilers used to incinerate the sludge produced in the mills are designed for combusting black liquor containing challenging components like chlorine, potassium and sodium; the process and materials are thus designed to accommodate challenging fuels. Moreover, HTC treatment can potentially reduce the corrosive components while enhancing energy efficiency by improving the characteristics of the sludge as a fuel, as shown in Table 1 for properties such as HHV and FCC, which increase with reaction severity, or ash and some inorganic compounds, which mainly decrease at HTC temperatures between 180 °C and 220 °C.
The significant reduction in heavy metals in the samples indicates the potential use of the hydrochar as a fertilizer, liming material, and soil conditioner [16]. The availability of its application would depend on the country’s regulations, which are typically established by the Ministry of Agriculture and Forestry, which sets the concentration limits of organic and inorganic materials in fertilizer products [7]. In Finland, the Finnish Fertilizer Product Act and Decree, and the Ministry of Agriculture and Forestry has set limit values for the maximum concentration of inorganics in fertilizer products [16]. Values of 0.015 mg g−1 for Cd, 0.3 mg g−1 for Cr, 0.1 mg g−1 for Ni, 0.1 mg g−1 for Pb and 1.5 mg g−1 for Zn are some of the concentration limits reported in [16]. This indicates that the samples investigated in this study may have potential use as a fertilizer. However further analysis and soil characterization where the fertilizer would be applied should be studied.

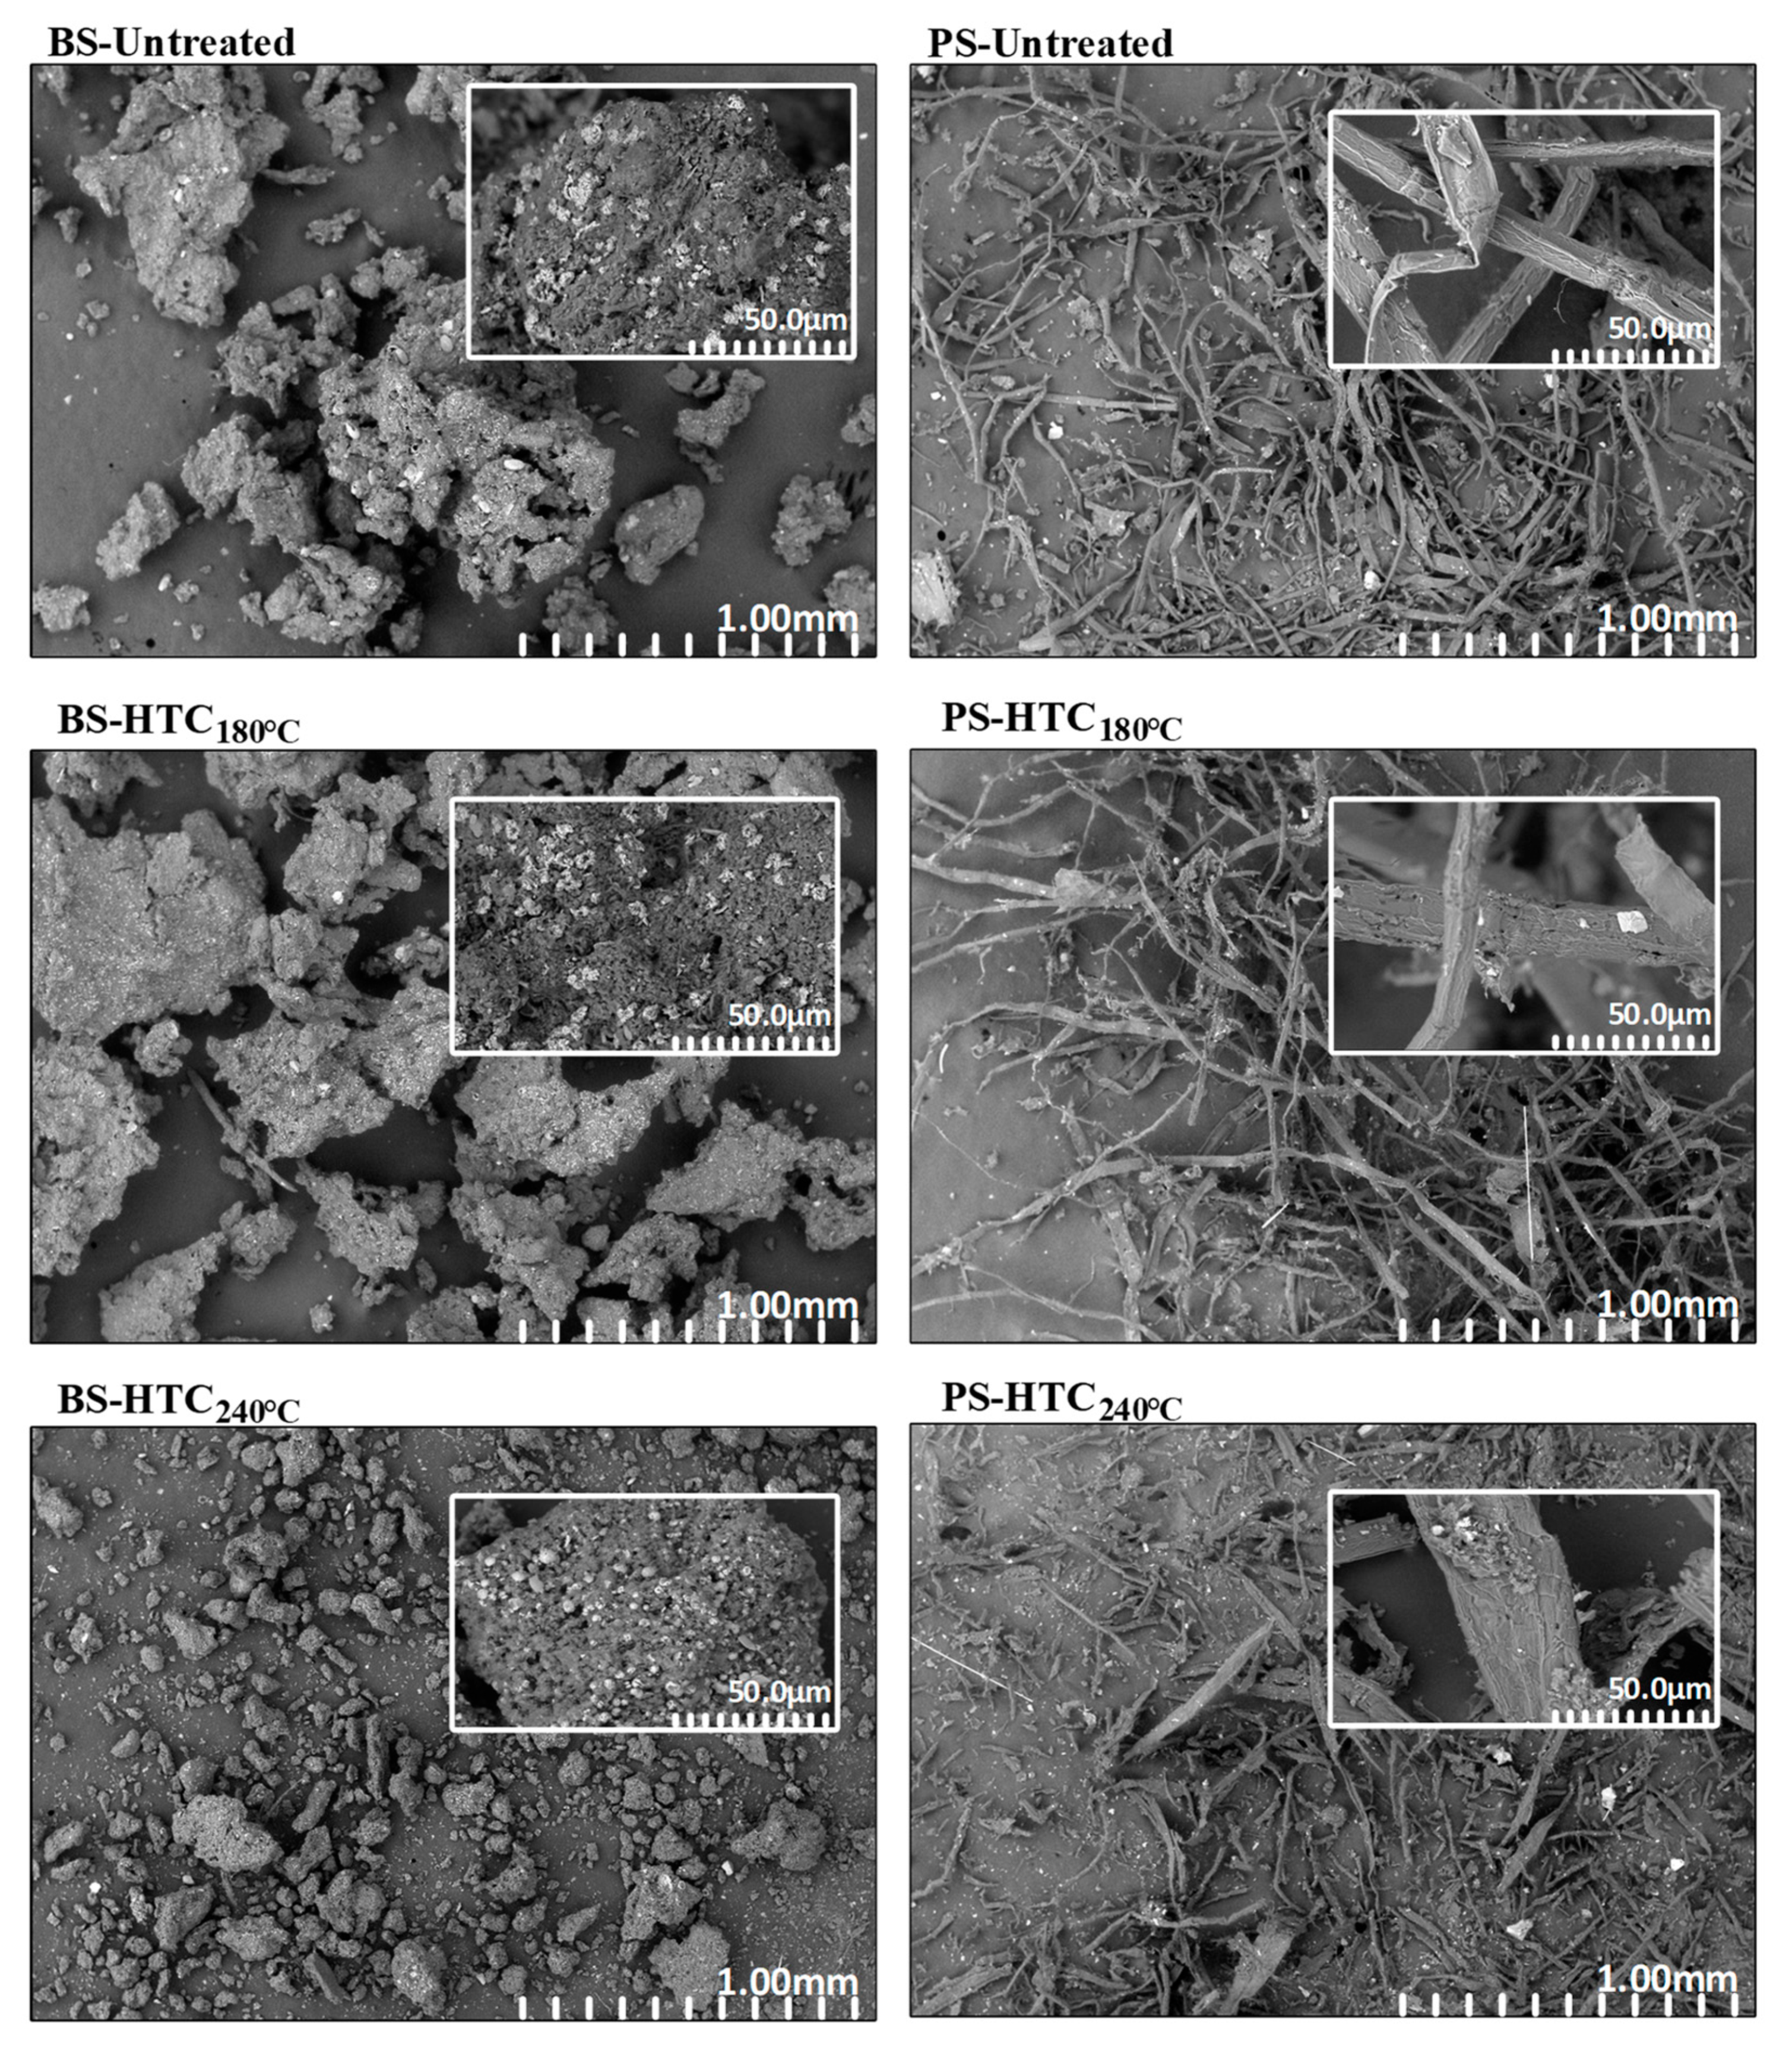
3.3. Morphology Analysis

The backscattered electron images of the untreated, HTC180°C and HTC240°C of biosludge and primary sludge are shown in Figure 6, providing the fiber characteristics and information on the integrity, structure and contaminants present in the samples. The PS samples present a fibrous morphology, consistent with results reported in [40] for primary sludge from paper mills. Long, smooth, and homogeneous fibers were mainly observed in untreated PS. Then, the fibers structure was slightly modified with HTC reaction severity to irregular cracked and shorter fibers. The fibers indicate the presence of lignocellulosic material, which can be observed in the XRD analysis with cellulose presence (Section 3.5) and in the FITR analysis with cellulose and lignin peaks (Figure 7). This was also found in previously published findings for thermochemical treatment of pulp mill sludge [41,42]. Aggregates of mineral particles were detected in all PS samples. Moreover, a slight reduction in the inorganic compounds on the surface of the PS treated at HTC180°C was observed.
Biosludge BES images showed amorphous particles [26,42], which were clearly fragmented with reaction severity. Aggregates of mineral particles were found mainly in untreated BS and HTC240°C, suggesting a reduction in mineral compounds at lower HTC reaction temperatures (180–200 °C) in the hydrochar, as explained in the previous section and observed in Figure 3, Figure 4 and Figure 5. For BS and PS, the highest surface areas were found at lower HTC reaction temperatures (180 °C), with a decrease at 240 °C likely due to condensing aromatic structure and pore collapse [42]. The adsorption–desorption loop and higher acidic concentration medium caused by HTC temperature increment may also affect the expansion in pore size at higher HTC temperatures [42,43]. The pores’ structure may absorb inorganic compounds, a fact that explains the increase in some elements analyzed in Section 3.2 and pore stress, which leads to surface area reduction. In general, the changes in BS and PS morphology may be associated with devolatilization and dehydration of sludges’ compounds, which also explain the fragmentation of the samples with increasing temperature.

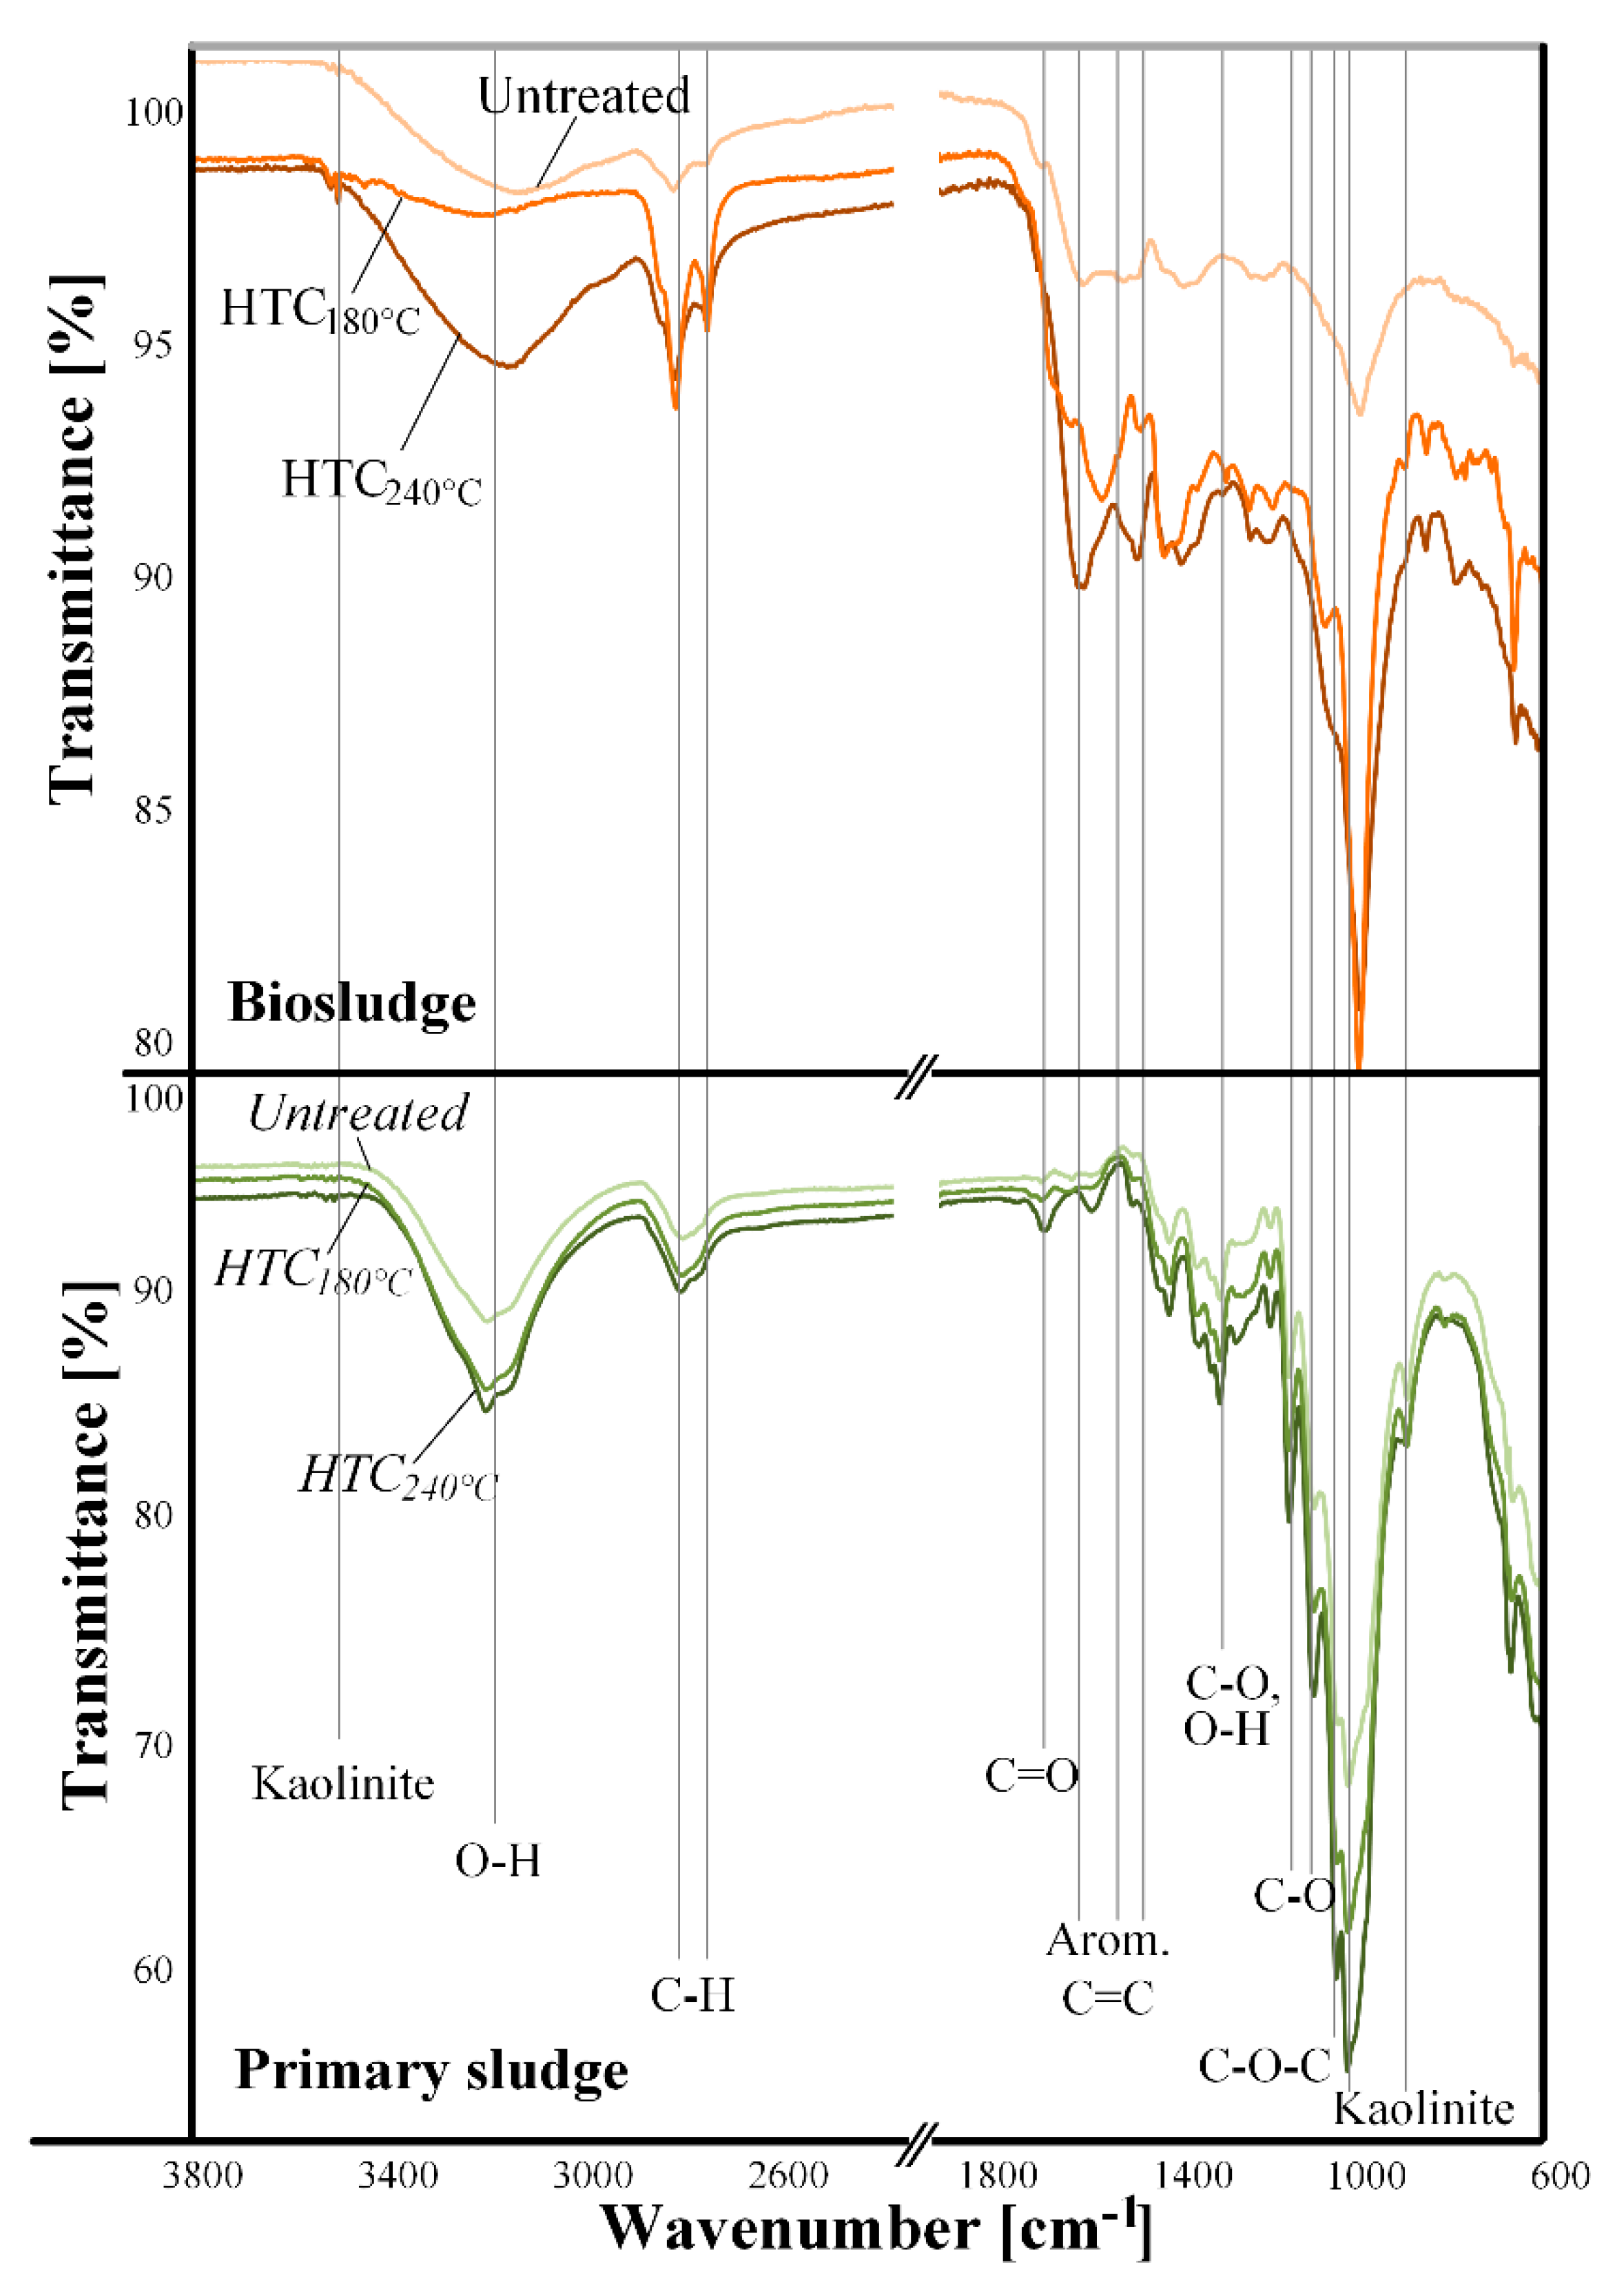
3.4. Surface Characterization

Biosludge and primary sludge are composed of a mixture of organic and inorganic components, of which some are stable under HTC conditions, while others react and form hydroxyls, alkyls, ethers, amines, among others. To analyze this, FTIR was used to examine the surface composition of the feedstock and produced hydrochar. The samples’ unique FTIR spectra are shown in Figure 7. For sludge, the O-H and CH3/CH2 stretching band at ~ 3300 cm−1, ~2900 cm−1 and ~2850 cm−1 and a large band comprised of several peaks at ~ 1700–~1030 cm−1 were reported in [42]. This large band is associated with C-O- linkages in cellulose and to a lesser extent in lignin. The spectra showed peaks between 1500 cm−1 and 1600 cm−1, and 1100 cm−1 and 1300 cm−1, indicating the presence of C=C aromatic compounds and C-O ring configurations, especially in biosludge. This may indicate the presence of lignin [42]. Resonances between 3200 cm−1 and 3600 cm−1 are attributed to hydroxyl groups of cellulose [40]. Peaks in bands at 1270 cm−1, 1110 cm−1 and 1160 cm−1 corresponding to C-O-C, and at 1055 cm−1 and 1160 cm−1 to C-O and O-H, respectively [40], were more intensive in primary sludge. This suggests that PS predominately contains cellulosic materials, while BS contains mainly lignin. Kaolinite was also observed in the samples at resonances of 3620 cm−1, 1030 cm−1 and 912 cm−1 [42]. Kaolinite is commonly used as an additive in the pulping industry [21].
The FTIR spectra increased in intensity with increasing HTC temperature [42]. Minor changes were observed at HTC180°C in the PS hydrochar, but at HTC180°C–240°C, BS peaks between 1100 cm−1 and 1700 cm−1 associated with C=O groups, significantly increase. The main changes occurred from the increase in vibrations associated with aromatic functionalities [42]. The increase in the reaction severity and the tendency of the peaks to maintain their shape suggest carbonization or repolymerization of organic species from the water onto the surface of the hydrochar [42]. The temperatures used in the HTC experiments are usually enough to degrade cellulosic compounds, but the C-O-C and C-OH functionalities were not completely affected during the 3 h residence time.

3.5. X-ray Diffractograms

The XRD for both untreated and HTC200°C of biosludge and primary sludge are shown in Figure 8. Samples at HTC200°C were selected to compare significant differences with the untreated sample. However, no significant difference was observed. For the BS samples, the same spectra for untreated and HTC200°C were obtained. Sharp peaks confirm the presence of crystalline material [41]; however, a low crystallinity size of about 1 nm for BS and a larger size for PS of about 4.6 nm, were observed. The presence of cellulose was confirmed in PS, showing the strongest peaks at 2θ = 12.6° and 2θ = 22.5° with approximately 88% of cellulose 1β linkages. The mineral fraction was predominantly composed of calcite, observed in the sharp peaks at 2θ = 26.9° and 2θ = 28.8° for BS and PS. Similar results were reported in [40] for pulp mill sludges.

3.6. HTC Liquor Characterization

The HTC liquor phase influences the physical and chemical structure of the feedstock by acting as a reaction medium during the thermochemical conversion process of the sludge. Significant quantities of organic and inorganic compounds, mainly sugars, organic acids, heavy metals among other components are found in the sludge and HTC liquor, which may react along the HTC process, generating an impact on the properties on the final products [23]. Quantification of the HTC liquor inorganic compounds from HTC treatment of BS and PS is presented in Figure 6; pH values, NVR, TOC and COD of the feedstock and HTC liquors are shown in Table 2.
Total organic carbon, total carbon and inorganic carbon were higher in the primary sludge than in the secondary sludge, mainly due to higher fibrous content and less mineralized PS. The high TOC content in both sludges, also reported in [23], indicates that these residues may act as a source of carbon. The COD was significantly higher in PS than BS. According to the EU Council Directive 91/271/EEC limit regulation on the discharge of effluents, COD should be under 125 mg∙L−1 [44]. The feedstock and HTC liquor of BS, and the feedstock of PS are under the limit values. However, COD tends to increase with reaction severity in the hydrochar produced from PS, thus exceeding the regulation limit.
As a general trend, NVR increases with reaction severity for PS, although it decreases slightly at HTC240°C. For BS, similar values were observed at the considered temperatures. The NVR increase is the result of non-volatile organic products failing to break down into non-condensable gases and remaining in the liquor. The trends in the HTC liquor results are in accordance with those reported in Mäkelä et al. [23] for sludge from a pulp and board mill. The pH results show decreasing values with increasing reaction severity. The decomposition of organic compounds during HTC generates organic acids, which lower the pH and can further catalyze hydrolysis and decarboxylation reactions if recirculated in the process.

4. Conclusions

The relatively low thermal properties of pulp and paper mill sludges, such as high moisture and volatiles content, the low percentage of fixed carbon and low calorific value make it an extremely problematic fuel for energy generation. Hydrothermal carbonization technology improves the characteristics of primary and secondary sludges of pulp and paper mills in an efficient way by improving their hydrophobicity, heating value and energy density ratios. The following findings and conclusions were drawn:
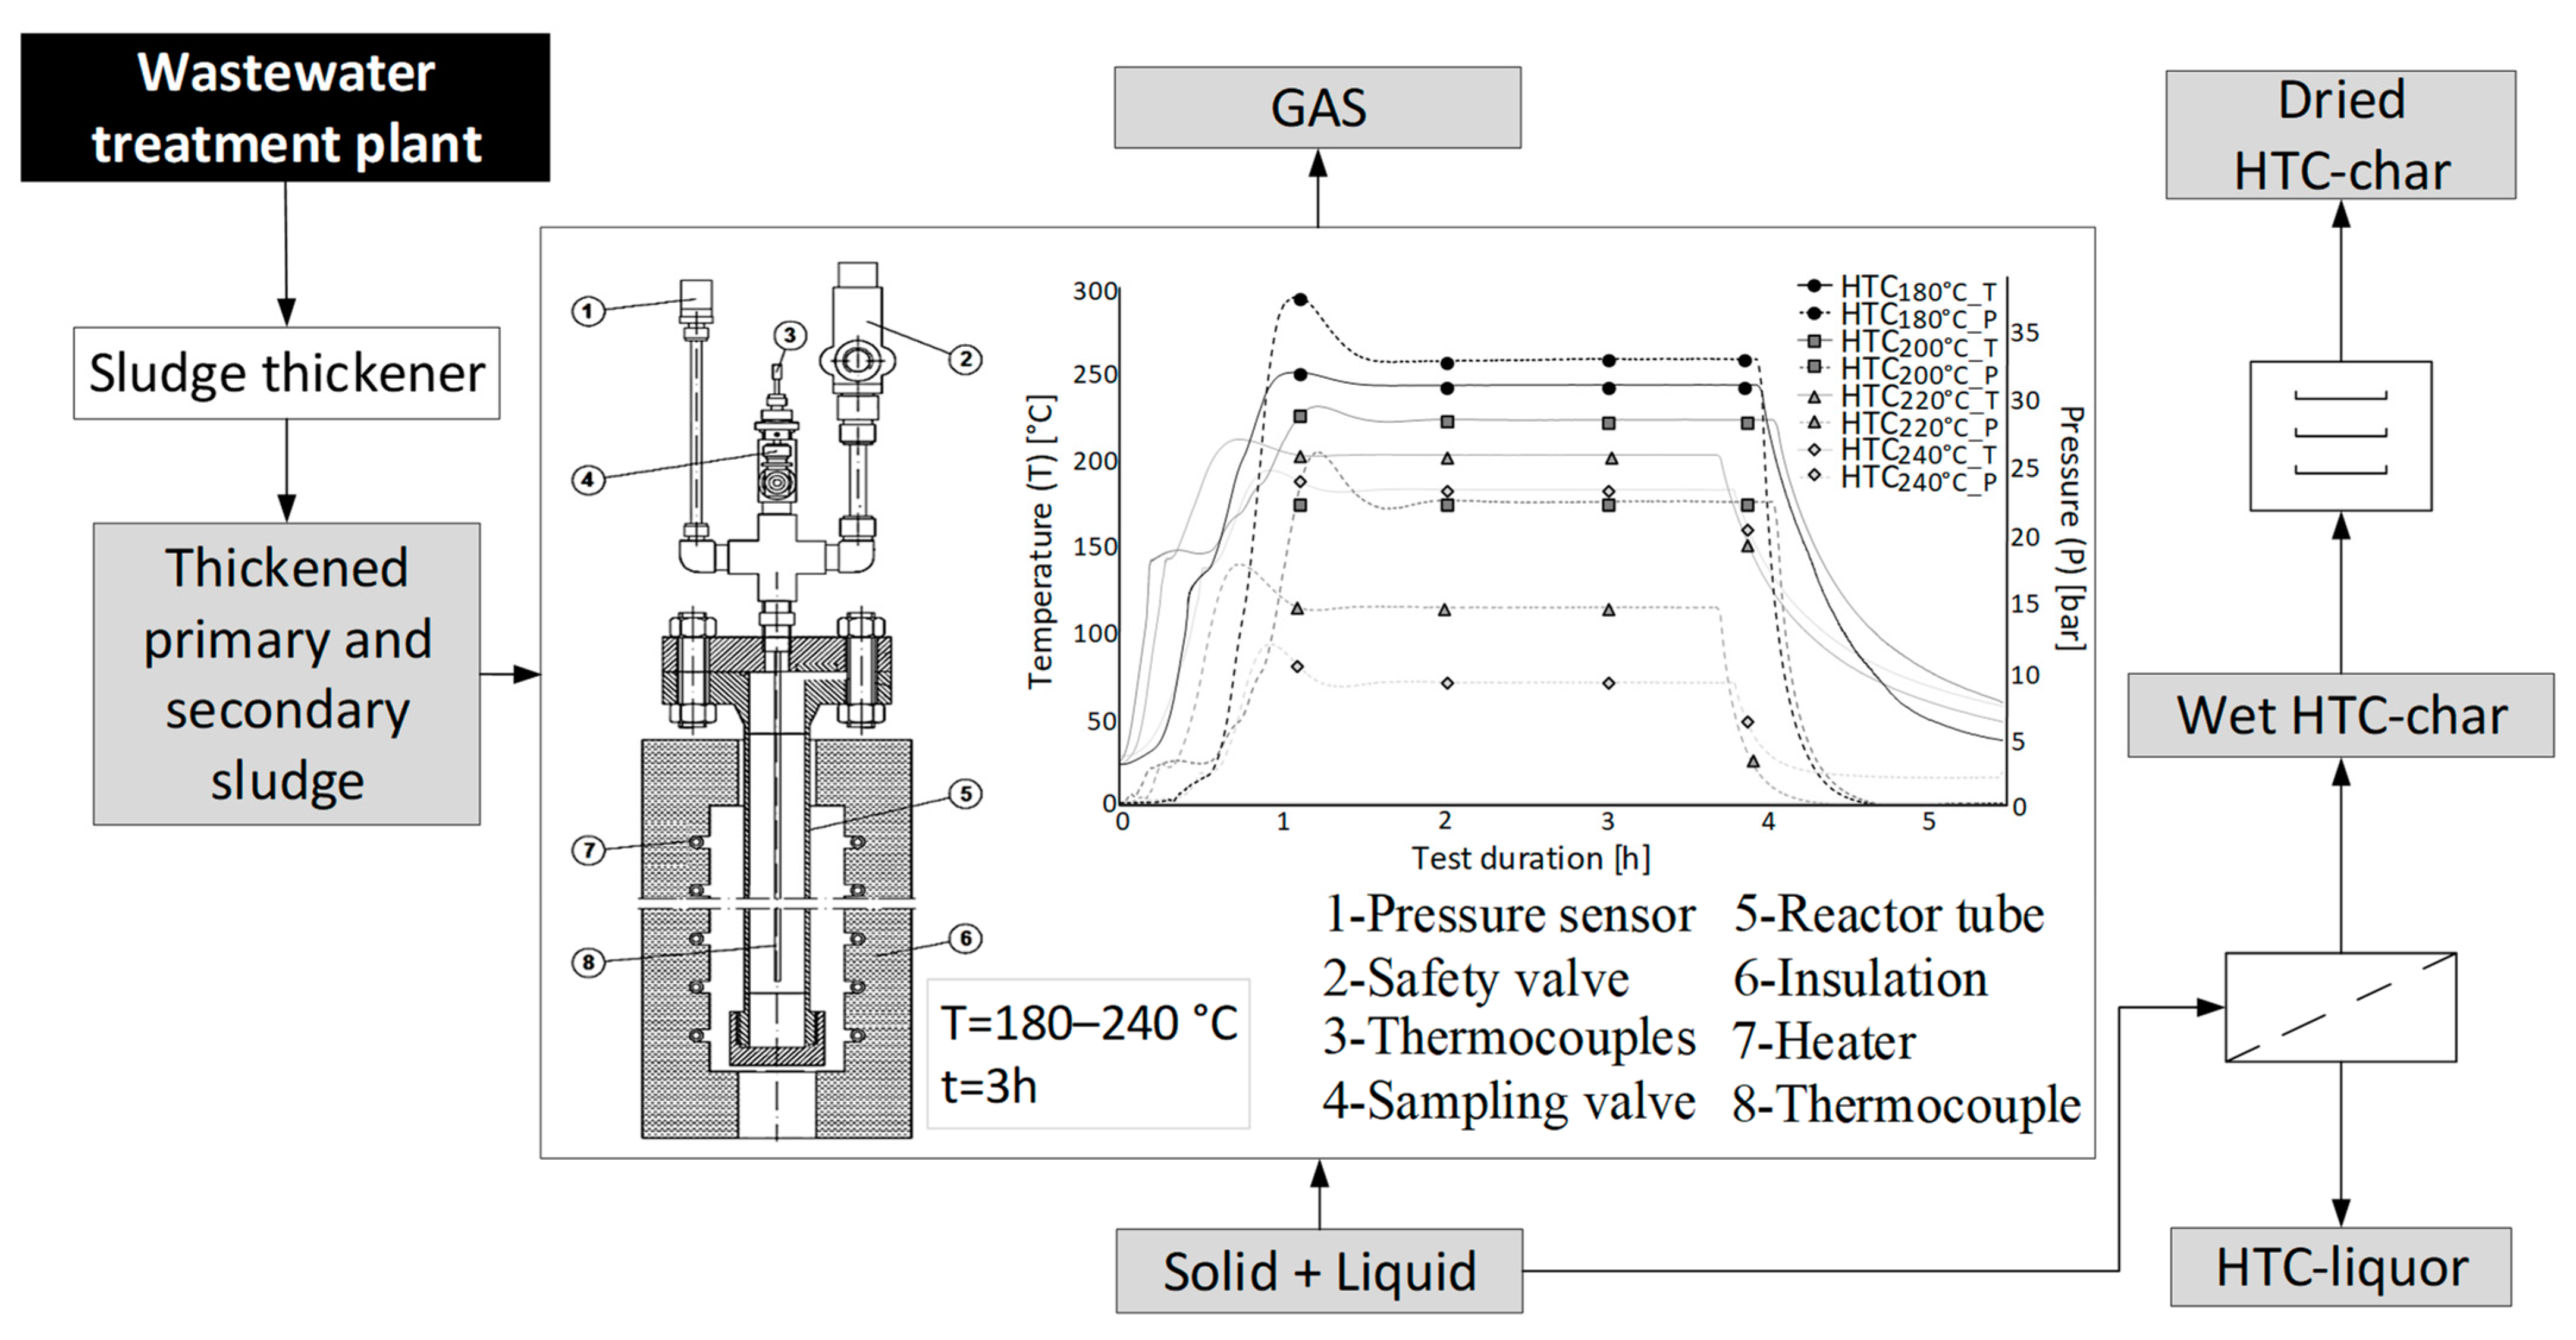
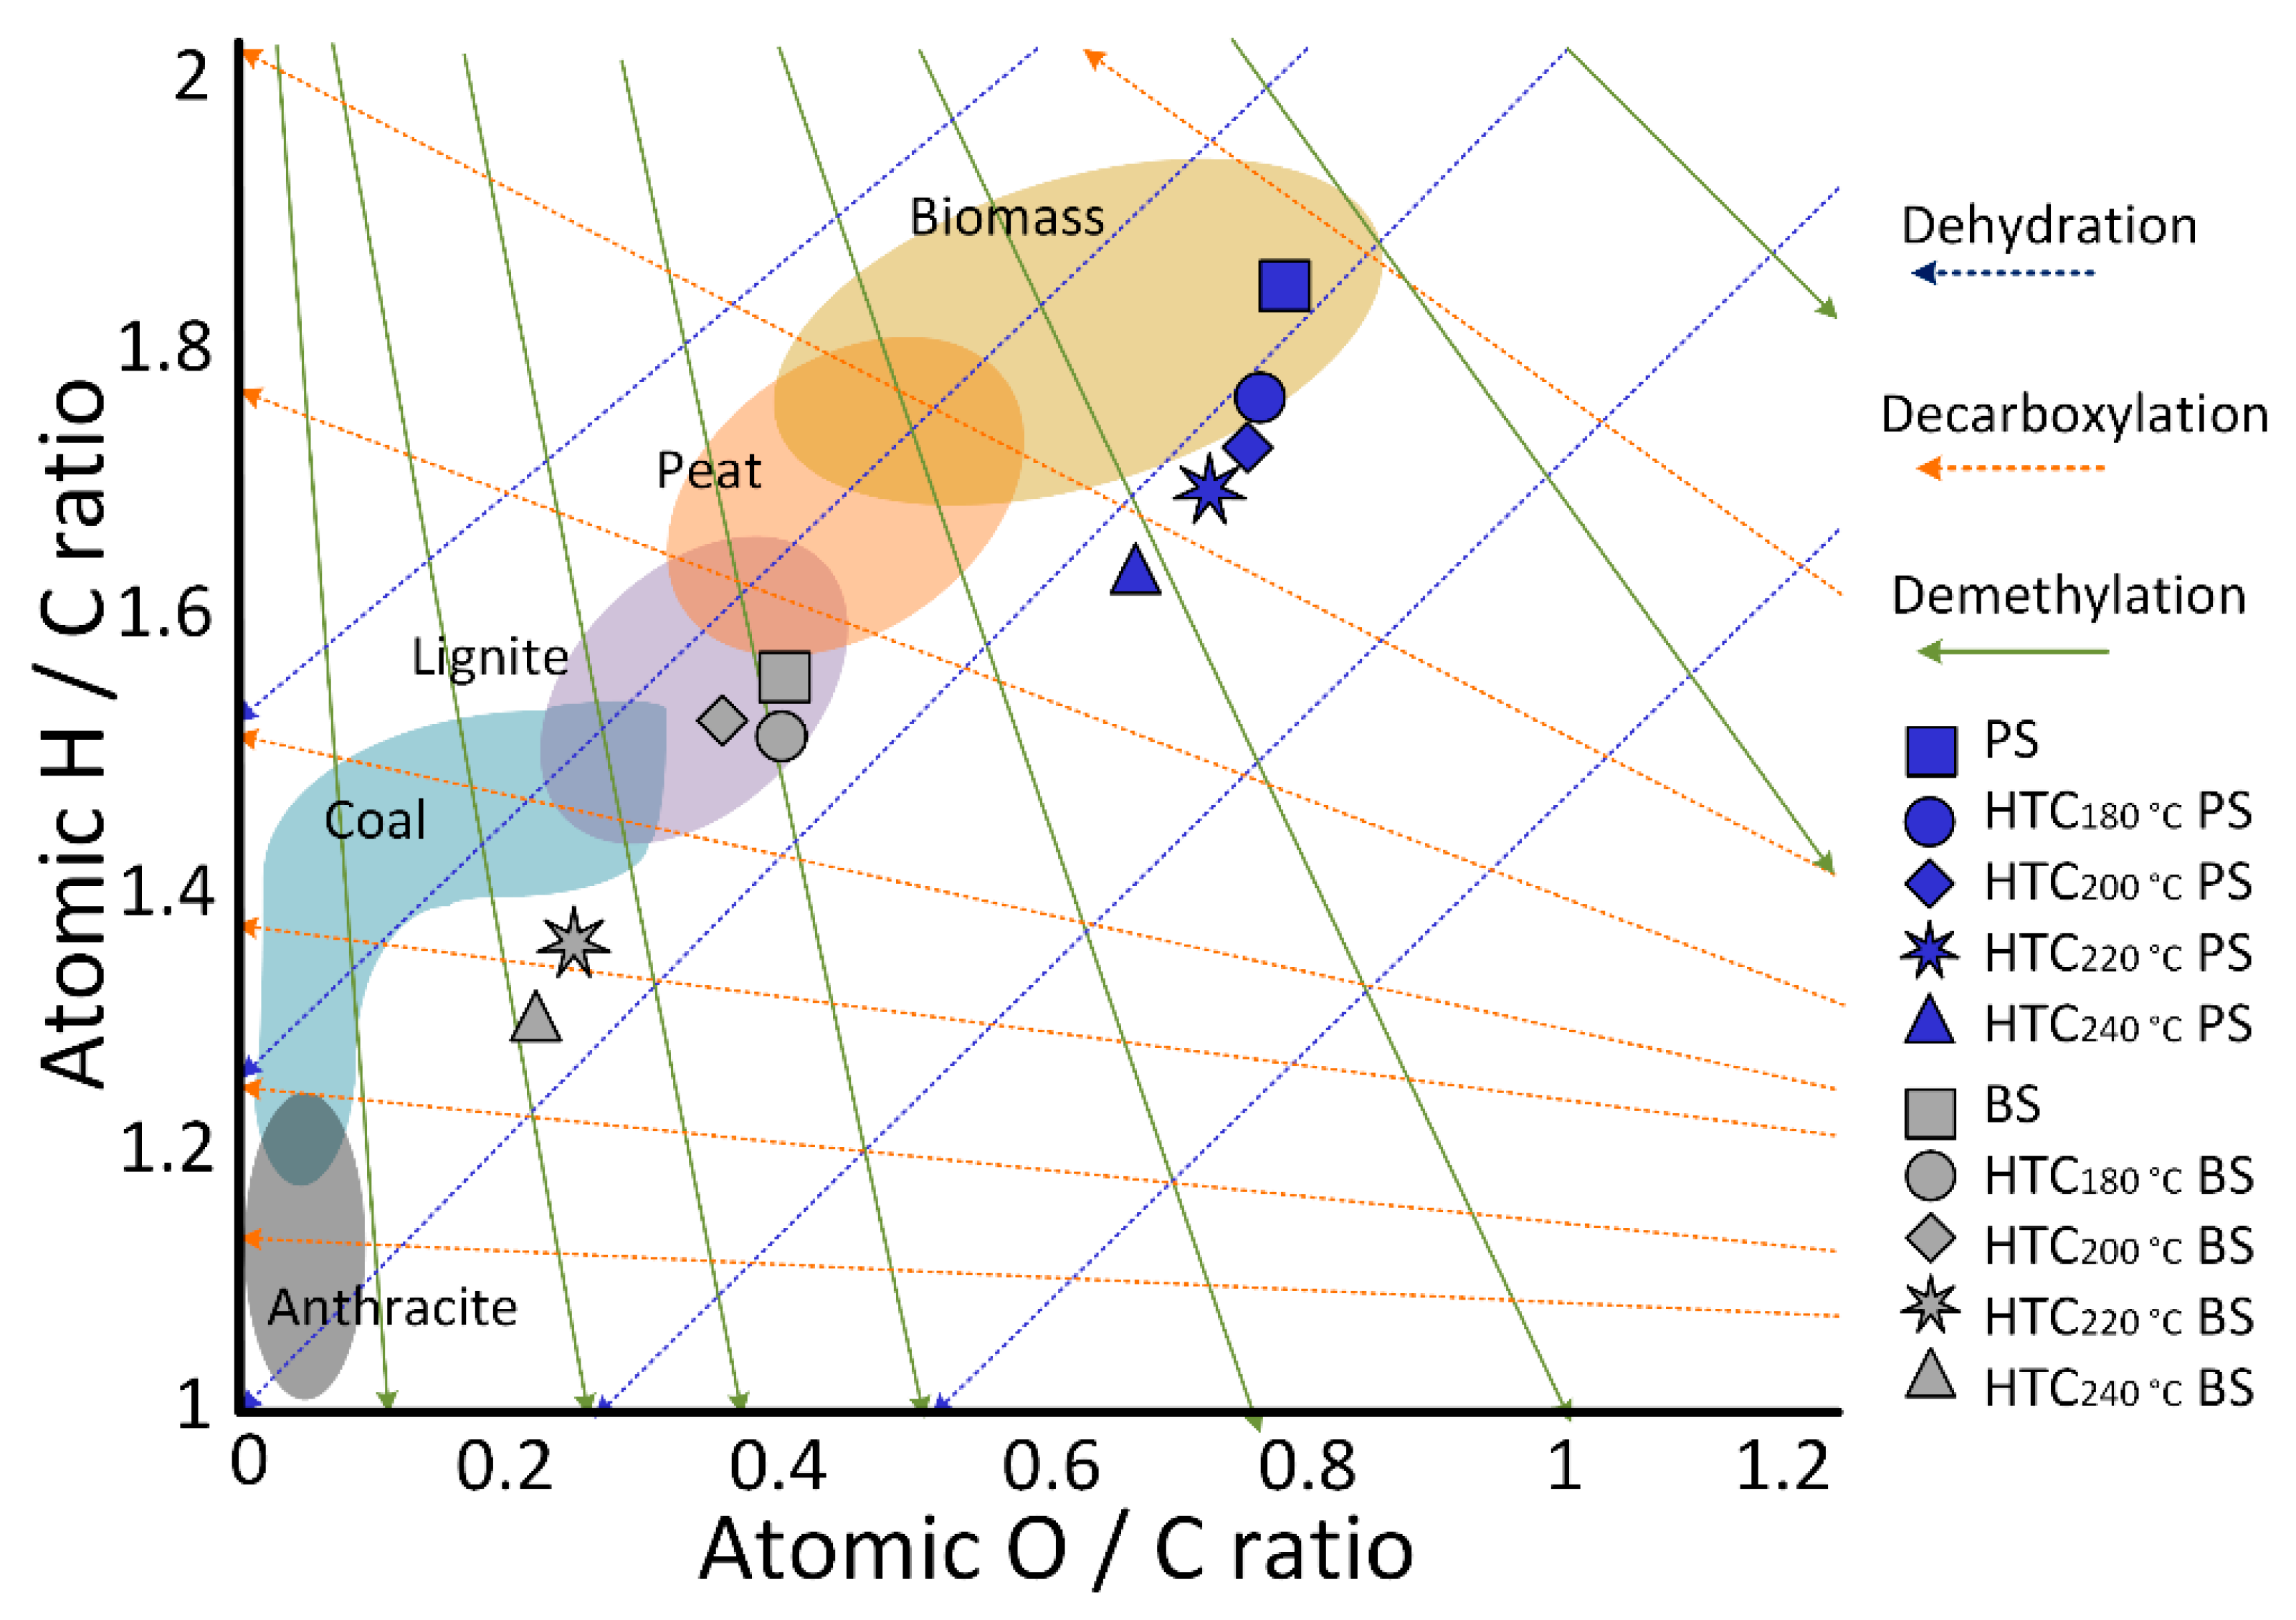
  • Dehydration and demethylation reactions are the dominant pathways with increasing hydrothermal carbonization temperatures for both biosludge and primary sludge samples, while the role of decarboxylation had a relatively small effect.
  • In general, sludge from pulp and paper mills contains a significant amount of inorganic compounds, such as aluminum, silica, zinc and potassium. However, the samples reported lower concentrations than the Finnish legislation limits for their possible soil applications.
  • The backscattered electron images analysis showed fibrous and amorphous particle morphologies for primary sludge and biosludge, respectively. The materials were degraded to irregular cracked and shorter fibers for primary sludge and fragmented particles for biosludge with hydrothermal carbonization reaction severity.
  • X-ray diffractograms reported a crystallinity size of 1 nm for biosludge with mainly peaks of calcite. A crystallinity size of about 4.6 nm for primary sludge was found with high peaks of crystalline cellulose. FTIR analysis showed that the main organic component of the sludges was cellulose due to a large band associated with C-O- linkages and to a lesser extent, lignin.
  • The liquor produced in the hydrothermal treatment showed higher amounts of organic compounds for all primary sludge samples, mainly due to its higher fibrous content and less mineralized material. Inorganic material tends to increase at lower hydrothermal treatment temperatures, mainly at 180 °C for biosludge and 200 °C for primary sludge due to minerals transferred from the solid phase.

Author Contributions

Conceptualization, methodology, validation, data curation, and investigation C.L.M.M. and E.S.; writing—original draft preparation, C.L.M.M.; writing—review and editing, C.L.M.M., E.S. and E.V.; supervision, project administration, and funding acquisition, E.V. All authors have read and agreed to the published version of the manuscript.

Funding

This research was funded by the Academy of Finland project “Role of Forest Industry Transformation in Energy Efficiency Improvement and Reducing CO2 Emissions”, grant number 315019.

Institutional Review Board Statement

Not applicable.

Informed Consent Statement

Not applicable.

Acknowledgments

The authors highly appreciate the support from Jussi Saari for his help with the English language improvement and gratefully acknowledge the assistance of Jordan Banks in the HTC experiments.

Conflicts of Interest

The authors declare no conflict of interest.

References

  1. Puettmann, M.; Sahoo, K.; Wilson, K.; Oneil, E. Life cycle assessment of biochar produced from forest residues using portable systems. J. Clean. Prod. 2020, 250, 119564. [Google Scholar] [CrossRef]
  2. Mendoza Martinez, C.L.C.L.; Sermyagina, E.; de Oliveira Carneiro, A.C.; Vakkilainen, E.; Cardoso, M.; de Cassia Oliveira Carneiro, A.; Vakkilainen, E.; Cardoso, M. Production and characterization of coffee-pine wood residues briquettes as an alternative fuel for local firing systems in Brazil. Biomass Bioenergy 2019, 123, 70–77. [Google Scholar] [CrossRef]
  3. Mendoza Martinez, C.L.; Sermyagina, E.; Saari, J.; de Silva Jesus, M.; Cardoso, M.; de Matheus Almeida, G.; Vakkilainen, E. Hydrothermal carbonization of lignocellulosic agro-forest based biomass residues. Biomass Bioenergy 2021, 147, 106004. [Google Scholar] [CrossRef]
  4. Veluchamy, C.; Kalamdhad, A.S. Biochemical methane potential test for pulp and paper mill sludge with different food/microorganisms ratios and its kinetics. Int. Biodeterior. Biodegrad. 2017, 117, 197–204. [Google Scholar] [CrossRef]
  5. CANMET. Pulp and Paper Sludge to Energy—Preliminary Assessment of Technologies, Canada; CANMET Energy Technology Center: Ottawa, ON, Canada, 2005. [Google Scholar]
  6. Simão, L.; Hotza, D.; Raupp-Pereira, F.; Labrincha, J.A.; Montedo, O.R.K. Wastes from pulp and paper mills-A review of generation and recycling alternatives. Ceramica 2018, 64, 443–453. [Google Scholar] [CrossRef] [Green Version]
  7. Monte, M.C.; Fuente, E.; Blanco, A.; Negro, C. Waste management from pulp and paper production in the European Union. Waste Manag. 2009, 29, 293–308. [Google Scholar] [CrossRef] [PubMed] [Green Version]
  8. Mäkelä, M.; Watkins, G.; Pöykiö, R.; Nurmesniemi, H.; Dahl, O. Utilization of steel, pulp and paper industry solid residues in forest soil amendment: Relevant physicochemical properties and heavy metal availability. J. Hazard. Mater. 2012, 207, 21–27. [Google Scholar] [CrossRef]
  9. Saha, N.; Saba, A.; Saha, P.; McGaughy, K.; Franqui-Villanueva, D.; Orts, W.J.; Hart-Cooper, W.M.; Toufiq Reza, M. Hydrothermal carbonization of various paper mill sludges: An observation of solid fuel properties. Energies 2019, 12, 858. [Google Scholar] [CrossRef] [Green Version]
  10. Mäkelä, M.; Benavente, V.; Fullana, A. Hydrothermal carbonization of lignocellulosic biomass: Effect of process conditions on hydrochar properties. Appl. Energy 2015, 155, 576–584. [Google Scholar] [CrossRef]
  11. Saari, J.; Kuparinen, K.; Sermyagina, E.; Vakkilainen, E.; Kaikko, J.; Sergeev, V. Effect of integration method and carbonization temperature on the performance of an integrated hydrothermal carbonization and CHP plant. BioResources 2019, 13, 5080–5110. [Google Scholar]
  12. Stemann, J.; Putschew, A.; Ziegler, F. Hydrothermal carbonization: Process water characterization and effects of water recirculation. Bioresour. Technol. 2013, 143, 139–146. [Google Scholar] [CrossRef]
  13. Wirth, B.; Reza, T.; Mumme, J. Influence of digestion temperature and organic loading rate on the continuous anaerobic treatment of process liquor from hydrothermal carbonization of sewage sludge. Bioresour. Technol. 2015, 198, 215–222. [Google Scholar] [CrossRef]
  14. Jaria, G.; Silva, C.P.; Ferreira, C.I.A.; Otero, M.; Calisto, V. Sludge from paper mill effluent treatment as raw material to produce carbon adsorbents: An alternative waste management strategy. J. Environ. Manag. 2017, 188, 203–211. [Google Scholar] [CrossRef] [Green Version]
  15. Gorzin, F.; Bahri Rasht Abadi, M.M. Adsorption of Cr(VI) from aqueous solution by adsorbent prepared from paper mill sludge: Kinetics and thermodynamics studies. Adsorpt. Sci. Technol. 2018, 36, 149–169. [Google Scholar] [CrossRef]
  16. Pöykiö, R.; Watkins, G.; Dahl, O. Characterization of primary and secondary wastewater treatment sludge from a pulp and board mill complex to evaluate the feasibility of utilization as a soil amendment agent and a fertilizer product. J. Bioresour. Bioprod. 2018, 3, 88–95. [Google Scholar]
  17. Fahim, S.; Nisar, N.; Ahmad, Z.; Asghar, Z.; Said, A.; Atif, S.; Ghani, N.; Qureshi, N.; Soomro, G.A.; Iqbal, M.; et al. Managing paper and pulp industry by-product waste utilizing sludge as a bio-fertilizer. Pol. J. Environ. Stud. 2019, 28, 83–90. [Google Scholar] [CrossRef]
  18. Xu, J.; Liao, Y.; Yu, Z.; Cai, Z.; Ma, X.; Dai, M.; Fang, S. Co-combustion of paper sludge in a 750 t/d waste incinerator and effect of sludge moisture content: A simulation study. Fuel 2018, 217, 617–625. [Google Scholar] [CrossRef]
  19. Grimm, A.; Etula, J.; Salh, R.; Kalén, G.; Segerström, M.; Brücher, J.; Söderberg, C.; Soukup, D.; Pfeifer, C.; Larsson, S.H. Slagging and fouling characteristics during co-combustion of Scots pine bark with low-temperature dried pulp and paper mill chemical sludge. Fuel Process. Technol. 2019, 93, 282–294. [Google Scholar] [CrossRef]
  20. Lin, Y.; Ma, X.; Peng, X.; Hu, S.; Yu, Z.; Fang, S. Effect of hydrothermal carbonization temperature on combustion behavior of hydrochar fuel from paper sludge. Appl. Therm. Eng. 2015, 91, 574–582. [Google Scholar] [CrossRef]
  21. Mäkelä, M.; Benavente, V.; Fullana, A. Hydrothermal carbonization of industrial mixed sludge from a pulp and paper mill. Bioresour. Technol. 2016, 200, 444–450. [Google Scholar] [CrossRef] [PubMed] [Green Version]
  22. Green. Making Wet Waste Valuable. Available online: https://www.c-green.se/ (accessed on 27 December 2020).
  23. Mäkelä, M.; Forsberg, J.; Söderberg, C.; Larsson, S.H.; Dahl, O. Process water properties from hydrothermal carbonization of chemical sludge from a pulp and board mill. Bioresour. Technol. 2018, 263, 654–659. [Google Scholar] [CrossRef] [PubMed]
  24. Song, E.; Park, S.; Kim, H. Upgrading Hydrothermal Carbonization (HTC) Hydrochar from Sewage Sludge. Energies 2019, 12, 2383. [Google Scholar] [CrossRef] [Green Version]
  25. Sermyagina, E.; Saari, J.; Kaikko, J.; Vakkilainen, E. Hydrothermal carbonization of coniferous biomass: Effect of process parameters on mass and energy yields. J. Anal. Appl. Pyrolysis 2015, 113, 551–556. [Google Scholar] [CrossRef]
  26. Wilk, M.; Magdziarz, A.; Jayaraman, K.; Szymańska-Chargot, M.; Gökalp, I. Hydrothermal carbonization characteristics of sewage sludge and lignocellulosic biomass. A comparative study. Biomass Bioenergy 2019, 120, 166–175. [Google Scholar] [CrossRef]
  27. Mohammed, I.S.; Na, R.; Kushima, K.; Shimizu, N. Investigating the effect of processing parameters on the products of hydrothermal carbonization of corn stover. Sustainability 2020, 12, 5100. [Google Scholar] [CrossRef]
  28. Li, W.; Li, Q.; Zhang, Y.; Meng, A. Ashing temperature’s impact on the characteristics of biomass ash. Appl. Mech. Mater. 2013, 261–262, 217–223. [Google Scholar] [CrossRef]
  29. Freitas, A.J.; Costa, A.C.S.; Oliveira, A.C.; Pereira, B.L.C.; Rocha, M.F.V.; Carneiro, A.C.O. Efeito da Pressão e do Tempo de Compactação nas Propriedades de Briquetes de Resíduos Madeireiros de Paricá. Nativa 2016, 4, 380–385. [Google Scholar] [CrossRef] [Green Version]
  30. Meyer, T.; Amin, P.; Allen, D.G.; Tran, H. Dewatering of pulp and paper mill biosludge and primary sludge. J. Environ. Chem. Eng. 2018, 6, 6317–6321. [Google Scholar] [CrossRef]
  31. Dyjakon, A.; Noszczyk, T.; Smȩdzik, M. The influence of torrefaction temperature on hydrophobic properties ofwaste biomass from food processing. Energies 2019, 12, 4609. [Google Scholar] [CrossRef] [Green Version]
  32. Falco, C.; Baccile, N.; Titirici, M.-M. Morphological and structural differences between glucose, cellulose and lignocellulosic biomass derived hydrothermal carbons. Green Chem. 2011, 13, 3273–3281. [Google Scholar] [CrossRef] [Green Version]
  33. Mäkelä, M.; Yoshikawa, K. Simulating hydrothermal treatment of sludge within a pulp and paper mill. Appl. Energy 2016, 173, 177–183. [Google Scholar] [CrossRef]
  34. Mendoza Martinez, C.L.; Saari, J.; Melo, Y.; Cardoso, M.; de Almeida, G.M.; Vakkilainen, E. Evaluation of thermochemical routes for the valorization of solid coffee residues to produce biofuels: A Brazilian case. Renew. Sustain. Energy Rev. 2021, 137, 110585. [Google Scholar]
  35. Engida, T.; Mekonnen, A.; Wu, J.M.; Xu, D.; Wu, Z.B. Review paper on beverage agro-industrial wastewater treatment plant bio-sludge for fertilizer potential in Ethiopa. Appl. Ecol. Environ. Res. 2020, 18, 33–57. [Google Scholar] [CrossRef]
  36. Timpe, R.C.; Mann, M.D.; Pavlish, J.H.; Louie, P.K.K. Organic sulfur and hap removal from coal using hydrothermal treatment. Fuel Process. Technol. 2001, 73, 127–141. [Google Scholar] [CrossRef]
  37. Gendek, A. Combustion heat and calorific value of the mix of sawdust and cones of common pine (Pinus sylvestris L.). Ann. Warsaw Univ. Life Sci.-SGGW Agric. 2015, 66, 137–144. [Google Scholar]
  38. Huang, R.; Tang, Y. Speciation Dynamics of Phosphorus during (Hydro)Thermal Treatments of Sewage Sludge. Environ. Sci. Technol. 2015, 49, 14466–14474. [Google Scholar] [CrossRef]
  39. Aho, M.; Yrjas, P.; Taipale, R.; Hupa, M.; Silvennoinen, J. Reduction of superheater corrosion by co-firing risky biomass with sewage sludge. Fuel 2010, 89, 2376–2386. [Google Scholar] [CrossRef]
  40. Méndez, A.; Fidalgo, J.M.; Guerrero, F.; Gascó, G. Characterization and pyrolysis behaviour of different paper mill waste materials. J. Anal. Appl. Pyrolysis 2009, 86, 66–67. [Google Scholar] [CrossRef]
  41. Devi, P.; Saroha, A.K. Effect of temperature on biochar properties during paper mill sludge pyrolysis. Int. J. ChemTech Res. 2013, 5, 682–687. [Google Scholar]
  42. Niinipuu, M.; Latham, K.G.; Boily, J.F.; Bergknut, M.; Jansson, S. The impact of hydrothermal carbonization on the surface functionalities of wet waste materials for water treatment applications. Environ. Sci. Pollut. Res. 2020, 27, 24369–24379. [Google Scholar] [CrossRef]
  43. Bai, K.; Hao, J.; Yang, Y.; Qian, A. The effect of hydrothermal temperature on the properties of SBA-15 materials. Heliyon 2020, 6, e04436. [Google Scholar] [CrossRef]
  44. Coimbra, R.N.; Calisto, V.; Ferreira, C.I.A.; Esteves, V.I.; Otero, M. Removal of pharmaceuticals from municipal wastewater by adsorption onto pyrolyzed pulp mill sludge. Arab. J. Chem. 2019, 12, 3611–3620. [Google Scholar] [CrossRef] [Green Version]
Figure 1. HTC experimental unit.
Energies 14 05693 g001
Figure 2. Van Krevelen diagram for feedstock and hydrochar samples. PS-primary sludge, BS-biosludge. The tendency of the dehydration, decarboxylation and demethylation reactions is shown by the arrows.
Energies 14 05693 g002
Figure 3. Inorganic elements in feedstock and hydrochar BS and SP samples.
Energies 14 05693 g003
Figure 4. Heavy metals in feedstock and hydrochar BS and SP samples.
Energies 14 05693 g004
Figure 5. Inorganic elements in feedstock-liquor and HTC-liquor of BS and SP samples.
Energies 14 05693 g005
Figure 6. BSE images for the untreated and HTC180 °C and HTC240 °C of biosludge and primary sludge.
Energies 14 05693 g006
Figure 7. FTIR spectra of the HTC180 °C and HTC240 °C, including feedstocks of primary sludge and biosludge.
Energies 14 05693 g007
Figure 8. XRD spectra of PS and BS samples.
Energies 14 05693 g008
Table 1. Elemental, proximate, and heating value analysis of feedstock and hydrochar samples.
Primary SludgeBiosludge
RawReaction Temperature (°C)RawReaction Temperature (°C)
180200220240180200220240
Elemental composition a (wt% dry)
C40.8 (0.05 ± 0.02)43.21 (0.47 ± 0.09)43.50 (0.26 ± 0.05)44.24 (0.19 ± 0.05)44.35 (0.22 ± 0.1)44.76 (0.02 ± 0.01)46.01 (0.35 ± 0.1)46.58 (0.05 ± 0.02)52.66 (0.13 ± 0.1)52.57 (0.05 ± 0.02)
H6.30 (0.07 ± 0.02)6.34 (0.03 ± 0.01)6.27 (0.02 ± 0.01)6.26 (0.02 ± 0.01)6.03 (0.02 ± 0.01)5.80 (0.01 ± 0.01)5.66 (0.19 ± 0.1)5.91 (0.14 ± 0.1)5.97 (0.02 ± 0.01)5.70 (0.02 ± 0.01)
O42.53 (0.09 ± 0.01)43.87 (0.4 ± 0.05)43.61(0.21 ± 0.05)42.62 (0.24 ± 0.1)39.63 (0.17 ± 0.07)24.02 (0.02 ± 0.01)24.63 (0.50 ± 0.05)22.43 (0.19 ± 0.08)17.32 (0.11 ± 0.09)15.59 (0.12 ± 0.1)
N0.67 (0.01 ± 0.01)0.45 (0.02 ± 0.01)0.28 (0.08 ± 0.03)0.26 (0.27 ± 0.1)0.24 (0.03 ± 0.01)4.36 (0.01 ± 0.01)4.14 (0.04 ± 0.02)4.01 (0.01 ± 0.01)2.88 (0.01 ± 0.01)2.99 (0.01 ± 0.01)
S0.42 (0.03 ± 0.01)0.24 (0.01 ± 0.01)0.21 (0.01 ± 0.01)0.18 (0.02 ± 0.01)0.24 (0.01 ± 0.01)2.30 (0.01 ± 0.01)2.27 (0.01 ± 0.01)2.22 (0.01 ± 0.01)2.27 (0.01 ± 0.01)0.28 (0.05 ± 0.03)
Proximate composition (wt%)
MC96.8 (0.20 ± 0.05)7.01 (0.46 ± 0.1)6.81 (0.76 ± 0.08)6.41 (0.60 ± 0.05)5.81 (0.30 ± 0.1)92.18 (0.29 ± 0.02)5.65 (0.45 ± 0.1)6.39 (1.15 ± 0.1)4.94 (0.67 ± 0.01)3.20 (0.12 ± 0.09)
VM b93.42 (0.24 ± 0.07)88.40 (0.14 ± 0.05)85.71(0.85 ± 0.05)86.04 (1.37 ± 0.2)81.30 (1.49 ± 0.6)69.16 (0.2 ± 0.07)63.33 (0.4 ± 0.04)56.75 (1.5 ± 0.2)55.21 (0.7 ± 0.08)52.97 (0.4 ± 0.05)
FC b5.72 (0.54 ± 0.01)8.17(0.16 ± 0.07)7.51 (0.63 ± 0.1)9.20 (0.45 ± 0.06)12.06 (0.2 ± 0.03)19.50 (0.5 ± 0.01)24.41 (1.8 ± 0.1)25.88 (1.0 ± 0.05)26.16 (1.0 ± 0.07)
AC b 550°C9.45 (0.46 ± 0.03)5.88 (0.84 ± 0.02)6.12(0.12 ± 0.02)6.44 (0.32 ± 0.1)9.49 (1.22 ± 0.05)20.99 (1.27 ± 0.01)17.17 (0.14 ± 0.09)18.83 (1.28 ± 0.2)18.90 (1.39 ± 0.05)20.87 (0.31 ± 0.05)
AC b 815°C9.21 (1.49 ± 0.2)5.64 (0.68 ± 0.01)5.97(0.28 ± 0.09)5.74 (0.08 ± 0.01)9.25 (1.13 ± 0.1)18.77 (0.43 ± 0.1)16.71 (0.14 ± 0.07)18.02 (1.14 ± 0.09)18.09 (1.37 ± 0.04)20.21 (0.37 ± 0.08)
Heating value (MJ∙kg dry−1)
HHV17.50 (0.1 ± 0.05)18.57 (0.1 ± 0.05)18.57(0.1 ± 0.05)18.70 (0.1 ± 0.05)18.77 (0.1 ± 0.05)19.78 (0.1 ± 0.05)21.0 (0.1 ± 0.05)24.4 (0.1 ± 0.05)24.5 (0.1 ± 0.05)24.7 (0.1 ± 0.05)
LHV16.07 (0.1 ± 0.05)17.14 (0.1 ± 0.05)17.15(0.1 ± 0.05)17.28 (0.1 ± 0.05)17.41 (0.1 ± 0.05)18.5 (0.1 ± 0.05)19.7 (0.1 ± 0.05)23.1 (0.1 ± 0.05)23.1 (0.1 ± 0.05)23.5 (0.1 ± 0.05)
NHV15.12 (0.1 ± 0.05)15.75 (0.1 ± 0.05)15.81(0.1 ± 0.05)16.01 (0.1 ± 0.05)26.25 (0.1 ± 0.05)17.8 (0.1 ± 0.05)18.5 (0.1 ± 0.05)21.5 (0.1 ± 0.05)21.8 (0.1 ± 0.05)22.7 (0.1 ± 0.05)
DE [−]1.061.061.071.071.061.231.241.25
a Dry ash free basis. b Dry basis. (…) Standard deviation. MC-moisture content; VM-volatile Matter; AC-ash content; FC-fixed carbon; HHV-higher heating value; LHV-low heating value; NHV-net heating value; DE-energy densification.
Table 2. Characterization of HTC liquor.
Primary SludgeBiosludge
RawReaction Temperature (°C)RawReaction Temperature (°C)
180200220240180200220240
TC (mg∙L−1)698 (0.1 ± 0.05)521 (0.1 ± 0.05)1342 (0.2 ± 0.04)876 (0.1 ± 0.07)1146 (0.08 ± 0.05)408 (0.09 ± 0.05)310 (0.05 ± 0.01)266 (0.1 ± 0.05)338 (0.7 ± 0.1)311 (0.1 ± 0.01)
IC (mg∙L−1)264 (0.3 ± 0.02)54 (0.2 ± 0.03)45 (0.1 ± 0.08)56 (0.4 ± 0.01)4 (0.1 ± 0.02)4 (0.1 ± 0.05)3 (0.3 ± 0.05)3 (0.5 ± 0.01)3 (0.2 ± 0.01)3 (0.7 ± 0.02)
TOC (mg∙L−1)434 (0.1 ± 0.03)467 (0.1 ± 0.05)1297 (0.1 ± 0.05)820 (0.6 ± 0.05)1142 (0.9 ± 0.04)404 (0.3 ± 0.01)307 (0.9 ± 0.05)263 (0.6 ± 0.05)335 (0.6 ± 0.02)308 (0.4 ± 0.02)
NVR (−)1.43 (0.4 ± 0.1)2.36 (0.6 ± 0.09)2.76 (0.8 ± 0.1)3.05 (0.8 ± 0.05)2.23 (1 ± 0.08)9.78 (0.8 ± 0.05)8.93 (0.4 ± 0.01)10.07 (0.1 ± 0.05)7.27 (0.5 ± 0.01)9.88 (1 ± 0.09)
COD (mg∙L−1)105 (1.2 ± 0.5)126 (1.5 ± 0.08)345 (1 ± 0.1)253 (1.9 ± 0.2)331 (1.6 ± 0.02)49 (0.9 ± 0.02)24 (0.3 ± 0.02)43 (1.7 ± 0.01)67 (0.9 ± 0.01)81 (2 ± 0.5)
pH (−)7.66 (0.5 ± 0.1)5.19 (0.7 ± 0.09)4.79 (0.4 ± 0.1)4.35 (0.9 ± 0.02)4.07 (0.7 ± 0.01)8.65 (1.2 ± 0.1)7.17 (0.7 ± 0.01)6.31 (0.6 ± 0.1)7.40 (1.4 ± 0.04)6.93 (1 ± 0.09)
(…) Standard deviation. TC-total carbon; IC-inorganic carbon; TOC-total organic carbon; NVR-non-volatile residue; COD-chemical oxygen demand.
Publisher’s Note: MDPI stays neutral with regard to jurisdictional claims in published maps and institutional affiliations.

