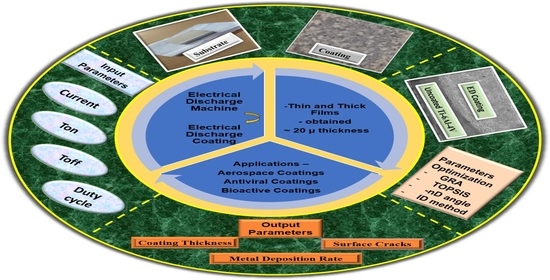
Article

Formation and Optimization of Electrical Discharge Coatings Using Conventional Electrodes

by
JagadeeswaraRao Maddu
1,
Buschaiah Karrolla
1,
Srikanth Vuppala
2,* and
Riyaaz Uddien Shaik
3,*
1
Department of Mechanical Engineering, University College of Engineering, Osmania University, Hyderabad 500007, India
2
Department of Civil and Environmental Engineering, Politecnico di Milano, Piazza Leonardo da Vinci, 32, 20133 Milan, Italy
3
Department of Astronautics Electrical and Energy Engineering, University of Rome “La Sapienza”, Via Eudossiana 18, 00184 Rome, Italy
*
Authors to whom correspondence should be addressed.
Energies 2021, 14(18), 5691; https://doi.org/10.3390/en14185691
Submission received: 17 July 2021 / Revised: 16 August 2021 / Accepted: 1 September 2021 / Published: 10 September 2021
(This article belongs to the Special Issue Water and Wastewater Treatment- Energy Efficiency)

Abstract

:
An emerging topic is electrical discharge (ED) coating with its application on complex shapes and cavities to repair components or act as functional coatings. Because it is a variant process of an electric discharge machine (EDM) with the ability to coat on electrically conductive substrates, there is a possibility that next-generation electrical discharge machining components may exploit the attachment phenomenon to enhance recast layer properties. Previously, researchers have obtained ED coating by mixing the powder in a dielectric medium and/or by using powder metallurgy electrodes. In this work, primarily, an insight in the formation of ED coating on-die sinks electrical discharge machine, using conventional electrode materials viz., bronze on titanium alloy (Ti-6Al-4V) is made. The bronze electrode on the titanium substrate obtained a crack-free copper coating of ~20 microns thickness. In order to perform the experiments, three combinations were made using five parameters: current (Amps), ton (µs), Toff (µs), duty cycle (%), and flushing pressure as constant (bar). After obtaining the coating, a combination of input parameters was selected by optimizing the output performance parameters, viz., the electrical discharge deposition rate, coating thickness, micro-cracks, and elemental coating composition. Secondarily, different optimization techniques viz., grey relational analysis, the technique for order of preferences by similarity to ideal solution, −nD angle method and information divergence method were implemented to find out the suitable combination of parameters where the latter two methods were introduced for the first time in this area of EDM optimization. A study was conducted to check whether the latter two methods are optimization techniques or multi-criteria decision-making techniques. The optimization of existing reactor types and the development of new reactors in wastewater treatment through EDC, by which energy could be saved by replacing the conventional techniques.

Graphical Abstract

1. Introduction

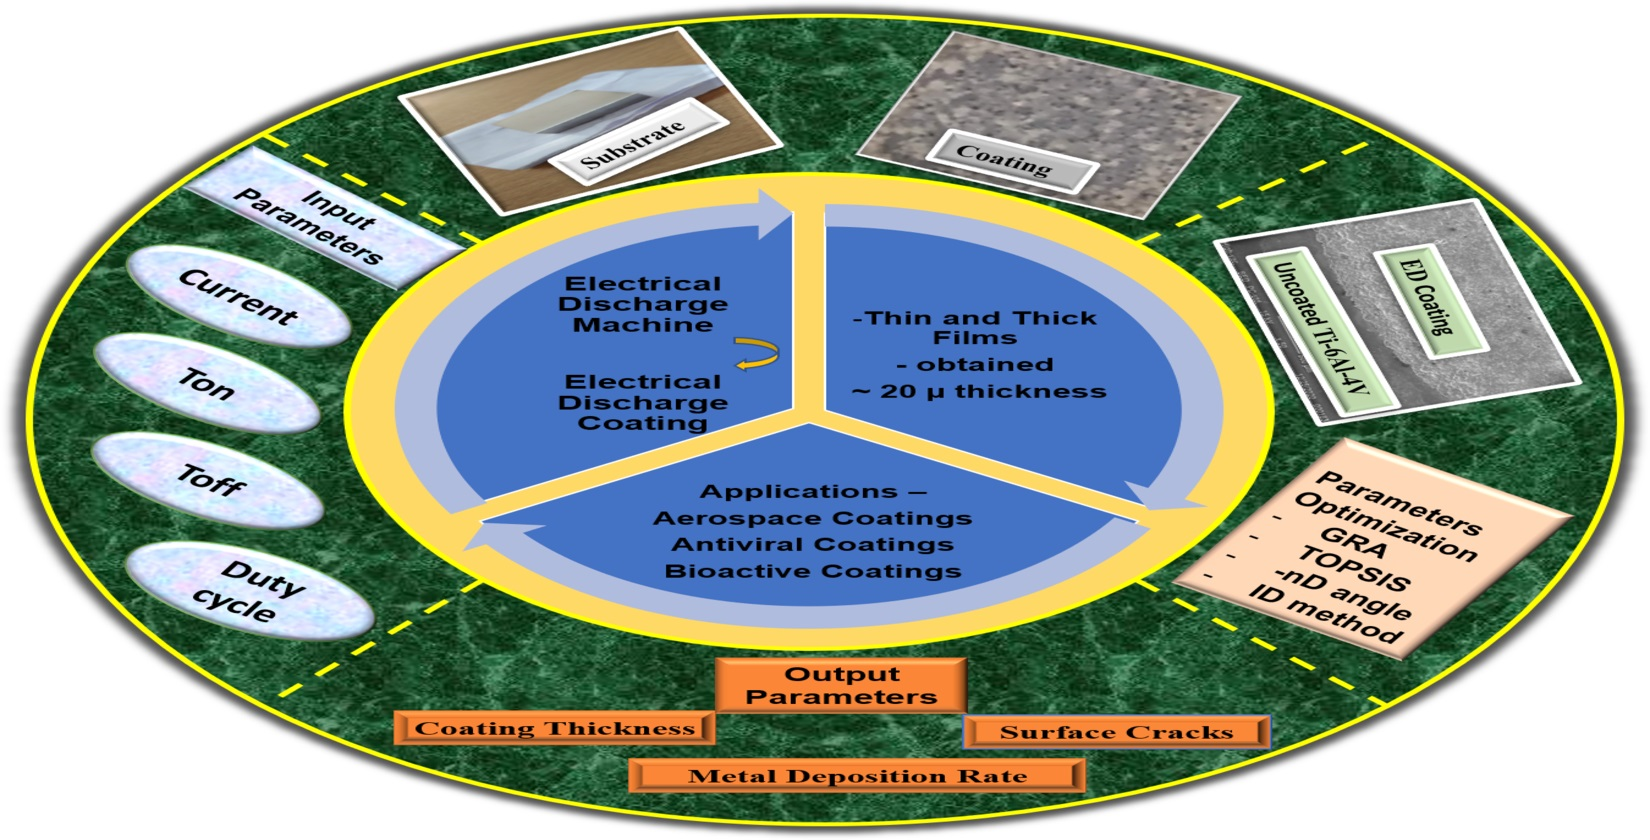
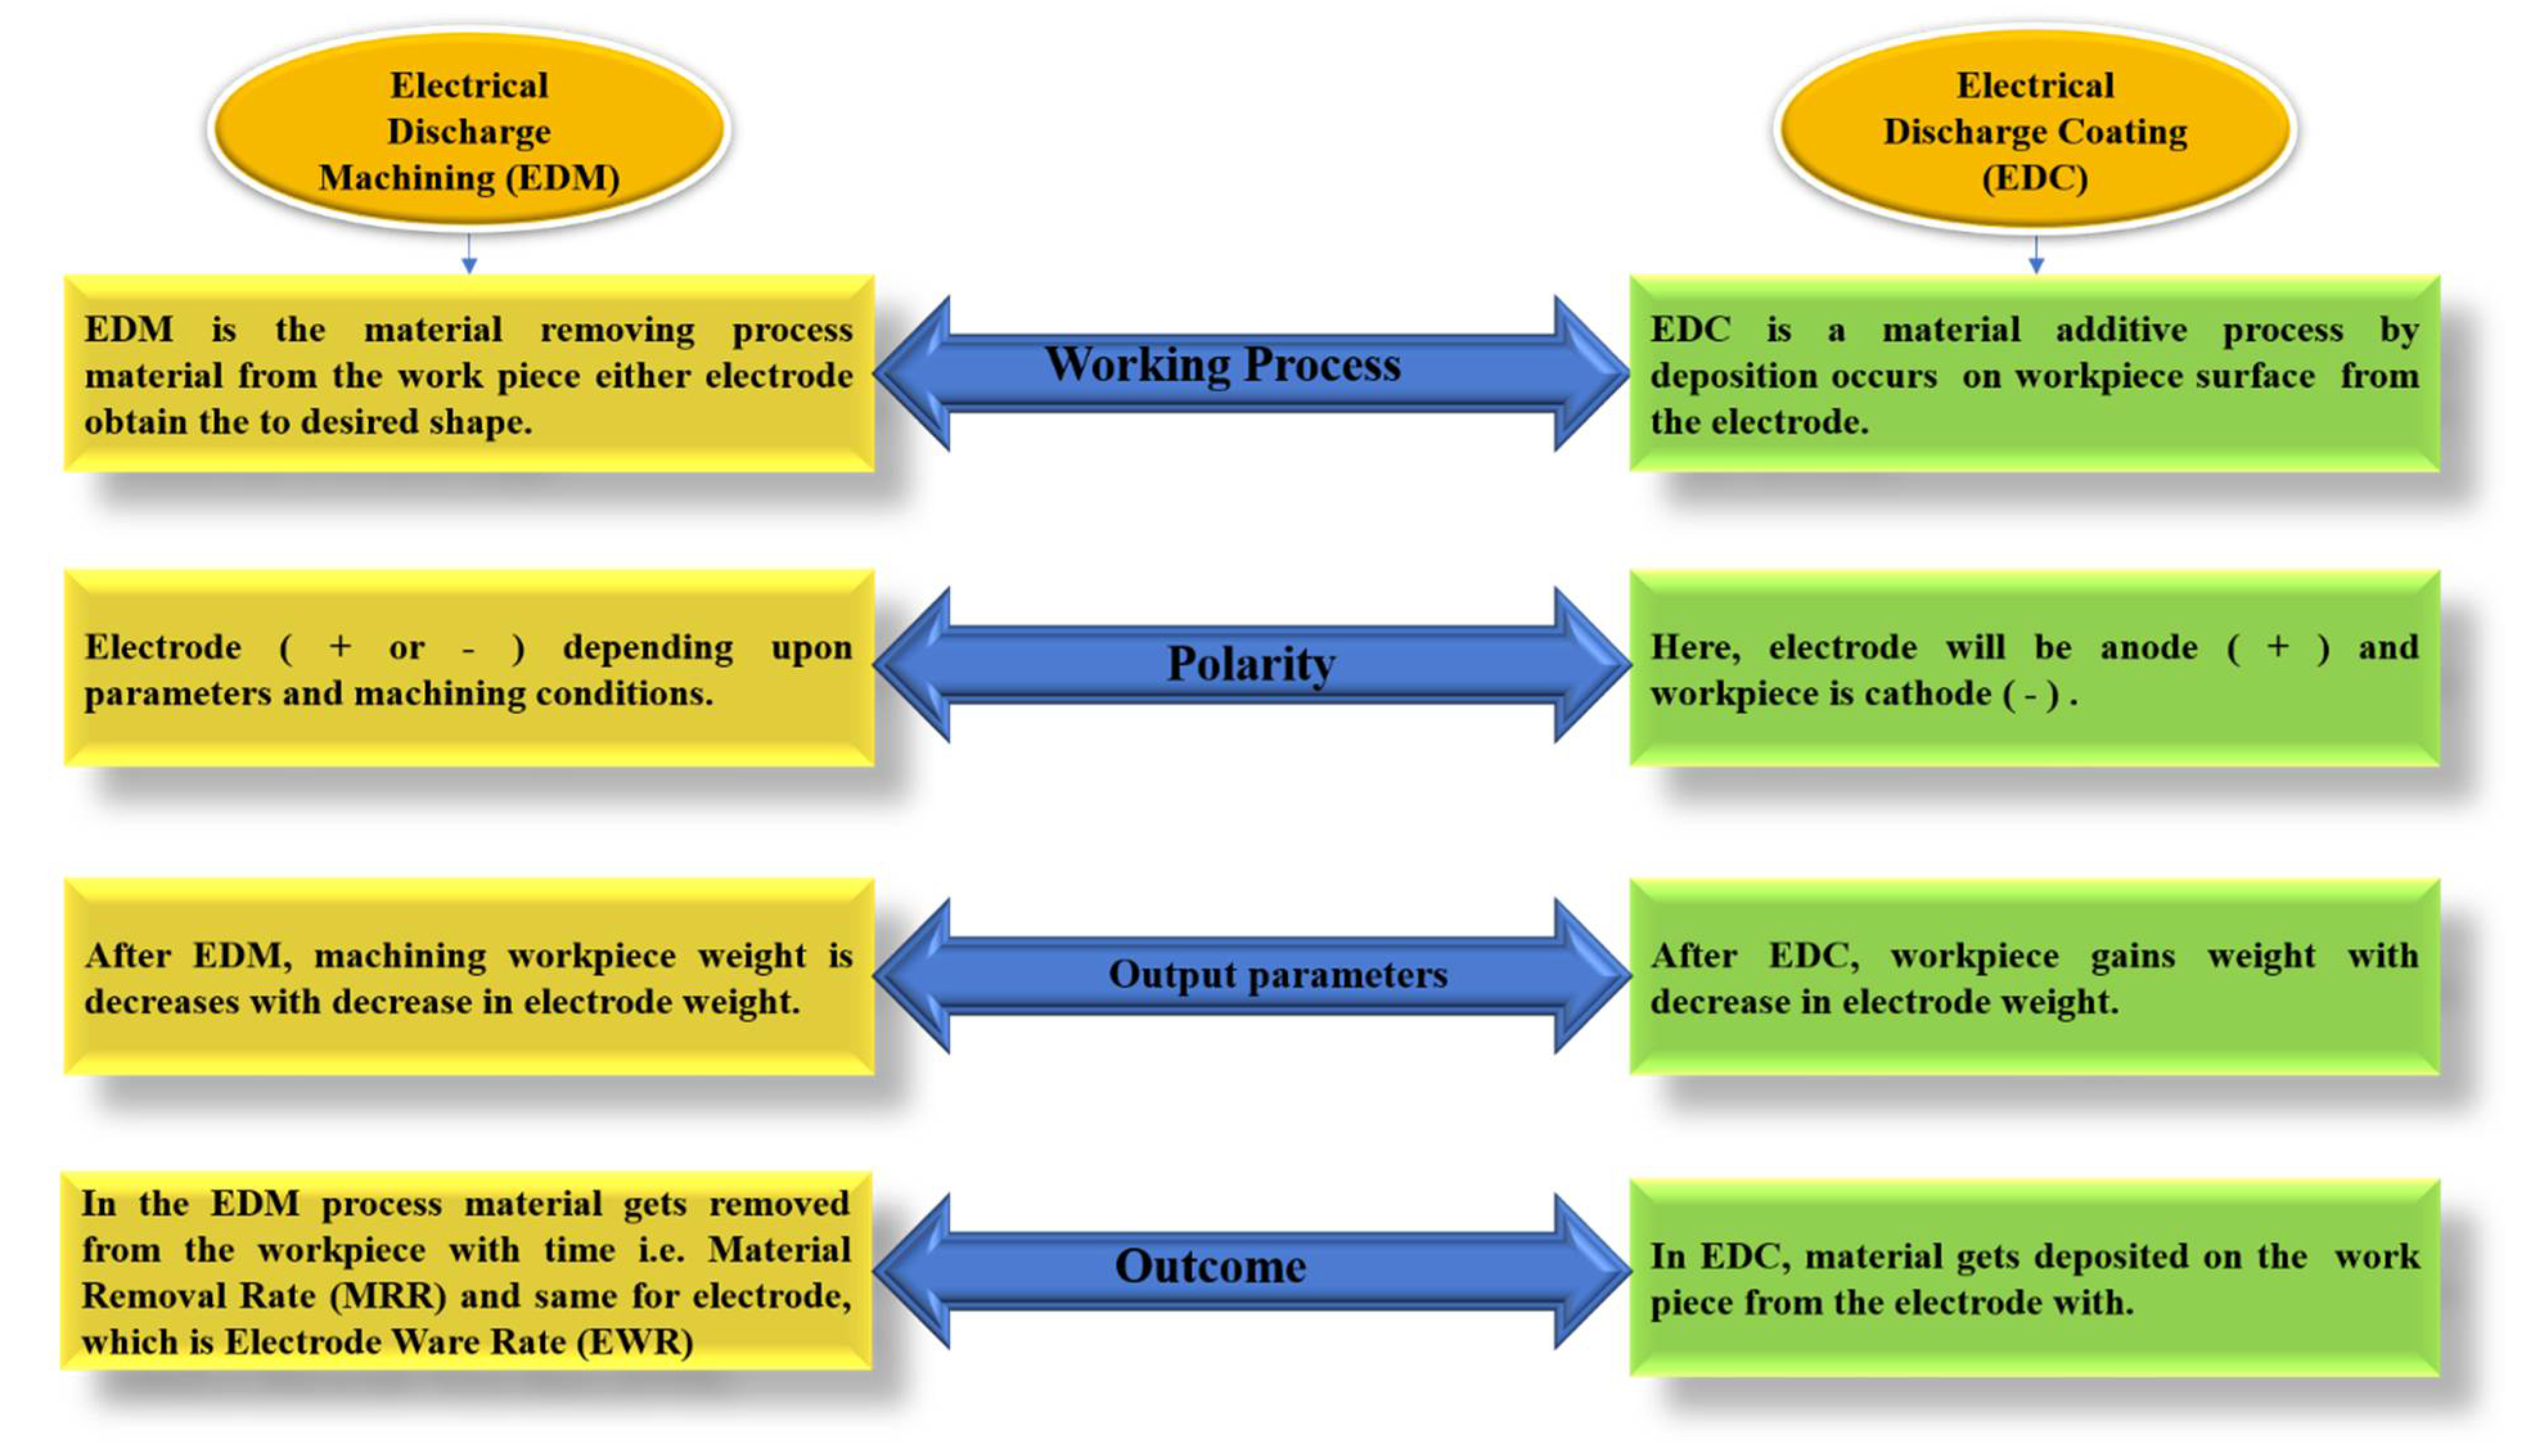
Electrical Discharge Coating (EDC) has its functional importance in lubrication and anti-wear applications since it has tremendous surface modification capabilities. The EDC process can obtain hard coatings. The coating process is carried out on the conventional Electric Discharge Machine [1,2]. The main differences between EDM and EDC in terms of the working process, polarity, and output parameters are shown in Figure 1.
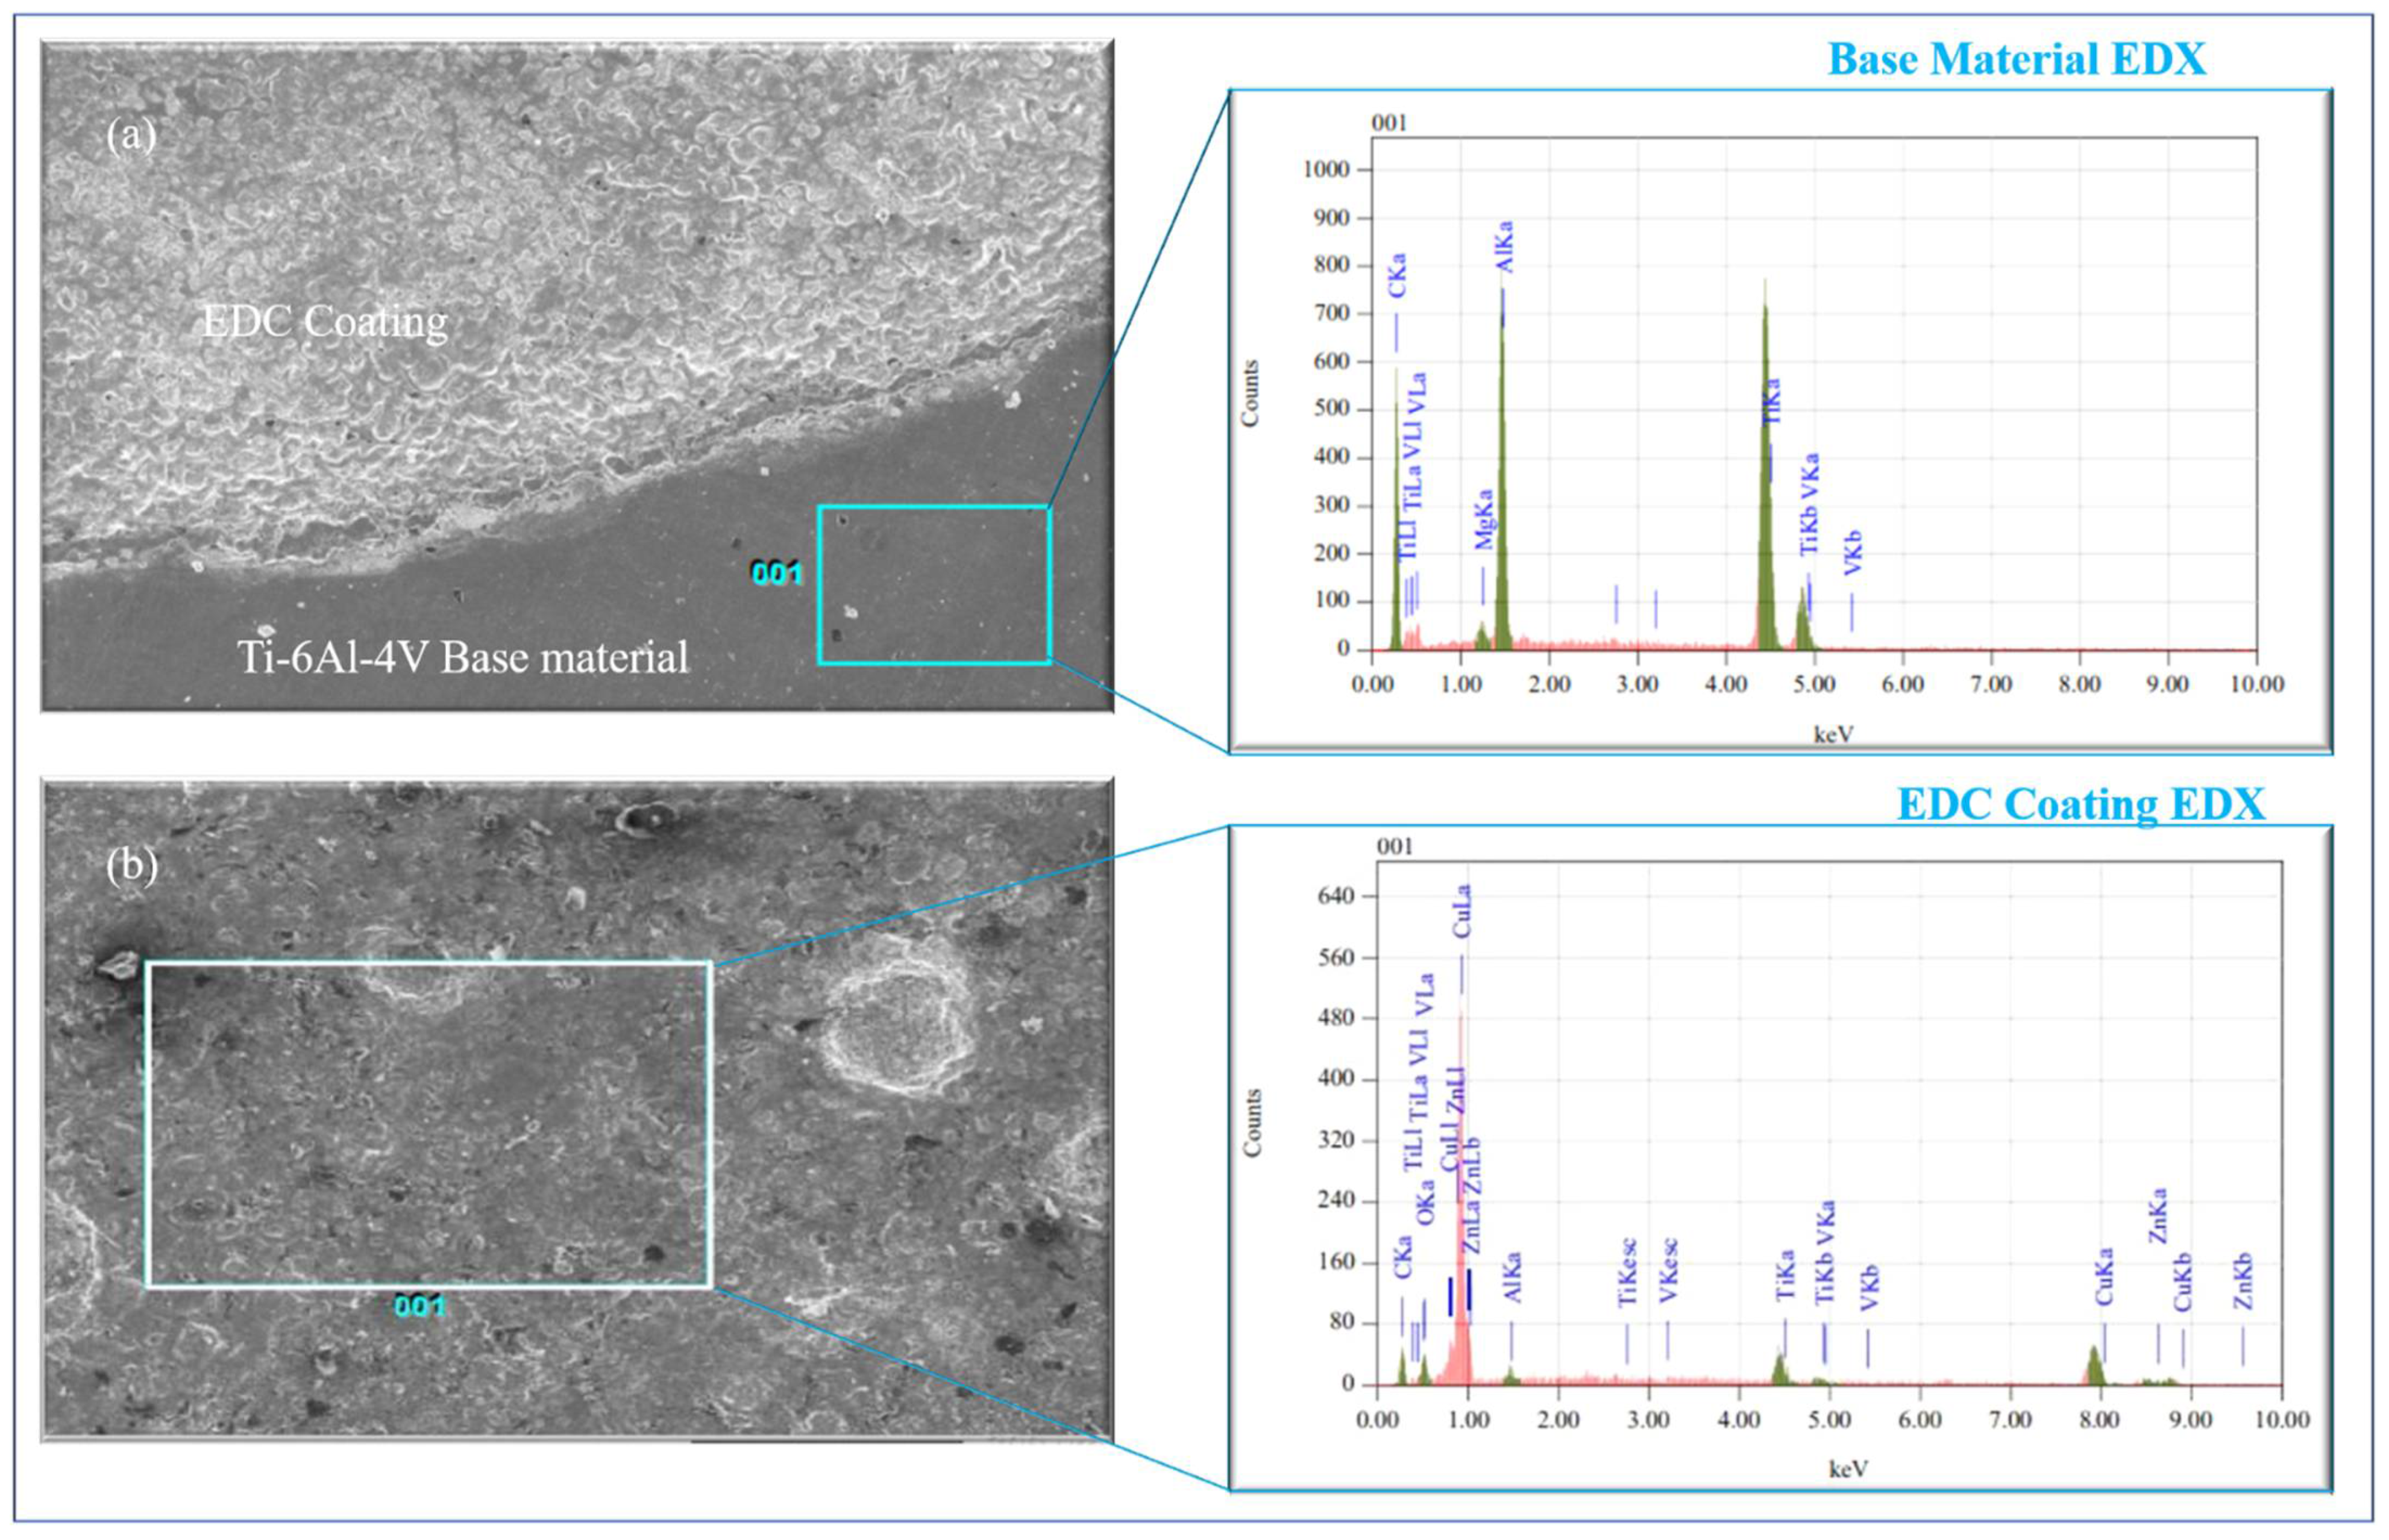
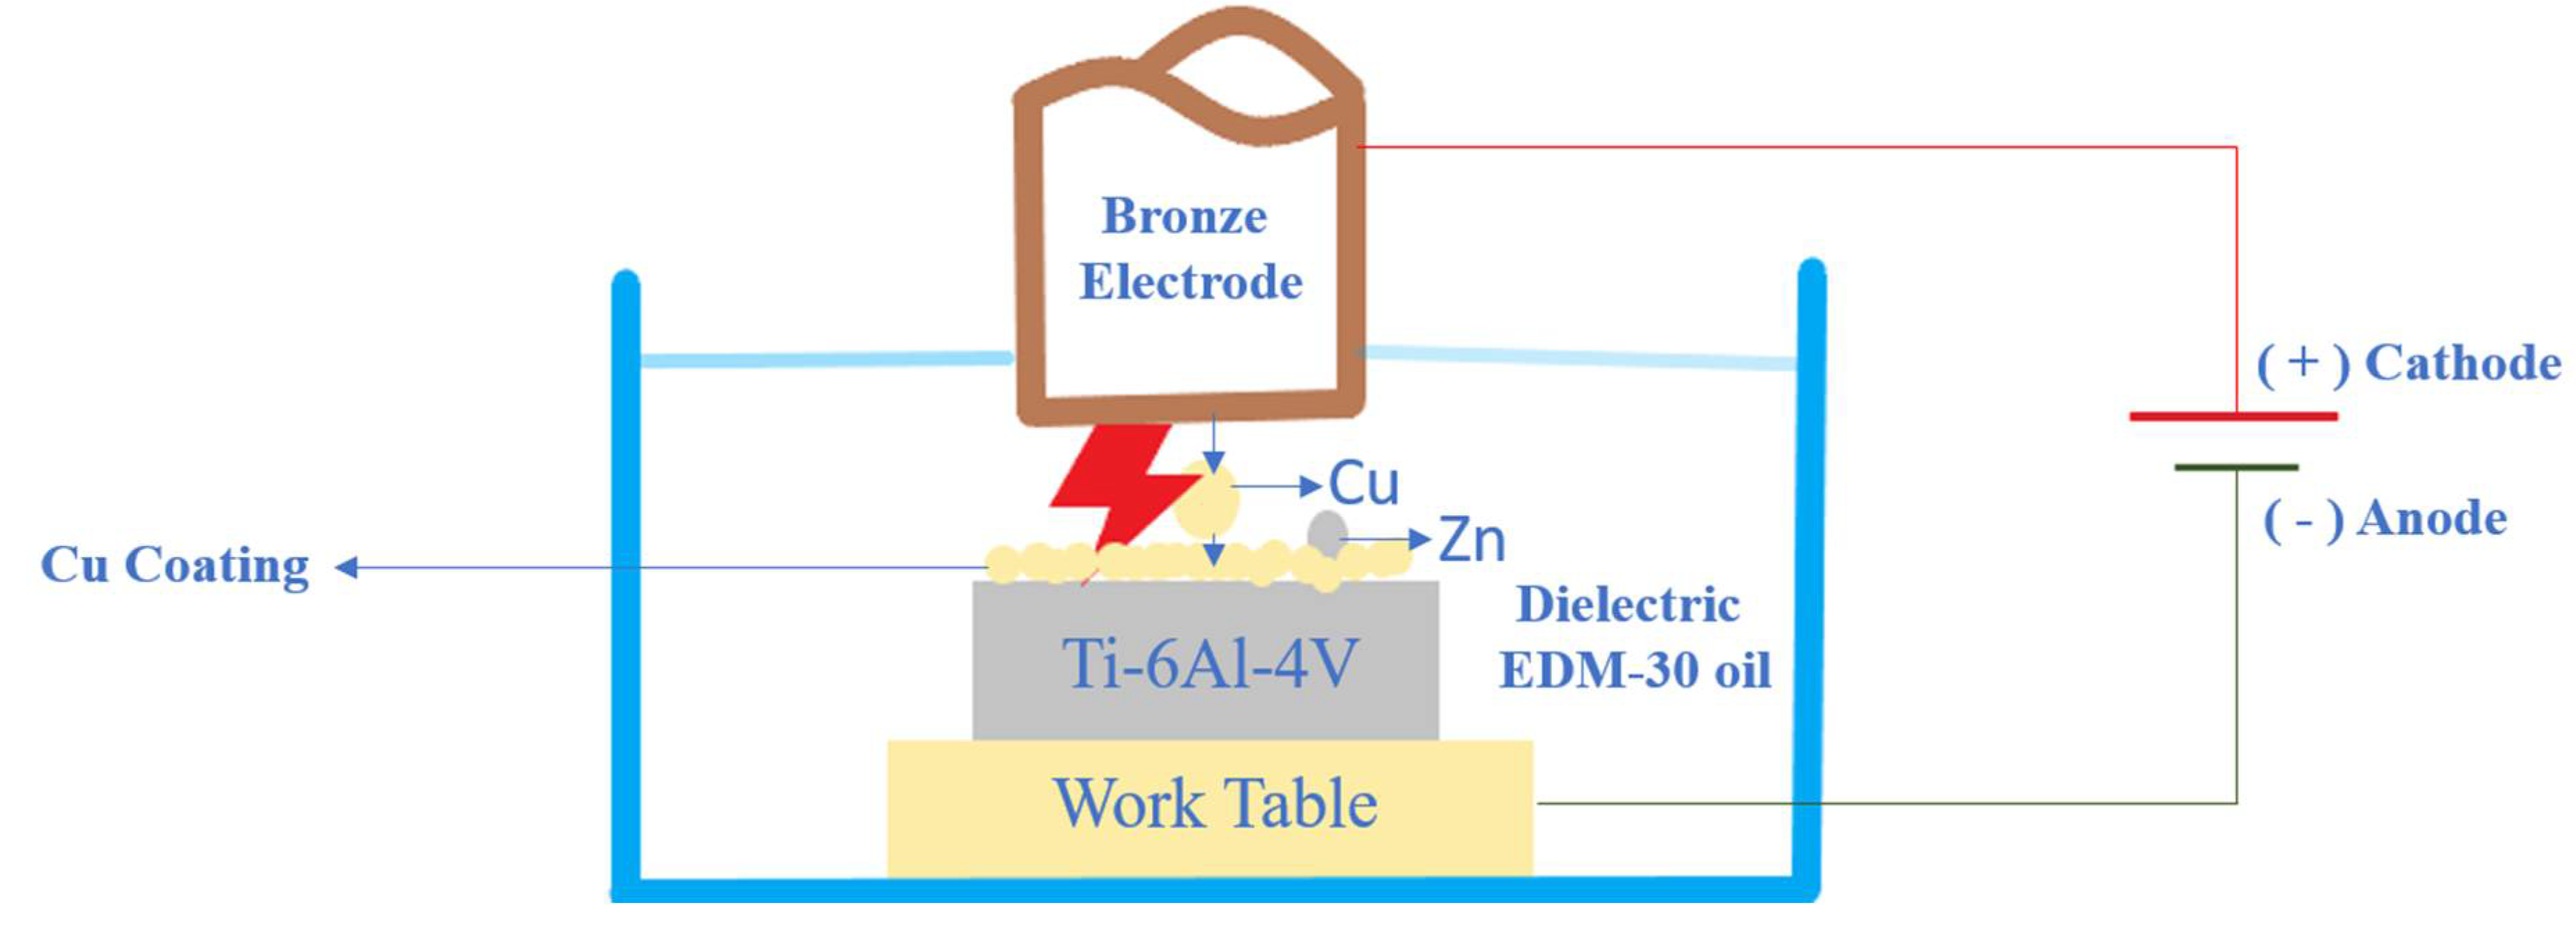
While processing in EDC, the electrode acts as an anode, and the workpiece act as a cathode. There will be an effect of cataphoretic which means under the influence of the electric field, due to the comparatively low melting point of the electrode, the erosion of metal takes place. It gets attracted to the cathode, as shown in Figure 2. The resistance occurs by forming a conduction bridge in the inter-electrode gap, which is called gap resistance. The involved particles are trapped into the micron-sized molten metal pool and get embedded in the surface of the workpiece [3].
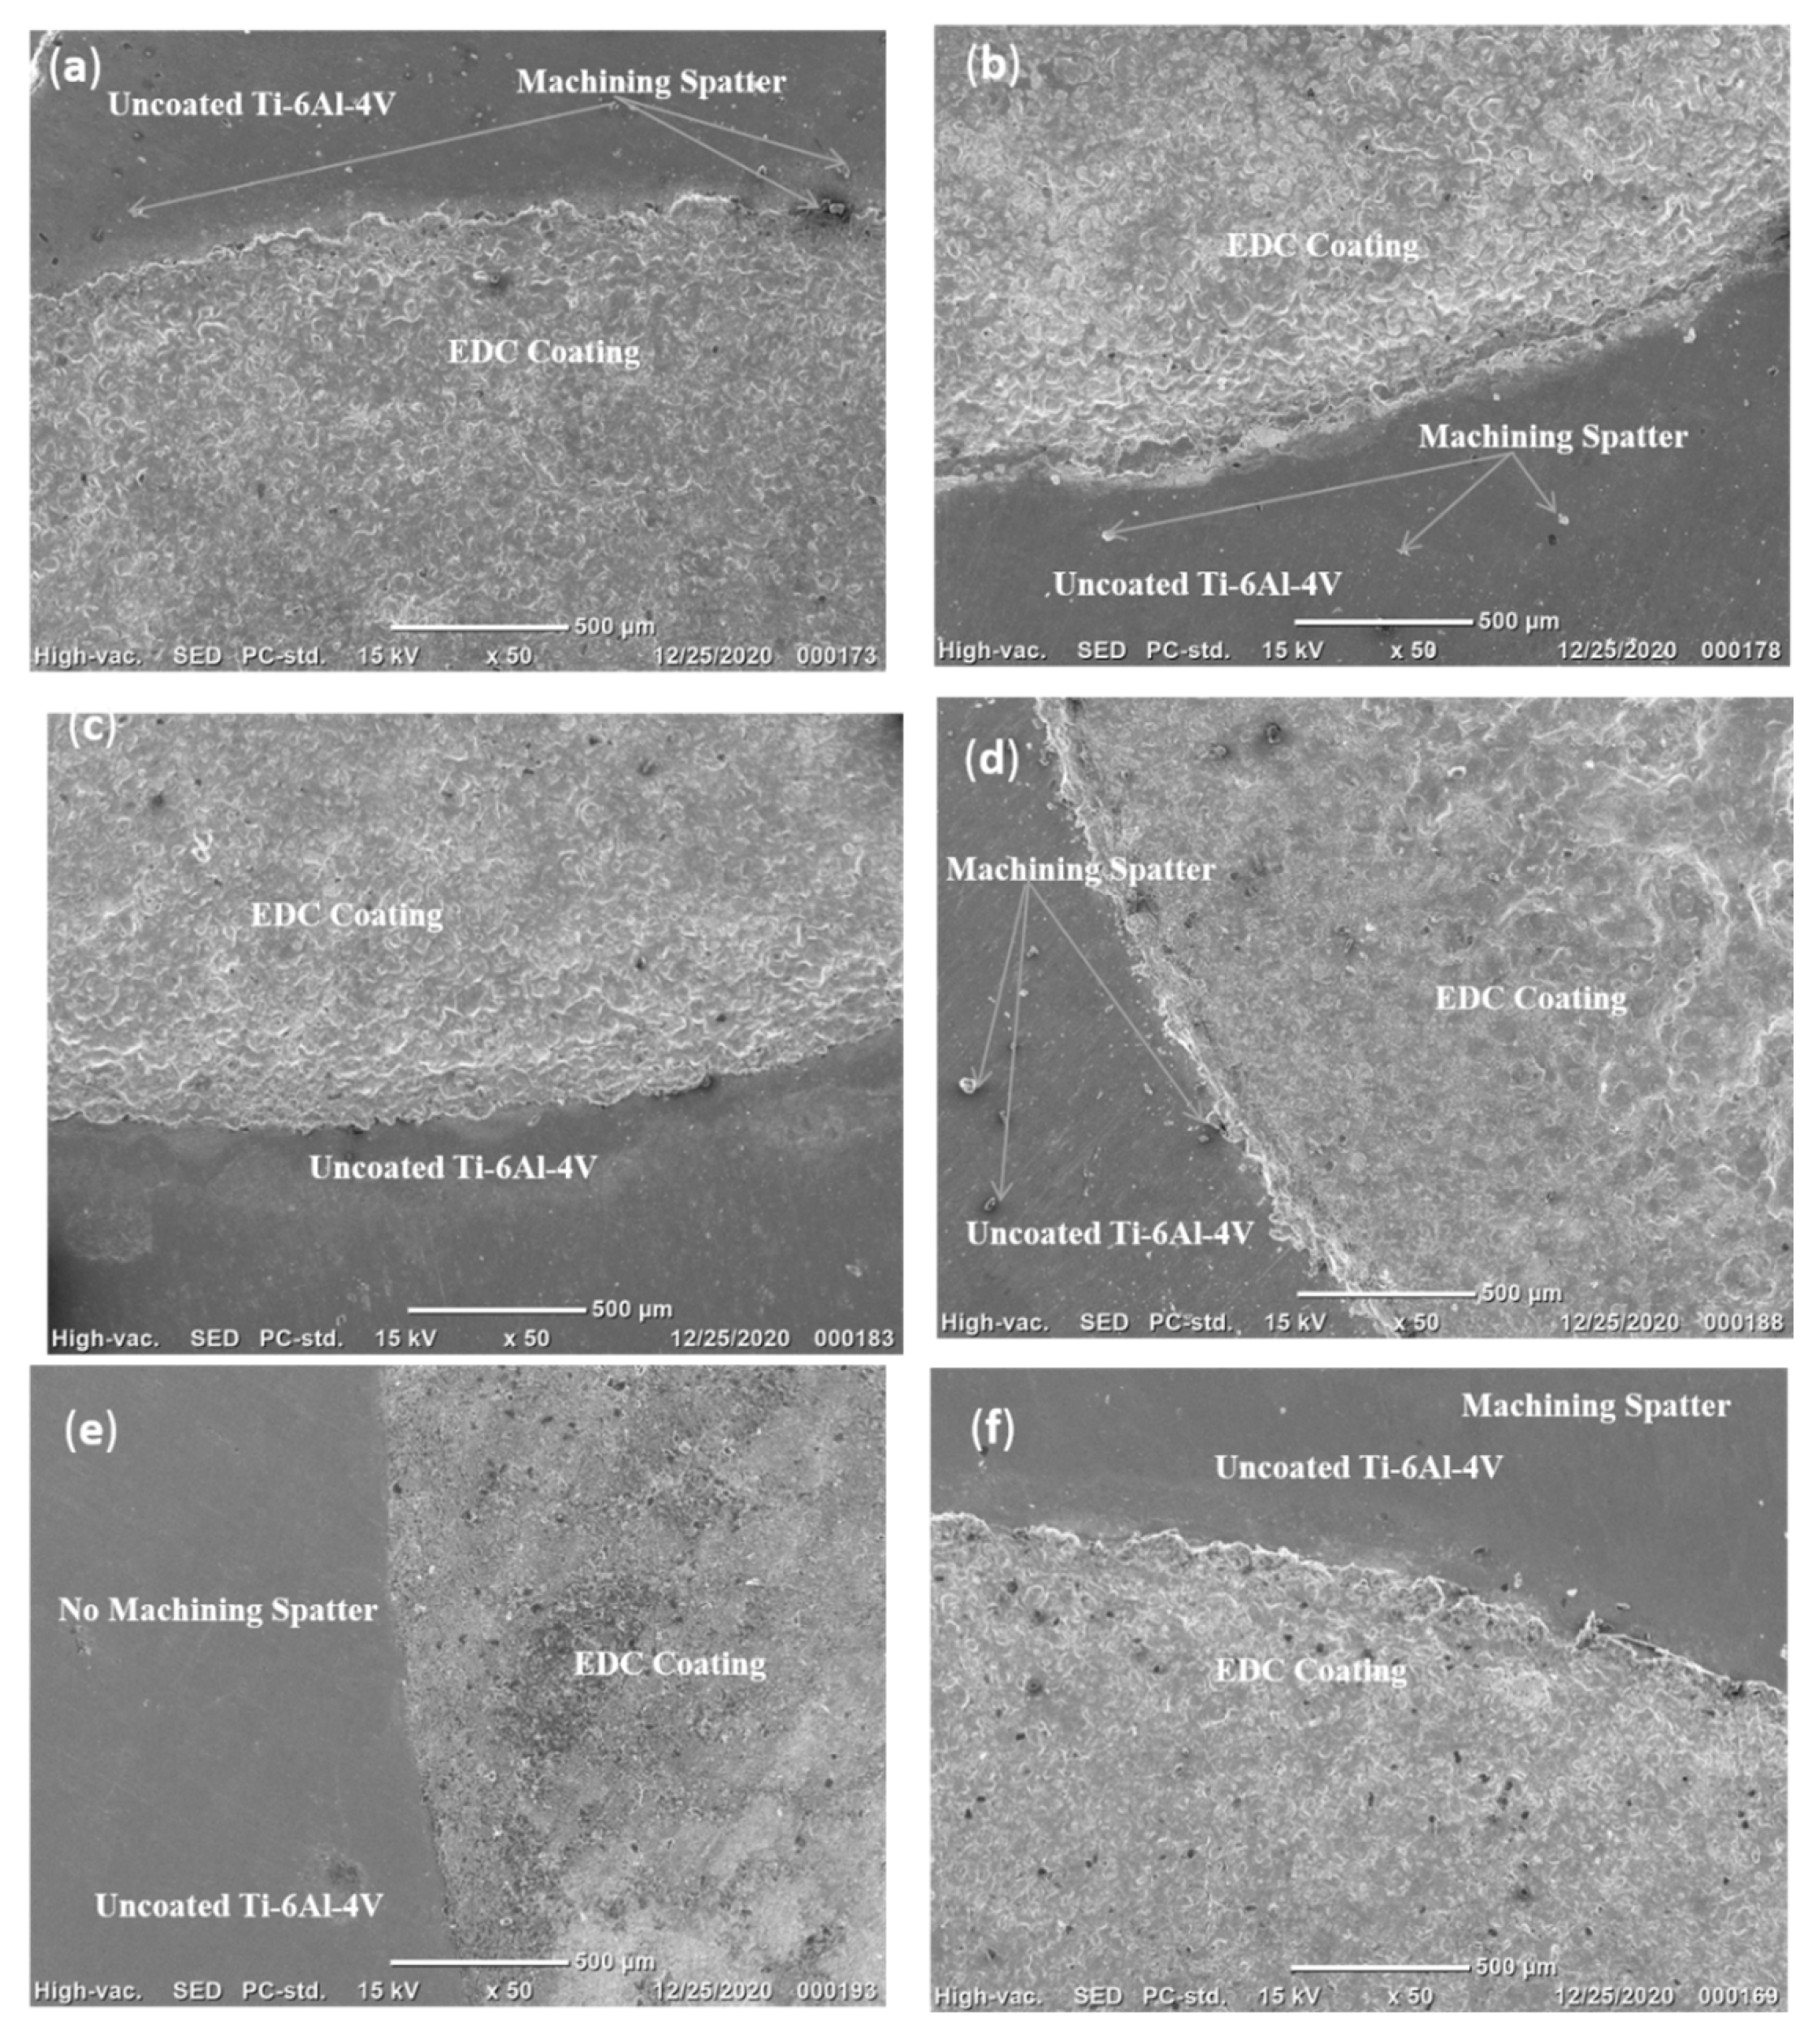
This process makes it possible to deposit a lot of functional materials onto complex shapes, and EDC can also create uneven surfaces. This process of coating can obtain high hardness. From the literature, in most cases, powder mixed electrode was used to deposit coating using EDC, whereas, in this study, we tried to deposit using a conventional electrode, which is readily available in the market [4,5,6]. The deposition rate depends upon the size of particles in electrode material, workpiece material, and experimental conditions.
This work focuses on coating copper alloy on a workpiece as it has various applications in wastewater treatment plants as antiviral coatings in this COVID pandemic times [7]. Since virucidal coating has to have Cu/Zn, bronze, an alloy of copper, was considered electrode material in this study. Finally, the copper alloy was coated on the titanium (Ti-6Al-4V) material which has several applications.
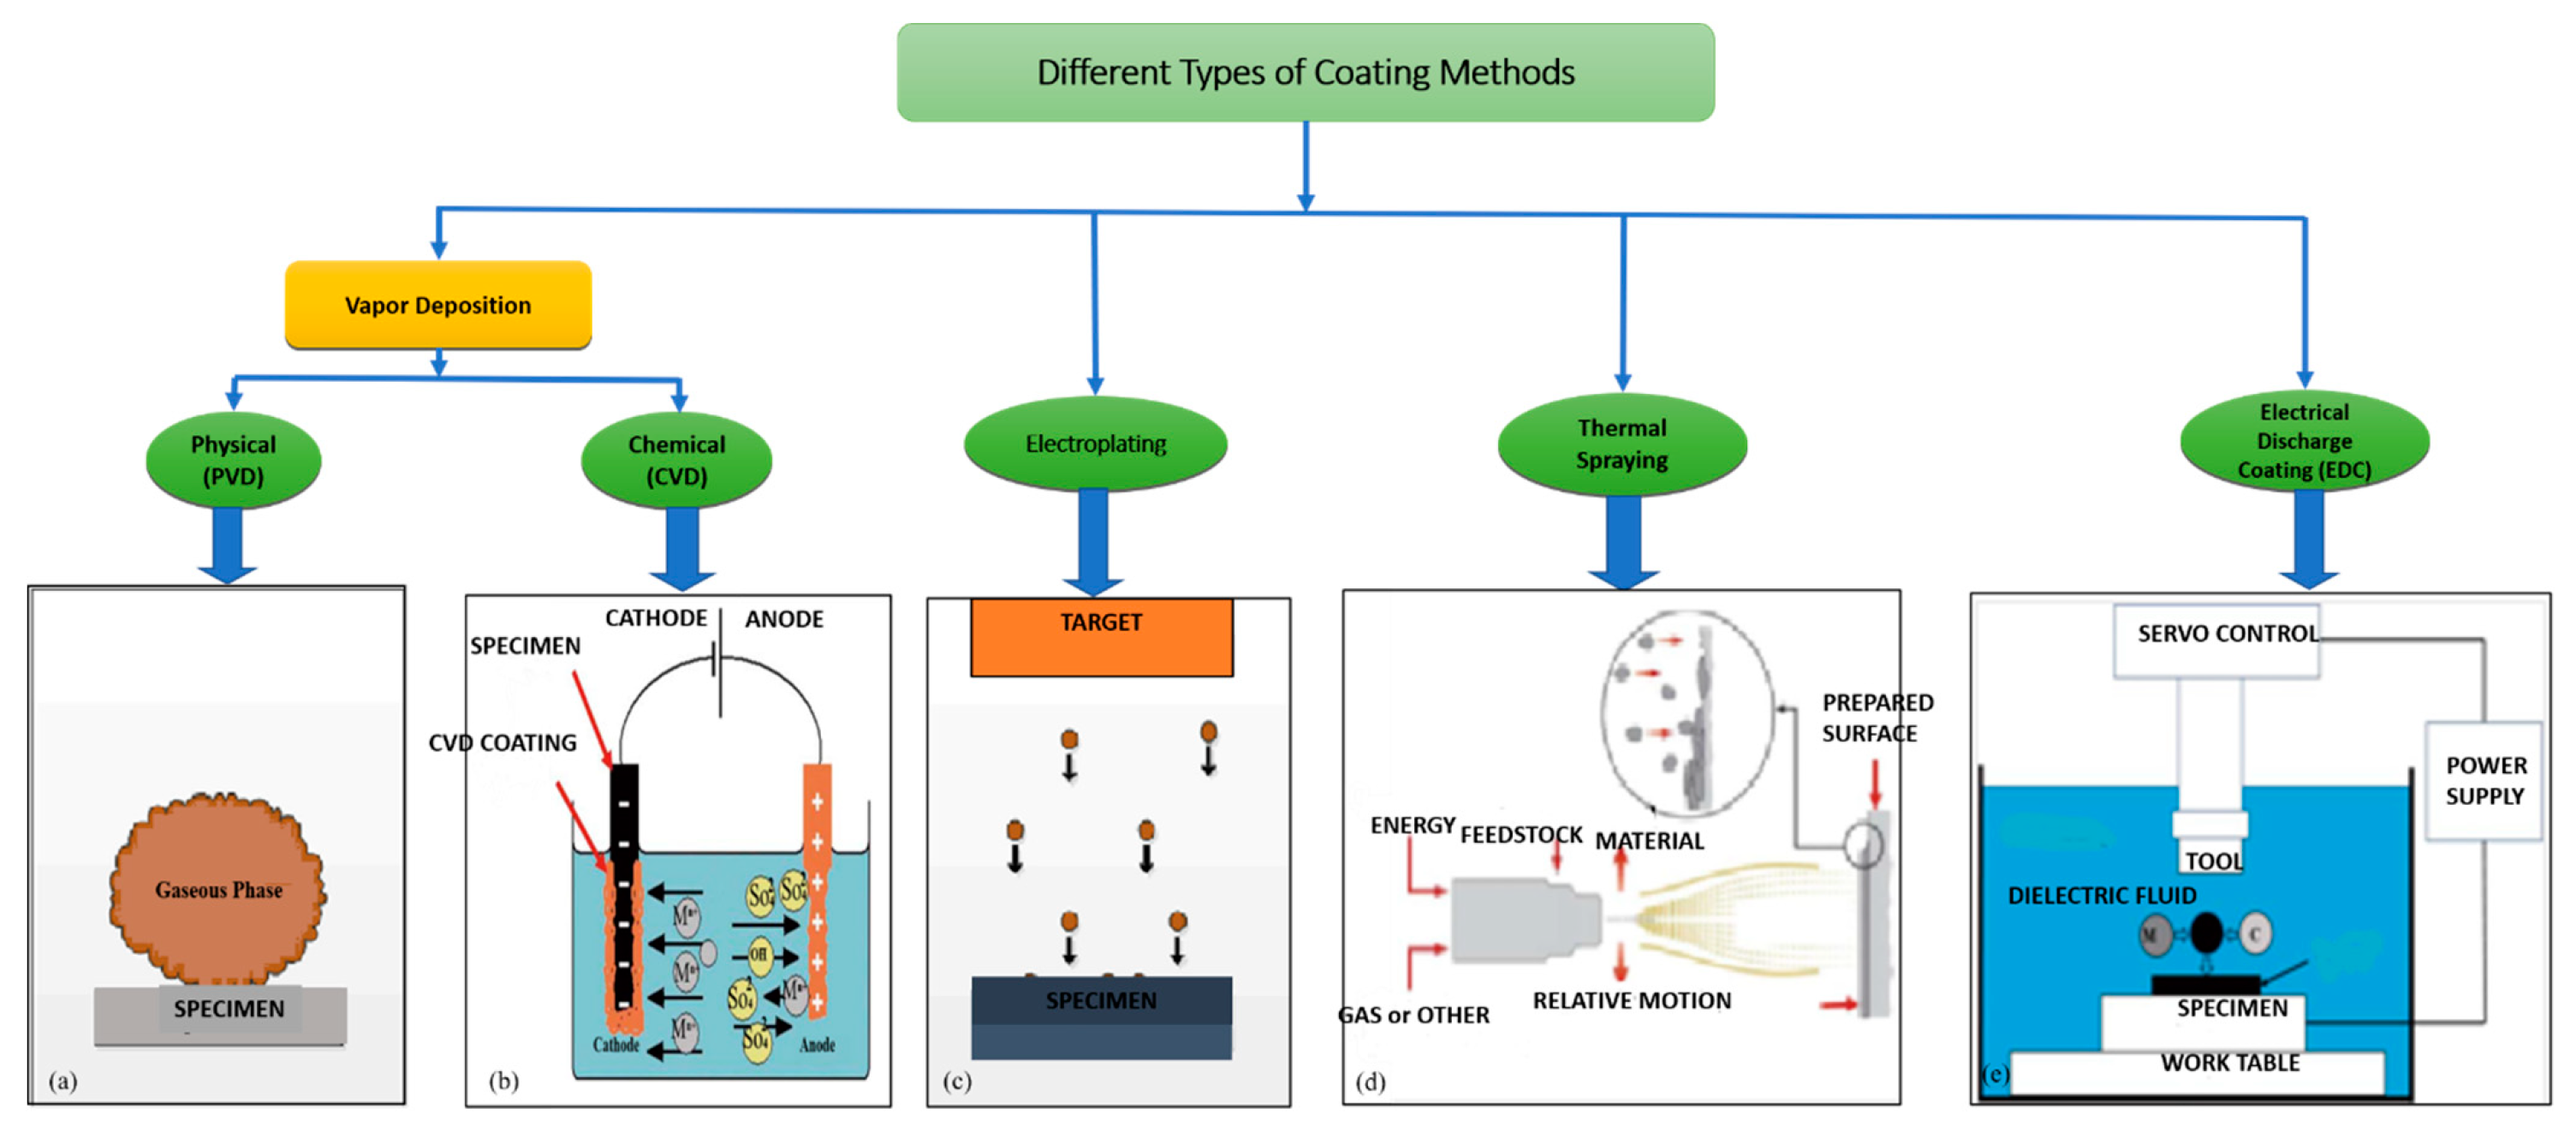
Popular coating techniques were studied from the literature review and EDC was selected among the coatings [8,9,10,11,12]. Figure 3 shows the different types of coatings available.
Different types of coating methods are shown here, and few comparisons were made even though every coating method has its own importance with respect to coating applications. Primarily, EDC can coat on complex shapes faster than others [3] and could be coated on the already available EDM machine. Secondarily, other coating methods such as Physical Vapor Deposition PVD, Chemical Vapor Deposition CVD, electroplating, etc., require complex apparatus and cannot be used for the localized coating process. Thus, coating by EDC is an alternative way to perform localized coating on any workpiece whose melting point is higher than the electrode [13].
The workpiece selected to coat the copper alloy is titanium (Ti-6Al-4V). High strength, corrosion resistance, and good mechanical properties made this material a more important material in bio-medical [14], power generation [15], and aerospace industries [16].
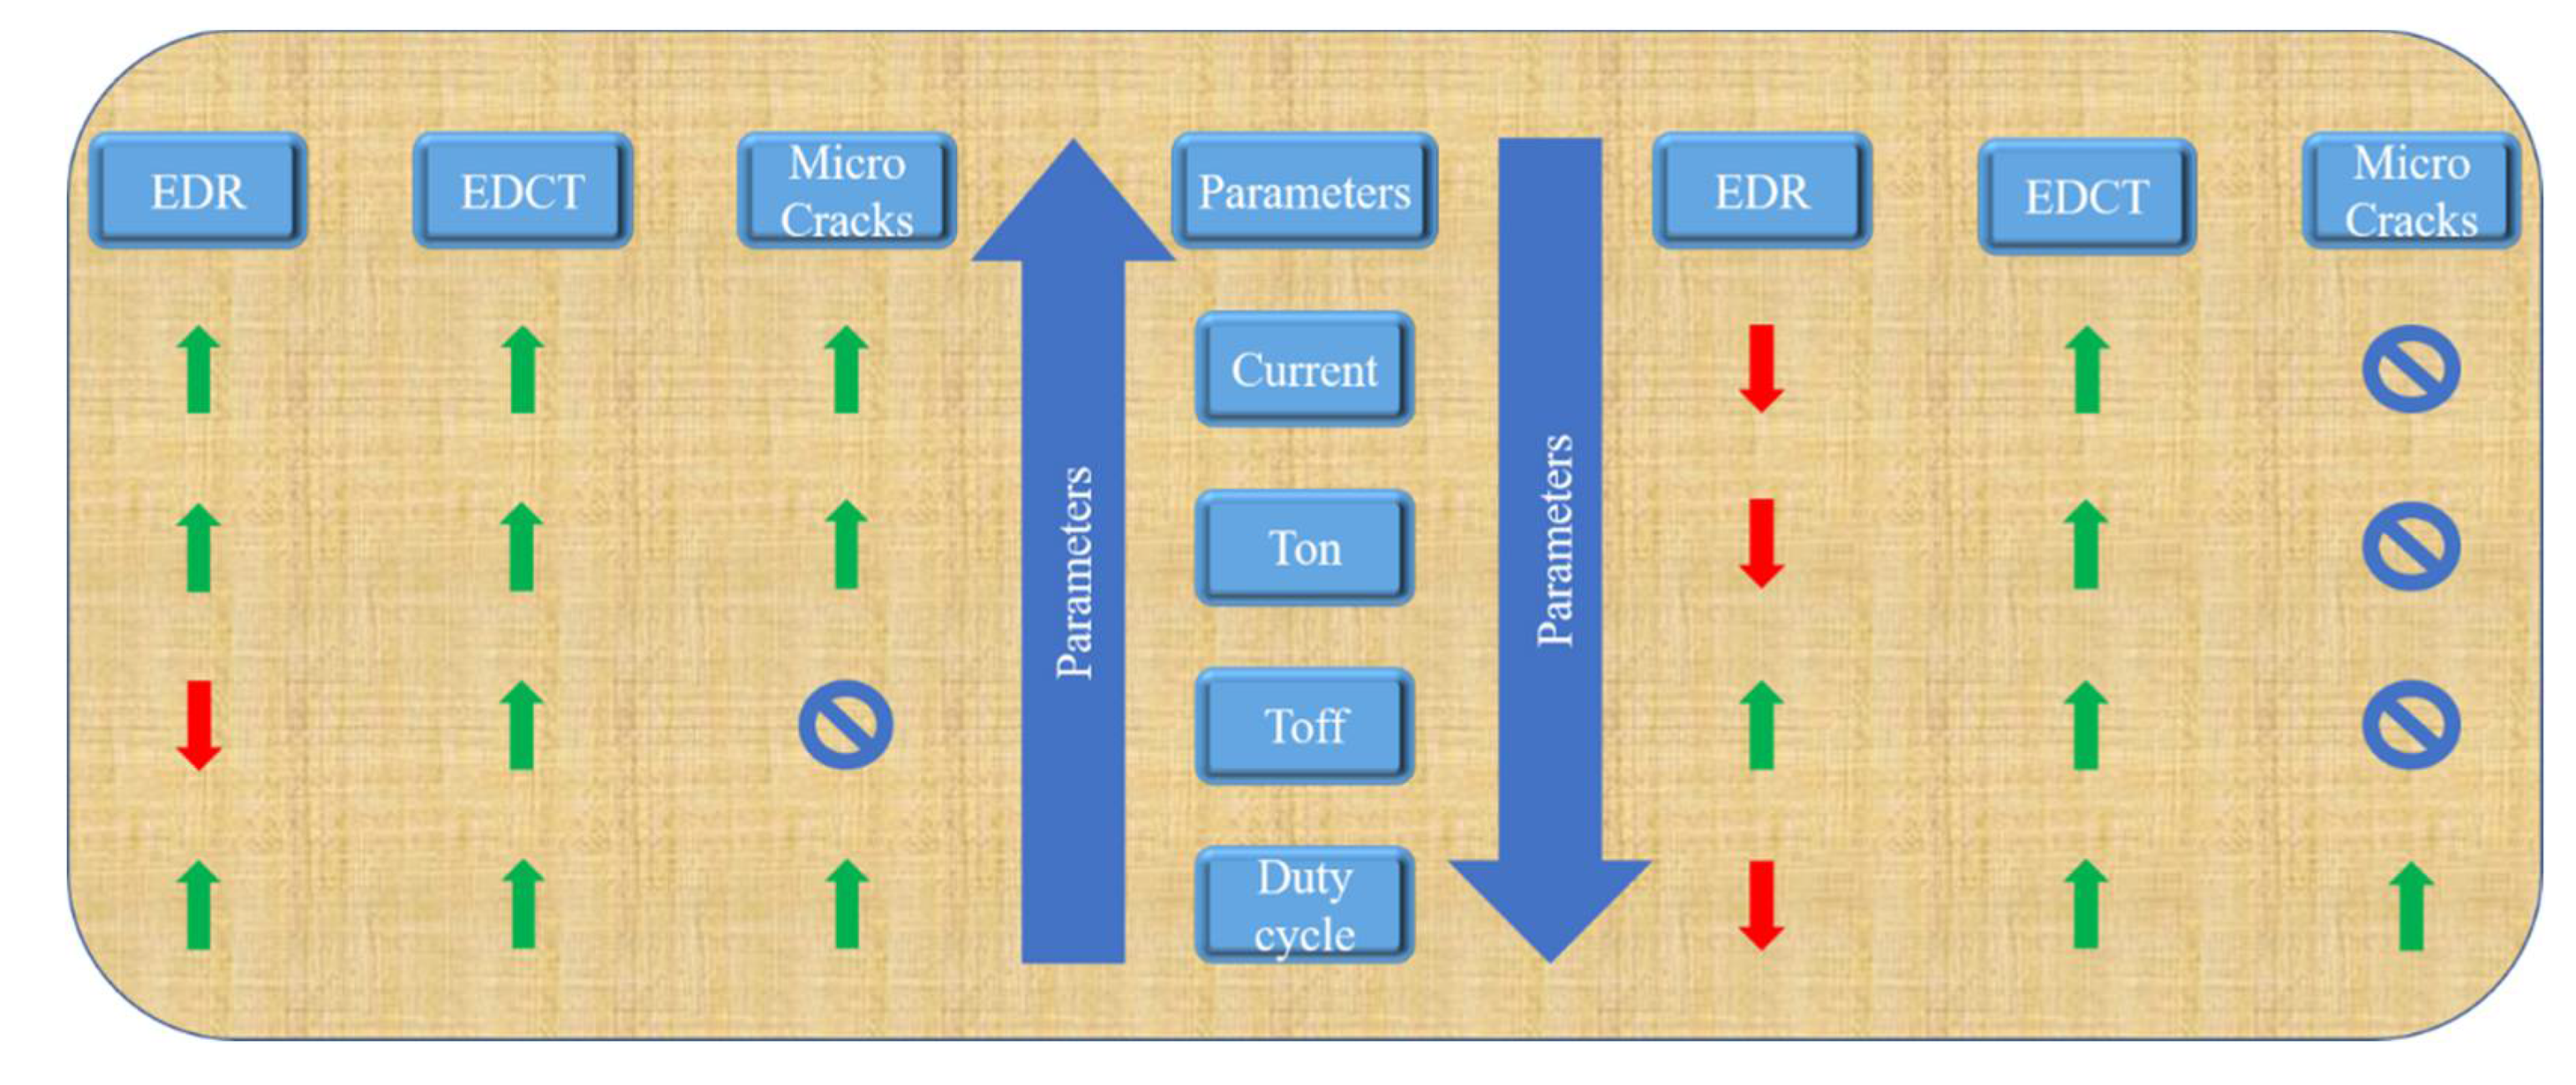
A study on the related work carried out by other researchers is summarized here. Tijo and Masanta [8] deposited a composite coating of TiC and TiB2 with improved hardness (three times) and wear properties (seven times) on the coated surface as compared to that of the substrate (Ti-6Al-4V). As the value of peak current and duty factor increases, the rate of deposition increases, but after that, some values of peak current, deposition rate starts decreasing owing to high discharge energy. The erosion of the workpiece also increases; as such, the combined effect of deposition and erosion of the workpiece results in a decrease in deposition rate. Similarly, WS2 coating was performed on Ti-6Al-4V by Mohanty et al. [9] through the micro-EDM process. They used WS2 powder particles of average size 15 μm, mixed with deionized water. High thermal energy from the electrical sparks was deposited on the tool material and WS2 on the surface of the workpiece. In the work of Sergey N. Grigoriev et al. [10], a comprehensive study of two different dielectric fluids and two machines on Al2O3 + 30% of TiC was considered for the experiments varying the input parameters and estimation of tool material and dielectric fluid influencing the chemical changes on machining surface. Pay Jun Liew et al. [3] have authored a review considering the previous research on electrical discharge coating. The parameters and material characteristics of various EDC processes for various materials were discussed and compared. Powder Mixed Electrical Discharge Machine (PMEDM) and Powder Metallurgy (PM) electrode methods are effective solutions for realizing EDC. In the paper authored by Marina A. Volosova et al. [11], three different approaches using wire EDM processing methods for non-conductive structural and functional ceramics based on ZrO2, Al2O3, and Si3N4 were tried and also added powder assistance in a dielectric medium. Muhammad Kashif Bangash et al. [12] carried out the Ti-6Al-4V workpiece using a micro-wire EDM process to improve the adhesion and joint strength in this case. Machined different shapes V, U, and semi-circle micro slots producing on the surface and then overlapping the two workpieces by applying that commercial epoxy adhesive mixture. Machining slots and heat treatment was carried, and the shear strength and feature analysis were found.
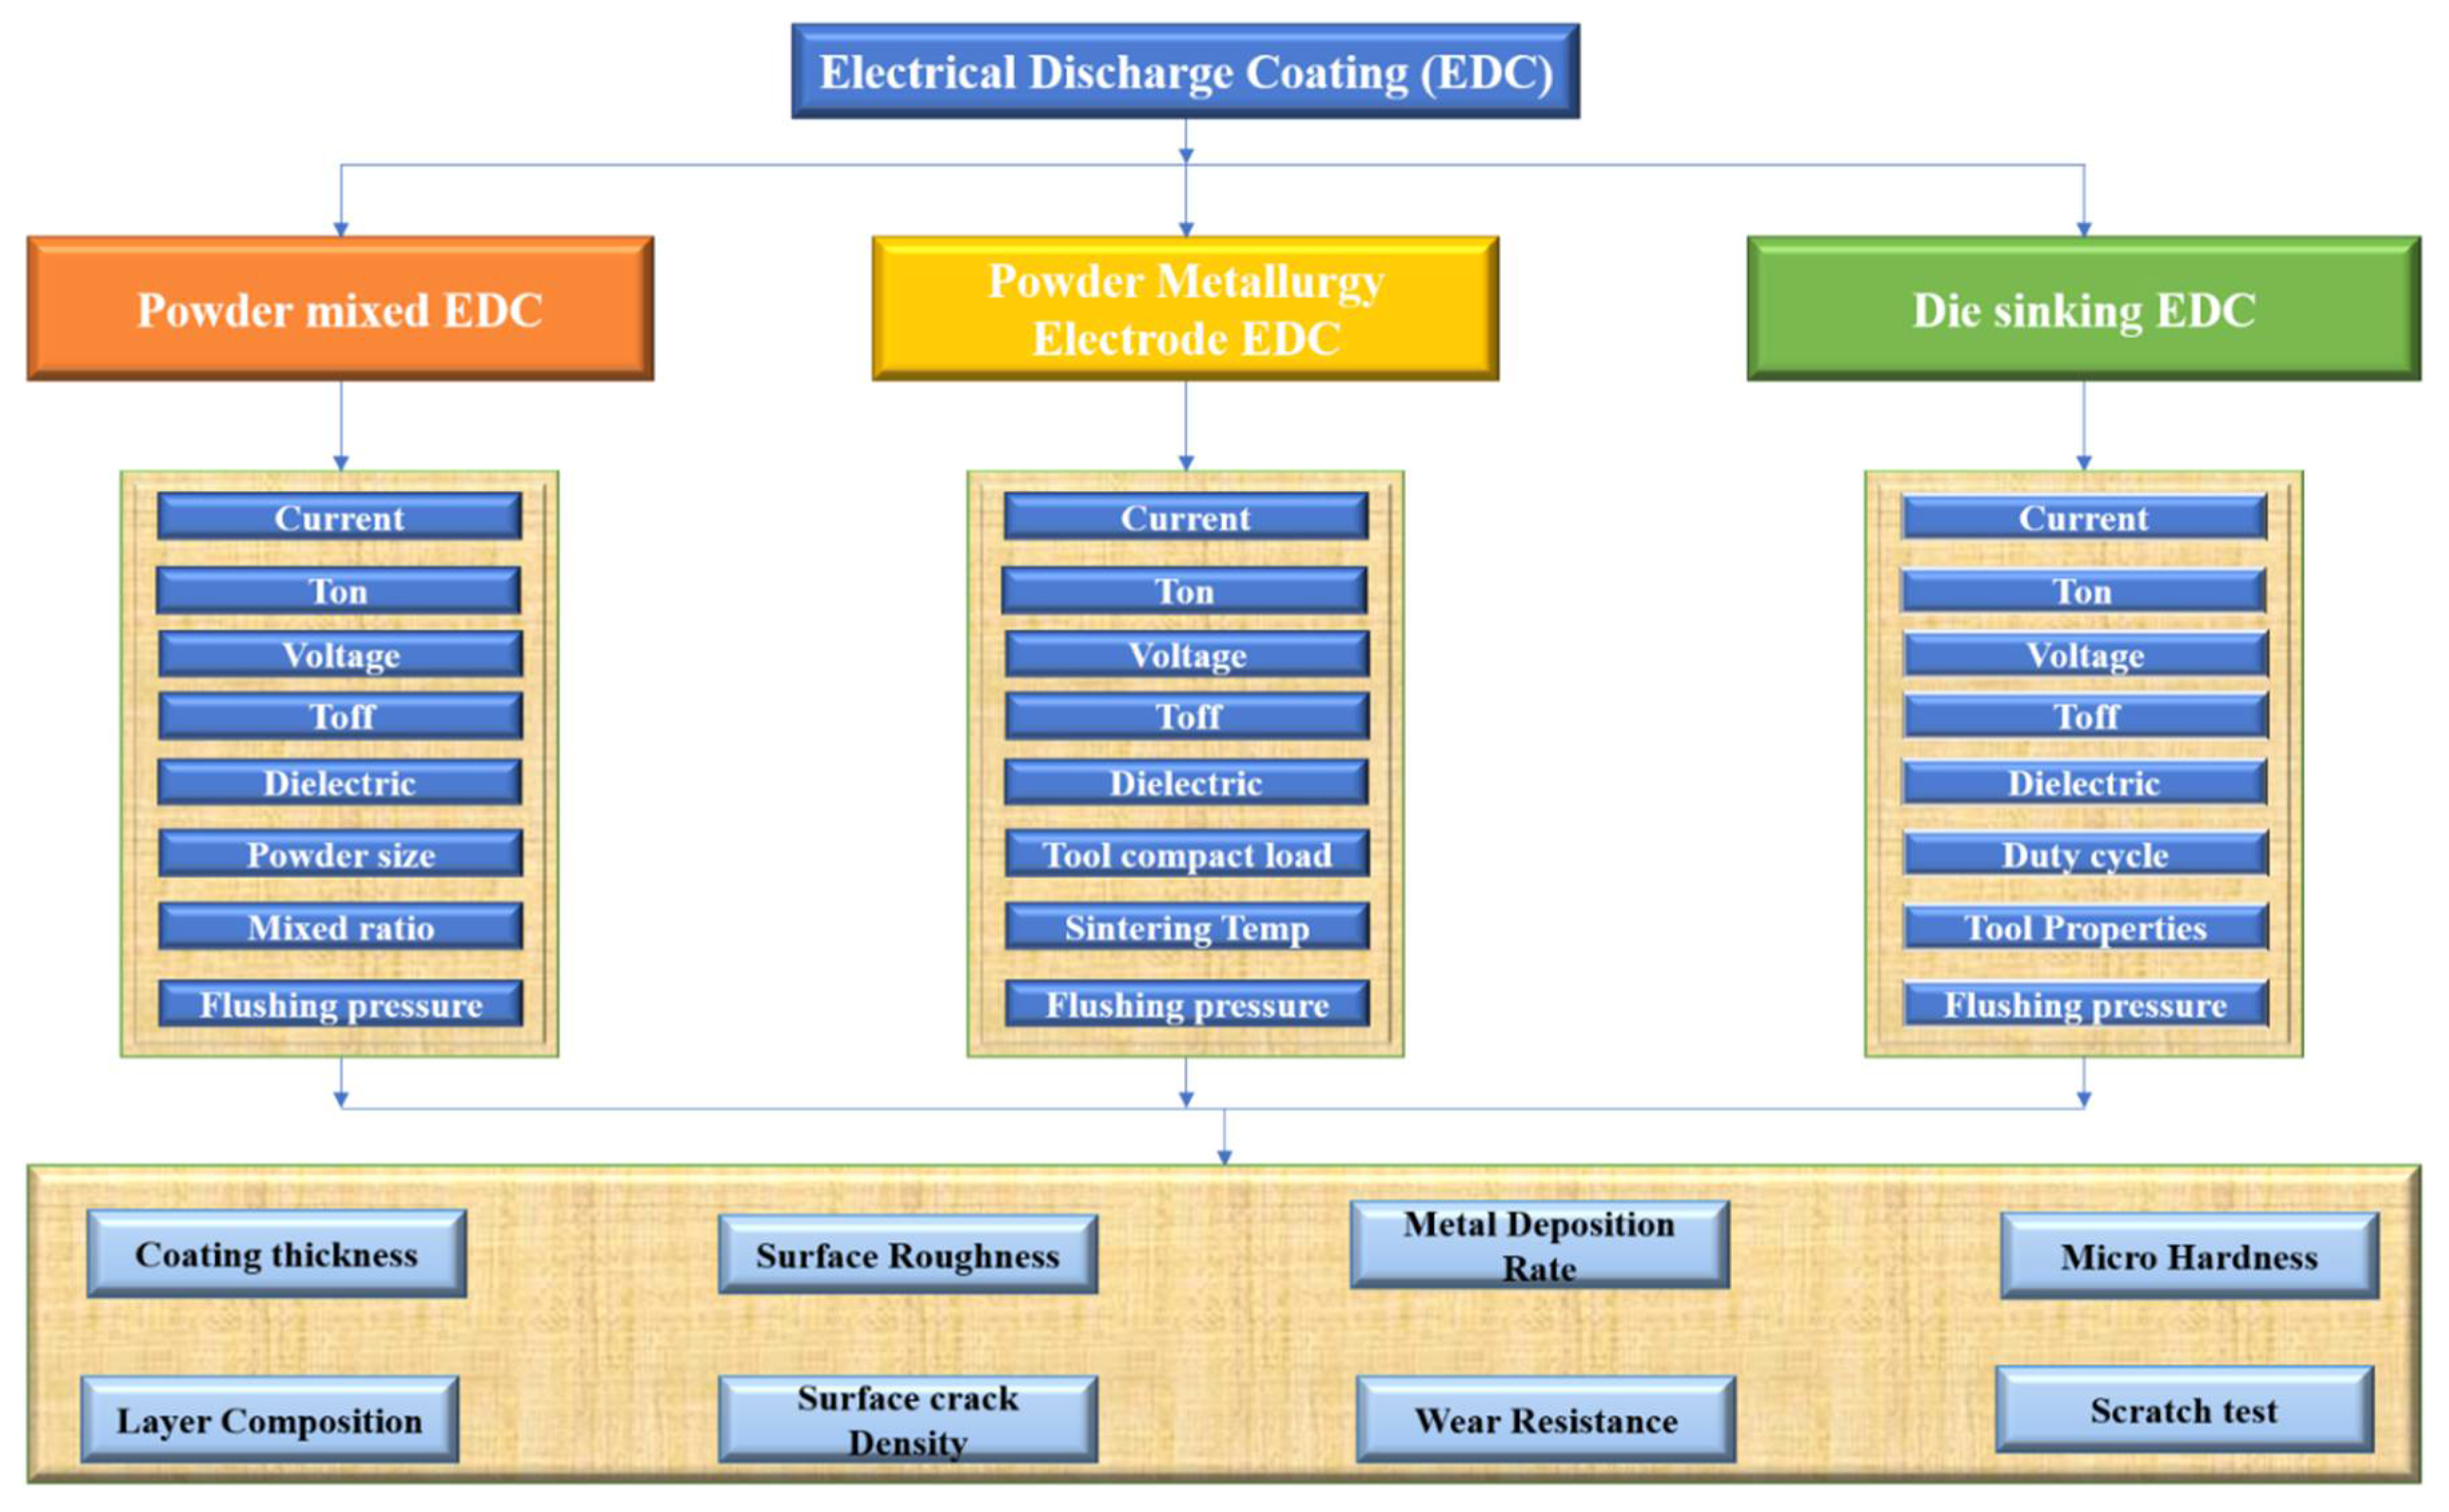
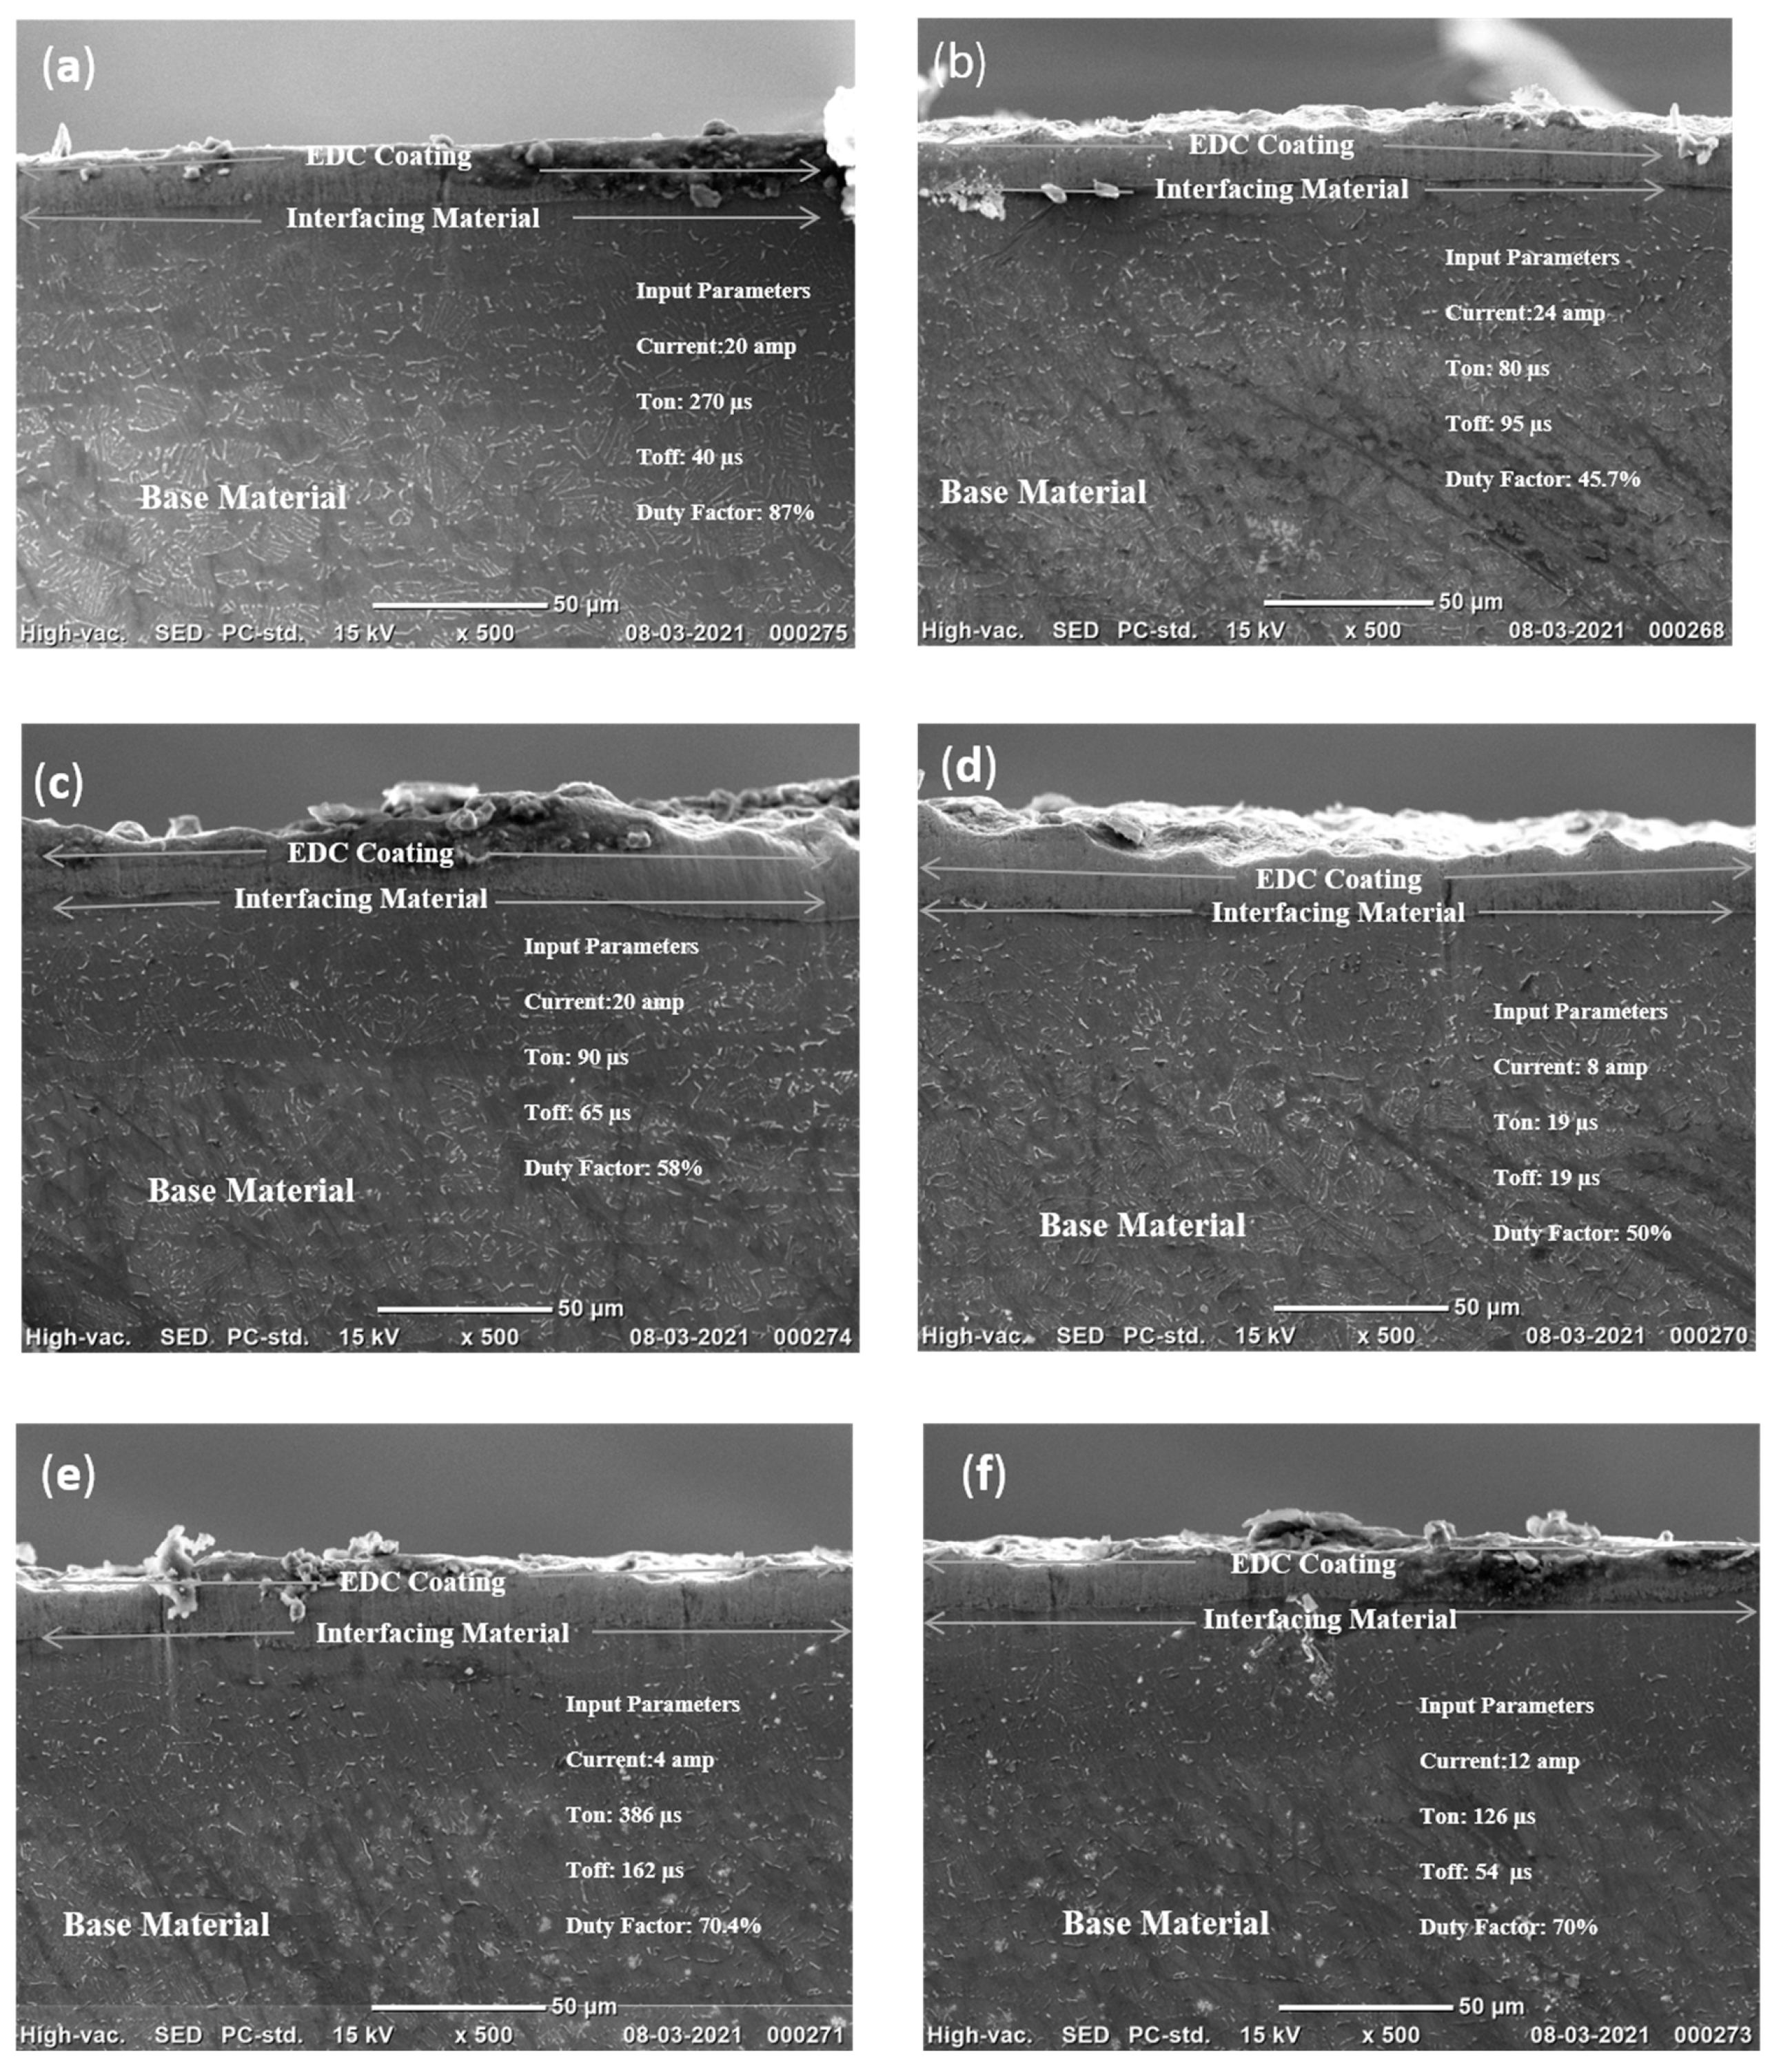
The properties considered in a different procedure carried out in the EDM machine are shown in Figure 4. In our case, for Die-Sinking EDC, duty cycle, tool properties, and flushing pressure were considered differently than the other procedures (Powder Mixed EDC and Powder Metallurgy Electrode EDC).
Water and wastewater treatment facilities [17,18] are difficult to maintain due to ambient exposure. The tanks used for settling treated wastewater in each step, pumping, sludge tanks [19] clarifying and filtering processes are based on steel and concrete, which is vulnerable to corrosion and sandy. Additionally, corrosive chemicals and aging infrastructure are problematic. In that case, there’s a need for high-performance and durable coating solutions. Coatings used in wastewater treatment facilities must be resistant to corrosive chemicals such as hydrogen sulfide [20,21] because these acids and other acidic compounds can cause cracking and corrosion in unprotected concrete in wastewater treatment facilities. Metal coatings such as Cu and Si [22] for the water and wastewater treatment processes increase durability and are anticorrosive [23] antiviral, and photoactive. The copper coating would be useful starting from the collection systems, through the clarifiers, digesters, headworks of the treatment process, and secondary containment and storage structures to reduce corrosion [3] and to protect the surface. Besides these physical and chemical properties, copper coatings would be advantageous from an antiviral application point of view. Cu coatings, i.e., virucidal properties of copper alloy and copper surfaces, have been tested in several studies. It was proven that a small percentage of copper had a significant effect on virucidal properties [7]. In another study on copper alloys, rapid inactivation of human coronavirus 229E was observed, and Cu/Zn brasses were very effective at lower copper concentrations. The viral genomes got inactivated because of exposure to copper and irreversibly affected virus morphology, including disintegration of envelope and dispersal of surface spikes in Human Coronavirus 229E, used as a surrogate for the more virulent coronaviruses responsible for SARS, MERS, and now COVID-19 [24].
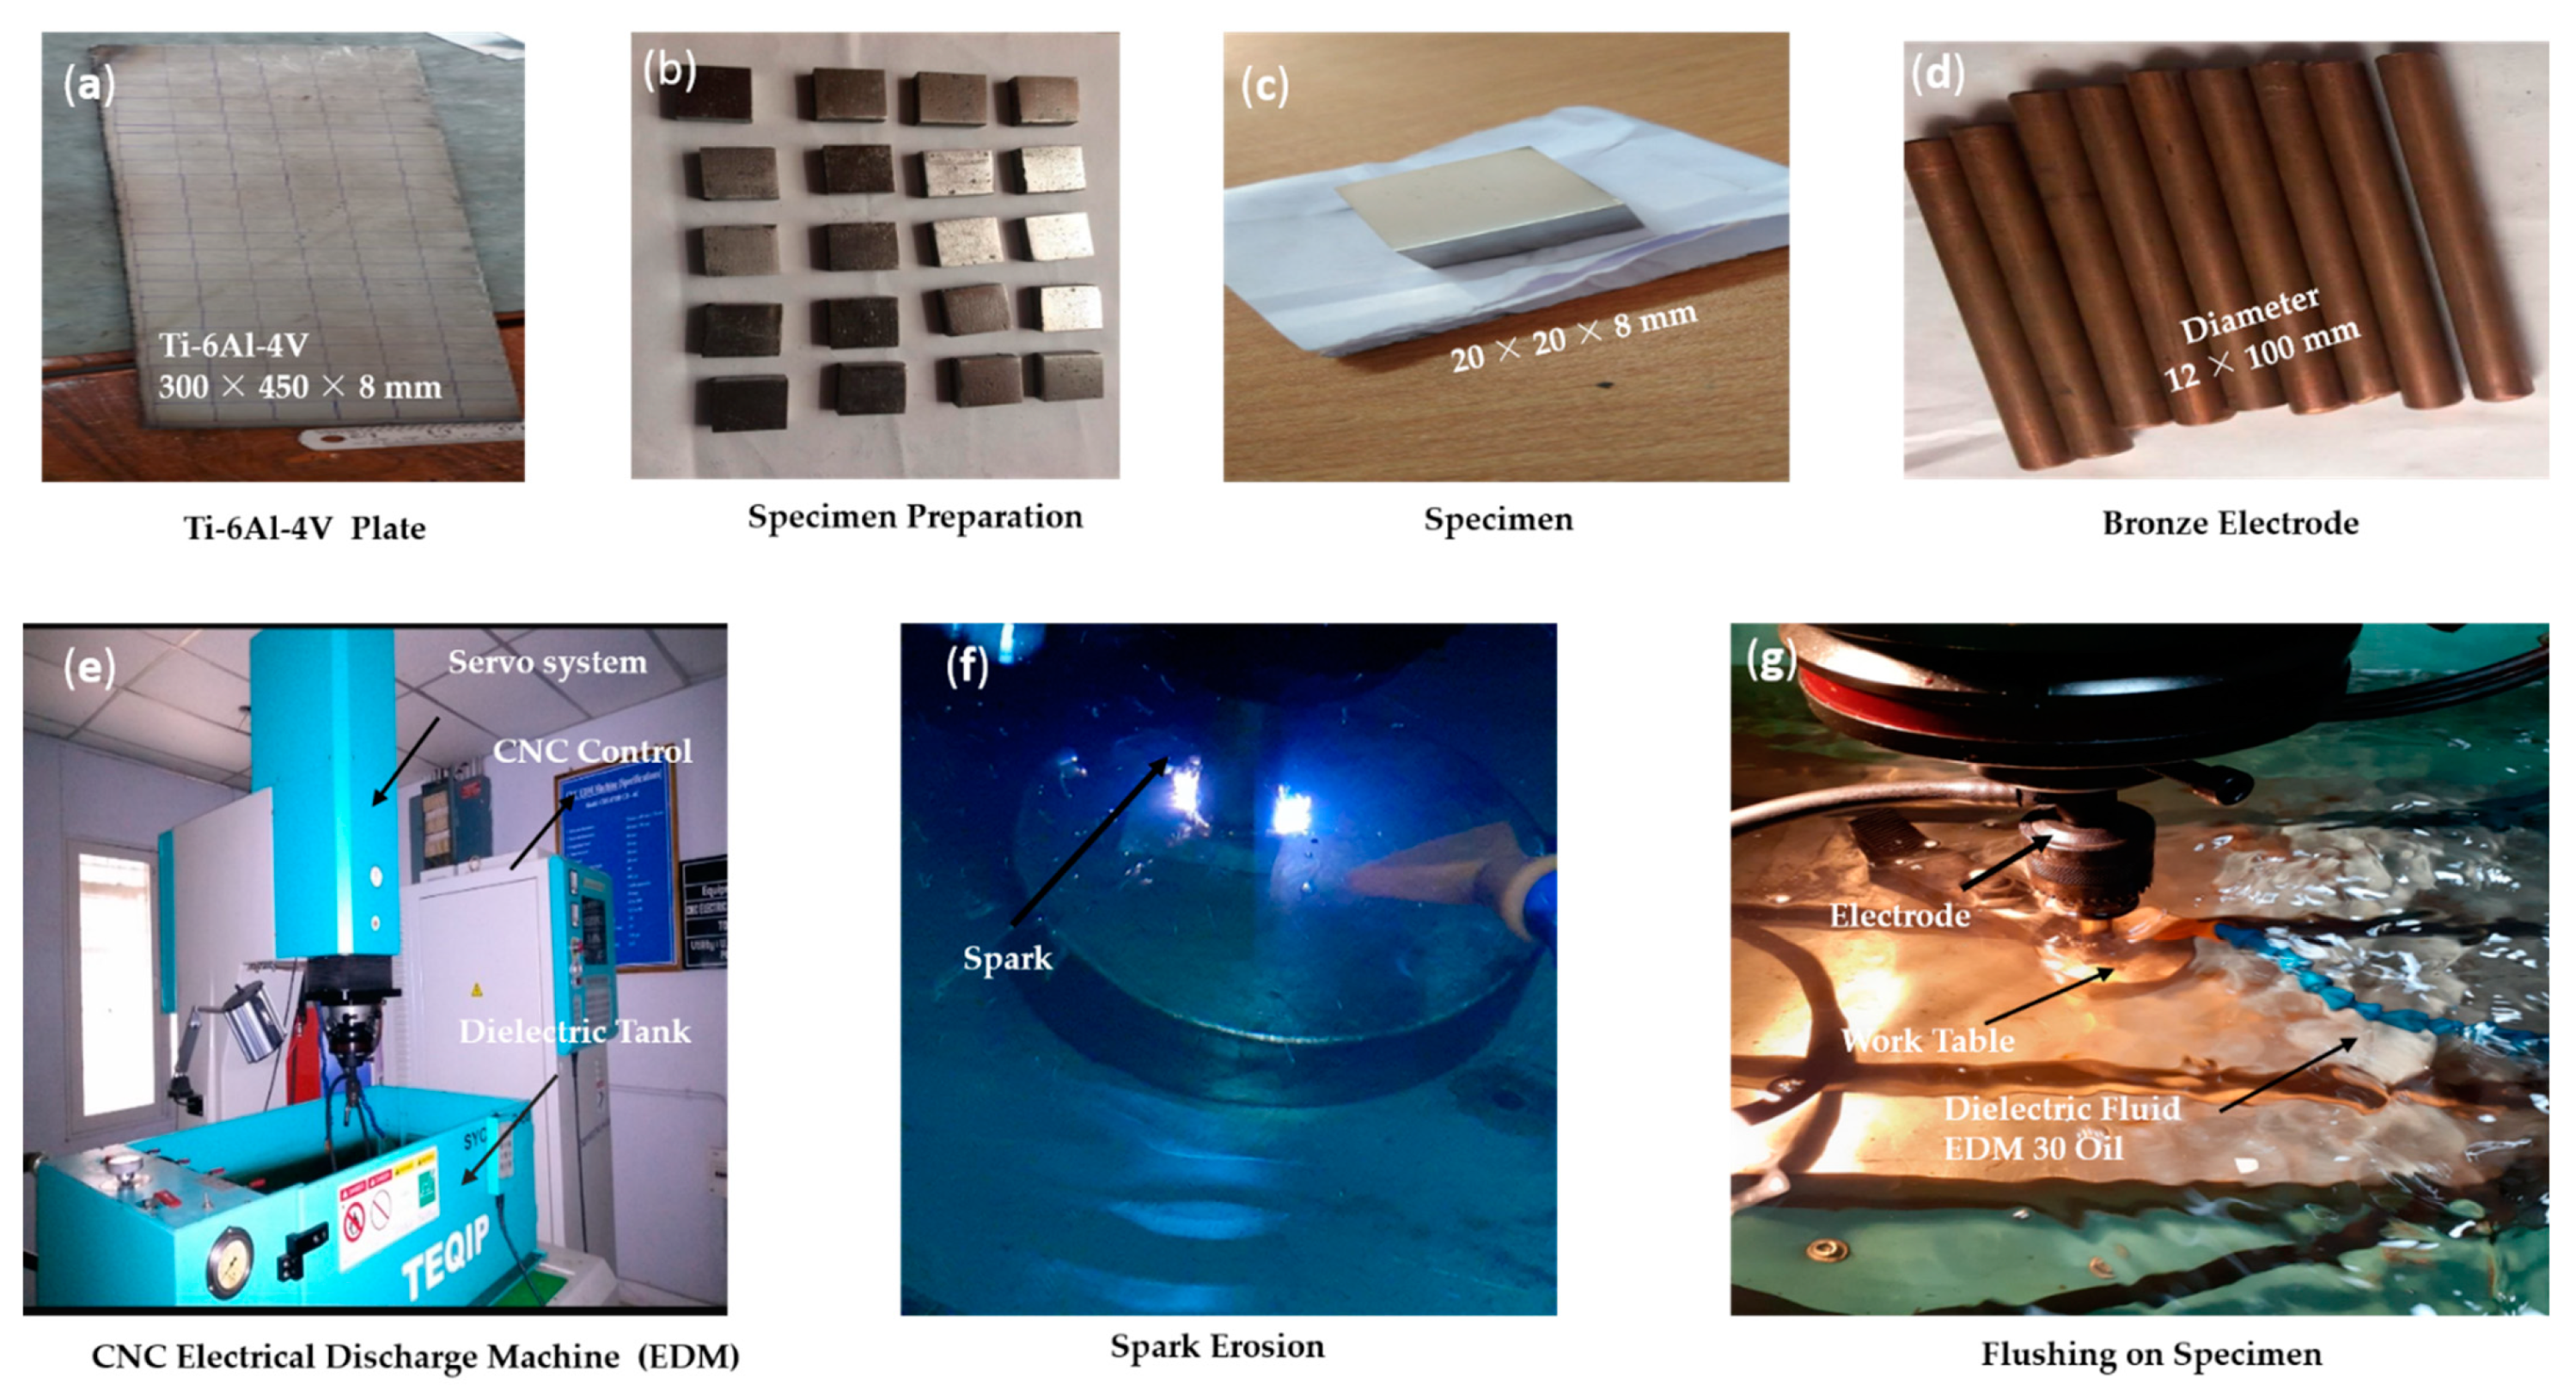
In this work, a conventional electrode of the copper alloy was coated on titanium alloy (Ti-6Al-4V) using the already available EDM machine for the first time. The parameters required to coat on EDM are found by the trial-and-error method in this work. The parameters influencing the experiments are optimized using different optimization techniques in which two new techniques (−nD angle and information divergence) are introduced.

2. Materials and Methods

2.1. Materials

Titanium alloy (Ti-6Al-4V) of size 20 mm × 20 mm × 8 mm and bronze of size 100 mm of length and diameter of 10 mm were considered as workpiece and electrode, respectively, whereas EDM 30 was used as dielectric fluid. Table 1 shows the chemical composition, density (kg/m2), melting point (°C), specific heat capacity (J/g °C), and hardness for the electrode and substrate.
Table 2 shows the experimental levels for the input parameters such as current, Ton, Toff, and Duty Cycle formed manually by trial-and-error method.

Influence of Parameters on Electrical Discharge Coating

Surface topography, surface quality, and homogeneity of the coatings depend upon the input parameters, i.e., current, Ton, Toff, and Duty Cycle. Table 2 shows the experimental input parameters, and Table 3 shows its combination. A combination of parameters was prepared by initially taking the Taguchi L9 design but then changing it manually depending upon the deposited coating. The combination was prepared by trial-and-error method.
Electrode   Deposition   Rate   ( EDR ) = WBM   WAM   Time ( g / min )  
where WAM = Weight after machining, WBM = Weight before machining.
While trying to fix the input parameters, it was understood that with a decrease in current from 24 A to 4 A, and by maintaining duty cycle (which comes with a relationship of Ton and Toff) in the range of 45% to 87%, the surface morphology of coating increased. Moreover
Duty   cycle   = T on T on + T off × 100 %  
where Ton = Pulse on time, Toff = Pulse off time.
Additionally, there was a development of Cu-containing craters at the surface. Figure 5 shows an uncoated and coated substrate with its surface morphology and composition using EDS.

2.2. Methods

2.2.1. Grey Relational Analysis (GRA)

Step 1: The first step of GRA is a process of grey relational generation in which normalization of data for the responses should be generated considering the criteria of higher the better or lower, the better. Since higher EDR, Electric Discharge Coating Thickness (EDCT), Cu%, and Zn% are desired, the higher the better criterion was followed in our case.
Step 2: Therefore, a comparability sequence as indicated in Equation (3) was generated by considering parameters of the translated, where I is the serial number of the schemes, Xi (k) refers to the value of each parameter,, max Yi (k) refers to the maximum of Yi (k), k is the serial number of the criteria min Yi (k) refers to the minimum Yi (k), and the standard comparability sequence can be referred by Xi (k). Firstly, the higher-the-better criterion can be expressed as Equation (3).
X i ( k ) = Y ( k ) min Y i ( k ) / max Y i ( k ) min Y i ( k )
Secondly, the expression Equation (4) is preferred for the lower-the-better criterion.
X i ( k ) = max Y i ( k ) Y i ( k ) / max Y i ( k ) min Y i ( k )  
The range of [0, 1] was scaled for all the candidate criteria values upon completion of the grey relational generating procedure [25].
Step 3: Closeness of a comparability sequence with the reference sequence was defined using the deviation sequence.
Δ oj = kx 0 ( k ) x i ( k )
Here, x0 (k) = 1, k = difference of absolute value xi (k) and xo (k) (3). let delta = difference of absolute value. Deviation sequence measures the distance between the reference sequence and the comparable sequence (value of 1). For instance, values closer to 1 could be considered remote values to the reference sequence and vice versa.
Step 4: The correlation coefficients of each reference sequence and comparison sequence on the corresponding elements were calculated. This correlation coefficient is termed a grey relational coefficient. ξi (k) is referred to as the grey relational coefficient as shown in Equation (6).
ξ i ( k ) = [ Δ min + ψ Δ max ] [ Δ O i ( k ) + ψ Δ max ]  
In the given Equation (6), a value of 0.5 will usually be given for the distinguishing coefficient (ψ) since a smaller value means a stronger discrimination ability among parameters and a bigger difference between correlation coefficients. By referring to the literature, a mid-value, i.e., 0.5, was selected to be the best possible value for the distinguishing coefficient [26]. The closeness of Xo(k) and Xi (k) could be determined by a higher value of the grey relational coefficient. Where ∆min and ∆max are the minimum and maximum of Xi (k), respectively, and delta is the distinguishing coefficient between [0, 1].
Step 5: Deng’s degree of grey incidence or grey relational grade (GRG) is a degree of partial proximity between two curves, which estimates the average of grey relational coefficients at each point (k). A measure of geometrical distance closeness between two curves can be termed GRG. GRG between the sequences, in our case, between experiments, represents the level of correlation between the comparability sequence and reference sequence. Generally, the optimal choice will be selected for the one with the highest grey relational grade between the reference sequence and the comparability sequence. By averaging the grey relational coefficients, the grey relational grade γi can be computed as
  γ i = 1 n n ( k ) = 1
The highest value among GRGs is selected to be the best choice.

2.2.2. TOPSIS

Step 1: In this method, the first step is to develop a decision matrix. This method consists of attributes in the columns and alternatives in the row. The matrix format can be expressed as [27].
D = a 1 . m [ X 11 X 1 n Xm 1 Xmn ]
Here, a (i = 1,2,3,……m) = represents all possible alternatives, j = 1,2,3,…n and xij represents the performance of i with respect to attribute j and x (j = 1,2,3,…n) = represents the attributes related to performance of alternatives.
Step 2: In this step, the above decision matrix is normalized and we get a normalized decision matrix γ ij . The formula for rij is given below
γ ij = x ij i = 1 m x ij 2
Step 3: Here, using Equations (10) and (11), a weighted normalized decision matrix can be calculated.
V = [ v iJ ]
j = 1 n w j = 1  
Step 4: Here, negative ideal solutions (worst) and positive ideal solutions (best) need to be calculated in this step. The solutions can be represented as a positive best (ideal) solution
a + = { ( max v ij , j J ) ( min v ij   J ˙   J )   J } v = { v 1 + , v 2 + , v 3 + . vj + vn + } .  
a = { ( min v ij , j J ) ( max v ij   J ˙   J ) J } v = { v 1 , v 2 , v 3 . vj vn }
Here,
J = { j = 1 , 2 , 3 , . n } ,   J   = { j = 1 , 2 , 3 , n }
J′ and J are associated with the non-beneficial and beneficial attributes.
Step 5: Now, the calculation of Euclidean distance of each alternative from a negative ideal solution and positive ideal by using the following equations:
D i + = i = 1 n ( v ij v i + ) 2 ,   i = 1 , 2 , 3 , . m  
D i = i = 1 n ( v ij v i ) 2 ,   i = 1 , 2 , 3 , . m  
Step 6: Here, the relative closeness of ideal solution for each alternative is calculated by using the Equation is given below
C i + = D i D i + + D i ,   i = 1 , 2 , 3 , . m ; 0 C i + 1
Step 7: Here, ranked according to the order of preference. The alternative of maximum relative closeness should be the best choice. +Ci is termed as MPCI (Multi-Performance Characteristic Index) in TOPSIS.

2.2.3. −nD Angle and Information Divergence Method

These two are trigonometric methods that are used in the field of remote sensing to find out similar spectra [28]. This was introduced in this field to check whether this gives similar results as the optimization technique GRA or Multi-Criteria Decision Method (MCDM), which is TOPSIS. The name −nD angle was given by us for the first time, which refers to divergence angle as shown in Equation (17). Given the test vector t and a reference vector r of length C, score a is calculated as
a = cos 1 [ i = 1 C t i γ i 1 = 1 N t i 2 i = 1 N γ i 2 ]
The information divergence method computes similarity based on the divergence between the probability distributions of the two vectors. Let r and t be the reference and test vectors, respectively. Calculate the distribution values for the reference vector as
q i = γ i i = 1 c γ i  
Calculate the distribution value for the test vector as
P i = t i i = 1 N t i
Then, compute the ID value by using the probability distributions of the references and the test vectors.
i = 1 c p i log ( p i q i ) + i = 1 c q i log ( q i p i )  

3. Experimental Procedure

Figure 4 shows the flow of the process carried out for coating. Initially, a plate of titanium was obtained from Ramesh Steels Corporation Pvt. Ltd., Mumbai, and then it was cut into the required size of 300 m × 450 m × 8 mm using wire cut EDM. Then, the substrates were ground and polished with emery paper sizes 50, 100, and 200 microns. The substrates after all those processes were shown in Figure 5c.
The electrodes were directly obtained in the required diameter, and then it was cut into the length of 100 mm. The EDM machine for coating is available at the Production Engineering Lab, Osmania University. This machine is of CREATER make and numerically controlled (CNC).

4. Result and Discussion

Electrical Discharge Coating was carried out on Ti-6Al-4V which is as shown in Figure 6. This section explains the results obtained with parameters considered and optimized with respect to results.

4.1. Study Surface Morphology

In total, six experiments were planned with a combination of parameters shown in Table 3. Corresponding Scanning Electron Microscope (SEM) images were shown in Figure 7.
These SEM images were taken to show the difference between normal surface and coating surface and the machining spatter occurring due to high flushing pressure of 0.75 bar.
It was observed that with a reduction in flushing pressure and melting of an electrode (due to high current at 24 A and 20 A), the machining spatter was reduced and led to better surface coating.
The output parameters considered for optimizing the input parameters and examining the coating properties were EDR/ EDCT and micro-cracks. Table 4 shows the output parameters for all the experimental combinations. WBM and WAM represents the weight of the substrate before and after machining as shown in Equation (1). In contrast, the electrodeposition rate is the ratio of change in substrate weight after machining to the time taken. EDC1, EDC2, and EDC3 are the thickness of the coating at three random places on the SEM image of the substrate’s cross-section. The average in the table represents the average of thicknesses at three places. Micro-cracks on the coating were also tabulated, which was measured using SEM image as shown in Figure 8. Using the measurement of micro-cracks, it was understood that the first three combinations of experiments were not suitable though they can give a better deposition. The figure depicted that coating obtained with experimental numbers 1, 2, and 3 have the micro-cracks formation of size 2.2, 1.5, and 3 microns. It was observed from EDR and input parameters that an increase in discharge rate and current leads to micro-cracks, and lower EDR gives better surface characteristics.

4.2. Chemical Composition of Coatings

SEM inspected the composition of obtained coatings with Energy Dispersive X-ray Spectroscopy (EDX). It was understood from Figure 9 that a higher copper percentage was obtained in the coating deposited with the parameters of experiment 4 having current, Ton, Toff, and Duty cycle as 8, 19, 19, and 50, respectively. In comparison, a lower copper percentage was obtained for 75.12% and Zn 8.14%.

4.3. Layer Thickness

The investigation of mechanically polished and chemically etched coatings, using scanning electron microscope on the cross-section of coating, showed major variations in the thickness of the layer as a function of process conditions. For example, the SEM image of Figure 10 shows the edge of the cross-section in a coated region of a sample processed under different conditions, as mentioned. It was understood that with an increase in current and duty cycle, the thickness of coating also increases but coating resulted in micro-cracks formation. Considering this result, the process in vice versa was investigated and found better results.
Figure 10 show cross-section SEM images and its associated line for the thickness of layer, for the developed coatings, as a function of increasing duty cycle and current. It is evident that layers become thicker gradually (Figure 10a from 15.9–19.9 μm) and are more discontinuous as the parameter combination (current 20 A, Ton 270 µs, Toff 95 µs). Meanwhile, there is a moderate layer thickness (Figure 10c from ~18 to 19 µm) and crack-free with decreasing input parameters (current 4 A, Ton 19 µs, Toff 19 µs).

4.4. Material Interfacing

In order to gain insight into the fine-scale microstructure, Figure 11 presents a SEM cross-section, which was prepared by cutting the coating by Wire EDM, and then the preparation of substrate was carried out by polishing. It can be evident from the SEM image that it is possible to view the base material, the interface, and the coating material.
Figure 11 provides more details about the interfacing and bonding of coating on the base material. It was observed that with an increase in current, heat generates and damages the base material, as shown in Figure 11c. Moreover, the deposition rate was high due to the current and coating surface was uneven.

4.5. Optimization of EDC Process Parameters

In order to find the suitable parameters for coating copper alloy using EDM, this study was conducted. The output parameters considered for the study were EDR, EDCT, Cu%, and Zn% as shown in Table 5. For the zero micro-cracks, obtained experiments were focused to obtain a maximum of all the parameters.

4.5.1. Grey Relational Analysis

As explained in the previous chapter, this analysis had four steps involved in it. Firstly, the output parameters were normalized using the formulae shown in Equation (3) for a grey relational generation. Normalization of parameters was generated considering the higher better criterion, which is called a grey relational generation. In our case, the higher, the better was followed because there was a need to have a high deposition rate without micro cracks, higher thickness, higher copper and zinc percentage apart from foreign particles.
It can be observed from Table 6 that all the candidates have values ranging from [0, 1], which represent minimum and maximum values. Table 7 shows the valves obtained after the deviation sequence using Equation (5).
The value of the deviation sequence measures the distance between the reference sequence and the comparable sequence. The comparable sequence value was considered as one in this study. If the deviation value is close to one, it represents the reference sequence and comparable sequence are far from each other.
Grey relational coefficient generation was calculated using the formulae shown in Equation (6). Table 8 shows the values of the grey relational coefficient generation. The maximum value of one was obtained for EDR, EDCT, Cu%, and Zn% at experiments 6, 4, 4, and 5, respectively.
Grey relational grade generation was the final step of this process. It can be observed in Table 9 that rank one was obtained for experiment 4, which represents the sequence of input parameters used for conducting this experiment are better than the other two experimental parameters.

4.5.2. TOPSIS

Similar to GRA, TOPSIS also has a step-by-step procedure involving seven steps. The formulae used to calculate at each step was shown above.
The formation of a matrix using the output parameters is the first step involved in this process. It helps in processing data more easily and efficiently. The first step is required to assign weights to the parameters, but here equal weightage was given to all the parameters, so this step was neglected. Only a decision matrix was formed, as shown in Table 10.
Table 11 shows the normalized decision matrix because, generally, there are benefit attributes and cost attributes in an MCDM problem. Transformation of various attribute dimensions into non-dimensional units and facilitate inter-attribute comparisons. Equation (9) was implemented to obtain the values shown in Table 11.
Since equal weightage was given to all the output parameters, 0.25 was considered. Thus, each value in Table 12 was multiplied with 0.25 to the value and obtained the weighted normalized decision matrix.
The positive ideal solution minimizes the cost criteria and maximizes the benefit criteria; on the contrary, the negative ideal solution maximizes the cost criteria and minimizes the benefit criteria. Here, the parameters that we required were considered positive ideal solution maximum of all parameters, whereas those that were not required were considered negative ideal solutions (minimum of all parameters) as shown in Table 13.
In this step, the calculation of distance measure from the positive and negative ideal solution was calculated and tabulated in Table 14. D+ and D stands for distance from positive and distance from negative, respectively, as shown in Equations (14) and (15).
The last step was to calculate the relative closeness using the formulae shown in Equation (16). The values are tabulated in Table 15, and it can be observed that experiment 2 has higher closeness and takes the rank of 1.

4.5.3. nD Angle and Information Divergence (ID)

The values tabulated in Table 16 are for −nD angle and ID angle values obtained using Equation (17), whereas 1D was obtained using Equation (20). It can be observed that the angle nearest to the reference values are obtained for experiment number 2 for both −nD angle and information divergence method. Whereas TOPSIS gives similar results like this, it can be understood that it is an easy process with only one formula to obtain similar results as TOPSIS, a seven-step method.

4.5.4. Parametric Study

Figure 12 depicts that with an increase in input parameters (current, Ton, and Duty Cycle), EDR increases. In contrast, EDCT increases with an increase in all input parameters. Moreover, micro-cracks increase with the increase in current, Ton, and Duty Cycle. With the decrease in input parameters, EDCT maintains the incline but consumes more time because the deposition rate declines with a decrease in input parameters. The coating becomes crack-free with comparatively less value of input parameters except for the duty cycle.

5. Conclusions

In this work, an electrical discharge machine with a conventional electrode was used for the first time to coat copper alloy on Ti6Al4V material. The main critical task in this coating process is to fix the suitable input parameters viz. current, Ton, Toff, and duty cycle. Higher coating thickness was obtained at (current 20 amp Ton 90 µs Toff 65 µs and duty cycle 58%) with the thickness of 19.96607 µm. It was understood that if current increases, material deposition, coating thickness, and micro-cracks also increase.
Continuation of this research work would concern the optimization process. Hence, crack-free coating obtained with three different experimental parameters was used to study these methods, and we understood that −nD angle and information divergence behave like TOPSIS. Moreover, we understood that an internal coating can be produced with EDM that has wider application in its wastewater treatment facilities.

Author Contributions

Conceptualization, J.R.M., S.V., R.U.S., and B.K.; methodology, J.R.M., S.V., and R.U.S.; investigation, J.R.M., S.V., and R.U.S.; software, J.R.M., R.U.S., and S.V.; resources, J.R.M., S.V., and B.K.; data curation, J.R.M., S.V., and R.U.S.; writing—original draft preparation, J.R.M., S.V., and R.U.S.; writing—review and editing, J.R.M., S.V., and R.U.S.; supervision, B.K. All authors have read and agreed to the published version of the manuscript.

Funding

This research received no external funding.

Data Availability Statement

Not applicable.

Acknowledgments

Authors would like to thank S Arun Kumar, Technician, Production Lab, Prof. A Krishnaiah, Production Lab In-Charge and Prof. Rega Rajendran, Head, Department of Mechanical Engineering, University College of Engineering, Osmania University, for their full support while conducting experiments.

Conflicts of Interest

The authors declare no conflict of interest. The funders had no role in the design of the study; in the collection, analyses, or interpretation of data; in the writing of the manuscript, or in the decision to publish the results.

References

  1. Wang, Z.L.; Fang, Y.; Wu, P.N.; Zhao, W.S.; Cheng, K. Surface modification process by electrical discharge machining with a Ti powder green compact electrode. J. Mater. Process. Technol. 2002, 129, 139–142. [Google Scholar] [CrossRef]
  2. Janmanee, P.; Muttamara, A. Surface modification of tungsten carbide by electrical discharge coating (EDC) using a titanium powder suspension. Appl. Surf. Sci. 2012, 258, 7255–7265. [Google Scholar] [CrossRef]
  3. Liew, P.J.; Yap, C.Y.; Wang, J.; Zhou, T.; Yan, J. Surface modification and functionalization by electrical discharge coating: A comprehensive review. Int. J. Extrem. Manuf. 2020, 2, 012004. [Google Scholar] [CrossRef]
  4. Prakash, C.; Singh, S.; Pruncu, C.I.; Mishra, V.; Królczyk, G.; Pimenov, D.Y.; Pramanik, A. Surface modification of Ti-6Al-4V alloy by electrical discharge coating process using partially sintered Ti-Nb electrode. Materials 2019, 12, 1006. [Google Scholar] [CrossRef] [PubMed] [Green Version]
  5. Ueno, M.; Fujita, N.; Kimura, Y.; Nakata, N. Evaluation of coating and wear characteristics of roll surface coated with TiC by electrical discharge coating. J. Mater. Process. Technol. 2016, 236, 9–15. [Google Scholar] [CrossRef]
  6. Ahmed, A. Deposition and Analysis of Composite Coating on Aluminum Using Ti-B 4C Powder Metallurgy Tools in EDM. Mater. Manuf. Process. 2016, 31, 467–474. [Google Scholar] [CrossRef]
  7. Rakowska, P.D.; Tiddia, M.; Faruqui, N.; Bankier, C.; Pei, Y.; Pollard, A.J.; Zhang, J.; Gilmore, I.S. Antiviral surfaces and coatings and their mechanisms of action. Commun. Mater. 2021, 2, 53. [Google Scholar] [CrossRef]
  8. Tijo, D.; Masanta, M. Mechanical performance of in-situ TiC-TiB2 composite coating deposited on Ti-6Al-4V alloy by powder suspension electro-discharge coating process. Surf. Coat. Technol. 2017, 328, 192–203. [Google Scholar] [CrossRef]
  9. Mohanty, S.; Kumar, V.; Das, A.K.; Dixit, A.R. Surface modification of Ti-alloy by micro-electrical discharge process using tungsten disulphide powder suspension. J. Manuf. Process. 2019, 37, 28–41. [Google Scholar] [CrossRef]
  10. Grigoriev, S.N.; Volosova, M.A.; Okunkova, A.A.; Fedorov, S.V.; Hamdy, K.; Podrabinnik, P.A.; Pivkin, P.M.; Kozochkin, M.P.; Porvatov, A.N. Electrical discharge machining of oxide nanocomposite: Nanomodification of surface and subsurface layers. J. Manuf. Mater. Process. 2020, 4, 96. [Google Scholar] [CrossRef]
  11. Volosova, M.A.; Okunkova, A.A.; Fedorov, S.v.; Hamdy, K.; Mikhailova, M.A. Electrical Discharge Machining Non-Conductive Ceramics: Combination of Materials. Technologies 2020, 8, 32. [Google Scholar] [CrossRef]
  12. Bangash, M.K.; Casalegno, V.; Das, A.K.; de la Pierre des Ambrois, S.; Ferraris, M. Surface machining of Ti6Al4V by means of Micro-Electrical Discharging to improve adhesive joining. J. Mater. Process. Technol. 2020, 286, 116813. [Google Scholar] [CrossRef]
  13. Murray, J.W.; Algodi, S.J.; Fay, M.W.; Brown, P.D.; Clare, A.T. Formation mechanism of electrical discharge TiC-Fe composite coatings. J. Mater. Process. Technol. 2017, 243, 143–151. [Google Scholar] [CrossRef]
  14. Sales, W.F.; Oliveira, A.R.F.; Raslan, A.A. Titanium perovskite (CaTiO3) formation in Ti6Al4V alloy using the electrical discharge machining process for biomedical applications. Surf. Coat. Technol. 2016, 307, 1011–1015. [Google Scholar] [CrossRef]
  15. Mughal, M.P.; Farooq, M.U.; Mumtaz, J.; Mia, M.; Shareef, M.; Javed, M.; Jamil, M.; Pruncu, C.I. Surface modification for osseointegration of Ti6Al4V ELI using powder mixed sinking EDM. J. Mech. Behav. Biomed. Mater. 2020, 113, 104145. [Google Scholar] [CrossRef] [PubMed]
  16. Dileep, R.; Mishra, K.; Datta, S.; Masanta, M. Effects of Tool Electrode on EDM Performance of Ti-6Al-4V. Silicon 2018, 10, 2263–2277. [Google Scholar]
  17. Trinh, H.P.; Lee, S.H.; Jeong, G.; Yoon, H.; Park, H.D. Recent developments of the mainstream anammox processes: Challenges and opportunities. J. Environ. Chem. Eng. 2021, 9, 105583. [Google Scholar] [CrossRef]
  18. Ozgun, H.; Cicekalan, B.; Akdag, Y.; Koyuncu, I.; Ozturk, I. Comparative evaluation of cost for preliminary and tertiary municipal wastewater treatment plants in Istanbul. Sci. Total. Environ. 2021, 778, 146258. [Google Scholar] [CrossRef]
  19. Zheng, Y.; Zhou, Z.; Jiang, L.; Huang, J.; Jiang, J.; Chen, Y.; Shao, Y.; Yu, S.; Wang, K.; Huang, J.; et al. Evaluating influence of filling fraction of carriers packed in anaerobic side-stream reactors on membrane fouling and microbial community of the coupled membrane bioreactors. J. Hazard. Mater. 2020, 388, 122030. [Google Scholar] [CrossRef]
  20. Deng, Y.; Song, G.L.; Zheng, D.; Zhang, Y. Fabrication and synergistic antibacterial and antifouling effect of an organic/inorganic hybrid coating embedded with nanocomposite Ag@TA-SiO2 particles. Colloids Surf. A Physicochem. Eng. Asp. 2021, 613, 126085. [Google Scholar] [CrossRef]
  21. Davoodi, A.; Pakshir, M.; Babaiee, M.; Ebrahimi, G.R. A comparative H2S corrosion study of 304L and 316L stainless steels in acidic media. Corros. Sci. 2011, 53, 399–408. [Google Scholar] [CrossRef]
  22. Sknar, I.; Sknar, Y.; Hrydnieva, T.; Riabik, P.; Demchyshyna, O.; Gerasimenko, D. Development of a New Suspension Electrolyte based on Methanesulphonic Acid for the Electrodeposition of Cu–Tio2Composites. East. Eur. J. Enterp. Technol. 2021, 1, 39–47. [Google Scholar] [CrossRef]
  23. Niu, S.; Dong, X.; Zhang, W.; Li, X.; Liu, S. Antibacterial and photocatalytic properties of SiO2-CuxO films with high copper loading and crystallized CuxO nanoparticles. Surf. Interfaces 2021, 23, 101021. [Google Scholar] [CrossRef]
  24. Warnes, S.L.; Little, Z.R.; Keevil, C.W. Human coronavirus 229E remains infectious on common touch surface materials. MBio 2015, 6, e01697-15. [Google Scholar] [CrossRef] [PubMed] [Green Version]
  25. Ertugrul, I. Grey Relational Analysis Approach in Academic Performance Comparison of University: A Case Study of Turkish Universities. Eur. Sci. J. 2016, 7881, 128–139. [Google Scholar]
  26. Vuppala, S.; Shaik, R.U.; Stoller, M. Multi-response optimization of coagulation and flocculation of olive mill wastewater: Statistical approach. Appl. Sci. 2021, 11, 2344. [Google Scholar] [CrossRef]
  27. Kumar, D.; Mondal, S. Process parameters optimization of AISI M2 steel in EDM using Taguchi based TOPSIS and GRA. Mater. Today Proc. 2019, 26, 2477–2481. [Google Scholar] [CrossRef]
  28. Shaik, R.U.; Giovanni, L.; Fusilli, L. New approach of sample generation and classification for wildfire fuel mapping on hyperspectral (prisma) image. In Proceedings of the IEEE IGARSS, Virtual Conference, Brussels, Belgium, 12–16 July 2021. [Google Scholar]
Figure 1. Comparison of EDM with EDC.
Energies 14 05691 g001
Figure 2. Working principle of EDC.
Energies 14 05691 g002
Figure 3. Different coating methods, (a) PVD, (b) CVD, (c) Electroplating, (d) Thermal and (e) Electrical discharge coating.
Energies 14 05691 g003
Figure 4. Flowchart for different types of EDC process input and output parameters.
Energies 14 05691 g004
Figure 5. Experimental Setup of EDC coating: (a) Ti6Al4V Plate, (b) Specimen preparation, (c) Specimen, (d) Bronze electrode, (e) CNC electrical discharge machine, (f) Spark erosion, and (g) Flushing on the specimen.
Energies 14 05691 g005
Figure 6. EDX comparison, (a) Base material Ti-6Al-4V, EDX, and (b) EDC coating EDX.
Energies 14 05691 g006
Figure 7. SEM images showing both coating and uncoating surface on substrate for six experiments, shown in the order of (af) respectively.
Energies 14 05691 g007
Figure 8. Surface morphology of coating by SEM Images for six experiments shown in the order of (a) to (f) respectively.
Energies 14 05691 g008
Figure 9. Chemical composition of EDC substrates for six experiments shown in the order of (af) respectively.
Energies 14 05691 g009
Figure 10. SEM image of cross-section EDC Coating for six experiments shown in the order of (af) respectively.
Energies 14 05691 g010
Figure 11. Cross section of material interfacing bonding for six experiments shown in the order of (af) respectively.
Energies 14 05691 g011
Figure 12. Output parameters response with respect to input parameters response.
Energies 14 05691 g012
Table 1. Physical and chemical composition of electrode and substrate.
PropertiesElectrodeSubstrate
Chemical Composition Cu 95% Tin 4%, Zn 1% C 0.08; Fe 0.25, Al 6, V 4, Ti Balance
Density (Kg/m2)7.584.42
Melting point (°C)10351878
Specific heat capacity (J/g °C) 370553
Hardness 170300
Table 2. Experimental conditions.
S. no ParametersLevel
1Current (Amps)4 8 12 20 24
2Ton (µs)19 80 90 126 270 386
3Toff (µs)19 40 54 65 95 162
Table 3. Combination of machining process parameters.
Experiments Current (Amps) Ton (µs) Toff (µs) Duty Cycle (%)
1 20 270 4087
2 24 80 9545
3 20 90 6558
4 8 19 1950
5 4 386 162 70
6 12 126 54 70
Table 4. Output parameters.
Exp.EDREDC Coating Thickness
No.WBMWAM(WBM-WAM)/TimeEDR (g/min)EDC1EDC2EDC3Average (µm) Micro Crack (Microns)
193.023487.920.1275850.002126415.917.117.116.72.2
293.347788.0630.13211750.00220216.519.5-181.5
385.976177.9640.20030250.00333841515.92919.966673
493.784991.63840.05366250.00089441818.620.719.10
589.90689.47640.010740.00017922.519.81318.433330
687.700383.05230.11620.00193671818.614.116.90
Table 5. Input and output parameters.
ExpEDREDCTCu%Zn%
40.000894419.190.777259.222
50.00017918.43333 87.2026512.79
60.001936716.989.0949310.90
Table 6. Normalizing Data.
ExperimentsEDREDCTCu%Zn%
40.40701.01.00
500.6969601
61.000.529360.4706
Table 7. Deviation sequence.
ExperimentsEDREDCTCu%Zn%
40.59299001
510.303010
6010.47060.52936
Table 8. Grey Relational Coefficient Generation.
ExperimentsEDREDCTCu%Zn%
40.45745110.3333
50.33330.622640.333331
610.333330.333330.48573
Table 9. Grey Relational Grade Generation.
ExpCurrentTonToffEDREDCTCu%Zn%GRGRank
4819190.000894419.190.777259.2222.79071
543861620.00017918.4333387.2026512.792.28932
612126540.001936716.989.0949310.9052.33413
Table 10. Decision matrix.
ExperimentsEDCEDCTCuZn
40.000894019.100000090.77249009.2227500
50.000179018.433333087.202653212.797340
60.001936716.899999989.094932010.9050600
Table 11. Normalized decision matrix.
ExperimentsEDCEDCTCuZn
40.41764370.60697410.58861500.480931575
50.83622180.58578830.56546640.66733294
60.9047546 0.5370609 0.57773690.56865768
Table 12. Weighted normalized decision matrix.
ExperimentsEDCEDCTCuZn
40.10441090.15174350.14715370.1202328
50.02090550.14644700.14136660.1668332
60.22618860.13426520.14443420.1421644
Table 13. Positive and negative ideal solutions.
ExperimentsEDCEDCTCuZn
Positive Ideal solution0.00193666719.100090.777249012.79734
Negative Ideal solution0.00017900016.899999987.20265329.22275096
Table 14. Distance measures of alternatives from ideal solutions.
ExperimentsD+D
493.45357389.11807214
593.45389589.11991495
693.45699689.122003414
Table 15. Relative closeness.
ExperimentsRelative ClosenessRank
40.4881265773
50.4881308810731
60.4881284462
Table 16. Closeness −nD angle and ID.
Experiments−nD AngleID
40.0379434890.008785855
50.0055949930.000183328
60.0263339740.002712809
Publisher’s Note: MDPI stays neutral with regard to jurisdictional claims in published maps and institutional affiliations.

