Article

Use of Renewable Energy Sources in the European Union and the Visegrad Group Countries—Results of Cluster Analysis

by
Elżbieta Kacperska
1,
Katarzyna Łukasiewicz
2 and
Piotr Pietrzak
2,*
1
Institute of Economics and Finance, Warsaw University of Life Sciences, 02-787 Warsaw, Poland
2
Management Institute, Warsaw University of Life Sciences, 02-787 Warsaw, Poland
*
Author to whom correspondence should be addressed.
Energies 2021, 14(18), 5680; https://doi.org/10.3390/en14185680
Submission received: 4 August 2021 / Revised: 3 September 2021 / Accepted: 7 September 2021 / Published: 9 September 2021
(This article belongs to the Special Issue Energy Supplies in the Countries from the Visegrad Group)

Abstract

:
Increasing the use of renewable energy sources is one of the strategic objectives of the European Union. In this regard, it seems necessary to answer the question: which of the member countries are the most effective in its implementation? Therefore, the main goal was to distinguish groups of European Union countries, including the Visegrad Group, differing in the use of renewable energy sources in transport, electricity, heating and cooling (based on cluster analysis). All members of the EU were determinedly selected for research on 1 February 2020 (27 countries). The research period embraced the years 2009–2019. The sources of materials were the literature on the topic and data from Eurostat. Descriptive, tabular, graphical methods and cluster analysis were used in the presentation and analysis of materials. In 2019 wind and hydro power accounted for two-thirds of the total electricity generated from renewable sources. In 2019, renewable energy sources made up 34% of gross electricity consumption in the EU-27. Wind and hydro power accounted for two-thirds of the total electricity generated from renewable sources (35% each). Moreover, it was determined that there were 5 clusters that differed in their use of renewable energy sources. The highest average renewable energy consumption in transport, heating and cooling in 2019 was characterized by a cluster consisting of Sweden and Finland. In contrast, the highest average renewable energy consumption in electricity was characterized by a cluster consisting of countries such as: Austria, Croatia, Denmark, Latvia and Portugal. Finally, in a group that included countries such as Belgium, France, Luxembourg, Malta, the Netherlands and the entire VG (Hungary, Czechia, Slovakia and Poland), renewable energy consumption rates (in transport, electricity, heating and cooling) were lower than the EU average (27 countries).

1. Introduction

During the last three decades, the fashionable concept in environmental discourse has been “sustainable development” (SD). “It has spawned a vast literature and has strengthened the arm of empire builders in many research institutes, Universities, national and international bureaucracies and statistical offices” [1] (p. 191). SD is also a fundamental and overarching objective of the European Union (EU), enshrined in Article 3 of the Treaty on EU. Since 2005 Eurostat has regularly produced biennial monitoring reports of the EU Sustainable Development Strategy (EU SDS), based on the EU set of Sustainable Development Indicators (SDIs).
The concept of SD has also been constantly criticized, mostly due to the inconsistency of mixing economic expansion and natural system preservation in one concept [2]. It was also mentioned that “there is no agreement on a comprehensive sustainable development theory, there are different contested theoretical approaches and definitions” [3] (p. 468). Nonetheless, the scientific community has agreed that SD is governed by a dynamic balance between the three pillars of civilization’s progress: (1) economic, (2) social, and (3) environmental [4].
Nowadays, there is a growing emphasis on the importance of applying the concept of SD to the energy sector [5]. Therefore, the term sustainable energy development (SED) is increasingly used in the literature [6]. SED is defined by the International Atomic Energy Agency (IAEA) as “the provision of adequate energy services at affordable cost in a secure and environmentally benign manner, in conformity with social and economic development needs” [7]. Figure 1 depicts the relationship between the three dimensions SD and energy as illustrated by the IEA/IAEA [7].
SED is also one of the priorities of the EU. One of the most important initiatives in this area is the “Clean Energy for All Europeans” [8]. In May 2019, the EU completed the final legislative acts of this package, thus reaching an important stage towards the completion of the Energy Union. The package includes “documents on energy efficiency (…) new energy and climate laws, consumer rights, energy security, electricity market efficiency, and cooperation between the EU and Member States to achieve the ambitious energy and climate goals” [9].
According to the package, the EU is to become a world leader in the use of renewable energy sources (e.g., biomass energy, hydropower, geothermal power, wind energy, and solar energy). Thus, it seems necessary to answer the question of which member countries are the most efficient in the use of renewable energy sources? That is why the main goal of this article is to distinguish groups of EU countries, including the VG, differing in the use of renewable energy sources in transport, electricity, heating and cooling based on cluster analyses. Through its implementation, it will be possible to identify the countries that are most committed to the use of renewable energy sources and, thus, the countries that most effectively implement the concept of SED. The following set of research tasks was adopted for its implementation: conduct a critical review of the literature on SD; show the changes in the use of renewable energy in transport, electricity heating and cooling in EU member states (including VG countries) from 2009 to 2019; show the structure of utilization of renewable energy sources in EU member states; identify leaders among EU member states in the development of the renewable energy sector.
The remainder of the article is structured as follows. The next section provides a brief description of the methodological approach and is followed by the literature review. The article ends with discussion and some concluding remarks.

2. Materials and Methods

All members of the EU were selected for research on 1 February 2020 (27 countries). The research period covers the years 2009–2019. In 2009, the European Parliament adopted the Directive 2009/28/EC [10]. It established a common framework for the use of energy from renewable sources in order to limit greenhouse gas emissions and to promote cleaner transport. The last year in which there were complete data needed to carry out the research using the assumed research methods at the time of the research was 2019. The sources of materials were the literature on the subject and also data from Eurostat (share of renewable energy in transport, share of renewable energy sources in electricity, share of renewable energy sources in heating and cooling). The use of Eurostat data made it possible to compare all EU countries.
Descriptive, tabular and graphical methods and cluster analysis were used for the presentation and analysis of materials.
In the first stage of the research, the changes in the use of renewable energy sources in the EU and VG countries were presented. The analysis includes the shares of renewable energy in transport, electricity, heating and cooling.
In the second stage, based on 2019 data, the cluster analysis was conducted. The term “cluster analysis” was coined by Tryon [11] and then further developed by Cattell [12], and the use of cluster methods has increased significantly over the past 30 years [13]. Cluster analysis is the set of multivariate techniques whose main aim is to aggregate items, objects or individuals (here: EU and VG countries) based on their characteristics [14]. The basic criteria used to group objects is their similarities. In this manner, objects belonging to the same cluster are similar to each other concerning the variables that were measured in them, and the elements of distinct clusters are dissimilar for these same variables [15].
Clustering techniques are classified into two types: agglomerative and divisive. In this research the authors used Ward’s method, which is one of the most frequently employed agglomerative clustering method. The characteristic feature of this method is the use of a variance analysis for the purpose of determining the distance between clusters. The distance between one cluster composed of objects and another one cannot be directly expressed by way of the distance between the objects belonging to these clusters [16]. Hence, “the method aims to minimize the sum of squared deviations of any two clusters which can be formed at any stage” [17] (p. 54). Therefore, clusters that “ensure the minimum sum of squared distances from the centre of mass of a new cluster, which they create” are merged [18] (p. 74). The literature points out that this kind of agglomerative method is cognitively effective; however, it yields small and yet most natural clusters. In this paper, the measure of similarity used was the squared Euclidean distance.

3. Literature Review

3.1. The Concept of Sustainable Development

The concept of SD has been developed in response to serious concerns over the potential of the Earth’s global ecosystem to sustain the impact of anthropo-pressure. It has been aimed at the preventive elimination or at least reduction of the imbalance between economic growth and social development as well as socio-economic development and the natural environment [19]. The concept of SD was introduced to the globally used terminology by the United Nations (UN) agencies [20,21]. This term was used extensively for the first time at the UN Conference on the Human Environment in 1972. It stemmed from the original concept of sustainable management of natural resources. It was defined as a strategy aiming at development based on the rational utilization of local resources and knowledge gained by farmers to satisfy the needs of remote rural areas in Third World countries [22].
The concept of SD is defined as an interdisciplinary approach, which covers in its scope the environmental (the natural capital), social (social capital) and economic spheres (the economic capital). It is an idea and at the same time a concept of actions leading to changes in the life of the human population in the 21st century to ensure adequate living conditions for the present and future generations, as well as the potential to satisfy their needs [23].
It may be assumed that the idea of SD is a certain compromise between the concepts for several component capitals of the natural, social and economic development. It needs to be indicated here that the term SD in terms of economic sciences stems from the development economics, which comprises both neoclassical theories (theories based on the linear model of economic growth, based on the two-sector and bipolar character of global economy) and theories which stress the problem of responsibility in the context of planned and realized economic development [24,25]
The concept of SD is mainly considered within the framework of three approaches [26]: (1) the socio-philosophical concept (assuming the need for changes in the system of human values), (2) a modern direction of economic development (assuming new economic organization and management methods), (3) a newly developed discipline of science.
Such studies as those by Górka [27,28] have attempted to standardize the terminology related to the discussed concept. It should be noted that sometimes, wrongly, the term sustainable is replaced by balanced. However, the state of lasting balance is not consistent with the essence of this concept. This may lead to economic stabilization or even retrogression [27].
Pirages [29] was of an opinion that SD refers to economic growth, which is sustained by the natural and social environment. In turn, Goodland and Ledec [30] stressed that SD is a process of economic transformation consisting in the optimization of current economic and social benefits without jeopardizing the potential to attain these benefits in the future. Turner [31] presented an opinion that SD requires maximization of net benefits of economic growth in order to maintain accessibility of environmental services and the quality of natural resources over time.
It should be noted that Pearce et al. [32] were of an opinion that SD includes the formation of the socio-economic system, which sustains the following objectives: growth of real income, improvement of educational standards, health and the quality of life. In turn, Górka et al. [33] defined SD as such a course of economic development, which does not significantly or irreversibly disturb the living environment for humans, while respecting the laws of nature and economics.
In the opinion of Runowski [34] SD consists in efforts to attain balance between various goals of socio-economic development, without which sustainability of the system may be difficult to attain. The primary aim is to ensure lasting development in terms of its stability and continuity. SD provides guidelines for sustainability as a goal to be reached. In turn, Giovannini and Linster [35] stated that the concept of SD refers both to the quality and volume of economic growth and combines three dimensions of welfare: economic, social and natural. Borys [36] defined SD as an integrated order, i.e., a certain game of limitations in the use of all capitals.
Holger [37] was of an opinion that SD strives to define such management conditions which might guarantee sufficiently high ecological, economic and socio-cultural standards to the entire presently living human population and to the future generations while observing tolerance of nature and realizing inter- and intragenerational justice. In turn, Stanny and Czarnecki [38] expressed an opinion that SD is a compromise between environmental, social and economic goals determining the welfare of future generations. The economic aspect refers not only to the satisfaction of the present-day needs, but also preservation of resources required to meet the needs of future generations. The social aspect is connected with education and the potential to attain the capacity to solve major social problems and to participate in development process of the entire system. Finally, the ecological aspect refers to the identification of absolute limits to human activity.
SD is a concept fully referring to the entire scope of human activity and the resulting interactions with the environment. It may be considered to be a certain type of socio-economic development, which in view of the changes occurring on Earth needs to be constantly monitored and analyzed.
One of the main principles of SD is the use of renewable energy sources. Therefore, it is to them that the next part of the article will be devoted.

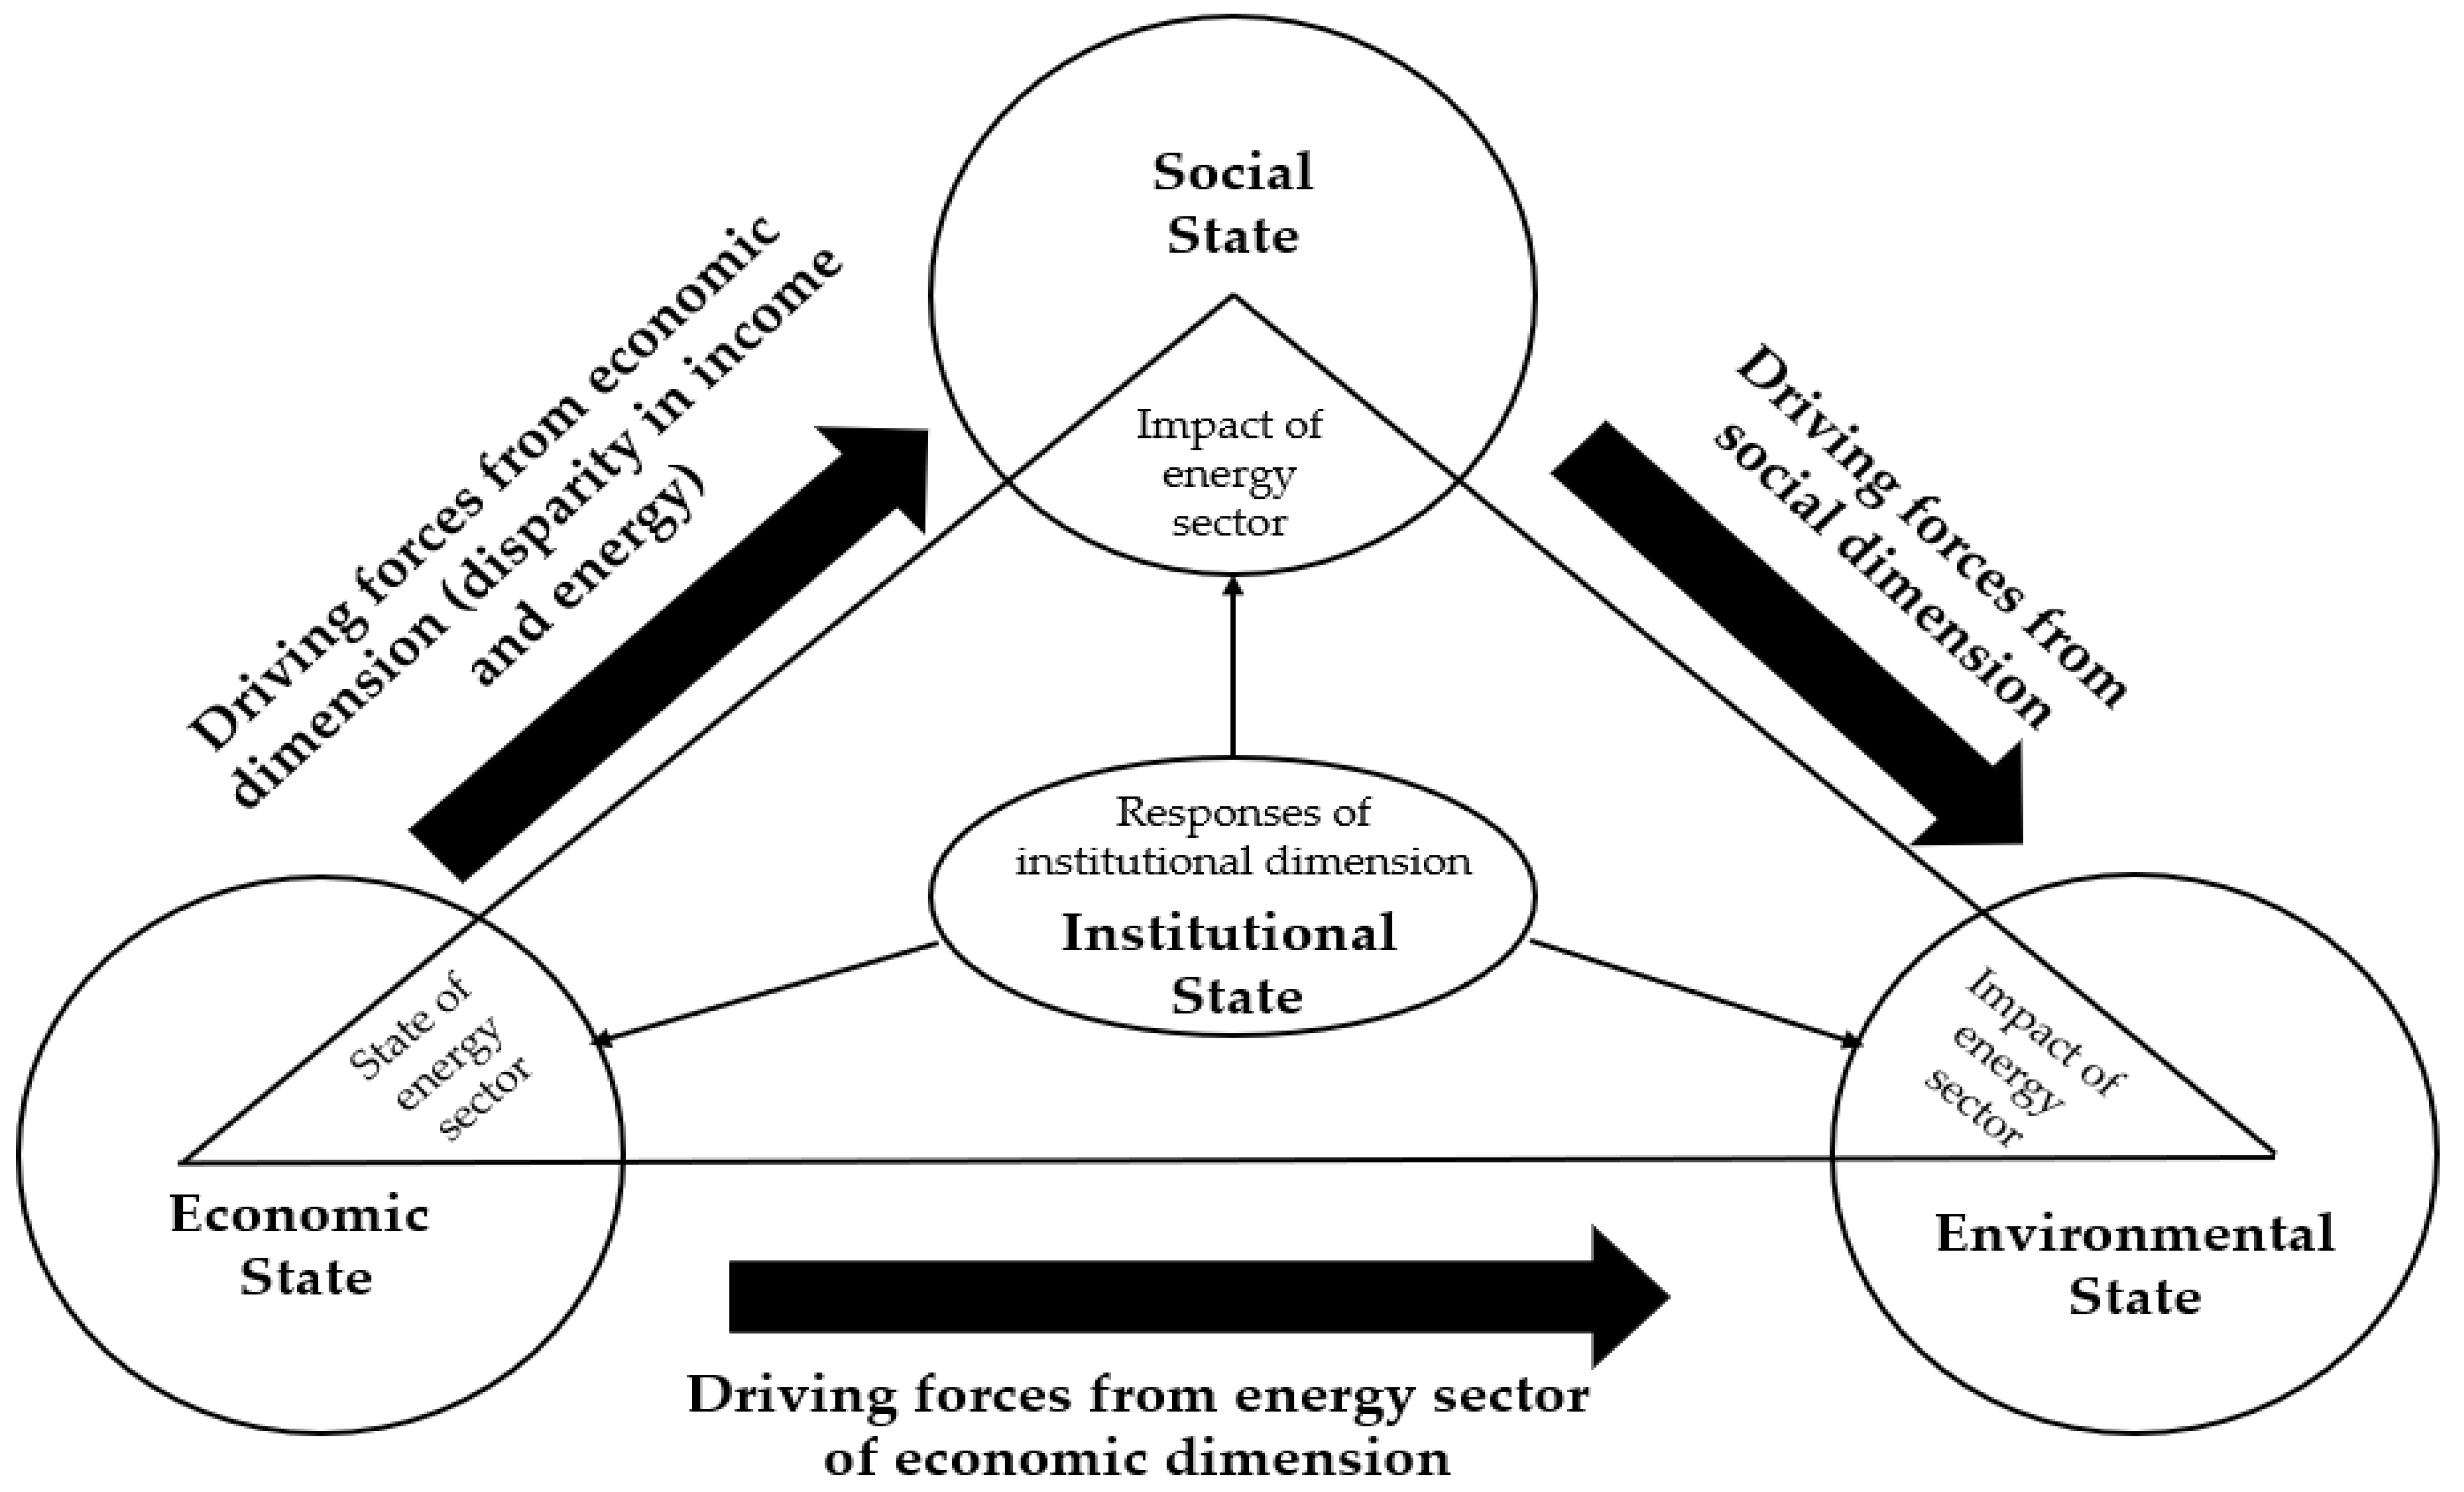
3.2. The Development of Renewable Energy Sources in the Entire EU and the VG Countries

Energy generated from renewable sources constitutes an important element in the strategy for SD of the EU member countries, including the VG. Public authorities in the EU have adopted the assumptions of SD for the power industry sector, defining them as an efficient use of energy, human, economic and natural resources [39]. This results from the rapid economic development, a continuous increase in energy demand as well as the awareness that global traditional energy resources are limited [40,41,42]. The concept of SD emphasizes the importance of environmental protection and repletion of renewable resources, which is particularly essential under new conditions observed globally [43]. In view of the above, SD is such an activity, which sustains the natural environment and may not be conducted at the expense of future generations [44,45]. The concept of SD is based on humans as subjects having an impact on the environment, our planet as an area (object) of human impact and partnership as a method of integrated activity [8]. The global actions towards SD need to ensure welfare and peace worldwide. Such foundations were also presented in the UN Resolution “Transforming our world: the 2030 Agenda for Sustainable Development”, adopted in September 2015 [46]. The global initiative for SD points to climate change and problems of renewable energy [47]. The 17 global sustainable development goals (SDGs) include energy issues, e.g., SDG7 indicates access to cheap, clean, reliable, technologically advanced and sustainable energy for all people by 2030 [8,48]. This is to be attained by [46]:
  • Providing common access to cheap, reliable and technologically advanced power supply services;
  • Considerably increasing the share of renewable energy in the total energy balance,
  • Doubling the global energy efficiency index;
  • Strengthening international cooperation in order to facilitate access to clean energy and technology, including renewable energy sources, ensuring greater energy efficiency and state-of-the-art clean fossil fuel technologies as well as supporting investments in the power engineering infrastructure and clean energy generation technologies;
  • Development of the infrastructure and modernization of technologies supplying advanced and sustainable energy services in all developing countries, particularly the least economically developed countries.
The EU has also played a significant role in the development of the 2030 Agenda, which is fully consistent with the European vision and constitutes a global program for actions for SD on the global scale, based on the SDGs. For many years, the EU has been undertaking actions for SD in the power sector. Since the beginning, the energy sector has been the most important aspect of the integration processes in Europe. The establishment of the European Coal and Steel Community (CSC) and the European Atomic Energy Community (EAEC) aimed at controlling this sector and ensure the energy security for the member countries [49,50].
In 1987 the “Single European Act” introduced the environmental protection policy and a year later the “European Commission Working Document on Internal Energy Market” presented goals in the energy policy. Since 1992 the EU has been working on the establishment of the single energy market, which comprises three stages. The next step in the development of cooperation in the energy sector was connected with the adoption in 2010 “A strategy for competitive, sustainable and secure energy”, specifying priorities of the EU in the energy policy by 2020. The EU identified these priorities as ensuring competitiveness of prices and energy supply security as well as enhancing the technological advantage in this sector [51]. The assumptions of the “Europe 2020” strategy assumed and increase in energy efficiency by 20%, an increase in the share of energy from renewable energy sources to 20% total energy consumption, reduction of greenhouse gas emissions to the level of 20% in 1990 [8,51]. In the next “2030 Energy Strategy” the EU defined the goals for climate and energy, within which the member countries declared by 2030 to reduce by min. 40% their greenhouse gas emissions compared to the levels of 1990, to increase the share of renewable energy sources to 32% energy consumed in the entire EU, to improve energy efficiency by 30% and to ensure potential transfer of 15% electricity generated in the EU to other EU countries within the framework of interconnection systems [8,51]. Reduction of greenhouse gas emissions by 80–90% compared to that in 1990 is another strategic goal of the EU specified in the “2050 Energy Roadmap” of 2011 [52].
The next step was connected with the adoption of the European Council in 2014 of the “European Energy Security Strategy”, assuming short-term actions in case of gas supply stoppages or disruptions in its imports to the EU. The framework for the energy policy for the years 2020–2030 was updated by the European Commission in 2016 in the “Clean Energy for all Europeans” package, which indicated the ambitious goal of energy efficiency increased by 32% [9].
In accordance with the climate strategy assumptions referred to as the European Green Deal [53], presented at the 2019 Climate Summit in Spain, the EU declared to reduce greenhouse gas emissions. Initially, it was assumed to reduce it by 80–95% by 2050 compared to the levels of 1990; finally, it was decided that the EU countries are to become zero-emitters (climate neutral) by 2050. In turn, during the European Council summit on 10–11 December 2020, the UE-27 leaders agreed to increase the CO2 reduction goal to 55% by 2030 [54].
All the actions undertaken by the EU, including the VG, related to energy and climate are consistent with the “2030 Agenda” assumptions [46]. These ambitious EU goals to attain new climate and energy goals focus primarily on the SD of the energy sector. These actions concentrate, e.g., on increased use of alternative energy sources, including renewable sources, in the energy balance [55]. A growing body of evidence on the negative effect of fossil fuels used to produce energy on the natural environment, human life and health are primary reasons for the growing interest in renewable energy sources [42]. The main goal of the sustainable energy policy is to limit the consequences of the negative impact of the energy sector on the atmosphere [56]. Governments worldwide are promoting the use of renewable energy sources [57,58].
Energy should be produced and consumed solely when generated from clean energy sources, i.e., mainly renewable energy [59,60,61,62]. Renewable energy sources include biomass energy, solar energy, hydropower, tidal power, wind and geothermal power [63,64,65]. In view of the above, SED in individual countries is required for the further existence of the energy sector, and it is key for the development not only of renewable energy sources, but also the economy, the environment and society [66]. “Increased importance of renewable energy in the global fuel and energy balance may contribute to savings in the consumption of energy raw materials and improve the condition of the natural environment thanks to reduced air and water pollution levels and decreased amounts of generated waste. For this reason support for the development of renewable energy sources is rapidly becoming a major direction in politics, which has to be considered when planning the energy policies of many countries worldwide” [42].
The use of renewable energy sources has been investigated in many studies and scientific analyses. They concern mainly the development of renewable energy in the context of SD [67], the potential to use solar energy from photovoltaic systems, their efficiency and environmental impact [68,69], potential to use wind energy [70,71], hydropower [72], tidal energy [73], geothermal energy [74] and biomass energy [75]. Many publications are devoted to the economic efficiency of investments in renewable energy sources in the EU [5,76,77,78], and the VG [79,80,81].
The primary indications for the growth and development of the renewable energy sector include the fact that these sources emit considerable lower amounts of greenhouse gases and other pollutants [82] and contribute to reduced greenhouse gas emissions [83]; renewable energy has a minimal environmental impact [84]; it does not require a specialized infrastructure and may contribute to an increase in employment rates [60] and provide economic benefits, particularly in rural areas, while its production is cheaper compared to conventional sources [61].
However, there are some barriers hindering rapid implementation of renewable energy sources. The main barrier is connected with the high initial cost of renewable technologies (e.g., photovoltaic panels or wind turbines), lack of data and information on resources, lack of storage facilities, insufficient capacity to construct the systems and monitor efficiency of renewable energy sources, challenges related to the integration of conventional and renewable energy technologies, the effect on agricultural land use, lack of potential for the enforcement of respective policies or design and implementation of renewable energy programs [85].
Dependencies between sustainable development and renewable energy indicated in literature on the subject include the role of renewable energy in economic development. Humanity since the very beginning was based on renewable energy. Biomass, water energy or solar energy were the only available energy sources. However, in the course of development, industrial countries started to exploit new energy sources, including also nuclear energy. At present, in many countries, energy is perceived as a right and governments are expected to meet this need. Consumers of energy services mainly want them to be abundant, reliable and accessible. However, many renewable energy sources are dependent on the nature forces and the environment, as is the case with, e.g., wind or solar energy. Thus, abundance or reliability of many energy sources varies depending on the region. Shortages or disruption in energy supply may also be experienced. For small settlements or remote communities, energy may be sufficient, but when considering large agglomerations or industrial areas with high energy demand, the use of renewable energy sources has to be adequately designed. Costs of renewable energy are also crucial. In many cases, the use of renewable energy is being promoted based on the prospective reduction in its cost. The EU policy concentrated on the support for policies and enterprises of its member states to use environmentally friendly energy from renewable sources [56,67].
At present, in the EU, including the VG, it is promoted to use solar energy in households thanks to subsidies for the purchase of photovoltaic panels, replacement of coal-fired furnaces and thermal retrofitting of family housing. Incentives are also introduced for the purchase of electric cars.
An essential aspect discussed in literature is also connected with the energy security as an aspect of sustainable development [85]. This concerns the reliability and availability of energy services, particularly in industrialized countries, where energy supply disruptions generate costs. In turn, the threat of fluctuations in energy prices may influence the economy and in extreme cases lead to an economic crisis. An important role in this respect is played by the state and its energy security policy. The EU, to promote energy security, has formed the single energy market, where a diversification of energy sources is being implemented. The EU is trying to become independent of external energy supplies; thus, diversification is observed in the forms of energy generation aiming at the increased use of renewable energy [9].
In terms of the EU energy policy, including that of the VG, a priority is to maintain a balance between security, satisfaction of social needs, economic competitiveness and environmental protection [67]. The strategy to develop the renewable energy sector indicates rational use of renewable energy sources, which will contribute to improved efficiency in the use and conservation of energy material resources and improve the condition of the natural environment [67].
Within the last 30 years the EU countries have recorded a considerable increase in the production and consumption of energy generated from renewable sources. In the years 1990–2019 greenhouse gas emissions decreased by 24%, while GDP increased by 60% [8].
The EU is the largest world source of public funds allocated to countering climate change. In 2019 they amounted to 21.9 billion euro. The EU finances sustainable transformation to meet the assumption of the European Green Deal. The countries of the VG diversified energy supplies, but in each of these countries, the structure of energy sources was different. Renewable energy sources were also introduced gradually and systematically. Their level is still low, but an upward trend was visible [79].
One of its goals is to co-finance renewable energy production. Although renewable energy in the electricity generation sector has been developing rapidly, an accelerated progress is also needed in transport, heating and cooling [86]. Within the last few years, globally, access to electricity has increased greatly; the use of renewable energy in the power engineering sector has increased, and energy efficiently has improved. However, due to the COVID-19 pandemic, millions of people are losing access to electricity [87]. Progress in the realization of the “2030 Agenda” SDG 7 seems to be too slow to promise the global energy goals are reached by 2030, with the pandemic additionally slowing it down or even reversing the progress [86,87].

4. Results and Discussion

Table 1, Table 2 and Table 3 show the changes in renewable energy consumption in transport, electricity, heating and cooling from 2009 to 2019. It is easy to see the increase in the use of renewable energy EU countries. In 2019, countries such as Sweden, Finland and the Netherlands had the largest share of renewable energy use in transport (30.31%, 21.29%, and 12.51%, respectively). For renewable energy use in electricity, countries such as Austria, Sweden and Denmark led the way. When it comes to renewable energy use in heating and cooling, countries such as Sweden, Latvia and Finland were the leaders: 66.12%, 57.76%, and 57.49%.
In contrast, the lowest renewable energy consumption occurred in countries such as:
  • In transport—Cyprus, Lithuania and Greece.
  • In electricity—Malta, Cyprus and Hungary.
  • In heating and cooling—Ireland, the Netherlands and Belgium.
During the period under review, the biggest changes in renewable energy consumption took place in countries such as: Malta (in 2009, the shares of renewable energy consumption especially in transport, electricity were 0.00, while in 2019, they were already close to the EU average), Estonia (the share of renewable energy consumption in transport has increased more than tenfold), Cyprus (the share of renewable energy consumption in electricity has increased more than 16-fold), and Slovakia (the share of renewable energy consumption in heating and cooling has more than doubled). However, as noted earlier, despite the significant increase in renewable energy consumption, most of the countries mentioned are still characterized by the lowest percentage of renewable energy use.
It should be mentioned that in 2019, renewable energy sources made up 34% of gross electricity consumption in the EU-27, slightly up from 32% in 2018. Wind and hydro power accounted for two-thirds of the total electricity generated from renewable sources (35% each). The remaining one-third of electricity generated was from solar power (13%), solid biofuels (8%) and other renewable sources (9%).
In 2019, hydro power use dominated the renewable energy mix in countries such as: Austria (76%), Bulgaria (48%), Croatia (74%), Finland (43%), France (53%), Italy (41%), Latvia (73%), Romania (65%), Slovakia (65%) and Sweden (66%)—Figure 2. Wind energy, on the other hand, dominated the structure of renewable energy sources in countries such as: Belgium (48%), Cyprus (45%), Denmark (69%), Germany (50%), Greece (42%), Ireland (86%), Lithuania (55%), Netherlands (49%), Poland (57%), Portugal (43%) and Spain (52%)—Figure 2.
In the next step, a cluster analysis was carried out, but before starting the cluster analysis, we standardized all three variables. As a first step in the cluster analysis, we analyzed correlations among the clustering variables (x1: share of renewable energy in transport in 2019, x2: share of renewable energy sources in electricity in 2019, x3: share of renewable energy sources in heating and cooling in 2019): strong correlation leads to an overrepresentation of the variables in the final clustering solution [88]. All bivariate correlations fell well below the 0.9 threshold, indicating no potential collinearity issues.
The clustering was performed based on the method of Ward. The results are given in Figure 3 and Figure 4. The tree diagram (Figure 3) is the first and the simplest result of the cluster analysis, and it is closely related to the second result, the graph of amalgamation schedule (Figure 4). The algorithm first calculates all the Euclidean distances between the countries (and puts them in the tree diagram), and only after arranging the distances in an ascending scale, it shows the amalgamation schedule.
The key to interpreting a hierarchical cluster analysis is to look at the point at which any given pair of countries “join together” in the tree diagram. Countries that join together sooner are more similar to each other than those that join together later. For example, the pair of countries with the lowest (shortest) distance (Spain and Italy; Slovakia and France, distance = 0.45) join together first in the tree diagram.
To find the optimal number of clusters, use the graph of amalgamation schedule. One could observe that at 23rd step, Euclidean distance rises sharply at value 3.9 (indicated by red line). Determining 2.5 as a cutoff point (as suggested by the amalgamation schedule in Figure 4) results in five distinct clusters of EU countries (Figure 3).
Based on the cluster analysis results, it is perceived that the first cluster includes: Lithuania, Estonia, Cyprus, Greece, Slovenia, and Bulgaria. This is the group of countries that is characterized by the lowest share of renewable energy use in transport compared to other clusters. The average for these countries is 5.41% (in 2019).
The next, third cluster includes nine EU countries: Slovakia, France, Malta, Hungary, Czechia, the Netherlands, Poland, Luxembourg and Belgium. Thus, it is the most diverse cluster. This group includes for example the entire VG (Poland, Slovakia, Czechia and Hungary). This is the cluster with the lowest share of renewable energy in electricity, heating and cooling. In 2019, on average, these shares were: 15.63%, and 16.52%. It is worth noting that in this group all the indicators used in the analysis were below the average for the whole European Union (27 countries).
The fourth cluster includes only two EU countries: Sweden and Finland. In 2019, in these Nordic countries, electricity production was in one half renewable (in average 54.62%). Within it, the largest share was hydro power followed by biomass (from forestry) and wind power (like it was mentioned before). Importantly, in 2017, Finland adopted a “National Energy and Climate Strategy” [89]. A specific target for overall renewable energy share was not defined in this policy, but it had exceeded already in 2014 the 67.5% target set for 2020 in the NREAP (National Renewable Energy Action Plan) [90]. In turn, Sweden had an energy commission in place, which submitted its final report in January 2017 [90]. The commission proposed a 100% renewable energy target for 2040.
The last, fifth, cluster includes five countries: Latvia, Denmark, Portugal, Croatia, and Austria. It is worth noting that this is the group of countries with the largest share of renewable energy consumption in electricity. In 2019, the average for countries was 59.50%. For example, Denmark has the highest share of wind power in the world.
Using the hierarchical cluster analysis method, we can group the EU Countries according to the characteristics of the analyzed three variables, revealing the existing structures as well as the way in which the analyzed countries are linked in hierarchical structures. Thus, by tackling these clusters as a whole, it is possible to improve efficiency and more effectively focus public policies and financial support instruments for renewable energy sources, resulting in effects in the countries that are part of the same cluster.
According to the results of the study, there is a serious gap in 2019 regarding the differences in the use of renewable energy sources in EU countries. In the case of transport, the gap recorded between the lowest share (Cyprus, 3.32%), and the highest (Sweden, 30.31%) was about 9.2 times larger. In the case of electricity, the gap recorded between the lowest share (Malta, 8.04%) and the highest (Austria, 75.14%) was about 9.3 times larger. Finally, in the case of heating and cooling, the gap recorded between the lowest share (Ireland, 6.32%) and the highest (Sweden, 66.12%) was about 10.5 times larger. These unfavorable differences in the use of renewable energy sources will obviously have an impact in the medium to long term on the ability of individual countries to achieve their sustainable development goals.
The results obtained are consistent with those obtained by Włodarczyk et al. [91]. The cluster analysis conducted by the researchers made it possible to distinguish 5 groups of EU countries differing in their effectiveness in achieving sustainable development goals. The group of countries that were characterized by “highest average value of share of renewable energy in transport (15.97%, exceeding the EU average with 81.7%), highest average value of share of renewable energy in electricity (57.01%, representing an increase of 75.7% compared to the EU average), highest average value of share of renewable energy in heating and cooling (57.35%, exceeding the EU average with a remarkable 91.6%), next to the lowest average value of greenhouse gas emissions intensity (71.77%, representing a decrease of 13.4% compared to the EU average)” [91] (p. 10) included: Denmark, Finland, Latvia and Sweden. In contrast, the group of countries that do not perform as well in these areas included: Belgium, Cyprus, Lithuania, Luxembourg and Malta [91].
Finally, we want to emphasize that the importance of renewable energy in the energy mix is increasingly reflected in specific activities and regulations at the international level. In practice, the environmental benefits of adopting renewable energy sources are undeniable today, and they are increasingly explored and analyzed in the literature. Research in this area has been carried out not only at the European Union level [91,92] but also at the level of individual countries, e.g., Germany [93,94], Hungary [95,96], France [97], Greece [98] or Spain [99].

5. Conclusions

The use of renewable energy sources is becoming one of the priorities of the EU. This is a consequence of the growing importance of the concept of SD and SED. Thus, more and more often biomass energy, solar energy, hydropower, tidal power, wind and geothermal power are used in cooling, heating, electricity and transport.
Our paper makes several contributions. Firstly, our study contributes to the SD and SED literature by offering a comprehensive grasp of its underpinnings in light of recent advances. Secondly, on the basis of the conducted research, the following can be noted: (1) In 2019, renewable energy sources made up 34% of gross electricity consumption in the EU-27; wind and hydro power accounted for two-thirds of the total electricity generated from renewable sources. (2) Between 2009 and 2019 there was an increase in the use of renewable energy sources in transport, electricity, cooling and heating (the biggest changes in renewable energy consumption took place in countries such as Malta, Estonia, Cyprus and Slovakia). (3) Five groups of EU member states have been identified, which differ in terms of renewable energy consumption. (4) The undisputed leader in the European Union in terms of the development of the renewable energy sector is Sweden, which had the largest share of renewable energy consumption in transport, heating and cooling during the period under review. (5) The entire VG (and also France, Malta, the Netherlands, Luxembourg and Belgium) in comparison with other EU countries is characterized by the lowest share of renewable energy in electricity, heating and cooling.
Despite these contributions, our study is not without limitations. Firstly, the literature review section does not include all possible studies on the discussed concepts. In the selection of literature, the authors were guided by its diversity, availability and timeliness. Secondly, cluster analysis was performed on three indicators only. Such indicators were omitted, e.g., greenhouse gas emissions intensity of energy consumption or final energy consumption in households per capita. Thirdly, the use of Ward’s method resulted in low abundance clusters (e.g., one of the clusters includes only two EU countries: Sweden and Finland).
The results provide an interesting starting point for future research. The methodology used in this article can be reproduced with other indicators both quantitative and qualitative. Another suggestion would be to perform a cluster analysis based on indicators showing changes in consumption of renewable energy sources over several years (dynamic approach). Finally, in cluster analysis, other methods could be used in addition to Ward’s Method (possibility of comparing results).

Author Contributions

Conceptualization, E.K., K.Ł. and P.P.; methodology, E.K., K.Ł. and P.P.; writing—review and editing, E.K., K.Ł. and P.P.; visualization, E.K., K.Ł. and P.P. All authors have read and agreed to the published version of the manuscript.

Funding

This research received no external funding.

Institutional Review Board Statement

Not applicable.

Informed Consent Statement

Not applicable.

Data Availability Statement

The data presented in this study are available on request from the corresponding author.

Conflicts of Interest

The authors declare no conflict of interest.

References

  1. Beckerman, W. “Sustainable Development”: Is it a Useful Concept? Environ. Values 1994, 3, 191–201. [Google Scholar] [CrossRef] [Green Version]
  2. Klarin, T. The Concept of Sustainable Development: From its Beginning to the Contemporary Issues. Zagreb Int. Rev. Econ. Bus. 2018, 21, 67–94. [Google Scholar] [CrossRef] [Green Version]
  3. Spaiser, V.; Ranganathan, S.; Bali Swain, R.; Sumpter, D.J.T. The sustainable development oxymoron: Quantifying and modelling the incompatibility of sustainable development goals. Int. J. Sustain. Dev. World 2017, 24, 457–470. [Google Scholar] [CrossRef]
  4. Nate, S.; Bilan, Y.; Cherevatskyi, D.; Kharlamova, G.; Lyakh, O.; Wosiak, A. The Impact of Energy Consumption on the Three Pillars of Sustainable Development. Energies 2021, 14, 1372. [Google Scholar] [CrossRef]
  5. Tutak, M.; Brodny, J.; Siwiec, D.; Ulewicz, R.; Bindzár, P. Studying the Level of Sustainable Energy Development of the European Union Countries and Their Similarity Based on the Economic and Demographic Potential. Energies 2020, 13, 6643. [Google Scholar] [CrossRef]
  6. Gunnarsdottir, I.; Davidsdottir, B.; Worrell, E.; Sigurgeirsdottir, S. Sustainable energy development: History of the concept and emerging themes. Renew. Sustain. Energy Rev. 2021, 141, 110770. [Google Scholar] [CrossRef]
  7. International Atomic Energy Agency. Indicators for Sustainable Energy Development; International Atomic Energy Agency: Vienna, Austria, 2001. [Google Scholar]
  8. Kryk, B. Ensuring Sustainable Energy as a Sign of Environmental Responsibility and Social Justice in European Union Members. Ekon. Sr. 2019, 4, 138–162. [Google Scholar]
  9. Clean Energy for All Europeans Package. Available online: https://ec.europa.eu/energy/topics/energy-strategy/clean-energy-all-europeans_en (accessed on 1 August 2021).
  10. Directive 2009/28/EC of the European Parliament and of the Council of 23 April 2009 on the Promotion of the Use of Energy from Renewable Sources and Amending and Subsequently Repealing Directives 2001/77/EC and 2003/30/EC. Available online: https://eur-lex.europa.eu/eli/dir/2009/28/oj (accessed on 1 August 2021).
  11. Tryon, R.C. Cluster Analysis: Correlation Profile and Orthometric (Factor) Analysis for the Isolation of Unities in Mind and Personality; Edwards Brothers: Ann Arbor, MI, USA, 1939. [Google Scholar]
  12. Cattell, R. A Note on Correlation Clusters and Cluster Search Methods. Psychometrika 1944, 9, 169–184. [Google Scholar] [CrossRef]
  13. Gore, P.A. Cluster analysis. In Handbook of Applied Multivariate Statistics and Mathematical Modeling; Tinsley, H., Brown, S., Eds.; Academic Press: San Diego, CA, USA, 2000; pp. 298–321. [Google Scholar]
  14. Hai, J.F., Jr.; Black, W.C.; Babin, B.J.; Anderson, R.E. Multivariate Data Analysis: Global Edition, 7th ed.; Pearson Education: Upper Saddle River, NJ, USA, 2013. [Google Scholar]
  15. Johnson, R.A.; Wichern, D.W. Applied Multivariate Statistical Analysis, 6th ed.; Pearson Prentice Hall: Upper Saddle River, NJ, USA, 2007. [Google Scholar]
  16. Stanisz, A. Przystępny kurs Statystyki z Zastosowaniem STATISTICA PL na Przykładach z Medycyny. Tom 3. Analizy Wielowymiarowe; StatSoft: Cracow, Poland, 2007. [Google Scholar]
  17. Cupak, A.; Wałęga, A.; Michalec, B. Cluster Analysis in Determination of Hydrologically Homogeneous Regions with Low Flow. Acta Sci. Polonorum. Form. Circumiectus 2017, 16, 53–63. [Google Scholar] [CrossRef]
  18. Roszko-Wójtowicz, E. Analiza skupień w ocenie warunków pracy w krajach Unii Europejskiej. Wiadomości Stat. 2014, 11, 65–84. [Google Scholar]
  19. Poskrobko, B. Wpływ trendów społecznych i gospodarczych na implementację idei zrównoważonego rozwoju. In Zrównoważony Rozwój Gospodarki Opartej na Wiedzy; Poskrobko, B., Ed.; Wydawnictwo Wyższej Szkoły Ekonomicznej w Białymstoku: Białystok, Poland, 2009; pp. 108–126. [Google Scholar]
  20. Matuszczak, A. Zróżnicowanie Rozwoju Rolnictwa w Regionach Unii Europejskiej w Aspekcie Jego Zrównoważenia; Wydawnictwo Naukowe PWN: Warsaw, Poland, 2013; pp. 66–67. [Google Scholar]
  21. Płachciak, A. Geneza idei zróżnicowanego rozwoju. Ekonomia. Pr. Nauk. Uniw. Ekon. We Wrocławiu 2011, 5, 231–248. [Google Scholar]
  22. Gudowski, J. Profesor Ignacy Sachs jako prekursor koncepcji zrównoważonego rozwoju. In Od Koncepcji Ekorozwoju do Koncepcji Zrównoważonego Rozwoju; Kiełczewski, D., Ed.; Wydawnictwo Wyższej Szkoły Ekonomicznej w Białymstoku: Białystok, Poland, 2009; pp. 13–14. [Google Scholar]
  23. Siuta-Tokarska, B. Nauka a filozofia zrównoważonego rozwoju. Nierówności Społeczne A Wzrost Gospod. 2020, 61, 167–183. [Google Scholar] [CrossRef]
  24. Deszczyński, P. Nauki ekonomiczne wobec problemów globalizacji gospodarki światowej—Implikacje dla krajów rozwijających się. In Nauki Ekonomiczne: Stylizowane Fakty a Wyzwania Nowoczesności; Fiedor, B., Ed.; Polskie Towarzystwo Ekonomiczne: Warsaw, Poland, 2015; pp. 311–322. [Google Scholar]
  25. Wożniak, M.G. Gospodarka Polski 1918–2018: W Kierunku Zintegrowanego Rozwoju; PWN: Warsaw, Poland, 2009; pp. 158–173. [Google Scholar]
  26. Adamowicz, M. Koncepcje trwałego i zrównoważonego rozwoju wobec wsi i rolnictwa. Pr. Nauk. Katedr. Polityki Agrar. Mark. Szkoły Głównej Gospod. Wiej. Warszawie 2006, 38, 11–25. [Google Scholar]
  27. Górka, K. Kontrowersje terminologiczne w zakresie ekonomiki ochrony środowiska i ekonomii ekologicznej. Ekon. Sr. 2010, 2, 15–21. [Google Scholar]
  28. Górka, K. Kwestie terminologiczne w ewolucji ekonomiki ochrony środowiska. Aura 2010, 10, 10–13. [Google Scholar]
  29. Pirages, D.C. The Sustainable Society—Implications for Limited Growth; Praeger: New York, NY, USA, 1997. [Google Scholar]
  30. Goodland, R.; Ledec, G. Neoclassical economics and principles of sustainable development. Ecol. Model. 1987, 38, 19–46. [Google Scholar] [CrossRef]
  31. Turner, R.K. Pluralism in an environmental economics: A survey of the sustainable economic development debate. J. Agric. Econ. 1988, 39, 352–359. [Google Scholar] [CrossRef]
  32. Pearce, D.; Markandya, A.; Barbier, W. Blueprint for a Green Economy; Earthscan: London, UK, 1989. [Google Scholar]
  33. Górka, K.; Poskrobko, B.; Radecki, W. Ochrona Środowiska: Problemy Społeczne, Ekonomiczne i Prawne; PWE: Warsaw, Poland, 1995. [Google Scholar]
  34. Runowski, H. Zrównoważony rozwój gospodarstw i przedsiębiorstw rolniczych. Rocz. Nauk. Stowarzyszenia Ekon. Rol. Agrobiz. 2000, 2, 94–102. [Google Scholar]
  35. Giovannini, E.; Linster, M. Measuring Sustainable Development: Achievements and Challenges; OECD: Geneva, Switzerland, 2005. [Google Scholar]
  36. Borys, T. Koncepcja zrównoważonego rozwoju w naukach ekonomicznych. In Ekonomia Zrównoważonego Rozwoju: Zarys Problemów Badawczych i Dydaktyki; Poskrobko, B., Ed.; Wydawnictwo Wyższej Szkoły Ekonomicznej: Białystok, Poland, 2010; pp. 44–61. [Google Scholar]
  37. Holger, R. Ekonomia Zrównoważonego Rozwoju; Wydawnictwo Zysk i Spółka: Poznań, Poland, 2010. [Google Scholar]
  38. Stanny, M.; Czarnecki, A. Zrównoważony Rozwój Obszarów Wiejskich Zielonych Płuc Polski. Próba Analizy Empirycznej; IRWIR PAN: Warsaw, Poland, 2011. [Google Scholar]
  39. Dębska, L.; Świsłowski, P.; Kalinichenko, A. Renewable resources of energy in sustainable development. In Business Ethics and Sustainable Development: Interdisciplinary Theoretical and Empirical Studies. Around the Basic Issues of Modernity; Kuzior, A., Ed.; Silesian Centre for Business Ethics and Sustainable Development: Zabrze, Poland, 2017; pp. 9–16. [Google Scholar]
  40. Kumar, M. Social, Economic, and Environmental Impacts of Renewable Energy Resources. In Wind Solar Hybrid Renewable Energy System; Books on Demand: Norderstedt, Germany, 2020; Available online: https://www.intechopen.com/chapters/70874 (accessed on 3 August 2021).
  41. Dovì, V.G.; Battaglini, A. Energy Policy and Climate Change: A Multidisciplinary Approach to a Global Problem. Energies 2015, 8, 13473–13480. [Google Scholar] [CrossRef] [Green Version]
  42. Bukowski, M.; Majewski, J.; Sobolewska, A. Macroeconomic Electric Energy Production Efficiency of Photovoltaic Panels in Single-Family Homes in Poland. Energies 2021, 14, 126. [Google Scholar] [CrossRef]
  43. Komiyama, H.; Takeuchi, K. Science: Building a new discipline. Sustain. Sci. 2006, 1, 1–6. [Google Scholar] [CrossRef]
  44. Patterson, W. Keeping the Lights On: Towards Sustainable Electricity; Royal Institute for International Affairs/Chatham House and Earthscan: London, UK, 2009; p. 14. [Google Scholar]
  45. Tester, J.W.; Drake, E.M.; Driscoll, M.J.; Golay, M.W.; Peters, W.A. Sustainable Energy: Choosing among Options; The MIT Press: London, UK, 2005; p. 19. [Google Scholar]
  46. Transforming Our World: The 2030 Agenda for Sustainable Development. Available online: https://www.un.org/en/development/desa/population/migration/generalassembly/docs/globalcompact/A_RES_70_1_E.pdf (accessed on 3 August 2021).
  47. Jianzhong, X.; Assenova, A.; Erokhin, V. Renewable Energy and Sustainable Development in a Resource-Abundant Country: Challenges of Wind Power Generation in Kazakhstan. Sustainability 2018, 10, 3315. [Google Scholar] [CrossRef] [Green Version]
  48. Prandecki, K. Theoretical foundations of sustainable energy. Studia Ekon. 2014, 166, 238–241. [Google Scholar]
  49. Traktat Ustanawiający Europejską Wspólnotę Węgla i Stali. Available online: https://eur-lex.europa.eu/legal-content/PL/TXT/?uri=LEGISSUM:xy0022 (accessed on 3 August 2021).
  50. Traktat Ustanawiający Europejską Wspólnotę Energii Atomowej. Available online: https://sip.lex.pl/akty-prawne/dzu-dziennik-ustaw/traktat-ustanawiajacy-europejska-wspolnote-energii-atomowej-rzym-1957-17099385 (accessed on 3 August 2021).
  51. Małuszyńska, E.; Gruchman, B. Kompedium Wiedzy o Unii Europejskiej; PWN: Warsaw, Poland, 2018. [Google Scholar]
  52. European Commission. Energy Roadmap 2050; Publications Office of the European Union: Luxembourg, 2012. [Google Scholar]
  53. A European Green Deal. Available online: https://ec.europa.eu/info/strategy/priorities-2019-2024/european-green-deal_en (accessed on 3 August 2021).
  54. European Council, 10–11 December 2020. Available online: https://www.consilium.europa.eu/pl/meetings/european-council/2020/12/10-11/# (accessed on 3 August 2021).
  55. Bluszcz, A.; Manowska, A. Panel Analysis to Investigate the Relationship between Economic Growth, Import, Consumption of Materials and Energy. Proc. World Multidiscip. Earth Sci. Symp. 2019, 362, 012153. [Google Scholar] [CrossRef] [Green Version]
  56. Lorek, E. Rozwój zrównoważony energetyki w wymiarze międzynarodowym, europejskim i krajowym. In Teoria i Praktyka Zrównoważonego Rozwoju; Gradczyk, A., Ed.; Eko-Pres: Białystok/Wrocław, Poland, 2007; pp. 163–176. [Google Scholar]
  57. Gallagher, K.S. Why & How Governments Support Renewable Energy. Daedalus 2013, 142, 59–77. [Google Scholar]
  58. Weitzel, T.; Glock, C.H. Energy Management for Stationary Electric Energy Storage Systems: A Systematic Literature Review. Eur. J. Oper. Res. 2018, 264, 582–606. [Google Scholar] [CrossRef]
  59. Gielen, D.; Boshell, F.; Saygin, D.; Bazilian, M.D.; Wagner, N.; Gorini, R. The role of renewable energy in the global energy transformation. Energy Strategy Rev. 2019, 24, 38–50. [Google Scholar] [CrossRef]
  60. Kuriqi, A.; Pinheiro, A.; Sordo-Ward, A.; Garrote, L. Trade-off between Environmental Flow Policy and Run-of-River Hydropower Generation in Mediterranean Climate. Eur. Water 2017, 60, 123–130. [Google Scholar]
  61. Wang, Q.; Yang, X. Investigating the sustainability of renewable energy—An empirical analysis of European Union countries using a hybrid of projection pursuit fuzzy clustering model and accelerated genetic algorithm based on real coding. J. Clean. Prod. 2020, 268, 121940. [Google Scholar] [CrossRef]
  62. Zahedi, A. A review of drivers, benefits, and challenges in integrating renewable energy sources into electricity grid. Renew. Sustain. Energy Rev. 2011, 15, 4775–4779. [Google Scholar] [CrossRef]
  63. Pokharel, R.; Grala, R.K.; Grebner, D.L. Woody Remediation for Bioenergy by Primary Forest Products Manufacturers: An Exploratory Analysis. For. Policy Econ. 2017, 85, 161–171. [Google Scholar] [CrossRef]
  64. Banshwar, A.; Sharma, N.K.; Sood, Y.R.; Shrivastava, R. Renewable Energy Sources as a New Participant in Ancillary Service Markets. Energy Strategy Rev. 2017, 18, 106–120. [Google Scholar] [CrossRef]
  65. Limberger, J.; Boxem, T.; Pluymaekers, M.; Bruhnc, D.; Manzella, A.; Calcagno, P.; Beekman, F.; Cloetingh, S.; van Wees, J.D. Geothermal Energy in Deep Aquifers: A Global Assessment of the Resource Base for Direct Heat Utilization. Renew. Sustain. Energy Rev. 2018, 82, 961–975. [Google Scholar] [CrossRef]
  66. Wang, Q.; Zhan, L. Assessing the sustainability of renewable energy: An empirical analysis of selected 18 European countries. Sci. Total Environ. 2019, 692, 529–545. [Google Scholar] [CrossRef] [PubMed]
  67. Pultowicz, A. The Premises of Renewable Energy Sources Market Development in Poland in the Light of Sustainable Development Idea. Probl. Sustain. Dev. 2009, 4, 109–115. [Google Scholar]
  68. Knutel, B.; Pierzyńska, A.; Dębowski, M.; Bukowski, P.; Dyjakon, A. Assessment of Energy Storage from Photovoltaic Installations in Poland Using Batteries or Hydrogen. Energies 2020, 13, 4023. [Google Scholar] [CrossRef]
  69. Gulaliyev, M.G.; Mustafayev, E.R.; Mehdiyeva, G.Y. Assessment of Solar Energy Potential and Its Ecological-Economic Efficiency: Azerbaijan Case. Sustainability 2020, 12, 1116. [Google Scholar] [CrossRef] [Green Version]
  70. Tong, W. Fundamentals of Wind Energy. WIT Trans. State Art Sci. Eng. 2010, 44, 3–48. [Google Scholar]
  71. Kaygusuz, K. Wind Energy: Progress and Potential. Energy Sources 2004, 26, 95–105. [Google Scholar] [CrossRef]
  72. Bagher, A.M.; Vahid, M.; Mohsen, M.; Parvin, D. Hydroelectric Energy Advantages and Disadvantages. Am. J. Energy Sci. 2015, 2, 17–20. [Google Scholar]
  73. Krzemień, Z. Wykorzystanie energii fal morskich do produkcji energii elektrycznej. Pr. Inst. Elektron. 2013, 262, 120–131. [Google Scholar]
  74. Sala, K. Przemysłowe wykorzystanie energii geotermalnej w Polsce na przykładzie geotermalnego zakładu ciepłowniczego w Bańskiej Niżnej. Pr. Kom. Geogr. Przemysłu Pol. Tow. Geogr. 2018, 32, 74–82. [Google Scholar] [CrossRef]
  75. Cantrell, K.B.; Ducey, T.; Ro, K.S.; Hunt, P.G. Livestock waste-to-bioenergy generation opportunities. Bioresour. Technol. 2008, 99, 7941–7953. [Google Scholar] [CrossRef]
  76. García-Álvarez, M.T.; Cabeza-García, L.; Soares, I. Assessment of energy policies to promote photovoltaic generation in the European Union. Energy 2018, 151, 864–874. [Google Scholar] [CrossRef]
  77. Gökgöz, F.; Güvercin, M.T. Energy security and renewable energy efficiency in EU. Renew. Sustain. Energy Rev. 2018, 96, 226–239. [Google Scholar] [CrossRef]
  78. Ossowska, L.J. Consequences of the energy policy in member states of the European Union—The renewable energy sources targets. Polityka Energ. 2019, 22, 21–32. [Google Scholar] [CrossRef]
  79. Rokicki, T.; Perkowska, A. Changes in Energy Supplies in the Countries of the Visegrad Group. Sustainability 2020, 12, 7916. [Google Scholar] [CrossRef]
  80. Marzec, L.; Zioło, M. Importance of Renewable Sources of Energy in the Visegrad Countries. Metod. Ilościowe Bad. Ekon. 2016, 17, 75–85. [Google Scholar]
  81. Kochanek, E. The Energy Transition in the Visegrad Group Countries. Energies 2021, 14, 2212. [Google Scholar] [CrossRef]
  82. UN Climate Change Conference. Available online: https://unfccc.int/cop25 (accessed on 4 August 2021).
  83. Quansah, D.A.; Adaramola, M.S. Ageing and degradation in solar photovoltaic modules installed in northern Ghana. Sol. Energy 2018, 173, 834–847. [Google Scholar] [CrossRef]
  84. The European Committee of the Regions. Available online: https://cor.europa.eu/pl/news/Pages/time-to-eradicate-energy-poverty-in-europe.aspx (accessed on 4 August 2021).
  85. Sathaye, J.; Lucon, O.; Rahman, A.; Christensen, J.; Denton, F.; Fujino, J.; Heath, G.; Mirza, M.; Rudnick, H.; Schlaepfer, A.; et al. Renewable Energy in the Context of Sustainable Development. Phys. Fac. Publ. 2011, 1, 707–790. [Google Scholar]
  86. Goal 7: Ensure Access to Affordable, Reliable, Sustainable and Modern Energy for All. Available online: https://unstats.un.org/sdgs/report/2018/goal-07/ (accessed on 4 August 2021).
  87. The Sustainable Development Goals Report. 2021. Available online: https://unstats.un.org/sdgs/report/2021/The-Sustainable-Development-Goals-Report-2021.pdf (accessed on 4 August 2021).
  88. Sarstedt, M.; Mooi, E. A Concise Guide to Market. Research: The Process, Data, and Methods Using IBM SPSS Statistics; Springer: Berlin/Heidelberg, Germany, 2014. [Google Scholar]
  89. National Energy and Climate Strategy of Finland for 2030. Available online: https://www.iea.org/policies/6367-national-energy-and-climate-strategy-of-finland-for-2030 (accessed on 26 July 2021).
  90. Fischer, R.; Elfgren, E.; Toffolo, A. Energy Supply Potentials in the Northern Counties of Finland, Norway and Sweden towards Sustainable Nordic Electricity and Heating Sectors: A Review. Energies 2018, 11, 751. [Google Scholar] [CrossRef] [Green Version]
  91. Włodarczyk, B.; Firoiu, D.; Ionescu, G.H.; Ghiocel, F.; Szturo, M.; Markowski, L. Assessing the Sustainable Development and Renewable Energy Sources Relationship in EU Countries. Energies 2021, 14, 2323. [Google Scholar] [CrossRef]
  92. Lyeonov, S.; Pimonenko, T.; Bilan, Y.; Štreimikienė, D.; Mentel, G. Assessment of Green Investments’ Impact on Sustainable Development: Linking Gross Domestic Product Per Capita, Greenhouse Gas Emissions and Renewable Energy. Energies 2019, 12, 3891. [Google Scholar] [CrossRef] [Green Version]
  93. Bechberger, M.; Reiche, D. Renewable energy policy in Germany: Pioneering and exemplary regulations. Energy Sustain. Dev. 2004, 8, 47–57. [Google Scholar] [CrossRef]
  94. Schlör, H.; Fischer, W.; Hake, J.F. Methods of measuring sustainable development of the German energy sector. Appl. Energy 2013, 101, 172–181. [Google Scholar] [CrossRef]
  95. Titov, A.; Kövér, G.; Tóth, K.; Gelencsér, G.; Kovács, B.H. Acceptance and Potential of Renewable Energy Sources Based on Biomass in Rural Areas of Hungary. Sustainability 2021, 13, 2294. [Google Scholar] [CrossRef]
  96. Németh, K.; Birkner, Z.; Katona, A.; Göllény-Kovács, N.; Bai, A.; Balogh, P.; Gabnai, Z.; Péter, E. Can Energy Be a “Local Product” Again? Hungarian Case Study. Sustainability 2020, 12, 1118. [Google Scholar] [CrossRef] [Green Version]
  97. Ze Ya, A. French Green Growth Paradigm In-line with EU Targets Towards Sustainable Development Goals. Eur. J. Sustain. Dev. 2016, 5, 143–170. [Google Scholar]
  98. Ntanos, S.; Kyriakopoulos, G.; Chalikias, M.; Arabatzis, G.; Skordoulis, M. Public Perceptions and Willingness to Pay for Renewable Energy: A Case Study from Greece. Sustainability 2018, 10, 687. [Google Scholar] [CrossRef] [Green Version]
  99. Gabaldón-Estevan, D.; Peñalvo-López, E.; Alfonso Solar, D. The Spanish Turn against Renewable Energy Development. Sustainability 2018, 10, 1208. [Google Scholar] [CrossRef] [Green Version]
Figure 1. Interrelationship among sustainability dimensions of the energy sector.
Energies 14 05680 g001
Figure 2. Structure of renewable energy use in EU countries in 2019.
Energies 14 05680 g002
Figure 3. Tree diagram: hierarchical cluster analysis of renewable energy consumption in European countries in 2019.
Energies 14 05680 g003
Figure 4. Graph of amalgamation schedule.
Energies 14 05680 g004
Table 1. Share of renewable energy in transport in years 2009–2019 (Note: countries were ordered by 2019 index value, from highest to lowest).
EU Country200920102011201220132014201520162017201820192009 = 100
Sweden9.369.6311.9413.7815.3218.8321.4926.5626.8429.7030.31323.95
Finland4.564.411.021.0710.6824.5424.788.8918.8117.6821.29467.32
Netherlands4.573.405.075.225.346.565.504.926.029.6212.51273.70
Austria11.1810.7110.0810.049.7010.9911.4110.599.719.959.7787.39
France6.656.580.997.427.608.258.378.418.768.969.25139.09
Portugal3.895.550.700.810.933.677.437.657.919.049.09233.95
Italy4.004.925.066.165.415.026.517.416.487.669.05226.23
Ireland1.962.493.844.044.895.205.945.167.447.178.93455.25
Malta0.000.002.023.223.484.674.685.276.838.028.6986.900
Slovakia5.365.295.735.606.217.958.637.776.956.998.31154.88
Hungary5.896.166.176.006.347.007.177.777.737.758.03136.44
Slovenia2.253.122.483.253.772.882.241.602.575.487.98354.64
Bulgaria1.091.500.900.655.895.746.497.207.278.087.89722.80
Romania1.301.372.854.965.454.685.496.176.566.347.85604.93
Czechia4.315.221.296.256.457.006.546.506.626.567.83181.63
Germany5.886.416.467.327.306.906.577.017.037.927.68130.68
Luxembourg2.232.092.362.834.075.556.705.966.476.577.66342.81
Spain3.715.020.770.870.951.031.115.195.806.937.61205.01
Denmark0.691.153.616.286.466.566.436.736.946.927.171034.49
Belgium2.204.804.794.915.085.843.916.026.626.696.81309.88
Poland5.416.646.926.536.676.325.693.974.235.656.12113.15
Croatia1.291.121.031.052.722.652.361.221.172.585.86453.52
Estonia0.440.430.450.450.450.420.410.430.423.305.151175.34
Latvia1.893.984.094.004.034.083.642.452.274.735.11270.87
Greece1.101.920.600.900.981.331.101.624.004.114.05367.42
Lithuania4.483.793.834.974.844.364.583.654.304.334.0590.36
Cyprus2.041.990.000.001.132.682.522.672.562.663.32162.87
Minimum0.000.000.000.000.450.420.410.430.422.583.3233.200
Average3.624.063.524.395.266.326.586.256.977.838.79242.90
Maximum11.1810.7111.9413.7815.3224.5424.7826.5626.8429.7030.31271.12
Table 2. Share of renewable energy in electricity in years 2009–2019 (Note: countries were ordered by 2019 index value, from highest to lowest).
EU Country200920102011201220132014201520162017201820192009 = 100
Austria68.6266.3666.7867.4468.9171.0671.4972.5271.6374.2175.14109.50
Sweden58.2555.7759.6259.7861.7463.2165.7364.8765.9166.2371.19122.21
Denmark28.2632.7435.8738.7243.0848.4951.2953.7259.9462.4065.35231.27
Portugal37.5640.6145.7847.5149.1052.0552.6253.9954.1752.1953.77143.16
Latvia41.9442.0544.6944.8848.6951.0452.2151.2554.3553.5053.42127.37
Croatia35.8837.5237.5938.7642.0845.2445.4146.6746.4448.1449.78138.76
Romania30.8930.3831.1333.5737.5241.6843.1642.7141.9741.7941.71135.01
Germany17.5218.2420.9323.5925.2828.1730.8832.2734.6137.8540.82232.95
Finland27.3527.6629.3929.5030.8831.4232.4732.9335.2236.7738.07139.21
Spain27.8429.7831.5633.4736.7337.7836.9536.4936.2935.0636.93132.67
Ireland14.0615.6418.2519.8421.2523.5125.5326.8430.1033.2636.49259.53
Italy18.8120.0923.5527.4231.3033.4233.4634.0134.1033.9334.77184.87
Slovenia33.7632.2031.0531.6333.0933.9432.7332.0632.4332.3132.6396.67
Greece11.0212.3113.8116.3621.2421.9222.0922.6624.4726.0031.30284.09
Bulgaria10.9112.3612.6215.8218.6818.6918.9819.1519.0222.3623.51215.56
France15.0914.8216.1816.5516.9718.4618.8219.2119.9321.1322.38148.36
Estonia5.9710.2912.2015.6712.9514.0215.6215.5617.0319.6922.00368.72
Slovakia17.7717.7719.3120.0520.8022.8722.6622.5121.3421.5021.95123.53
Belgium6.177.239.0111.3412.5513.4515.6115.9017.2618.9020.83337.46
Lithuania5.877.409.0210.8813.1513.7115.5416.8718.2618.4118.79320.16
Netherlands9.079.609.7410.359.919.9211.0412.5513.8115.1918.22200.89
Poland5.836.658.1610.6810.7312.4013.4313.3613.0913.0314.36246.18
Czechia6.387.5210.6111.6712.7813.8914.0713.6213.6513.7114.05220.24
Luxembourg4.113.794.084.665.335.966.206.678.069.1310.86264.48
Hungary6.967.106.386.066.607.317.347.297.528.319.99143.60
Cyprus0.591.393.454.936.657.408.458.598.919.369.761656.37
Malta0.000.030.451.121.573.334.315.716.857.668.0480.400
Minimum0.000.030.451.121.573.334.315.716.857.668.0480.400
Average20.2421.0122.6424.1625.9127.5728.4528.8929.8630.8232.45160.32
Maximum68.6266.3666.7867.4468.9171.0671.4972.5271.6374.2175.14109.50
Table 3. Share of renewable energy in heating and cooling in years 2009–2019 (Note: countries were ordered by 2019 index value, from highest to lowest).
EU Country200920102011201220132014201520162017201820192009 = 100
Sweden60.5758.4859.9562.3963.5364.4665.2865.4565.7765.3466.12109.16
Latvia47.8940.7544.7147.2749.6552.1551.7451.8154.6055.4357.76120.63
Finland42.8943.9745.7648.2550.7751.9552.6253.7054.5954.6457.49134.04
Estonia41.7843.2543.9742.9942.9944.9749.3350.9551.7053.6852.28125.11
Denmark29.5130.4532.0533.2834.8038.1740.2341.5944.6445.5548.02162.74
Lithuania33.7232.5432.7934.5436.8840.6346.0946.5746.5046.0247.36140.45
Portugal37.9533.8335.2033.1634.6440.4640.1141.6341.0340.9341.65109.74
Croatia31.3032.8833.8236.5537.3136.2238.6237.6436.6336.6536.79117.56
Bulgaria21.6424.3324.7727.2429.2328.5228.9029.9929.8833.3035.51164.09
Cyprus17.3218.8420.0221.8422.6222.2624.1324.7626.4837.2335.10202.69
Austria29.6330.9631.5233.0833.2233.3833.2333.4833.6734.1933.80114.08
Slovenia28.8729.5431.7833.1435.1134.6436.1535.5634.6432.3432.16111.39
Greece17.2518.6620.1124.1227.4227.8726.5625.4228.2530.2930.19175.05
Romania26.4327.2324.3125.7526.2026.7425.8926.8726.5825.4325.7497.37
Malta2.017.2812.0313.4015.4015.0314.6416.8619.3123.3525.701277.72
Czechia14.2614.1015.3916.2517.7019.5219.7819.8719.7220.6322.65158.81
France15.0416.1615.3716.6717.6718.1919.0220.2420.7321.3622.46149.36
Slovakia8.187.909.268.807.888.8710.799.889.8410.6019.70240.84
Italy16.4315.6413.8216.9818.0918.9119.2518.8820.0819.2319.67119.74
Spain13.3212.6213.6614.1614.1515.8216.9817.3017.7017.5718.87141.66
Hungary17.0218.0820.0423.3123.7021.2821.3421.0319.8718.1718.12106.47
Poland11.6111.8113.2413.5014.2714.2414.8014.9214.8815.1415.98137.69
Germany11.1612.0612.5713.4213.4113.4213.4413.0413.3814.1214.55130.47
Luxembourg4.634.704.744.945.357.066.867.057.478.488.71188.12
Belgium5.946.706.657.097.587.747.868.238.148.318.31139.88
Netherlands3.373.103.693.774.004.935.205.125.676.077.08210.12
Ireland4.194.324.604.815.196.296.196.276.626.356.32150.91
Minimum2.013.103.693.774.004.935.205.125.676.076.32314.12
Average22.0022.2323.1824.4725.5126.4327.2227.5628.0928.9029.93136.07
Maximum60.5758.4859.9562.3963.5364.4665.2865.4565.7765.3466.12109.16
Publisher’s Note: MDPI stays neutral with regard to jurisdictional claims in published maps and institutional affiliations.

