Review

A Review of Key Performance Indicators for Building Flexibility Quantification to Support the Clean Energy Transition

1
Dipartimento di Ingegneria, Università degli Studi di Palermo, 90128 Palermo, Italy
2
Istituto di Tecnologie Avanzate per l’Energia “Nicola Giordano”, Consiglio Nazionale delle Ricerche, 98126 Messina, Italy
*
Author to whom correspondence should be addressed.
Energies 2021, 14(18), 5676; https://doi.org/10.3390/en14185676
Submission received: 21 July 2021 / Revised: 30 August 2021 / Accepted: 7 September 2021 / Published: 9 September 2021

Abstract

:
The transition to a sustainable society and a carbon-neutral economy by 2050 requires extensive deployment of renewable energy sources that, due to the aleatority and non-programmability of most of them, may seriously affect the stability of existing power grids. In this context, buildings are increasingly being seen as a potential source of energy flexibility for the power grid. In literature, key performance indicators, allowing different aspects of the load management, are used to investigate buildings’ energy flexibility. The paper reviews existing indicators developed in the context of theoretical, experimental and numerical studies on flexible buildings, outlining the current status and the potential future perspective. Moreover, the paper briefly reviews the range of grid services that flexible buildings can provide to support the reliability of the electric power system which is potentially challenged by the increasing interconnection of distributed variable renewable generation.

1. Introduction

To achieve ambitious targets of a sustainable society by 2050 [1], various measures and pathways are being investigated by research communities. All parts of society and economic sectors will play a role in this transition, requiring a combination of economic, environmental and social challenges. In this context, the achievement of a carbon-neutral energy system with a high spread of renewable energy systems (RES) requires a paradigm shift in power systems [2,3].
Most of the current energy infrastructures have been designed to house large, centrally located, localized generation units that are managed to meet instantaneous energy demand. However, to facilitate the RES integration in the existing infrastructures, the flexibility of the power system must be increased, aiming to achieve the instant balance of temporal and spatial mismatches in a bi-directional decentralized system with a high penetration of smaller prosumers. Import and export of energy over the system boundaries, power-to-X technologies and energy storage technologies, as well as different demand response strategies, are examples of flexibility sources [4,5].
In this context, the building sector is a key enabler of future energy systems as it will help to facilitate a larger share of renewables, distributed supply and demand-side energy flexibility [6].
Although building design should be firstly based on the employment of passive design strategies to reduce energy requirements, implementation of energy efficient systems and adoption of RES to cover the building’s energy demand, the successful building design should also take into account the flexibility of its energy systems. Future buildings should play a crucial role in transforming the energy markets, becoming interactive players in grid balancing [7,8,9].
Control strategies to deploy demand-side flexibility are crucial instruments to activate the energy flexibility of the buildings in order to improve grid interaction and load match, reduce energy demands, perform load shifting [10]. Several control strategies are reported in literature with the aim both of increasing demand shifting and offering solutions to use RES more efficiently [11].
The control strategies act upon certain control inputs’ parameters, such as building envelope characteristics (e.g., active skin), climate properties, indoor temperature, occupancy and behavioral patterns, characteristics of the end-use equipment and their flexibility, load or generation profiles in the case of RES.
Moreover, future buildings can provide grid services and flexibility; thereby, they will be crucial players in the transition to a low-carbon energy system. Buildings can provide significant benefits to the grid through a combination of actions that reduce or adjust electricity consumption to avoid or reduce electricity system costs. They can supply flexibility services in different ways such as shifting of plug loads [12], utilization of thermal mass [13], adjustability of HVAC systems [14] and charging of electric vehicles [15]. This can enhance energy quality and security by offering faster responses to the changing levels of renewable generation or reducing transmission losses.
Despite the above-described potential and critical role in future energy grids, the role of buildings as active players in the grid is often neglected in definitions of low- or zero-energy buildings, and undefined in relevant design standards. In this context, defining a methodology to assess and quantify the flexibility of a building is among the most important challenges of the research activities on this topic. A unique methodology to assess and quantify the building flexibility in literature is still lacking as a consequence of the different definitions of flexibility [16]. The experts participating in the International Energy Agency-Energy Buildings and Communities (IEA-EBC) Annex 67 defined the energy flexibility of a building as “the ability to manage its demand and generation according to local climate conditions, user needs and grid requirements”. Moreover, it was stated that “Energy Flexibility of buildings will thus allow for demand-side management (DSM)/load control and thereby demand response based on the requirements of the surrounding energy networks” [17]. Other definitions of the flexibility of buildings reviewed in literature are listed in Table 1.
The building’s flexibility is influenced by several factors, for example: from its physical characteristics, such as thermal mass and architectural layout; from its energy systems, such as ventilation, heating, and energy storage systems; from its control system; from the users’ behavior and the thermal or visual comfort requirements and from many other boundary conditions, such as the climate conditions and its interaction with the energy infrastructures. Lund et al. [33] defined three main properties for the flexibility: time, energy and costs. All quantification methods and their corresponding performance indicators in literature have typically revolved around these three metrics. Reynders et al. [16], through a review of buildings energy flexibility definitions, stated that the reviewed studies focus on specific aspects or properties of energy flexibility, grouping the different areas of focus into five categories: energy infrastructure [34], electricity [22], costs [25], possibility of compromising other performances of the building (e.g., the impact on thermal comfort or on energy performance) [13] and interaction between the energy systems and the building [35].
Energy Flexibility represents a key issue to be addressed not only at a single level but also at a cluster level to achieve performance enhancement and cost optimization due the mutual collaboration among buildings and their generation, storage and consumption units [36,37]. At a district level, it can be considered not only the aggregation of individual buildings comprising the district, but also the distribution grids and the energy generation plants. To the best knowledge of the authors, most existing studies have been focused on the energy flexibility of individual buildings rather than clusters. Among the few studies regarding clusters, Vigna et al. [31,38] evaluated the flexibility of a four-building cluster, and Taniguchi et al. [39] focused at a neighborhood level on developing a bottom-up energy performance model to assess the energy flexibility of 5000 residential households. The energy flexibility potential on a large scale has the advantage of helping system operators to establish if it is financially worthwhile to provide flexibility services [40]. Moreover, within the cluster concept it is possible to obtain a decrease in the cost of electricity consumption, a larger load shift in time and a better improvement of the local use of renewable energy.
In literature, different approaches have been previously employed for the quantification of the flexibility of buildings. Key Performance Indicators (KPIs) provide the tools for measuring and managing progress for further learning and improvement. As a result, the KPI approach’s functionality has made it one of the most popular and valuable approaches in the reviewed literature regarding the investigation of building flexibility. For example, this approach has been used to investigate the energy flexibility of case study buildings in the North America [41], South America [42], Asia [28,43] and Europe [28,44].
KPIs are indispensable for quantifying a building’s energy flexibility and estimating how different features influence the sharing of renewable energies and the reduction of peaks of the energy loads. Indicators are useful to effectively show the energy flexibility concept, providing a common language between energy players. Moreover, the use of energy KPIs can contribute to determining the proper technologies for systems able to store energy and to improve buildings’ load shifting potential [17]. Considering the explanations above, the present work contributes to the research question on the role of the flexible buildings on future energy systems by investigating the relevance and usefulness of KPIs already existing in the literature. In detail, an analysis of the current literature concerning existing indicators developed in the context of theoretical, experimental and numerical studies on flexible buildings is presented. In detail, although in the literature there are different groups of KPIs that address different issues related to buildings’ performances (e.g., thermal or visual comfort [45], users’ behavior [46], RES sizing [47], HVAC energy efficiency [48], etc.) and although very often some of these KPIs are used jointly to examine buildings’ performances in a multidisciplinary way, in this paper only the KPIs that directly and explicitly take into account the issues of energy flexibility are investigated. In this context, the goal of the paper is to review different KPIs used to quantify the main aspects of building energy flexibility allowing the analysis and comparison of the strengths and weaknesses of each investigated KPI. This will also lead to the definition of the current literature gaps, suggesting the aspects to address in future research.
Finally, since by exploiting its flexibility, the built sector can participate in new markets providing grid services for sustainable and cost-effective energy supply, in order to establish if the investigated KPIs can be deployed in the evaluation and analysis of grid services, the paper provides a background on these and on the strategies to deliver them with flexible building loads.
This review is structured as follows: Section 2 reviews energy flexibility indicators from a building perspective, classified into: load matching indicators, grid interaction indicators and energy flexibility indicators. Section 3 describes grid services provided by flexible buildings. Discussion and final remarks are reported in Section 4.

2. Energy Flexibility from Buildings Perspective

From buildings’ perspective, flexibility is crucial in the context of the goals of decarbonization, energy saving and high-RES integration, including thermal and electricity storage, to achieve the nZEB target. The large amount of information regarding building flexibility and its quantification can be easily dealt with through the use of KPIs. Despite several indicators concerning several aspects of energy flexibility being available in literature, the research regarding the flexibility and the methodologies to quantify it is still widely investigated (i.e., Annex 83 [49]). Reviewed KPIs are discussed together with their definition in the following subsections, while nomenclature and subscripts are reported at the end of the paper. In detail, the reviewed indicators were divided into three main groups: load matching (LM) indicators, grid interaction (GI) indicators and flexibility energy flexibility indicators. Although the LM and GI KPIs do not directly address energy flexibility, they have been included in this review because LM KPIs take into account the building flexibility in terms of on-site energy generation in response to the change of load, while GI KPIS take into account the flexibility in terms of interaction with the grid. In this context, all these KPIs allow for building a complete framework to assess and quantify the energy flexibility of buildings.
In literature, load matching and grid interaction indicators are not used to optimize the building flexibility [28,50,51], but they are often used to improve the control of the building’s load. Usually, the building’s flexibility is evaluated by comparing the behavior of a building to a reference case or by comparing different strategies for the same building [47]. In this context, the flexibility of a building is studied by results comparison. Although these indicators are not directly linked to the building’s energy flexibility, these KPIs have been examined since they are crucial for investigating the coupled performance among the grid, RES and building and to assess the degree of success of grid control strategies, sizing or investment decisions. In fact, indicators for load match and grid interaction are considered relevant with time and research progress on the nearly zero energy building (nZEB) concept, providing a better understanding of the interplay between generation and demand [52,53]. Since such buildings play the dual role of being producers and consumers of energy, providing for the energy demand by coordinating on-site generation with energy imports from the utility grid, considerations about self-consumption are becoming more and more important, both at a design and operation level.

2.1. Load Matching Indicators

Load match indicators account building flexibility in terms of on-site energy generation in response to the change of load. In detail, they refer to how the on-site energy production compares with the building’s energy demand. These indexes accounting at the same time this dual aspect could be more useful in the context of a common framework to assess and quantify the flexibility of buildings. In the research field, aiming at the developments of nZEBs, LM indicators may help in comparing different design alternatives [54]. Moreover, they could be useful in choosing the size of RES and energy storage systems or in optimizing control strategies.
The simplicity of their mathematical definition makes LM indicators a useful tool for a first performance evaluation. If calculated using high-time-resolution data, LM KPIs show in full the correlation between energy supply and on-site demand, illustrating hourly, daily and seasonal effects, the correspondence between load and generation, the production pattern of different renewable energy technologies and the effects of applied control strategies. However, without full knowledge of the features of the investigated energy systems, it cannot be concluded which are the optimal KPI values for the investigated systems.
Load match indicators reviewed from literature are reported in Table 2. Moreover, for each KPI, the table shows the main strengths or weaknesses, highlighted from the literature analysis.
The load cover factor ( γ l o a d , Equation (1)) is defined as the percentage of the electrical demand covered by on-site electricity generation. In periods with no on-site generation the load cover factor value is zero, while the highest values are reached when there is a coincidence between the profile shape of electricity load and self-generation [28,29]. On the other hand, the supply cover factor ( γ s u p p l y , Equation (2)) is defined as the percentage of the on-site generation that is used by the building [28,29]. It is the complementary index of the load cover factor. These two KPIs are widely used in literature [44,55,56]. They are used to study different types of energy systems both at the single-building level and at the neighborhood level. For example, Salom et al. [28] use these KPIs to study zero energy residential buildings equipped with PV systems, while Tumminia et al. [44] analyzed an nZEB case study equipped with a grid-connected PV system, energy storage system and a programmable fuel cell. On the other hand, Baetens et al. [56] investigated the load match of a residential zero-energy neighborhood equipped with building integrated photovoltaic system. Moreover, they are mostly suited to evaluate control strategies aimed at decreasing grid dependence [43]. However, they have the disadvantage of to giving no direct information on net energy, consumption or supply, no information on peaks in power exchange and no information on connection capacity usage.
The loss of load probability ( L O L P b , Equation (3)) is defined as the time share during which the local generation does not cover the building demand [28,29], and thus how often energy must be supplied by the grid. It is useful in order to evaluate different load control strategies in a building and when the aim is increasing the suitability of a distributed generation system for covering the local load profile decreasing the need to consume power from the grid. It can be achieved by controlling demand with or without the inclusion of a storage system or adjusting the local generation, for instance, by changing the orientation of PV panels, increasing generation during morning and evening peaks in power demand. As with the previous two KPIs, it has the disadvantage of showing no indication on net energy, consumption or generation, no information on peaks in power exchange or on use of capacity connection. Therefore, referring at the loss of load probability, a generation system could be oversized leading to higher peaks in supply [57]. The energy autonomy KPI ( A b , Equation (6)) is the complementary index of the L O L P b index. It is defined as the fraction of the time when 100% of the load can be matched by on-site electricity generation.
The L O L P b and A b , indexes are a function of the time resolution used in the calculations. The time resolution based on the net exported to the grid is affected by the energy balance of the building. Due to the complexity of knowing in real time the changes in this balance, the L O L P b and A b , indexes could be an underestimated / overestimated in flexibility quantifications [44].
The mismatch compensation factor ( M C F , Equation (7)), defined as capacity of the local energy generation system for which the annual net exported energy is equal to zero divided by the capacity of the same system for which the economic value of annual import and export of electricity is the same [58], allows accounting for the benefits, in terms of cost savings, due to the use of different control strategies. Moreover, it could be useful to calculate how much to increase the production unit, aiming to compensate for the influence of the mismatch on the electricity supply system outside the building. If the system that compensates for the mismatch is smaller than the system that gives a net zero energy balance, generated electricity is, on average, worth more than demanded electricity so the M C F value is >1. As an example, if M C F is 1.2, it means that the mismatch has a negative influence on the system and has to be compensated, i.e., by increasing the capacity of the PV installation by 20%.
For the deployment of RESs, which fluctuates on the time scale of minutes/hours, it is crucial to define flexibility indicators based on these time intervals. The mismatch compensation factor, defined on yearly base, is not useful from this point of view.
Finally, the on-site energy ratio ( O E R , Equation (8)) is defined as the ratio between energy supply from local renewable sources and energy demand [59]. This KPI, rather than considering only the generation of more exported energy versus its importation to the grid or individual buildings, emphasis shifting to the maximization of energy performance in a system-based approach. If O E R has a value of 1 it means that, considering a net annual balance, the energy demand is completely covered by RES supply. A value higher than 1 implies that the annual energy demand is lower than the annual energy supply from local renewable energy sources. OER does not take into account the different energy types separately. It expresses the condition for which demand is covered by on-site production without accounting for the energy mismatch for each energy type.

2.2. Grid Interaction Indicators

Grid interaction indicators are used to measure how a building utilizes the grid connection [54]. As the load match indicators, these indicators are widely used in literature. However, in contrast to LM indicators that give an indication of the total amount of the exchanged energy with the grid, the GI indicators include also information about the quality of the energy exchange between the building and the grid [60]. Grid refers both to the physical utilization of the infrastructure and to the upstream energy system and market [61].
GI indicators can be used successfully in evaluating and designing the operation limits of the grid and in improving voltage regulation in the case of high RES penetration [62]. Some KPIs require only the generation and load profiles, while others involve in the calculation also additional data (e.g., energy market prices).
Table 3 shows the grid interaction indicators reviewed from literature concerning the matching of grid export and grid stability and quality requirements [63].
The grid interaction index ( G I I , Equation (9)) is defined as the variability of the exchanged energy between the building and the grid within a year, normalized for the maximum absolute value [29]. This KPI accounts the variation over time of the energy exchange of the building with the grid but not the amount of grid electricity needed. It describes the average interaction between the building and the grid, showing how the building works in synergy with the grid. Moreover, it is useful for expressing the variation over time of the energy exchange between the grid and a building.
The no grid interaction probability ( P E = 0 , Equation (10)) is defined as the probability that the building is acting autonomously of the grid [29]. However, it describes the interaction between the building and the grid without any information about the magnitude of the exchanged power with the grid.
The capacity factor ( C F b , Equation (11)) is defined as total energy exchange with the grid divided by the exchange that would have occurred at nominal connection capacity [28]. This KPI has the advantage of accounting for energy exchange with the grid, concurrence of load and generation and information on use of connection capacity. In contrast, it shows no indication about the on-site generation and consumption, or indication of peaks in power exchange with the grid.
The connection capacity credit ( E c , Equation (12)) is defined as the percentage of grid connection capacity that could be saved compared to a reference case (building with no local energy supply) [28,29]. It is useful to monitor the highest power peak when a specific limit should never be exceeded. Positive values of E c indicate a saving potential; negative values a need to increase the grid connection capacity with respect to the reference case. Moreover, decreasing this indicator could be a way to decrease the grid impact. A limit in the use of this indicator is that when it decreases it does not show if peaks are exceeded, so another indicator should be used to monitor peaks.
The one percent peak power ( O P P , Equation (14)) is defined as the mean power of the one percent highest quarter hourly peaks [64]. In detail, given loads measured at regular intervals one may sort them by decreasing values. This KPI is then the kth of these values, with k equal to 1% of the measured values. Values of the indicator can only be compared if the measurement interval is the same. Since this indicator is useful to monitor power peaks, it could be used to evaluate controls aimed at limiting them, thereby limiting grid losses and facilitating keeping the grid within operational limits. It has the disadvantage of not giving any information either on net energy exchange, consumption or supply or on matches between load and generation.
The absolute grid support coefficient ( G S C a b s , Equation (16)) weights a time-resolved electricity consumption profile with a time-resolved reference quantity (e.g., the residual load) [61]. It is used to evaluate the grid impact either of the heat supply system or the building (energy system view). From its definitions emerges that G S C a b s cannot be calculated for an instant of time, but a period consisting of at least two-time steps. As an example of the meaning of this KPI, a value of G S C a b s of 0.9 means that electricity is, on average, consumed when the residual load assumes 90% of its mean value in the evaluation period. This KPI indicates whether additional loads occur at times with a relative electricity demand above or below average. Moreover, it allows an evaluation of the grid impact of a building from the energy system perspective. This metric can be used to analyze the electricity consumption profiles of energy generators, such as heat pumps, since load shifting is typically restricted to a few hours. On the other hand, the relative grid support coefficient ( G S C r e l , Equation (18)) reports the achieved value of the G S C a b s to the worst and best possible potential boundaries on a scale of −100 to 100. In particular, the lower potential boundaries are referred to the least favorable grid conditions and the upper ones to the most favorable grid conditions. The grid support coefficients require a grid signal so they are not suitable for design analysis, but they are useful for ex-post performance considerations. They are referred to mean conditions of the grid so there is a limitation in their use for extreme situations, e.g., when grid operation is jeopardized.
Finally, the equivalent hours of storage ( N h S , Equation (19)) corresponds to the storage capacity expressed in hours. This index should be explored as potential indicator of flexibility in buildings with storage system.

2.3. Energy Flexibility Indicators

These indicators focused on flexibility quantification with respect to energy or power can be shifted as response to external signals in the power grid context. They can be used to investigate the building’s reaction to external signals (e.g., electricity price) within the context of the power grid or to analyze the physical characteristics of a building’s energy systems (e.g., storage capacity). Moreover, since they are often price-based, they can report whether energy is withdrawn or fed into the grid during low or high price periods.
Due to their generic structure, these KPIs can be applied to different building typologies, climates and energy systems.
Whilst the reviewed KPIs show the available energy flexibility of the building and its energy systems, they don’t capture the cost of providing it [65]. An economic index might be useful to allow a financial contract to be settled between users and network operators. Table 4 shows the energy flexibility KPIs reviewed from literature.
The flexibility factor ( F F , Equation (20)) is defined as the ability to shift energy use from periods with high energy prices to periods with low energy prices [25]. It gives an indication of when energy is consumed. In particular, if no demand load occurs during low price time its value is −1, if no demand load occurs during high price time its value is 1 and if demand load is similar during both price time its value is 0. It can be used to quantify the energy can be shifted in terms of heat stored by thermal mass.
The flexibility index ( F I , Equation (21)) is used in literature to quantify the flexibility in terms of reduction of the heating energy demand not covered by RES [38]. For example, in [38] the authors use this KPI to assess the energy flexibility of a cluster of buildings connected to a district heating system.
The procurements cost avoided flexibility factor ( F F P C , Equation (24)) is used to quantify the building flexibility in terms of procurement costs avoided (cost savings) [66]. The minimum value 0 is reached when the electricity required is used at the time with the highest price while the maximum value 1 is achieved at the time with the lowest price. Although the authors use this KPI to evaluate the ability to shift the heat pump electric load, it can be used to investigate the flexibility of any other electrical equipment.
The volume shifted flexibility factor ( F F V S , Equation (25)) is used to account for the flexibility in terms of energy shifted compared to a reference profile [66]. It can be used to investigate the flexibility of any other electrical equipment.
The available structure storage capacity ( C A D R , Equation (26)) is defined as the amount of heat that can be added to the thermal mass of a building, in the timeframe of an active demand response (ADR) event, without jeopardizing thermal comfort. Moreover, in [61] the same authors defined the storage efficiency ( η A D R , Equation (27)) as the fraction of heat that can be stored during an ADR event in order to be used subsequently to reduce the heating power needed to maintain thermal comfort. Although the authors use these indicators to investigate the heat that can be accumulated in the thermal mass of buildings, they are also useful for any other type of thermal storage systems, as proposed by Oldewurtel et al. [67]. As these KPIs refer only to thermal power they cannot be directly used by grid operators [68].
Finally, Kathirgamanathan et al. [65] defined the flexible energy efficiency KPI ( η f , Equation (31)) as a measure of how much energy can be shifted relative to a rebound effect. Since any kind of rebound behaviour is seen as less than ideal, it gives priority to the grid operator’s point of view.

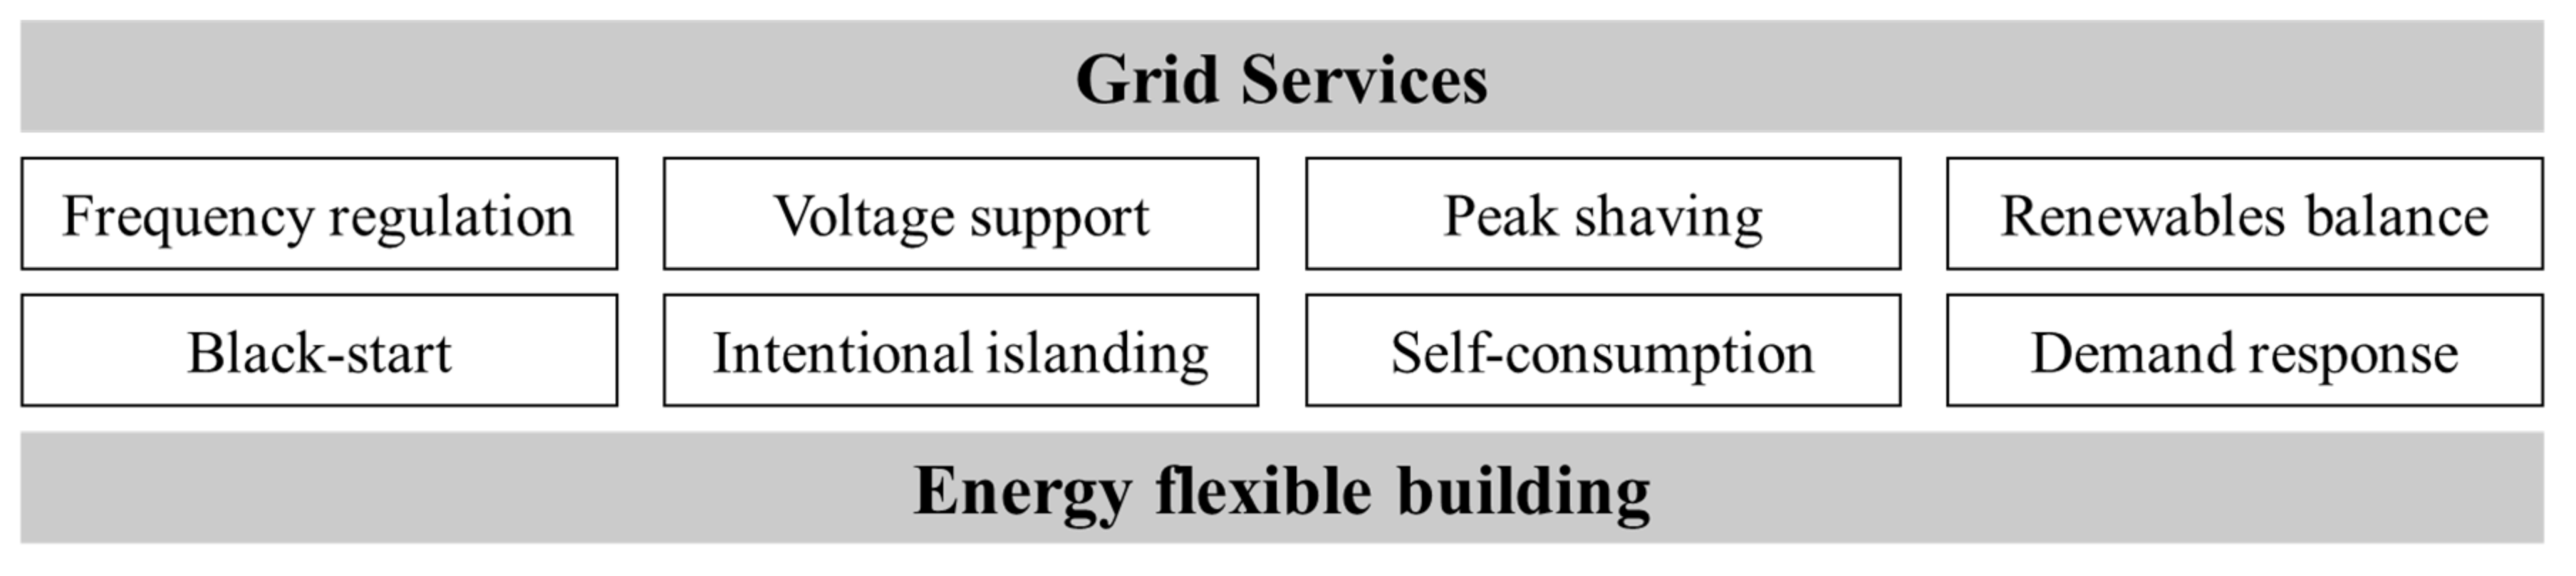
3. Energy Flexibility from Grid Service Perspective

Building energy flexibility can be exploited to respond to the needs of energy networks [71].
At the building level, demand-side management could enable different grid services, as reported in Figure 1.
In Section 2 the analysis of KPIs shows how the building flexibility to provide these grid services is affected by several aspects, such as on-site energy generation systems, thermal storage systems, electric storage systems, thermal mass of the building, building envelope characteristics, control strategies, and energy management strategies.
A definition of the grid services reported in the Figure 1 follows:
  • frequency regulation: control of the active power supply in order to contribute in regulating the grid frequency;
  • voltage support: control of the reactive power supply in order to contribute in regulating the grid voltage;
  • peak shaving: modulation of the active power delivered/adsorbed to tone down high rate of power due to the renewables in the power network;
  • renewable balance: compensation of renewable energy sources fluctuations;
  • black-start: ability to re-start the power network or portions of power networks;
  • intentional islanding: ability to operate in off-grid configuration;
  • self-consumption: control of the active power and of the loads, to maximize the use of the local renewable energy source, minimizing the grid interaction;
  • demand response: control of DSM and storage to perform load profiles, based on programs coming from signals of system operators.
Reductions in peak energy demand help avoid investments in infrastructure that would have been needed otherwise. Moreover, the large-scale use of distributed energy storage systems would allow buildings to provide energy flexibility and at the same time would increase the network resilience. This aspect could be crucial for town planning and urban design. The increasing share of renewable energy sources together with an extensive electrification of the energy demand are imposing new challenges to the management of energy systems due to the high stress of the electrical grid. Flexible buildings can contribute to reducing grid stress, creating a more resilient and reliable grid from with lowering costs for consumers. To flatten their demand curve, consumers are encouraged to use less energy during peak hours and to move the time of energy use to off-peak times such as night [72,73]. In this way, the energy system is improved at the side of the end-user in terms of consumption and cost effectiveness [74]. In this context, flexible buildings could benefit the operation of the electric grid and owners and occupants simultaneously, thus benefiting utilities and grid operators, customers and society at-large [75]. From the perspective of building owners, they can offer customer cost savings through more effective reduction in peak loads, taking advantage of utility time-of-use rates and additional revenues from demand response program participation while also enhancing building performance and occupant comfort.
A grid service provided depends, for example, on the type of service offered and its timing, the location within the grid and the avoided cost compared to a less expensive alternative resource providing a comparable service.
For grid operators, in order to manage grid services, certain features, such as the duration of the service, the response time and the frequency of events [76], are of paramount importance. Therefore, from grid operators’ point of view, the flexibility KPIs should allow the taking into account of these aspects.
The KPIs should provide information on some key aspects of flexibility, such as:
  • quantity and timing of demand flexibility provided to the grid;
  • quality of demand flexibility provided (e.g., time required to achieve the desired change in demand);
  • impacts on users and building non-energy services (e.g., occupants’ comfort).

4. Discussion and Final Remarks

The design and the control of nZEBs is challenging in many ways, due to the high and complex performance required in terms of energy efficiency, economic feasibility, environmental sustainability and occupant satisfaction. However, the successful design of any type of building, and even more so of in the case nZEBs, should also take into account the energy flexibility of its energy systems, the interaction with the infrastructure to which the building will be connected and the provision of services to this infrastructure.
Benefits in terms of cost savings for building owners and benefits in terms of recognition of how much generation for demand response can be activated for grid operators are among the advantages in the utilization of buildings’ flexibility. The quantification of energy flexibility is a complex process, dealing with the requirements both of the costumers and of the grid operators. However, there is still a lack between the definition of building flexibility and its quantification. This dissimilarity among the two aspects gives rise to a diversity of interpretations regarding the building flexibility concept.
In this context, this paper reviews and compares different building performance indicators existing in literature, developed in the context of the demand-side management strategies to quantify the main aspects of building flexibility. In detail, after analyzing a total of 28 indicators, they were divided into three categories as follows:
  • indicators useful for describing the degree of the utilization of on-site energy generation related to the local energy demand in nZEBs. (Load matching indicators);
  • indicators useful for describing the grid connection (Grid interaction indicators);
  • indicators useful for providing information about energy can be shifted in relation to scope and target for which energy flexibility measurements are applied (Energy flexibility indicators).
The load matching indicators are useful to study and compare different types of energy systems based on the coincidence between the profile shape of electricity load and self-generation or to evaluate different load control strategies. Most of these indicators have the disadvantage showoff not showing indication of net energy, consumption or generation, and no information on peaks in power exchange or on use of capacity connection. A further disadvantage is the mathematical dependence from the time of resolution affected by the energy balance of the building. Due to the complexity of knowing, in real time, the changes in this balance, with the use of these indicators flexibility quantification could be underestimated or overestimated.
The grid interaction indicators are useful for expressing the variation over time of the energy exchange between the grid and a building and to evaluate control strategies to limit peaks in power in order to limit grid losses and facilitate keeping the grid within operational limits. As a further advantage, these indicators allow evaluation of the grid impact from the energy system perspective, including also information about the quality of the energy exchange between the building and the grid. Most of these indicators have the disadvantage of not giving any information either on net energy exchange, consumption or supply or on matches between load and generation.
The energy flexibility indicators are useful for evaluating how the energy demand is distributed as response to a demand response event or a grid external signal. They allow investigation of the energy flexibility on the basis of the potential flexibility, going from individual energy systems’ components (HVAC, CHP, HPs or other appliances). They are widely used in the context of the storage technologies whose implementation is among the most developed DSM options to provide building flexibility. These indicators depend on several parameters, such as the physical/technological properties of the building, flexibility control strategies implemented and climate conditions. As a consequence, it is more difficult to compare different buildings based on their use. A comparison it is possible or among energy flexibility systems and dynamic strategies used in the same building or among similar buildings with the same climate conditions. The strong dependency from the climate conditions of the energy indicators is currently the strongest limitation in their utilization.
The research allowed the analysis and comparison of the strengths and weaknesses of each investigated KPI. On the other hand, the KPI review also led to highlighting some of the current literature gaps. For example, one of the research gaps identified concerns the limited availability of real monitored data used to calculate these KPIs. Moreover, whilst the reviewed KPIs show the available energy flexibility of the building and its energy systems, they do not capture the cost of providing it. In this context, an economic KPI might be useful to allow a financial contract to be settled between users and network operators.
The study also pointed out that all the KPIs examined take into account energy flexibility only on the side of the buildings. In particular, although DSM strategies are already widely used to reduce buildings’ energy consumption and increase their energy efficiency [34,37], in future they can be used to optimize the interaction between the buildings and the grid, opening up new market opportunities. In this context there is also a need for metrics and indicators to assess demand flexibility performance for grid services.
From the point of view of grid operators, the flexibility KPIs should be those related to the provision of services, which make it possible to take into account the duration of the service, the response time, the frequency of events and other requirements, for example, in a similar way to the monitoring of battery energy storage systems’ state of charge and identifying the energy of flexible buildings and the amount of energy that they can exchange with the grid, both by feeding energy and withdrawing it (a sort of dynamic state of charge of buildings). This indicator could lead to an improvement of the interactions between the buildings and the power grids.
Metrics beyond the simple quantity of any impact may become increasingly important, due to the fact that the flexibility of building demand will become more commonly implemented and buildings will provide more ancillary services. For example, the grid owner may require as services a load reduction within a specified time frame or with a specified response time, the duration of the load change, or the level of reliability or persistence as the percentage of time available in one year. Therefore, new KPIs may include metrics that show the quality of demand flexibility provided by a building as a grid service.
In this context, the KPIs should provide information such as:
  • realization rate: fraction of the expected reduction in load reduction or shift and energy generation that the building is able to provide in a given period of time;
  • compliance rate: how constantly the building provides the expected network services;
  • technical feasibility: acceptable range of voltage and frequency support.
To conclude, the research has highlighted that there is an opportunity for developing new KPIs to address the challenges within the reviewed KPIs. In addition, future works will be undertaken to test the performance of these indicators on real case studies.

Author Contributions

Conceptualization, V.A., M.C., M.F., F.S. Methodology, G.A.F., M.F., G.T., F.S. Writing—Original Draft Preparation, G.A.F., G.T., M.F., F.S. Writing—Review & Editing, D.A., V.A., M.C., M.F., G.T., F.S. Visualization, all authors. Supervision, V.A., M.C., M.F. All authors have read and agreed to the published version of the manuscript.

Funding

This research received no external funding.

Conflicts of Interest

All authors declare no conflicts of interest.
Nomenclature
A b Energy autonomy
C A D R Available structure storage capacity
C c o s t , b a l a n c e Capacity of the local energy generation system for which the annual net exported energy is equal to zero
C e n e r g y , b a l a n c e Capacity of renewable installation for which the cost of annual export and import of electricity is the same
C F b Capacity factor
D R Sizing rate
DSMDemand-side management
d t Delivered energy
EShifted energy
E 1 % , p e a k Power in the 1%highest peaks in energy exchange
E c Connection capacity credit
E d e s Nominal design connection capacity
e t Exported energy
FFFlexibility Factor
FIFlexibility Index
F F P C Procurements Cost avoided Flexibility Factor
F F V S Volume Shifted Flexibility Factor
G I I Grid interaction index
g(t)On-site electricity generation
GIGrid interaction
G s ¯ Peak power generation index
G s i Grid signal in time step i
G S C Grid Support Coefficient
HVACHeating, ventilation and air conditioning
l t Electric power load
LMLoad match
L O L P b Loss of load probability
KPIsKey Performance Indicators
M C F Mismatch compensation factor
N h S Equivalent hours of storage
nNumber of time steps
n e t Net exported electricity to the grid
nZEBNearly zero energy building
O E R On-site energy ratio
O P P One percent peak power
P Power
P E = 0 No grid interaction probability
P A L Peaks above limit
PBPotential boundaries
PCProcurement cost of the electricity consumed per year
PVPhotovoltaic
q Residual demand non covered by RES
q h Heating demand
RESRenewable energy systems
S t Stored energy
STDStandard deviation
TTime (evaluation period)
W e l Electricity consumption
γ l o a d Load cover factor
γ s u p p l y Supply cover factor
η A D R Storage efficiency
η A E E F Available electrical energy flexibility efficiency
η f Flexible energy efficiency
ζ t Power losses
Subscripts
absAbsolute
ADRActive demand response
AEEFAvailable electrical energy flexibility
bBuilding
cConnection
consConsumed
desDesign
elElectrical
exchExchanged
fFlexibility
hHeating
hptHigh price time
hSHours
limLimit
lptLow price time
PCProcurement cost
prodProduction
rbrebound
relrelative
refReference
s(grid) signal
VSVolume shifted

References

  1. European Commission COM(2019) 640 Final: “The European Green Deal” 2019. Available online: https://eur-lex.europa.eu/legal-content/IT/TXT/?uri=CELEX:52019DC0640 (accessed on 7 September 2021).
  2. Dupont, C.; Kulovesi, K.; Van Asselt, H. Assessing the EU 2030 Climate and Energy Framework. Rev. Eur. Comp. Int. Environ. Law 2020, 29. [Google Scholar] [CrossRef]
  3. Morales, J.M.; Conejo, A.J.; Madsen, H.; Pinson, P.; Zugno, M. Integrating Renewables in Electricity Markets: Operational Problems; Springer Science & Business Media: Berlin/Heidelberg, Germany, 2013; Volume 205, ISBN 1461494117. [Google Scholar]
  4. Dominković, D.F.; Dobravec, V.; Jiang, Y.; Nielsen, P.S.; Krajačić, G. Modelling smart energy systems in tropical regions. Energy 2018, 155, 592–609. [Google Scholar] [CrossRef]
  5. Farulla, G.A.; Cellura, M.; Guarino, F.; Ferraro, M. A Review of Thermochemical Energy Storage Systems for Power Grid Support. Appl. Sci. 2020, 10, 3142. [Google Scholar] [CrossRef]
  6. Zafar, R.; Mahmood, A.; Razzaq, S.; Ali, W.; Naeem, U.; Shehzad, K. Prosumer based energy management and sharing in smart grid. Renew. Sustain. Energy Rev. 2018, 82, 1675–1684. [Google Scholar] [CrossRef]
  7. EPBD Recast Directive 2018/844/UE of the European Parliament and of Council, 30 May 2018 on the Energy Performance of Buildings (Recast) Official Journal of the European Union. 2018. Available online: http://data.europa.eu/eli/dir/2018/844/oj (accessed on 7 September 2021).
  8. Cellura, M.; Campanella, L.; Ciulla, G.; Guarino, F.; Lo Brano, V.; Cesarini, D.N.; Orioli, A. The redesign of an Italian building to reach net zero energy performances: A case study of the SHC Task 40—ECBCS Annex 52. ASHRAE Trans. 2011, 117, 331–339. [Google Scholar]
  9. Cellura, M.; Guarino, F.; Longo, S.; Mistretta, M. Modeling the energy and environmental life cycle of buildings: A co-simulation approach. Renew. Sustain. Energy Rev. 2017, 80, 733–742. [Google Scholar] [CrossRef]
  10. Setlhaolo, D.; Xia, X. Combined residential demand side management strategies with coordination and economic analysis. Int. J. Electr. Power Energy Syst. 2016, 79, 150–160. [Google Scholar] [CrossRef]
  11. Mason, K.; Grijalva, S. A review of reinforcement learning for autonomous building energy management. Comput. Electr. Eng. 2019, 78, 300–312. [Google Scholar] [CrossRef] [Green Version]
  12. Gandhi, P.; Brager, G.S. Commercial office plug load energy consumption trends and the role of occupant behavior. Energy Build. 2016, 125, 1–8. [Google Scholar] [CrossRef] [Green Version]
  13. Reynders, G.; Nuytten, T.; Saelens, D. Potential of structural thermal mass for demand-side management in dwellings. Build. Environ. 2013, 64, 187–199. [Google Scholar] [CrossRef]
  14. Rotger-Griful, S.; Jacobsen, R.H.; Nguyen, D.; Sørensen, G. Demand response potential of ventilation systems in residential buildings. Energy Build. 2016, 121, 1–10. [Google Scholar] [CrossRef]
  15. Tan, Z.; Yang, P.; Nehorai, A. An optimal and distributed demand response strategy with electric vehicles in the smart grid. IEEE Trans. Smart Grid 2014, 5, 861–869. [Google Scholar] [CrossRef]
  16. Reynders, G.; Amaral Lopes, R.; Marszal-Pomianowska, A.; Aelenei, D.; Martins, J.; Saelens, D. Energy flexible buildings: An evaluation of definitions and quantification methodologies applied to thermal storage. Energy Build. 2018, 166, 372–390. [Google Scholar] [CrossRef]
  17. Jensen, S.Ø.; Marszal-Pomianowska, A.; Lollini, R.; Pasut, W.; Knotzer, A.; Engelmann, P.; Stafford, A.; Reynders, G. IEA EBC Annex 67 Energy Flexible Buildings. Energy Build. 2017, 155, 25–34. [Google Scholar] [CrossRef] [Green Version]
  18. Bertsch, J.; Growitsch, C.; Lorenczik, S.; Nagl, S. Flexibility in Europe’s power sector-An additional requirement or an automatic complement? Energy Econ. 2016, 53, 118–131. [Google Scholar] [CrossRef] [Green Version]
  19. Capuder, T.; Mancarella, P. Techno-economic and environmental modelling and optimization of flexible distributed multi-generation options. Energy 2014, 71, 516–533. [Google Scholar] [CrossRef]
  20. De Coninck, R.; Helsen, L. Quantification of flexibility in buildings by cost curves—Methodology and application. Appl. Energy 2016, 162, 653–665. [Google Scholar] [CrossRef]
  21. Finck, C.; Li, R.; Zeiler, W. Identification of a dynamic system model for a building and heating system including heat pump and thermal energy storage. MethodsX 2020, 7, 100866. [Google Scholar] [CrossRef]
  22. Fischer, D.; Wolf, T.; Wapler, J.; Hollinger, R.; Madani, H. Model-based flexibility assessment of a residential heat pump pool. Energy 2017, 118, 853–864. [Google Scholar] [CrossRef]
  23. Hurtado, L.A.; Rhodes, J.D.; Nguyen, P.H.; Kamphuis, I.G.; Webber, M.E. Quantifying demand flexibility based on structural thermal storage and comfort management of non-residential buildings: A comparison between hot and cold climate zones. Appl. Energy 2017, 195, 1047–1054. [Google Scholar] [CrossRef]
  24. Junker, R.G.; Azar, A.G.; Lopes, R.A.; Lindberg, K.B.; Reynders, G.; Relan, R.; Madsen, H. Characterizing the energy flexibility of buildings and districts. Appl. Energy 2018, 225, 175–182. [Google Scholar] [CrossRef]
  25. Le Dréau, J.; Heiselberg, P. Energy flexibility of residential buildings using short term heat storage in the thermal mass. Energy 2016, 111, 991–1002. [Google Scholar] [CrossRef]
  26. Lopes, R.A.; Chambel, A.; Neves, J.; Aelenei, D.; Martins, J. A Literature Review of Methodologies Used to Assess the Energy Flexibility of Buildings. Energy Procedia 2016, 91, 1053–1058. [Google Scholar] [CrossRef] [Green Version]
  27. Masy, G.; Georges, E.; Verhelst, C.; Lemort, V.; André, P. Smart grid energy flexible buildings through the use of heat pumps and building thermal mass as energy storage in the belgian context. Sci. Technol. Built Environ. 2015, 21, 800–811. [Google Scholar] [CrossRef]
  28. Salom, J.; Marszal, A.J.; Widén, J.; Candanedo, J.; Lindberg, K.B. Analysis of load match and grid interaction indicators in net zero energy buildings with simulated and monitored data. Appl. Energy 2014, 136, 119–131. [Google Scholar] [CrossRef]
  29. Salom, J.; Widén, J.; Candanedo, J.; Sartori, I.; Voss, K.; Marszal, A. Understanding net zero energy buildings: Evaluation of load matching and grid interaction indicators. In Proceedings of the 12th Conference of International Building Performance Simulation Association, Sydney, Australia, 14–16 November 2011; Volume 6, pp. 2514–2521. [Google Scholar]
  30. Nuytten, T.; Claessens, B.; Paredis, K.; Van Bael, J.; Six, D. Flexibility of a combined heat and power system with thermal energy storage for district heating. Appl. Energy 2013, 104, 583–591. [Google Scholar] [CrossRef]
  31. Vigna, I.; Pernetti, R.; Pasut, W.; Lollini, R. New domain for promoting energy efficiency: Energy Flexible Building Cluster. Sustain. Cities Soc. 2018, 38, 526–533. [Google Scholar] [CrossRef]
  32. Stinner, S.; Huchtemann, K.; Müller, D. Quantifying the operational flexibility of building energy systems with thermal energy storages. Appl. Energy 2016, 181, 140–154. [Google Scholar] [CrossRef]
  33. Lund, P.D.; Lindgren, J.; Mikkola, J.; Salpakari, J. Review of energy system flexibility measures to enable high levels of variable renewable electricity. Renew. Sustain. Energy Rev. 2015, 45, 785–807. [Google Scholar] [CrossRef] [Green Version]
  34. Xue, X.; Wang, S.; Sun, Y.; Xiao, F. An interactive building power demand management strategy for facilitating smart grid optimization. Appl. Energy 2014, 116, 297–310. [Google Scholar] [CrossRef]
  35. Kim, Y.-J.; Fuentes, E.; Norford, L.K. Experimental study of grid frequency regulation ancillary service of a variable speed heat pump. IEEE Trans. Power Syst. 2015, 31, 3090–3099. [Google Scholar] [CrossRef]
  36. Shen, L.; Sun, Y. Performance comparisons of two system sizing approaches for net zero energy building clusters under uncertainties. Energy Build. 2016. [Google Scholar] [CrossRef]
  37. Crosbie, T.; Short, M.; Dawood, M.; Charlesworth, R. Demand response in blocks of buildings: Opportunities and requirements. Entrep. Sustain. Issues 2017. [Google Scholar] [CrossRef] [Green Version]
  38. Vigna, I.; Jaeger, I.; De Saelens, D.; Lovati, M.; Lollini, R.; Pernetti, R.; Milano, P.; Leuven, K.U. Evaluating Energy and Flexibility Performance of Building Clusters Eurac Research, Bolzano; Italy Flemish Institute for Technological Research (VITO): Mol, Belgium; Università Degli Studi di Trento: Trento, Italy, 2018; pp. 3326–3333. [Google Scholar]
  39. Taniguchi, A.; Inoue, T.; Otsuki, M.; Yamaguchi, Y.; Shimoda, Y.; Takami, A.; Hanaoka, K. Estimation of the contribution of the residential sector to summer peak demand reduction in Japan using an energy end-use simulation model. Energy Build. 2016, 112, 80–92. [Google Scholar] [CrossRef]
  40. Hu, M.; Xiao, F. Quantifying uncertainty in the aggregate energy flexibility of high-rise residential building clusters considering stochastic occupancy and occupant behavior. Energy 2020, 194, 116838. [Google Scholar] [CrossRef]
  41. Denholm, P.; Novacheck, J.; Jorgenson, J.; O’Connell, M. Impact of Flexibility Options on Grid Economic Carrying Capacity of Solar and Wind: Three Case Studies; National Renewable Energy Lab. (NREL): Golden, CO, USA, 2016. [Google Scholar]
  42. Piderit, M.B.; Vivanco, F.; Van Moeseke, G.; Attia, S. Net Zero Buildings—A framework for an integrated policy in Chile. Sustainability 2019, 11, 1494. [Google Scholar] [CrossRef] [Green Version]
  43. Li, Y.; Gao, W.; Zhang, X.; Ruan, Y.; Ushifusa, Y.; Hiroatsu, F. Techno-economic performance analysis of zero energy house applications with home energy management system in Japan. Energy Build. 2020, 214, 109862. [Google Scholar] [CrossRef]
  44. Tumminia, G.; Guarino, F.; Longo, S.; Aloisio, D.; Cellura, S.; Sergi, F.; Brunaccini, G.; Antonucci, V.; Ferraro, M. Grid interaction and environmental impact of a net zero energy building. Energy Convers. Manag. 2020, 203, 112228. [Google Scholar] [CrossRef]
  45. Fratean, A.; Dobra, P. Key performance indicators for the evaluation of building indoor air temperature control in a context of demand side management: An extensive analysis for Romania. Sustain. Cities Soc. 2021, 68, 102805. [Google Scholar] [CrossRef]
  46. Jia, M.; Srinivasan, R.; Ries, R.J.; Bharathy, G.; Weyer, N. Investigating the impact of actual and modeled occupant behavior information input to building performance simulation. Buildings 2021, 11, 32. [Google Scholar] [CrossRef]
  47. Marotta, I.; Guarino, F.; Cellura, M.; Longo, S. Investigation of design strategies and quantification of energy flexibility in buildings: A case-study in southern Italy. J. Build. Eng. 2021, 41, 102392. [Google Scholar] [CrossRef]
  48. Zhang, K.; Kummert, M. Evaluating the impact of thermostat control strategies on the energy flexibility of residential buildings for space heating. Build. Simul. 2021, 14, 1439–1452. [Google Scholar] [CrossRef]
  49. Hedman, Å.; Rehman, H.U.; Gabaldón, A.; Bisello, A.; Albert-Seifried, V.; Zhang, X.; Guarino, F.; Grynning, S.; Eicker, U.; Neumann, H.M.; et al. IEA EBC Annex83 positive energy districts. Buildings 2021, 11, 130. [Google Scholar] [CrossRef]
  50. Ferraro, M.; Sergi, F.; Antonucci, V.; Guarino, F.; Tumminia, G.; Cellura, M. Load match and grid interaction optimization of a net zero energy building through electricity storage: An Italian case-study. In Proceedings of the 2016 IEEE 16th International Conference on Environment and Electrical Engineering (EEEIC), Florence, Italy, 7–10 June 2016. [Google Scholar] [CrossRef]
  51. Candanedo, J.; Salom, J.; Widén, J.; Athienitis, A. Load matching, grid interaction, and advanced control. Model. Des. Optim. Net-Zero Energy Build. 2015, 207–240. [Google Scholar] [CrossRef]
  52. Voss, K.; Sartori, I.; Napolitano, A.; Geier, S.; Gonçalves, H.; Hall, M.; Heiselberg, P.; Widén, J.; Candanedo, J.A.; Musall, E.; et al. Load Matching and Grid Interaction of Net Zero Energy Buildings. In Proceedings of the EUROSUN 2010 International Conference on Solar Heating, Cooling and Buildings, Graz, Austria, 28 September–1 October 2016; pp. 1–8. [Google Scholar] [CrossRef] [Green Version]
  53. Guarino, F.; Cassarà, P.; Longo, S.; Cellura, M.; Ferro, E. Load match optimisation of a residential building case study: A cross-entropy based electricity storage sizing algorithm. Appl. Energy 2015, 154, 380–391. [Google Scholar] [CrossRef]
  54. Papachristou, C.; Hoes, P.J.; Loomans, M.G.L.C.; van Goch, T.A.J.; Hensen, J.L.M. Investigating the energy flexibility of Dutch office buildings on single building level and building cluster level. J. Build. Eng. 2021, 40, 102687. [Google Scholar] [CrossRef]
  55. Baetens, R.; De Coninck, R.; Helsen, L.; Saelens, D. The impact of load profile on the grid-interaction of building integrated photovoltaic (BIPV) systems in low-energy dwellings. J. Green Build. 2010, 5, 137–147. [Google Scholar] [CrossRef]
  56. Baetens, R.; De Coninck, R.; Van Roy, J.; Verbruggen, B.; Driesen, J.; Helsen, L.; Saelens, D. Assessing electrical bottlenecks at feeder level for residential net zero-energy buildings by integrated system simulation. Appl. Energy 2012, 96, 74–83. [Google Scholar] [CrossRef]
  57. Yoon, Y.T.; Felder, F.A. Study of loss of load probability in designing installed capacity market. In Proceedings of the IEEE Power Engineering Society Transmission and Distribution Conference, Yokohama, Japan, 6–10 October 2002. [Google Scholar]
  58. Lund, H.; Marszal, A.; Heiselberg, P. Zero energy buildings and mismatch compensation factors. Energy Build. 2011, 43, 1646–1654. [Google Scholar] [CrossRef]
  59. Ala-Juusela, M.; Crosbie, T.; Hukkalainen, M. Defining and operationalising the concept of an energy positive neighbourhood. Energy Convers. Manag. 2016, 125, 133–140. [Google Scholar] [CrossRef] [Green Version]
  60. Sun, Y.; Ma, R.; Chen, J.; Xu, T. Heuristic optimization for grid-interactive net-zero energy building design through the glowworm swarm algorithm. Energy Build. 2020, 208, 109644. [Google Scholar] [CrossRef]
  61. Klein, K.; Herkel, S.; Henning, H.M.; Felsmann, C. Load shifting using the heating and cooling system of an office building: Quantitative potential evaluation for different flexibility and storage options. Appl. Energy 2017, 203, 917–937. [Google Scholar] [CrossRef]
  62. Ranaboldo, M.; Ferrer-Martí, L.; García-Villoria, A.; Pastor Moreno, R. Heuristic indicators for the design of community off-grid electrification systems based on multiple renewable energies. Energy 2013, 50, 501–512. [Google Scholar] [CrossRef]
  63. Sartori, I.; Napolitano, A.; Voss, K. Net zero energy buildings: A consistent definition framework. Energy Build. 2012, 48, 220–232. [Google Scholar] [CrossRef] [Green Version]
  64. Verbruggen, B.; Driesen, J. Grid impact indicators for active building simulations. IEEE Trans. Sustain. Energy 2015, 6, 43–50. [Google Scholar] [CrossRef]
  65. Kathirgamanathan, A.; Péan, T.; Zhang, K.; De Rosa, M.; Salom, J.; Kummert, M.; Finn, D.P. Towards standardising market-independent indicators for quantifying energy flexibility in buildings. Energy Build. 2020, 220, 110027. [Google Scholar] [CrossRef]
  66. Georges, E.; Masy, G.; Verhelst, C.; Lemort, V.; André, P. Smart Grid Energy Flexible Buildings Through The Use Of Heat Pumps In The Belgian Context. In Proceedings of the 3rd International High Performance Buildings Conference, West Lafayette, IN, USA, 14–17 April 2014. [Google Scholar]
  67. Oldewurtel, F.; Borsche, T.; Bucher, M.; Fortenbacher, P.; Haring, M.G.V.T.; Mathieu, J.L.; Megel, O.; Vrettos, E.; Andersson, G. A framework for and assessment of demand response and energy storage in power systems. In Proceedings of the 2013 IREP Symposium Bulk Power System Dynamics and Control—IX Optimization, Security and Control of the Emerging Power Grid, Rethymno, Greece, 25–30 August 2013; pp. 1–24. [Google Scholar] [CrossRef]
  68. Péan, T.; Torres, B.; Salom, J.; Ortiz, J. Representation of daily profiles of building energy flexibility. In Proceedings of the eSim 2018, the 10th Conference of IBPSA-Canada, Montréal, QC, Canada, 9–10 May 2018; pp. 153–162. [Google Scholar]
  69. Reynders, G.; Diriken, J.; Saelens, D. Generic characterization method for energy flexibility: Applied to structural thermal storage in residential buildings. Appl. Energy 2017, 198, 192–202. [Google Scholar] [CrossRef] [Green Version]
  70. Kathirgamanathan, A.; Murphy, K.; Rosa, M.; De Mangina, E.; Finn, D.P. Aggregation of Energy Flexibility of Commercial Buildings. In Proceedings of the eSim 2018 10th Conference IBPSA-Canada, Montreal, QC, Canada, 9–10 May 2018; pp. 173–182. [Google Scholar]
  71. Fosas, D.; Nikolaidou, E.; Roberts, M.; Allen, S.; Walker, I.; Coley, D. Towards active buildings: Rating grid-servicing buildings. Build. Serv. Eng. Res. Technol. 2021, 42, 129–155. [Google Scholar] [CrossRef]
  72. Kies, A.; Schyska, B.U.; Von Bremen, L. The demand side management potential to balance a highly renewable European power system. Energies 2016, 9, 955. [Google Scholar] [CrossRef]
  73. Cheng, P.H.; Huang, T.H.; Chien, Y.W.; Wu, C.L.; Tai, C.S.; Fu, L.C. Demand-side management in residential community realizing sharing economy with bidirectional PEV while additionally considering commercial area. Int. J. Electr. Power Energy Syst. 2020, 116, 105512. [Google Scholar] [CrossRef]
  74. Lampropoulos, I.; Kling, W.L.; Ribeiro, P.F.; Van Den Berg, J. History of demand side management and classification of demand response control schemes. In Proceedings of the 2013 IEEE Power & Energy Society General Meeting, Vancouver, BC, Canada, 21–21 July 2013; pp. 1–5. [Google Scholar] [CrossRef]
  75. Neukomm, M.; Nubbe, V.; Fares, R. Grid-interactive efficient buildings technical report series: Overview of research challenges and gaps. Tech. Rep. 2019. [Google Scholar] [CrossRef]
  76. Schiller, S.R.; Schwartz, L.C.; Murphy, S. Performance Assessments of Demand Flexibility from Grid-Interactive Efficient Buildings: Issues and Considerations; Lawrence Berkeley National Lab.(LBNL): Berkeley, CA, USA, 2020. [Google Scholar]
Figure 1. Energy flexible buildings to provide grid services.
Energies 14 05676 g001
Table 1. Some building energy flexibility definitions.
ReferencesPaper Indexed KeywordsBuilding Energy Flexibility Definitions
[18]Electricity; power plant fleet optimization; renewable energy; flexibility; market designThe capability to balance rapid changes in forecast errors and renewables generation within a power system.
[19]Cogeneration; distributed multi-generation; electric heat pumps; flexibility; multi-energy systems; thermal storageThe capability to react to price signals almost in real time.
[20]Buildings; flexibility; demand response; optimal control; case studyThe ability to switch from a reference electric load profile in a certain time interval.
[21]Optimal control; model predictive control; black box modelling; grey box modellingThe ability to adapt energy demand to follow the local energy generation.
[22]Flexibility; heat pumps; thermal storage; cooling; demand-side management; smart gridThe ability to modify energy consumption or generation in response to external signals.
[23]Demand flexibility; flexibility grid integration of the demand side; building energy simulationsThe ability to adapt dynamically the electrical power consumption patterns, either voluntary or mandatory, in response to external signals.
[24]Energy flexibility; demand response; flexibility function; smart building; flexibility index; smartnessThe ability to respond to an external signal.
[25]Demand-side management; energy flexibility; heat storage; Heat conservation; thermal mass; radiator; underfloor heatingThe ability to shift the energy consumption from high price periods to low price periods.
[26]Buildings; energy flexibility; demand response; thermal energy storageThe capability to deviate electricity consumption under different scenarios of thermal comfort provision and electricity costs.
[27]Not reportedThe ability to shift the electric loads from peak to off-peak hours.
[16]Energy flexible buildings; demand-side management; smart grid; load control; demand responseThe ability to shift electricity load without compromising users’ comfort.
[28]Load matching; grid interaction; net zero energy building; load management; self-generation
self-consumption
The ability to contribute positively to the context of a system with RES high share.
[29]Not reportedThe ability to respond to smart grids signals, price signals or to some users ‘actions, and accordingly adjust generation, load and storage control strategies aiming to serve the building needs, the grid, or adjust to profitable market prices for energy imports or exports.
[30]Cogeneration; flexibility; smart grids; thermal energy storage; district heating; demand-side managementThe ability to shift energy in time in order to have a better match between the on-site energy generation and the load.
[31]Energy flexibility; building cluster; energy efficiency; indicators; smart readiness indicatorThe capacity to react to forcing factors aiming to minimize CO2 emissions and maximize the use of RESs.
[32]Flexibility; storage capacity; thermal energy storage; building energy systems; renewable energy integrationThe energy that can be delivered by his energy systems (such as a combined heat and power system coupled to storage devices).
Table 2. Load match indicators.
KPIDefinitionStrengths (S)/Weaknesses (W)
Load cover factor [28,29]Percentage of the electrical demand covered by on-site electricity generation
γ l o a d = τ 1 τ 2 m i n g t S t ζ t , l t d t τ 1 τ 2 l t d t (1)
(S) They allow to analyze different control strategies and measures of load match.
(S) They do not need any additional data besides load and generation profile.
(S) They are widely used in literature, allowing to carry out also the comparison between different case studies.
(W) They are a function of the time resolution used in the calculation.
(W) They do not give a direct information on net energy, consumption or supply, peaks in power exchange or connection capacity usage.
Supply cover factor [28,29]Percentage of the on-site generation that is used by the building
γ s u p p l y = τ 1 τ 2 m i n g t S t ζ t , l t d t τ 1 τ 2 g t d t (2)
Loss of load probability [28,29]Time share during which the building energy demand is not covered by the on-site energy generation
L O L P b = τ 1 τ 2 f t d t T (3)
f t = 1   i f   n e t < 0 0   i f   n e t 0 (4)
n e t = e t d t (5)
(S) They can be useful for the design and control of on-site energy generation systems.
(S) It defines the fraction of time in which the building needs imported energy from the grid.
(S) They are widely used in literature, allowing to carry out also the comparison between different case studies.
(W) Omits the volume of grid imports.
(W) The time resolution based on the net exported electricity to the grid is affected by the renewable energy sources stochasticity
Energy autonomy [28,29]It reports the time share during which the entire local load can be covered by on-site generation
A b = 1 L O L P b (6)
Mismatch compensation factor [58]Capacity of the local energy generation system for which the annual net exported energy is equal to zero divided by the capacity of the same system for which the economic value of annual import and export of electricity is the same
M C F = C c o s t , b a l a n c e C e n e r g y , b a l a n c e (7)
(S) Even if it is used regard to economic balance, it could also refer to the CO2 emission or the primary energy consumption of the system.
(S) It can be used in the sizing of generation systems.
(W) It is calculated using an annual time resolution. On the other hand, higher temporal resolution, such as hourly resolution, could provide more useful information.
On-site energy ratio [59]Ratio between energy supply from local renewable sources and energy demand
O E R = τ 1 τ 2 g t d t τ 1 τ 2 l t d t (8)
(S) For its calculation it requires only the load and generation profiles.
(W) In case of multiple renewable energy sources, it does not take into account the different energy types separately.
Table 3. Grid Interaction indicators.
KPIDefinitionStrengths (S)/Weaknesses (W)
Grid interaction index [29]Standard deviation of the net exported energy within a year
G I I = S T D n e t m a x n e t (9)
(S) It describes the average grid stress and it can be used to analyze the variation of the electricity interchange between a building and the grid.
No grid interaction probability [29]Probability that the building is acting autonomously of the grid
P E = 0 = τ 1 τ 2 d t n e t < 0 τ 2 τ 1 (10)
(S) For its calculation it requires only the load and generation profiles.
(S) It is widely used in literature, allowing to carry out also the comparison between different case studies.
(W) It describes the interaction between the building and the grid without any information about the magnitude of the exchanged power.
Capacity factor [29]Ratio between the energy exchanged between the building and the grid and the energy exchanged that would have occurred at nominal connection capacity
C F b = τ 1 τ 2 n e t d t E d e s · T (11)
(S) It takes into account energy exchange, concurrence of load and generation and gives information on use of connection capacity.
(W) It doesn’t show indication on generation and consume, indication of peaks in power exchange.
(W) It is not suited for standalone evaluation of connection capacity use.
Connection capacity credit [28,29]Percentage of grid connection capacity that could be saved compared to a reference case (building with no local energy supply)
E c = 1 D R D R r e f (12)
D R = m a x n e t E d e s (13)
(S) Decreasing this indicator could be a way to decrease the grid impact.
(W) It does not give any information neither on net energy exchange, consumption or supply nor on match between load and generation.
One percent peak power [64]Mean power of the one percent highest quarter hourly peaks
O P P = E 1 % , p e a k T (14)
(S) They are useful to monitor power peaks.
(S) They could be used to evaluate controls, aimed at limiting peaks, thereby limiting grid losses and facilitating keeping the grid within operational limits.
(W) They do not to give any information neither on net energy exchange, consumption or supply nor on match between load and generation.
Peaks above limit [64]Percentage of time during that net exported energy exceeds a certain limit
P A L = t P e x c h > P l i m T (15)
Absolute Grid Support Coefficient [61]A measure of how a consumer’s electricity consumption profile matches the availability of electricity assessed using a grid bases reference quantity
G S C a b s = i = 1 n W e l i · G s i W e l · G s ¯ (16)
W e l = i = 1 n W e l i ,   G s ¯ = 1 n i = 1 n G s i (17)
(S) They are metrics to ‘weight” the electricity consumption profile with a time-resolved reference quantity expressing the availability of electricity in the public grid.
(S) These metrics are useful for the grid support of shiftable electricity producers or consumers.
(S) The grid signals could also refer to the CO2 emission or the primary energy consumption.
(S) They allow an evaluation of the grid impact of a building from the energy system perspective.
(W) They require a grid signal per kWh for time-steps t so they are not suitable for design analysis, but they are useful for ex-post performance considerations.
Relative Grid Support Coefficient [61] G S C r e l = 200 G S C a b s l o w e r P B G S C a b s a c h i e v e d G S C a b s l o w e r P B G S C a b s u p p e r P B 100 (18)
Equivalent hours of storage [28] N h S = m a x S t m a x n e t   (19)(S) It coincides to the storage capacity expressed in hours.
(S) It can be useful to compare and choose between different designs alternatives.
Table 4. Energy flexibility indicators.
KPIDefinitionStrengths (S)/Weaknesses (W)
Flexibility Factor [25]Ability to shift the energy use during time with high prices to low energy price periods
F F = l p t   2 q h d t h p t   0 q h d t l p t   0 q h d t + h p t   0 q h d t (20)
(S) It explains how the energy demand is distributed in comparison to the energy peaks.
(W) It doesn’t give any further information on how much local load can be shifted.
Flexibility Index [38]Ability of the building to minimize the heating energy usage during the absence of renewable energy sources production and maximize it during periods of available renewable production
F I =   q m a t c h R e f q m a t c h S M A R T d t q c o n s R E F (21)
q m a t c h R E F = m a x 0 ,   q c o n s R e f q p r o d R e f d t (22)
q m a t c h S M A R T = m a x 0 ,   q c o n s S M A R T q p r o d S M A R T d t (23)
(S) It takes into account the self-consumption.
(W) It doesn’t give any further information on how much local load can be shifted.
Procurements Cost avoided Flexibility Factor [66]Ability to shift the heat pump electric load from peak to off-peak hours in terms of electricity price
F F P C = P C m a x P C P C m a x P C m i n (24)
(S) It takes into account the operational cost savings.
(S) Although, the authors use this KPI to evaluate the ability to shift the heat pump electric load, it can be used to investigate the flexibility of any other electrical equipment.
Volume Shifted Flexibility Factor [66]Ability to shift the heat pump electric load from peak to off-peak hours in terms of energy shifted compared to a reference profile F F V S = F F P C F F P C , r e f F F P C , r e f (25)(S) It can be used to investigate the flexibility of any other electrical equipment.
Available structure storage capacity [69]Amount of heat can be added to the mass of a building, over time of an ADR event
C A D R = 0 τ A D R q h , A D R q h , r e f d t (26)
(S) It takes into account climate condition, occupant behavior and HVAC system.
(S) It is not useful only for thermal mass but also for every kind of storage system.
Storage efficiency [69]Fraction of heat that can be stored in the timeframe of an ADR event in order to be used subsequently aiming to reduce the heating power needed η A D R = 1 0 Q δ d t 0 τ A D R Q δ d t = 1 0 Q δ d t C A D R (27)
Q δ = q h , A D R q h , r e f (28)
Available electrical energy flexibility efficiency [70]It shows the storage efficiency based on whether upward or downward flexibility is provided η A E E F u p f l e x = 0 τ P e l f l e x P e l r e f d t 0 τ P e l f l e x P e l r e f + d t (29)
η A E E F d o w n f l e x = 1 0 τ P e l f l e x P e l r e f + d t 0 τ P e l f l e x P e l r e f d t (30)
(S) They capture the size of the deviation in consumption due to a demand response event.
Flexible energy efficiency [65]It measures of how much energy was shifted taking into account the rebound effect
η f = E f E r b · 100 % (31)
(S) It takes into account the rebounds effects.
(S) Since any kind of rebound behavior is seen as less than ideal, it gives priority to the grid operator’s point of view.
Publisher’s Note: MDPI stays neutral with regard to jurisdictional claims in published maps and institutional affiliations.

