Abstract
The combined heat pump–organic Rankine cycle is a thermal–electrical storage concept which allows the reversible use of components in both operation modes (loading and unloading the storage). This saves in terms of investment costs but also creates challenges during design and operation. A heat exchanger is an expensive component destined to be used for the reversible purposes of a heat pump condenser and an organic Rankine cycle evaporator. In this study, the operation of such an apparatus was evaluated based on an analytical model, experimental data and thermal imaging. This study shows that the model can predict the filling of the apparatus distinguished by liquid, vapour and the two-phase region. The thermal imaging supports the model and gives the location of the regions. Connecting both methods, a valid statement about the current condition of the heat exchanger is possible. Due to very small pinch points, the apparatus is not efficiently used in the investigated modes. Extending the pinch to 2 K can already save up to 46.1% of the heat exchange area. The quality of the heat transfer in the evaporator ( = 10.9 kW/m) is clearly higher than in the condenser ( = 6.1 kW/m).
1. Introduction
The energy transition towards a CO-neutral future requires a growing amount of renewable energy sources. Solar and wind power produce a fluctuating energy supply and thus cannot replace the fossil energy production without any changes to the distribution grid and organisation. To shift energy from times of surplus production to times of need, energy storage concepts are necessary. In medium- and large-scale applications for mid-term storage duration (hours to days), the use of pumped thermal energy storages (PTES) is increasing. These employ Carnot batteries which are presented with different concepts for a huge range of applications [1]. The heat pump cycle (HP) converts low temperature heat into high temperature heat by the use of electrical energy. The organic Rankine cycle (ORC) converts high temperature heat into electrical energy and releases low temperature heat. The following approach combines both cycles into one reversible process, as shown in Figure 1.
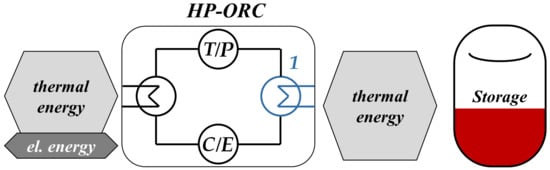
Figure 1.
Principle of the reversible heat pump (HP)–organic Rankine cycle (ORC) Carnot battery (with T: throttle valve; P: ORC-pump; C: compressor; E: expander; 1: upper heat exchanger).
Because both processes use similar components (heat exchangers and a reversible compressor/expander), the combination of which offers huge potential in terms of saving investment costs. Of course, this may require a trade-off during the design, since two state points must be considered (HP and ORC mode). In this context especially, the heat exchangers are key components. Depending on the mode (loading or unloading), heat exchanger 1 (blue in Figure 1) can be used as a heat pump condenser and as an ORC evaporator. These state points differ in terms of temperature and pressure levels and thus in the density of the working fluid. The current work combines a closer analytical look at the condensation and evaporation in the reversible heat exchanger with an experimental investigation of the apparatus during operation. The experiments were carried out with an HP–ORC pilot plant. To evaluate the operation beyond the use of sensors (pressure/temperature), a thermal imaging camera was deployed.
The observation of air-refrigerant heat exchangers using infrared thermography was already shown in [2]. The investigation of phase change heat exchangers is a bigger challenge. Dickes et al. [3] studied the fluid distribution in ORC heat exchangers by means of an infra-red camera and gravimetric methods. The current work extends this research to a reversible apparatus used in ORC mode as well as in HP mode. For this, an investigation and evaluation method based on a thermal imaging camera and an analytical model were compared. In addition, the following work contributes to a better understanding of the reversible HP–ORC concept and to a better selection of reversible heat exchangers in particular.
2. Materials and Methods
2.1. Analytical Model to Calculate the Filling of a Heat Exchanger
The reversible operation of the heat exchanger was already considered during the design of the HP–ORC pilot plant. Therefore, an analytical model is helpful for predicting heat exchanger behaviour. Different temperature and pressure levels in HP and ORC mode affect the density of the working fluid and thus its total mass in the fixed volume of piping and instrumentation changes. While the global discrepancies can be countered with a collector vessel (described in [3,4,5]), there are still local differences in the apparatuses’ filling. The following procedure shows an analytical method of determining the filling of the heat exchanger, which operates as an HP-condenser and ORC-evaporator. The storage medium is water. Hereafter, the organic refrigerant in the reversible cycle will be called the working fluid. The effect of a lubricant, often an integral part in the working fluid system, is neglected in this model.
The model for indirect heat transfer is based on the assumption that a condenser or evaporator can be divided into three regions, as shown in Figure 2. A solid wall divides both fluids: the storage medium water on the left-hand side and the working fluid on the right-hand side of the wall. The storage water passes through the apparatus in counter current to the working fluid. In HP mode, the water enters at the bottom; in ORC mode, it enters at the top. At the bottom of the apparatus, the working fluid is in liquid state (l), therefore this region indicates a liquid-to-liquid heat exchange. The working fluid is pre-heated in ORC mode or sub-cooled in HP mode. At the very top of the apparatus, there is a region where the working fluid is in pure vapour condition (v). Here, a liquid-to-vapour heat exchange takes place. The working fluid is super-heated (ORC mode) or pre-cooled (HP mode). In between those regions, there is a two-phase area, where the phase change of the working fluid happens (2p). It evaporates (ORC mode) or condenses (HP mode) here. Each region has different boundary conditions and state variables, which requires different methods to calculate the heat exchange. The model simplifies the complex heat transfer during phase-change, as flow phenomena are not considered in detail. With this, a rough but solid assessment of the heat exchanger operation is possible, enabling the estimation of the extension of each region (l, 2p, v) during reversible operation.
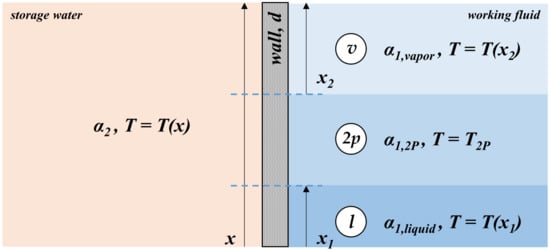
Figure 2.
Principle of the analytical approach: dividing the heat exchanger into three regions: pre-heating/sub-cooling (l); evaporation/condensation (2p); super-heating/pre-cooling (v).
The transferred heat in the heat exchanger in relation to the heat exchanger area is the specific heat flow density, as shown in Equation (1). The total amount of transferred heat is known because of the design boundary conditions and experimental data. To calculate the area of a certain heat exchange task, the heat flow density must be determined [6]:
The heat flow density can be calculated for each region with the medium temperature difference and the heat transition coefficient k:
Meanwhile, the medium temperature difference for sensible heat transfer is defined with the temperature differences in terms of working fluid and water at the boundaries of each region:
The total heat transition coefficient is the sum of several local thermal transmittance numbers or the sum of the local reciprocal thermal resistances, as shown in Equation (4). The thermal resistance of the solid wall can be described by the wall thickness divided by the specific thermal conductivity of the material . The heat transfer from the fluid to the wall can be described with the heat transfer coefficient at the working fluid side and the water side . An optional heat resistance because of heat exchanger fouling can be added:
For each region, the heat transfer coefficient has to be calculated following a different approach according to the state of the working fluid (liquid, vapour or phase change). The calculation of is the most crucial part of the model, as it is highly dependent on the geometry, fluid and material properties and state variables (temperatures, pressures, flow velocity, etc.). There are many empirical equations which have to be carefully checked to ensure they fit the current case. To calculate the sensible heat transfer in the model, the approach following Martin et al. [7] was used. The latent heat transfer was simplified with literature values. A more detailed procedure and the assumption are described in Appendix A.
The input of the model is the temperature and pressure data from the experimental tests, as shown in Table 1. The detailed results can be seen in Appendix B. The model was realised with Python libraries NumPy [8], Matplotlib [9] and CoolProp [10].

Table 1.
Properties of the upper heat exchanger in HP and ORC mode.
2.2. Experimental Set-Up
In order to determine the model’s input parameters and to experimentally evaluate the model, test runs at a reversible HP–ORC pilot plant were carried out. The system has a thermal power of up to 100 kW and uses brazed plate heat exchangers. The working fluid is R1233zd(E) as it is advantageous in terms of safety and performance [4]. An overview of the pilot plant is shown in [11] and therefore it is not presented here in detail. The experiment is divided into two sections: first, the loading of a thermal storage is operated (HP mode); hereafter, the unloading procedure (ORC mode) takes place. The experimental set-up does not include a thermal storage for practical reasons, but it is connected to an adjustable heat source and sink to ensure steady state conditions. Both working modes (HP and ORC) were studied individually and are not coordinated as they would be in the case of a shared heat storage. During operation, several temperature and pressure sensors record the state of the working fluid and the storage water at different points. Figure 3 shows the reversible ORC-evaporator/HP-condenser and where the sensors are placed. Additionally, a thermal imaging camera (TIC) observes the apparatus during the term. In the current set-up, two viewing angles were recorded: (a) with a total view; and (b) with a detailed view at the bottom of the apparatus. Images from both views were recorded with the same camera shortly after each other to ensure that the operation points are still the same.
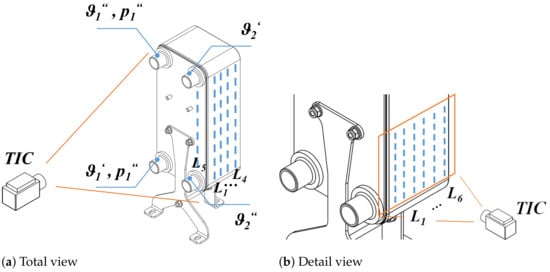
Figure 3.
Experimental set-up to observe the reversible HP-condenser/ORC-evaporator with a thermal imaging camera (TIC) during operation.
The TIC (FLIR X5, 320 × 256 pixels) records the surface temperature of objects. Note that the camera is sensitive to thermal radiation. Thus, reflection and absorption have to be considered. To optimise the measurement, the surface of the heat exchanger is treated with an anti-reflection powder spray (top and sides) and anti-reflection tapes (front). The TIC software (FLIR ResearchIR) allows the post-processing of the images. Here, the temperature values along vertical lines on the surface were recorded (lines … in total view and the … lines in detailed view, as shown in Figure 3).
3. Results
The properties of the heat exchanger while running the pilot plant in HP mode and ORC mode are shown in Table 1. The numbers are the average values of a two-minute interval during steady state operation. During operation, the heat pump cycle reaches a coefficient of performance of 4.89 and the organic Rankine cycle has an efficiency of 4.27%.
The temperatures and pressures of the working fluid upstream and downstream the apparatus were recorded as well as the temperatures of the storage water at the inlet and outlet and the mass flow of both fluids. The temperature of the phase change was calculated from the average pressure of the working fluid using Coolprop [10]. Figure 4 gives the temperature-heat-diagrams of heat pump mode (a) and organic Rankine cycle mode (b) based on the measurement data. The blue lines indicate the temperature of the working fluid while the red lines indicate the temperature of the storage water. The temperature standard deviation is visualised with vertical lines. The pinch-point (point of minimal temperature difference) is at condensation temperature for the heat pump case and at working fluid inlet temperature for the ORC case. The pinch is very small, especially in HP mode, which indicates an area-consuming heat transfer. The thermal power is kW and kW.
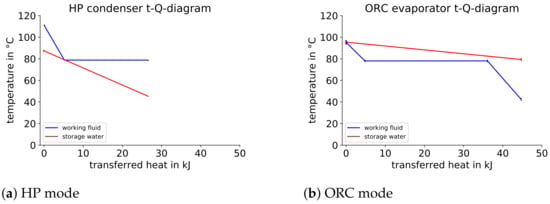
Figure 4.
t-Q-diagrams of the reversible HP-condenser/ORC-evaporator.
3.1. Analytical Model of Regenerative Heat Exchanger
The heat exchanger model calculates the heat transfer and outputs the height of each region (l, 2p, v) using the recorded process properties from Table 1 as input data. The calculation boundary condition is a pinch point of 2 K. A detailed result of the calculation is given in Appendix B. Figure 5 shows a visual representation of the filling in HP mode (a) and ORC mode(b). The regions (liquid (l), phase change (2p) and vapour (v)) are displayed in different colours. For both cases, the total height of the apparatus was not used, and the heat transfer requires less than half of the available area. In HP mode (a), there is almost no liquid working fluid region, which matches the observation from Figure 4a (almost no sub-cooling). Otherwise, there is a liquid regime in ORC mode (Figure 5b), again matching the sensor data (relevant pre-heating). The comparison of the t-Q-diagrams with the analytical results shows superior heat flow density during phase change, which requires less area (height) per transferred heat compared to the single phase (water–liquid and water–vapour) heat exchange. The mass of the working fluid within the apparatus is kg and kg calculated by the model.
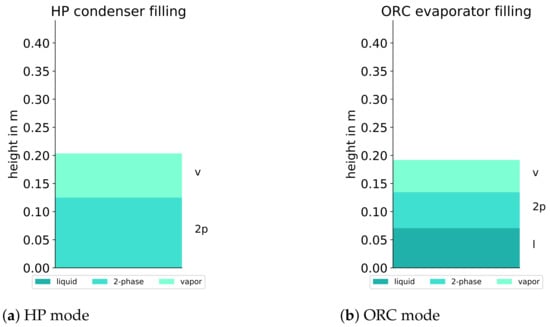
Figure 5.
Calculated levels of the phases of condenser (HP) and evaporator (ORC).
3.2. Experimental Study Using Thermal Imaging Camera
For a better understanding of the apparatus’ behaviour during reversible usage as both a condenser and evaporator, an optical method supports the analytical model. Figure 6a and Figure 7a show the surface temperature of the plate heat exchanger during HP mode and during ORC mode, respectively, corresponding to the set-up described in Figure 3a.The colour scale goes from 40 °C (black) to 100 °C (white). The effect of the surface preparation can be studied at the front side of the heat exchanger, where only some areas are covered with anti-reflection tape. The upper and lower right connections are for the storage water and the left connections are for the working fluid. The top of the apparatus is the hottest region in both modes, where the working fluid is in vapour state (pre-cooling in HP mode and super-heating in ORC mode). At the very bottom of the apparatus, the working fluid is coldest in both modes.
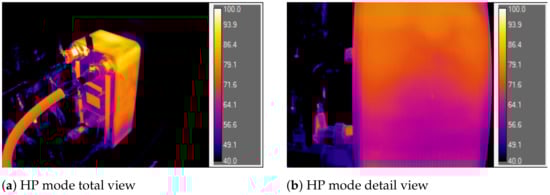
Figure 6.
TIC images of the reversible heat exchanger during operation as an HP-condenser.
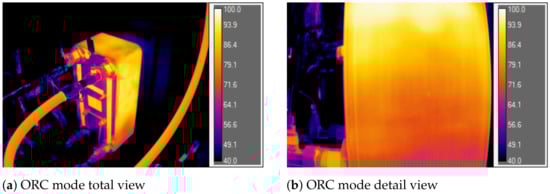
Figure 7.
TIC images of the reversible heat exchanger during operation as an ORC-evaporator.
Figure 6b and Figure 7b show the surface temperature in a detailed view, as described in Figure 3b. The scale is the same as described above. The images show a global trend going from a high surface temperature at the top to a lower surface temperature at the bottom. In general, the surface temperature in ORC mode is at a higher level than in HP mode. For further evaluation, the TIC images were post-processed in the software. From the lines …, as defined in the set-up (Figure 3a), the local mean temperature is displayed in the following Figure 8. The grey region indicates the range of the standard deviation. Position is at the top and is at the bottom of the apparatus in each case at the level of the inlet/outlet connections.
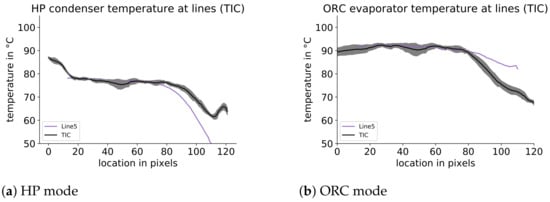
Figure 8.
Temperature profiles of measure lines from the TIC image analysis (total view).
The shapes of the curves are significantly different in both modes. In HP mode, there is a region at the top, where the temperature decreases. It is followed by a bigger region with almost constant temperature, which happens to be the condensation temperature. In the region at the lower third of the apparatus, the temperature again decreases. In this region, line (front of the apparatus) differs from the other lines, showing a lower temperature. At the very bottom of the observed area, the temperature increases again.
In ORC mode there is a broad region with almost constant temperature (about the working fluid vapour outlet temperature). In the lower third of the apparatus, the surface temperature decreases. Again, line differs from the others, but for this mode, it shows a higher temperature.
4. Discussion
The TIC surface temperature is compared with the PT100 temperature sensor at the upper water connection ( in Figure 3), showing a difference of 0.4 K (HP mode) and 2.7 K (ORC mode). The TIC temperature standard deviation shows a maximum (2.7 K) at in both modes, most likely being an artefact because of uneven surface preparation with powder spray at this place. Line at the front of the apparatus differs from the other lines. It shows the surface temperature at the first plate, which is most likely a water plate. The local mean temperature measured at the side of the apparatus shows the surface temperature which is determined by the temperatures of both fluids, the storage water and the working fluid. Additionally, the density and heat capacity of the fluids in each region influence the surface temperature. Therefore, it can be assumed that in regions where the working fluid is vapour (low density), the surface temperature is mainly affected by the storage water temperature. The unsteady temperature profile at the bottom of the heat exchanger in HP mode is most likely caused by the water inlet at in this region.
A visual combination of the model’s results and the TIC recorded values is given in Figure 9. Additionally, the temperature profiles according to the t-Q-diagrams (Figure 4) are given. As already mentioned, the model indicates that not the whole height of the apparatus is necessary for heat exchange. A huge amount of the heat exchanger area is used to reach the small pinch while only a very low amount of heat is transferred. The combination of both approaches makes those almost ineffective regions visible.
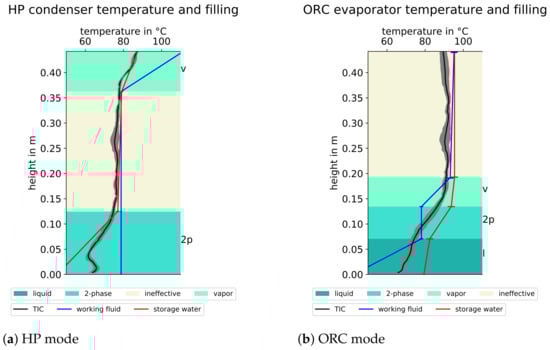
Figure 9.
Combination of analytical level calculation and TIC temperature profiles.
In HP mode, the heat exchanger is divided into three main regions: at the top, the working fluid enters in vapour state and pre-cools by heating up the storage water. At a temperature close to the condensation temperature, a large share of the height is used to reach the small pinch. The difference between the temperatures of both fluids is becoming smaller and almost no heat exchange takes place (with a reasonable heat density). At the bottom, the low inlet temperature of the storage water increases the temperature difference. Hence, the pinch point can be left, causing the working fluid to condense. In this region, the storage water has a huge change in temperature. The slope of the temperature profile is much steeper than in the vapour region, as the heat transition is more effective during phase change. The TIC temperature profile mainly follows the storage water temperature as the density in the vapour state and during phase change is not sufficient to affect the average surface temperature.
In ORC mode, the heat exchanger separates into four regions. At the bottom, there is a pre-heated liquid working fluid, and the storage water cools down. The recorded surface temperature fits properly with the average of both temperature profiles. On top of this region, the working fluid evaporates. The slope of the storage water is again bigger here because of the bigger heat density than in the other regions. The largest slope of the TIC temperature profile can be found here. In the third region the working fluid vapour overheats. It follows a region where, again, a large part of the apparatus is used to decrease the temperature difference between the water and working fluid until the pinch point is reached. The low temperature difference between both fluids at this top region of the apparatus is not sufficient to cause any other heat transfer. Thus, the upper half of the heat exchanger in ORC mode can be seen as practically ineffective.
The total mass in the apparatus has to be extended because of the practically ineffective regions, which are filled with vapour in both modes. Hence, the total mass including ineffective regions is kg and kg.
To evaluate the reproducibility of the TIC measurements and to exclude effects that solely come from the perspective, the results from both views (Figure 3a,b) are compared in Figure 10. Both views show good correlation in the relevant regions.
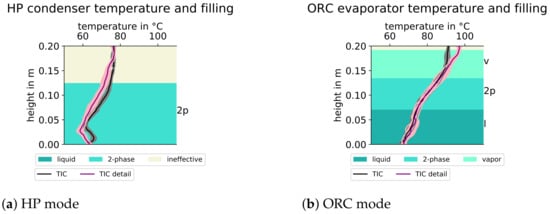
Figure 10.
Temperature profiles of measure lines from the TIC detailed image analysis.
The combination of analytical level calculation and TIC temperature profiles at further operation points is shown in Figure 11. The load which is referred to in the sub-caption is the thermal power of the operation modes given in Table 1.
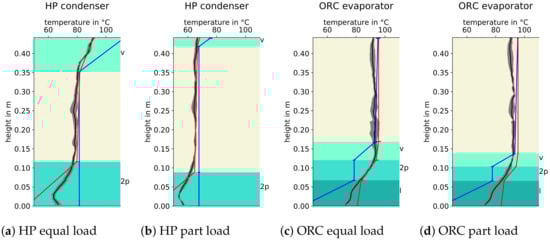
Figure 11.
Combination of analytical level calculation and TIC temperature profiles for further operation points (legend see Figure 9).
Figure 11a,c illustrate the operation points with approximately the same thermal power and at the same temperature levels (compared to Figure 9) but at different times during the experiments. These operation points with a comparable load show good reproducibility in terms of TIC profile and analytical model. Figure 11b,d illustrate a part-load situation during the start-up of the HP mode and ORC mode. Furthermore, for the part-load operations, the model and the TIC data show plausible results and fit together. The less effective area of the heat exchanger increases with lower power. The mass of working fluid in the apparatus during part-load decreases to kg and kg.
Comparing both operation modes, the overall heat transfer in ORC mode is much more effective: the major part of the heat transfer in the evaporator takes place at the lower half of the apparatus with an average heat density of kW/m. Meanwhile, the average heat density (without an ineffective area) in the condenser is kW/m. This ratio of approximately
has to be considered during the system design. It follows that:
- If the thermal power during loading (HP mode) and unloading (ORC mode) needs to be approximately the same value, the heat exchanger has to operate with a certain standby area in condenser mode.
- If the apparatus that needs to be operated is most effective in both modes, the thermal power in condenser mode is considerably lower.
5. Conclusions
In this paper, the combination of an analytical model and an experimental TIC set-up was used to study the performance of a reversible condenser–evaporator in an HP–ORC process. In general, the TIC approach is a good method of studying the operation of a heat exchanger. We keep in mind that it records the average surface temperature, which is closer to the temperature of the medium with bigger density and heat capacity. The analytical model predicts the level of the liquid two-phase region and vapour. It matches well the experimental data at different operation points. The TIC measurements enable specifying the location of the regions and help evaluate the quality of utilisation.
In the studied cases, both operation modes do not make reasonable use of the whole heat exchanger. The pinch point is very narrow, the pinch temperature is at condensation temperature in HP mode and at vapour outlet temperature in ORC mode. Accordingly, the less effective regions are in the middle of the apparatus (HP) and at the top (ORC). If an expansion of the pinch point to 2 K is acceptable, the apparatus could save 46.1% (HP) and 43.5% (ORC) of the heat transfer area. Hence, a significantly smaller apparatus could be used. The current apparatus would be able to work at approximately double power in both modes. Thus, the current working points can be seen as under-load situations (solely referring to this apparatus). The heat exchanger is oversized for the evaluated operation points (as a condenser and as a evaporator).
This study showed that the approach of the combined analytical, experimental and thermo-optical observation of a reversible heat exchanger works well and enhances our understanding of the process. These findings can be helpful for selecting reversible heat exchangers for HP–ORC systems and similar applications. However, the model has to be validated with more experimental data at further different operation points. A study of the reversal HP-condenser/ORC-evaporator considering the interaction with the reversible process should follow.
Author Contributions
Conceptualisation, D.S.; methodology, D.S.; software, D.S. and J.P.; validation, D.S. and C.R.; formal analysis, D.S. and C.R.; investigation, D.S. and C.R.; resources, D.S.; data curation, D.S. and C.R.; writing—original draft preparation, D.S., C.R. and J.P.; writing—review and editing, D.S. and J.P.; visualisation, D.S.; supervision, E.S.; project administration, E.S.; funding acquisition, E.S. All authors have read and agreed to the published version of the manuscript.
Funding
This research was funded by the BAYERISCHE STAATSREGIERUNG within the Energie Campus Nürnberg (EnCN), grant number IX.6-F2421.4.0/22/31.
Institutional Review Board Statement
Not applicable.
Informed Consent Statement
Not applicable.
Data Availability Statement
The data presented in this study are available on request from the corresponding author. The data are not publicly available due to institute regulations.
Acknowledgments
We would like to offer our special thanks to BITZER SE, SWEP International AB and Honeywell International Inc. for the support with products.
Conflicts of Interest
The authors declare no conflict of interest. The funders had no role in the design of the study; in the collection, analyses, or interpretation of data; in the writing of the manuscript, or in the decision to publish the results.
Abbreviations and Symbols
The following abbreviations and symbols are used in this manuscript:
| PTES | Pumped Thermal Energy Storage | |
| HP | Heat Pump | |
| ORC | Organic Rankine Cycle | |
| TIC | Thermal Imaging Camera | |
| heat transfer coefficient | W/(m2K) | |
| T | absolute temperature | K |
| temperature | °C | |
| x | position variable | m |
| heat flow density | W/m2 | |
| heat flow | W | |
| A | area | m2 |
| k | heat transition coefficient | W/(m2K) |
| R | heat resistance | K/W |
| dimension of the wall | m | |
| specific thermal conductivity | W/(m K) | |
| p | pressure | bara |
| mass flow | kg/s | |
| h | height | m |
| Reynolds number | - | |
| density | kg/m3 | |
| w | flow velocity | m/s |
| dynamic viscosity | kg/(m s) | |
| Nusselt number | - | |
| Prandtl number | - | |
| hydraulic diameter | m | |
| heat capacity | kJ/(kg K) | |
| amplitude of wave profile | m | |
| area extension factor | - | |
| X | wave number | - |
| wave length | m | |
| dimensionless length | - |
Appendix A
Appendix A shows the geometrical assumptions (Table A1 and Table A2) and the analytical procedure. The useful height in Table A1 is defined as the distance between the inlet and outlet connections of the apparatus.
Table A1.
Geometry heat exchanger.
Table A1.
Geometry heat exchanger.
| Name | Value |
|---|---|
| Width | 0.243 m |
| Depth | 0.164 m |
| Useful height | 0.441 m |
| Thickness of wall | 0.0005 m |
| Thermal conductivity wall | 15 W/(m K) |
Table A2.
Geometry assumptions wave profile.
Table A2.
Geometry assumptions wave profile.
| Name | Value |
|---|---|
| Wavelength | 0.002 mm |
| Amplitude | 0.0005 mm |
| Stamping angle | 45° |
The analytical procedure follows the approach described by Martin et al. in chapter N6, VDI-Wärmeatlas [7], with the following equations: the Reynolds number is calculated with the density , the flow velocity w, and the dynamic viscosity :
The Nusselt number is defined with the heat transfer coefficient , the hydraulic diameter and the thermal conductivity :
The Prandtl number is a function of the dynamic viscosity , the heat capacity and the thermal conductivity [12]:
The hydraulic diameter comes from the wave profile geometry assumptions, such as the amplitude , and , the area extension factor:
The wave number can be calculated from the amplitude and the wave length :
The area extension factor comes with this wave number X:
An empirical solution for the Nusselt number was presented by Lévêque [13] which is valid for sensible heat transfer in plate heat exchangers:
with:
and with:
Only rare approaches for the calculation of condensation and evaporation in plate heat exchangers have been described in the literature. Thus, a conservative procedure was chosen for the calculation of the phase change regions, using literature values for the heat transition coefficient k: Ref. [14] gives characteristic values for condensation = 750 W/(mK) and evaporation = 3000 W/(mK). The sensible heat exchange was calculated until a pinch of 2 K.
Appendix B
Appendix B presents the results of the calculations in the heat pump (Table A3) and organic Rankine cycle mode (Table A4).
Table A3.
Results modelling the HP condenser.
Table A3.
Results modelling the HP condenser.
| Value | Liquid Section | 2-Phase Section | Vapour Section |
|---|---|---|---|
| Heat transition coefficient k | 432 W/(m2K) | 750 W/(m2K) | 369 W/(m2K) |
| Heat flow | 0.182 kW | 21.3 kW | 5.13 kW |
| Mean temperature difference | 33.4 K | 11.2 K | 8.81 K |
| Heat flow density | 14.4 kW/m2 | 8.42 kW/m2 | 3.25 kW/m2 |
| Area A | 0.013 m3 | 2.53 m2 | 1.58 m2 |
| Height h | 0.001 m | 0.12 m | 0.074 m |
| Mass m | 0.078 kg | 2.43 kg | 0.023 kg |
Table A4.
Results modelling the ORC evaporator.
Table A4.
Results modelling the ORC evaporator.
| Value | Liquid Section | 2-Phase Section | Vapour Section |
|---|---|---|---|
| Heat transition coefficient k | 480 W/(m2K) | 3000 W/(m2K) | 501 W/(m2K) |
| Heat flow | 4.78 kW | 31.3 kW | 8.62 kW |
| Mean temperature difference | 6.61 K | 7.65 K | 14.0 K |
| Heat flow density | 3.18 kW/m2 | 22.9 kW/m2 | 7.02 kW/m2 |
| Area A | 1.51 m2 | 1.36 m2 | 1.23 m2 |
| Height h | 0.071 m | 0.064 m | 0.058 m |
| Mass m | 2.68 kg | 1.26 kg | 0.089 kg |
References
- Dumont, O.; Frate, G.F.; Pillai, A.; Lecompte, S.; De Paepe, M.; Lemort, V. Carnot battery technology: A state-of-the-art review. J. Energy Storage 2020, 32, 101756. [Google Scholar] [CrossRef]
- Bowers, C.; Wujek, S.; Hrnjak, P. Quantification of Refrigerant Distribution and Effectiveness in Microchannel Heat Exchangers Using Infrared Thermography. 2010. Available online: http://docs.lib.purdue.edu/iracc (accessed on 30 August 2021).
- Dickes, R.; Dumont, O.; Lemort, V. Experimental assessment of the fluid charge distribution in an organic Rankine cycle(ORC) power system. Appl. Therm. Eng. 2020, 179, 115689. [Google Scholar] [CrossRef]
- Steger, D.; Regensburger, C.; Eppinger, B.; Will, S.; Karl, J.; Schlücker, E. Design aspects of a reversible heat pump—Organic rankine cycle pilot plant for energy storage. Energy 2020, 208, 118216. [Google Scholar] [CrossRef]
- Steger, D.; Karl, J.; Schlücker, E. Launch and first experimental results of a reversible heat pump-ORC pilot plant as Carnot Battery. In Proceedings of the 6th International Seminar on ORC Power Systems, Munich, Germany, 11–13 October 2021; Volume 44. [Google Scholar]
- Roetzel, W.; Spang, B. C1 wärmeübertrager: Berechnungsmethoden. In VDI-Wärmeatlas; Stephan, P., Kabelac, S., Kind, M., Mewes, D., Schaber, K., Wetzel, T., Eds.; Springer Reference Technik (VDI Springer Reference); Springer Vieweg: Berlin/Heidelberg, Germany, 2021. [Google Scholar] [CrossRef]
- Martin, H.; Dietrich, B.; Nickolay, M. N6 druckverlust und wärmeübergang in plattenwärmeübertragern. In VDI-Wärmeatlas; Stephan, P., Kabelac, S., Kind, M., Mewes, D., Schaber, K., Wetzel, T., Eds.; Springer Reference Technik (VDI Springer Reference); Springer Vieweg: Berlin/Heidelberg, Germany, 2021. [Google Scholar] [CrossRef]
- Harris, C.R.; Millman, K.J.; van der Walt, S.J.; Gommers, R.; Virtanen, P.; Cournapeau, D.; Wieser, E.; Taylor, J.; Berg, S.; Smith, N.J.; et al. Array programming with NumPy. Nature 2019, 585, 357–362. [Google Scholar] [CrossRef] [PubMed]
- Hunter, J.D. Matplotlib: A 2D graphics environment. Comput. Sci. Eng. 2007, 9, 90–95. [Google Scholar] [CrossRef]
- Bell, I.H.; Wronski, J.; Quoilin, S.; Lemort, V. Pure and Pseudo-pure Fluid Thermophysical Property Evaluation and the Open-Source Thermophysical Property Library CoolProp. Ind. Eng. Chem. Res. 2014, 53, 2498–2508. [Google Scholar] [CrossRef] [Green Version]
- Eppinger, B.; Steger, D.; Regensburger, C.; Karl, J.; Schlücker, E.; Will, S. Carnot battery: Simulation and design of a reversible heat pump-organic Rankine cycle pilot plant. Appl. Energy 2021, 288, 116650. [Google Scholar] [CrossRef]
- Kind, M. A2 dimensionslose kenngrößen für die berechnung von wärmeübertragern und wärmetechnischen apparaten. In VDI-Wärmeatlas; Stephan, P., Kabelac, S., Kind, M., Mewes, D., Schaber, K., Wetzel, T., Eds.; Springer Reference Technik (VDI Springer Reference); Springer Vieweg: Berlin/Heidelberg, Germany, 2019. [Google Scholar] [CrossRef]
- Lévêque, A. Les lois de la transmission de chaleur par convection. Ann. Mines 1928, 12, 201–415. [Google Scholar]
- Roetzel, W.; Spang, B. C2 wärmeübertrager: Wärmedurchgang und wärmedurchgangskoeffizienten. In VDI-Wärmeatlas; Stephan, P., Kabelac, S., Kind, M., Mewes, D., Schaber, K., Wetzel, T., Eds.; Springer Reference Technik (VDI Springer Reference); Springer Vieweg: Berlin/Heidelberg, Germany, 2021. [Google Scholar] [CrossRef]
Publisher’s Note: MDPI stays neutral with regard to jurisdictional claims in published maps and institutional affiliations. |
© 2021 by the authors. Licensee MDPI, Basel, Switzerland. This article is an open access article distributed under the terms and conditions of the Creative Commons Attribution (CC BY) license (https://creativecommons.org/licenses/by/4.0/).