Abstract
The main purpose of this paper is to assess energy consumption with a breakdown into main sectors of the countries that belong to the Visegrad Group. The specific objectives aim to determine changes in energy absorption, its productivity, structure by sectors and to show the similarities of the Visegrad Group countries to the other EU states in terms of the sectoral energy absorption structure. All members of the Visegrad group, i.e., Poland, Hungary, Slovakia and the Czech Republic, were purposefully selected for the study as of 31 December 2018. The research period covered the years 1990–2018. The sources of gathered information were the literature on the subject and OECD data. The following methods were used for the analysis and presentation of materials: explanations, tabular and graphical depictions, descriptive statistics, dynamics indicators, and cluster analysis performed with the following methods: k-means, hierarchical agglomerative clusters and DIvisive ANAlysis (DIANA). There is a limited number of previous studies on the relationship between the national level of economic development and energy consumption in different sectors of industry. Additionally, there are no such analytical projects concerning EU states. The article fills the research gap in this area. It was established that the dynamics of productivity growth over the nine years (2010–2018) was similar in the countries of the Visegrad group and on average for the EU. This means that the members of the Visegrad group did not actually improve their energy efficiency as compared to the EU average. The reason may be the increasingly faster implementation of modern technologies in developed economies of Western Europe as compared to the developing countries, which include the members of the Visegrad group. The conversion of the economy had a very large impact on changing the structure of energy absorption by sector. Industry and agriculture lost their importance. On the other hand, the transport and service sectors benefited. As a result of the cluster analysis, all EU (European Union) states were divided into four groups. Poland, the Czech Republic, and Hungary found themselves in one group, along with most Western European countries. This may mean that the economies of these states have become unified with highly developed economic systems. Slovakia found itself in the group of states with a greater importance of industry. The study complements the contribution to the theory. From a practical point of view, it shows the impact of economic transformation on changes in energy consumption in individual sectors, which may be a model of transition in this area.
1. Introduction
1.1. General Context
Energy is essential for all activities, it is used in transport, services, agriculture and other sectors of industry. Individual activities differ in terms of energy consumption. Additionally, most of utilized energy comes from non-renewable sources. Therefore, the proper use of power is becoming increasingly important [1,2,3]. There are also differences in the energy absorption of developed and developing economies [4,5,6]. Of course, countries are striving for energy convergence. However, strict compliance is not possible [7,8]. Several studies have confirmed the existence of regional cooperation in energy consumption some examples are studies by Liddle [9], Jakob et al. [10], Mulder and De Groot [11], Mishra and Smyth [12], and Payne et al. [13]. Sustainable development in the field of energy savings and reduction of pollutant emissions has become the goal of all states in the world [14,15]. Even so, there are big differences between countries in terms of energy consumption. Bridging the gap depends mainly on technological progress and the structure of the industry [16,17,18,19]. Developing countries often model their stages of economic development on the developed countries. However, they do not take into account energy efficiency, which varies annually. Additionally, energy absorption is related to the environment, the adaptation of the industry structure, and the effectiveness of economic growth. All these elements reflect the path of sustainable development of a given economy [20,21,22,23]. It may also be suggested that the energy policy and international responsibilities of developing countries should differ from the obligations of economically developed states. Of course, all nations should focus on saving energy and reducing emissions [8,24,25,26,27,28,29].
1.2. Literature Review
When analysing energy consumption in individual states, their level of economic development should be taken into account. Countries are often at various stages of development. Hence the differences, the level of economic evolution of a country can be measured by GDP per capita. Acaravci and Ozturk [30] analysed 19 European countries. A long-term relationship was found between energy consumption per capita and the real gross domestic product (GDP) per person in Western European states. Judson et al. [31] examined the relationship between GDP per-capita and proportionate energy consumption in major sectors of industry. Panel data covering up to 123 nations were employed. It was found that there are substantial differences among sectors in the structure of a country, time, and income effects. In particular, the share of transportation tends to rise, and the contribution of industry follows an inverse-U pattern. Therefore, there are strict interdependencies. Medlock and Soligo [32] identified the development patterns that characterize particular economic sectors and analysed the effect of growth rates of sector-specific energy demand on the composition of final demand for energy. It was found that the demand for industrial energy surges at the initial stages of development, but this growth slows down steadily throughout the process of technological development. On the other hand, the energy requirement for transportation rises steadily and takes the major share of total energy utilization at the latter stages of development. These results have implications for the primary energy demand of an economy as it develops.
Ma and Stern [33] conducted research concerning the People’s Republic of China. This country experienced a dramatic slump in energy intensity from the onset of economic reform in the late 1970s until the end of the millennium. Since then, the rate of decline slowed down, and energy concentration increased in 2003. Most of the downturn was due to technological development, but there is a certain degree of uncertainty regarding the role of structural change. The authors found that technological development was confirmed as the dominant contributor to the downturn in energy intensity. Structural transition of industry increased energy significance between 1980 and 2003, although the structural change at the manufacturing level was very different in the 1980s and the post-1990 period. The structural change covered shifts of production between sub-sectors. However, it lessened the overall importance of energy. The surge in energy concentration since 2000 is explained by negative technological progress because inter-fuel substitution was found to contribute little to the changes in energy intensity.
Mulder and de Groot [11] computed and evaluated energy intensity developments across 18 OECD states and 50 sectors from 1970–2005. It was found that across countries, energy concentration tends to decrease in most manufacturing sectors. In the service sector, energy intensity decreases relatively slowly, with diverse trends across sub-sectors. A decomposition analysis revealed that shifts in the economy’s sectoral composition explain a considerable and increasing part of aggregate dynamics of energy concentration. Only after 1995 did nationwide variation in aggregate levels of energy intensity tended to decrease. Moreover, across sectors, lagging countries are catching up with leading states.
Voigt et al. [34] examined energy intensity trends and drivers in 40 major economies. Shifts in energy significance at the national level (between 1995 and 2007) are mainly attributable to technological development, while structural transition is less significant in most countries. Notable exceptions are Japan, the United States, Australia, Taiwan, Mexico, and Brazil, where the difference in the industry mix was the main driver behind the observed reduction of energy concentration. At the worldwide level, the authors found that despite the global shifts to more energy-intensive countries, the efficiency of aggregate energy improved primarily due to technological change.
1.3. Contribution Motivation and Scope
The corelation between economic growth and energy consumption is well analysed in academic literature. However, there are not many investigations of the relationship between the level of economic development of a given country and the energy absorption rates of economic sectors. The few studies that exist are listed in the Introduction. Additionally, there are no such projects concerning EU states, which means there is a research gap that needs to be filled.
The main purpose of the paper is to assess energy consumption with a breakdown into main sectors in the countries of the Visegrad Group. The specific objectives were to determine changes in energy absorption, its productivity, structure by sectors and to show the similarities of the Visegrad group members with other EU states in terms of the sectoral energy demand structure.
The member states of the Visegrad Group are countries in which, as a result of the change from the communist system to capitalism, a huge economic metamorphosis took place. In a relatively short time, the production structure of the share of individual sectors has changed. This significantly influenced energy consumption in the respective sectors and energy efficiency. The Visegrad Group members are examples of developing countries. Therefore, it can be assumed that the energy consumption structure in these states may be similar to that in other developing economies of the EU. Additionally, compared to economically developed countries, energy productivity generally grew faster and energy intensity slower in developing economies. Based on these premises, two research hypotheses were formulated in the paper:
Hypothesis 1.
In the Visegrad countries, energy productivity grew faster and energy intensity slower as compared to changes in these parameters for the entire EU, mainly as a result of the economic transformation.
Hypothesis 2.
Members of the Visegrad Group had a similar sectoral energy consumption structure to other developing states of the EU, and completely different from economically developed countries.
1.4. Document Organization
The organization of this paper is as follows: Section 2 presents the methods used to determine changes in the sectoral energy use in the Visegrad Group members, as well as to show the setup of EU states, including the Visegrad Group in terms of energy consumption in sectors of the economy. In Section 3, the results of the research were presented. In Section 4, the Discussion, reference is made to the other research results that dealt with the studied relationships. Finally, Section 5 concludes the paper.
2. Materials and Methods
The analysis of the Visegrad Group was conducted using data from the OECD. Additionally, the study was extended to cover all states of the European Union to show differences between the Visegrad Group members and the countries of European Union. The use of OECD data makes it possible to compare all states together due to the fact that all tested parameters were calculated with the same methodology. When presenting the results in graphs, abbreviations of state names were used. The acronyms of country denomination used in the work are according to ISO 3166-1 alfa-2. They are as follows: Austria (AT), Belgium (BE), Bulgaria (BG), Cyprus (CY), Czechia (CZ), Germany (DE), Great Britain (GB), Denmark (DK), Estonia (EE), Spain (ES), Finland (FI), France (FR), Greece (GR), Croatia (HR), Hungary (HU), Ireland (IE), Italy (IT), Lithuania (LT), Luxembourg (LU), Latvia (LV), Malta (MT), Netherlands (NL), Poland (PO), Portugal (PT), Romania (RO), Sweden (SE), Slovenia (SI), and Slovakia (SK).
The article covers data from the years 1990–2018 (2018 is the last year for which information for each selected country is available). The potential list of variables was selected based on data availability. Additionally, energy consumption in main economic sectors was used. The completed list of variables used in paper is presented in Table 1.

Table 1.
List of variables used in the analysis.
The first variable used in the analysis is the total primary energy supply (TPES) defined as energy production plus energy import, minus energy export, minus international bunkers, then plus or minus stock changes. The energy balance methodology of International Energy Agency (IEA) is based on the calorific content of the energy commodities and a common unit of account: tonne of oil equivalent (toe). The next analysed variable is energy productivity defined as a measure of the economic benefit received from each unit of energy used. It is calculated by dividing total economic output (e.g., GDP) by the amount of energy consumed (e.g., barrels of oil equivalent, or kilowatt hours of electricity). Energy intensity refers to total primary energy supply (TPES) per thousand US dollars of GDP. The ratios are calculated by dividing each country’s annual TPES by each country’s annual GDP expressed in constant 2005 prices and converted to US dollars using purchasing power parities (PPPs) for the year 2005.
In the first stage of the research, data on changes in the total primary energy supply in the Visegrad Group countries compared to the entire EU were presented. Additionally, energy productivity was shown to determine if energy utilization was improving. Thanks to this, it is possible to check whether the decrease (increase) in energy consumption was not indirectly caused by changes in energy productivity. Dynamics indicators for energy efficiency were also calculated. Another important parameter was energy intensity, which indirectly determines how the structure of the economy has changed and what changes have been made in technology.
As a result, the directions and strength of analysed variables were obtained. In this paper the chain simple dynamic indicators were used as follows:
where: yt—level of the phenomenon in a certain period, yt−1—level of the phenomenon during one period earlier.
Descriptive, tabular and graphic methods were also used to present the data. The purpose of this section is to present the general background for further analysis.
The second stage of research focused on the share of individual sectors of the economy in energy consumption in the Visegrad Group member states. At the beginning, descriptive statistics on the share of individual sectors in energy consumption in individual countries of the Visegrad group and the EU as a whole are presented. This part of the research was aimed at obtaining information on the regularities occurring in individual states of the Visegrad group and throughout the EU. The analysed statistics include average, median, minimal, maximal, standard deviation, coefficient of variation, skewedness, and kurtosis. This section also presents changes in the structure of energy consumption in individual countries in the years 1990–2018.
In the third stage of the research, a cluster analysis was performed for all countries. Unsupervised learning methods were used. The first is the k-means algorithm.
K-means is one of the most popular algorithms used in machine learning. Machine learning techniques are used widely in many fields of data analysis, including distribution estimation or data exploration [35]. Data exploration methods can be divided into supervised learning and unsupervised learning methods. The goal of supervised learning is to estimate a function that maps independent features to targets (dependent variable). In contrast, the main purpose of unsupervised learning is to discover patterns from unlabelled data (the classes are not known) and the main solved problems are: clustering, dimensionality reduction methods, and association rules.
Clustering methods are focused on grouping objects (countries) into clusters according to their variable similarity [36]. One of the most frequently used methods in clustering is k-means. The k-means method is an iterative optimization technique that groups the data set points D = (X1, … Xn) through a predefined (determined by user) number of K clusters [36]. The algorithm assumes a certain K number of clusters with centers (u1, …, uk) and tries to minimize the square of Euclidean distance between the assigned points and their cluster centre. It could be summarized by the following formula:
where: ai,j is a binary coefficient with a value equal to one or zero depending on cluster assignment.
Each cluster is described by a centre called centroid (centres) (u1, …, uk). The formula depends on the position of cluster centre uj and assigned points. In the first step, the algorithm selects the optimal ai,j for fixed uj by assigning the given data point xi to the nearest uj. In the next step, k-means updates the centres uj for fixed assignment ai,j. These two steps are repeated until certain conditions are met (no changes in clusters assignment or the number of iterations exceeds a specified number). It should be noted that the iterative algorithm in k-means does not guarantee achieving a global minimum of the function. Depending on the choice of the initial centres, the final clusters may differ. To overcome this fact, several trails should be performed to select the best initial centres. Despite this, the k-means is very efficient and perhaps the fastest clustering algorithm that can be used for long (many records) and wide (many data dimensions) datasets.
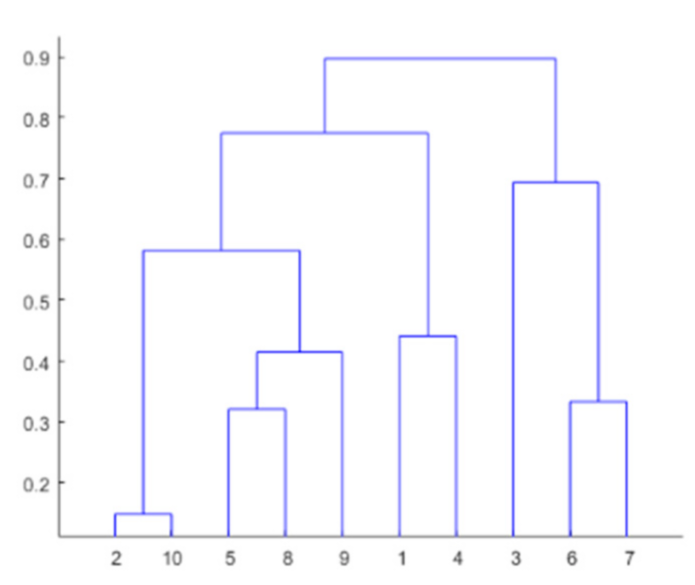
The second algorithm used in the paper is hierarchical agglomerative clustering (HAC), which is called the “mother” of all clustering models. At the beginning, the algorithm starts with a solution where each object (country) belongs to a separate cluster and in each iteration the algorithm groups two clusters into one cluster up to the situation where all objects (countries) fall into one supercluster. In each step, the algorithm calculates the distances between all pairs of objects and groups the most similar ones [37]. The output of this process can be presented as a tree diagram called a dendrogram, where the height of the dendrogram can be used to select the optimal number of clusters (Figure 1). The basic distance metric in HAC is the Euclidean distance formula, but other distance metrics also can be used (like “Manhattan”, “Minkowski” or “Pearson”). The most useful version of hierarchical agglomerative clustering is Ward’s method, which fuses the object based on the smallest increase in the error after fusing two clusters [36,38]. Ward’s method aims at finding compact, spherical clusters.
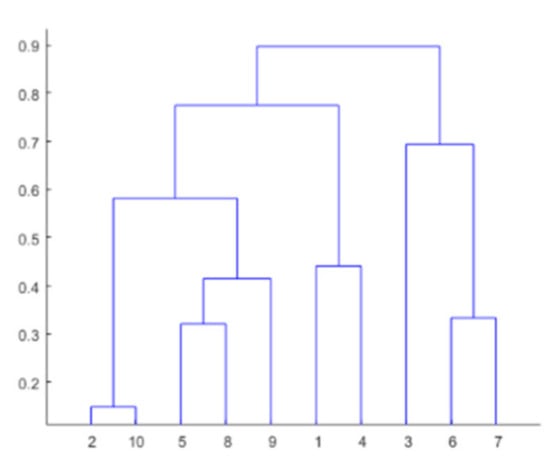
Figure 1.
Example of dendrogram for hierarchical agglomerative clustering.
The last method used in the paper is DIvisive ANAlysis clustering (DIANA) algorithm, which is also a hierarchical clustering technique [39]. This method constructs the hierarchy but in the inverse order in comparison to hierarchical agglomerative clustering. At the beginning, there is one large supercluster consisting of all objects and in each iteration the algorithm splits the available cluster into two subclusters until finally all clusters comprise only one single object. At each iteration, the cluster with the largest dissimilarity between any two of its objects is selected. In the subsequent step, the algorithm first looks for its most disparate observation (i.e., which has the largest average dissimilarity to the other observations of the selected cluster) and this object initiates the “splinter group”. In subsequent steps, the algorithm reassigns observations that are closer to the “splinter group” than to the “old” [39]. Finally, the selected cluster is split into two clusters. DIANA can be classified as a top-down approach and in certain situations is more efficient than hierarchical agglomerative clustering.
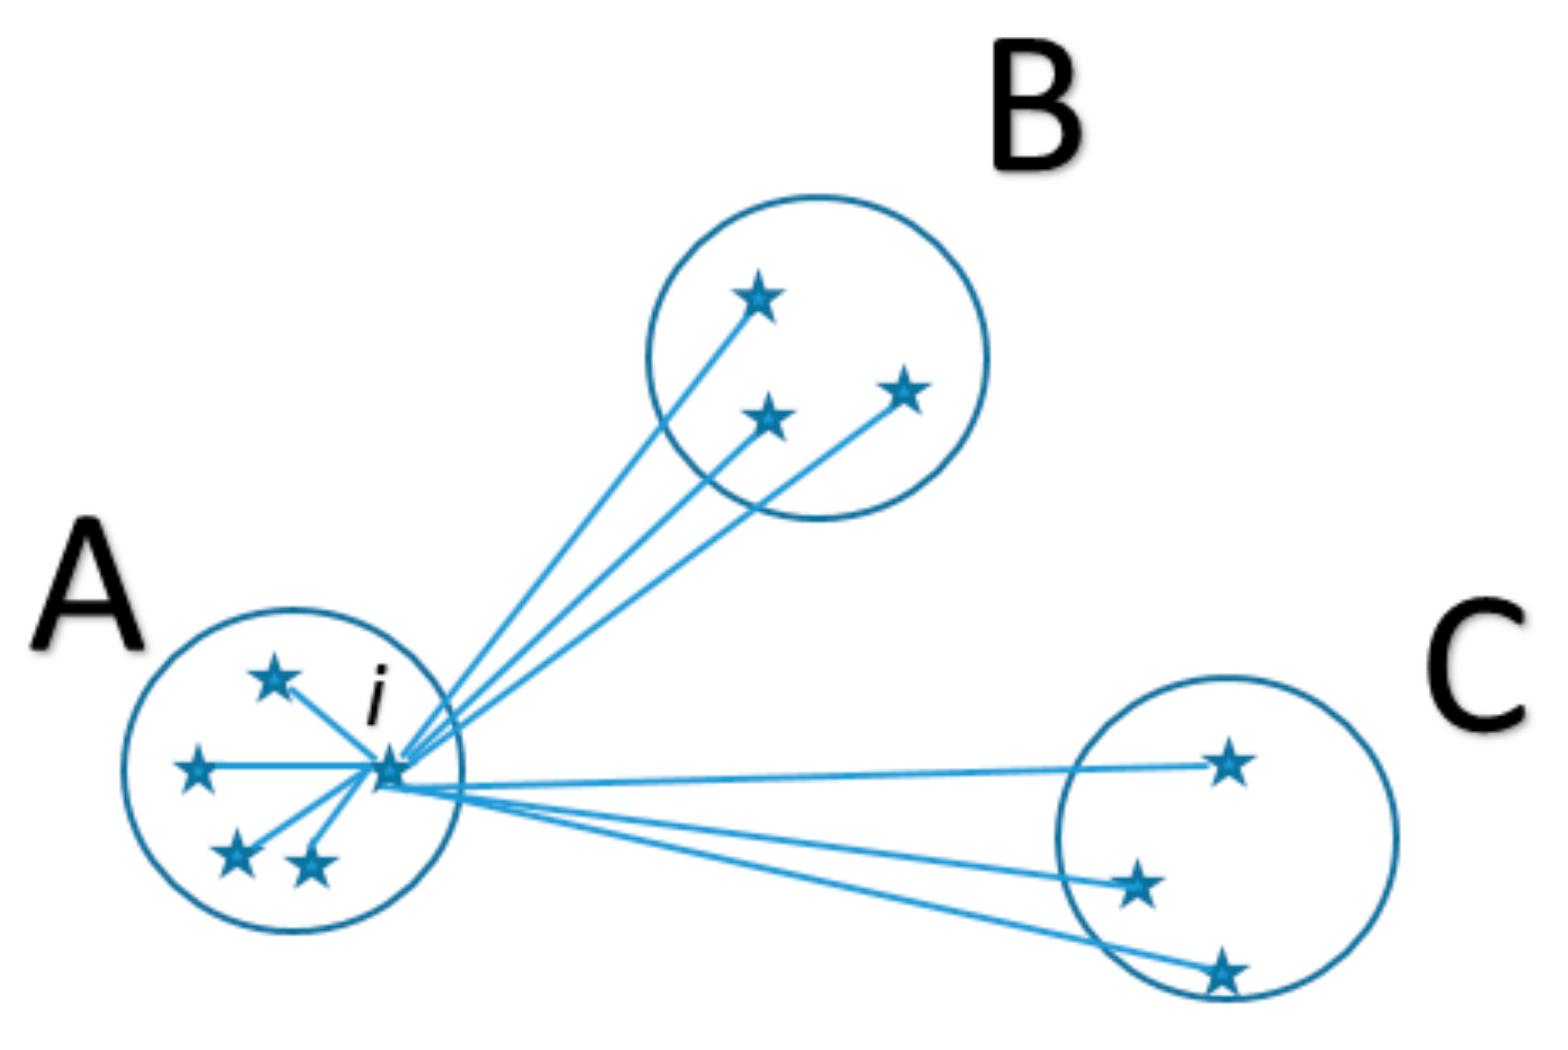
Silhouette index is used to validate the consistency of clustering and can be described as a measure of how similar the object is to its own cluster (cohesion) compared to other clusters (separation). The formula for the silhouette index is as follow:
where: a(i)—average dissimilarity of object i and all other objects in the same cluster (the smaller the a(i), the better the assignment), b(i)—the smallest average dissimilarity of object i to all other clusters, of which i is not a member. The cluster with the smallest value of b(i) is the “neighbouring cluster” of object i.
If a given cluster contains only one object, then s(i) is equal to 0. The theoretical values of this index range from −1 to 1, where higher a value (close to 1) indicates that object is well clustered, a value close to 0 indicates that the object lies between two separate clusters and a negative value indicates that a given object is assigned to the wrong cluster [40]. More positive values for specific clustering indicate that the configuration is appropriate. The average of the silhouette index for the entire dataset (the silhouette coefficient) may be used to select the optimal number of clusters. The formula can be used with any distance metric, not only with the Euclidean distance. The general concept of the silhouette index is presented in Figure 2.
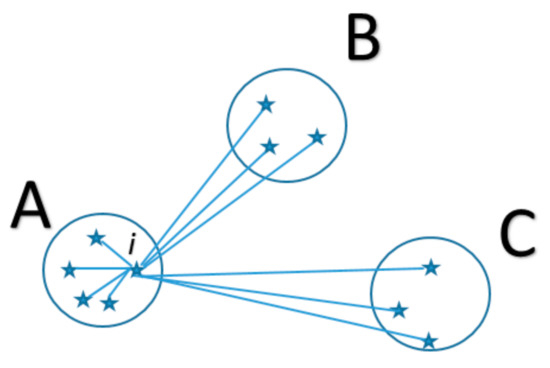
Figure 2.
The general idea of the silhouette index, where object i belongs to cluster A.
Additionally, in order to assess similarity between selected techniques, the Rand and Jaccard indices were used. The Rand and Jaccard indices are two of the most popular metrics of similarity used in clustering. These metrics are designed for accuracy, but also can be used when class labels are missing. Actually, for two clusterings of the same data set, these metrics calculate the similarity statistic specified for the clusterings from the comemberships of the observations. Basically, the comembership is defined as the pairs of observations that are clustered together [36]. The detailed equations are as follows:
where: n1,1 is the number of observation pairs where both observations are comembers in both clusterings, n1,0 is the number of observation pairs where the observations are comembers in the first clustering but not the second, n0,1 is the number of observation pairs where the observations are comembers in the second clustering but not the first and n0,0 is the number of observation pairs where neither pair are comembers in either clustering (64).
3. Results
3.1. Basic Parameters of Energy Consumption in the Countries of the Visegrad Group
Total primary energy supply in the Visegrad Group member states was relatively constant in 1990–2018 (Figure 3). Significant stabilization occurred in Hungary and Slovakia. The greatest fluctuations occurred in Poland, especially in the years 1995–2010. In Czech Republic, heavy reductions were evident at the beginning of the economic transformation period, i.e., in the years 1990–2005. The turning point was the accession of the Visegrad Group members to the EU. Adjustment measures had been carried out earlier, but the accession allowed for the opening of the EU market to these countries. Between 1990 and 2018, total primary energy supply increased only in Poland (by 2.6%), while it decreased the most in Slovakia (by 18.6%), then in Czech Republic (by 13.1%) and in Hungary (by 7.1%). Across the EU, the decline was 2.5%. However, there were large variations, such as a surge in 2004, followed by a continuous decline until 2014 (when increases began). It was not possible to present data on the EU and individual countries of the Visegrad group in one graph. For example, in 2018, the total primary energy supply in the EU was 1603 million tonnes of oil equivalent (toe), while in Slovakia only 17.35 million tonnes. Generally, in individual member states of the Visegrad Group, as well as in the entire EU, there is a visible tendency to reduce the total primary energy supply, which is a positive phenomenon.
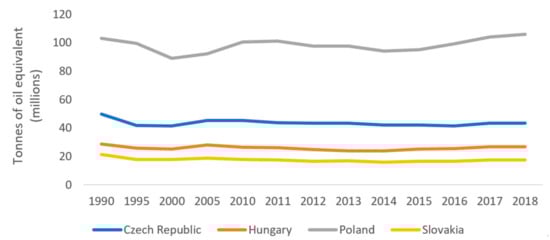
Figure 3.
Total primary energy supply in the Visegrad Group countries in 1990–2018.
Reducing energy consumption without improving performance would mean that countries do not produce more and do not grow. Productivity is therefore a key factor, both for the development of countries and the reduction of energy absorption, i.e., the implementation of key energetical and environmental trends.
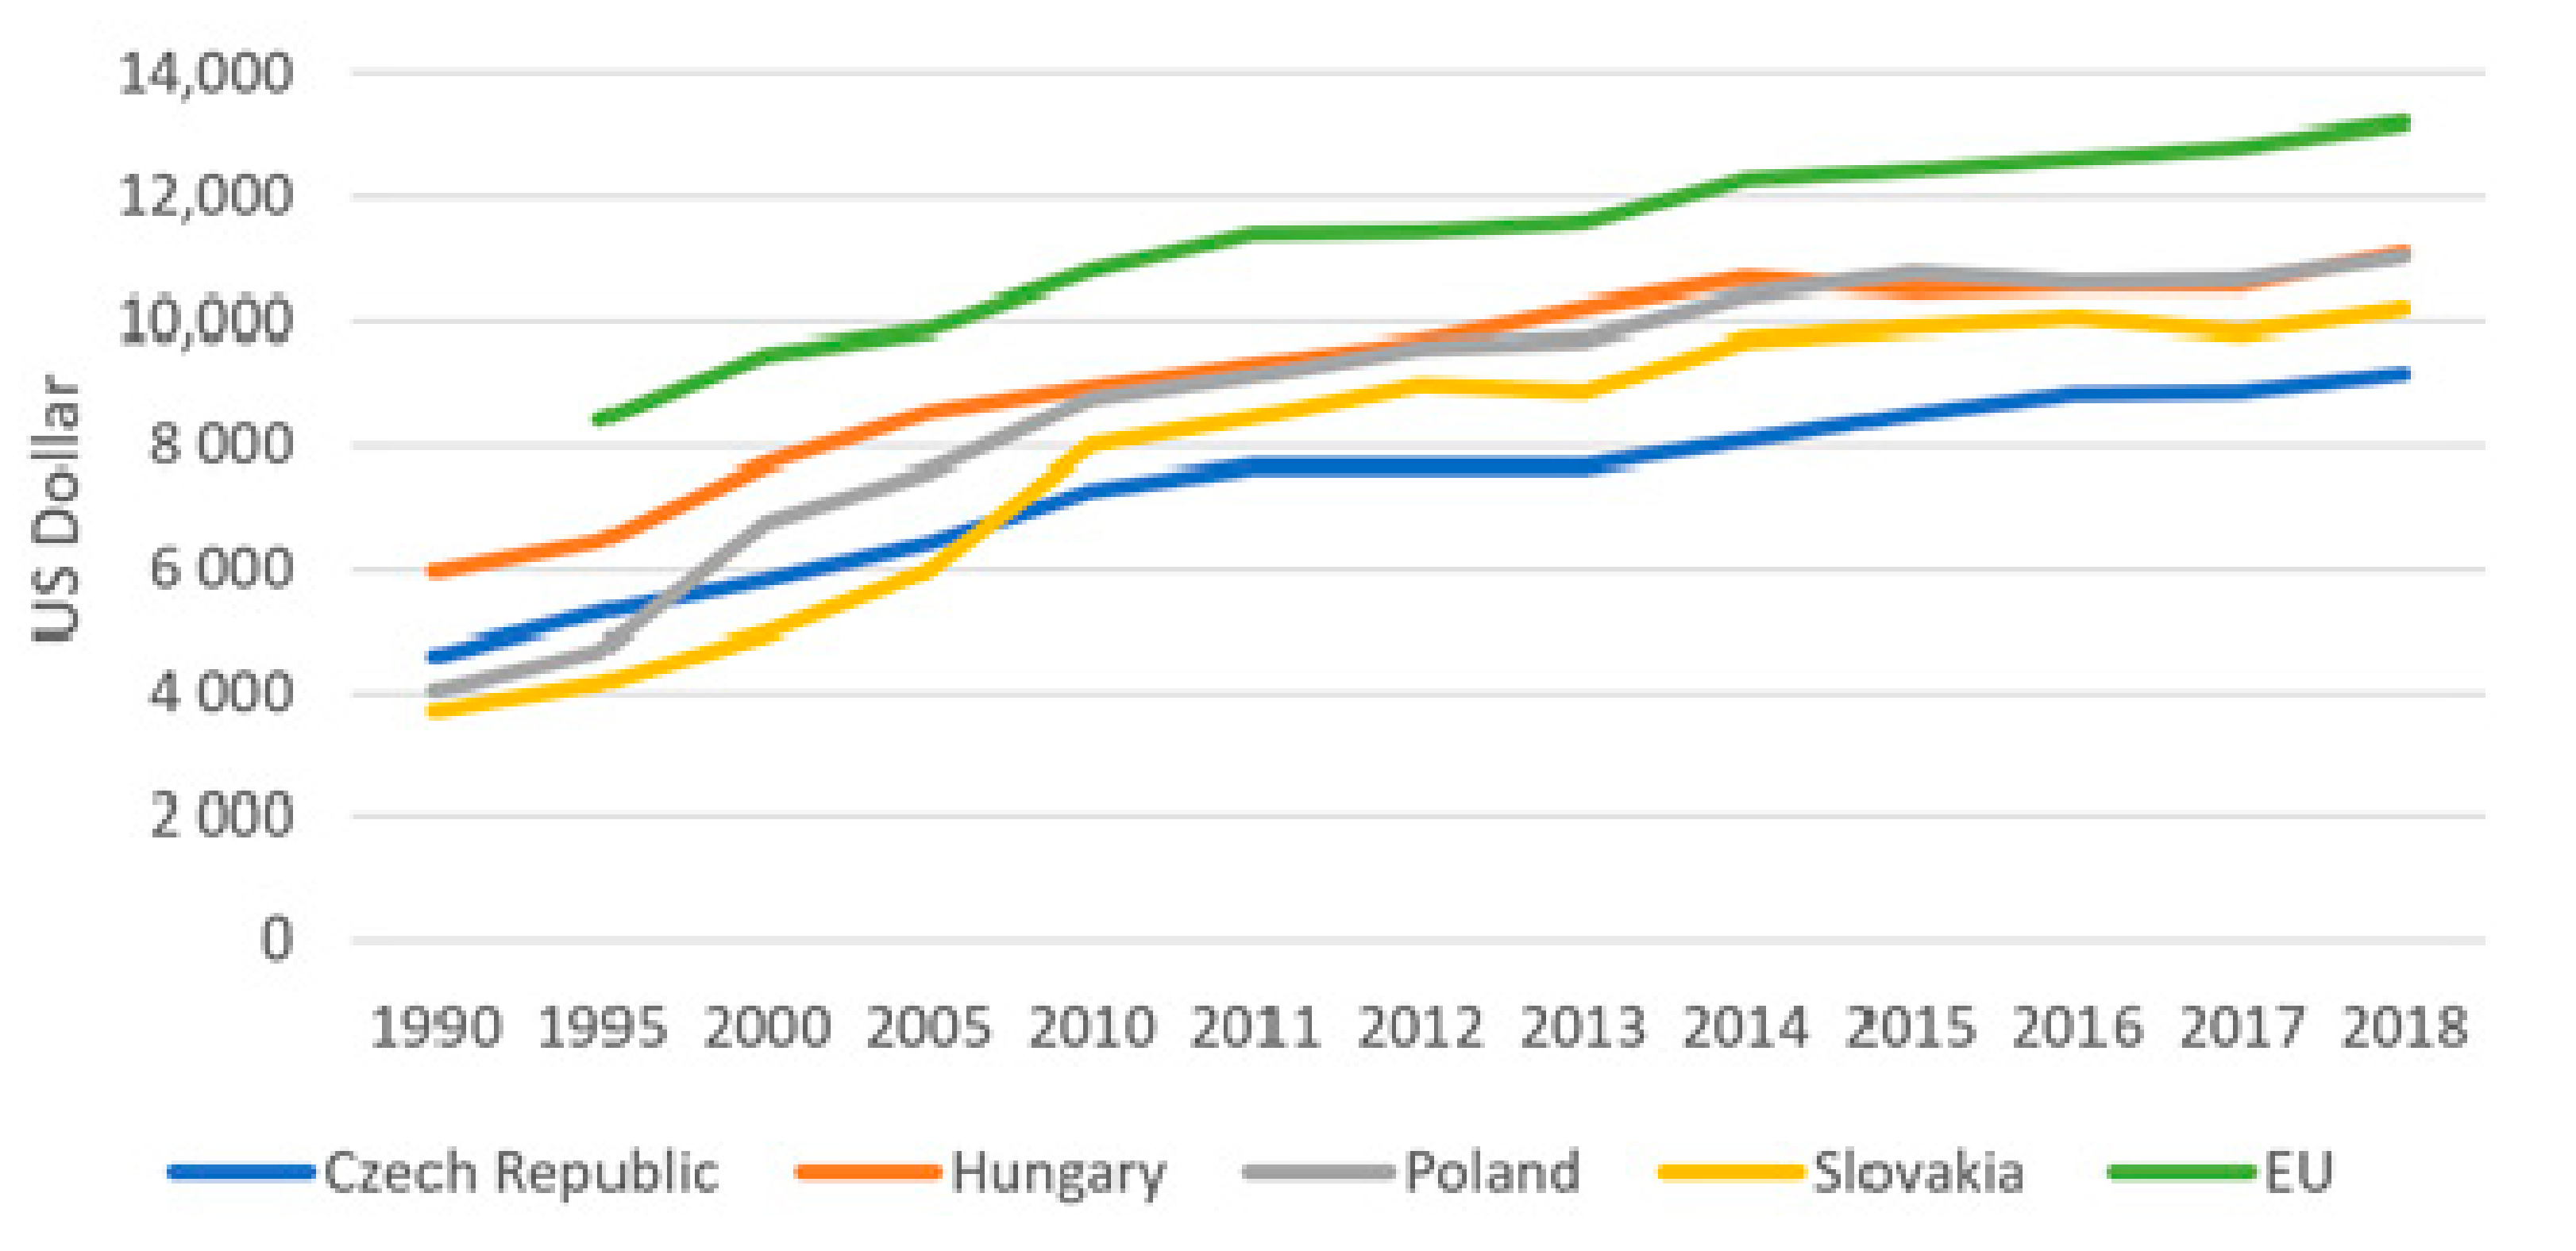
In the analysed period it can be observed that energy productivity for the Visegrad Group members was still increasing (Figure 4). At the beginning of the analysed period, the highest energy productivity was in Hungary, but at the end the highest yield of energy can be observed in Hungary and Poland. The green line represents the EU level of energy efficiency and in all years, it was higher than the energy performance in the Visegrad countries. An interesting change can be observed for Czech Republic. At the beginning of the analysed period, the Czech Republic was in second place, but at the end of the term, it was last. It could be summarized that for Czech Republic there was the lowest increase in energy productivity.

Figure 4.
Energy productivity in the Visegrad Group countries in 1990–2018.
Additionally, for the Czech Republic, the dynamic indicators show that the highest increase in energy productivity can be observed in 2011 (Table 2). After this year, the yield of energy was stable up to 2014 when the energy output increased again. Additionally, after 2016, the energy efficiency improved; however, at a slower rate than before. For Hungary, it can be observed that between 2011 and 2014 there was a soar in energy productivity (more or less 5%), but later the energy performance was stable. For Slovakia, the energy output increased significantly in 2011 and 2012, but after 2015 the yield of energy remained constant. In 2018, a surge can be noted for Slovakia (4%). In the case of Poland, a significant increase in energy output can be noticed between 2011 and 2014, but later the improvement in energy performance is lower than it was previously. Moreover, in 2016 a decrease is observed. For the European Union, the highest increase in the yield of energy can be observed in 2011 and 2014. At the end of the analysed period, growth was observed but at much lower level. The total dynamics of the productivity trend over the nine years was similar in the countries of the Visegrad group and on average for the EU. This means that the Visegrad Group members did not actually improve their energy output compared to the EU average. Productivity in the EU was at a higher level, so in absolute terms it increased more than in the states of the Visegrad Group. The reason may be the progressively faster implementation of modern technologies in highly developed economies of Western Europe as compared to the economically developing countries, which include the Visegrad Group members.
Table 2.
The chain dynamic indicators for energy productivity in the Visegrad group countries.
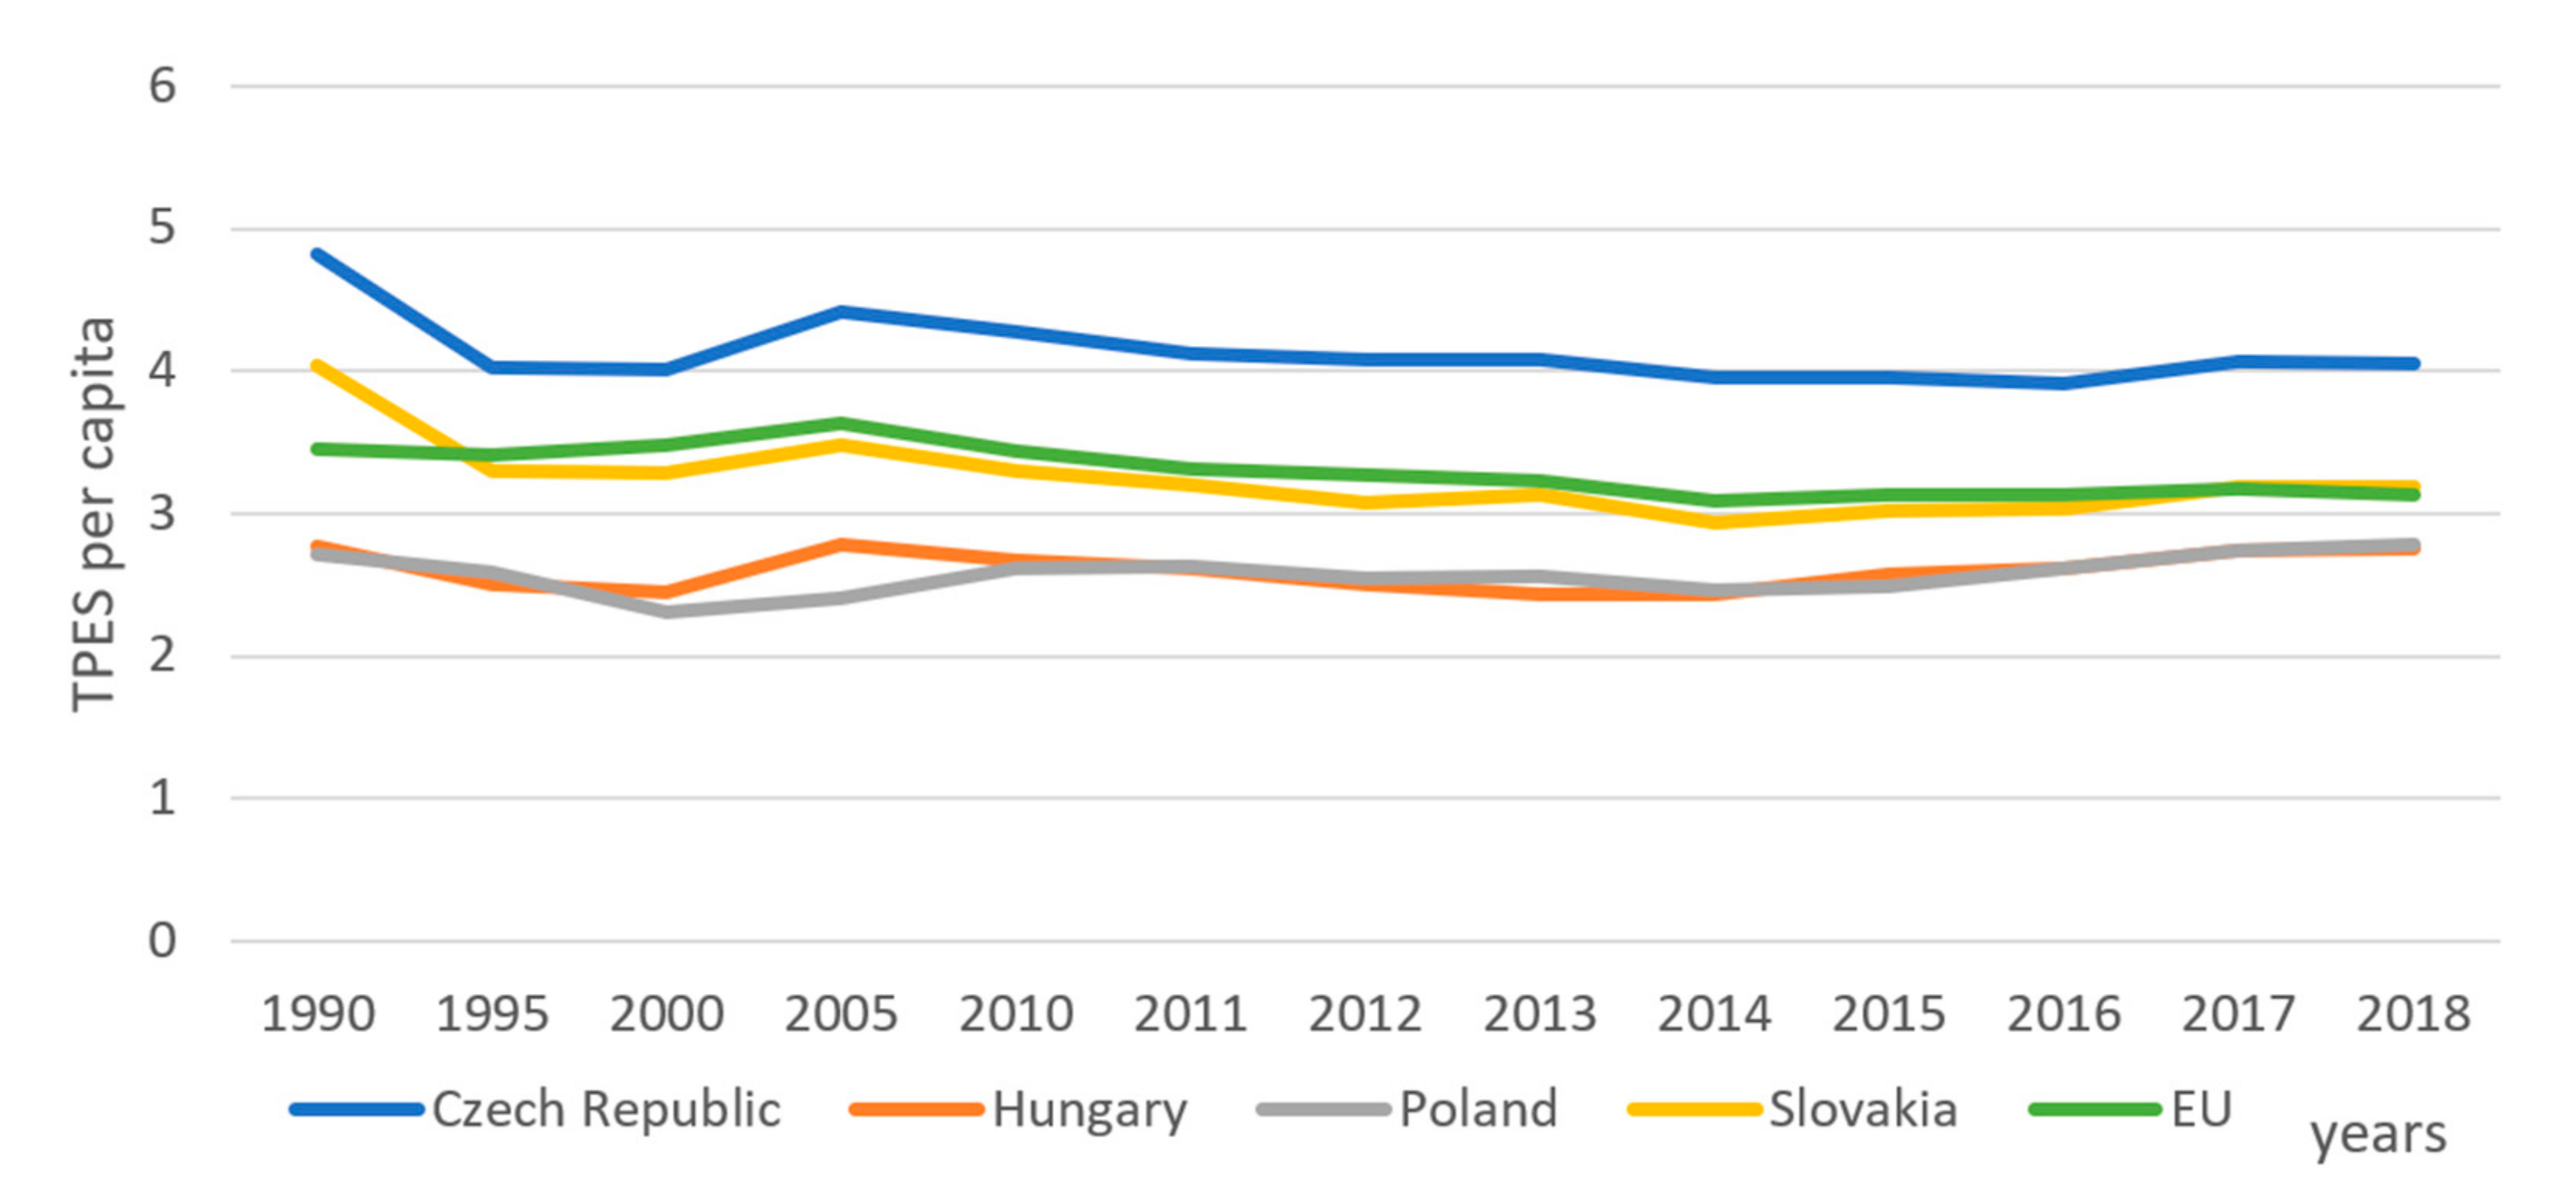
Energy intensity per capita is an important indicator as it shows the transformation of the economy. Of course, in all the countries of the Visegrad group, large economic growth was recorded in the years 1990–2018. With the old structure of industry and technology maintained, this would mean a very large increase in energy consumption, i.e., greater energy absorption. This did not happen; energy intensity per capita decreased in all Visegrad Group members, except Poland (Figure 5). Declines also occurred across the EU. The slumps took place in the 1990s. At that time, the transformation of the economy was the greatest. Heavy industry, which was very energy-intensive, was severely restricted in many post-communist states. It was often a shock therapy, as entire factories were closed, and workers became unemployed. At the same time, a large market of new merchandise opened up, which were more competitive than many products from the socialist system. The growth in individual consumption was one of the reasons for changing the structure of the economy and developing light industry, which requires less energy. The importance of agriculture has also decreased, while transport has increased. In the Visegrad Group members, the growth in energy intensity per capita occurred only in Poland (by 2.7%), while decreases occurred in Slovakia (by 21.1%) and the Czech Republic (15.7%). There was stabilization in Hungary (a decrease of only 0.7%). In the EU, the energy concentration per person reduced by 9.2% over the considered period. Generally, the Visegrad Group states followed the trends of the entire EU, i.e., lowering the energy intensity of the economy. However, it should not be forgotten that the countries of the Visegrad Group underwent a transformation of the economy, which mainly concerned changes in the sectoral structure, but also the introduction of new technologies.
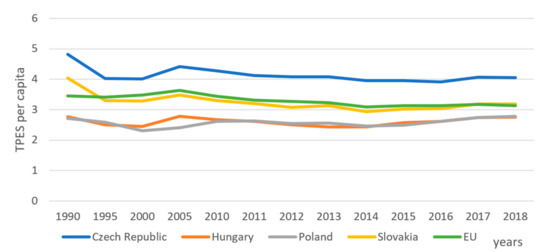
Figure 5.
Energy intensity (TPES per capita) in the Visegrad Group countries in 1990–2018.
3.2. Energy Consumption in Sectors of the Economy in the Countries of the Visegrad Group
Descriptive statistics are intended to present the nature of changes in energy consumption of individual member states of the Visegrad group. The sectoral dimension is important here. The agricultural industry was of the greatest importance in Poland and the smallest in Slovakia. This is evident in the share of the sectoral structure of energy consumption (Table 3). Additionally, in the countries of the Visegrad Group, energy absorption in agriculture has been steadily decreasing. This is evidenced by all the statistics presented. There was relative stabilization in the EU at that time. It can be concluded that the Visegrad Group members have adhered to the EU in terms of the importance of agriculture in energy consumption. The industrial sector underwent the greatest transition. It was still significant as it absorbed more than 20% of energy. However, there were years (especially in the early 1990s) when it constituted over 30%, or even almost 50% (in the Czech Republic with 48.26% in 1990). Of course, industry in the states of the Visegrad Group is subject to further changes, but they are not so violent. The coefficients of variation in individual countries were at a similar level as in the case of agriculture. Additionally, low variability was found in Slovakia, at a level similar to that in the EU. Transport has become an important sector in the countries of the Visegrad Group. Its share of energy consumption in all countries exceeded 20%, and often reached 30%. Under the communist regime, rail services were developed, which are not very energy intensive. The reason was the domination of heavy industry. After the system was changed to capitalist, road conveyance gained importance, allowing processed goods to be transported to any place. An important factor was satisfying the needs of individual consumers. Additionally, the frequency of transport has grown. As a result, the importance of this sector for the Visegrad group members has increased. The changes were quite rapid, as evidenced by a very high coefficient of variation. In the EU, there has been a relative stabilization of the importance of transport in terms of energy absorption. The service sector was also quite important. In all countries, it accounted for over 10% of utilized energy and its significance was growing. Volatility was high, but lower than in other sectors of the economy. It was the largest in Slovakia and the smallest in the Czech Republic. The remaining sectors had a significant share in energy consumption; however, they were characterized by low variability. Probably, the grouping of the remaining sectors into one division meant that it was impossible to define the detailed changes of individual smaller sectors. In general, it can be stated that the structure of energy consumption in the member states of the Visegrad Group has become similar to that in the EU. The reason was the relatively large transformation in the economies of these countries. Nevertheless, it is not the case that the sectoral structure in individual EU states, including the Visegrad Group members, is the same. Detailed analyses will show that there are differences between countries.
Table 3.
Selected characteristics of adopted diagnostic variables for Visegrad Group countries.
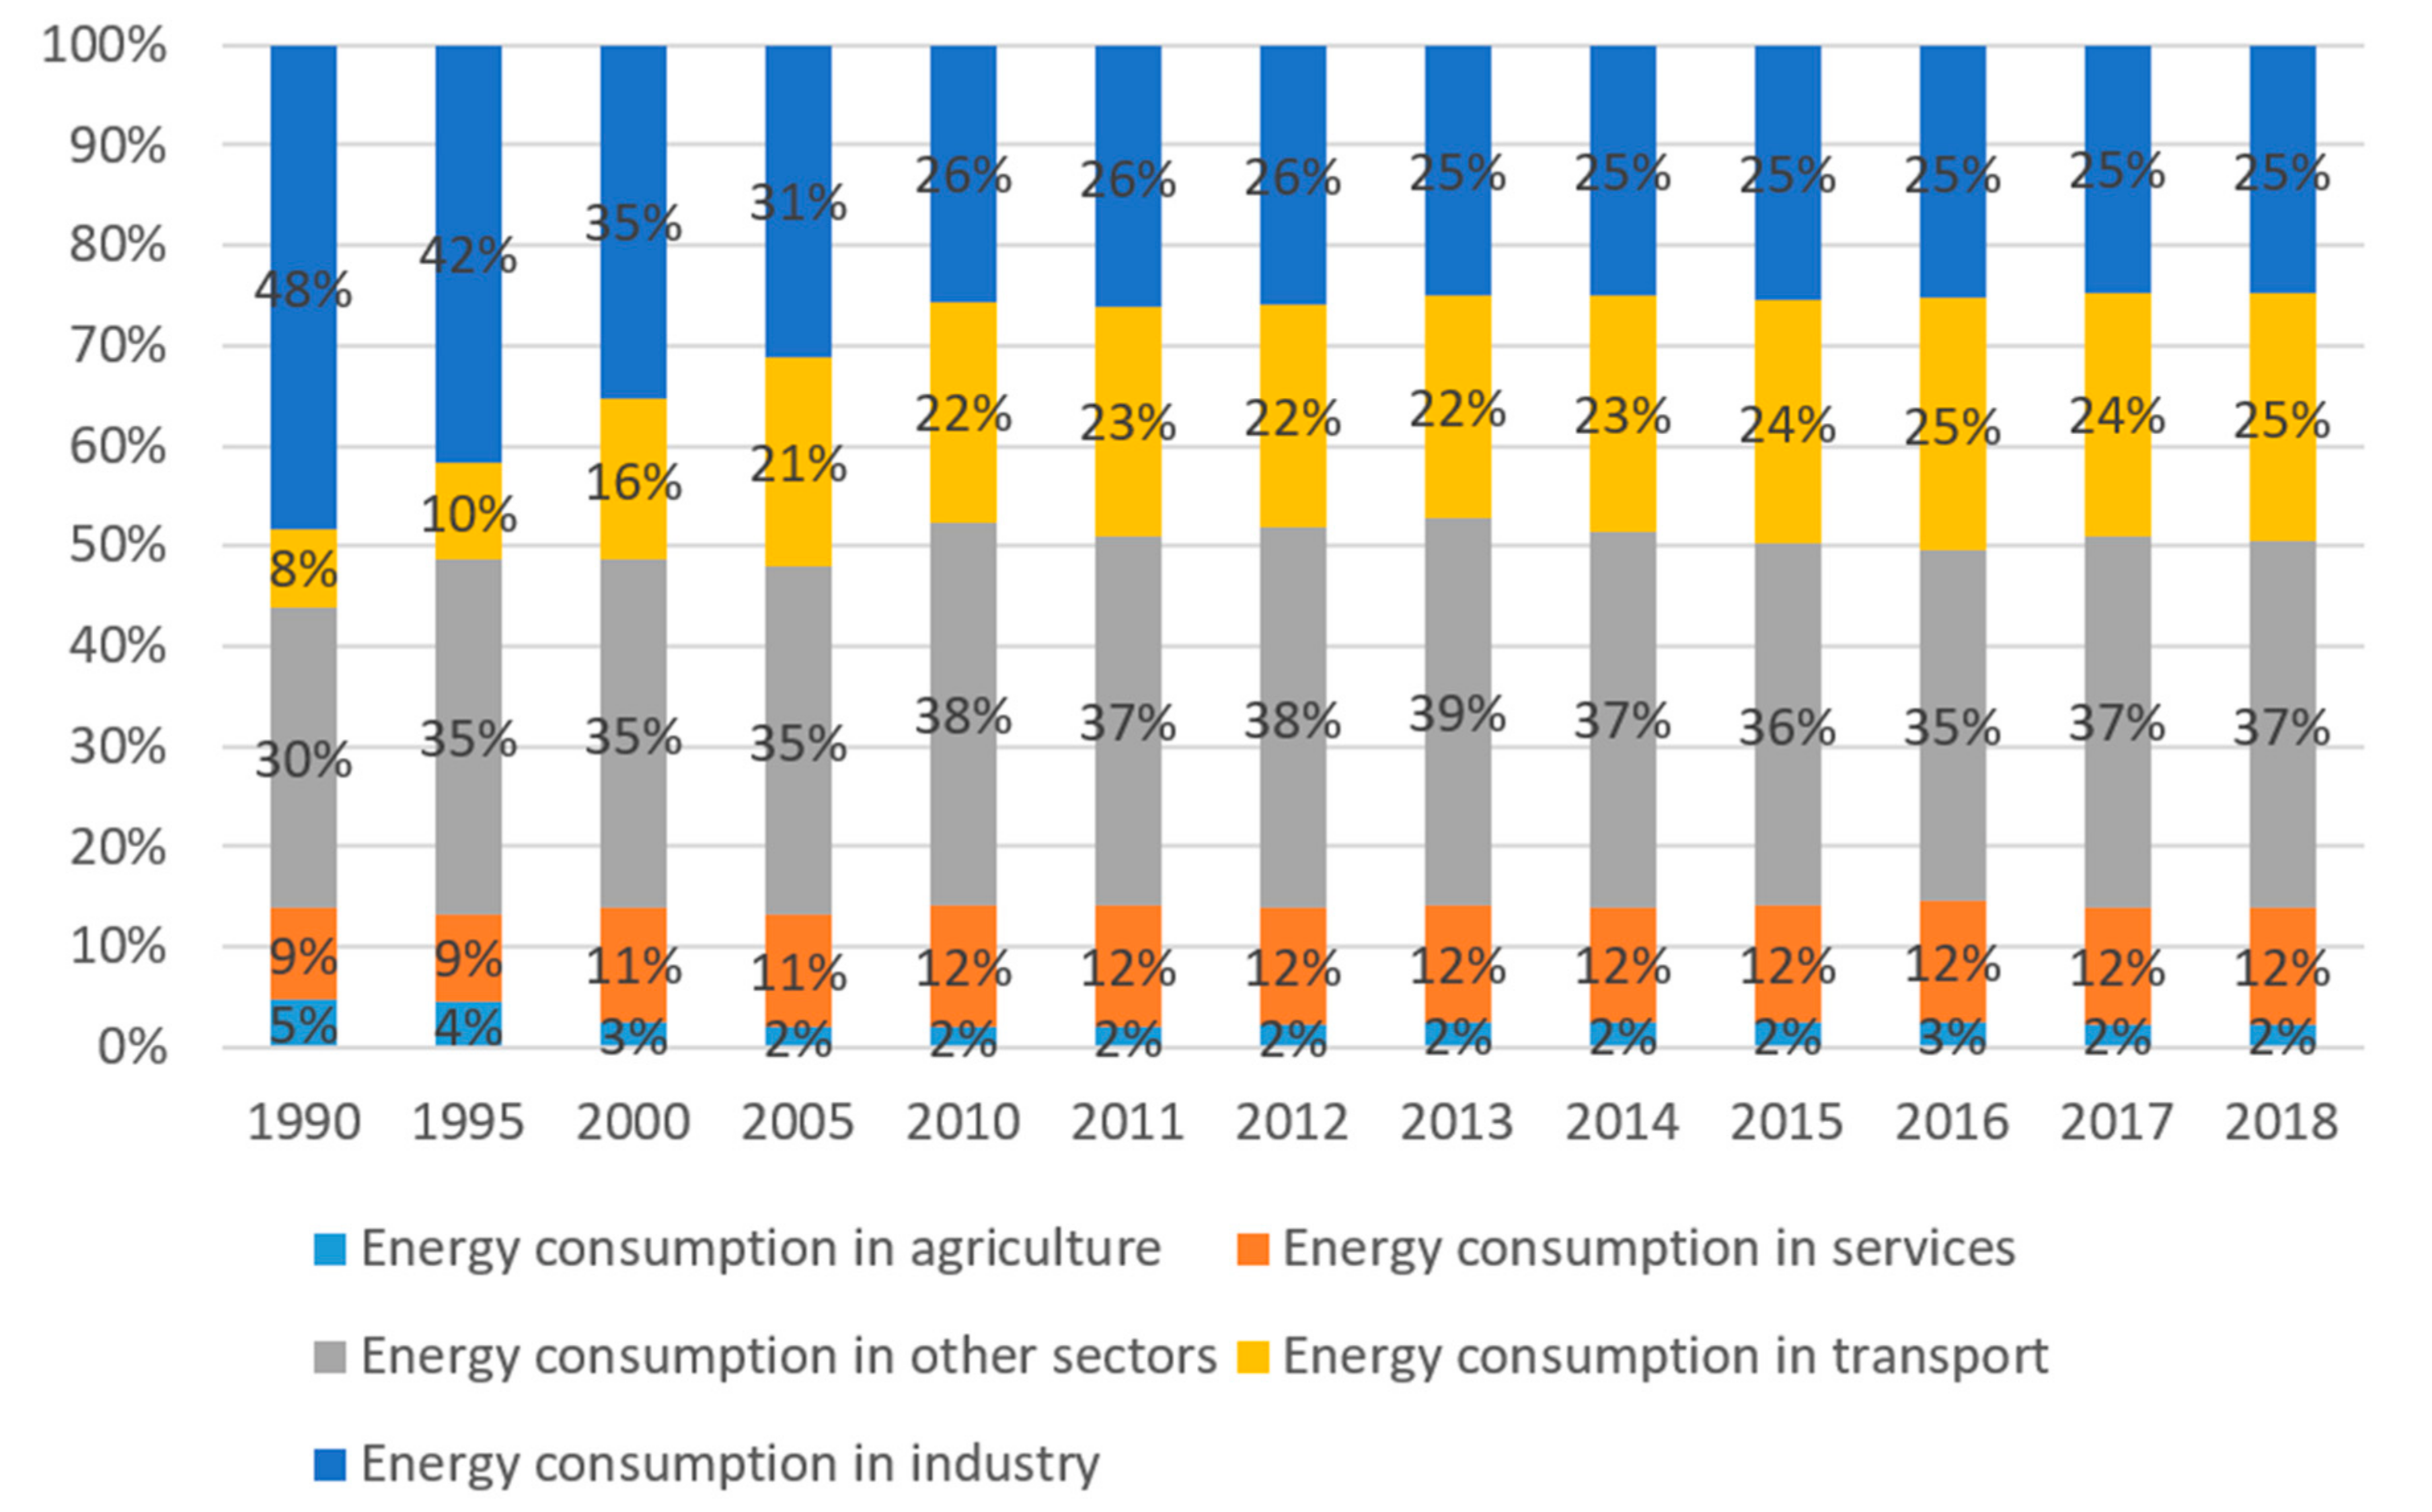
The situation of energy consumption in the Visegrad Group was diverse. In the Czech Republic, it can be seen that energy absorption in agriculture decreased slightly (from 4.66% in 1990 to 2.30% in 2018) (Figure 6). For the energy consumption in services, a stable level can be observed (9.19% in 1990 and 11.57% in 2018). The biggest drop in energy absorption can be noticed for industry (from 48.26% to 24.83%). In contrast, the highest growth is observed for transport (from 7.86% to 24.60%). The detailed analysis shows that the largest changes were observed between 1990 and 2005. After 2005, the structure of energy consumption is quite stable (+/−3%). The economic transformation was the most important cause of variations in the structure of energy absorption in sectors of the economy. The transition from the communist to capitalist system brought about changes in the structure of the economy. Many state-owned enterprises collapsed. Additionally, production patterns from Western Europe were implemented. As a result, at the time of accession to the EU in 2004, the Czech Republic was after a thorough economic conversion. Subsequent changes resulted more from developments in production technology than from shifts in the structure of the economy.

Figure 6.
Structure of energy consumption in Czech Republic in 1990–2018.
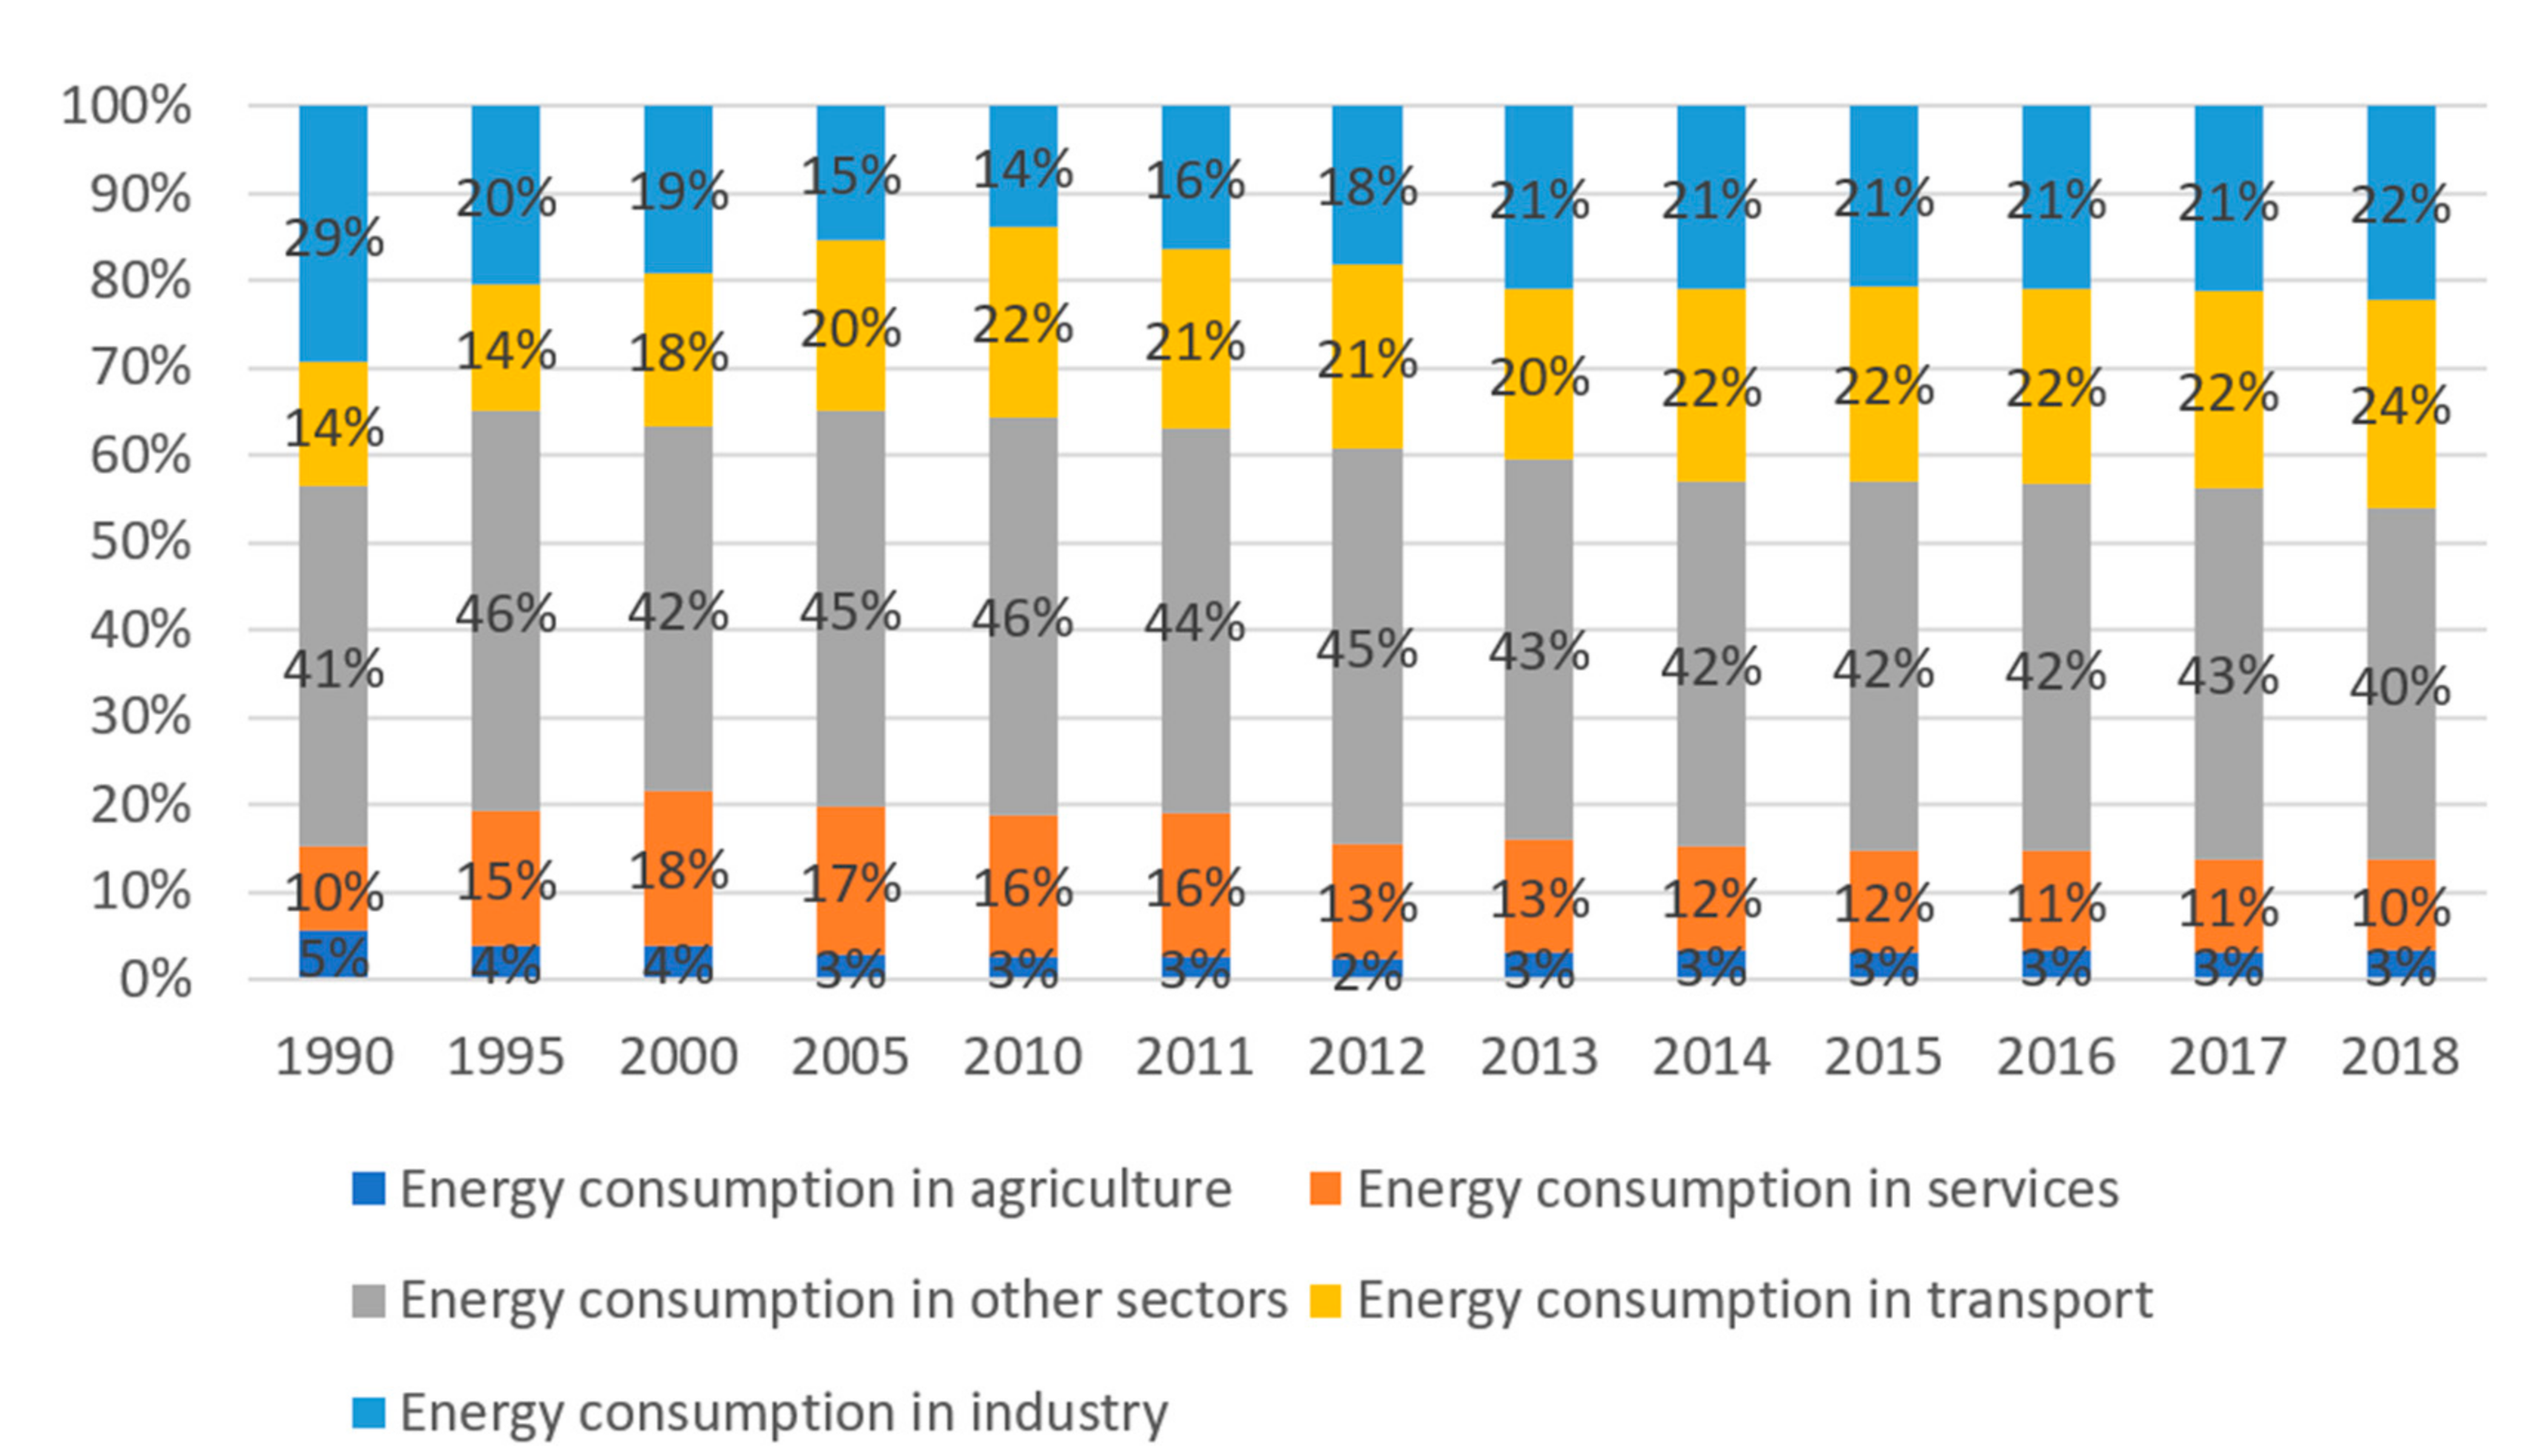
For Hungary, the structure of energy consumption was quite stable in the analysed period (Figure 7). The smallest consumption, the energy utilization in agriculture, decreased by two percentage points (from 5.47% in 1990 to 3.19% in 2018). A stable situation was also recorded for services and other sectors. However, it should be noted that in 2000 the energy absorption was much higher when compared to other years (17.56%). A similar situation was also recorded for other sectors. Between 1995 and 2012, the share was around 45%. An upward trend can be observed (from 14.17% to 23.81%) for transport and a downward trend for industry in the first part of the analysed period. After 2013, the industry consumption was approximately 21%.

Figure 7.
Structure of energy consumption in Hungary in 1990–2018.
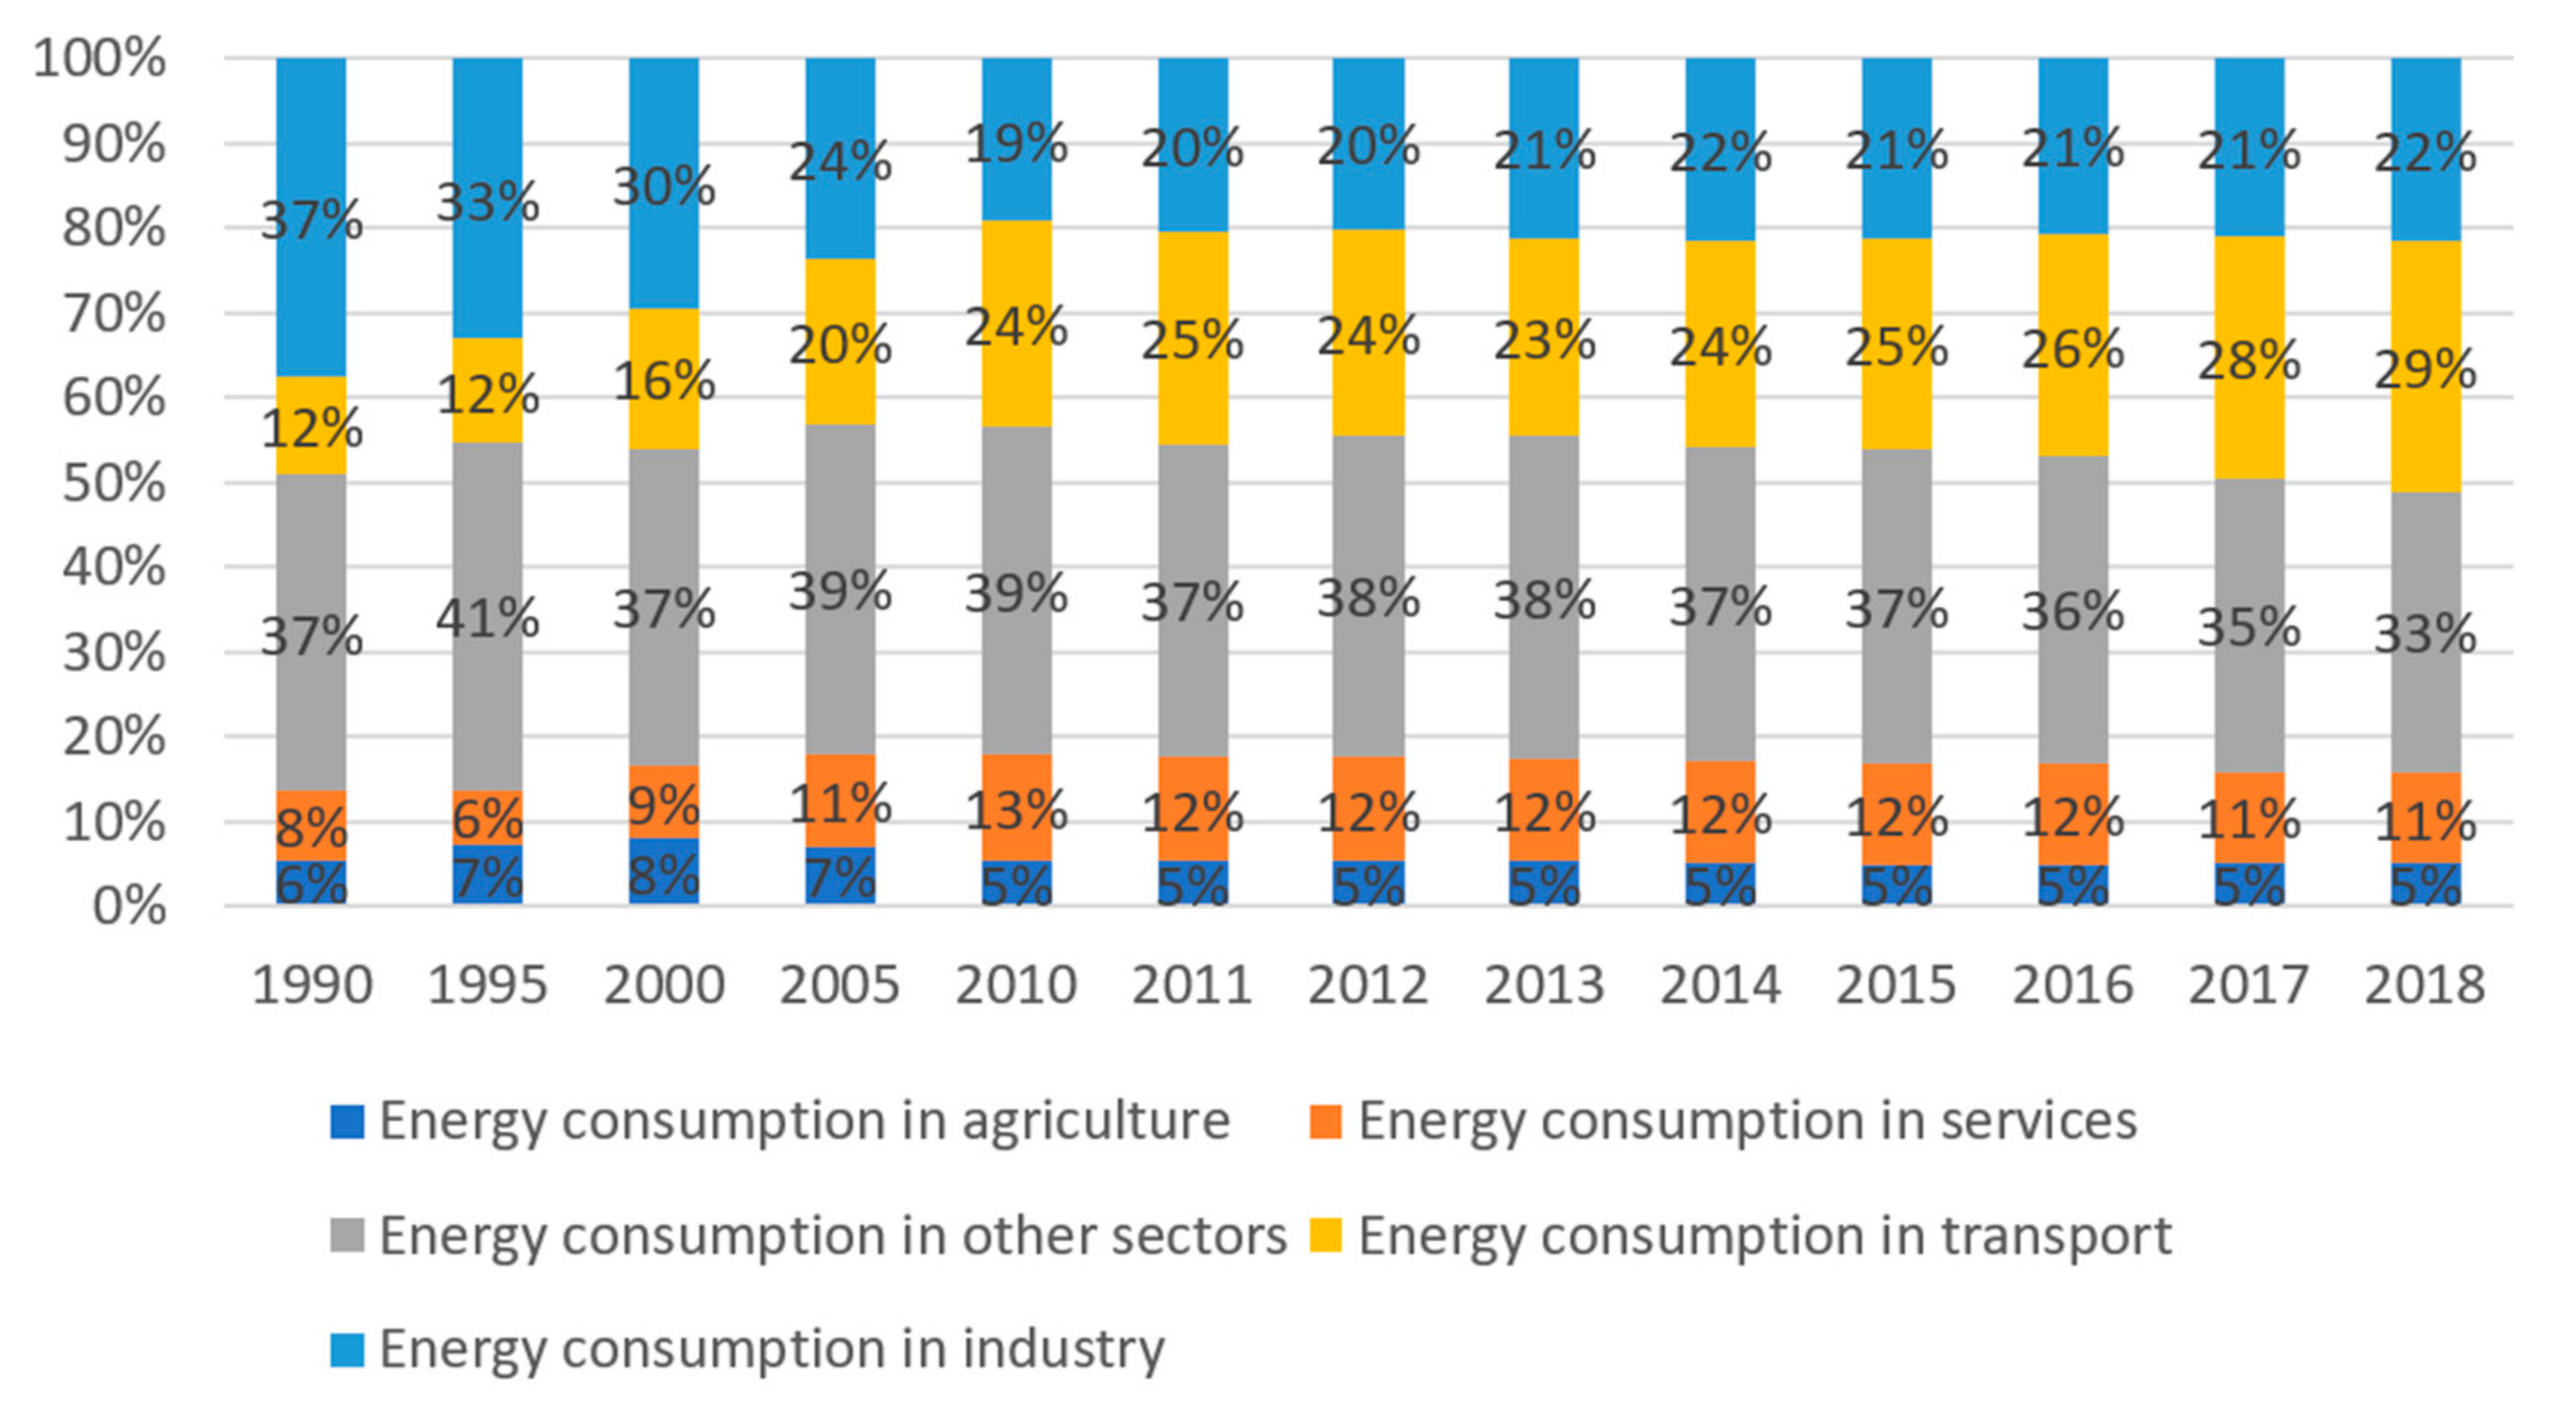
A similar situation to Hungary can be observed in the case of Poland. The energy consumption in agriculture decreased by two percentage points (from 5.47% to 3.19%) (Figure 8). An upward trend was recorded for energy absorption in services in the first part of the analysed period and a downward trend in the latter part (finally 10.54% in 2018). The upward trend was also observed also for transport in the analysed period (from 11.61% in 1990 to 29.49% in 2018). As for industry, a decrease in energy consumption can be seen the first part of the analysed period and after 2010, the absorption was on the same level (more or less 21%).
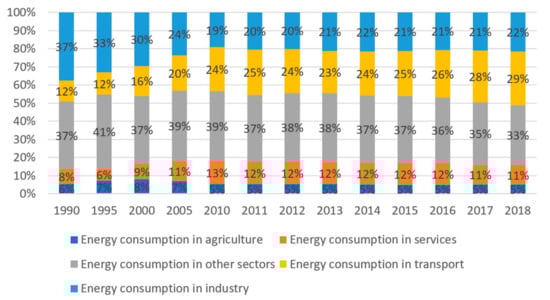
Figure 8.
Structure of energy consumption in Poland in 1990–2018.
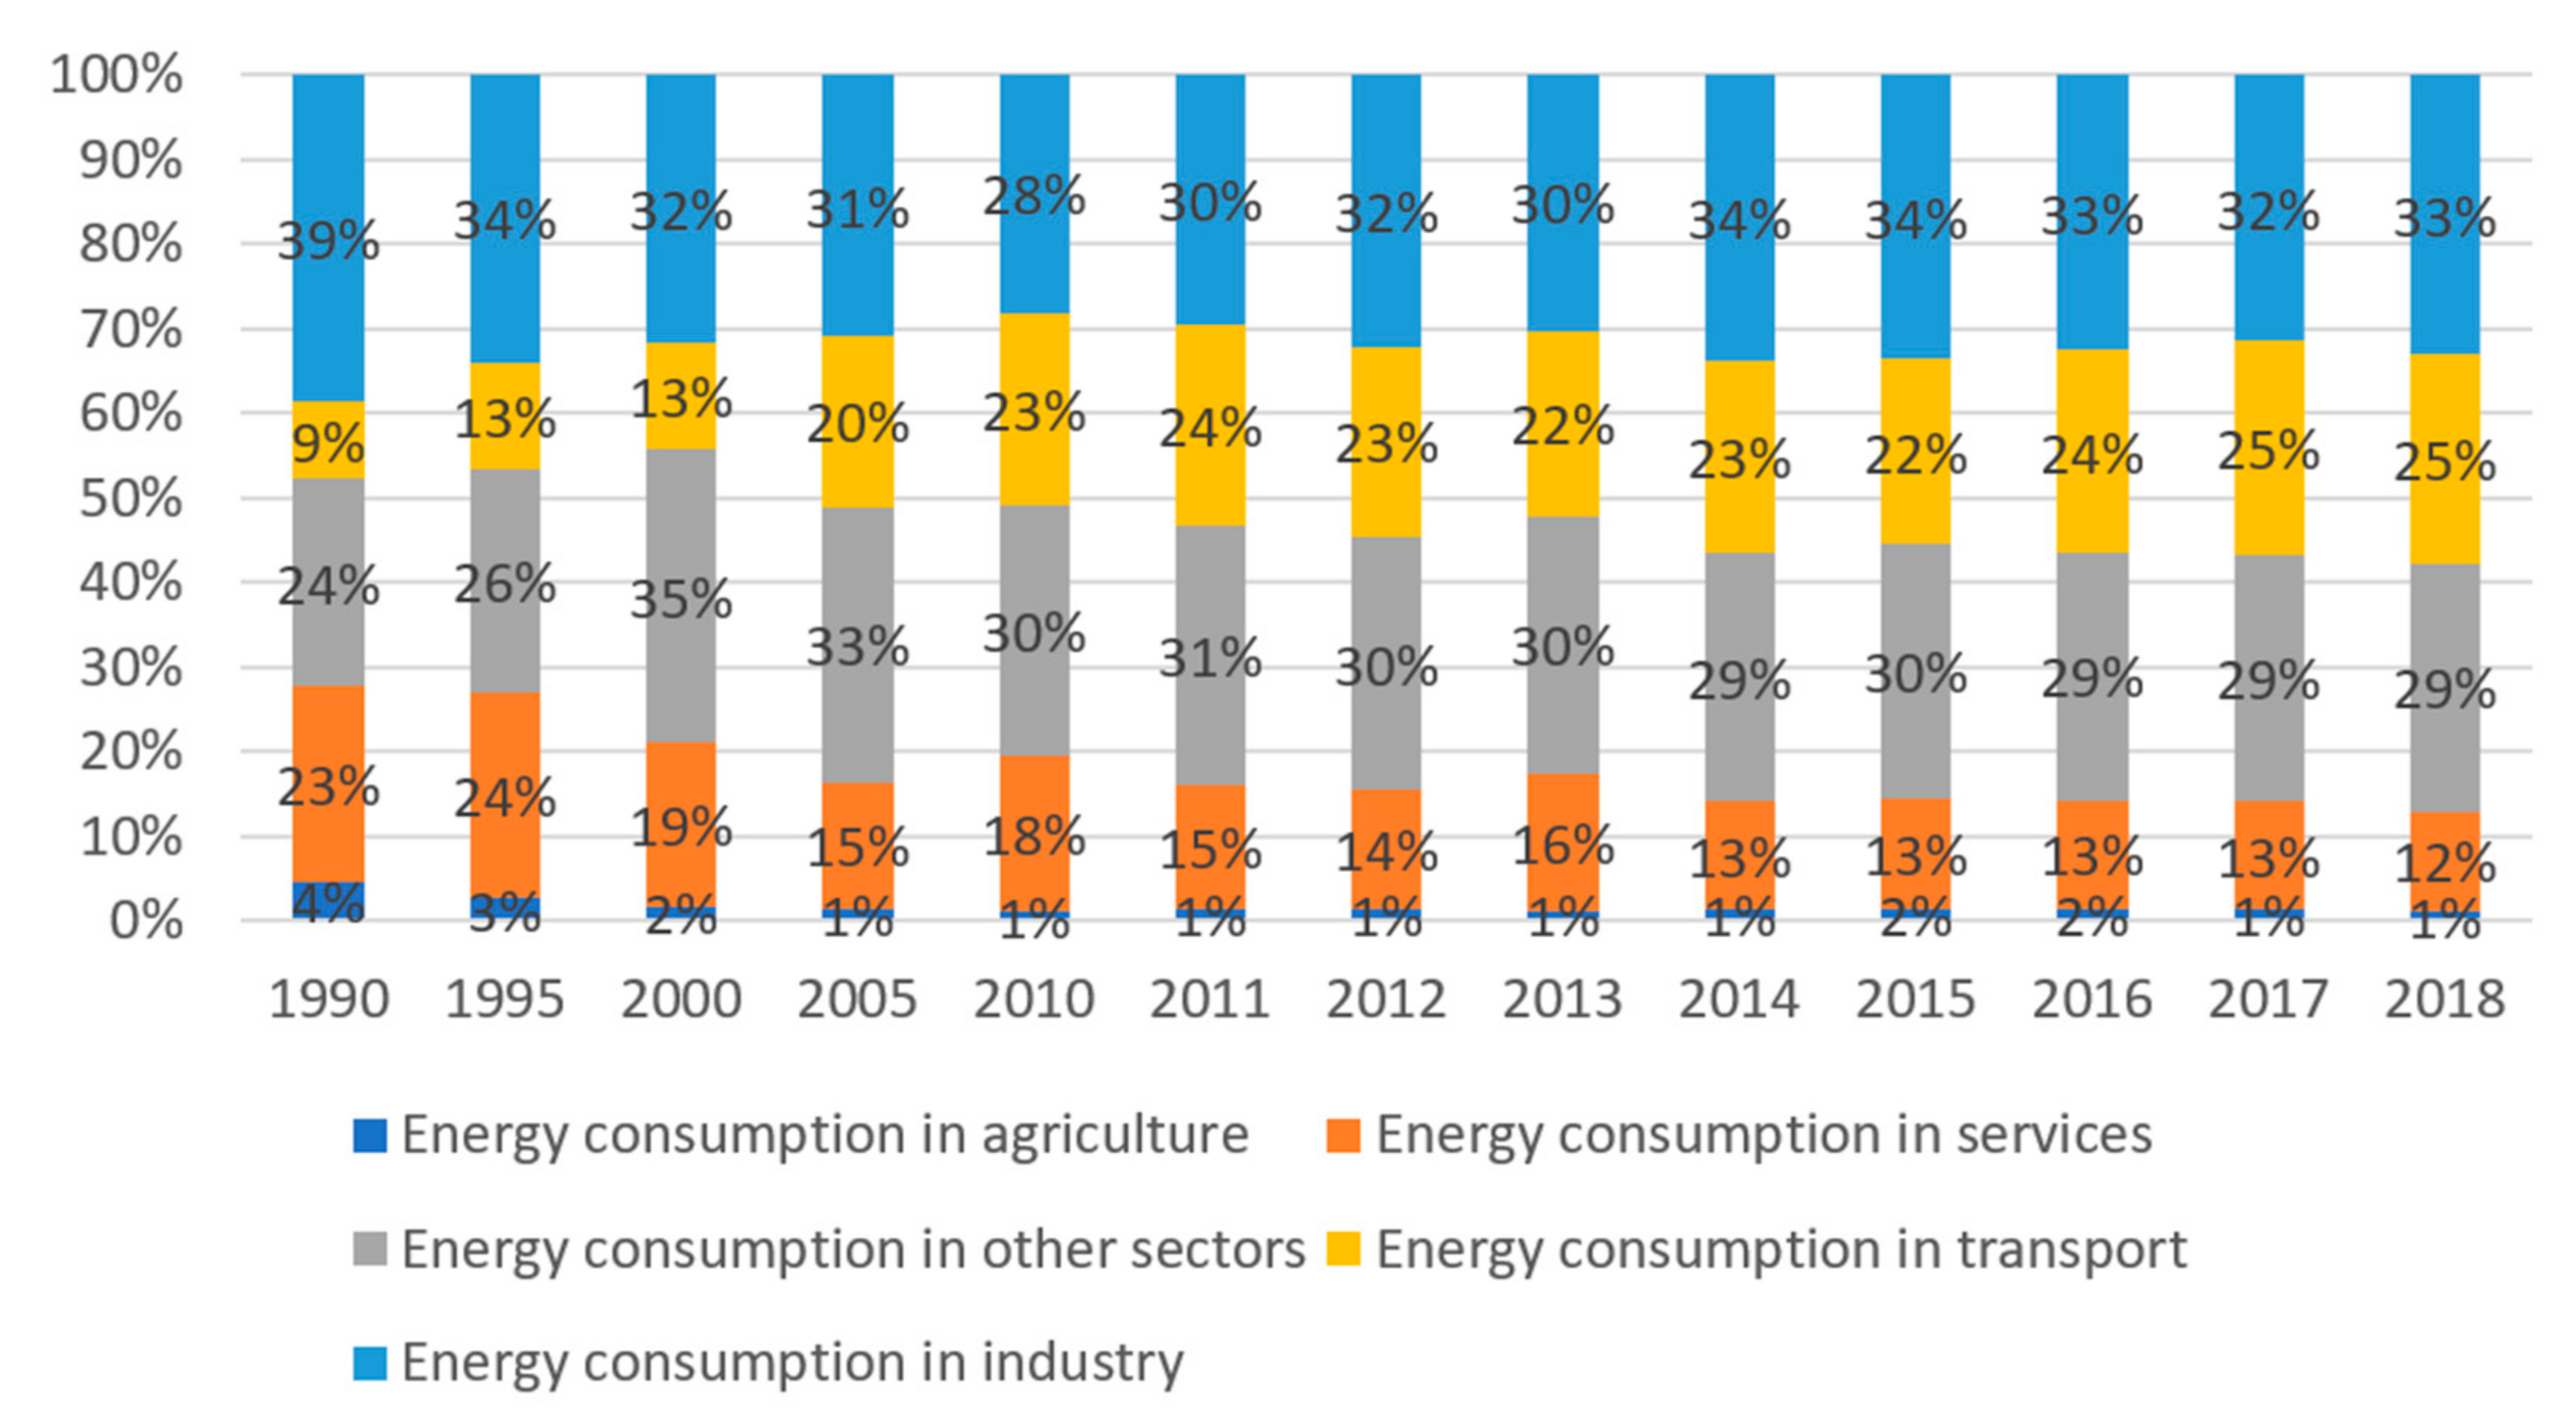
For Slovakia, a higher energy consumption for industry was recorded compared to other Visegrad Group members (33.15% in 2018) (Figure 9). Similarly, the increase in energy absorption in transport was noted in the analysed period (from 9.18% in 1990 to 24.59% in 2018). As for other sectors, after 2010, stable level of energy consumption can be observed (more or less 29%). For the remaining two sectors (services and agriculture), falling trends can be observed: from 23.22% to 11.71% for services and from 4.48% to 1.18 for agriculture.
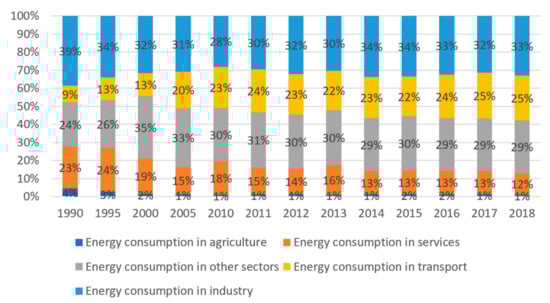
Figure 9.
Structure of energy consumption in Slovakia in 1990–2018.
Changes in the structure of energy consumption in all the Visegrad Group members have a common cause, i.e., economic transformation from a communist regime to the capitalist system. Technological factors seem to have a smaller impact on the changes that occurred.
3.3. Cluster Analysis in the Field of Energy Consumption for EU Countries
In the next step, the analysis was extended by including other states from the European Union to find groups of countries with similar patterns of energy consumption. The analysis was performed for 2018. In the first step, the similarity matrix for 2018 including all 28 states was calculated and presented as a heat-map. Based on that it can be stated that Poland’s energy absorption was similar to Latvia’s energy consumption (Figure 10). In addition, based on the analysis of the heat-map, Hungary’s energy utilization patterns are close to the Czech Republic’s. Moreover, Slovakia’s energy profile was similar to Sweden’s.
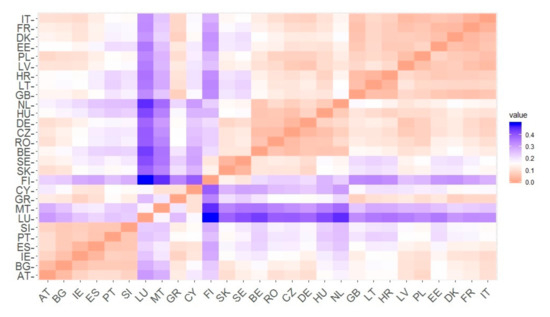
Figure 10.
Visualization of distance matrix for countries of the EU. Countries tagged using ISO Alpha-2 codes. Source: own preparation.
3.3.1. The Results of K-means Clustering
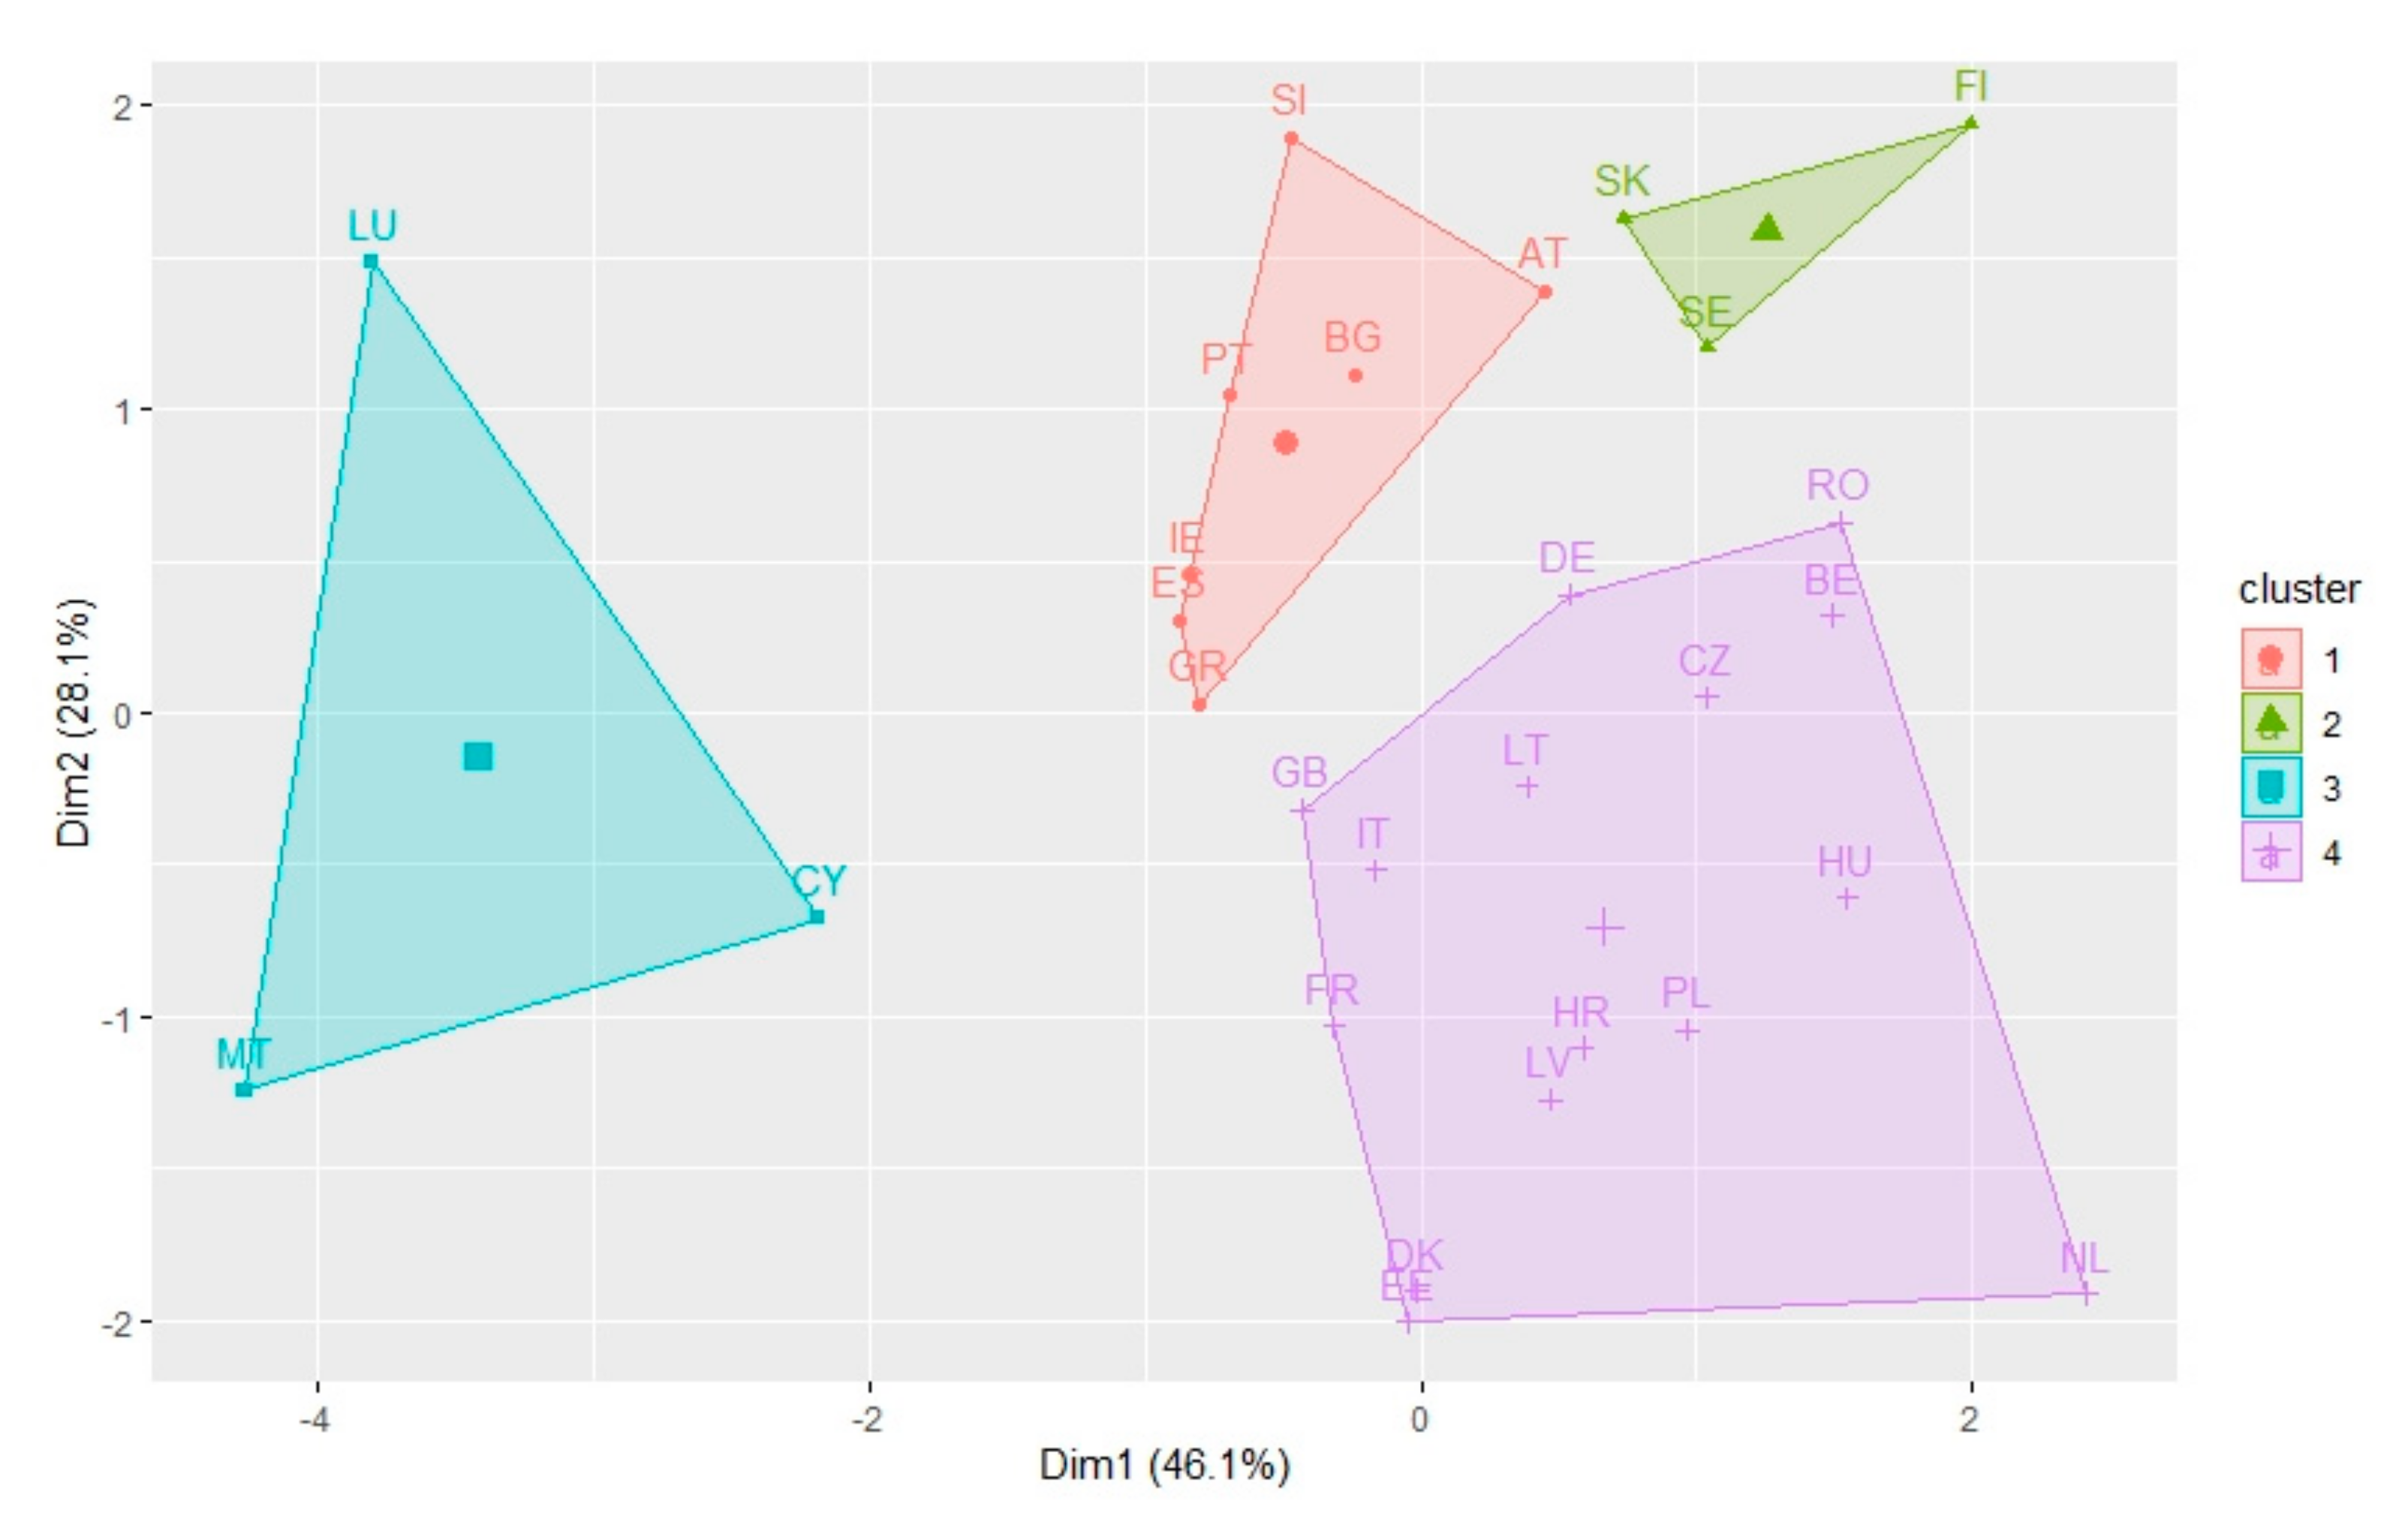
The goal of the analysis was to discover a similar energy consumption profile among the countries by dividing into k clusters in such a way that countries in the same cluster are close to each other. The result of a k-means clustering is a list of clusters with nations assigned to each group. One of the most important steps in this analysis is to determine the number of clusters. To assess the number of clusters, the silhouette index was calculated for a different number of clusters (from 1 to 10) (Figure 11) and, based on the results, the four clusters with the highest values of silhouette index were determined. On the right side of the figure (Figure 11), the silhouette index for each country is shown (assuming four clusters). Based on that, it can be stated that there is no negative value of this index confirming four clusters as optimal for the k-means algorithm. The results of the k-means algorithm after principal component transformation are presented in Figure 12.
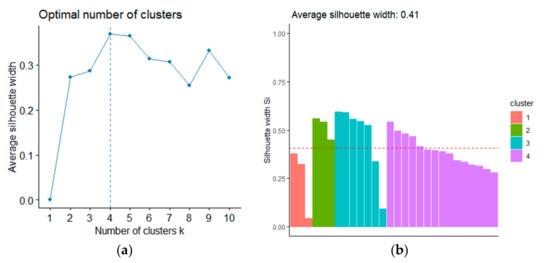
Figure 11.
(a) The average silhouette index for different numbers of clusters, (b)value of silhouette index for each country in k-means clustering.

Figure 12.
The results of k-means clustering after principal component analysis (PCA). Dim1 refers to first principal component, Dim2 refers to second principal component. Source: own preparation.
3.3.2. The Results of Hierarchical Agglomerative Clustering
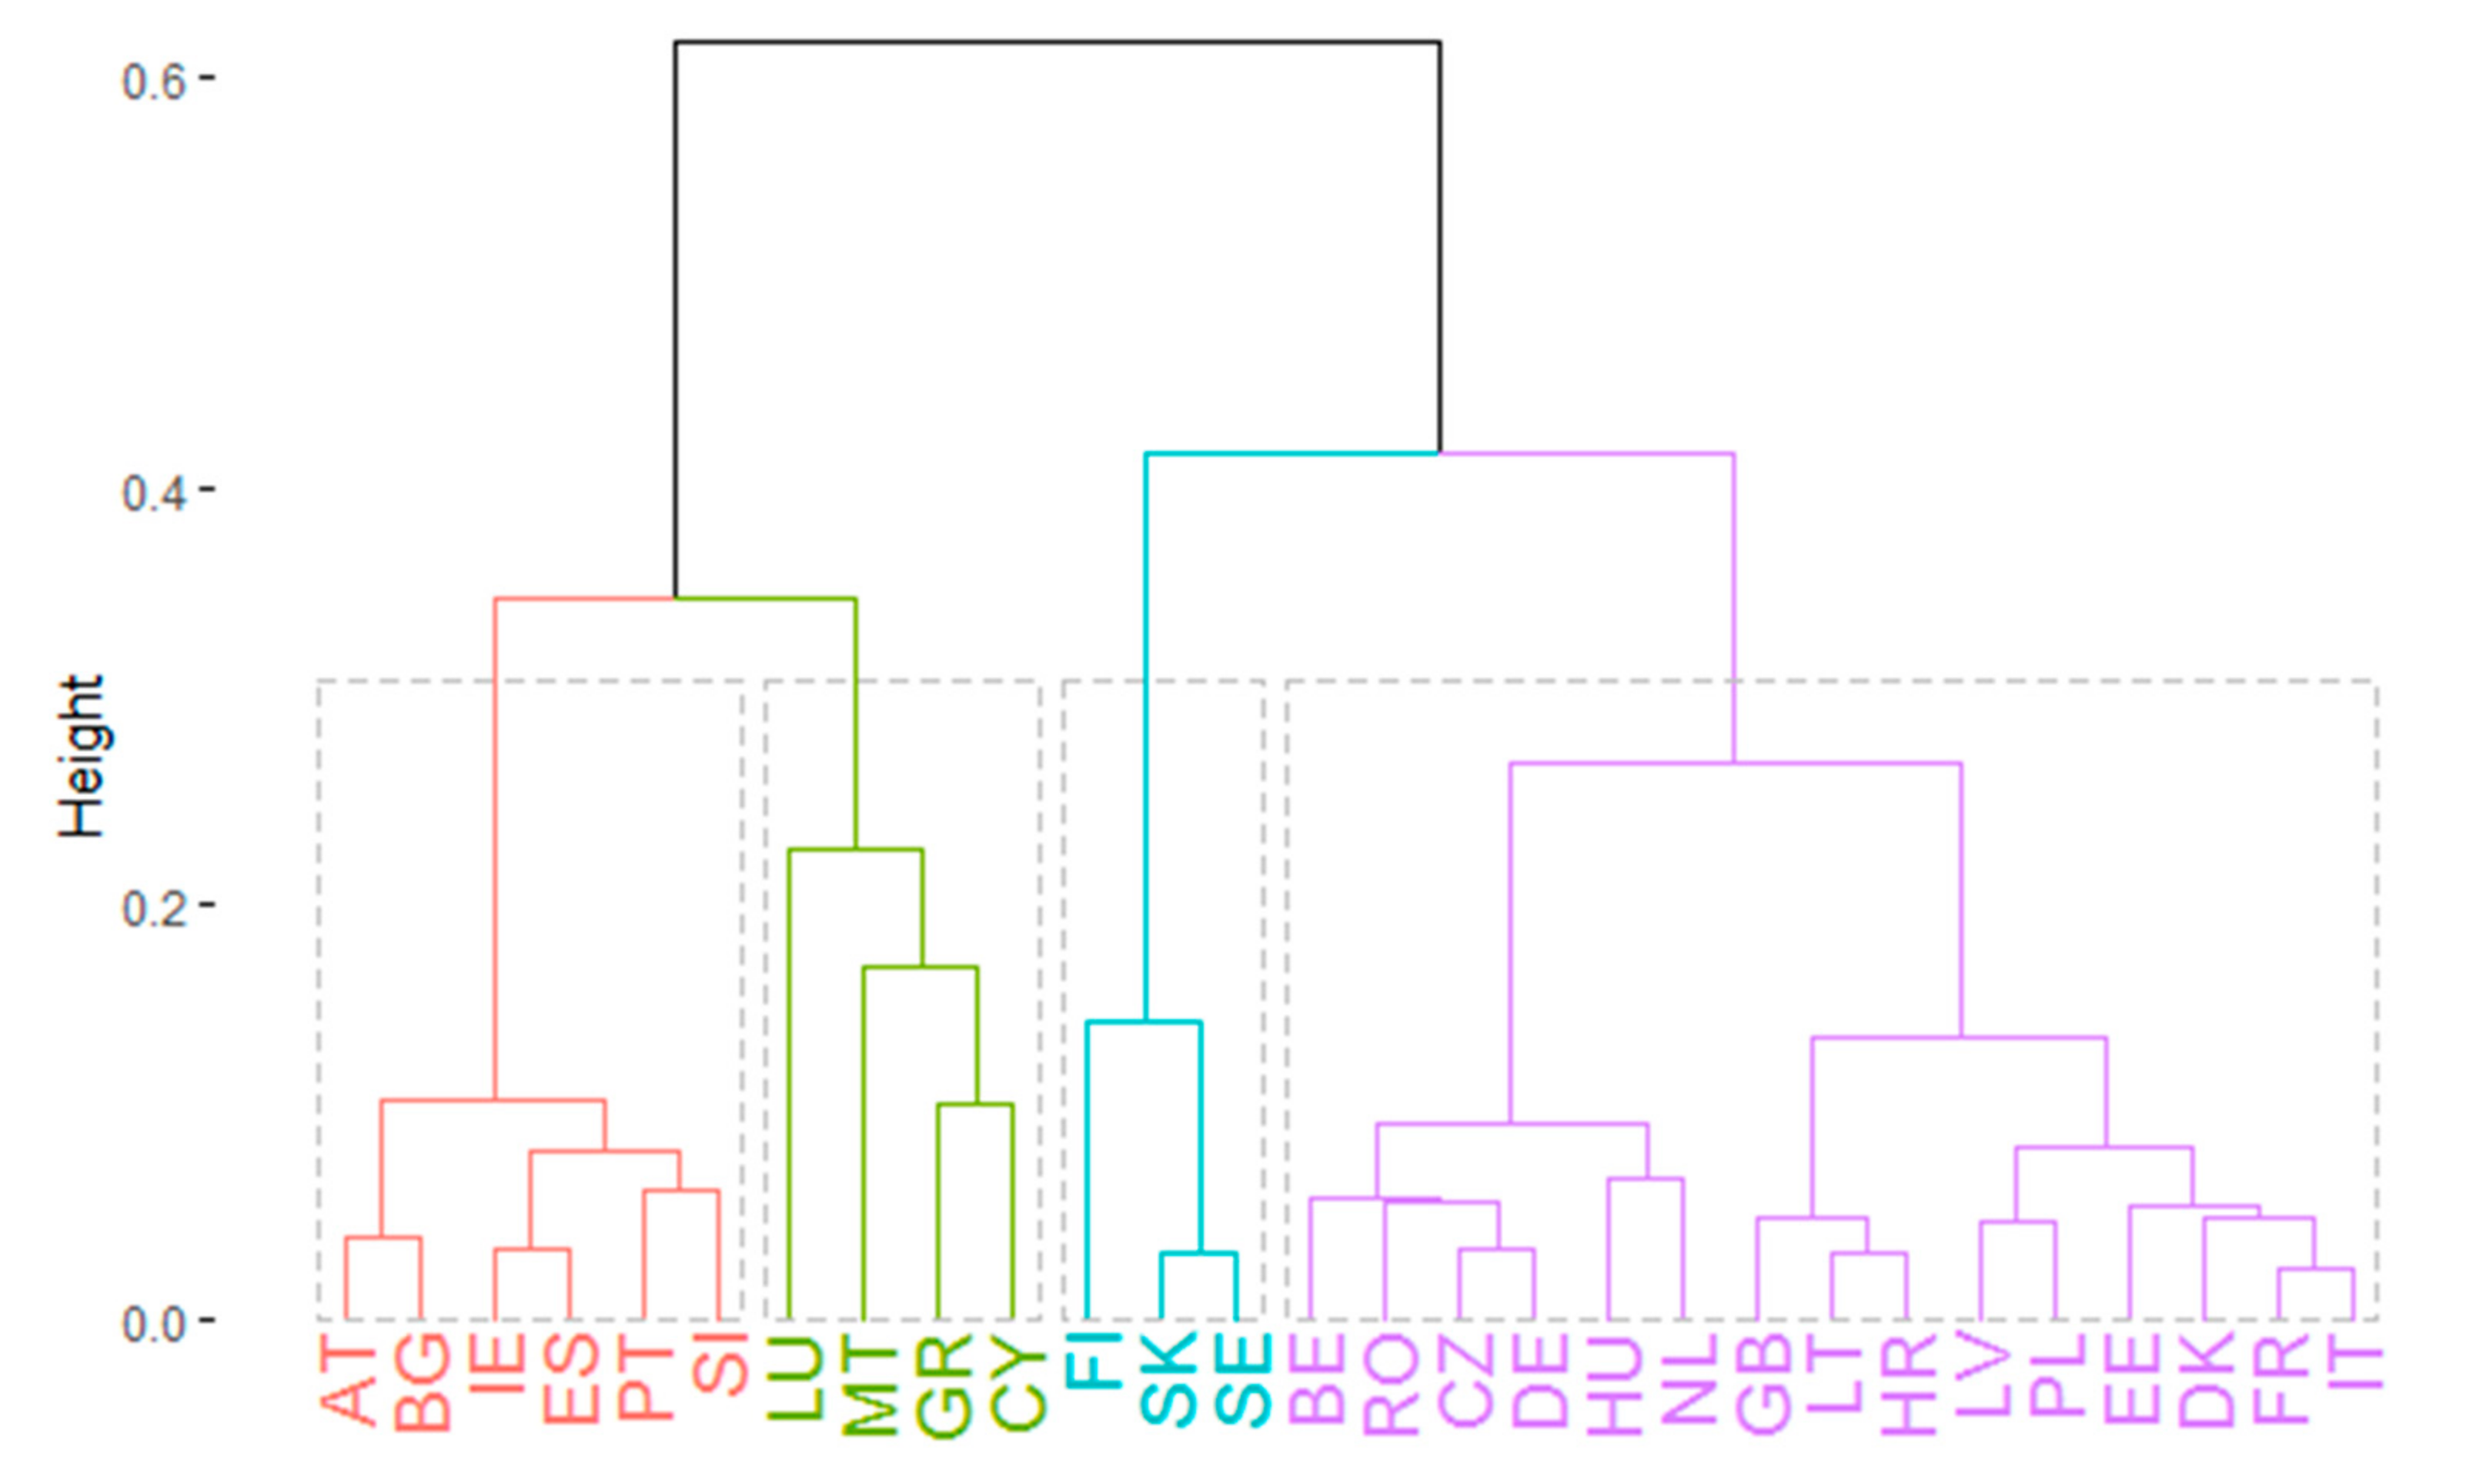
Similar approach was performed for hierarchical agglomerative clustering. The analysis shows that the optimal number of clusters is four (Figure 13). Moreover, the analysis of the silhouette index for each country shows that the index is negative only for one state (i.e., Greece). The negative value may indicate that this nation is not properly clustered. In comparison to k-means clustering, Greece was clustered to two separate clusters. The outcome of hierarchical clustering with the Euclidean distance measure is presented as dendrogram in Figure 14. Poland, Czech Republic, and Hungary were classified into one cluster (the biggest one). In contrast, Slovakia was categorized in another cluster together with Sweden and Finland.
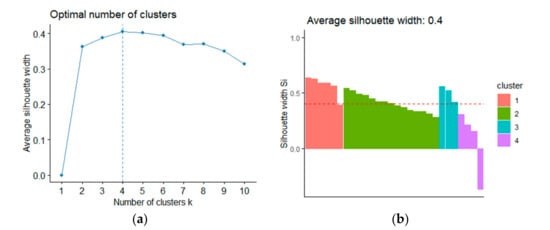
Figure 13.
(a) The average silhouette index for different numbers of clusters, (b) value of silhouette index for each country in hierarchical agglomerative clustering.
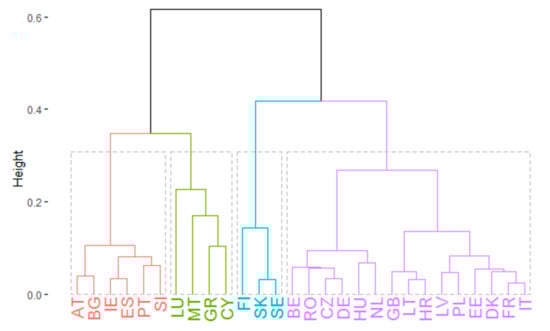
Figure 14.
The dendrogram of hierarchical clustering using Ward’s method for countries from EU. Countries tagged using ISO Alpha-2 codes. Source: own preparation.
3.3.3. The Results of DIANA
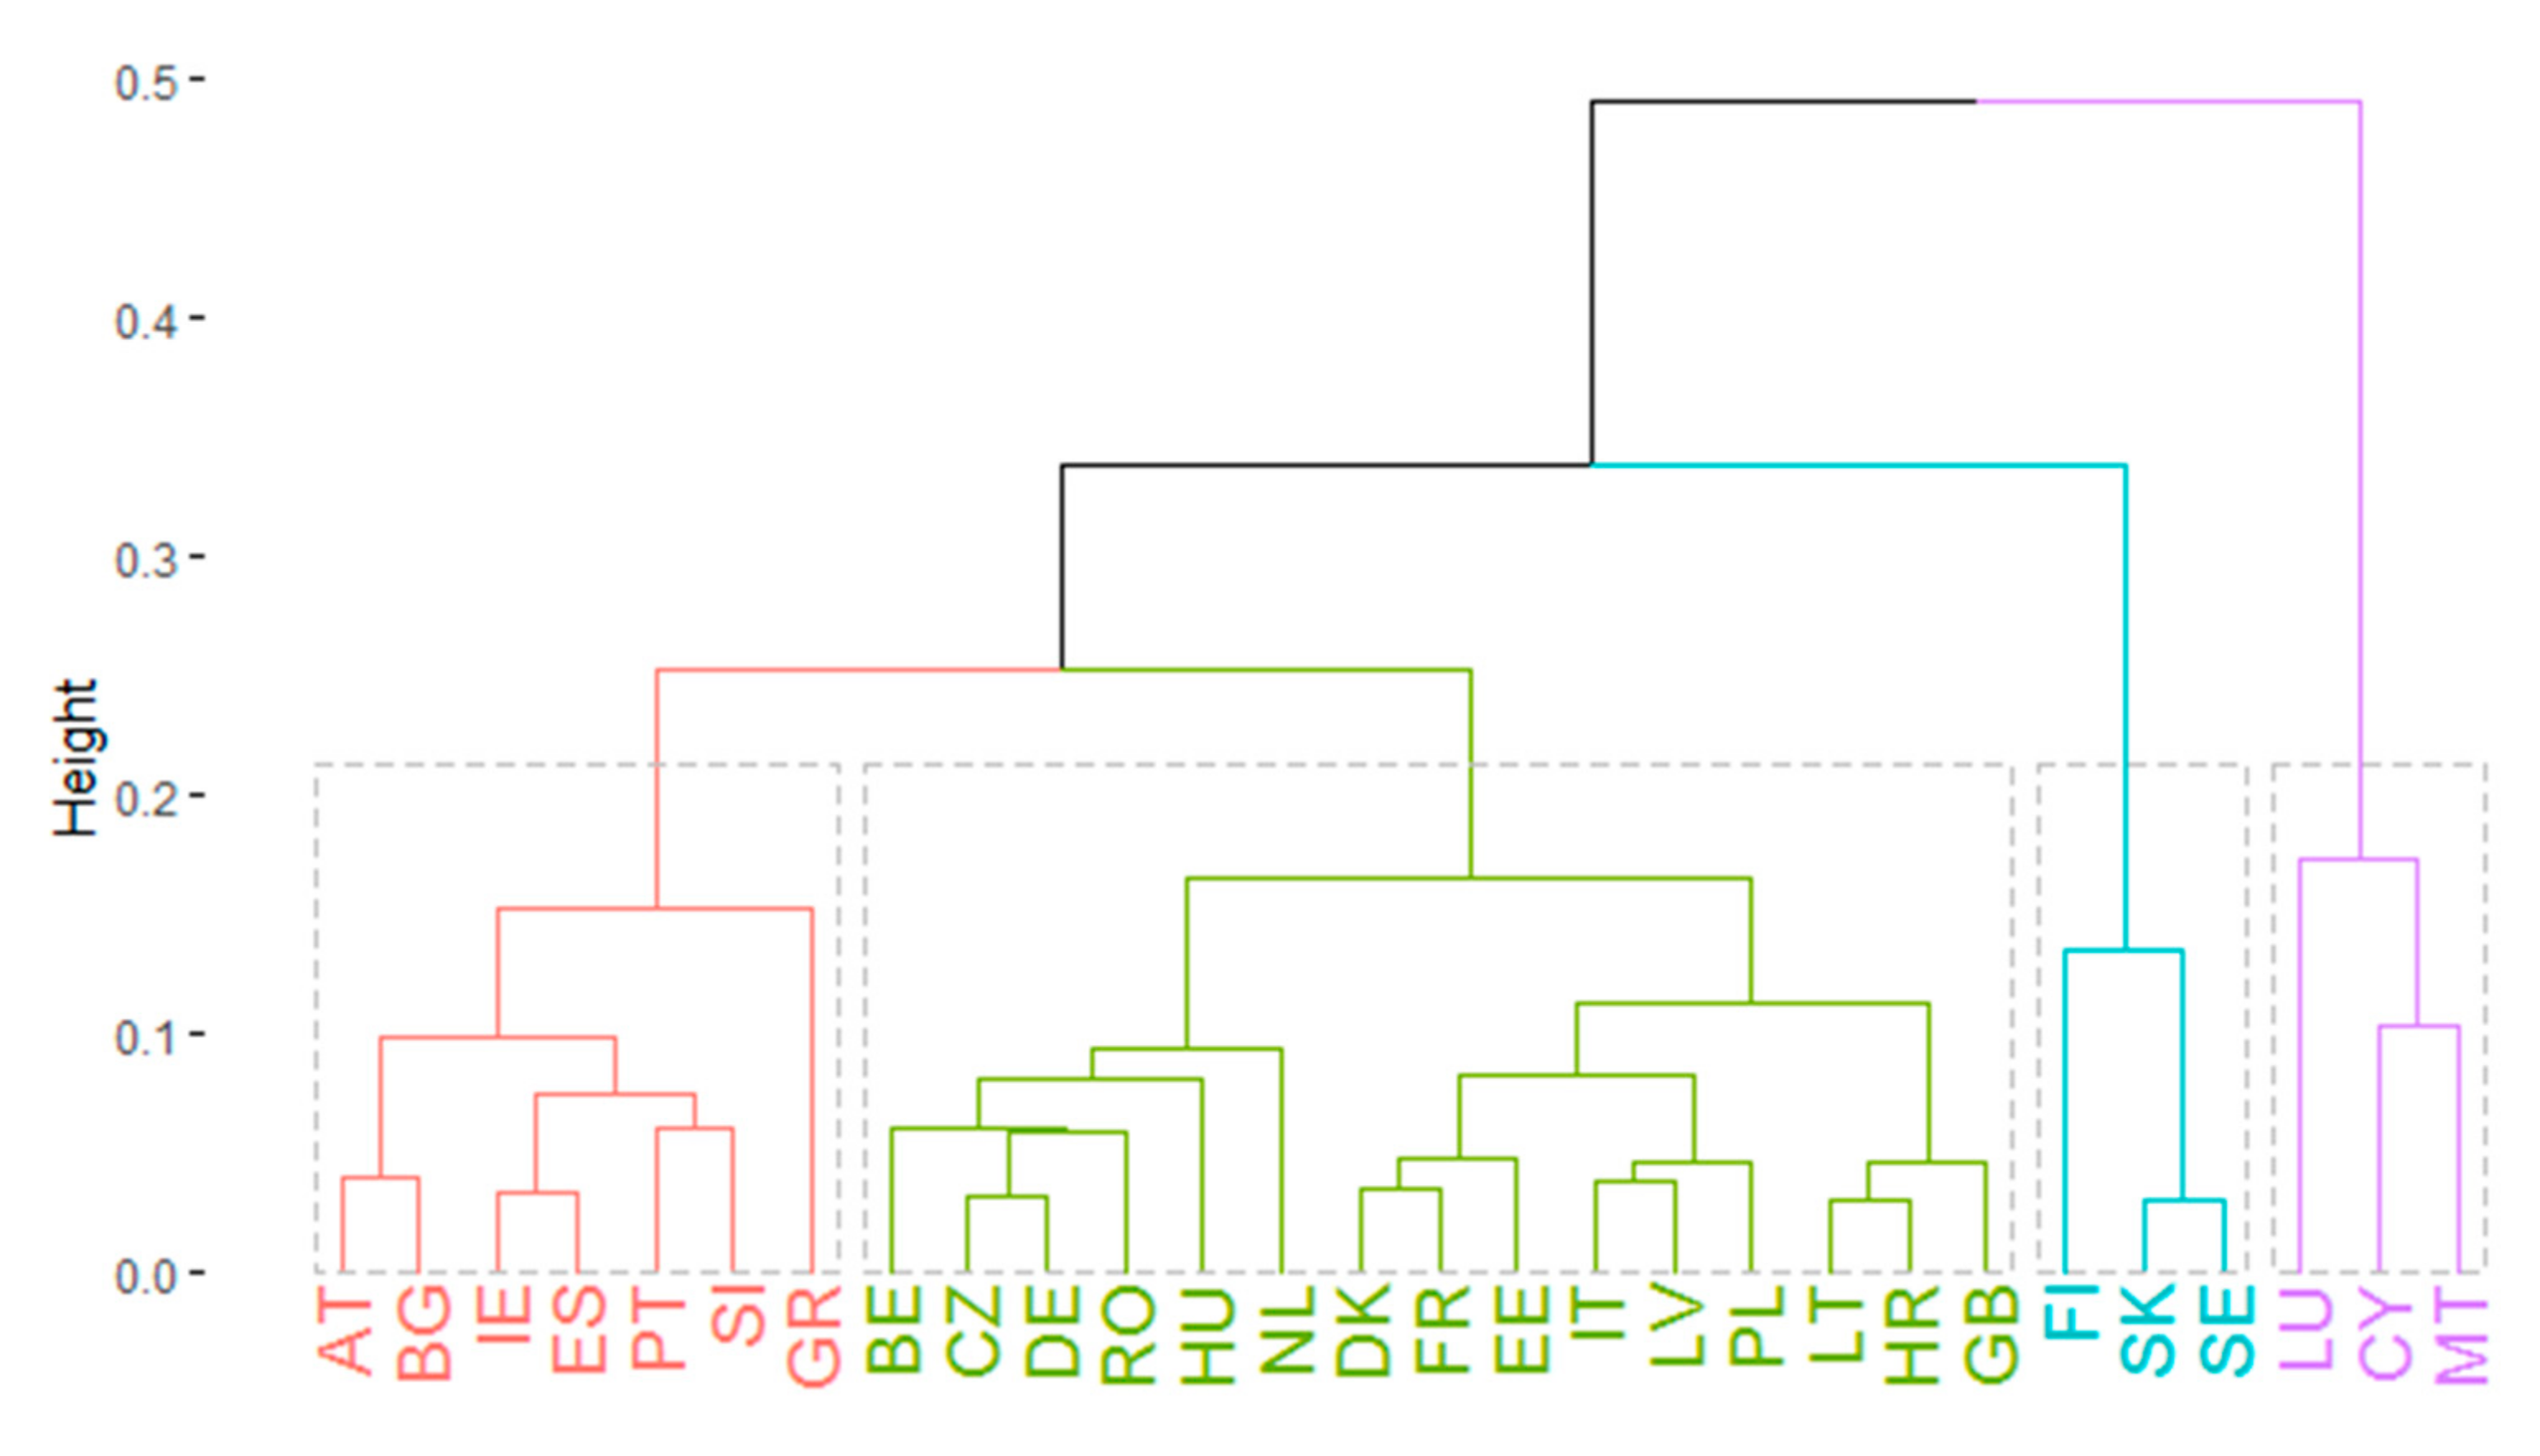
The last algorithm considered was DIANA which is similar to hierarchical clustering. As before, the silhouette index was calculated for a different number of clusters to determine the optimal one. Based on the results, the highest value of the index is for two clusters, but from the analysis perspective, two clusters can be interpreted as oversimplification (Figure 15). The second highest estimation is four and this value is consistent with results of the previous methods. On the right side of the figure (Figure 15), the silhouette index for each country is presented. Assuming four clusters, there is no negative value of the index, which means that countries were properly clustered. The outcome of DIANA clustering is presented as a dendrogram in Figure 16. Similar to the hierarchical clustering, Poland, Czech Republic, and Hungary were classified into one group (the biggest one), and Słovakia was classified into another.
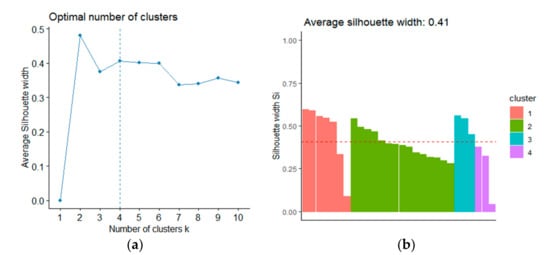
Figure 15.
(a) The average silhouette index for different numbers of clusters, (b) value of silhouette index for each country in DIANA clustering. Source: own preparation.
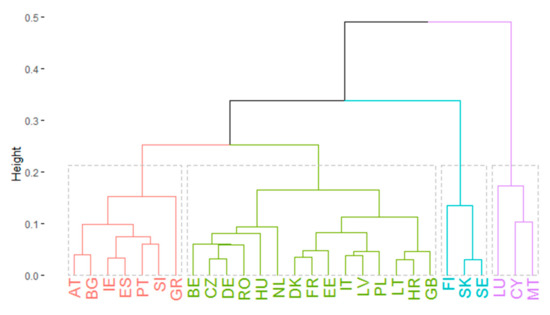
Figure 16.
The dendrogram of DIANA clustering for countries from EU. Countries tagged using ISO Alpha-2 codes.
3.3.4. Assessment of Clustering Techniques
To select the best clustering techniques, the mean value of the silhouette index was calculated for each option. For the k-means clustering and DIANA clustering, the mean estimation of the silhouette index is the same (i.e., 0.406171). For hierarchical aglomerative clustering, the mean is a bit lower (0.4045798). The reason for the lower value could be an incorrect classification of Greece. For the next step, the results of the k-means algorithm were used due to the fact that this method is one of the most frequently used and this technique has the highest estimation of the analysed index.
The values of the Rand and Jaccard indices are presented below (Table 4). Higher values indicate that the final clusters of the two techniques are similar. The results show that k-means and DIANA algorithms clustered countries in a similar way. This is very interesting because the hierarchical and DIANA techniques were expected to have higher values. The Rand index shows higher estimations for hierarchical and DIANA approaches than for the hierarchical and k-means techniques.
Table 4.
The Jaccard and Rand metrics for the analysed techniques.
3.3.5. Energy Consumption Analysis
To assess the energy consumption profile in Europe, the results of the k-means algorithm were used. The EU states were split into four clusters, where two of them contain only three members. The first one (cluster number 3) contains the following countries: Luxembourg, Malta and Cyprus (small countries in terms of area). Additionally, the location of the cluster after principal component analysis is far from other clusters, so this group can be considered an “outlier” cluster (Figure 12). For this cluster, high energy consumption in services and transport can be noticed (Table 5). In addition to that, low energy absorption in agriculture, industry, and other sectors was recorded. The second small cluster is group number 2. For this cluster, three countries were also classified: Sweden, Slovakia, and Finland. For this cluster, the highest energy consumption was in industry (36.75%). At the same time, lower energy absorption was observed in agriculture, services, and transport. The third group contains seven countries: Slovenia, Austria, Bulgaria, Portugal, Ireland, Spain, and Greece, which are mainly southern states of Europe. For this cluster, higher energy consumption can be observed in agriculture, industry, and transport, but at the same time lower energy absorption was recorded in services and other sectors.
Table 5.
The mean values of analysed variables in each cluster.
The rest of the countries were classified into cluster 4 (the biggest one). This group contains 15 states from central and western Europe including Poland, Czech Republic, and Hungary. This cluster can be characterized by the highest energy consumption in agriculture and other sectors and high energy absorption in services. In addition to this, low energy consumption in industry was recorded.
In terms of the Visegrad Group, the clustering confirmed that in the end of the analysed period, Poland’s, Hungary’s and Czech Republic’s energy profiles were very similar. An increase in energy consumption for transport and other sectors and a decrease in industry were noticed. Moreover, as mentioned earlier, Poland’s energy profile is similar to Latvia’s. Slovakia was assigned to the other group where high energy absorption in industry was recorded.
In the last stage of the analysis, the average dynamics of changes in real GDP per capita (US Dollar, 2015) in individual clusters was determined (Table 6). In this way, the pace of economic development in each group can be determined. The highest average annual growth was recorded in cluster 4. This group includes economically developed states of Western Europe, three developing members of the Visegrad Group and three Baltic countries, plus Croatia. The pace of economic development was also quite high in the countries from cluster 3, which included small but economically developed states. The countries of northern Europe and Slovakia were rated the worst. The pace of development was not much better in cluster 1, which included the Southern European category.
Table 6.
Average value of medium-period tempo of change for GDP per capita (US Dollar, 2015) in each cluster.
4. Discussion
The energy intensity of economies is systematically declining. An example of such changes is the case of the United States, which started to reduce energy consumption as a result of the first fuel shock in the 1970s. Efficiency can be improved by better utilization of energy or by abandoning energy-intensive activities [41]. Löschel et al. [42] studied energy absorption in 27 EU countries from 1995–2009. According to these researchers, changes in energy concentration can be attributed to two different factors, i.e., shifts in the industrial structure of the economy, as well as variations in energy efficiency in individual sectors. Pothen and Schymura [43] used data from 40 countries, which accounted for 75% of the global material extraction and 88% of GDP in the years 1995–2008. The authors concluded that there was an increase in material efficiency and a decline in the importance of material and energy intensive sectors. These changes, however, were less dynamic. There was also a significant heterogeneity in this aspect in individual countries. The confirmation of the thesis concerning the impact of technological progress on the reduction of energy intensity of the economy can be found in the study by Gutiérrez-Pedrero et al. [44] (among others), in the case of EU states, and in Chen et al. [45] and Parker and Liddle [46] in the case of OECD members. In turn, according to Gallo [47], the dominant source of dynamics and convergence of electricity concentration are intensities at the sector level, i.e., sectoral energy efficiency, and not the economic structure. Van Benthem [48] found that energy savings from accessing more efficient technologies have been offset by other trends, including the shift to more energy-intensive consumption packages and industrial composition changes such as outsourcing. Mulder [49], in the case of 19 OECD member states, showed that the convergence of energy intensity in production between countries was due to improved productivity in lagging economies and was weakened by growing international differences in the sectoral structure. Energy-intensive sectors have a large impact on energy concentration. Countries often specialize in sectors where they do not have a comparative advantage in energy efficiency. Such patterns were also found by Pappas et al. [50] in the case of a comparison between China, India, and the countries of South Asia. The use of energy in equivalent sectors in China was even several times better than in India. Duan et al. [51] found that greater industrialization resulted in more significant energy consumption of a given region and neighbouring areas. Actions aimed at reducing energy absorption should be undertaken regionally. The results obtained in our research are similar. A decrease in the energy consumption of the economies of the Visegrad Group members was found. Based on this literature review, the reason for such regularities can be substantiated. The decrease in energy intensity in the long term resulted from shifts in the industrial structure of the economy and the increase in energy efficiency in individual sectors. In addition, the countries of the Visegrad Group underwent a significant transformation in respective sectors. New technologies were introduced. Other authors also took note of this. In member states the Visegrad Group, a decline in the importance of heavy (material-consuming) and energy-consuming industries can also be noticed. Other researchers also pointed out such tendencies in their literature reviews. One should also mention the cohesion (unification) of the sectoral structure in the countries of the Visegrad group with other EU states. An example of this is the classification in the cluster analysis of three countries from the Visegrad group to one group with the countries of Western Europe. This means that the energy consumption structure in terms of sectors in Poland, the Czech Republic, and Hungary, has harmonized with that of the highly developed economies. Slovakia, in turn, was included in the same group as Finland and Sweden. These were also economically developed countries with a little bit more importance for industry. The reason for these changes, apart from sectoral shifts, was the improvement in productivity in developing countries from the Visegrad Group. Of course, complete unification of the sectoral structure of economies in the EU states will never happen due to the specialization in production in individual countries.
A change in the production structure in the economy may affect the relation between energy consumption and production due to the fact that various industries may be characterized by different energy consumption. There are several examples confirming this hypothesis. First of all, it is necessary to analyse highly developed economies that underwent an economic transformation in the long term. An example is Japan. Han and Lakshmanan [52] examined the effects of the pervasive structural changes in the Japanese economy on its energy intensity in 1975–1985. It was found that shifts in the final demand structure contributed more to reducing the economy’s energy intensity than the much-discussed effects of technological development. Shifts in the demand structure also caused changes in the composition of the economy and energy concentration in the Visegrad Group member states. Kahrl and Roland-Holst [53] using the example of China, also found a relationship between structural changes in the economy and energy consumption patterns. The data concerned the years 1997–2004. Admittedly, it is a short period, but the Chinese economy was one of the fastest growing, so these variations were visible. A long-term study by Zhang and Lahr [54] on China from 1987–2007, shows some regularities. China produced more energy-intensive goods for capital investment and export. China is an example of a country with high economic development and advanced energy-intensive activities. The Visegrad Group members have chosen a different path of transformation. The structure of their economies has become less energy intensive.
Interesting research was carried out by González et al. [55]. They examined the evolution of energy efficiency in 20 European states between 1995 and 2010. The results show that European countries, especially former communist states, made a great effort to improve the productivity of energy. In post-communist countries, promotion and adaptation to more efficient techniques, innovation, better use of technology, research and development, and replacement of high-quality energy have been used. Such activities mainly concerned industry and transport. González [56] has also investigated most EU economies in other studies. He described the impact of shifts in sectoral composition of these economies on aggregate energy consumption. He determined the greater importance of the intensity ratio over structural changes, the positive impact of structural shifts in some post-communist countries, and the significant, negative contribution of the industrial sector to changes in aggregate energy concentration. These results are consistent with those obtained in our research on the Visegrad Group member states. They also explain the reasons for the shifts in energy consumption.
The economies of the Visegrad Group members need constant adoption of more efficient techniques, innovations, research, and development. These strategies should be accompanied by other policies aimed at accelerating the processes of economic transformation. Despite the changes made, there are still subsectors that require modification.
The literature review shows no current research on the relationship between the transformation of the economic structure and energy consumption. Moreover, there are no studies on EU countries, including the Visegrad Group. Therefore, this article is valuable and fills the research gap.
5. Conclusions
Over the period studied, the total primary energy supply in the countries of the Visegrad Group was decreasing in the long term. The trends were similar to those for the entire EU. Only in Poland was there was a slight increase in this parameter. Energy productivity is also an important parameter. There was a systematic increase in this indicator, which was positive. The trends were quite similar to those in the EU. The total dynamics of productivity growth over the nine years (2010–2018) were similar in the member states of the Visegrad group to the average for the EU. This means that the Visegrad Group members did not actually improve their energy productivity compared to the EU standard. Thus, hypothesis 1 was rejected. The reason may be the increasingly faster implementation of modern technologies in highly developed economies of Western Europe compared to economically developing countries, which include the Visegrad Group members.
The last parameter is energy intensity. The trends were very similar to those in the case of total primary energy supply. For all energy-related parameters, there were similarities between the countries of the Visegrad group and the entire EU (or the average for this group). However, it is necessary to mention the large changes in energy parameters in the Visegrad Group members in the 1990s. At that time economy was transforming, which also influenced energy consumption and its use.
The transition of the economy had a very large impact on changing the structure of energy absorption by sector. Industry and agriculture lost their importance. On the other hand, the transport and service sectors benefited. After the rapid changes in the 1990s, there was a relative stabilization, especially since the accession of the Visegrad Group countries to the EU in 2004. Additionally, there has been some standardization of patterns related to the structure of sectoral energy consumption in the EU.
After careful investigation, it turned out that individual EU states differ from each other in terms of the structure of sectoral energy absorption. The analysis was performed for 2018, so it could seem that the economies of individual countries have unified. As a result of the cluster analysis, all EU states were divided into four groups. Poland, the Czech Republic, and Hungary found themselves in one group, along with most of the countries of Western Europe. This may mean that the economic systems of these countries have become unified with highly developed economies. Slovakia found itself in a group of states with a greater importance of industry. Hypothesis 2 was therefore not confirmed.
The presented analysis shows that the economic transformation in the 1990s and the adjustment processes after the accession to the EU of the Visegrad Group members led to a significant unification of the structure of the sectoral energy consumption. Of course, there are still differences. There will probably never be full harmonization, since countries specialize in certain activities. For example, the Czech Republic puts emphasis on the automotive and engineering industries. The dominant sector in Slovakia is the automotive industry, the production of machines, mechanical devices, and electrical equipment and their parts. In Poland, construction and transport services as well as telecommunications and information services were concentrated. Poland was also a significant exporter of food. On the other hand, the automotive, energy, and financial sectors dominated Hungary. As a result of globalization and the functioning of the common market in the EU, many production technologies are similar, with homogeneous energy consumption.
Generally, there is little research on the relationship between a national level of economic development and energy consumption in economic sectors. Additionally, there are no current studies on EU states, concerning this topic. Therefore, the article is innovative and fills the research gap in this area. The study complements the contribution to the theory. From a practical point of view, it shows the impact of the transformation of the economy on shifts in energy consumption in individual sectors, which may be a model of changes in this area.
Further research may extend the analysis to other groups of countries in other continents. This would allow for the comparison of patterns of change in different areas of the world. For example, it will be possible to determine how energy consumption has changed in individual countries due to the transformation of the economy. Another direction is to check the harmonization of respective sectors in groups of countries globally, including the determination of the degree of comparability in the energy consumption model.
Author Contributions
Conceptualization, M.G. and T.R.; methodology, M.G. and T.R.; software, M.G.; validation, L.O., G.K. and M.R.; formal analysis, K.W. and H.S.; investigation, P.B. and A.B.-B.; resources, M.R.; data curation, M.G.; writing—original draft preparation, M.G. and T.R.; writing—review and editing, L.O. and G.K.; visualization, M.G.; supervision, M.G. and T.R. All authors have read and agreed to the published version of the manuscript.
Funding
This research received no external funding.
Institutional Review Board Statement
Not applicable.
Informed Consent Statement
Not applicable.
Data Availability Statement
Publicly available datasets were analyzed in this study. This data can be found here: https://data.oecd.org/ accessed on 14 July 2021.
Conflicts of Interest
The authors declare no conflict of interest.
Abbreviations
| Abbreviation | Meaning |
| level of the phenomenon in t period | |
| level of the phenomenon t−1 period | |
| chain dynamic indicators | |
| variable i | |
| cluster j | |
| binary coefficient with a value equal to one or zero depending on cluster assignment | |
| Euclidean distance between the assigned point and cluster center | |
| average dissimilarity of object i and all other objects in the same cluster | |
| the smallest average dissimilarity of object i to all other clusters, of which i is not a member | |
| Silhouette index | |
| number of observation pairs where both observations are comembers in both clusterings | |
| number of observation pairs where the observations are comembers in the first clustering but not the second | |
| number of observation pairs where the observations are comembers in the second clustering but not the first | |
| number of observation pairs where neither pair are comembers in either clustering |
References
- Malinauskaite, J.; Jouhara, H.; Ahmad, L.; Milani, M.; Montorsi, L.; Venturelli, M. Energy efficiency in industry: EU and national policies in Italy and the UK. Energy 2019, 172, 255–269. [Google Scholar] [CrossRef]
- Rokicki, T.; Perkowska, A.; Klepacki, B.; Bórawski, P.; Bełdycka-Bórawska, A.; Michalski, K. Changes in Energy Consumption in Agriculture in the EU Countries. Energies 2021, 14, 1570. [Google Scholar] [CrossRef]
- Rokicki, T.; Ratajczak, M.; Bórawski, P.; Bełdycka-Bórawska, A.; Gradziuk, B.; Gradziuk, P.; Siedlecka, A. Energy Self-Subsistence of Agriculture in EU Countries. Energies 2021, 14, 3014. [Google Scholar] [CrossRef]
- Alcantara, V.; Duro, J.A. Inequality of energy intensities across OECD countries: A note. Energy Policy 2004, 32, 1257–1260. [Google Scholar] [CrossRef]
- Rokicki, T.; Perkowska, A. Diversity and Changes in the Energy Balance in EU Countries. Energies 2021, 14, 1098. [Google Scholar] [CrossRef]
- Rokicki, T.; Perkowska, A. Changes in Energy Supplies in the Countries of the Visegrad Group. Sustainability 2020, 12, 7916. [Google Scholar] [CrossRef]
- Le Pen, Y.; Sévi, B. On the non-convergence of energy intensities: Evidence from a pair-wise econometric approach. Ecol. Econ. 2010, 69, 641–650. [Google Scholar] [CrossRef] [Green Version]
- Markandya, A.; Pedroso-Galinato, S.; Streimikiene, D. Energy intensity in transition economies: Is there convergence towards the EU average? Energy Econ. 2006, 28, 121–145. [Google Scholar] [CrossRef]
- Liddle, B. Revisiting world energy intensity convergence for regional differences. Appl. Energy 2010, 87, 3218–3225. [Google Scholar] [CrossRef]
- Jakob, M.; Haller, M.; Marschinski, R. Will history repeat itself? Economic convergence and convergence in energy use patterns. Energy Econ. 2012, 34, 95–104. [Google Scholar] [CrossRef]
- Mulder, P.; De Groot, H.L. Structural change and convergence of energy intensity across OECD countries, 1970–2005. Energy Econ. 2012, 34, 1910–1921. [Google Scholar] [CrossRef] [Green Version]
- Mishra, V.; Smyth, R. Convergence in energy consumption per capita among ASEAN countries. Energy Policy 2014, 73, 180–185. [Google Scholar] [CrossRef]
- Payne, J.E.; Vizek, M.; Lee, J. Stochastic convergence in per capita fossil fuel consumption in US states. Energy Econ. 2017, 62, 382–395. [Google Scholar] [CrossRef]
- Le, T.H.; Chang, Y.; Park, D. Energy demand convergence in APEC: An empirical analysis. Energy Econ. 2017, 65, 32–41. [Google Scholar] [CrossRef]
- Chen, Y.; Lee, C.C. Does technological innovation reduce CO2 emissions? Cross-country evidence. J. Clean. Prod. 2020, 263, 121550. [Google Scholar] [CrossRef]
- Herrerias, M.J. World energy intensity convergence revisited: A weighted distribution dynamics approach. Energy Policy 2012, 49, 383–399. [Google Scholar] [CrossRef]
- Cheong, T.S.; Li, V.J.; Shi, X. Regional disparity and convergence of electricity consumption in China: A distribution dynamics approach. China Econ. Rev. 2019, 58, 101154. [Google Scholar] [CrossRef]
- Parker, S.; Liddle, B. Economy-wide and manufacturing energy productivity transition paths and club convergence for OECD and non-OECD countries. Energy Econ. 2017, 62, 338–346. [Google Scholar] [CrossRef]
- Rokicki, T.; Perkowska, A.; Klepacki, B.; Szczepaniuk, H.; Szczepaniuk, E.K.; Bereziński, S.; Ziółkowska, P. The Importance of Higher Education in the EU Countries in Achieving the Objectives of the Circular Economy in the Energy Sector. Energies 2020, 13, 4407. [Google Scholar] [CrossRef]
- Lee, C.C.; Chang, C.P. Energy consumption and economic growth in Asian economies: A more comprehensive analysis using panel data. Resour. Energy Econ. 2008, 30, 50–65. [Google Scholar] [CrossRef]
- Wen, H.; Lee, C.C. Impact of environmental labeling certification on firm performance: Empirical evidence from China. J. Clean. Prod. 2020, 255, 120201. [Google Scholar] [CrossRef]
- Zhao, C.P.; Gukasyan, G.; Bezpalov, V.; Prasolov, V. Development of modern standards for energy efficiency of industrial enterprises within the European Union policy. Int. J. Energy Econ. Policy 2020, 10, 451. [Google Scholar] [CrossRef]
- Hassan, Y.A.; Isiaka, M.A. Convergence in electricity consumption among selected West African Countries. Colombo Bus. J. 2019, 10, 1–18. [Google Scholar] [CrossRef]
- Steckel, J.C.; Brecha, R.J.; Jakob, M.; Strefler, J.; Luderer, G. Development without energy? Assessing future scenarios of energy consumption in developing countries. Ecol. Econ. 2013, 90, 53–67. [Google Scholar] [CrossRef]
- Arto, I.; Capellán-Pérez, I.; Lago, R.; Bueno, G.; Bermejo, R. The energy requirements of a developed world. Energy Sustain. Dev. 2016, 33, 1–13. [Google Scholar] [CrossRef] [Green Version]
- Hao, Y.; Liao, H.; Wei, Y.M. Is China’s carbon reduction target allocation reasonable? An analysis based on carbon intensity convergence. Appl. Energy 2015, 142, 229–239. [Google Scholar] [CrossRef]
- Kim, Y.S. Electricity consumption and economic development: Are countries converging to a common trend? Energy Econ. 2015, 49, 192–202. [Google Scholar] [CrossRef]
- Cheshmehzangi, A. Low carbon transition at the township level: Feasibility study of environmental pollutants and sustainable energy planning. Int. J. Sustain. Energy 2021, 40, 670–696. [Google Scholar] [CrossRef]
- Mahmood, T.; Ahmad, E. The relationship of energy intensity with economic growth: Evidence for European economies. Energy Strategy Rev. 2018, 20, 90–98. [Google Scholar] [CrossRef]
- Acaravci, A.; Ozturk, I. On the relationship between energy consumption, CO2 emissions and economic growth in Europe. Energy 2010, 35, 5412–5420. [Google Scholar] [CrossRef]
- Judson, R.A.; Schmalensee, R.; Stoker, T.M. Economic development and the structure of the demand for commercial energy. Energy J. 1999, 20, 29–57. [Google Scholar] [CrossRef] [Green Version]
- Medlock III, K.B.; Soligo, R. Economic development and end-use energy demand. Energy J. 2001, 22, 77–105. [Google Scholar] [CrossRef]
- Ma, C.; Stern, D.I. China’s changing energy intensity trend: A decomposition analysis. Energy Econ. 2008, 30, 1037–1053. [Google Scholar] [CrossRef] [Green Version]
- Voigt, S.; De Cian, E.; Schymura, M.; Verdolini, E. Energy intensity developments in 40 major economies: Structural change or technology improvement? Energy Econ. 2014, 41, 47–62. [Google Scholar] [CrossRef] [Green Version]
- Gostkowski, M.; Gajowniczek, K. Weighted Quantile Regression Forests for Bimodal Distribution Modeling: A Loss Given Default Case. Entropy 2020, 22, 545. [Google Scholar] [CrossRef]
- Nafkha, R.; Gajowniczek, K.; Ząbkowski, T. Do Customers Choose Proper Tariff? Empirical Analysis Based on Polish Data Using Unsupervised Techniques. Energies 2018, 11, 514. [Google Scholar] [CrossRef] [Green Version]
- Konstantinos, K.T.; Chorianopoulos, A. Data Mining Techniques in CRM: Inside Customer Segmentation; Wiley: Hoboken, NJ, USA, 2010; ISBN 978-0-470-74397-3. [Google Scholar]
- Ward, J.H., Jr. Hierarchical grouping to optimize an objective function. J. Am. Statist. Assoc. 1963, 58, 236–244. [Google Scholar] [CrossRef]
- Kaufman, L.; Rousseeuw, P.J. Finding Groups in Data: An Introduction to Cluster Analysis; John Wiley & Sons: Hoboken, NJ, USA, 2009; Volume 344. [Google Scholar]
- Rousseeuw, P.J. Silhouettes: A graphical aid to the interpretation and validation of cluster analysis. J. Comput. Appl. Math. 1987, 20, 53–65. [Google Scholar] [CrossRef] [Green Version]
- Metcalf, G.E. An empirical analysis of energy intensity and its determinants at the state level. Energy J. 2008, 29, 1–26. [Google Scholar] [CrossRef]
- Löschel, A.; Pothen, F.; Schymura, M. Peeling the onion: Analyzing aggregate, national and sectoral energy intensity in the European Union. Energy Econ. 2015, 52, S63–S75. [Google Scholar] [CrossRef] [Green Version]
- Pothen, F.; Schymura, M. Bigger cakes with fewer ingredients? A comparison of material use of the world economy. Ecol. Econ. 2015, 109, 109–121. [Google Scholar] [CrossRef]
- Gutiérrez-Pedrero, M.J.; Tarancón, M.Á.; del Río, P.; Alcántara, V. Analysing the drivers of the intensity of electricity consumption of non-residential sectors in Europe. Appl. Energy 2018, 211, 743–754. [Google Scholar] [CrossRef]
- Chen, Z.; Huang, W.; Zheng, X. The decline in energy intensity: Does financial development matter? Energy Policy 2019, 134, 110945. [Google Scholar] [CrossRef]
- Parker, S.; Liddle, B. Analysing energy productivity dynamics in the OECD manufacturing sector. Energy Econ. 2017, 67, 91–97. [Google Scholar] [CrossRef]
- Gallo, L. Electricity Intensity in the Developed Countries: Global Divergence, Club Convergence and the Role of the Structure of the Economy. 2019. Available online: https://fsr.eui.eu/wp-content/uploads/2020/03/Gallo-FSR-CLIMATE-2019-Electricityintensity-convergence.pdf (accessed on 14 July 2021).
- van Benthem, A.A. Energy leapfrogging. J. Assoc. Environ. Resour. Econ. 2015, 2, 93–132. [Google Scholar] [CrossRef]
- Mulder, P. International specialization, structural change and the evolution of manufacturing energy intensity in OECD countries. Energy J. 2015, 36. [Google Scholar] [CrossRef]
- Pappas, D.; Chalvatzis, K.J.; Guan, D.; Ioannidis, A. Energy and carbon intensity: A study on the cross-country industrial shift from China to India and SE Asia. Appl. Energy 2018, 225, 183–194. [Google Scholar] [CrossRef] [Green Version]
- Duan, R.; Shen, T.; Li, C.; Fatima, N.; Anser, M.K. Estimating the determinants and spatial effects of electricity intensity in China. Energy Strategy Rev. 2021, 35, 100651. [Google Scholar] [CrossRef]
- Han, X.; Lakshmanan, T.K. Structural changes and energy consumption in the Japanese economy 1975-95: An input-output analysis. Energy J. 1994, 15, 165–187. [Google Scholar] [CrossRef]
- Kahrl, F.; Roland-Holst, D. Growth and structural change in China’s energy economy. Energy 2009, 34, 894–903. [Google Scholar] [CrossRef]
- Zhang, H.; Lahr, M.L. China’s energy consumption change from 1987 to 2007: A multi-regional structural decomposition analysis. Energy Policy 2014, 67, 682–693. [Google Scholar] [CrossRef]
- González, P.F.; Landajo, M.; Presno, M.J. The Divisia real energy intensity indices: Evolution and attribution of percent changes in 20 European countries from 1995 to 2010. Energy 2013, 58, 340–349. [Google Scholar] [CrossRef]
- González, P.F. Exploring energy efficiency in several European countries. An attribution analysis of the Divisia structural change index. Appl. Energy 2015, 137, 364–374. [Google Scholar] [CrossRef]


Publisher’s Note: MDPI stays neutral with regard to jurisdictional claims in published maps and institutional affiliations. |
© 2021 by the authors. Licensee MDPI, Basel, Switzerland. This article is an open access article distributed under the terms and conditions of the Creative Commons Attribution (CC BY) license (https://creativecommons.org/licenses/by/4.0/).