Article

An Optimized Adaptive Protection Scheme for Numerical and Directional Overcurrent Relay Coordination Using Harris Hawk Optimization

1
Department of Electrical Engineering, Yeungnam University, Gyeongsan 38541, Korea
2
Department of Electrical Engineering, Air University Islamabad, Kamra Campus, Kamra 43750, Pakistan
3
Korea Electric Power Company (KEPCO), Deajon 24056, Korea
*
Author to whom correspondence should be addressed.
These authors contributed equally to this work and considered as first author.
Energies 2021, 14(18), 5603; https://doi.org/10.3390/en14185603
Submission received: 15 June 2021 / Revised: 10 August 2021 / Accepted: 27 August 2021 / Published: 7 September 2021
(This article belongs to the Special Issue Smart Energy Systems: Control and Optimization)

Abstract

:
The relay coordination problem is of dire importance as it is critical to isolate the faulty portion in a timely way and thus ensure electrical network security and reliability. Meanwhile a relay protection optimization problem is highly constraint and complicated problem to be addressed. To fulfill this purpose, Harris Hawk Optimization (HHO) is adapted to solve the optimization problem for Directional Over-current Relays (DOCRs) and numerical relays. As it is inspired by the intelligent and collegial chasing and preying behavior of hawks for capturing the prey, it shows quite an impressive result for finding the global optimum values. Two decision variables; Time Dial Settings (TDS) and Plug Settings (PS) are chosen as the decision variables for minimization of overall operating time of relays. The proposed algorithm is implemented on three IEEE test systems. In comparison to other state-of-the-art nature inspired and traditional algorithms, the results demonstrate the superiority of HHO.

1. Introduction

The electrical power system is one of the most crucial systems running across the globe. For smooth operation of the electrical network, effective protection systems are a necessary requirement. In an electrical power system, the primary function of the protective system is to detect and isolate any failed or faulty components as fast as can be, so that the unfaulty portion continues to be operational. To ensure reliability and security, the components of the electrical network are protected by primary as well as backup protection. In an event of fault, the primary protection must operate in a timely way to confine the faulty part of the electrical network. In case of primary protection failure, backup protection must act to accomplish the protection task. This ought to be the favored situation of any protective system in light of the fact that the primary protection confines just the influenced region while the backup protection ensures that at whatever point, no more than a strictly necessary portion of the systems is exposed to the ill effects of blackouts. To ensure that only the affected segment of the system is confined thusly diminishing the likelihood of bothersome broader power outages, dependable and viable administration of protection equipment is required.
For a multi-loop network, a viable and productive protection scheme needs to consider Directional Over-current Relays (DOCRs). The functioning and configuration of a DOCR depend upon two parameters. The first one is the Time Dial Setting (TDS) and the second one is the Plug Setting (PS). The target of DOCR optimization is to provide the optimal settings for TDS and PS such that the primary relays respond promptly to any fault in their zone. Backup relays should also operate in a timely manner and not affect the unfaulty portions of the network. Therefore, minimization of operating times of primary relays as well as coordination of backup relays are the requirements of DOCRs, while obeying the constraints. To explain this confounded issue, various strategies have been proposed in the literature. The curve intersection method was utilized to take care of the coordination issue of overcurrent relays [1]. In [2], the graphical selection method was used to find the relay settings. The minimum break point set method has been used for an expert system in [3]. For DOCR coordination problems [4,5,6,7,8] and complex problems within the electrical power network, numerous techniques like the Nature-inspired optimization technique whale optimization [9] and the JAYA algorithm [10] have been developed to deal with the DOCR problem. With respect to the physical and logical change of arrangement of the system the optimal DOCR design was developed in [11,12]. The optimal TDS and PS settings of a DOCR were found using the hybrid genetic algorithm for the generation unit or line outage contingencies in [13,14]. The DOCRs problem in a multi loop transmission system due to single line outage contingencies has been resolved in [15,16]. A grid-connected photovoltaic system for regulating power quality issues using a supercapacitor-based STATCOM is used in [17]. The protection coordination problem is vital in the design of DOCRs, which sometime operate improperly due to alterations in the network configuration. In [18], fault current limiters were used to solve the protection coordination problem without considering line or DG outages. For line, substation and DG outages in microgrids, the protection settings were determined by using the new coordination parameters set [19]. Moreover, all these network arrangements makes them more complex, yielding discoordination of DOCRs, that constantly leads to contingencies. In order to resolve these issues and the power outages, optimal relay setting while considering the main system configuration has been recommended in [20,21,22,23]. The DOCRs problem was formulated as a mixed integer nonlinear programming (MINLP) problem and relay setting parameters were found using different population-based optimization techniques in [24,25]. In [26,27] a few bio-motivated algorithms were developed to tackle the DOCR coordination issue by designing a linear formulation. In [28,29,30,31,32], a different version of particle swarm optimization (PSO) was used to determine the optimum values for DOCRs. A different version of the differential algorithm was reported in [33] to solve the DOCR coordination problem to point out the superiority of modified differential evolution algorithms. Many other Nature-inspired algorithms like the grey wolf optimizer (GWO), teaching learning–based optimization (TLBO), biography-based optimization (BBO), back-tracking algorithm, the improved firefly (IFA) metaheuristic and modified electromagnetic field optimization (MEFO) were used for DOCR coordination in [34,35,36,37,38,39,40]. A modified teaching-based optimization algorithm was implemented in [41]. An analytic approach to solve the DOCR coordination problem was utilized in [42]. In [43], for determining relay setting parameters, an improved group search algorithm was used. In [44], the comparison of several metaheuristic algorithms to solve DOCR problem was presented. In [45], in order to solve DOCR problem, multiple embedded crossover PSO algorithm was applied. For a multisource network, the DOCR problem can be regarded as an optimization problem. The downside of the past optimization procedures and that of the metaheuristic optimization, is that they possibly converge to settings which are not optimal and may trap into local optimum results. The mathematical optimization techniques work on the gradient based information about the used functions for finding solutions. For such type of algorithms, there is likelihood of converging to local optimum results. Further, convergence rate of such algorithms lowers with larger systems. These drawbacks are alleviated by nature-inspired algorithms. Such algorithms start optimization from random solutions, and this helps in avoidance of local optima. These algorithms also do not need the gradient-based information for the solution. The edge of Nature-inspired algorithms is that they can be incorporated into optimization solutions considering them as a black box. This helps in finding optimal solutions easily for problems with unknown search space [46,47]. To comprehend this issue, a HHO algorithm technique is examined in this work to determine the optimal DOCR parameters as compared to other state-of-the-art algorithms.
In this paper, the optimal settings for DOCRs were found by a novel population-based, Nature-inspired optimization algorithm called the Harris Hawks Optimizer (HHO) deployed in a multi-loop power system. The primary motivation of HHO is the agreeable conduct and pursuing style of Harris hawks in Nature called surprise pounce. Furthermore, according to the no free lunch theorem, all proposed algorithms give almost equal results on average, when applied to all optimization problems [48]. In short, no single algorithm is universally good to solve all optimization problems, and this urges researchers to adapt and use more efficient optimization techniques. HHO is developed under the inspiration of the cooperative schema of hunting and chasing the prey by performing surprise pounces. The chasing style of Harris hawks changes dynamically according to the behavior of the prey. This paper proposes the HHO methodology that can accomplish the optimal DOCR coordination and operation. The implementation of the HHO is utilized for a test in the IEEE-9, 15 and 14-bus systems. The comparison of HHO with other algorithms proves its effectiveness. In this insightful procedure, a few Harris hawks cooperate to pounce on a prey from various bearings trying to surprise it. Harris hawks can reveal a variety of chasing patterns dependent on the dynamic nature of scenarios and the escape patterns of the prey. This work numerically impersonates such dynamic patterns and behavior to develop an optimization algorithm. The suggested HHO has more exploration capability in contrast to other metaheuristic algorithms. These qualities of HHO enhance the potential of search agents to seek optimal solutions. The important part of the proposed HHO is to decide the ideal estimations of TDS and PS to minimize the operational time of DOCRs regarding reinforcement and hand-off setting limitations.
The paper is organized as follows: Section 2 presents the problem formulation for DOCR. Section 3 contains an introduction to the proposed algorithm and its details. Section 4 explains about the results in the used test systems and a detailed discussion about the results. Finally, Section 5 concludes the paper.

2. DOCR Problem Formulation

The DOCR relay system is supposed to sense a fault event and isolate the faulty portion of a network in a timely manner, so that the healthy portion of the system does not experience the effects of the fault. Two design variables, TDS and PS, are selected to find the optimized and minimized operating time. The optimum values of TDS and PS will result in a minimized collective operating time of relays. The sum of operating times of the relays is referred to as an objective function as shown in Equation (1):
m i n f = i = 1 n T j i    
where Tji indicates the operating times of relays for a fault in j zone and i varies from 1 to the number of relays in the system. The IEC normal inverse relays are selected for relay protection schema and operating time is given by Equation (2):
T j = T D S i [ α ( I F i P S × C T R ) k 1 ]
where α and k are characteristic constants with values of 0.14 and 0.02, respectively [49]. Furthermore, TDS indicates time dial settings, IF shows the fault current value, PS shows plug settings value and CTR shows the currents transformer ratio value for the relays. Tj stands for the operating time of the primary relay. The goal is to minimize the operating time of relays, while keeping constraints into consideration. The overall schema of DOCRs coordination and protection is shown in Figure 1. Which shows the goal of DOCRs protection keeping in view the backup protection as well as constraints.

2.1. Coordination Criteria

For an effective protection scheme, backup protection is supposed to act as a second line of defense. It should be ensured that backup protection acts neither too fast nor too slow. Hence, backup protection is supposed to act after some coordination time interval (CTI). This value varies between 0.2–0.5 s, depending upon the choice of certain value or relay types used. The relation between backup and primary relays is shown by Equation (3):
T b   T j + C T I
where Tb: the backup relay operating time; and Tj: the primary (or main) relay operating time.

2.2. Relay Setting Bounds

Along with coordination constraints, the relay protection scheme is subject to constraints imposed on the values of TDS and PS. Further information about minimum and maximum values of TDS and PS is mentioned along with the experimental data. The number of TDS and PS varies according to the number of primary relays. In following equations, i indicates the number of relays. The optimum values of TDS and PS are bound to obey these settings constraints of minimum and maximum values. The ultimate goal is the settings which will ensure constraints of coordination as well as settings constraints, indicated in this section, as shown by Equations (4) and (5):
T D S i m i n T D S i T D S i m a x
P S i m i n P S i P S i m a x

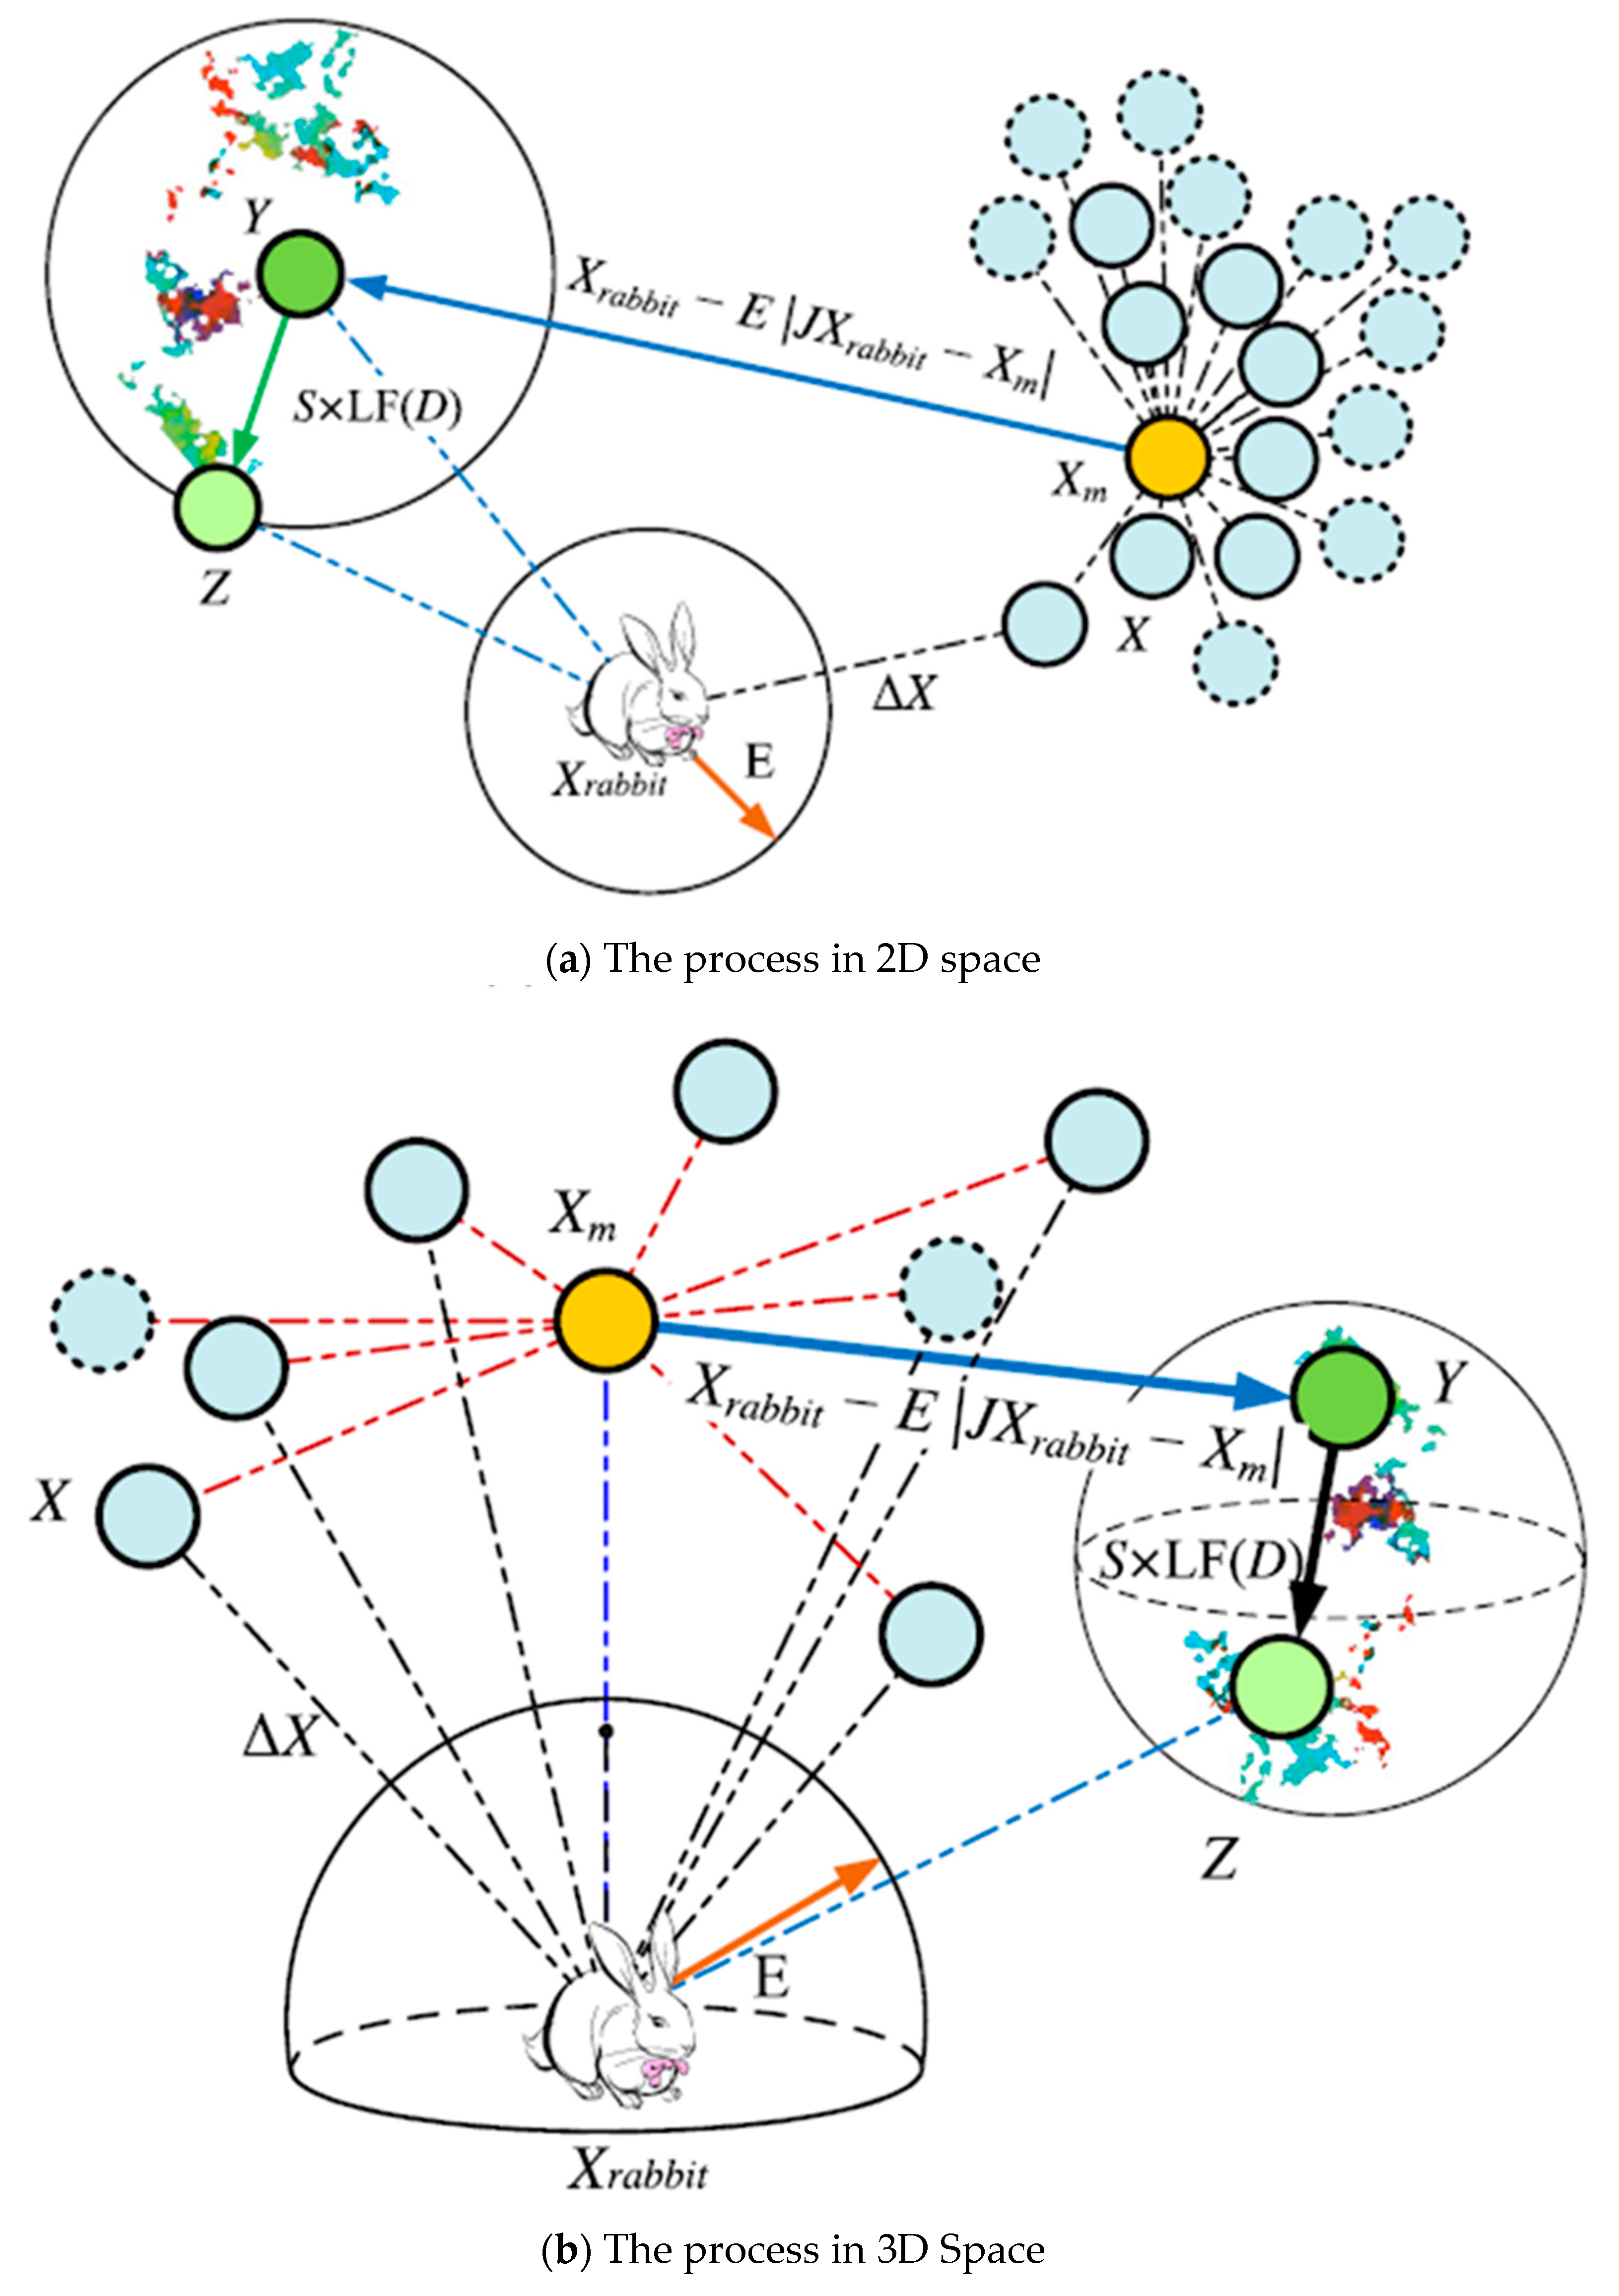
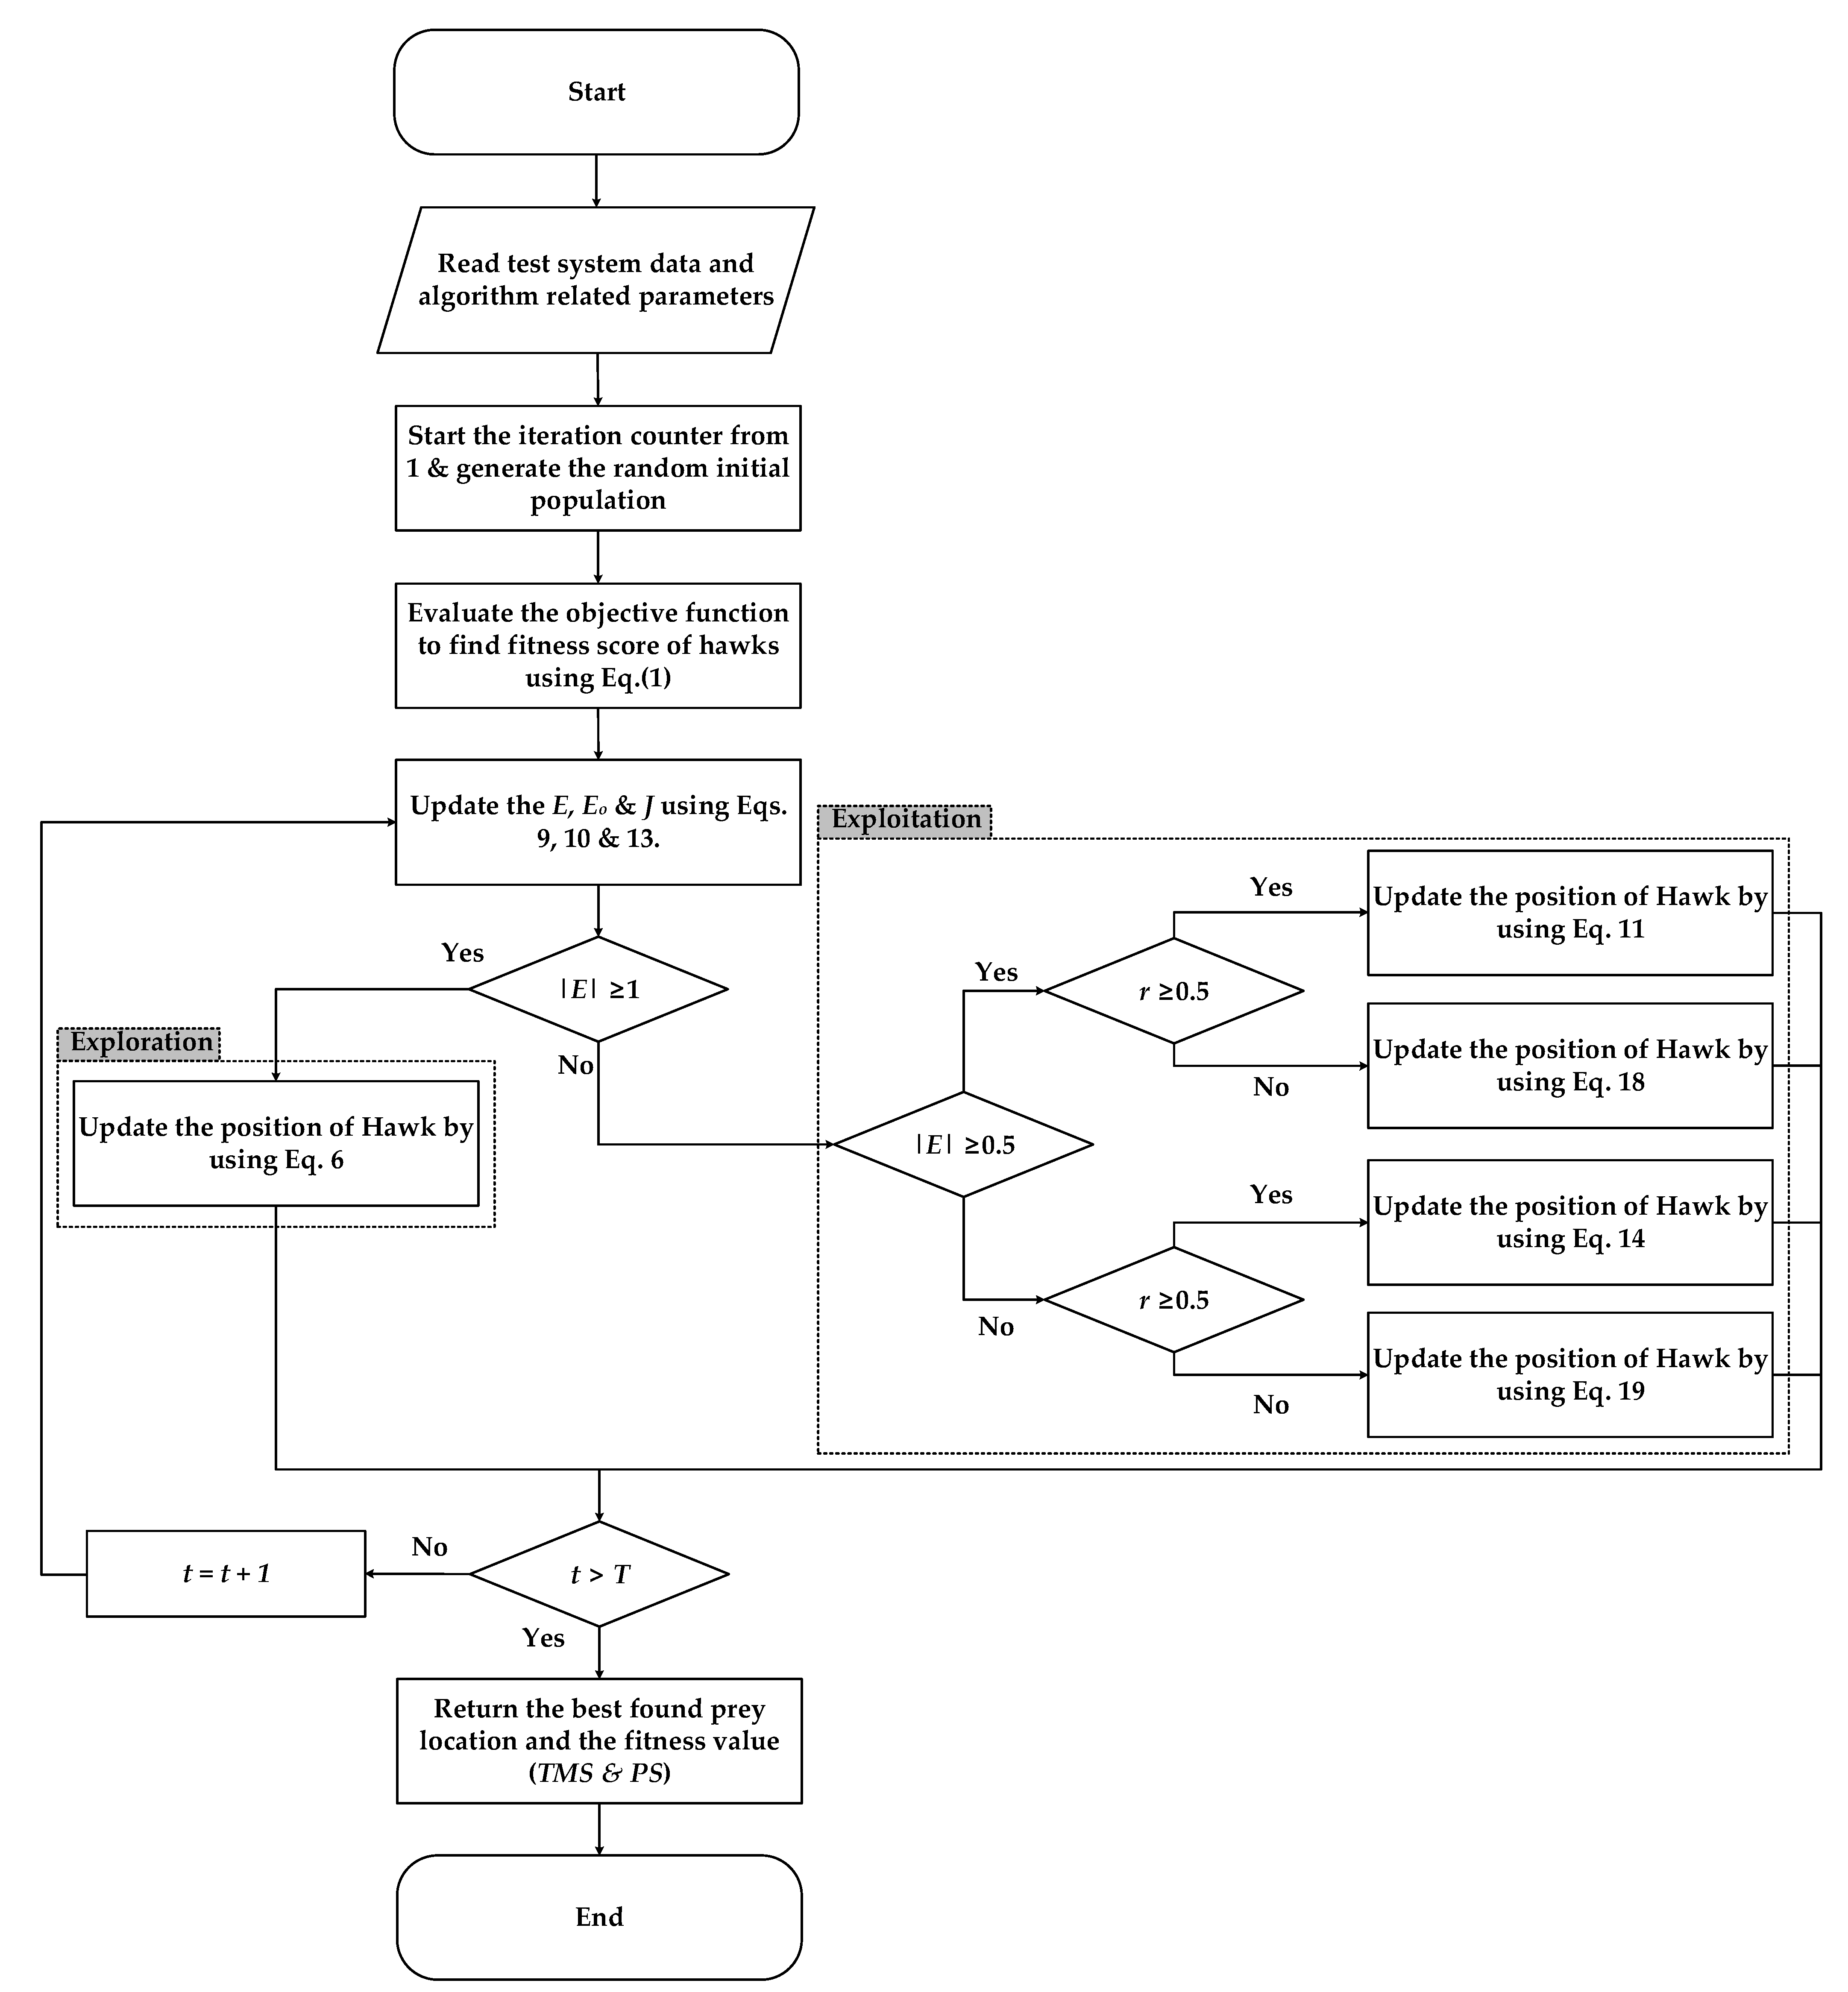
3. Harris Hawks Optimization (HHO) Algorithm

In 2019, Heidari et al. presented a population-based Nature-inspired model-based algorithm called the Harris Hawk Optimization (HHO) algorithm to solve optimization problems [50]. The HHO was developed under the inspiration of one of highest IQ hunters, the Harris hawk. Harris Hawks sense and adapt their hunting strategies according to the dynamic moves and escape attempts of their prey. The hunting quest of several hawks starts with mutual encircling of the prey and then changing different hunting patterns according to the behavior of the prey. Unlike other algorithms, HHO adapts dynamically according to different patterns shown by the prey in the exploitation phase. In this section, the exploration and exploitation of HHO is modelled, elaborating mutual hunting strategy of surprise pounces and attacking by Harris hawks.

3.1. Exploration Phase

In this part, the exploration process by HHO is stated. Harris hawks scan the search area with their powerful eyes. They sit on some tall place to better cover a large search area and may spend several hours in locating and identifying a prey. It is important to note that in the HHO paradigm, Harris hawks are the candidate solutions and the prey is the optimal solution. There is an equal probability that Harris hawks will adapt to two different perching strategies. According to the first strategy, a Harris hawk may perch according to its hunting group, while, as a second strategy, Harris hawks may perch randomly on a tall tree, inside the hunting group range. Both of these perching strategies are summed up in Equation (6), indicating q ≥ 0.5 for first case and q < 0.5 for second case:
X ( t + 1 ) = { X r a n d ( t ) r 1 | X r a n d ( t ) 2 r 2 X ( t ) |                         q 0.5 ( X r a b b i t ( t ) X m ( t ) ) r 3 ( L B + r 4 ( U B L B ) )       q < 0.5      
X ( t ) = r 5 ( N D × R N ) . ( U B L B ) + L B
Here, X(t + 1) is the random location of hawks for the iteration t + 1. X(t), given by Equation (7), is the hawks’ position vector at current iteration t. Here, ND represents the number of decision variables and RN represents the number of relays being used in the system. This equation will produce the ( N D × R N ) vector of uniformly distributed numbers in the interval (LB, UB). Xrand(t) is a random hawk from the current population and Xm(t) is the average position of hawks for current iteration. The position of the rabbit (prey) in the current iteration is given by Xrabbit(t). To depict the random nature, variables r1, r2, r3, r4 and r5 are included from interval (0, 1). To restrict the scenario to the valid search space, all variables are supposed to obey the upper and lower bounds, included as UB and LB in the Equation (6). According to the first part of Equation (6), the position of a hawk for the next iteration will be the result of the difference between the random hawk’s position from the current iteration and the normalized difference of the position of the random hawk and other hawks in the current iteration. According to the second part of Equation (6), the position of hawks for the next iteration is based on the best location so far, the average position and a randomly scaled factor based on the group range. To impart randomness and explore search space more, a randomly scaled LB parameter is included. By using Equation (7), the average position of hawks for current iteration is calculated:
X m ( t ) = 1 N i = 1 N X i ( t )
Here, N indicates the number of hawks and Xi(t) is the individual hawk location for the current iteration.

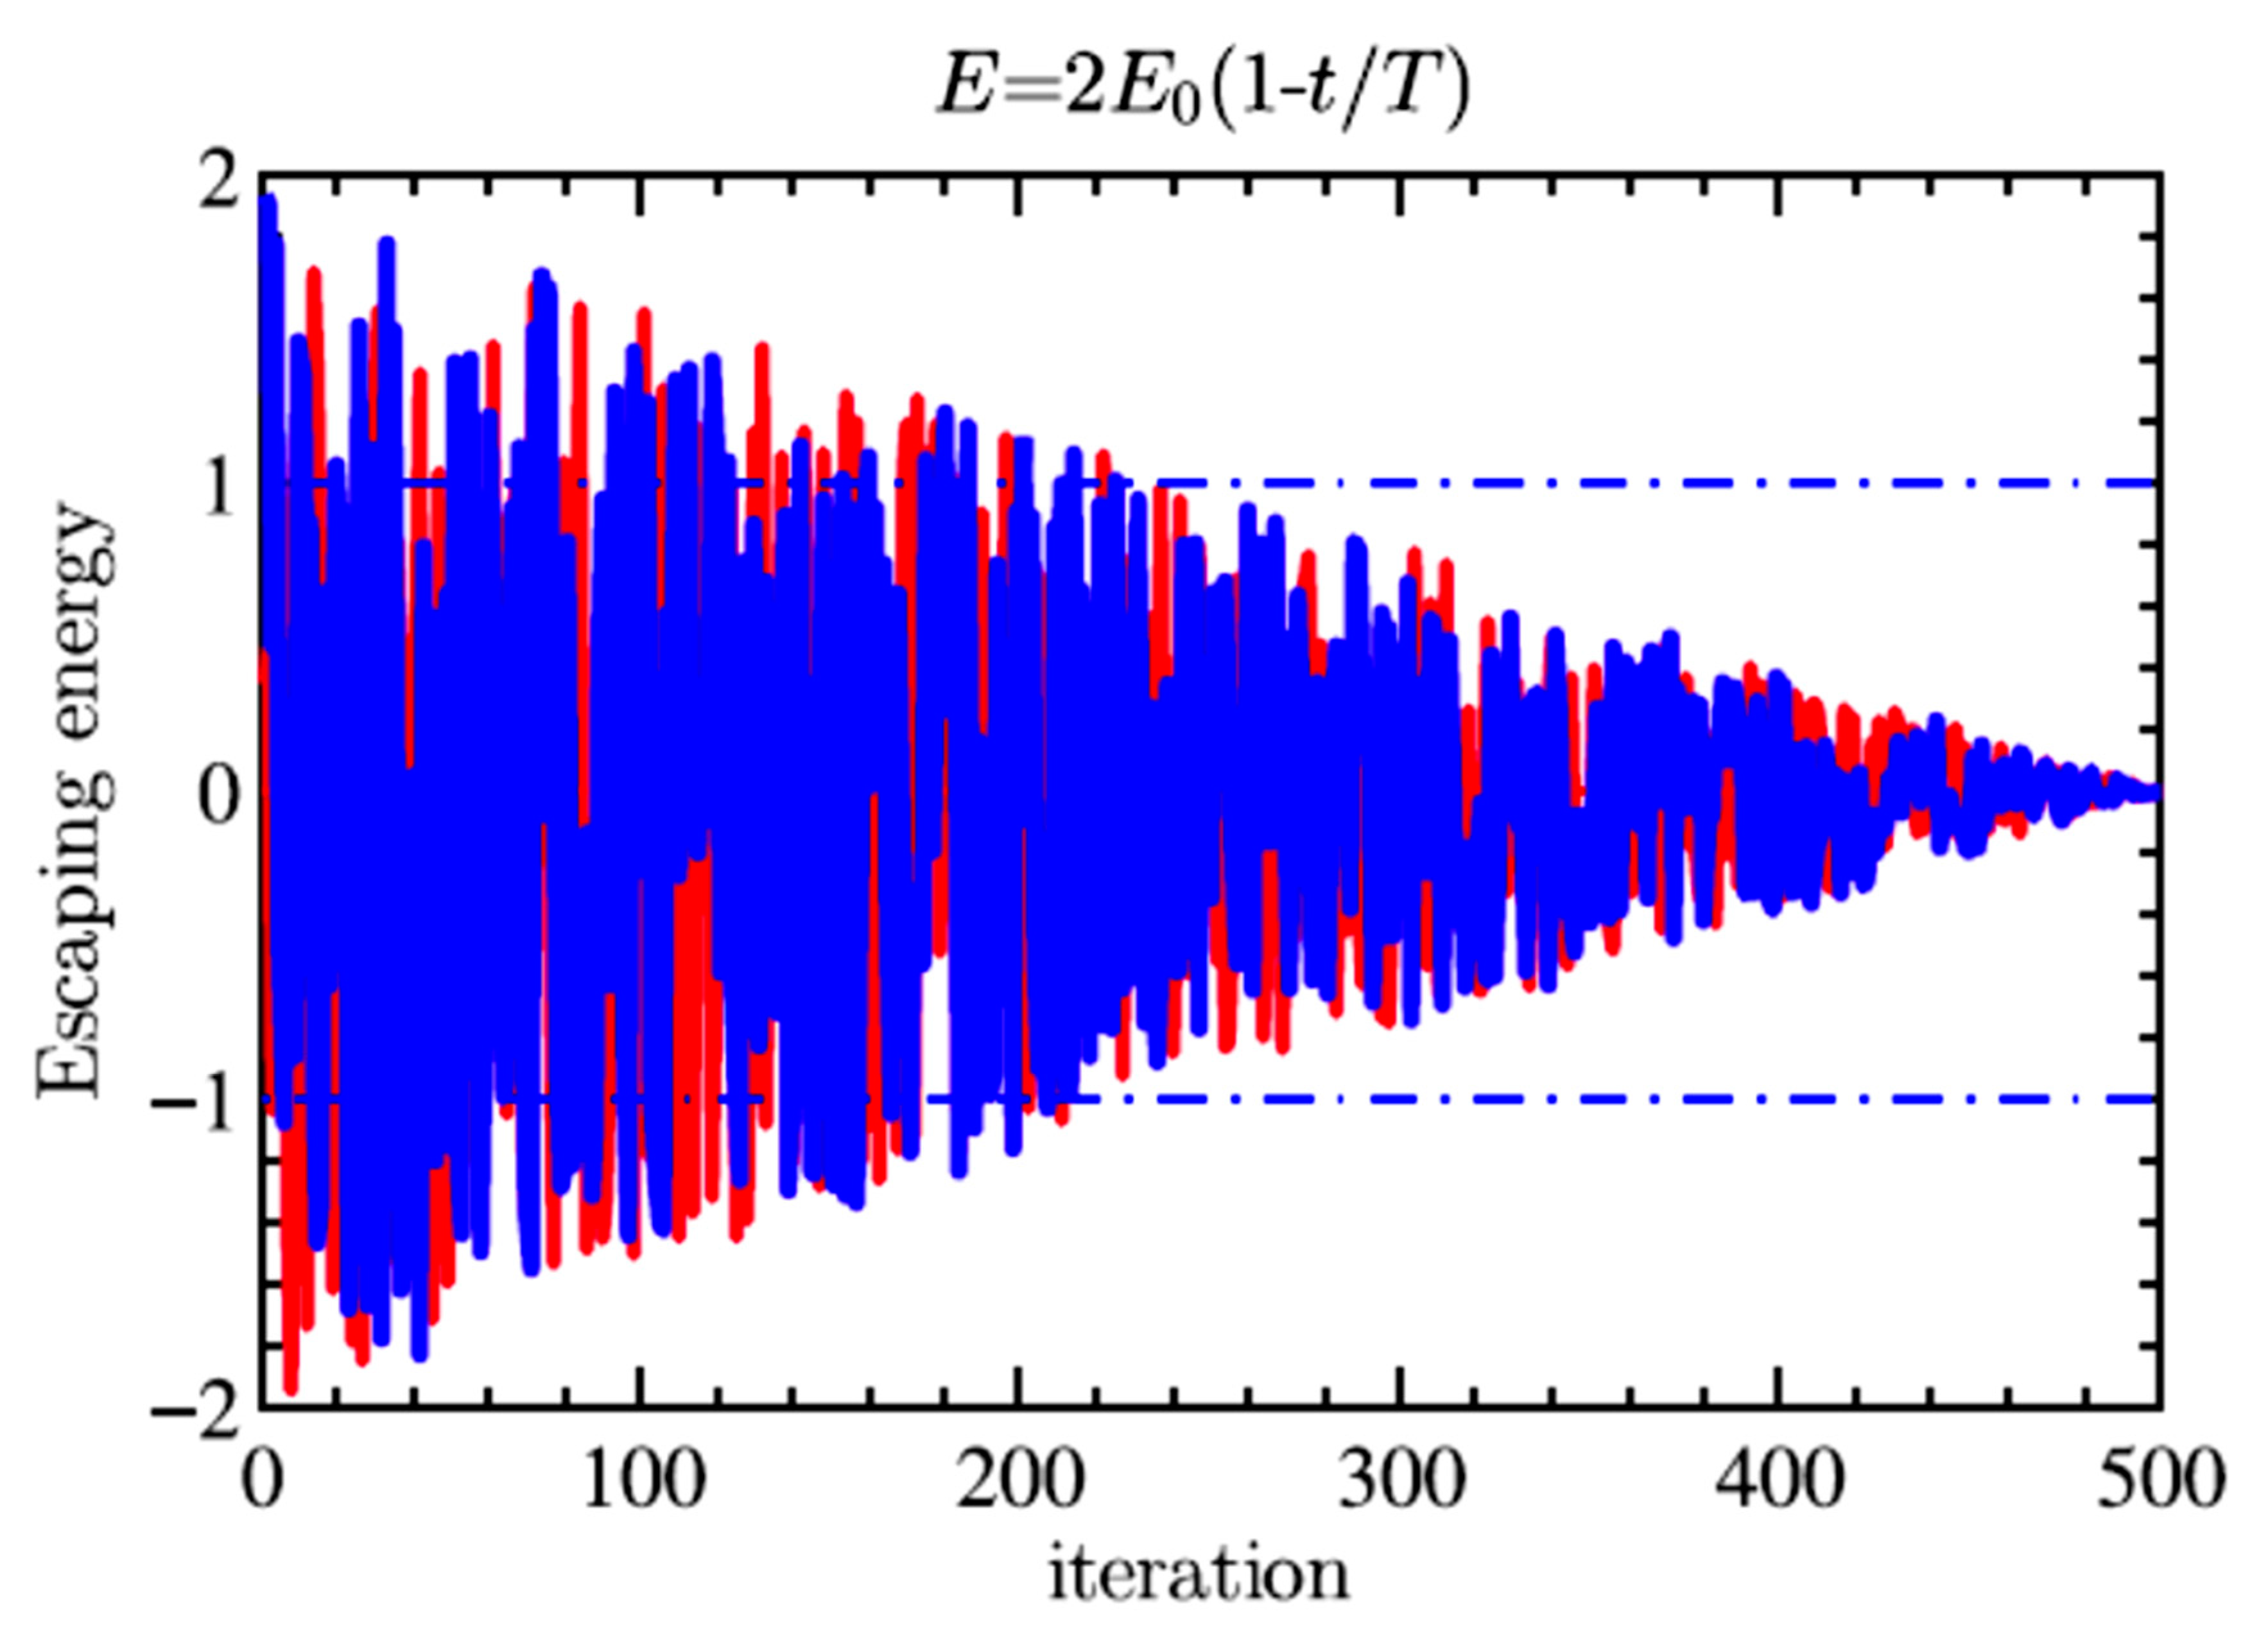
3.2. Transition from Exploration to Exploitation

The switching from exploration to exploitation and then different dynamic exploitation modes is triggered by the escaping energy of the prey. The escaping energy decreases during the hunt, whereas different escaping patterns can be adopted by prey to deceive the hawks. The escaping energy is of the prey is mathematically modelled in Equation (9):
E = 2 E o ( 1 t / T )
Eo = 2 ∗ (r6) − 1
Here, Eo is the energy of prey at the initial state, given by Equation (10). t is the current iteration and T indicates the total number of iterations and r6 is a random number which varies between 0 and 1. The energy of the prey varies randomly between −1 and 1. For energies between 0 and −1, the prey starts weakening while for energies between 0 and 1 the prey starts strengthening and performs deceiving moves and tries its level best to get away from the hunting hawks. As iterations pass, the energy of the prey decreases. For escaping energies |E| ≥ 1, the hawks look through a different vicinity to locate the prey, indicating exploration, whereas for escaping energies |E| < 1 a detailed search is carried out, referred to as exploitation. To sum things up, for |E| ≥ 1, the HHO is in exploration phase, while for |E| < 1, HHO is in an exploitation phase. The escaping energy for two runs and 500 iterations is shown in Figure 2.

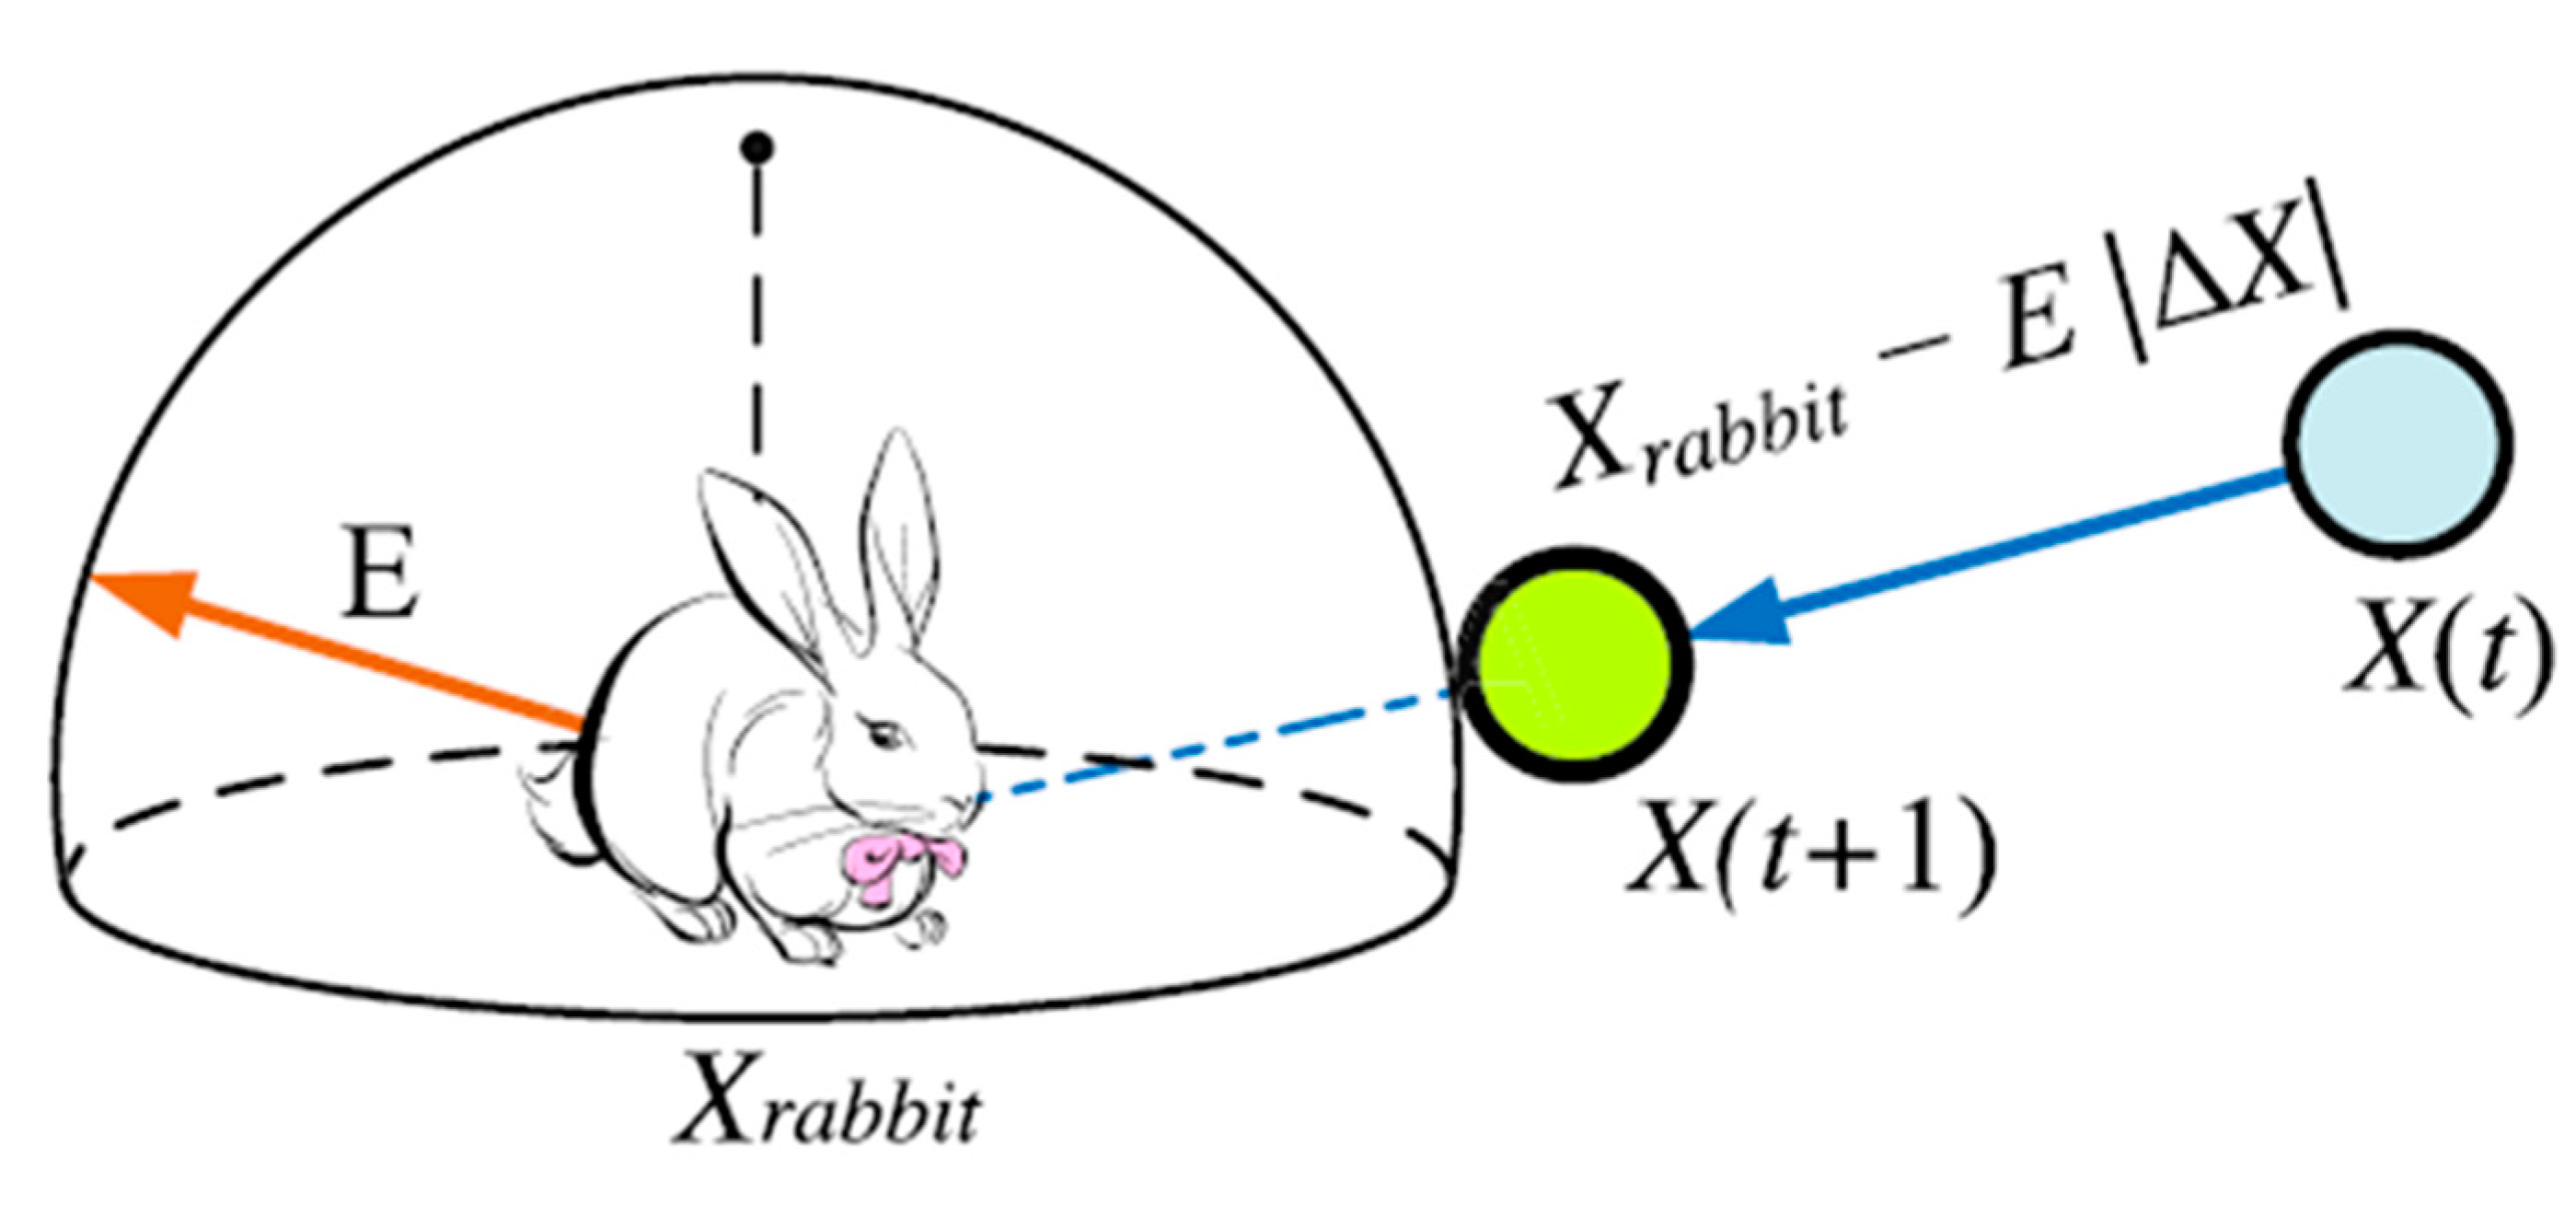
3.3. Exploitation Phase

Harris hawks implement a surprise pouncing strategy on the identified prey. As a resultant the prey becomes exhausted and is captured easily by the hawks, but during this process, the prey tries its best to deceive the hawks and save itself from danger. To model this scenario, four different scenarios are presented in HHO. The prey strives hard to get away from hawks. Before the surprise pounce, the probability of a successful escape is characterized as (r < 0.5), while the probability of an unsuccessful escape is characterized as (r 0.5). Therefore, depending upon the parameters r and E, the prey’s escape patterns can be characterized into four different scenarios, explained in detail in the following section. According to the different scenarios, Harris hawks change their cooperative hunting tactics. As a result, the prey gets exhausted and its energy is diminished. In this stage, Harris hawks perform a hard or soft siege and capture the prey. In such a manner, the adaptation mode of a Harris hawk is classified into soft and hard siege, depending upon the condition |E| 0.5 and |E| < 0.5, respectively.

3.3.1. Soft Siege

For the scenario of unsuccessful escape the probability r 0.5 and the energy value |E| 0.5, the prey still has enough energy. The prey performs random jumps to mislead the Harris hawks. In such a scenario, Harris hawks adapt a soft siege mode to further exhaust the prey. This scenario is modelled in Equation (11):
X ( t + 1 ) = X ( t ) E   | J X r a b b i t ( t ) X ( t ) |
X ( t ) = X r a b b i t ( t ) X ( t )
Here ∆X(t) in Equations (11) and (12) represents the difference between the rabbit position and hawk position for the current iteration:
J = 2(1 − r6)
Furthermore, Equation (13) indicates the jump strength of the prey whilst escaping. Here, r6 is random number from the interval (0, 1). This random number imparts a random nature to demonstrate the movement of the prey in every iteration

3.3.2. Hard Siege

For the scenario of unsuccessful escape probability r ≥ 0.5 and energy value |E|< 0.5, the prey is quite exhausted and has considerably low energy to escape the hunt. Harris hawks sense this situation and their siege tactics are intensified to capture the prey. This scenario is modelled in Equation (14):
X ( t + 1 ) = X r a b b i t ( t ) E | X ( t ) |
An example to demonstrate this scenario is shown in Figure 3.

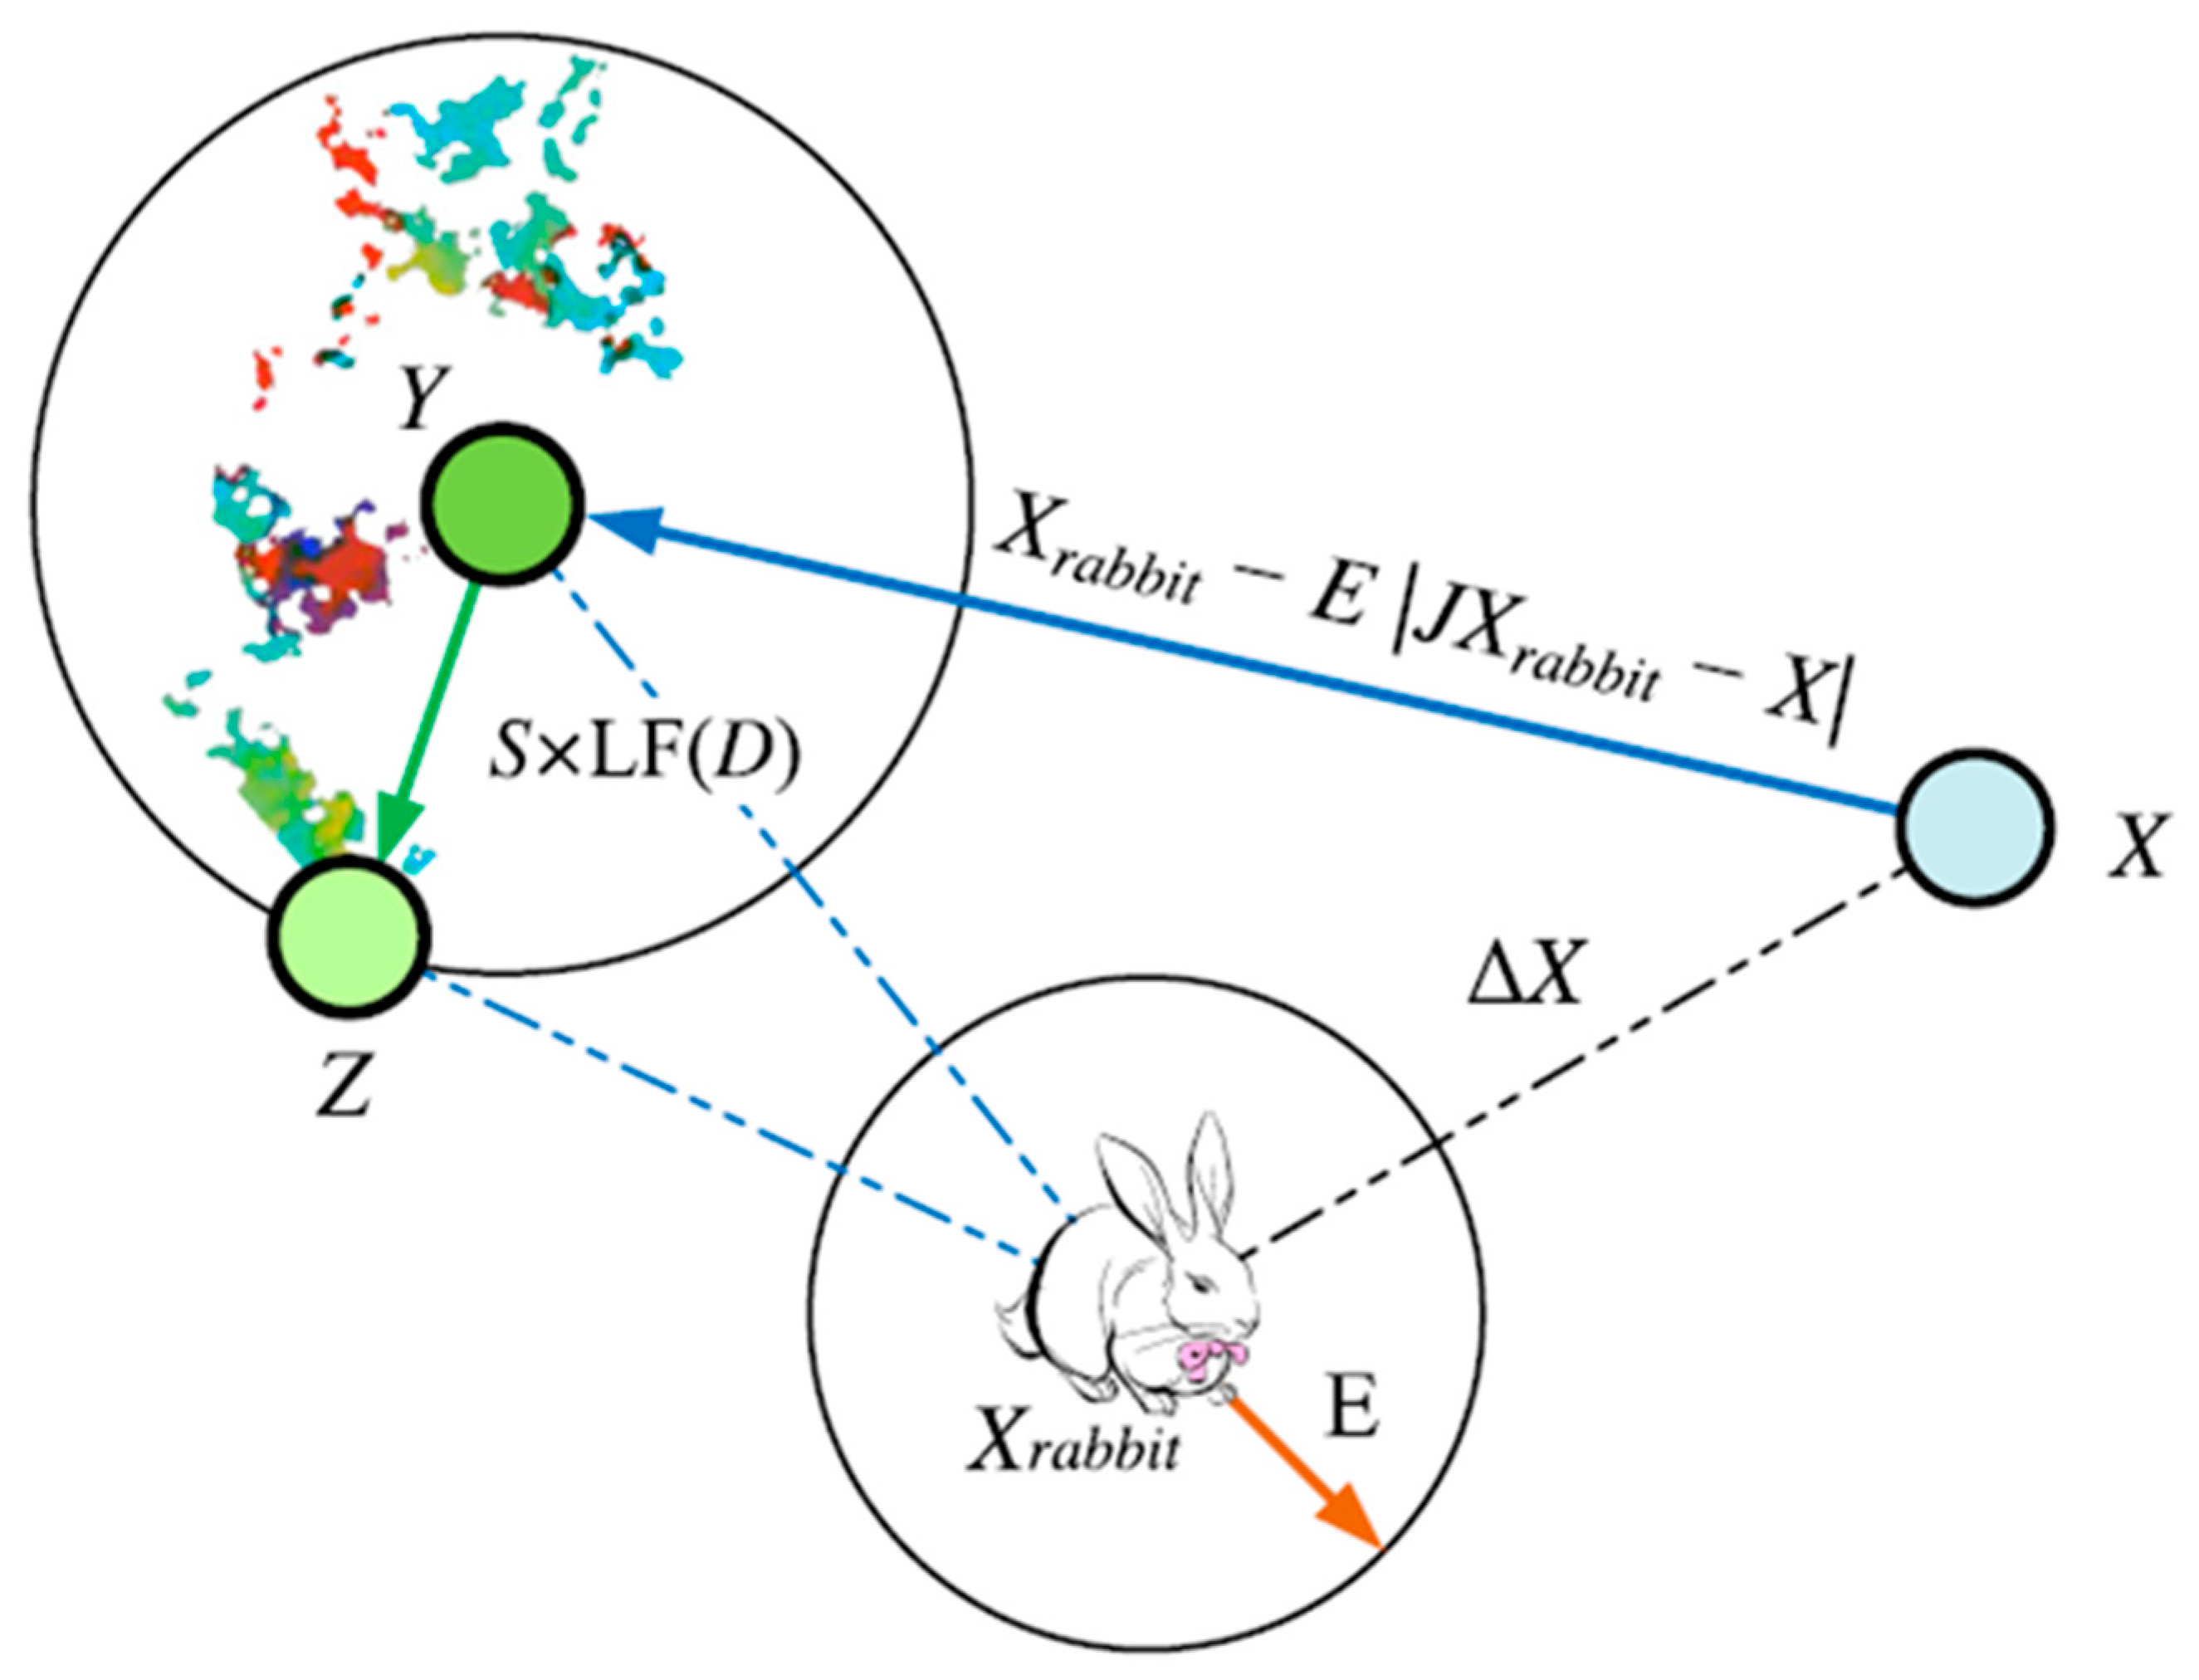
3.3.3. Soft Siege with Progressive Rapid Dives

For the scenario of successful escape probability r < 0.5 and energy value |E| 0.5, prey is energetic enough to deceive the hunting plans. Sensing this situation, Harris hawks switch their hunting schema to a more sophisticated and intelligent mode. The mode of hunting is soft siege but it combined with the technique of Levy flights (LF). In accordance to the deceiving motions and jumps of the prey, Harris hawks also start zigzag dives [51]. In this way, Harris hawks try to match their hunting pattern with the random and deceiving jumps of the prey. LF is a quite favorable mode of capturing the prey for foragers and predators [52,53]. The LF technique is often adopted by predators, and can be seen in the chasing schemes used by sharks and monkeys [51,52,53,54,55,56,57]. The soft siege model used by hawks at this stage is shown in Equation (15):
Y = X r a b b i t ( t ) E   | J X r a b b i t ( t ) X ( t ) |
The LF technique used by HHO is modelled on Equation (16). Harris hawks analyze their current move and the past moves and change their diving and hunting strategy accordingly. After comparison and realization, Harris hawks perform sporadic, unexpected and abrupt dives:
Z = Y + S × L F ( D )
Here, D indicates the dimension, S indicates a random vector of size (1 × D) and LF indicates the Levy flight function, which is modelled by using Equation (17):
L F ( x ) = 0.01 × u × σ | v | 1 β ,   σ = ( Γ ( 1 + β ) × sin ( π β 2 ) Γ ( 1 + β 2 ) × β × 2 ( β 1 2 ) ) 1 / β
Here, u and v are the random values between the interval (0, 1). β is a constant with a value equal to 1.5. As a whole, the hunting and surprise pouncing pattern used by the hawks for this mode can be modelled by using Equation (18):
X ( t + 1 ) = { Y                           i f             F ( Y ) < F ( X ( t ) ) Z                         i f               F ( Z ) < F ( X ( t ) )
Here, the parameters Y and Z refer to Equations (15) and (16) respectively. This step with one hawk is elaborated in Figure 4. The LF patterns shown by the hawk are also demonstrated for a course of a few iterations. The colored-dotted line shows the LF-based dives. For every next iteration, Y and Z are adopted to intelligently capture the prey. This behavior is adopted by the whole group of Harris hawks.

3.3.4. Hard Siege with Progressive Rapid Dives

For the scenario of successful escape probability r < 0.5 and energy value |E|< 0.5, the prey is exhausted because of low energy. Now, Harris hawks decrease the distance between the prey and perform a hard siege. To tackle the deceiving jumps of the prey, the LF-based technique is also incorporated. This situation is modelled in Equation (19):
X ( t + 1 ) = { Y                           i f             F ( Y ) < F ( X ( t ) ) Z                         i f               F ( Z ) < F ( X ( t ) )
where Y and Z are obtained using the new rules in Equations (20) and (21).
Y = X r a b b i t ( t ) E   | J X r a b b i t ( t ) X ( t ) |
Z = Y + S × L F ( D )
Here, Xm(t) can be accessed from Equation (7). This scenario is elaborated in Figure 5. The colored-dots indicate the LF patterns for the current iteration. For the next iteration, the decision between Y or Z will be made by the hawks, accordingly.

3.4. Computational Complexity

The computational complexity is the result of three processes. The first one is initialization, the second one is fitness evaluation and the third one is updating of hawks. With N number of hawks, the initialization complexity is O(N). Due to updating, the complexity becomes O(T × N) + O(T × N × D). This includes the search for the best location and as well as updating of location for whole group of hawks. Here, T indicates the total number of iterations and D indicates the dimension of problems. Resultantly, the computational complexity can be given as O(N × (T + TD + 1)).

4. Results and Discussion

In this part, the HHO is successfully implemented to address the DOCR coordination problem and has been verified for three IEEE standard test systems: the IEEE-9, 14, and 15 bus systems. The results have been obtained by developing a simulation program using MATLAB software @ R2018b. The parameters used for HHO are listed in Table 1. Whereas, the parameters used for other compared algorithms are mentioned in Appendix A, Table A1.

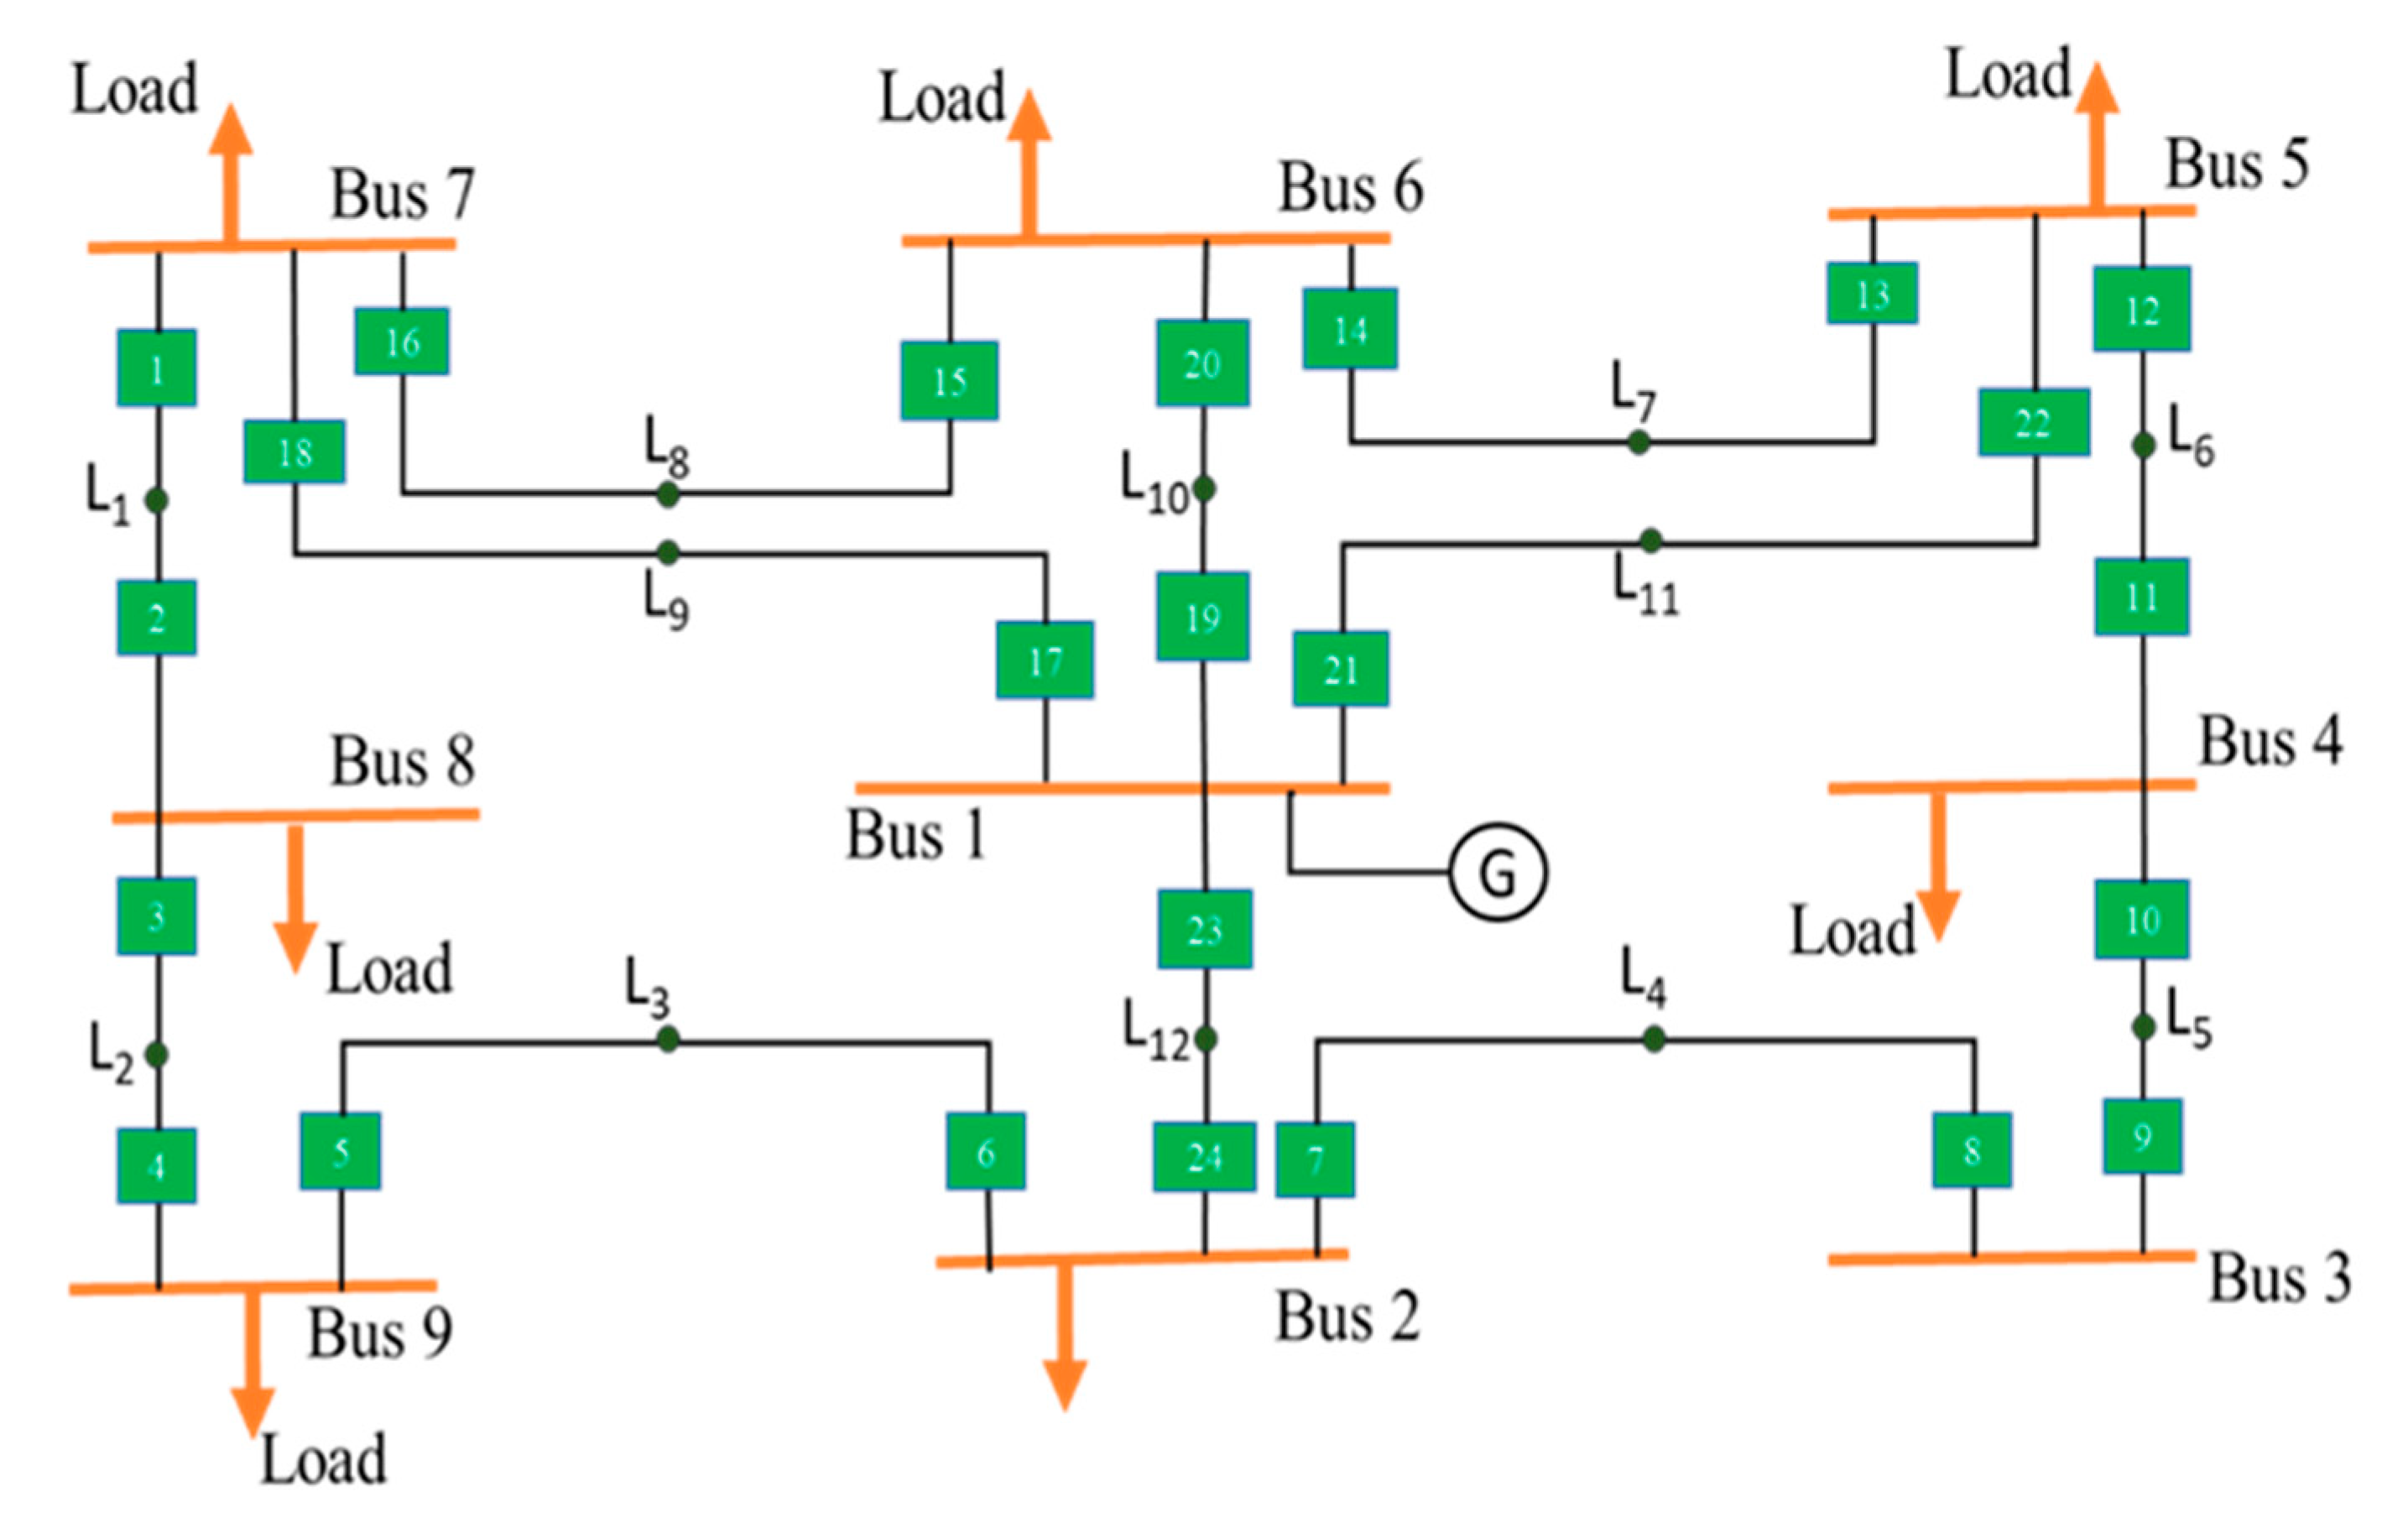
4.1. IEEE Nine Bus System for DOCRs

The proposed algorithm is implemented on IEEE 9 bus system as shown in Figure 6. The system consists of nine buses and 12 lines. The system is powered by a generator located at bus 1. The primary and backup pairs of DOCRs and short circuit test is mentioned in reference [13] and not discussed further here. The current transformer ration is set at 500/1 for all DOCRs. The higher and lower values of TDS (1.2–0.1) and PS (2.5–0.5) are selected accordingly with a coordination interval of 0.2 s. The optimum results obtained for TDS and PS by the proposed HHO are shown in Table 2. Table 3 shows the net total operating time achieved by the HHO and other state of the art algorithms and it cn be realized that the HHO outperforms the other algorithms in minimizing the total operating time of DOCR for an IEEE 9 Bus system. By comparison, it is evident that HHO is giving desired optimal settings for DOCRs as compared to other algorithms. For example, the improvement in operating time achieved by using HHO with respect to particle swarm optimization (PSO) is 37.55%. Meanwhile, the improvements with respect to genetic algorithm (GA), non-linear programming (NLP), informative differential evolution (IDE) algorithm, harmony search (HS), biogeography-based optimization (BBO) and modified adaptive teaching learning-based optimization algorithm (MTLBO) are 73.23%, 55.03%, 85.37%, 11.28%, 69.73% and 79.17% respectively. Figure 7 depicts the convergence characteristics of HHO obtained during the course of the simulation. It can be noticed that HHO achieved a quite fast convergence rate to achieve the optimal values. At about 150 iterations, the HHO was able to attain the optimal values.

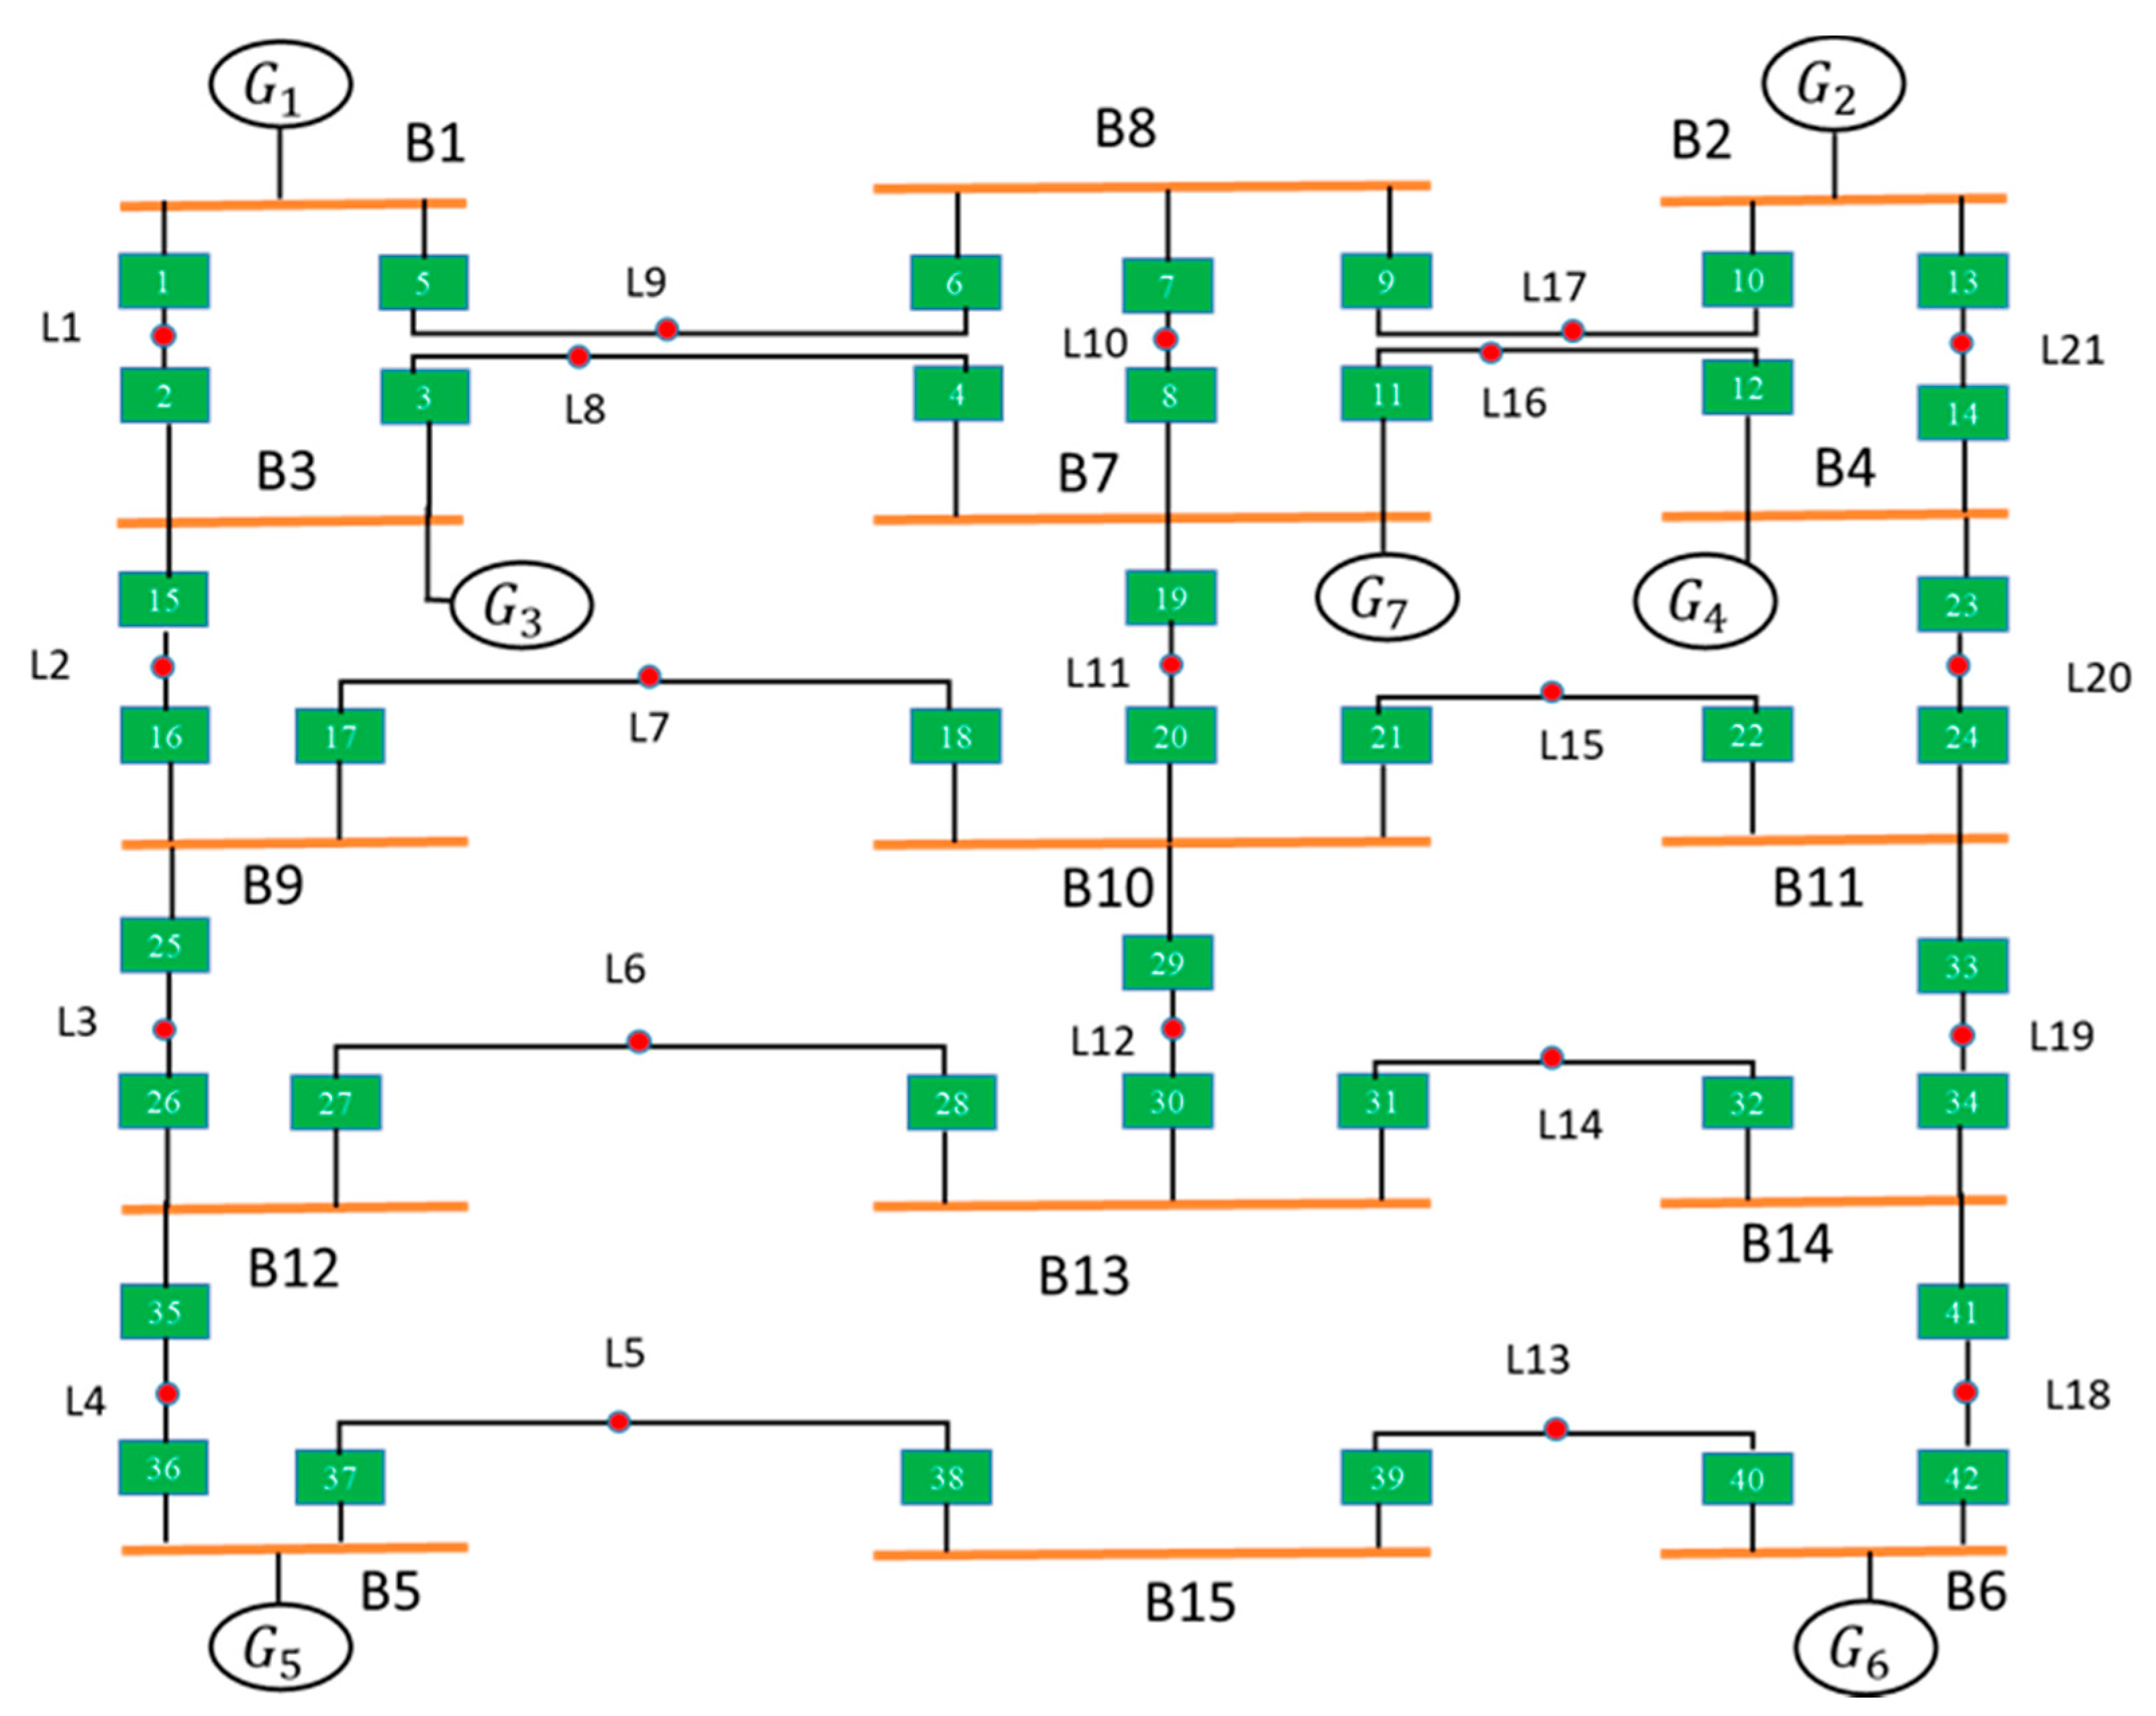
4.2. IEEE 15 Bus System for DOCRs

The IEEE 15 bus system is a highly distributed generator (DG)-enlarged distribution system consisting of 21 lines and 42 relays as mentioned in Figure 8 and is has 82 constraints and 84 design variables. The short circuit test and primary and back up configuration are mentioned in reference [24]. Table 4 shows the current transformer ratio for the DOCR configuration. The higher and lower limits of TDS (1.2–0.1) and PS (2.5–0.5) are selected accordingly. A CTI of 0.3 s is selected.
The optimum values obtained by the proposed HHO are listed in Table 5 which shows that HHO optimized the total operating time up to attain the minimum and optimum values. Table 6 shows the comparison of HHO with other algorithms applied for the same DOCR coordination problem. It proves that HHO is superior to other current algorithms in minimizing the total operating time up to a minimum value with a fast convergence rate as shown in Figure 9 and obtains the best value for the objective function in a smaller number of iterations. The comparison of optimal settings determined by HHO with seeker algorithm (SA), mixed integer non-linear programming (MINLP), analytic approach (AA), differential evolution (DE), HS, backtracking search algorithm (BSA), MTLBO, group search optimization (GSO), improved group search optimization (IGSO) and modified electromagnetic field optimization (MEFO) shows 5.64%, 24.77%, 1.07%, 1.89%, 8.60%, 29.19%, 78.02%, 15.50%, 4.93% and 17.31% improvements, respectively. Figure 9 and Figure 10 portrays the convergence characteristics of HHO during the course of simulations. For the studied 15-bus network, HHO is able to attain optimal values with quite good convergence rate, after about 175 iterations.

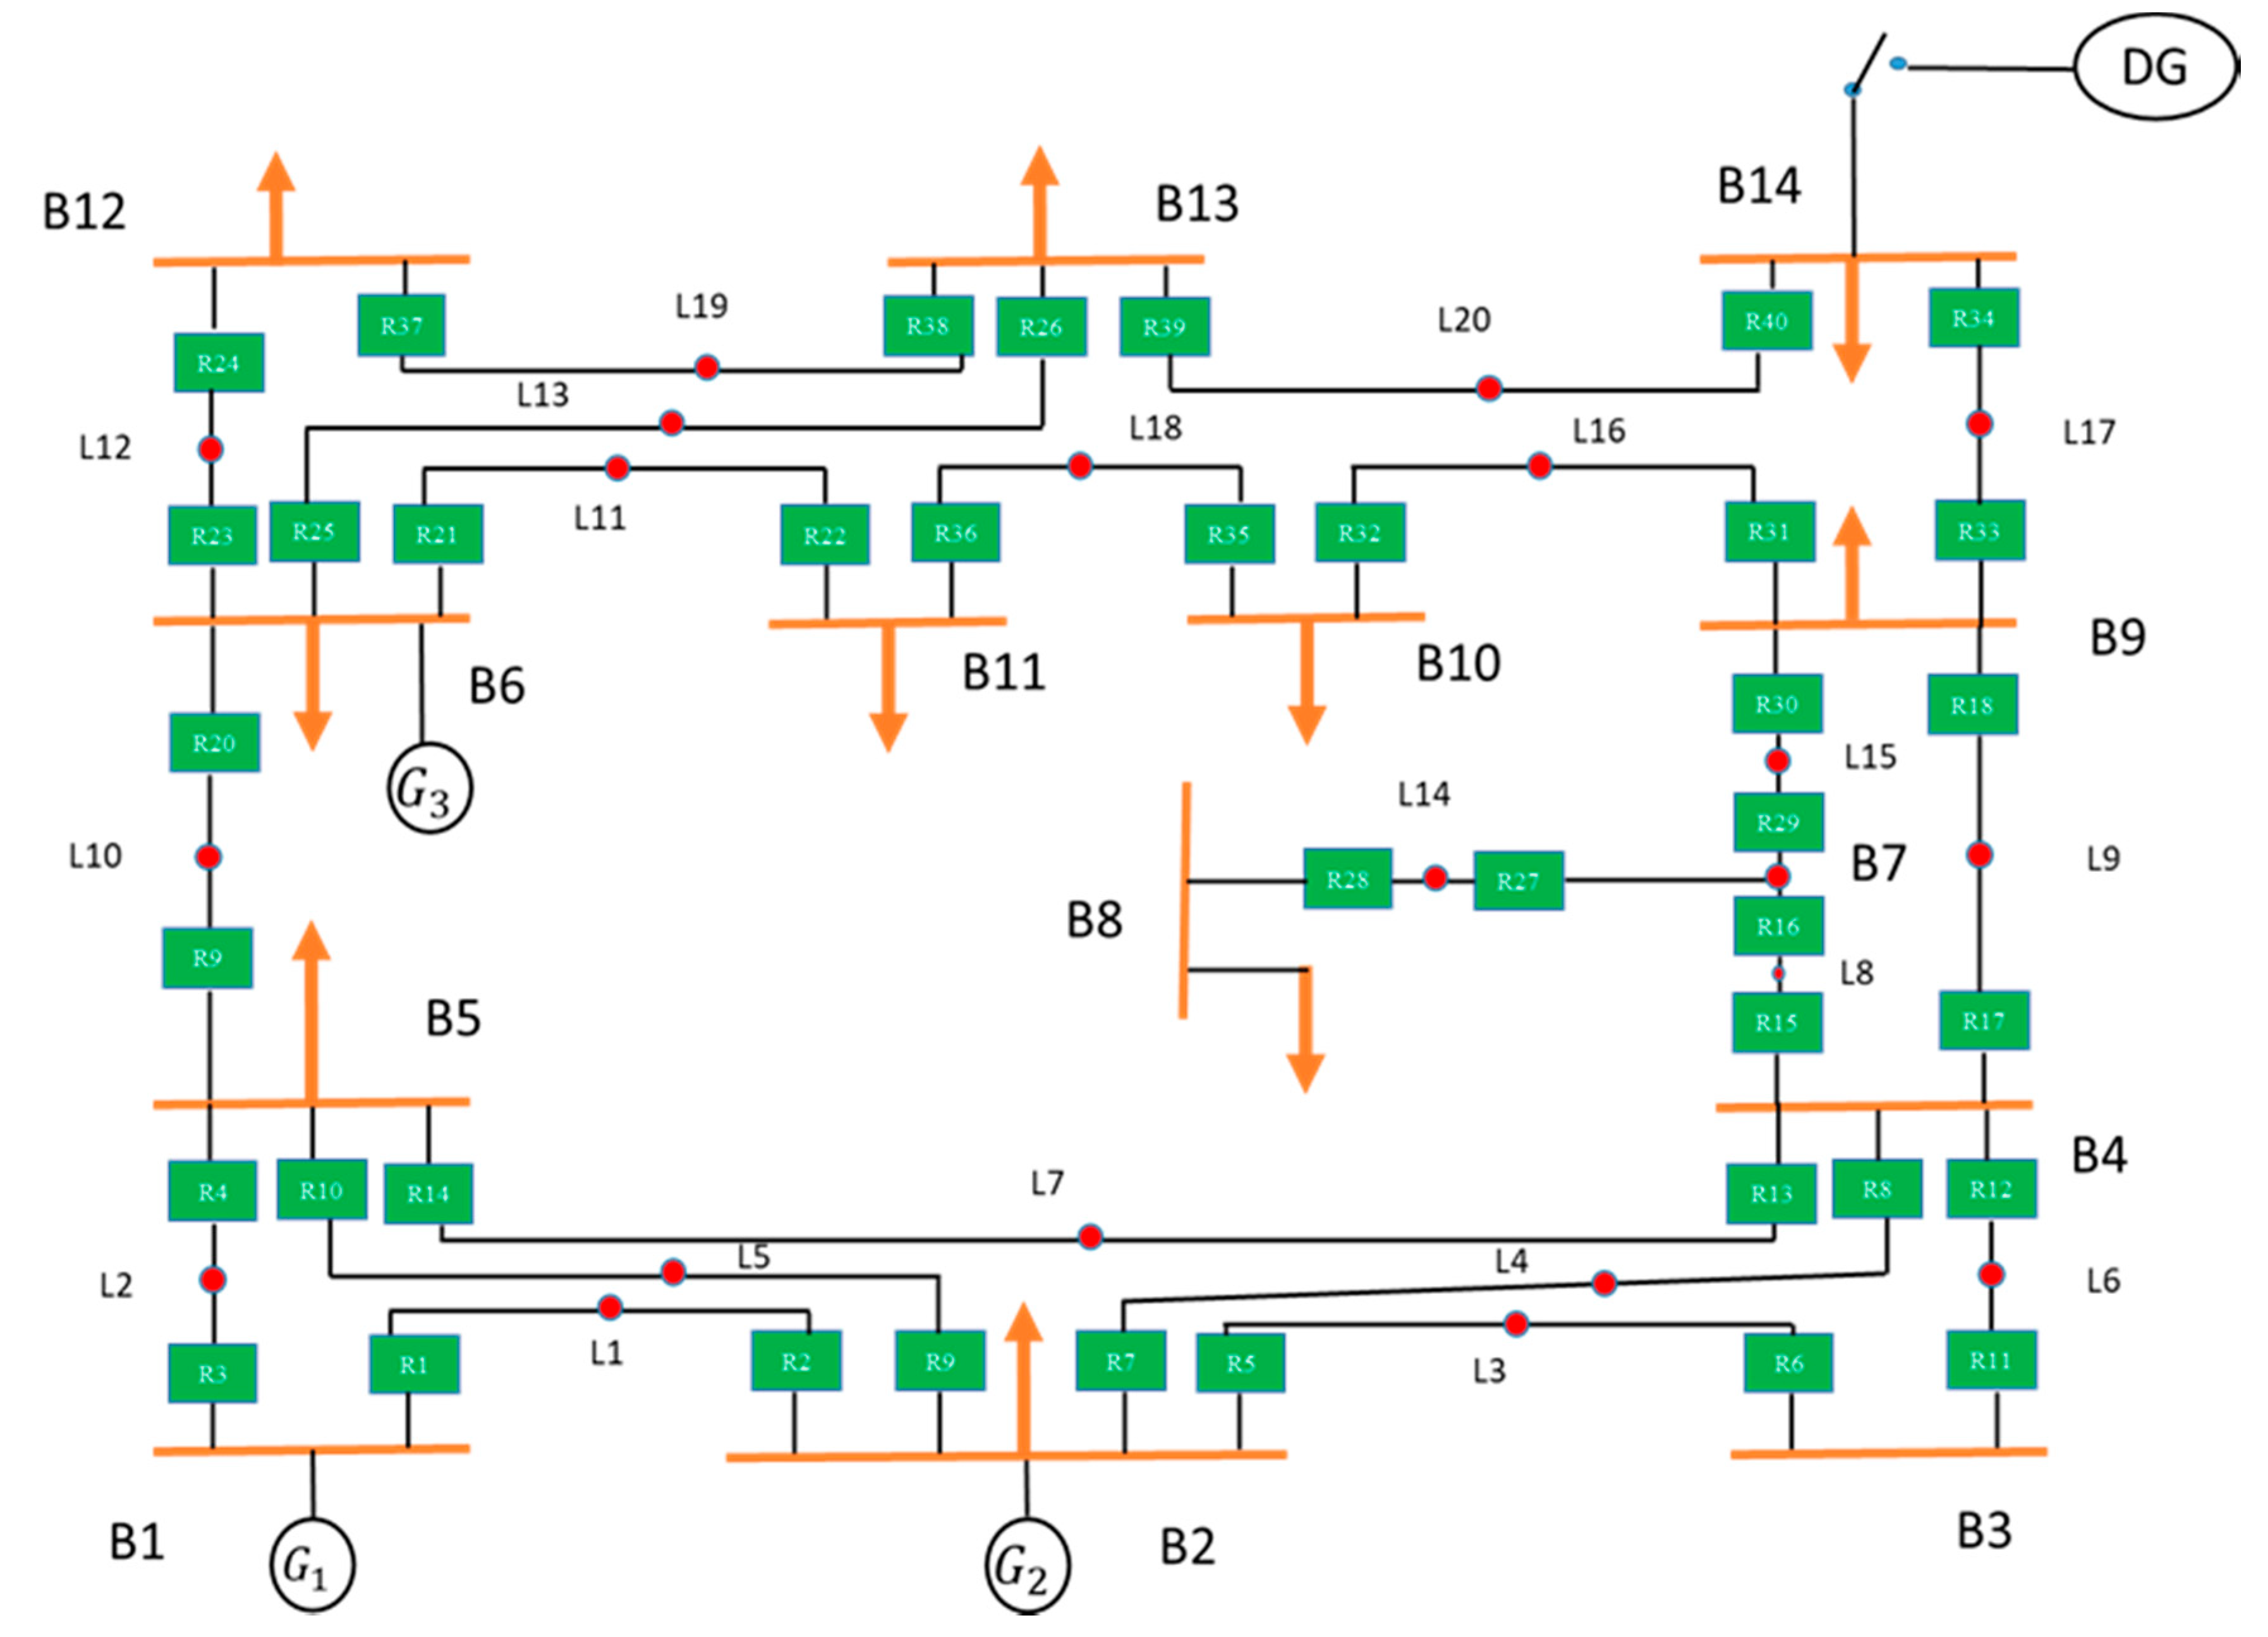
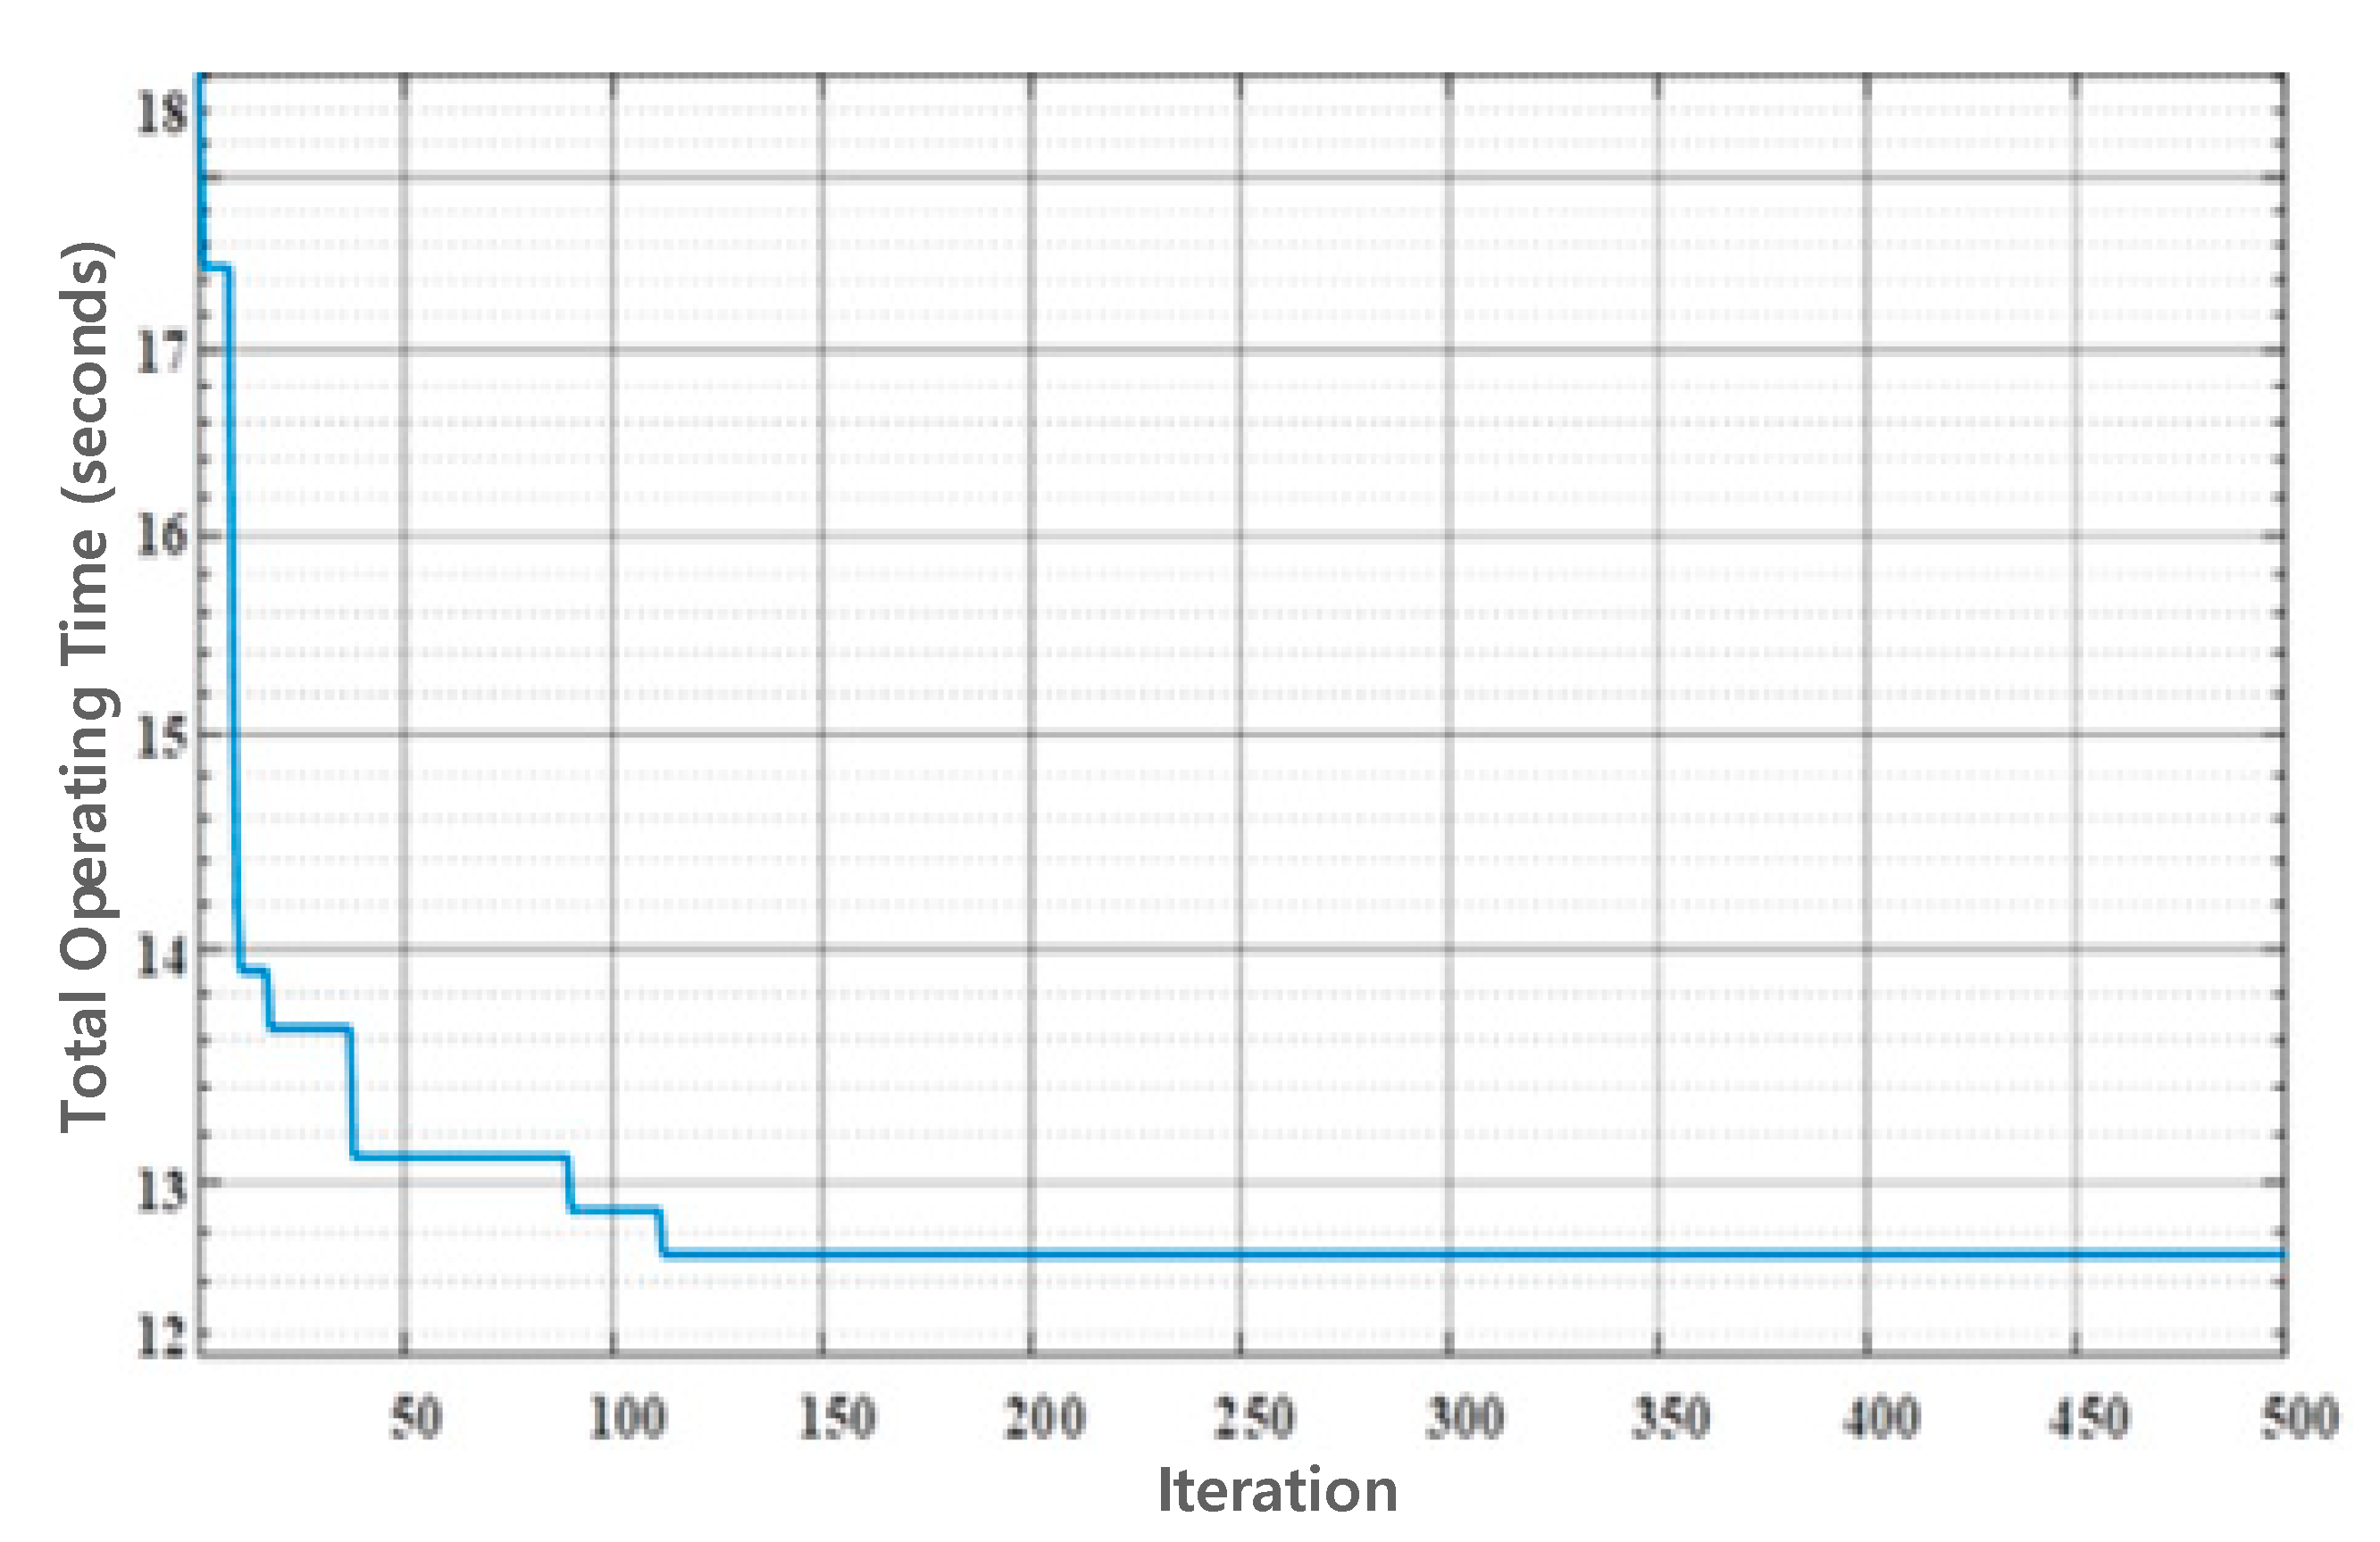
4.3. IEEE 14 Bus System Using Numerical Relays

Figure 11 shows the single line diagram of the IEEE 14-bus system that consists of 14 buses and 40 relays. The listed relays’ CT ratios (CTRs), P/B relay pairs, current transformer ration other information regarding this test system are shown in Table 7. The fault currents for the close-in 3ϕ faults and system information are mentioned in reference [58]. The lower and upper boundaries for TDS and PS are presumed as continuous and set in the range of [0.1 to 1.1] for TDS and [0.5 to 2] [59] with a coordination interval of 0.2 s. The optimum values obtained by the proposed algorithm for TDS and PS and total operating time are shown in Table 8, which shows that the proposed algorithm optimized and minimized all the values up to optimum values. Figure 12 shows the convergence characteristics of the objective function value obtained as a result of the simulation, which show that the convergence is faster and achieved the optimum value in a smaller number of iterations. For the 14-bus network, HHO was able to attain optimal results with a fast convergence rate after about 115 iterations. Table 9 shows the comparison of the proposed algorithm with other state of the art algorithms, which confirms the superiority of the proposed HHO. The overall improvement in optimal settings determined by HHO as compared to the hybrid genetic algorithm linear programming (HGA-LP), mixed integer linear programming (MILP), multiple embedded crossover PSO (MECPSO) and modified adaptive PSO (MAPSO) algorithms is 4.18%, 1.63%, 0.06%, 8.48%, respectively.

5. Conclusions

In this paper, the network relay coordination and optimization problem has been solved by using HHO. Relay optimization is formulated as MINLP targeted to minimize the overall operating time of relays by selecting as design parameters TDS and PS. For evaluation, three test systems with different scenarios have been considered. For DOCR optimization and coordination, a 9-bus system with a single generator and a 15-bus system with multiple DG penetration were tested, while for numerical relays, a 14-bus system having conventional as well as DGs is tested. The unique sieging and hunting capability of the HHO has been found affective in finding the global optimum values with robustness and better convergence as compared to other state of the art algorithms. The algorithm-wise comparison, for all three test systems, shows improved and optimum settings are found by HHO. The obtained results justify or claim that HHO is successful at finding better and optimum solutions for DOCRs and numerical relays proving it to be an effective tool for relay coordination and optimization.

Author Contributions

Formal analysis: K.-C.K. and S.-B.R.; Funding acquisition, K.-C.K., S.-R.O. and S.-B.R.; Investigation, A.W. and T.K.; Methodology, M.I., A.W., T.K. and B.M.K.; Project administration, K.-C.K.; Resources, S.-R.O. and S.-B.R.; Supervision, A.W. and S.-B.R.; Writing—original draft, A.W. and B.M.K.; Writing—review & editing, M.I., T.K. and B.M.K. All authors have read and agreed to the published version of the manuscript.

Funding

This work was supported by the Development of Modular Green Substation and Operation Technology of the Korea Electric Power Corporation (KEPCO).

Data Availability Statement

The data used to support the finding of this study are included within the article.

Conflicts of Interest

The authors declare no conflict of interest.

Appendix A

Table A1. Parameters of the algorithms.
AlgorithmParameterValue
PSOMax. iteration100
Population size60
(c1, c2)(2.025, 2.025)
(wmin, wmax)(0.4, 0.9)
GAMax. iteration100
Population size256
Crossover rate0.5
Mutation rate0.1
IDEMax. iteration500
Population size48
Crossover rate0.8
(F1, F2)(0.7, 0.3)
BBOMax. iteration40
Population size100
MTLBOMax. iteration500
Population size100
No. of cycles20
SAMax. iteration1000
Population size120
min, µmax)(0.95, 0.0111)
(wmin, wmax)(0.1, 0.9)
DEMax. iteration100
Population size30
Crossover rate0.4
Mutation factor0.5
HSMax. iteration100
Population size10
HMCR0.9
(BWmin, BWmax)(0.0001, 1.0)
(PARmin, PARmax)(0.4, 0.7)
GSOMax. iteration1000
IGSOMax. iteration1000
Threshold value0.01
MAPSO1, α2)(1, 1)
1, β2)(100, 50)

References

  1. Lu, Y.; Chung, J.-L. Detecting and solving the coordination curve intersection problem of overcurrent relays in subtransmission systems with a new method. Electr. Power Syst. Res. 2013, 95, 19–27. [Google Scholar] [CrossRef]
  2. Ezzeddine, M.; Kaczmarek, R.; Iftikhar, M. Coordination of directional overcurrent relays using a novel method to select their settings. IET Gener. Transm. Distrib. 2011, 5, 743–750. [Google Scholar] [CrossRef]
  3. Sharifian, H.; Abyaneh, H.A.; Salman, S.K.; Mohammadi, R.; Razavi, F. Determination of the minimum break point set using expert system and genetic algorithm. IEEE Trans. Power Deliv. 2010, 25, 1284–1295. [Google Scholar] [CrossRef]
  4. Yu, J.T.; Kim, C.H.; Wadood, A.; Khurshiad, T.; Rhee, S. Self-adaptive multi-population JAYA algorithm with lévy flights for solving economic load dispatch problems. IEEE Access 2019, 7, 21372–21384. [Google Scholar] [CrossRef]
  5. Yu, J.; Kim, C.H.; Wadood, A.; Khurshiad, T.; Rhee, S.B. A novel multi-population based chaotic JAYA algorithm with application in solving economic load dispatch problems. Energies 2018, 11, 1946. [Google Scholar] [CrossRef] [Green Version]
  6. Gholami Farkoush, S.; Khurshaid, T.; Wadood, A.; Kim, C.H.; Kharal, K.H.; Kim, K.H.; Rhee, S.B. Investigation and optimization of grounding grid based on lightning response by using ATP-EMTP and genetic algorithm. Complexity 2018, 2018, 1–8. [Google Scholar] [CrossRef]
  7. Khurshaid, T.; Wadood, A.; Farkoush, S.G.; Yu, J.; Kim, C.H.; Rhee, S.B. An improved optimal solution for the directional overcurrent relays coordination using hybridized whale optimization algorithm in complex power systems. IEEE Access 2019, 7, 90418–90435. [Google Scholar] [CrossRef]
  8. Haider, Z.M.; Mehmood, K.K.; Khan, S.U.; Khan, M.O.; Wadood, A.; Rhee, S.B. Optimal management of a distribution feeder during contingency and overload conditions by harnessing the flexibility of smart loads. IEEE Access 2021, 9, 40124–40139. [Google Scholar] [CrossRef]
  9. Wadood, A.; Khurshaid, T.; Farkoush, S.G.; Yu, J.; Kim, C.H.; Rhee, S.B. Nature-inspired whale optimization algorithm for optimal coordination of directional overcurrent relays in power systems. Energies 2019, 12, 2297. [Google Scholar] [CrossRef] [Green Version]
  10. Wadood, A.; Farkoush, S.G.; Khurshaid, T.; Yu, J.T.; Kim, C.H.; Rhee, S.B. Application of the JAYA Algorithm in solving the problem of the optimal coordination of overcurrent relays in single-and multi-loop distribution systems. Complexity 2019, 2019, 1–13. [Google Scholar] [CrossRef]
  11. Bhattacharya, S.K.; Goswami, S.K. Distribution network reconfiguration considering protection coordination constraints. Electr. Power Compon. Syst. 2008, 36, 1150–1165. [Google Scholar] [CrossRef]
  12. Abyaneh, H.; Al-Dabbagh, M.; Karegar, H.; Sadeghi, S.; Khan, R. A new optimal approach for coordination of overcurrent relays in interconnected power systems. IEEE Trans. Power Deliv. 2003, 18, 430–435. [Google Scholar] [CrossRef]
  13. Bedekar, P.P.; Bhide, S.R. Optimum coordination of directional overcurrent relays using the hybrid GA-NLP approach. IEEE Trans. Power Deliv. 2010, 26, 109–119. [Google Scholar] [CrossRef]
  14. Noghabi, A.S.; Sadeh, J.; Mashhadi, H.R. Considering different network topologies in optimal overcurrent relay coordination using a hybrid GA. IEEE Trans. Power Deliv. 2009, 24, 1857–1863. [Google Scholar] [CrossRef]
  15. Urdaneta, A.; Perez, L.; Restrepo, H. Optimal coordination of directional overcurrent relays considering dynamic changes in the network topology. IEEE Trans. Power Deliv. 1997, 12, 1458–1464. [Google Scholar] [CrossRef]
  16. Noghabi, A.S.; Mashhadi, H.R.; Sadeh, J. Optimal coordination of directional overcurrent relays considering different network topologies using interval linear programming. IEEE Trans. Power Deliv. 2010, 25, 1348–1354. [Google Scholar] [CrossRef]
  17. Afzal, M.M.; Khan, M.A.; Hassan, M.A.S.; Wadood, A.; Uddin, W.; Hussain, S.; Rhee, S.B. A comparative study of supercapacitor-based statcom in a grid-connected photovoltaic system for regulating power quality issues. Sustainability 2020, 12, 6781. [Google Scholar] [CrossRef]
  18. Najy, W.K.; Zeineldin, H.H.; Woon, W.L. Optimal protection coordination for microgrids with grid-connected and islanded capability. IEEE Trans. Ind. Electron. 2012, 60, 1668–1677. [Google Scholar] [CrossRef]
  19. Saleh, K.A.; Zeineldin, H.H.; El-Saadany, E.F. Optimal protection coordination for microgrids considering N-1 contingency. IEEE Trans. Ind. Inform. 2017, 13, 2270–2278. [Google Scholar] [CrossRef]
  20. Saleh, K.A.; Zeineldin, H.H.; Al-Hinai, A.; El-Saadany, E.F. Optimal coordination of directional overcurrent relays using a new time-current-voltage characteristic. IEEE Trans. Power Syst. 2014, 30, 537–544. [Google Scholar] [CrossRef]
  21. Saleh, K.A.; El-Saadany, E.F.; Al-Hinai, A.; Zeineldin, H.H. Dual-setting characteristic for directional overcurrent relays considering multiple fault locations. IET Gener. Transm. Distrib. 2015, 9, 1332–1340. [Google Scholar] [CrossRef]
  22. Wadood, A.; Kim, C.-H.; Farkoush, S.G.; Rhee, S.B. An adaptive protective coordination scheme for distribution system using digital overcurrent relays. In Proceedings of the Korean Institute of Illuminating and Electrical Installation Engineers, Gangwon, Korea, 30 August 2017; p. 53. [Google Scholar]
  23. Zeineldin, H.H.; El-Saadany, E.F.; Salama, M.M.A. Optimal coordination of overcurrent relays using a modified particle swarm optimization. Electr. Power Syst. Res. 2006, 76, 988–995. [Google Scholar] [CrossRef]
  24. Amraee, T. Coordination of directional overcurrent relays using seeker algorithm. IEEE Trans. Power Deliv. 2012, 27, 1415–1422. [Google Scholar] [CrossRef]
  25. Urdaneta, A.; Nadira, R.; Jimenez, L.P. Optimal coordination of directional overcurrent relays in interconnected power systems. IEEE Trans. Power Deliv. 1988, 3, 903–911. [Google Scholar] [CrossRef]
  26. Wadood, A.; Farkoush, S.G.; Khurshaid, T.; Kim, C.-H.; Yu, J.; Geem, Z.W.; Rhee, S.-B. An optimized protection coordination scheme for the optimal coordination of overcurrent relays using a nature-inspired root tree algorithm. Appl. Sci. 2018, 8, 1664. [Google Scholar] [CrossRef] [Green Version]
  27. Wadood, A.; Khurshaid, T.; Farkoush, S.G.; Kim, C.H.; Rhee, S.B. A bio-inspired rooted tree algorithm for optimal coordination of overcurrent relays. In Proceedings of the International Conference on Intelligent Technologies and Applications, Bahawalpur, Pakistan, 23–25 October 2018; Springer: Berlin/Heidelberg, Germany, 2018; pp. 188–201. [Google Scholar]
  28. Wadood, A.; Kim, C.-H.; Khurshiad, T.; Farkoush, S.G.; Rhee, S.-B. Application of a continuous particle swarm optimization (CPSO) for the optimal coordination of overcurrent relays considering a penalty method. Energies 2018, 11, 869. [Google Scholar] [CrossRef] [Green Version]
  29. Khurshaid, T.; Wadood, A.; Farkoush, S.G.; Kim, C.-H.; Cho, N.; Rhee, S.-B. Modified particle swarm optimizer as optimization of time dial settings for coordination of directional overcurrent relay. J. Electr. Eng. Technol. 2019, 14, 55–68. [Google Scholar] [CrossRef]
  30. Mansour, M.M.; Mekhamer, S.F.; El-Kharbawe, N. A modified particle swarm optimizer for the coordination of directional overcurrent relays. IEEE Trans. Power Deliv. 2007, 22, 1400–1410. [Google Scholar] [CrossRef]
  31. Baghaee, H.R.; Mirsalim, M.; Gharehpetian, G.B.; Talebi, H.A.; Aghamirsalim, M. MOPSO/FDMT-basedpareto-optimal solution for coordination of overcurrent relays in interconnected networks and multi-DER microgrids. IET Gener. Transm. Distrib. 2018, 12, 2871–2886. [Google Scholar] [CrossRef]
  32. Darabi, A.; Bagheri, M.; Gharehpetian, G.B. Highly accurate directional overcurrent coordination via combination of Rosen’s gradient projection–complex method with GA-PSO algorithm. IEEE Syst. J. 2019, 14, 1171–1182. [Google Scholar] [CrossRef]
  33. Thangaraj, R.; Pant, M.; Deep, K. Optimal coordination of over-current relays using modified differential evolution algorithms. Eng. Appl. Artif. Intell. 2010, 23, 820–829. [Google Scholar] [CrossRef]
  34. Kim, C.H.; Khurshaid, T.; Wadood, A.; Farkoush, S.G.; Rhee, S.B. Gray wolf optimizer for the optimal coordination of directional overcurrent relay. J. Electr. Eng. Technol. 2018, 13, 1043–1051. [Google Scholar]
  35. Singh, M.; Panigrahi, B.; Abhyankar, A. Optimal coordination of directional over-current relays using teaching learning-based optimization (TLBO) algorithm. Int. J. Electr. Power Energy Syst. 2013, 50, 33–41. [Google Scholar] [CrossRef]
  36. Albasri, F.A.; Alroomi, A.R.; Talaq, J.H. Optimal Coordination of directional overcurrent relays using biogeography-based optimization algorithm. IEEE Trans. Power Deliv. 2015, 30, 1810–1820. [Google Scholar] [CrossRef]
  37. El-Hana Bouchekara, H.R.; Zellagui, M.; Abido, M.A. Coordination of directional overcurret relays using the backtracking search algorithm. J. Electr. Syst. 2016, 12, 387–405. [Google Scholar]
  38. Damchi, Y.; Dolatabadi, M.; Mashhadi, H.R.; Sadeh, J. MILP approach for optimal coordination of directional overcurrent relays in interconnected power systems. Electr. Power Syst. Res. 2018, 158, 267–274. [Google Scholar] [CrossRef]
  39. Khurshaid, T.; Wadood, A.; Farkoush, S.G.; Kim, C.H.; Yu, J.; Rhee, S.B. Improved firefly algorithm for the optimal coordination of directional overcurrent relays. IEEE Access 2019, 7, 78503–78514. [Google Scholar] [CrossRef]
  40. Bouchekara, H.; Zellagui, M.; Abido, M.; Bouchekara, H.R.E.-H. Optimal coordination of directional overcurrent relays using a modified electromagnetic field optimization algorithm. Appl. Soft Comput. 2017, 54, 267–283. [Google Scholar] [CrossRef]
  41. Kalage, A.A.; Ghawghawe, N.D. Optimum coordination of directional overcurrent relays using modified adaptive teaching learning based optimization algorithm. Intell. Ind. Syst. 2016, 2, 55–71. [Google Scholar] [CrossRef] [Green Version]
  42. Mahari, A.; Seyedi, H. An analytic approach for optimal coordination of overcurrent relays. IET Gener. Transm. Distrib. 2013, 7, 674–680. [Google Scholar] [CrossRef]
  43. Alipour, M.; Teimourzadeh, S.; Seyedi, H. Improved group search optimization algorithm for coordination of directional overcurrent relays. Swarm Evol. Comput. 2015, 23, 40–49. [Google Scholar] [CrossRef]
  44. Alam, M.N.; Das, B.; Pant, V. A comparative study of metaheuristic optimization approaches for directional overcurrent relays coordination. Electr. Power Syst. Res. 2015, 128, 39–52. [Google Scholar] [CrossRef]
  45. Farzinfar, M.; Jazaeri, M.; Razavi, F. A new approach for optimal coordination of distance and directional over-current relays using multiple embedded crossover PSO. Int. J. Electr. Power Energy Syst. 2014, 61, 620–628. [Google Scholar] [CrossRef]
  46. Saremi, S.; Mirjalili, S.; Lewis, A. Grasshopper optimization algorithm: Theory and application. Adv. Eng. Softw. 2017, 105, 30–47. [Google Scholar] [CrossRef] [Green Version]
  47. Singh, M.; Panigrahi, B.K.; Abhyankar, A.R.; Das, S. Optimal coordination of directional over-current relays using informative differential evolution algorithm. J. Comput. Sci. 2014, 5, 269–276. [Google Scholar] [CrossRef]
  48. Wolpert, D.H.; Macready, W.G. No free lunch theorems for optimization. IEEE Trans. Evol. Comput. 1997, 1, 67–82. [Google Scholar] [CrossRef] [Green Version]
  49. Gers, J.M.; Holmes, E.J. Protection of Electricity Distribution Networks; IET: London, UK, 2004; Volume 47. [Google Scholar]
  50. Heidari, A.A.; Mirjalili, S.; Faris, H.; Aljarah, I.; Mafarja, M.; Chen, H. Harris hawks optimization: Algorithm and applications. Future Gener. Comput. Syst. 2019, 97, 849–872. [Google Scholar] [CrossRef]
  51. Bednarz, J.C. Cooperative hunting in Harris’ Hawks (parabuteo unicinctus). Science 1988, 239, 1525. [Google Scholar] [CrossRef] [PubMed]
  52. Humphries, N.E.; Queiroz, N.; Dyer, J.R.; Pade, N.G.; Musyl, M.K.; Schaefer, K.M.; Fuller, D.W.; Brunnschweiler, J.M.; Doyle, T.K.; Houghton, J.D.; et al. Environmental context explains Lévy and brownian movement patterns of marine predators. Nature 2010, 465, 1066–1069. [Google Scholar] [CrossRef] [Green Version]
  53. Viswanathan, G.M.; Afanasyev, V.; Buldyrev, S.V.; Murphy, E.J.; Prince, P.A.; Stanley, H.E. Lévy flight search patterns of wandering albatrosses. Nature 1996, 381, 413. [Google Scholar] [CrossRef]
  54. Sims, D.W.; Southall, E.J.; Humphries, N.E.; Hays, G.C.; Bradshaw, C.J.; Pitchford, J.W.; James, A.; Ahmed, M.Z.; Brierley, A.S.; Hindell, M.A.; et al. Scaling laws of marine predator search behaviour. Nature 2008, 451, 1098–1102. [Google Scholar] [CrossRef] [PubMed]
  55. Gautestad, A.O.; Mysterud, I. Complex animal distribution and abundance from memory-dependent kinetics. Ecol. Complex. 2006, 3, 44–55. [Google Scholar] [CrossRef]
  56. Shlesinger, M.F. Levy flights: Variations on a theme. Physica D 1989, 38, 304–309. [Google Scholar] [CrossRef]
  57. Viswanathan, G.M.; Afanasyev, V.; Buldyrev, S.V.; Havlin, S.; Da Luz, M.G.E.; Raposo, E.P.; Stanley, H.E. Lévy flights in random searches. Physica A 2000, 282, 1–12. [Google Scholar] [CrossRef]
  58. Alam, M.N. Adaptive protection coordination scheme using numerical directional overcurrent relays. IEEE Trans. Ind. Inform. 2019, 15, 64–73. [Google Scholar] [CrossRef]
  59. Alam, M.N.; Das, B.; Pant, V. An interior point method based protection coordination scheme for directional overcurrent relays in meshed networks. Int. J. Electr. Power Energy Syst. 2016, 81, 153–164. [Google Scholar] [CrossRef]
Figure 1. Schematic outline for DOCR coordination in an electrical power network.
Energies 14 05603 g001
Figure 2. Escaping energy trend for two runs [50].
Energies 14 05603 g002
Figure 3. Hard siege scenario considering one hawk [50].
Energies 14 05603 g003
Figure 4. Soft siege mode of hawks with progressive rapid dives [50].
Energies 14 05603 g004
Figure 5. The position vectors for hard siege mode with progressive rapid dives in 2D and 3D space [50].
Energies 14 05603 g005
Figure 6. Flowchart of HHO.
Energies 14 05603 g006
Figure 7. Single line diagram of the IEEE 9 bus system.
Energies 14 05603 g007
Figure 8. Convergence characteristics of HHO for the 9-bus system.
Energies 14 05603 g008
Figure 9. IEEE 15 bus system.
Energies 14 05603 g009
Figure 10. Convergence characteristics of HHO for a 15-bus system.
Energies 14 05603 g010
Figure 11. Single line diagram of the IEEE 14 bus system.
Energies 14 05603 g011
Figure 12. Convergence characteristics of HHO for a 14-bus system.
Energies 14 05603 g012
Table 1. HHO parameters used during the simulation.
ParameterValues
Population Size, N200
Maximum Iterations, T500
Random Jump Strength, J[0, 2]
Number of Variables, N_Var:
For 9-Bus network96
For 15-bus network84
For 14-bus network80
Table 2. Optimum value of TDS for the IEEE 9 bus system.
Relay NoTDSPS
10.10040.5018
20.10000.7857
30.10100.5048
40.10000.5000
50.10040.9900
60.10030.5016
70.10150.5426
80.10011.5942
90.10210.5287
100.10010.5004
110.10001.9928
120.10000.8153
130.10050.5477
140.10000.5800
150.10000.5530
160.10000.5048
170.10300.5000
180.10110.5154
190.10000.8906
200.10120.5000
210.10130.6588
220.10450.5067
230.10000.5226
240.10000.5000
Total Operating Time8.7266 (s)
Table 3. Comparison of HHO with other algorithms.
AlgorithmObjective Function
PSO [44]13.9742
GA [13]32.6058
NLP [13]19.4041
IDE [41]59.6741
HS [40]9.838
BBO [36]28.8348
MTLBO [41]41.9041
Proposed HHO8.7266
Table 4. Current transformer ratio.
Relay No.CTR
18, 20, 21, 291600:5
2–4–8–11–12–14–15–231200:5
1–3–5–10–13–19–36–37–40–42800:5
6–7–9–16–24–25–26–27–28–31–32–33–35600:5
17–22–30–34–38–39–41400:5
Table 5. Optimum values of TDS for the IEEE 15 bus system.
Relay NoHHORelay NoHHO
TDSPS TDSPS
10.10050.5027220.11200.5600
20.15980.5782230.10361.9400
30.10000.5000240.10060.5031
40.10100.5051250.10000.5000
50.10000.5000260.10590.5297
60.16570.8469270.10140.5072
70.20520.5006280.20521.0258
80.10090.5045290.10110.5054
90.10030.5015300.10330.5166
100.21520.5000310.21521.0760
110.10000.5000320.10740.5372
120.10131.7029330.10020.5010
130.12210.7558340.10280.5142
140.10172.4487350.10000.5000
150.10000.5000360.10220.5109
160.10310.5064370.13330.6666
170.10000.5000380.10000.5000
180.10312.1313390.12012.4678
190.10030.5016400.10240.5121
200.60442.3997410.10000.5000
210.13770.6885420.10000.500
Total Operating Time11.537 (s)
Table 6. Comparison of HHO with other up to Date Algorithms.
Algorithm Objective Function
SA [24]12.227
MINLP [24]15.335
AA [42]11.6618
DE [44]11.7591
HS [44]12.6225
BSA [37]16.293
MTLBO [41]52.5039
GSO [43]13.6542
IGSO [43]12.135
MEFO [40]13.953
Proposed HHO11.537
Table 7. Current transfer ration.
CT RatioRelay NoCT RatioRelay No
8000/511000/520, 35, 38
5000/529800/516, 18
4000/55, 25600/522, 32, 37, 40
3500/53, 14500/517, 26, 34
3000/521400/52, 4, 8, 10, 13, 24
2500/57250/511
2000/512, 36, 39200/56
1600/59, 19, 23, 27, 3150/528
1200/515, 30, 33--
Table 8. Optimum TDS and PS for Case 3.
Relay NoHHORelay NoHHO
TDSPS TDSPS
10.10000.5898210.10070.5842
20.10000.5120220.10810.5606
30.10010.5000230.10030.9667
40.10000.5021240.10210.6392
50.10000.7892250.10890.6451
60.11010.5001260.10210.6667
70.10120.5000270.10130.5799
80.10000.7204280.10490.5959
90.10180.5353290.10520.5462
100.10100.8633300.10710.5622
110.21960.7160310.10000.6141
120.10000.5779320.10010.5601
130.1000.5000330.10140.5000
140.10120.9390340.10480.5443
150.11310.7789350.10400.5970
160.10040.6082360.10000.9009
170.11150.5263370.10280.6388
180.10280.5023380.10290.5727
190.11930.8656390.10490.5014
200.10150.7498400.10950.5376
Total Operating Time12.9274 (s)
Table 9. Comparison of HHO with other algorithms.
Algorithm Objective Function
HGA-LP [38]13.4914
MILP [38]13.1411
MECPSO [45]12.919
MAPSO [45]14.126
Proposed HHO12.9274
Publisher’s Note: MDPI stays neutral with regard to jurisdictional claims in published maps and institutional affiliations.

