Article

Development of a Unified Taxonomy for HVAC System Faults

Building Technology & Urban Systems Division, Lawrence Berkeley National Laboratory, Berkeley, CA 94720, USA
*
Author to whom correspondence should be addressed.
Energies 2021, 14(17), 5581; https://doi.org/10.3390/en14175581
Submission received: 11 July 2021 / Revised: 13 August 2021 / Accepted: 25 August 2021 / Published: 6 September 2021

Abstract

:
Detecting and diagnosing HVAC faults is critical for maintaining building operation performance, reducing energy waste, and ensuring indoor comfort. An increasing deployment of commercial fault detection and diagnostics (FDD) software tools in commercial buildings in the past decade has significantly increased buildings’ operational reliability and reduced energy consumption. A massive amount of data has been generated by the FDD software tools. However, efficiently utilizing FDD data for ‘big data’ analytics, algorithm improvement, and other data-driven applications is challenging because the format and naming conventions of those data are very customized, unstructured, and hard to interpret. This paper presents the development of a unified taxonomy for HVAC faults. A taxonomy is an orderly classification of HVAC faults according to their characteristics and causal relations. The taxonomy includes fault categorization, physical hierarchy, fault library, relation model, and naming/tagging scheme. The taxonomy employs both a physical hierarchy of HVAC equipment and a cause-effect relationship model to reveal the root causes of faults in HVAC systems. A structured and standardized vocabulary library is developed to increase data representability and interpretability. The developed fault taxonomy can be used for HVAC system ‘big data’ analytics such as HVAC system fault prevalence analysis or the development of an HVAC FDD software standard. A common type of HVAC equipment-packaged rooftop unit (RTU) is used as an example to demonstrate the application of the developed fault taxonomy. Two RTU FDD software tools are used to show that after mapping FDD data according to the taxonomy, the meta-analysis of the multiple FDD reports is possible and efficient.

1. Introduction

Commercial buildings account for more than 40% of energy consumption in the United States, constituting approximately 5296 billion kWh (18.07 quadrillion Btu) of electricity consumption in 2020 [1]. Faults, malfunctioning control and operation, and poor maintenance account for 15–30% of energy waste in commercial buildings in the United States [2]. Apart from energy waste, decreased building thermal comfort, increased system operation and maintenance costs are also observed due to various faults in heating, ventilation and air-conditioning (HVAC) systems [3,4,5]. The integration and deployment of fault detection and diagnostics (FDD) tools are proven to significantly enable reliable HVAC system operation, as well as decrease energy consumption and other negative impacts on buildings and occupants [6,7,8]. It is estimated that by deploying FDD tools in the buildings, 5–20% energy saving can be achieved [2,8], and a recent major study saw median energy savings of 9% from implementation of FDD tools across 9 million square meters (97 million square feet) of commercial building floorspace [9].
FDD is designed to detect HVAC system abnormalities, locate the fault causes, and facilitate the analytics on the possible impacts of faults during the operation of a system or equipment. In the past three decades, extensive research has been conducted on developing advanced FDD methods and tools [10]. Today, more than 30 commercialized FDD software tools are available in the U.S. and the deployment scope has witnessed a rapid increase [8]. FDD software is an analytics tool which usually uses building automation system (BAS) data (sometimes in combination with meter data, weather data or other information) and various diagnostics approaches such as rule-based, physical model-based and data-driven methods to provide insights into building system operation. For example, a BAS may instruct an air handling unit (AHU) outside air damper to be at minimum position, but the FDD algorithm identifies that mixed air temperature tracks the outside air temperature, indicating that the outside air damper is actually stuck in an open position, which would result in hidden energy waste [11]. FDD software usually includes a front-end graphical user interface (GUI) which offers a dashboard for system operators to monitor system operation and flag the operational abnormalities. Additionally, FDD tools can output their analytics results in a variety of formats, including tabular/text and visual format. Figure 1 illustrates a report format of an FDD tool. In the tabular/text summary example of a FDD report (Figure 1a), various semantic representations of system/equipment/component operational status are employed to describe a fault property. Each piece of semantic representation can be viewed as a fault message log and be automatically generated into fault records or fault message logs with different time duration in the database. The fault records or fault message logs are usually presented in text or tabular formats and can be exported to a standard format spreadsheet file. To support root cause analysis of reported faults, FDD tools may also offer charting and trending capabilities to users (Figure 1b). The underlying fault detection algorithms may be the same in either case; these examples relate specifically to the presentation of FDD results.
The rapid expansion in deployment of FDD software is generating and storing data that reflect system operational conditions at an increasing scale. For example, the FDD tools deployed in Walmart supermarkets generated 25 million HVAC alarms company-wide in 2019 [13]. The FDD report data, in theory, offers a valuable opportunity to understand the nature of commercial buildings’ operational performance at an unprecedented level of granularity. However, compared with considerable efforts on the improvement of algorithms in the FDD tools, few studies are found to explore and standardize FDD software report data despite several organizations such as FDD subcommittee of ASHRAE TC 7.5 and U.S. National Institute Standards and Technology were reported working on labeling conventions for FDD tools [14]. Some industry efforts have produced industry available protocols to improve the semantic data interpretability in building applications such as Brick Schema [15], Project Haystack [16], and the ontology of smart building (SBOnto) [17]. A thorough review of these efforts can be found in [18]. Nevertheless, those protocols lack of capabilities to standardize FDD-reported fault data.
Different from BAS data where the numerical format is used to reflect system operation, FDD report data (as shown in Figure 1a) is usually presented in a text format to provide a semantic definition of a specific fault (e.g., faulty components, fault duration, description of fault nature, and sometimes fault cost impacts) for a piece of equipment or the system. Although data from FDD tool reports may contain abundant information, FDD report data mining is very challenging. Several barriers have been identified that hinder the effective meta-analysis of FDD report data.
  • There is not a standardized FDD report data format in the building FDD software industry. Various unstructured semantic representations are used in different FDD tools to create a diverse report data format. This causes difficulty in automatically extracting information and data analytics from multiple FDD software tools.
  • Inconsistent fault naming conventions in various FDD tools decrease the interpretability of the data. Very random and customized fault names are employed across different FDD tool providers or even within one software tool but different versions. For example, in one commercial FDD tool, a ‘discharge air damper hunting’ fault is reported to reflect a malfunctioning damper control in variable air volume (VAV) air terminal units (ATUs). However, in another FDD tool, this fault may be reported as a ‘discharge air damper cycling’ fault or an ‘unstable damper’ fault. This causes an obvious discrepancy among different FDD reports or software. In some cases, fault messages can only be interpreted by FDD tool developers.
  • FDD software tools employ a mixture of fault type definitions with opaque relationships between them. Multiple fault flag messages may be generated for one piece of equipment, but they may reflect the same fault root causes. For example, a ‘low supply air temperature’ fault, a ‘simultaneous heating and cooling’ fault, and a ‘stuck cooling coil valve’ fault may be reported concurrently. At face value, this would be counted as three faults, when in reality the stuck cooling coil valve may be the single true fault that is resulting in the other two effects being observed. A successful meta-analysis of FDD data requires the relationships between different fault types to be defined. Hence, duplicated information, which may prevent efficient analyses on the data, may exist in the FDD reports.
  • There is a lack of a consistent physical hierarchy, which can be used to classify faults occurring at different levels of operation (e.g., component level, sub-system level, whole system level). Additionally, some critical information related to the equipment/component or even fault nature may be missed in the FDD report data. For example, a ‘flat sensor’ fault may be reported by a FDD tool but no information on what type of sensor (e.g., temperature or air flow) is given in the fault name. This causes some FDD reports to provide a high volume of data but information is poor. Further, there may be atypical components included in the FDD report due to the mistaken label of an equipment. For example, the ‘compressor short cycling’ fault was found in the AHU fault detection report of one FDD tool. However, the reported component type, i.e., the compressor, should not be included in the AHU but other types of equipment such as chillers. This equipment type label error is mainly because there is not a clear and consistent equipment physical hierarchy when developing the FDD tools.
Leveraging this wealth of data to obtain scaled building performance insights requires the synthesis of system and software outputs that present discrepant naming conventions, hierarchical physical granularity of reporting, and definitions of efficiency opportunities. This represents a need for domain-specific semantic representation that can be applied to unify the information from diverse sources into a consistent and common knowledge framework. Two semantic approaches can be used to develop data models to increase data representability and interoperability [17]. One approach is to use an ontological frame to describe data structure and relations, another type is to use taxonomy to specify data terminology as well as prescribe data structure. Ontology defines common language and representation so that information and knowledge can be described in structured data [19]. In the ontology framework, a standardized vocabulary library is used to define properties, classes, and attributes of the components [20]. Another classification approach is taxonomy, which is the classification scheme which categorizes a set of information by employing agreed vocabulary of items in either a hierarchical or non-hierarchical structure [17]. Familiar examples of taxonomies include those used in the biological sciences [21], and the Dewey Decimal system [22]; additional examples can be found in web search and browse frameworks and software testing [23,24].
In this study, a taxonomy for HVAC system faults is developed to enable the effective interpretation and mining of data obtained from various FDD software reports. The taxonomy presented in this work, extends the state of knowledge established in prior work by providing a unique classification for the faults in HVAC systems. The taxonomy permits unification across different layers in the equipment-component location-component type-fault nature hierarchy, across diverse fault naming or indexing conventions, and across multiple commonly used conventions for determining whether a fault is present. The current version of the taxonomy includes faults in three common types of HVAC equipment: packaged rooftop units (RTUs), AHUs, and VAV ATUs. The developed taxonomy was principally designed to support a large-scale U.S. fault prevalence study, but is expected to have broader applications for HVAC researchers, FDD software developers, and commercial building owners. In the fault prevalence research, the occurrence and prevalence of various types of faults occurring in HVAC systems in commercial buildings will be analyzed according to different drivers such as building types, climate zones, and equipment operation conditions. Data used to develop calculation metrics is primarily based upon the report data generated from multiple commercial FDD tools in the U.S. Therefore, efficient interpretation and analytics of FDD software report data are very critical.
The paper is organized as follows: a review of related works is introduced in Section 2. In Section 3, the development methodology for fault taxonomy is described. The fault taxonomy for RTUs is employed as an example to describe the procedure. A case study of using the taxonomy to analyze the outputs of two FDD tools is presented in Section 4. Several discussions are presented in Section 5. Section 6 presents conclusions.

2. Background and Related Work

2.1. Fault Descriptions Used by Existing FDD Software

The definition of the term ‘fault’ is a key to understanding the analysis output of FDD tools. According to IFAC Technical Committee SAFEPROCESS [25], a fault is ‘an unpermitted deviation of at least one characteristic property (feature) of the system from the acceptable, usual, standard condition’. Besides that, two other definitions were given to malfunction and failure as comparisons with the fault. A malfunction is ‘an intermittent irregularity in the fulfillment of a system’s desired function’. A failure is ‘a permanent interruption of a system’s ability to perform a required function under specified operating conditions’. A fault can cause a malfunction in one component or system, and then lead to a failure of the component or system.
However, faults reported from today’s FDD tools in the HVAC industry comprise a wider scope which may include faults, malfunction, and corresponding symptoms in the system. This is because enormous operational abnormalities, which significantly affect the normal operational performance, have been found in the HVAC system in either commercial or residential buildings [26]. According to Frank et al. existing commercial FDD tools use three general categories of fault type definition based upon how the faults are presented [27]. The categories include condition-based, behavior-based, or outcome-based faults. Table 1 lists the descriptions of the three fault types. The definitions portion of the taxonomy permits reconciliation of the fact that these three fault instances indeed refer to a single fault state as opposed to multiple independent fault states.
As an introductory example shown in Table 1, consider an AHU with its outside air damper stuck open in the mechanical cooling operation mode. In the FDD tool, the AHU’s faulted state may be defined by its condition (i.e., outside air damper is stuck open), behavior (i.e., mixed air temperature is too high), or outcome (i.e., the excessive cooling energy consumption). However, if the AHU is experiencing a call for preheating when the outside temperature is very low in the winter season, it would still be considered faulted under the condition-based definition (the outside air damper is stuck open), but not under the behavior-based definition because mixing air temperature in the mixing box may not be abnormal. The AHU’s state under the outcome-based definition would be determined by the amount of chilled water flow through the cooling coil compared to a normal level of chilled water consumption. While condition-based and behavior-based fault conventions are more often seen in the tabular/text analysis summary of the commercial FDD tools outputs, all three definitions may be used in the tools depending on the available input data and the tool developer’s preferred approaches.

2.2. Fault Taxonomy in the HVAC Industry

Fault or data taxonomy is found to be critical to decouple faults and facilitate data mining in HVAC systems. In order to identify the fault causes, faults in RTUs are classified into electrical-related or controls-related and mechanical related categories [28]. Under this classification, 40% of faults were identified as electrical-related or controls-related faults, and 60% percent of faults were grouped into mechanical related faults. Similarly, Li and Braun developed a taxonomy for RTU faults which are grouped into two categories as component level faults and system level faults [29]. In component-level faults, the fault source impact is restricted to a specific component. The impacts on the system can be traced back to this source impact. For instance, a compressor valve leakage fault is grouped into the component fault category. In a system-level fault, the source impact cannot be confined to a specific location or component. For example, a low refrigerant charge fault is grouped into a system level fault. The developed taxonomy was used to handle multiple simultaneous faults across different components. Cheung and Braun grouped faults in HVAC systems into six categories including control faults, sensor faults, RTU and split air conditioner faults, chiller faults and other uncategorized faults [30]. Under this fault classification, faults were mainly categorized according to their locations in RTUs. However, some common faults in AHUs and VAV terminal units were not investigated in detail. Similarly, Zhang and Hong classified operational faults into five categories as fouling fault, control fault, sensor offset, performance degradation, and stuck fault in a VAV system [31]. These faults may occur in different locations in a VAV HVAC system. For example, a sensor offset fault can occur in an economizer or heating/cooling coil. Various fault models were developed to describe the fault characteristics, and fault symptoms were analyzed. Despite common faults in an air conditioner unit being classified, those faults were all actuator-related faults and no sensor and control-related faults were discussed. Besides, the authors did not provide a complete fault name library.

2.3. Fault Taxonomy in Other Industries

Apart from the data taxonomy in the HVAC industry, we also reviewed literature from other industries including construction industry, process industry, power system industry, and software industry. We found that the establishment of a clear and accurate data/fault taxonomy not only increases the systematic description of data/faults from multiple data sources, but also facilitates many applications such as locating faults in a complex system, developing a fault analysis system, improving data interoperability, and interpretability.
For example, in order to improve construction productivity monitoring which requires data to be fused from multiple data sources, Pradhan et al. developed a taxonomy of spatial and temporal reasoning mechanisms [32]. In the process industry, faults were simply classified into different categories according to their forms, time behaviors, and extents [33]. Those classification methods are useful to differentiate the fault characteristics and facilitate fault detection and diagnosis. In the form type, faults can be classified into systematic fault or random fault. According to the time behavior, faults can be categorized into permanent fault, transient fault, intermittent fault, noise fault, and drift fault. With regards to the extent type, faults can be divided into local faults and global faults. In [25], fault types are grouped as sensor faults, actuator faults, process faults and control loop/controller fault according to 165 faults published through 1991–1995. In the power system, faults can be classified into three types as symmetrical faults, unsymmetrical faults and open circuit faults [34]. Beside those classifications, the development of fault taxonomy which includes more fault characteristics has drawn attention from other industries such as aerospace engineering and software engineering. The purposes of those taxonomies are to reduce risks and increase the system reliability. At the same time, tracking root caused faults can be more efficient as fault relation models are developed in the fault taxonomy. The development of fault taxonomy has also drawn attention in the software industry so that detecting and tracking a fault can become more efficient. Studies [23,35,36] reported the development of fault taxonomy for the software industry. It was found that, by using the coherent fault taxonomy for analyzing faults, an effective test and analysis method can be easily achieved. In order to assess the quality of software, especially for component-based software, Mariani et al. developed a fault taxonomy for component-based software [35]. In the research, faults in the software were classified according to their causes and effects. Two main classes of faults such as service-related and structure-related faults were identified. The fault taxonomy significantly improves the testing and analysis techniques for component-based software.

2.4. Summary

Despite various methodologies employed to develop a fault taxonomy in the HVAC industry and in other industries, the methods employed seldom consider the faults reported by FDD software. The developed taxonomy is insufficient to describe data obtained from various FDD tool reports for the following reasons. First, most of them did not adequately address the physical configuration characteristics of an HVAC system. Complete information for a fault in the FDD software tool often includes the description of the component which reports the fault occurrence. Therefore, in the taxonomy architecture, the physical configuration of an equipment should be explicitly presented. Secondly, existing taxonomy does not well illustrate relations between various types of faults. As illustrated in Section 2.1, faults reported in a FDD tool may contain relationships which reveal the causes and effects. Understanding those relationships is critical to accurately translate FDD software data. Lastly, none of the research aimed to provide a standardized fault library and naming conventions which would be critical in extracting information from meta-data analytics.
To bridge this gap, a unified taxonomy which aims at effectively interpreting faults reported by HVAC FDD software tools is developed and is presented below.

3. Methodology

As stated in the Introduction, fault names used in FDD software reports lack interpretability. This causes increasingly complex and difficult problems when analyzing HVAC system faults such as fault prevalence analysis in which ‘counts’ should be accurate. For example, one dataset may refer to a stuck heating or cooling valve, while in another dataset, this fault may be reported as simultaneous heating and cooling, or even excessive unit-level energy consumption.
In order to address this issue, the proposed fault taxonomy for HVAC equipment fault should contain information which can be used to locate the fault and reflect the fault feature. To achieve this goal, we first define a system physical hierarchy, and then assign a unique fault name from a summary fault library.
The developed taxonomy included four scenarios which are expected to accurately capture the fundamental information integrated in a fault message from FDD software tools. A four-element design schema includes equipment physical configuration hierarchy for locating a fault (Section 3.1), controlled vocabularies for describing fault nature (Section 3.2), unified fault identification codes (IDs) and fault library (Section 3.3), as well as fault relation models for identifying condition-based fault and associated behavior-based faults (Section 3.4), for efficiently querying FDD report data. The design schema will be detailed by using a common type of HVAC equipment, i.e., RTU as an example in the following sections.
RTU is a typical type of HVAC equipment which comprises all the components such as fans, compressors, evaporators, and coils needed to provide conditioned air to zones in a building. RTUs are widely used in commercial buildings from different sizes due to their advantages of application flexibility, low cost, easy installation and so on [37]. In the U.S, approximately 34% of all commercial buildings and 52% commercial floor space is served by RTUs [38].

3.1. Equipment Physical Hierarchy

Despite some standards such as Brick Schema [15] and Project Haystack [16,39] including descriptions for a system’s hierarchy, or equipment physical configurations, they attempt to follow BAS functionalities to capture the sensory data meaning in a BAS or BEMS. For example, in the Brick schema, two classes of entities such as equipment and points are employed to describe the entities in a HVAC system [40]. The dependencies between sensors, actuators, setpoints, and related equipment and spaces are described by control relationships. However, those relations are not sufficient to interpret data generated from FDD software tools where the fault report messages need to explicitly reveal what occurs in which component in a piece of equipment. Besides, one of the objectives of fault prevalence research is to count fault occurrence in a specific component. Therefore, an accurate physical hierarchy is critical to reflect various levels in a complex HVAC system. In the process of developing the fault taxonomy for HVAC systems, we classified HVAC equipment physical configuration into three levels as equipment category, component location type, and component type.
Figure 2 shows a simple example of three levels in the hierarchy of an RTU, with examples of what appears in each level. The first level is assigned to define the equipment type. In the second level, a component location is given to describe which location in an equipment a component belongs to. The third level in the hierarchy defines the component type, i.e., the component in which a FDD tool reports a fault.

3.1.1. Equipment Type

In the equipment type, we focus on the equipment within the study scope of fault prevalence study. Therefore, three common equipment—such as AHUs, RTUs, and VAV ATUs—were first selected.

3.1.2. Component Location

Under each equipment type, a two-level hierarchy is used to identify a component and component location is the first level. Different from the Brick schema in which the location is used to determine the spatial point in a building (i.e., a floor or a room) [40], in the fault taxonomy, the class of component location type is employed to locate a component within a piece of equipment. This is because the same type of component may be installed at different locations in an equipment and serve different functionalities in equipment operation. For instance, a temperature sensor can be installed and employed in the supply air section of a RTU to collect supply air temperature and compare it with the supply air setpoint. Meanwhile, the same type of temperature sensor can also be installed outside of the RTU to collect outside air temperature data (Figure 3). It is obvious when reporting a temperature sensor fault that the component location information should be provided. However, in many FDD software tools, the diagnostics outputs do not include any information about where the location of the component is in an equipment. For instance, a FDD tool may only report a ‘temperature sensor frozen’ fault, but does not explicitly illustrate if it is a temperature sensor in the outdoor air section or in the supply air section Therefore, localizing the component in an equipment facilitates exactly mapping the fault output data generated by a FDD software. In the example above, if a fault message is found that the location information is absent to identify the component functionality, the fault message will be excluded from counting the fault occurrence.
We use a term ‘Unassigned’ in the taxonomy to represent a component of which the location information cannot be clearly identified, or multiple locations are included. For instance, in the RTU taxonomy, the component of the RTU controller is identified. However, the controller itself is directly tied to the RTU and serves a functionality to control the entire RTU operation. Therefore, when representing the RTU controller, the ‘Unassigned’ string is used to illustrate such a condition. Additionally, in the FDD software tool, the violation of a rule based on multiple components at different locations is used to diagnose a fault. For example, some FDD tools employ the difference between mixed air temperature and outside air temperature from AHU Performance Assessment Rules [41] to detect AHU faults and generate fault reports. Hence, a fault message of ‘mixed air temperature equals outside air temperature’ is generated by the FDD tool correspondingly. In such a case, not a single location of the component can be identified. Therefore, when mapping those fault messages, the ‘Unassigned’ string is used to illustrate such a condition.
In the common RTU configuration hierarchy as shown in Figure 3, a total of 15 locations are identified as given in Table 2. It is noted that some components such as the evaporator are also categorized into location sections. This is because faults in a more granular component level can be detected and diagnosed. For example, the air filter fouling fault in the evaporator was reported in [4].

3.1.3. Component Type

Component type is the second level of the two-level hierarchy which is used to identify a component under the equipment type. In the class of component type, a generic component type is determined. Although ‘Points’, which are used in the Brick Schema [40] can well represent some components in the equipment or systems, it does not clearly differentiate the data types generated by FDD software tools. Considering the FDD tools output three types of faults as condition-based faults, behavior-based faults and outcome-based faults (Section 2.1), and each type covers various objects to represent faults, the component types include two entities-physical entities and virtual entities to represent objects that report faults. The introduction of two different entity types in the component type facilitates to map and differentiate a condition-based fault from associated behavior-based faults or potential outcome-based faults from the FDD tools.
In the physical entity, various physical components—such as sensors, actuators, and controllers associated with the equipment—are included. Apart from those real components, control sequence or control parameters are also treated as physical entities because operators can directly touch those entities by programming the control sequence or setting the parameters. Physical entities are mostly used in the descriptions of condition-based faults because the descriptions of physical conditions are given to real components which operators can fix.
Virtual entities include various measurements such as single sensor outputs (e.g., temperature, relatively humidity, air flow), actuator feedback (e.g., damper operation position, valve operation position, and fan speed) and multiple measurements (e.g., supply air temperature and supply air temperature setpoint). Virtual entities, which are used to illustrate the objects of fault symptoms, are mostly in the descriptions of behavior-based faults or outcome-based faults.
Similar to the component location, we use a term ‘Unassigned’ in this level to represent a component type for which the detailed information is not given. This is because for some faults, existing FDD tools seldom provide diagnostics results in a more detailed granularity. For instance, a compressor fault message such as ‘compressor malfunction’ from the FDD tool may be caused by any faults occurring in components (e.g., motor, oil circuit or airline) occurring in a compressor. However, no detailed diagnostics result regarding the fault root cause is given. Therefore, in the RTU taxonomy, the term ‘compressor’ is aligned to the component location class and the term of ‘Unassigned’ is given in the component type. This term of ‘Unassigned’ can be replaced by a detailed component name if the FDD tool can detect and diagnose what component type is faulty within the attached high-level component location.
Various optional components or parts may be employed in different models of RTU products. Therefore, it is not possible to include all available equipment configurations in the marketplace when developing the fault taxonomy. In the current version fault taxonomy, we determined a common RTU physical configuration after reviewing the current RTU faults literature [4,29,42]. Despite the current taxonomy not covering all possible physical configurations, the proposed taxonomy architecture is scalable for FDD software developers to add more components and expand the fault name library in the future.
In the current RTU fault taxonomy, the component type level includes 31 physical entities and 10 virtual entities (e.g., temperature, pressure, and relative humidity) are identified as provided in Table 3.
It is noted that, although faults in the zone level component (e.g., zone temperature sensor fault) have been seldom reported in the RTU FDD papers, in the RTU fault taxonomy, we include those faults because they are frequently reported in FDD software tools.

3.2. Description of a Fault Nature

Many terms or expressions are used in existing FDD software tools to represent a fault nature, and the terms used are very customized and random. Some terms are found in the same FDD software to represent the same fault nature. For example, the term ‘Frozen’ in a FDD tool is used to describe a sensor reading value that is constant even if the real measurement value is changing. However, in the same FDD tool but different versions, the term ‘Stuck’ is used to describe the same fault nature. In order to reconcile this inconsistency, a unified term list is needed to be developed.
In this study, controlled vocabularies are developed to standardize the fault description in one to three words. Controlled vocabularies reduce ambiguity inherent in normal human languages where the same concept can be given different names and ensure consistency [43]. The words used as the controlled vocabularies are selected based upon extensive literature review and investigations on available FDD software tools. In the current stage, we developed 21 controlled vocabularies to describe the fault natures. Table 4 lists the controlled vocabularies and corresponding descriptions.
Apart from the common terms (e.g., frozen, stuck, and blocked) that are frequently reported in either academic literature or commercially available FDD software tools, we also employ some terms which represent fault characteristics at a higher level so that in the fault prevalence study, we minimize fault names which represent similar fault characteristics. We explain those terms below in detail.
Abnormal: This term is used to describe behavior-based faults which a physical measurement falls outside of certain defined criteria. For example, FDD tools usually report the RTU supply temperature is too high or too low or fluctuating. In the taxonomy, those semantic expressions are defined as ‘Abnormal’ to avoid excessive descriptions.
Rule_abnormal: This term is used to define the fault that is detected and diagnosed based on relations between multiple components. This is because of two reasons as (1) some FDD tools detect and report equipment faults based on rules generated from multiple components. For example, in some FDD tools, the abnormality between mixed air temperature value and outside air temperature value is flagged as one fault in an AHU or RTU, and (2) some FDD tools report faults that describe the abnormality between measurement and setpoint. For example, the ‘supply air temperature is higher than the setpoint’ fault is reported by a FDD tool. In such a condition, the fault characteristic includes both supply air temperature and supply air temperature setpoint. The fault is detected because the threshold between two measurements is overpassed. This may be caused by either the supply air temperature is abnormal or the setpoint is abnormal. Therefore, we use ‘Rule_abnormal’ to accurately capture this fault characteristic in FDD software tools.
Unspecified: We use the word ‘Unspecified’ to represent the fault which the FDD software does not explicitly report what type of the fault is due to its diagnostics resolution or random naming conventions when developing the rules. For example, FDD software has a ‘temperature sensor failure’ fault in its report, but does not mention the exact fault nature, i.e., bias, drift, and frozen. Therefore, by assigning ‘Unspecified’ fault nature, we can map those types of faults and count the fault occurrence without missing fault detection results for specific components.

3.3. Design of Fault ID Format

The data format is very critical in big data analytics [44]. Studies show that incompatible, non-aligned data structures, and inconsistent data semantics significantly challenge the efficient data analytics and effective information extraction [45,46]. However, in the reports of most commercial HVAC FDD tools, a large number of text data, which is unstructured and non-machine-readable, are usually included to describe what happens in a HVAC system. For example, a FDD tool gives human-readable language as ‘RTU supply air temperature is too low’ as a supply air temperature detection result. While another FDD tool may give a simplified data format as ‘EXCESSIVE_RATE_OF_TRAVEL’ combined with equipment information such as ‘CHW’ or ‘HW’ to completely describe the operational abnormality in the component, i.e., chilled water flow rate abnormal or hot water flow oscillation. Those code formats are very customized, and usually can only be interpreted by FDD tool developers. Therefore, these unstructured pieces of text data frames should be converted into a unified data format so that an efficient FDD report data analytics can be achievable.
In this study, a fault naming schema was designed to identify each fault so that structured fault data format can be established. Following the above-mentioned taxonomy architecture, a fault name comprises four elements as equipment type, component location, component type, and fault nature description. The standardized and machine-readable fault ID format will facilitate the data query to analyze the fault prevalence at various levels of granularities.
Through this fault naming scheme, a fault library was established to include the fault in AHU, ATU, and RTU. Each fault ID is unique and in a standardized format. In the taxonomy, full expressions of component location and component type are used to tag each element in the fault ID. This will increase the interpretability so that persons outside of the HVAC industry can interpret the FDD data without barriers.
Table 5 and Table 6 show examples of a condition-based and a behavior-based fault name respectively. In the first element, the equipment type is described. In the second element, the component location is given. In the third element, the component type is assigned. The last element in the fault name is to describe the fault nature by using the controlled vocabularies. Each element is connected by a dash symbol to formulate a structured fault name as ‘RTU-Supply_air-Temperature_sensor-Bias’ and ‘RTU-Supply_air-Fan_control-Hunting’.
Controlled vocabularies listed in Table 4 are used to describe the RTU fault natures. After determining the RTU configuration and identifying the fault natures for each component, a total of 117 fault names—which include 91 condition-based faults, 23 behavior-based faults, and 3 outcome-based faults—are generated.

3.4. Fault Relation Model

In FDD reports, both condition-based faults and behavior-based faults can be found in the software outputs. For each condition-based fault, a set of related behavioral symptoms (behavior-based faults) could occur and are reported by the FDD tool. Consider, for example, the case in which one set of field data indicates one instance of a stuck valve (condition-based convention), and a second set of field data indicates one instance of simultaneous heating and cooling (behavior-based convention). Simultaneous heating and cooling could be caused by a leaking valve, a stuck valve, a faulted sensor, or even controls problems. Therefore, across the two sets of data, the total number of instances of leaking valve is at least one, and potentially two. It can be seen that the relation model in the taxonomy well addresses the issue of how condition-based faults and associated behavior-based faults relate to one another, and can partly avoid under or over counting of faults.
A relation model can be defined to reveal these relationships between a condition-based fault and associated behavior-based faults. Despite Brick Schema providing some relation descriptions on various entities within HVAC systems, it primarily describes equipment/parts and their relations within a building. In this study, we borrow strategies from Fault Tree [47] and Bayesian networks [48] which are usually employed to depict the cause-and-effect relations in an automation system. We developed a comprehensive model to connect the condition-based faults and associated behavior-based faults based on expert knowledge and in consultation with a project Technical Advisory Group.
Figure 4 provides graphic examples of the above-mentioned relation between a condition-based fault and associated behavior-based faults. In Figure 4a, a condition-based fault ‘compressor motor malfunction’ in the RTU (RTU-Compressor-Motor-Malfunction) is connected by multiple behavior-based or outcome-based faults in the RTU, such as ‘Supply air temperature abnormal’ (RTU-Supply_air-Temperature-Abnormal), ‘Supply air temperature and supply air temperature setpoint don’t match’ (RTU-Supply_air-Temperature_setpoint-Rule_abnormal), ‘Zone temperature abnormal’, (RTU-Zone-Temperature-Abnormal), and ‘Cooling abnormal’ (RTU-Unassigned-Cooling-Abnormal) may be caused by this fault. Through this relation model, the calculation of fault prevalence is expected to be more accurate. Similarly, a behavior-based fault can be caused be caused by multiple condition-based faults in multiple components. For example, an RTU-Supply_air-Temperature-Abnormal fault can be caused by actuator related condition-based faults such as RTU-Compressor-Motor-Malfunction fault, or ‘Compressor short cycling’ fault (RTU-Compressor-Unassigned-Short_cycling), or control related condition-based faults such as ‘Control sequence setting’ fault (RTU-Control-Sequence-Setting), or sensor related condition-based faults such as ‘Supply air temperature sensor frozen’ fault (RTU-Supply_air-Temperature_sensor-Frozen) etc., as illustrated in Figure 4b.
It should be noted that a condition-based fault may propagate and affect different equipment or even subsystems due to the highly coupled HVAC system (e.g., a chilled water supply pump fault in the primary subsystem can cause multiple symptoms in downstream equipment such as an abnormal cooling coil valve position and abnormal supply air temperature in AHUs). Therefore, a condition-based fault and associated behavior-based faults may cross between different pieces of equipment or subsystems. However, in this study, only ‘local’ fault relation models with a single piece of equipment were developed.

4. Case Study

In this section, we present how we use the developed fault taxonomy to map results generated from two FDD tools. Results for detecting and diagnosing RTU faults from two commercial FDD tools are employed. We firstly extracted critical information which illustrate fault properties from the FDD reports. Then, we mapped fault names according to the developed fault taxonomy. From this process, we successfully reduced the number of fault names, and hence, redundant information in the FDD tool reports could be dropped. New fault IDs were assigned when the mapped fault names were generated. Lastly, we employed one processed FDD report to calculate fault occurrence at different granular levels to demonstrate efficient analyses and evaluation of the commercial FDD tools can be achieved, and the HVAC system fault prevalence research can be accomplished.

4.1. Description of Data Set

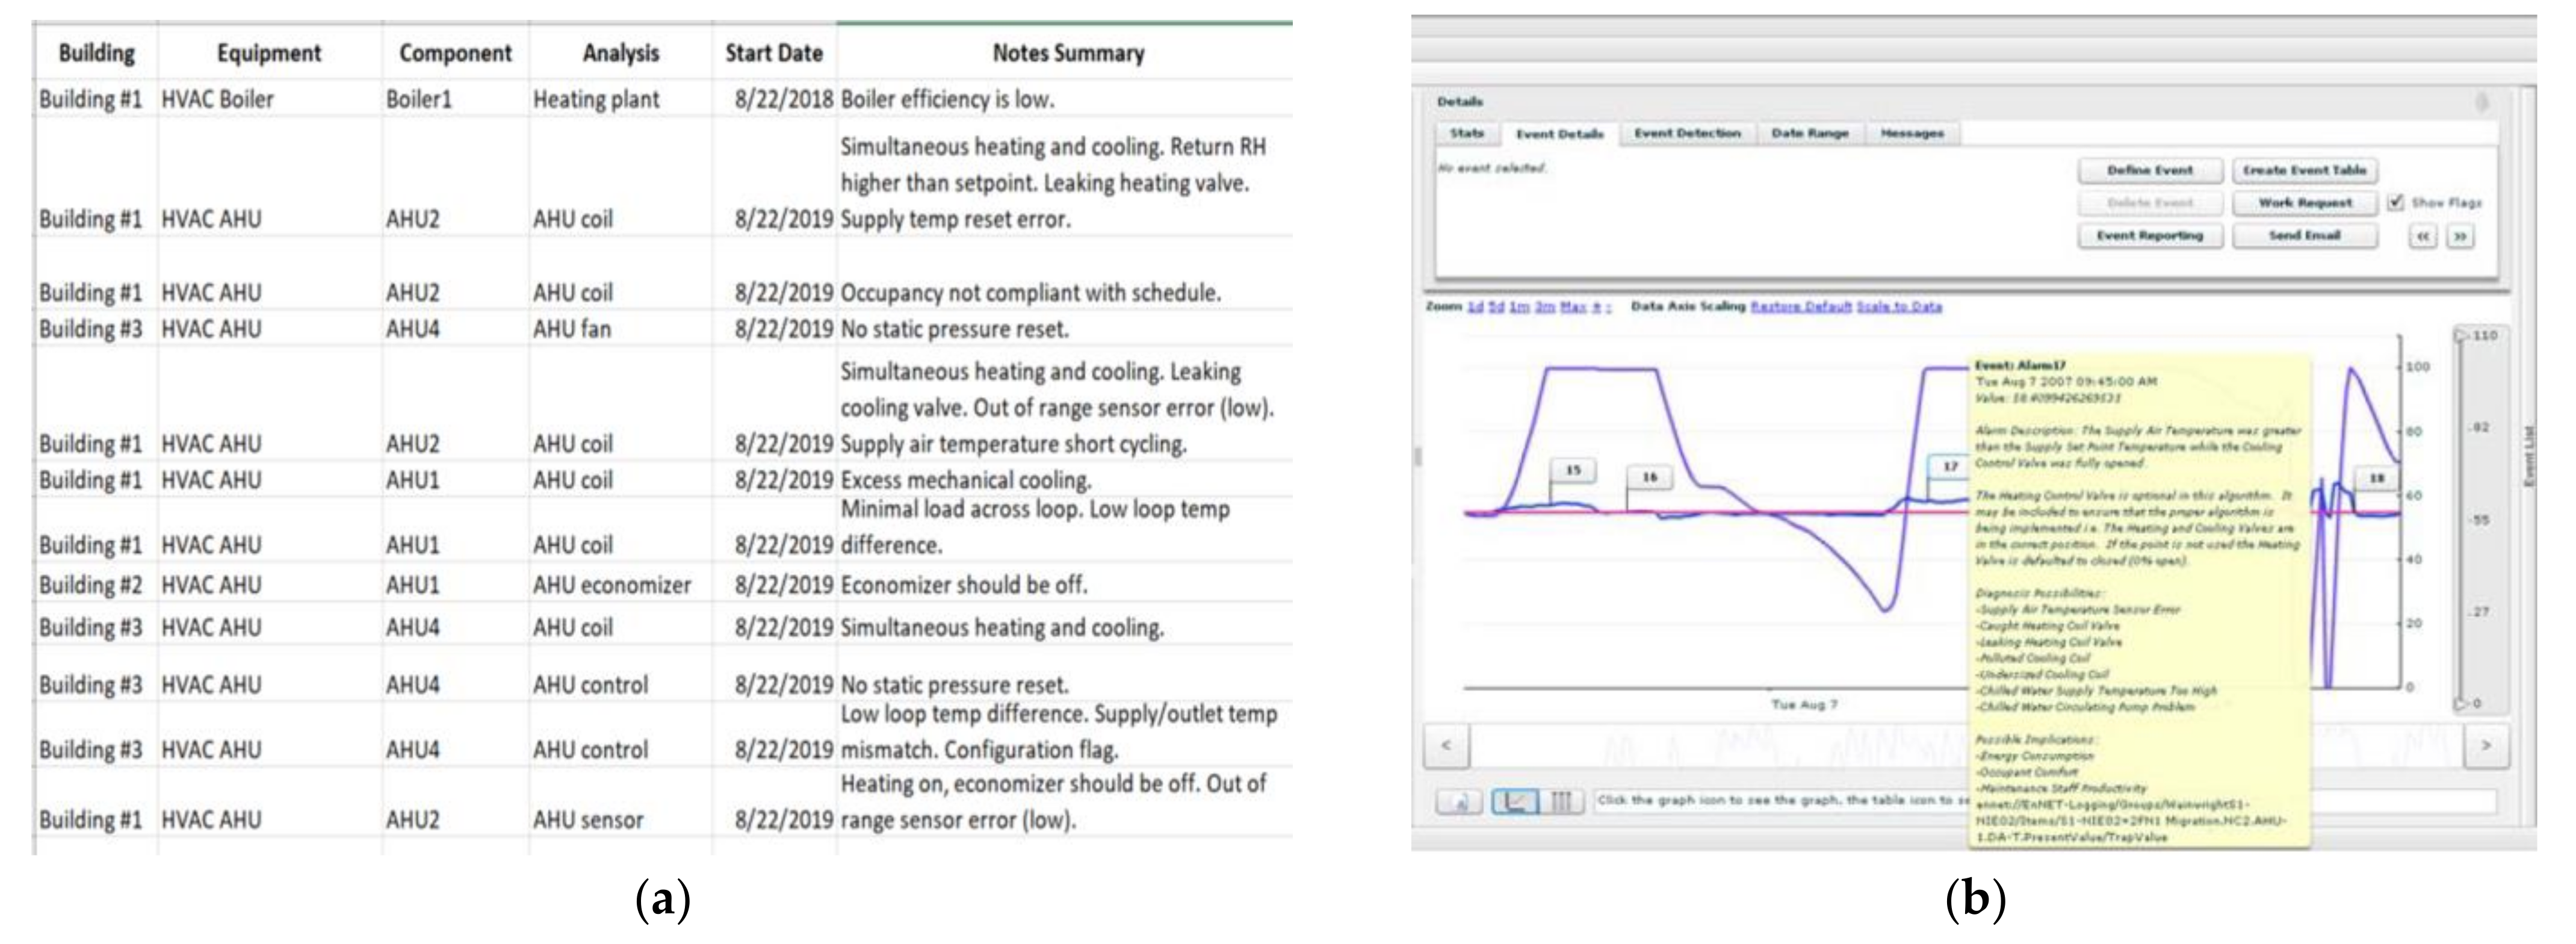
In this study, fault reports from two commercial FDD software tools which listed the identified RTU faults, are used.
The first report (referred to as no. 1 FDD report) generated from the commercial FDD tool A, includes two-year (Year 2018–2019) FDD results of a total of over 2000 RTUs from 131 buildings in the U.S. After converting the raw fault message into a binary daily fault (BDF) format in which multiple fault logs for the same piece of component of an equipment in the same day are removed, and only one unique fault message for the same piece of component of an equipment within one day is kept. The number of BDF messages in the data set reaches 2,865,786 rows.
The second report (referred to as no. 2 FDD report) generated from commercial FDD tool B covers one-year (Year 2018) FDD results of over 5000 RTUs from 808 buildings including office buildings, mercantile buildings, and education buildings, in the U.S. The number of BDF messages in the data set reaches 348,911 rows.
The BDF messages are the fundamental elements and will be used to calculate the HVAC fault prevalence according to different drivers.

4.2. Mapping Process

4.2.1. Mapping Procedure

In the current FDD report mapping process, we do not use the natural language processing toolbox to map the raw fault names in the FDD reports to the fault IDs in the developed library. This is because we found the fault naming conventions in the FDD software reports are very customized and there is not a suitable processing toolbox that can accomplish the task. Therefore, we employed a manual process to map the raw fault names in the data cleaning process.
In order to map report results, a general procedure in the text information process is followed as shown in Figure 5. First, the text data generated from the FDD tool is cleaned and preprocessed. The fault report messages are normalized so that each fault is mapped to one fault record. It is found that in the no. 1 FDD report, multiple fault messages representing various components are recorded as one log. Therefore, those messages are cleaned according to the semantic descriptions. Secondly, the equipment and component type in each fault message are examined and mapped according to the physical hierarchy. Finally, the fault names generated in the FDD report are mapped according to the fault library in the taxonomy.

4.2.2. Mapping Rules

In order to achieve a more accurate mapping result, a set of rules are also established.
Rule 1: The determination of fault type. If a raw fault name includes semantic representations which describe both component information and fault symptoms, we map it to a condition-based fault type instead of a behavior-based fault type. For example, a fault name is ‘RTU return air temperature sensor stuck, temperature is too low’. In this name, we know that the fault explicitly illustrates that its temperature sensor reading value is constant. Despite a semantic description of ‘temperature is too low’ illustrates the fault symptom, we map this fault to a ‘RTU-Return_air-Temperature_sensor-Frozen’ fault instead of a ‘RTU-Return_air-Temperature-Abnormal’ fault.
Rule 2: When determining the fault nature and selecting the corresponding controlled vocabularies, the words ‘Abnormal’, ‘Malfunction’, and ‘Unspecified’ can be assigned to very similar semantic meanings. However, the word ‘Abnormal’ is assigned to represent a behavior-based fault. While ‘Malfunction’ and ‘Unspecified’ are intended to be used to represent condition-based faults.

4.3. Fault Mapping Results

Table 7 and Table 8 present the unique fault names according to the taxonomy library.
In the no. 1 FDD tool, a total of 167 raw fault names are reported from a two-year FDD report. Among those 167 faults, 102 faults can be mapped to condition-based faults and 45 faults can be mapped to behavior-based faults according to the taxonomy respectively. After mapping fault names according to the taxonomy, 39 unique faults in the no. 1 FDD report were assigned as given in Table 7.
In the no. 2 FDD tool, a total of 17 raw fault names are extracted from a one-year FDD report. Among those 17 faults, 6 faults can be mapped to condition-based faults and no fault can be mapped to behavior-based faults. After mapping fault names according to the taxonomy, 6 unique faults in the no. 2 FDD tool were assigned as given in Table 8.
The number of unique faults after mapping is much less than the number of raw fault names in no. 1 FDD report because multiple fault names in the FDD reports can be mapped to the same fault according to the fault taxonomy as can be seen in 
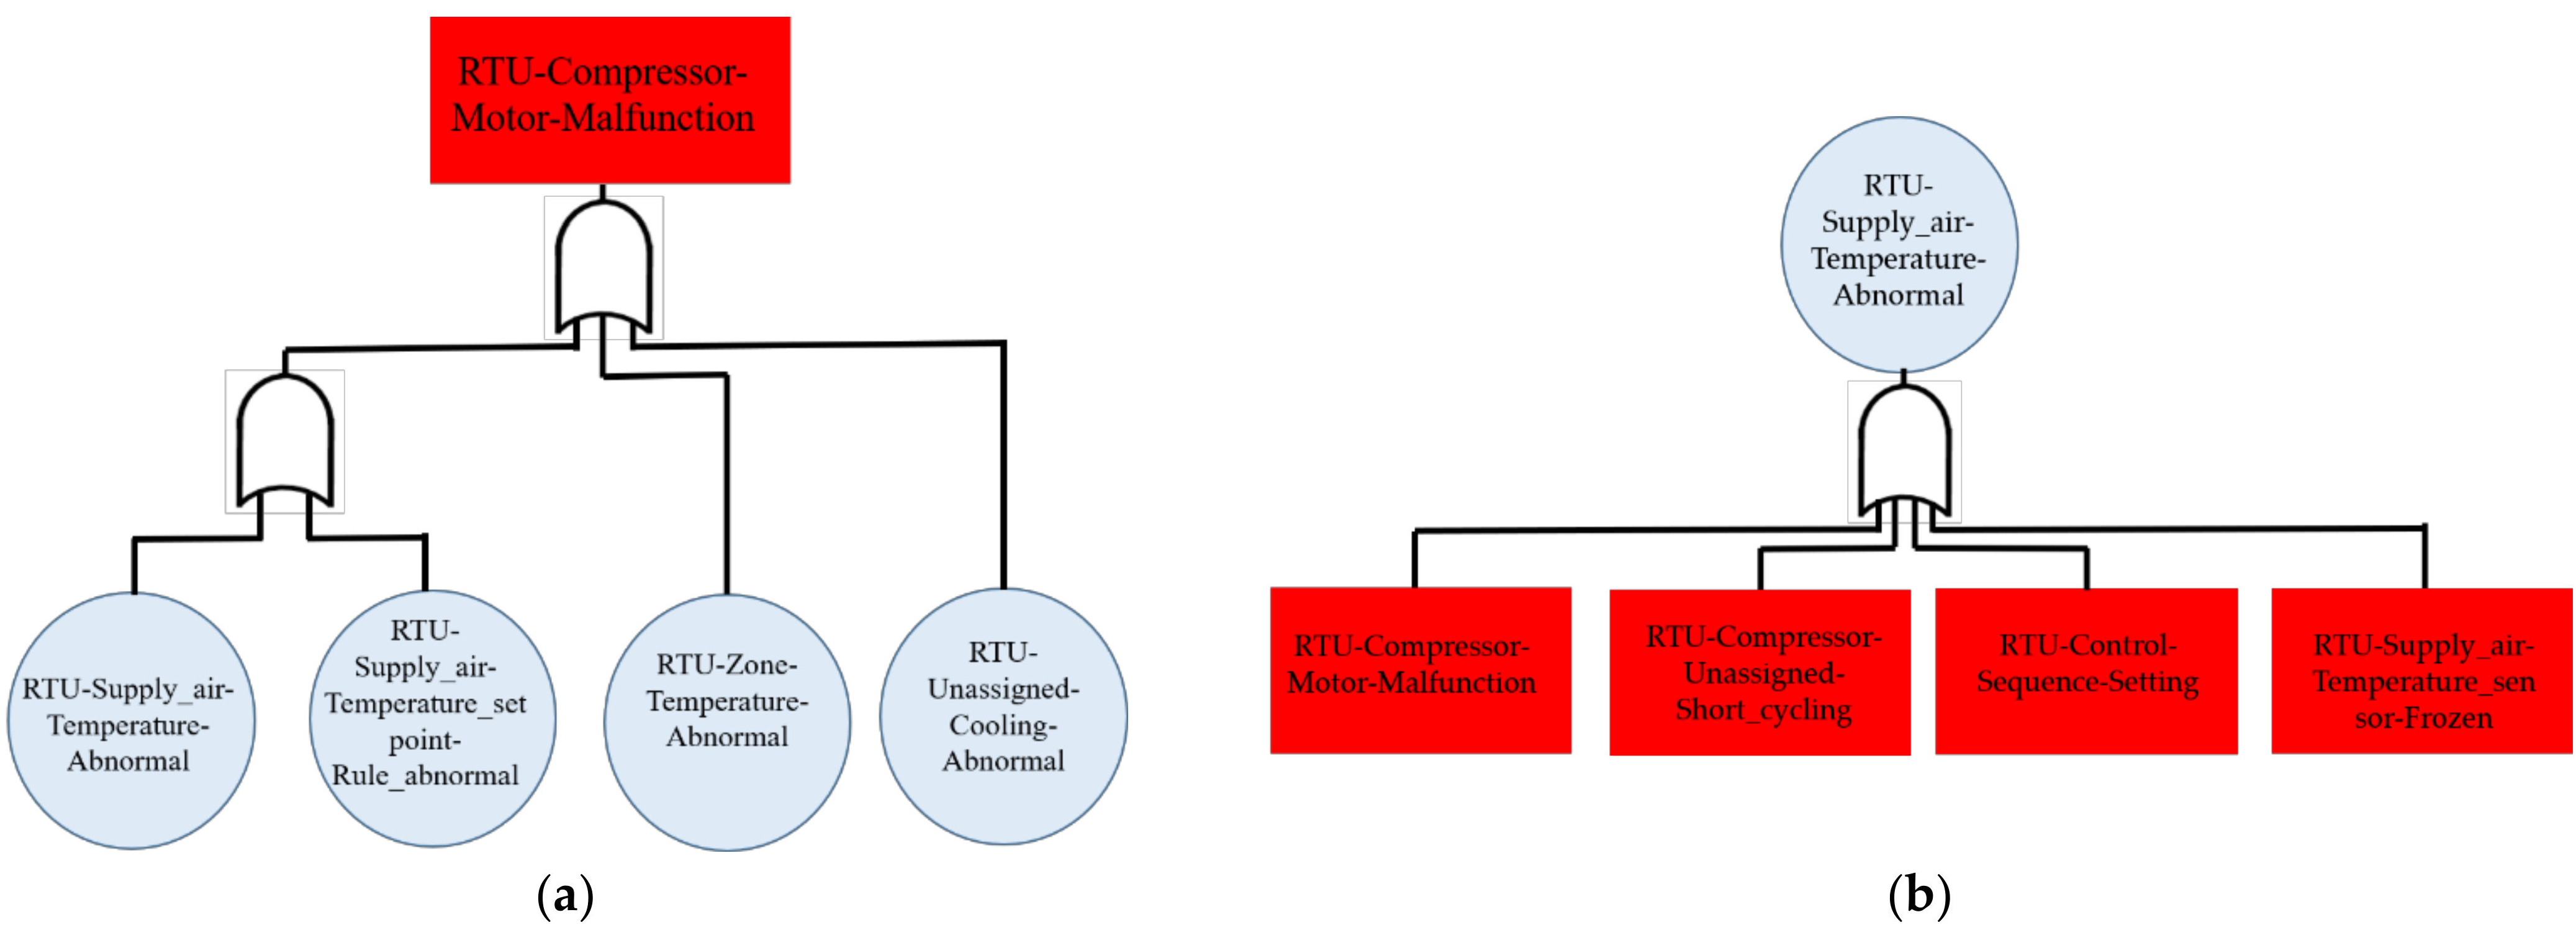
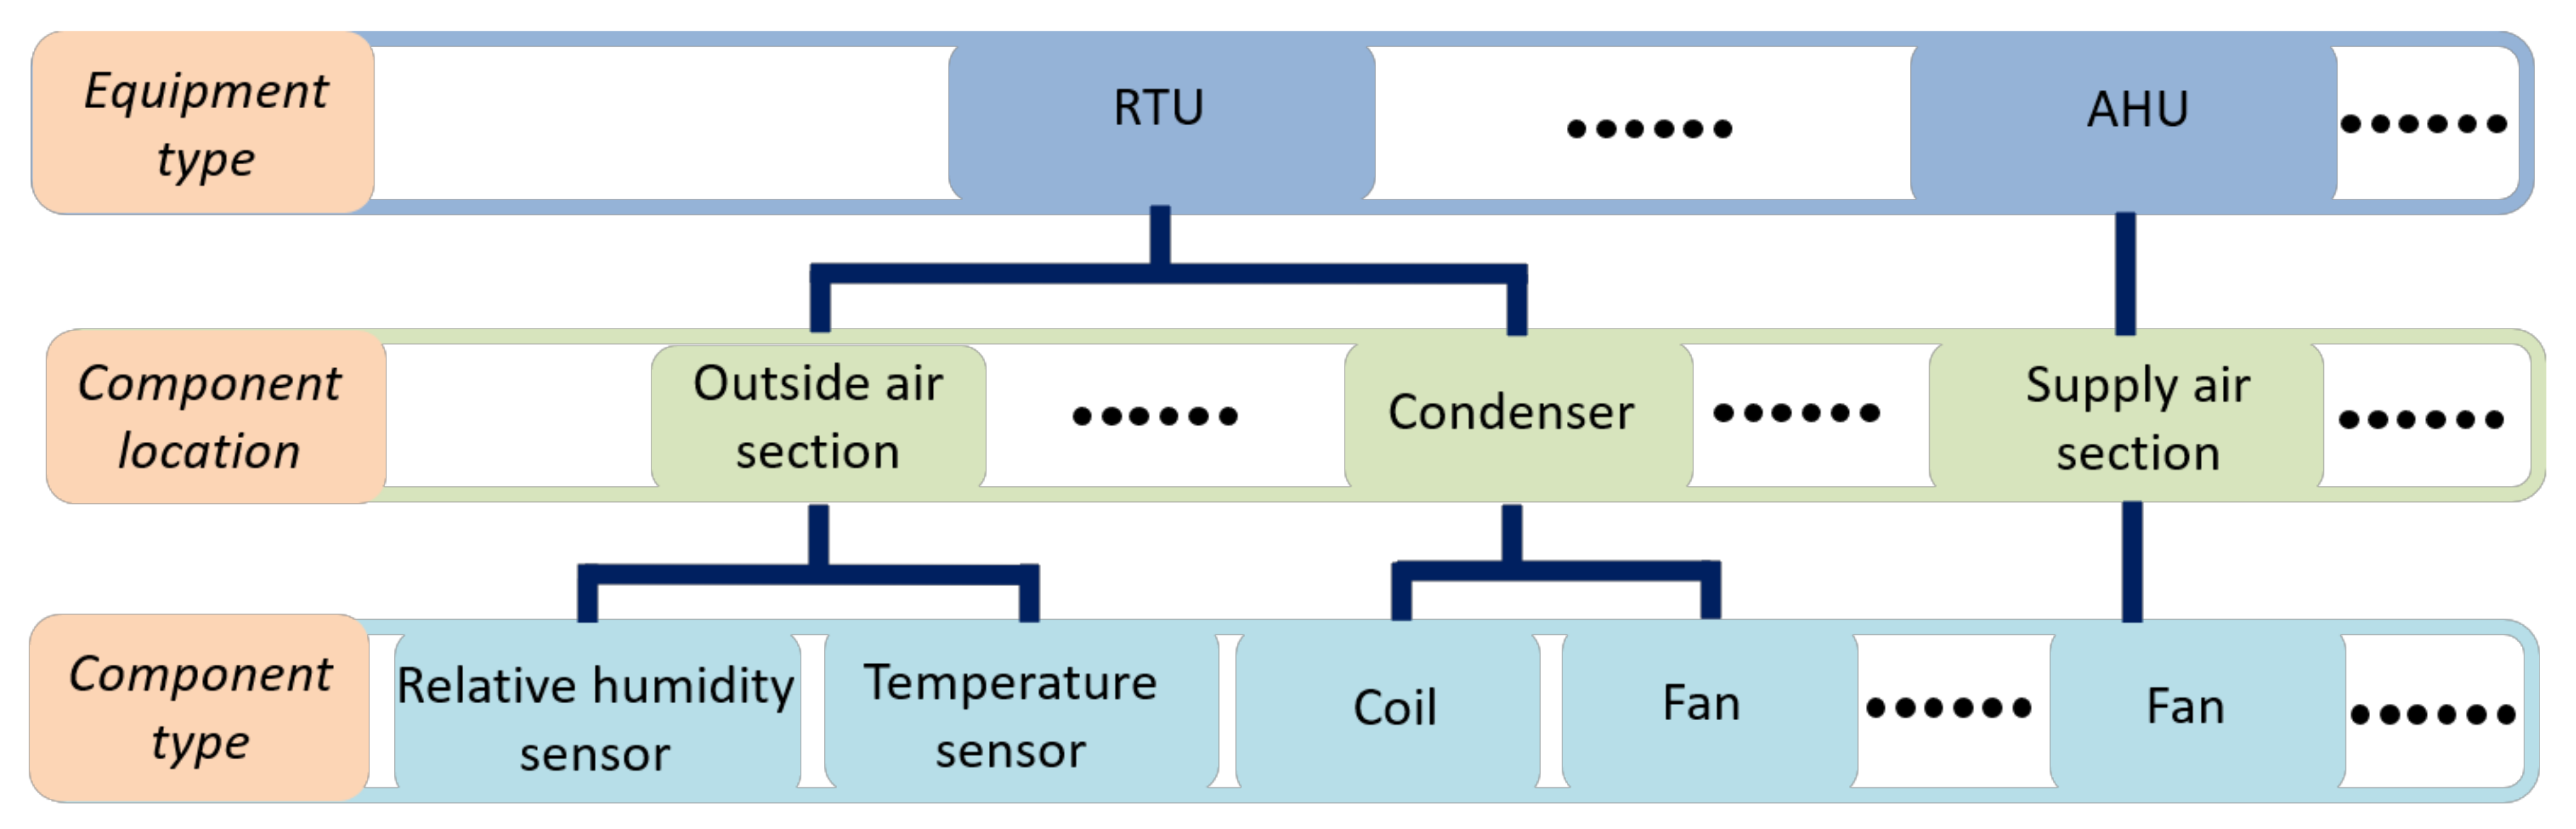
Table 9. For instance, the ‘RTU-Zone-Temperature_sensor-Unspecified’ condition-based fault in the taxonomy was used to map 14 raw fault names in the FDD report including: ‘ZAT Sensor Failure: Reading less than 45’, ‘ZAT Failure: Reading greater than 95’, ‘ZAT Circuit open’, ‘ZAT Sensor Circuit is Open’, ‘ZAT Sensor Excessively Fluctuating’, ‘ZAT Circuit is Shorted’, and so on. For these fault names, the fault’s component location and component type, i.e., the zone temperature sensor can be identified. Besides, some fault symptoms (e.g., Reading less than 45 and greater than 95) are given in fault names based on internal rules used by the FDD tool developers. However, the fault name is not well described to reveal the fault nature. Therefore, we mapped this fault to the ‘RTU-Zone-Temperature_sensor-Unspecified’. Another example is in the no. 1 FDD report, the ‘RTU-Supply_air-Temperature_setpoint-Rule_abnormal’ behavior-based fault in the taxonomy was used to map 2 raw fault names in the FDD report including: ‘Free Cooling Setpoint Not Met-SAT Too Warm’ and ‘Free Cooling Setpoint Not Met-SAT Too Cool’. In this case, the supply air temperature abnormal fault was reported by providing both the setpoint information and supply air temperature information. The relation between these two measures is broken to illustrate this behavior-based fault can be either caused by the setpoint setting error or other faults. Therefore, we used the ‘RTU-Supply_air-Temperature_setpoint-Rule_abnormal’ to map both faults.
After mapping fault names according to the taxonomy, 39 unique faults in the no. 1 FDD report, and 6 unique faults in the no. 2 FDD tool were assigned. Both FDD tools have ‘RTU-Supply_air-Temperature_sensor-Unspecified’ fault reported. In the no. 1 FDD report, four fault names including ‘SAT Sensor Failure: Reading less than 35 F’, ‘SAT Sensor Failure: Reading greater than 150 F’, ‘SAT Sensor Failure: Reading greater than 150’ and ‘SAT Circuit Shorted’ are mapped to this fault. In the no. 2 FDD report, one fault name (e.g., ‘HealthSATSensor’) is mapped to this fault. Both FDD tools have faults related to outside temperature sensor, but in the no. 1 FDD report, the fault name can be mapped to ‘RTU-Outside_air-Temperature_sensor-Frozen’ as the raw fault name is ‘Stuck Outside Air Temperature Sensor’. However, in the no. 2 FDD report, the fault name can only be mapped to ‘RTU-Outside_air-Temperature_sensor-Unspecified’ because no detailed information on the fault nature is given in the raw fault name (i.e., ‘HealthOSASensor’). The FDD tool vendor cannot give the detailed information on this fault either.
Table 9 and Table 10 list the quantitative mapping analyses for no. 1 and no. 2 FDD tool reports respectively.
In order to evaluate the redundant information (i.e., multiple fault names represent one type of fault), the fault name reduction rate is proposed. The fault name reduction rate can represent what the percentage of raw fault names in the FDD tool can be reduced as a result that those raw fault names can be mapped to one fault name in the taxonomy. The higher fault name reduction rate means that a higher amount of fault names represents the same information, and hence has a higher duplicated information in the FDD reports. The calculation of the fault name reduction rate is given below:
Fault   name   reduction   rate   = 1   Unique   fault   name   according   to   taxonomy / Fault   name   can   be   mapped
Consequently, in the no. 1 FDD report, the total fault name reduction rate is 73.4% because 39 unique fault names were mapped from 147 fault names which can be mapped in the FDD report (71.6% for the condition-based faults, and 77.8% fault the behavior-based faults respectively) as shown in Table 9. In the no. 2 FDD report, the total fault name reduction rate is 0% because 6 unique fault names were mapped from 6 fault names which can be mapped in the FDD tool (0% for the condition-based faults), as given in Table 10. A 0% fault name reduction rate illustrates that the FDD tool vendor does not use similar fault names to represent the same fault according to fault name.
However, the mapping result shows that the mapping percentage did not reach 100%, i.e., some faults in the FDD reports were not successfully mapped. As can be seen, for the no. 1 FDD tool, the total successful mapping fault name is 88%. For the no. 2 FDD tool, the total successful mapping fault name is 35.29%
The reasons for unsuccessfully-mapped fault names come from the following aspects:
1. The faults for specific components are not developed in the current version of taxonomy. For example, faults related to a heating recovery wheel are detected by the no. 1 FDD tool. As the heating recovery wheel was not considered in the RTU configuration in the current version taxonomy library, four faults related to the recovery wheel (e.g., ‘ERV Wheel Low Outside Airflow’, ‘ERV Wheel Inefficiency Duration’, ‘ERV Wheel Inefficiency Demand’, ‘ERV Wheel Inefficiency’) were not mapped. In the no. 1 FDD report and in the no. 2 FDD report, 21 raw fault names and two raw fault names are not mapped because of this reason.
2. The faults described by the FDD tool reports cannot be identified. For example, in one FDD tool, a ‘No Communication’ fault is reported. This fault does not provide any details regarding fault location and component type. In the no. 1 FDD report and no. 2 FDD report, two raw fault names and eight raw fault names are not mapped because of this reason.
3. Multiple fault natures are presented in the semantic description of a fault. For instance, in the no. 2 FDD tool, a ‘HealthMultipleFaults’ fault name is used but no specific fault nature and diagnosis information is provided. In this case, the fault name cannot be mapped to the taxonomy. In the no. 2 FDD report, one raw fault name is not mapped because of this reason.
Generally speaking, two objectives are achieved through mapping the FDD results via the developed fault taxonomy. First, the fault name space is decreased after mapping the fault names to the names in the fault library of the taxonomy. Therefore, automated analysis and evaluation on FDD results can be more efficient. Secondly, with the unifying fault taxonomy, the exact names were mapped to the fault messages from different FDD tools. Therefore, the FDD results from different FDD tools can be easily compared.

4.4. Calculation of Fault Prevalence

Initial fault prevalence research has been conducted by employing the fault taxonomy mapping results. The fault prevalence research is based on data collected from various commercialized FDD tools across the U.S. The objective of the research is to understand the fault occurrence for a specific fault or for a specific component. We designed various metrics to assess the fault occurrence and prevalence.
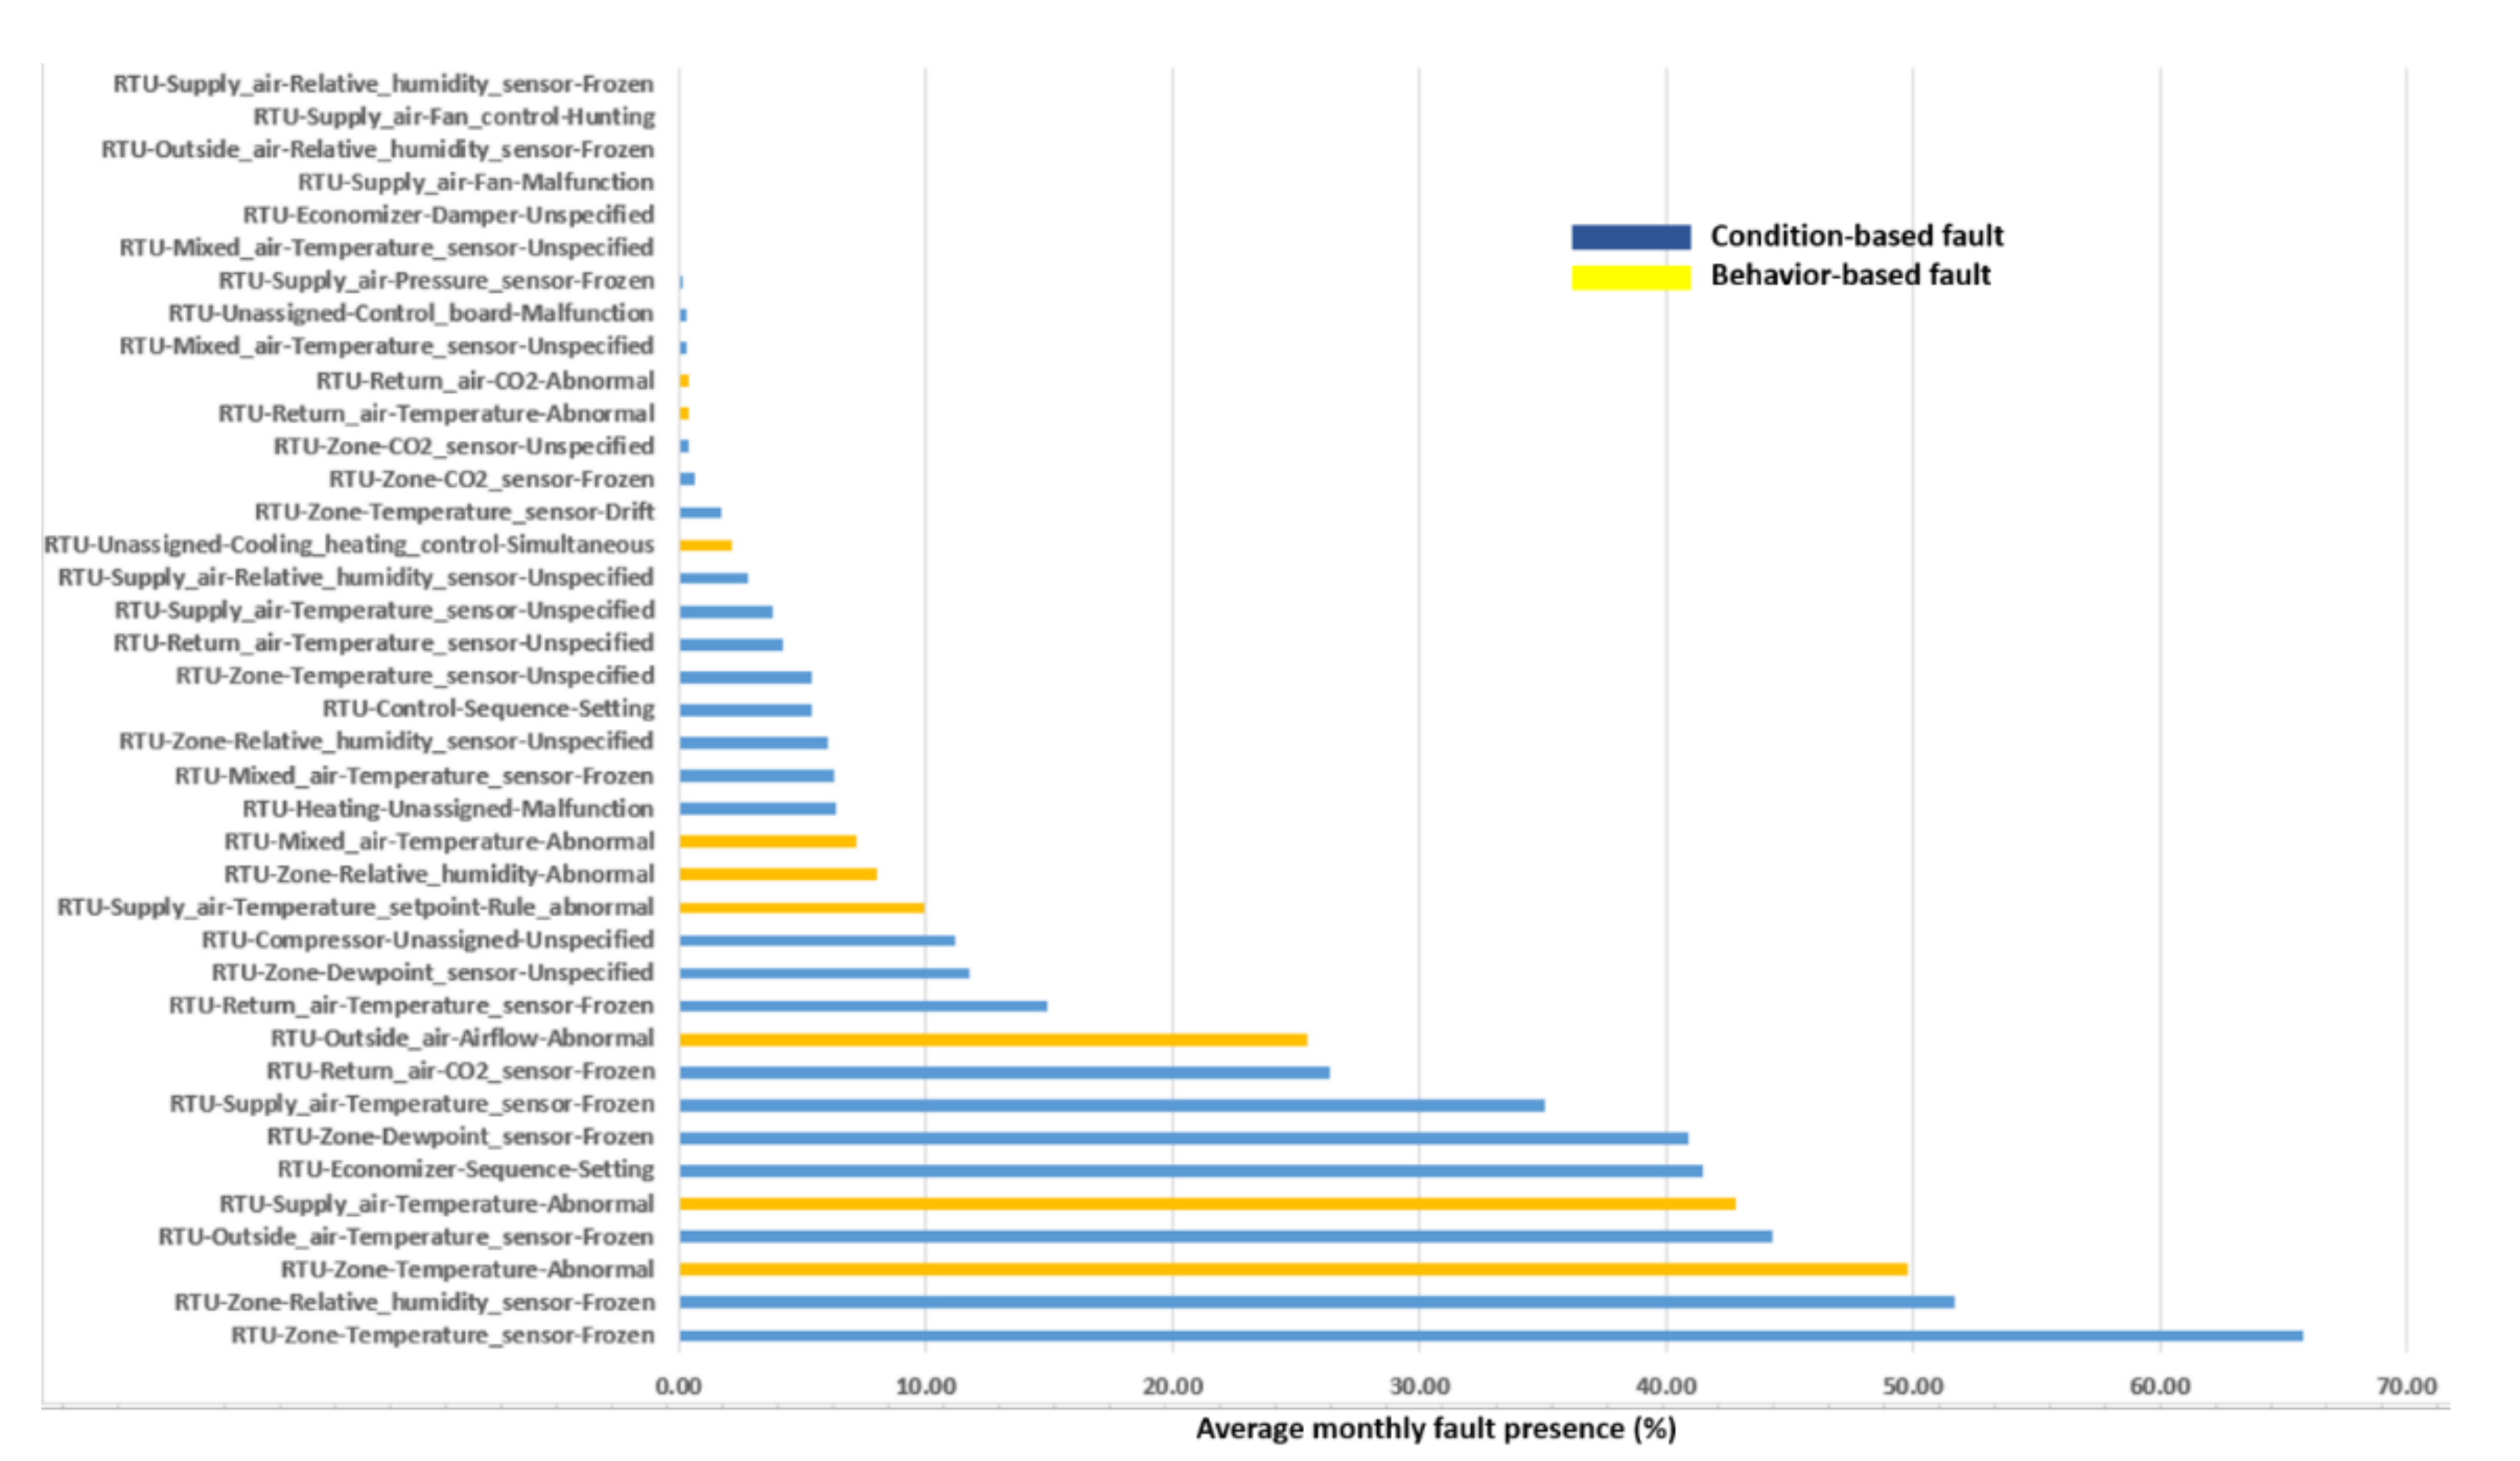
For example, we designed a metric which is the average monthly fault presence. In this metric, we measure what percentage of equipment experiences the presence of fault type ‘x’ on one or more days in a month, averaged across all months (expressed as a percentage of all equipment that could experience that fault). Using no. 1 FDD report as an example, the average monthly fault presence for the 39 mapped faults is from 0.02 to 65.8% as given in Figure 6. It can be seen that the sensor related faults demonstrate a higher fault presence value compared with faults in other types of components. For instances, zone temperature sensor frozen fault (RTU-Zone-Temperature_sensor-Frozen), zone relative humidity sensor frozen (RTU-Zone-Relative_humidity_sensor-Frozen) fault, and outside air temperature sensor frozen (RTU-Outside_air-Temperature_sensor-Frozen) fault reach to 65.8%, 51.7%, and 44.3% respectively.
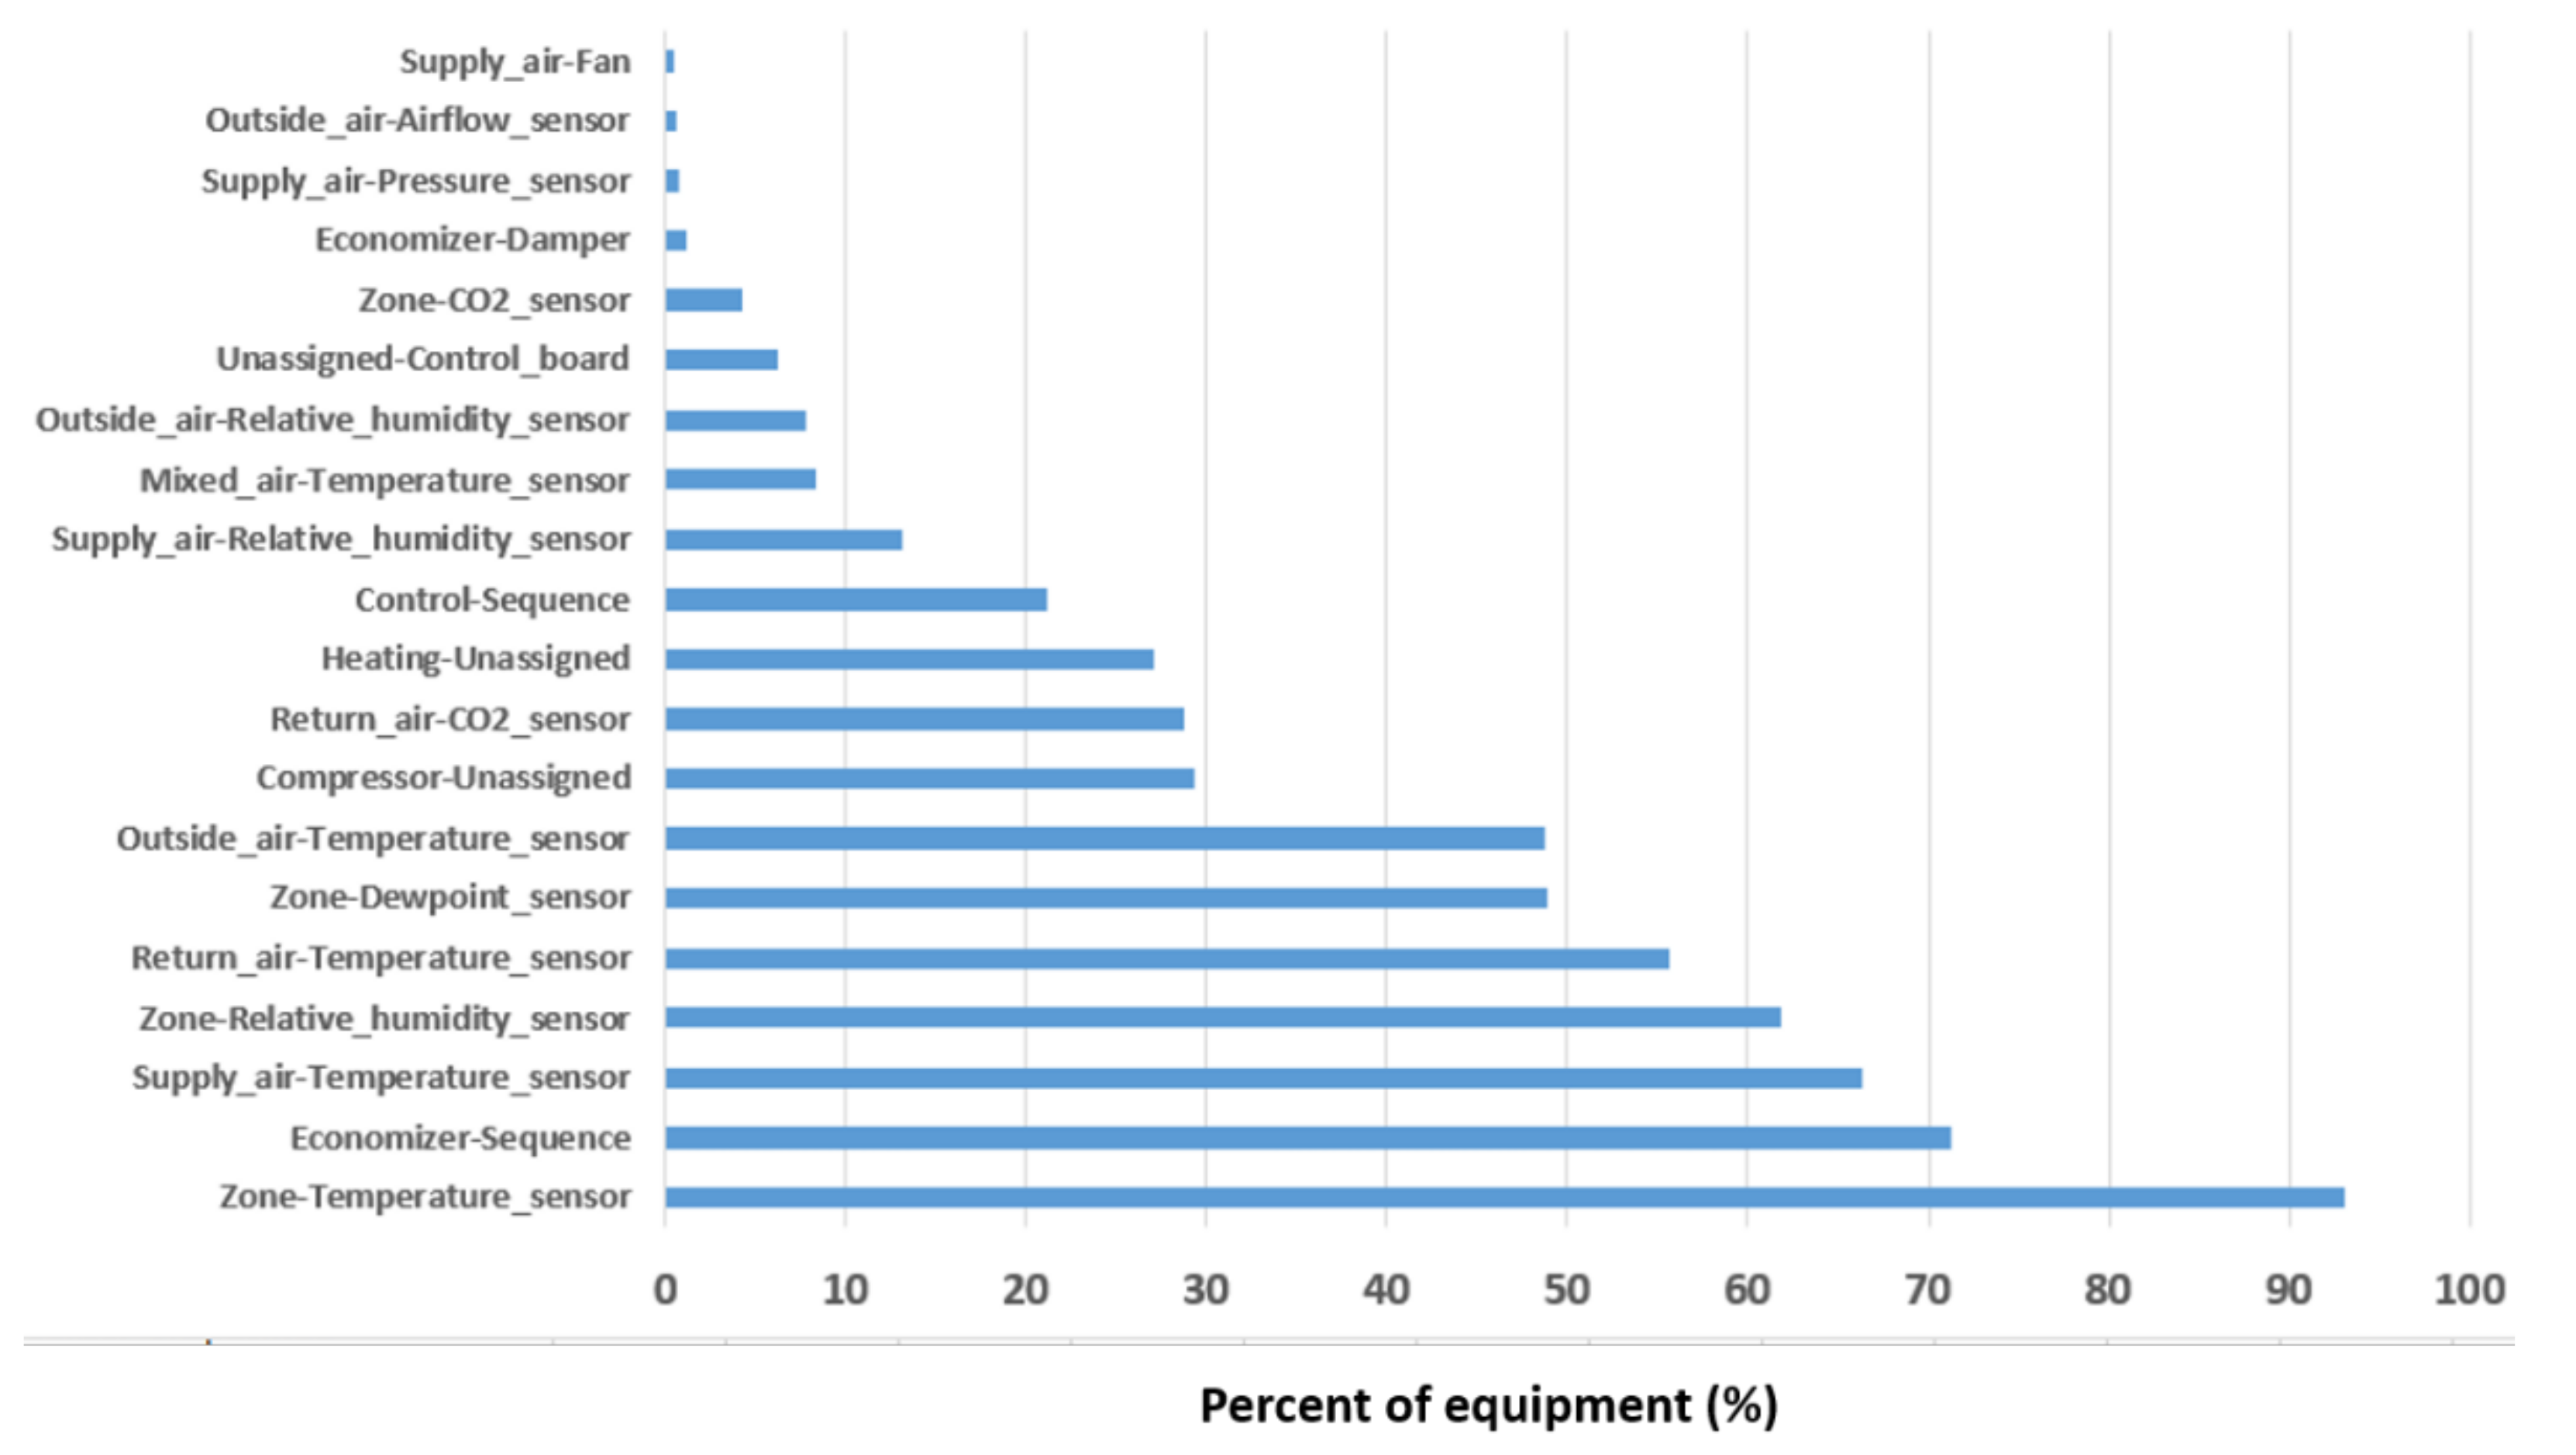
The format of fault name convention also enables the efficient data query to explore more detailed fault occurrence or evaluate equipment operation at different granular levels. Using the same data set from no. 1 FDD report, 20 different physical components (components associated with condition-based faults) are reported to experience a type of fault. 0.1% to 93.2% equipment report faults related to those 20 components as shown in Figure 7. The top five components that a high percentage of equipment may report the faults are zone temperature sensor, economizer sequence, supply air temperature sensor, zone relative humidity sensor, and return air temperature sensor related. It can be seen that, through the clear definition of fault names and a well-designed format in the fault name conventions, it will be much easier to calculate and assess the fault occurrence at various components across the population of equipment.

5. Discussion

To date, the taxonomy covers three major system types: RTUs, AHUs, and ATUs. The unified fault taxonomy library includes 293 faults for three types of equipment. Further improvements including expansion to additional equipment/components, relation model validation, and compatibility with other standards, are worth considering when updating the taxonomy.

5.1. Expansion of the Taxonomy to Cover Different Equipmennt/Components

When developing the unifying fault taxonomy, the researchers first tried to include common faults reported in existing academic literature, as well as commercial FDD tools into the fault libraries. The selected equipment, i.e., AHUs, RTUs, and ATUs are widely equipped in today’s HVAC systems in commercial buildings. However, we found different system physical configurations and additional components may be adopted in each type of equipment to meet different application requirements. For example, some RTUs are equipped with additional components such as heat recovery wheels and CO2 sensors to improve energy efficiency and indoor air quality. Those components are not included in the existing physical hierarchy. Therefore, faults related to such components were not included in the fault libraries of the existing taxonomy.
Therefore, it is possible to extend the fault library so that the library can cover novel faults when new equipment physical configurations or additional components are incorporated into the development of the fault taxonomy. Furthermore, other common equipment—such as chiller plants, boiler, and refrigerant equipment—are expected to be included into future libraries in the fault taxonomy.

5.2. Validation of Relation Model

The causal relation models in the fault taxonomy, which reflect the cause-and-effect relationships between condition-based faults and behavior-based faults, were developed to represent relations within one piece of equipment within the larger HVAC system. However, we did not carry out the validation of the developed relation models due to the limited data set at hand. We planned to validate the relation models when more FDD report data are received. Furthermore, we would also like to point out that an HVAC system is a closely coupled system in which various equipment may affect each other. Therefore, a fault in one equipment may propagate to affect other equipment in the system. For example, an AHU outside air damper stuck at a too high position fault in the summer season may cause pump speed to be abnormal in the chiller plant compared with the baseline. Those fault propagations were believed to arise from the difficulty of accurately locating and isolating a fault in a complex system. Furthermore, an HVAC system operates under different modes and conditions. In some operation modes, associated behavior-based faults may be reported together with the condition-based fault. However, in other operation modes, those behavior-based faults may not be detected. Therefore, a field validation should be conducted to assess developed relations between a condition-based fault and associated behavior-based faults and improve the accuracy of the relation models.

5.3. Integration with Other Standards

Various standards or ontology models have been developed to increase the building data interpretability and interoperability. During the development of fault taxonomy, we also borrow some terms from other standards or ontology models such as Brick Schema [40] and Project Haystack [16]. Additionally, as presented in the Introduction section, some organizations were reported as making efforts on integration standards and labeling faults conventions for FDD. A unified standard of formats and semantic characteristics for data collected from the entire life cycle of buildings will significantly improve the future building meta-data analytics. Therefore, we will further study the possibility of the integration of the developed taxonomy with other standards or models.

6. Conclusions

In big data analytics, a unified data taxonomy and standardized data format is a fundamental requirement to better interpret the data. Today, the increasing deployment of FDD tools in commercial buildings significantly ensures the system operation reliability and improves building operational performance. Although a large amount of data which reflects faults for equipment and components in HVAC systems has been generated via various FDD tool reports, a lack of a unified fault taxonomy makes it difficult to interpret the FDD report data across various FDD tools.
In this paper, we describe the development of a unified taxonomy for HVAC system faults relating to AHUs, ATUs, and RTUs. The developed fault taxonomy gives an accurate and orderly classification of HVAC equipment faults based upon their characteristics and causal relations. The designed fault name conventions can significantly improve the FDD report data interpretability. The data format of fault names which is well-structured and machine-readable, makes it possible to efficiently query fault data for further data analytics.
Data generated by FDD software tools are used to demonstrate how the developed fault taxonomy was used to identify RTU faults. The results show that a concise and accurate fault set can be obtained through mapping the fault taxonomy to the diagnostic results. The mapped fault sets can be used in various analytics which are primarily based on the FDD report data. The case study shows that the taxonomy can be successfully applied for a major fault prevalence study, prior to its full publication.
Our future works include extending the fault taxonomy library so that various equipment and corresponding physical configurations can be included. Besides, field validation works will be performed when conducting fault prevalence research. Through this way, the probabilities of a fault and its impacts are expected to be identified.

Author Contributions

Y.C.: Methodology, Writing—Original Draft; G.L.: Conceptualization, Writing—Reviewing and Editing; E.C.: Supervision, Writing—Reviewing and Editing; J.G.: Project administration, Funding acquisition. All authors have read and agreed to the published version of the manuscript.

Funding

This work was supported by the Assistant Secretary for Energy Efficiency and Renewable Energy, Building Technologies Office, of the U.S. Department of Energy under Contract No. DOE-AC02-05CH11231.

Institutional Review Board Statement

Not Applicable.

Informed Consent Statement

Not Applicable.

Data Availability Statement

Not Applicable.

Acknowledgments

The authors wish to acknowledge Erika Gupta for her guidance and support of the research, as well as our FDD technology partners who contributed to the FDD tool reports.

Conflicts of Interest

The authors declare no conflict of interest.

References

  1. EIA. Annual Energy Outlook 2020; Energy Information Administration: Washington, DC, USA, 2020.
  2. Katipamula, S.; Brambley, M.R. Methods for fault detection, diagnostics, and prognostics for building systems—A review, part I. Hvac R Res. 2005, 11, 3–25. [Google Scholar] [CrossRef]
  3. Ginestet, S.; Marchio, D.; Morisot, O. Evaluation of faults impacts on energy consumption and indoor air quality on an air handling unit. Energy Build. 2008, 40, 51–57. [Google Scholar] [CrossRef]
  4. Breuker, S.M.; Braun, J.E. Common faults and their impacts for rooftop air conditioners. HVAC R Res. 1998, 4, 303–318. [Google Scholar] [CrossRef]
  5. Yang, C.; Chen, Q.; Shen, W.; Gunay, B. Toward failure mode and effect analysis for heating, ventilation and air-conditioning. In Proceedings of the 2017 IEEE 21st International Conference on Computer Supported Cooperative Work in Design (CSCWD), Wellington, New Zealand, 26–28 April 2017. [Google Scholar]
  6. Company, Pacific Gas & Electric. Fault Detection and Diagnostic Software ET Project Number: ET11PGE3131; 2012.
  7. Motegi, N.; Piette, M.A.; Kinney, S.; Herter, K. Web-Based Energy Information Systems for Energy Management and Demand Response in Commercial Buildings; Report LBNL-52512; Lawrence Berkely National Laboratory: Berkeley, CA, USA, 2003.
  8. Granderson, J.; Singla, R.; Mayhorn, E.; Ehrlich, P.; Vrabie, D.; Frank, S. Characterization and Survey of Automated Fault Detection and Diagnostic Tools; Report LBNL-2001075; Lawrence Berkely National Laboratory: Berkeley, CA, USA, 2017.
  9. Granderson, J.; Kramer, H.; Lin, G.; Curtin, C.; Crowe, E. Proving the Business Case for Building Analytics; Report LBNL; Lawrence Berkely National Laboratory: Berkeley, CA, USA, 2020.
  10. Kim, W.; Katipamula, S. A review of fault detection and diagnostics methods for building systems. Sci. Technol. Built Environ. 2018, 24, 3–21. [Google Scholar] [CrossRef]
  11. Kramer, H.; Lin, G.; Granderson, J.; Curtin, C.; Crowe, E.; Tang, R. Synthesis of Year Three Outcomes in the Smart Energy Analytics Campaign; LBNL-2001217; Lawrence Berkeley Laboratory: Berkeley, CA, USA, 2019.
  12. Joy Ulickey, T.F.; Koeppel, E.; Soper, J. Building Performance Tracking in Large Commercial Buildings: Tools and Strategies. In Characterization of Fault Detection and Diagnostic (FDD) and Advanced Energy Information System (EIS) Tools; California Commissioning Collaborative: Sacramento, CA, USA, 2010. [Google Scholar]
  13. Heinemeier, K. Rooftop HVAC Fault Detection and Diagnostics: Technology and Market Review Energy and Demand Savings Estimates; New Buildings Institute: Davis, CA, USA, 2012. [Google Scholar]
  14. Wiggins, M.; Brodrick, J. HVAC fault detection. ASHRAE J. 2012, 54, 78–80. [Google Scholar]
  15. Balaji, B.; Bhattacharya, A.; Fierro, G.; Gao, J.; Gluck, J.; Hong, D.; Johansen, A.; Koh, J.; Ploennigs, J.; Agarwal, Y.; et al. Brick: Towards a unified metadata schema for buildings. In Proceedings of the 3rd ACM International Conference on Systems for Energy-Efficient Built Environments, Palo Alto, CA, USA, 16–17 November 2016. [Google Scholar]
  16. Fierro, G.; Prakash, A.K.; Mosiman, C.; Pritoni, M.; Raftery, P.; Wetter, M.; Culler, D.E. Shepherding Metadata Through the Building Lifecycle. In Proceedings of the 7th ACM International Conference on Systems for Energy-Efficient Buildings, Cities, and Transportation, Virtual Event, Japan, 18–20 November 2020. [Google Scholar]
  17. Malafsky, G.P.; Newman, B. Organizing Knowledge with Ontologies and Taxonomies; Techi LLC: Midway, UT, USA, 2009; pp. 1–12. [Google Scholar]
  18. Pritoni, M.; Paine, D.; Fierro, G.; Mosiman, C.; Poplawski, M.; Saha, A.; Bender, J.; Granderson, J. Metadata Schemas and Ontologies for Building Energy Applications: A Critical Review and Use Case Analysis. Energies 2021, 14, 2024. [Google Scholar] [CrossRef]
  19. Tomašević, N.M.; Batić, M.Č.; Blanes, L.M.; Keane, M.M.; Vraneš, S. Ontology-based facility data model for energy management. Adv. Eng. Inf. 2015, 29, 971–984. [Google Scholar] [CrossRef]
  20. Lork, C.; Choudhary, V.; Hassan, N.U.; Tushar, W.; Yuen, C.; Ng, B.K.K.; Wang, X.; Liu, X. An Ontology-Based Framework for Building Energy Management with IoT. Electronics 2019, 8, 485. [Google Scholar] [CrossRef] [Green Version]
  21. Nelson, P.E.; Dignani, M.C.; Anaissie, E.J. Taxonomy, biology, and clinical aspects of Fusarium species. Clin. Microbiol. Rev. 1994, 7, 479–504. [Google Scholar] [CrossRef]
  22. Ein-Dor, P. Taxonomies of knowledge. In Encyclopedia of Knowledge Management, 2nd ed.; IGI Global: Hershey, PA, USA, 2011; pp. 1490–1499. [Google Scholar]
  23. Bruning, S.; Weissleder, S.; Malek, M. A fault taxonomy for service-oriented architecture. In Proceedings of the 10th IEEE High Assurance Systems Engineering Symposium (HASE’07), Dallas, TX, USA, 14–16 November 2007. [Google Scholar]
  24. Chan, K.M.; Bishop, J.; Steyn, J.; Baresi, L.; Guinea, S. A fault taxonomy for web service composition. In Proceedings of the International Conference on Service-Oriented Computing, Newport Beach, CA, USA, 19–20 June 2007. [Google Scholar]
  25. Isermann, R.; Balle, P. Trends in the application of model-based fault detection and diagnosis of technical processes. Control. Eng. Pract. 1997, 5, 709–719. [Google Scholar] [CrossRef]
  26. Roth, K.W.; Westphalen, D.; Feng, M.Y.; Llana, P.; Quartararo, L. Energy Impact of Commercial Building Controls and Performance Diagnostics: Market Characterization, Energy Impact of Building Faults and Energy Savings Potential; US Department of Energy: Washington, DC, USA, 2005.
  27. Frank, S.; Lin, G.; Jin, X.; Singla, R.; Farthing, A.; Granderson, J. A performance evaluation framework for building fault detection and diagnosis algorithms. Energy Build. 2019, 192, 84–92. [Google Scholar] [CrossRef] [Green Version]
  28. Breuker, M.; Rossi, T.; Braun, J. Smart maintenance for rooftop units. ASHRAE J. 2000, 42, 41–47. [Google Scholar]
  29. Li, H.; Braun, J.E. A methodology for diagnosing multiple simultaneous faults in vapor-compression air conditioners. HVAC R Res. 2007, 13, 369–395. [Google Scholar] [CrossRef]
  30. Cheung, H.; Braun, J.E. Development of Fault Models for Hybrid Fault Detection and Diagnostics Algorithm: October 1, 2014–May 5, 2015; National Renewable Energy Lab. (NREL): Golden, CO, USA, 2015.
  31. Zhang, R.; Hong, T. Modeling of HVAC operational faults in building performance simulation. Appl. Energy 2017, 202, 178–188. [Google Scholar] [CrossRef]
  32. Pradhan, A.; Akinci, B. A taxonomy of reasoning mechanisms and data synchronization framework for road excavation productivity monitoring. Adv. Eng. Inform. 2012, 26, 563–573. [Google Scholar] [CrossRef]
  33. Isermann, R. An Introduction from Fault Detection to Fault Tolerance; Springer: Berlin/Heidelberg, Germany, 2006. [Google Scholar]
  34. Yadav, A.; Dash, Y. An overview of transmission line protection by artificial neural network: Fault detection, fault classification, fault location, and fault direction discrimination. Adv. Artif. Neural Syst. 2014, 2014, 1–20. [Google Scholar] [CrossRef] [Green Version]
  35. Mariani, L. A fault taxonomy for component-based software. Electron. Notes Theor. Comput. Sci. 2003, 82, 55–65. [Google Scholar] [CrossRef] [Green Version]
  36. Marchetto, A.; Ricca, F.; Tonella, P. An empirical validation of a web fault taxonomy and its usage for web testing. J. Web Eng. 2009, 8, 316. [Google Scholar]
  37. Wang, W.; Katipamula, S.; Ngo, H.; Underhill, R. Energy performance evaluation of variable-speed packaged rooftop units using field measurements and building energy simulation. Energy Build. 2019, 183, 118–128. [Google Scholar] [CrossRef]
  38. EIA. Commercial Buildings Energy Consumption Survey (CBECS) Data: Table B40 and B41 (2012); Energy Information Administration: Washington, DC, USA, 2012.
  39. Quinn, C.; McArthur, J. A case study comparing the completeness and expressiveness of two industry recognized ontologies. Adv. Eng. Inform. 2021, 47, 101233. [Google Scholar] [CrossRef]
  40. Balaji, B.; Bhattacharya, A.; Fierro, G.; Gao, J.; Gluck, J.; Hong, D.; Johansen, A.; Koh, J.; Ploennigs, J.; Agarwal, Y.; et al. Brick: Metadata schema for portable smart building applications. Appl. Energy 2018, 226, 1273–1292. [Google Scholar] [CrossRef]
  41. Schein, J.; Schein, J. Results from Field Testing of Embedded Air Handling Unit and Variable Air Volume Box Fault Detection Tools; NISTIR 6994; National Institute of Standards and Technology: Gaithersburg, MD, USA, 2006.
  42. Katipamula, S.; Kim, W.; Lutes, R.G.; Underhill, R.M. Rooftop Unit Embedded Diagnostics: Automated Fault Detection and Diagnostics (AFDD) Development, Field Testing and Validation; Pacific Northwest National Lab. (PNNL): Richland, WA, USA, 2015.
  43. Southwick, S.B.; Lampert, C.K.; Southwick, R. Preparing controlled vocabularies for linked data: Benefits and challenges. J. Libr. Metadata 2015, 15, 177–190. [Google Scholar] [CrossRef]
  44. Merino, J.; Caballero, I.; Rivas, B.; Serrano, M.; Piattini, M. A data quality in use model for big data. Future Gener. Comput. Syst. 2016, 63, 123–130. [Google Scholar] [CrossRef]
  45. Kaisler, S.; Armour, F.; Espinosa, J.A.; Money, W. Big data: Issues and challenges moving forward. In Proceedings of the 2013 46th Hawaii International Conference on System Sciences, Wailea, HI, USA, 7–10 January 2013. [Google Scholar]
  46. Chen, M.; Mao, S.; Liu, Y. Big Data: A Survey. Mob. Netw. Appl. 2014, 19, 171–209. [Google Scholar] [CrossRef]
  47. Lee, W.-S.; Grosh, D.L.; Tillman, F.A.; Lie, C.H. Fault tree analysis, methods, and applications ߝ a review. IEEE Trans. Reliab. 1985, 34, 194–203. [Google Scholar] [CrossRef]
  48. Chien, C.-F.; Chen, S.-L.; Lin, Y.-S. Using Bayesian network for fault location on distribution feeder. IEEE Trans. Power Deliv. 2002, 17, 785–793. [Google Scholar] [CrossRef]
Figure 1. Examples of FDD tool analytics report: (a) tabular/text summary (b) visual display showing AHU cooling coil valve detection result [12].
Energies 14 05581 g001
Figure 2. Illustration of the physical hierarchy for an RTU.
Energies 14 05581 g002
Figure 3. Typical RTU configuration.
Energies 14 05581 g003
Figure 4. Examples of fault relations: (a) one condition-based fault with multiple associated behavior-based faults that may be caused by the condition-based fault; (b) one behavior-based fault that may be caused by multiple condition-based faults.
Energies 14 05581 g004
Figure 5. Flowchart of the fault name mapping procedure.
Energies 14 05581 g005
Figure 6. Average monthly fault presence (Data from no. 1 FDD report).
Energies 14 05581 g006
Figure 7. Percentage of equipment that report faults related to a specific component (Data from no. 1 FDD report).
Energies 14 05581 g007
Table 1. Fault definition conventions [27].
CategoryCondition-Based FaultBehavior-Based FaultOutcome-Based Fault
DefinitionPresence of an improper or undesired physical condition in a system or piece of equipment Presence of improper or undesired behavior during the operation of a system or piece of equipmentA state in which a quantifiable outcome or performance metric for a system or piece of equipment deviates from a correct or reference outcome, termed the expected outcome
ExampleOutside air damper stuck openMixing air temperature is too highExcessive cooling energy consumption
Table 2. Component locations in the RTU configuration and their code in fault IDs.
No.LocationCode Used in Fault IDs
1Outside air sectionOutside_air
2Supply air sectionSupply_air
3Return air sectionReturn_air
4Mixed air sectionMixed_air
5Compressor sectionCompressor
6Condenser sectionCondenser
7Evaporator sectionEvaporator
8Heating sectionHeating
9Refrigerant circuitRefrigerant_circuit
10Economizer sectionEconomizer
11Discharge air sectionDischarge_air
12Suction sectionSuction
13Zone sectionZone
14Control sectionControl
15UnassignedUnassigned
Table 3. Component types of a typical RTU configuration.
LocationComponent Type
Outside air sectionOutside air temperature sensor
Outside air relative humidity sensor
Outside airflow sensor
Outside air damper
Temperature
Relative humidity
Air flow
Damper position
Supply air sectionSupply air temperature sensor
Supply air pressure sensor
Supply air relative humidity sensor
Supply airflow sensor
Supply air fan
Supply air filter
Temperature
Relative humidity
Air flow
Pressure
Fan speed
Return air sectionReturn air temperature sensor
Return air CO2 sensor
Return air vent
Temperature
CO2
Zone sectionZone temperature sensor
Zone relative humidity sensor
Zone CO2 sensor
Zone dewpoint temperature sensor
Temperature
Relative humidity
CO2
Economizer sectionEconomizer damper
Compressor sectionCompressor motor
Compressor lubrication oil
Compressor discharge part sectionCompressor discharge valve
Compressor suction part sectionCompressor suction valve
Condenser sectionCondenser coil
Condenser gas
Fan
Unassigned
Evaporator sectionEvaporator coil
Evaporator filter
Heating deviceUnassigned
Refrigerant sectionRefrigerant circuit refrigerant
Refrigerant circuit expansion device
Control boardUnassigned
ControlSchedule
Setpoint
Control sequence
UnassignedCooling consumption
Heating consumption
Electricity power consumption
Table 4. List of controlled vocabularies.
No.Controlled Vocabulary Used in Fault IDsExample Component Type in Which the Fault May OccurDescription of Fault Nature
1BiasSupply air temperature sensorSensor reading value is constantly higher or lower than the real value
2DriftSupply air temperature sensorLow frequency reading value change in a sensor with time
3FrozenSupply air temperature sensorSensor reading value is frozen at a constant value
4FoulingCooling coilFouling is the buildup of sediments and debris on the surface area of a coil
5SizeSupply air ductImproper coil, duct, pump size
6LeakageHeating coil valveFluid or air escape from the coil, or valve, or duct due to sealing issues
7StuckOutside air damperActuator is stuck at a certain position due to mechanical or electrical malfunction
8Setpoint_settingControl setpoint settingImproper control setpoint setting
9Sequence_settingControl sequence settingControl interlock fault, improper control mode
10Schedule_settingSchedule settingSchedule setting fault
11BlockFilterFilter is blocked by fouling
12MalfunctioningSupply air fanFan fault due to motor failure, loose belt, or other hardware faults
13RestrictionRefrigerant circuit in the RTUThe refrigerant circuit is restricted
14ChargeRefrigerant circuit in the RTULiquid line or filter/dryer is restricted
15No_condensable_gasRefrigerant circuit in the RTUNo condensable gas is present in the circuit
16Rule_abnormalSupply air temperature and setpointMay apply to all measurements and setpoint. Represent relations between two or more measurements in one fault name
17HuntingSupply air fanUnstable actuator behaviors such as cycling operation due to improper control parameters
18SimultaneousCooling and heatingSimultaneously provide heating and cooling
19Short_cyclingCompressor in the RTUControl problems cause short runtime
20AbnormalSupply air relative humidity Physical measurements are abnormal (e.g., temperature is too high or too low)
21UnspecifiedN/AThe description of the fault nature is not given
Table 5. Example of a condition-based fault name.
Equipment TypeComponent LocationComponent TypeFault Nature
RTUSupply_airTemperature_sensorBias
Table 6. Example of a behavior-based fault name.
Equipment TypeComponent LocationComponent TypeFault Nature
RTUSupply_airFan_controlHunting
Table 7. Fault name mapped and number of raw fault names in the No. 1 FDD report.
No.Fault Name MappedNumber of Raw Fault NamesFault Type
1RTU-Zone-Temperature-Abnormal23BB *
2RTU-Zone-Temperature_sensor-Unspecified14CB **
3RTU-Economizer-Sequence-Setting8CB
4RTU-Control-Sequence-Setting8CB
5RTU-Zone-CO2_sensor-Unspecified6CB
6RTU-Zone-Temperature_sensor-Drift6CB
7RTU-Supply_air-Temperature-Abnormal6BB
8RTU-Return_air-Temperature_sensor-Unspecified5CB
9RTU-Compressor-Unassigned-Unspecified5CB
10RTU-Zone-Temperature_sensor-Frozen5CB
11RTU-Mixed_air-Temperature-Abnormal5BB
12RTU-Supply_air-Relative_humidity_sensor-Unspecified4CB
13RTU-Zone-CO2_sensor-Frozen4CB
14RTU-Supply_air-Temperature_sensor-Unspecified4CB
15RTU-Zone-Dewpoint_sensor-Unspecified4CB
16RTU-Zone-Relative_humidity_sensor-Unspecified4CB
17RTU-Zone-Relative_humidity_sensor-Frozen3CB
18RTU-Mixed_air-Temperature_sensor-Unspecified3CB
19RTU-Outside_air-Airflow-Abnormal3BB
20RTU-Supply_air-Temperature_setpoint-Rule_abnormal2BB
21RTU-Zone-Relative_humidity-Abnormal2BB
22RTU-Supply_air-Temperature_sensor-Frozen2CB
23RTU-Supply_air-Fan-Malfunction2CB
24RTU-Return_air-Temperature_sensor-Frozen2CB
25RTU-Heating-Unassigned-Malfunction2CB
26RTU-Economizer-Damper-Unspecified2CB
27RTU-Unassigned-Control_board-Malfunction1CB
28RTU-Unassigned-Cooling_heating_control-Simultaneous1BB
29RTU-Supply_air-Fan_control-Hunting1BB
30RTU-Return_air-CO2_sensor-Frozen1CB
31RTU-Supply_air-Relative_humidity_sensor-Frozen1CB
32RTU-Mixed_air-Temperature_sensor-Frozen1CB
33RTU-Outside_air-Temperature_sensor-Frozen1CB
34RTU-Return_air-Temperature-Abnormal1BB
35RTU-Return_air-CO2-Abnormal1BB
36RTU-Supply_air-Pressure_sensor-Frozen1CB
37RTU-Outside_air-Relative_humidity_sensor-Frozen1CB
38RTU-Zone-Dewpoint_sensor-Frozen1CB
39RTU-Outside_air-Airflow_sensor-Unspecified1CB
* BB: behavior-based fault. ** CB: condition-based fault.
Table 8. Fault name mapped and number of raw fault names in the No. 2 FDD report.
No.Fault Name MappedNumber of Raw Fault NamesFault Type
1RTU-Supply_air-Temperature_sensor-Unspecified1CB
2RTU-Outside_air-Temperature_sensor-Unspecified1CB
3RTU-Return_air-CO2_sensor-Unspecified1CB
4RTU-Economizer-Damper-Unspecified1CB
5RTU-Compressor-Unassigned-Unspecified1CB
6RTU-Condenser-Fan-Malfunction1CB
Table 9. Fault name mapping results for report no. 1.
ContentCBBBTotal
No. fault name rawNANA167
No. fault name can be mapped10245147
Pct of fault name can be mappedNANA88%
No. unique fault name according to taxonomy291039
Fault name reduction rate 71.6%77.8%73.4%
Table 10. Fault name mapping results for the report no. 2.
ContentCBBBTotal
No. fault name rawNANA17
No. fault name can be mapped606
Pct of fault name can be mappedNANA35.29%
No. unique fault name according to taxonomy606
Fault name reduction rate 0%NA0%
Publisher’s Note: MDPI stays neutral with regard to jurisdictional claims in published maps and institutional affiliations.

