Article

GHG and NH3 Emissions vs. Energy Efficiency of Maize Production Technology: Evidence from Polish Farms; a Further Study

1
Institute of Technology and Life Sciences—National Research Insitute, Falenty, 3 Hrabska Avenue, 05-090 Raszyn, Poland
2
Institute of Wood Sciences and Furniture, Warsaw University of Life Sciences, 166 Nowoursynowska St., 02-787 Warsaw, Poland
*
Author to whom correspondence should be addressed.
Energies 2021, 14(17), 5574; https://doi.org/10.3390/en14175574
Submission received: 28 June 2021 / Revised: 27 August 2021 / Accepted: 31 August 2021 / Published: 6 September 2021
(This article belongs to the Special Issue Advances in Sustainable Energy and Environmental Economics)

Abstract

:
The paper determines the effect of selected cultivation technologies, including production chain energy inputs (growing, harvest, heap forming) on greenhouse gas emissions (GHGs) to the atmosphere. The data for the study was collected from 13 actually operating family farms ranging in size from 2 to 13 ha, located in the Podlaskie voivodship (Poland). GHG and ammonia (NH3) emissions from natural and mineral fertilisation as well as GHGs from energy carriers in a form of fuels (ON) were estimated. The average GHG emissions from the sources analysed were 1848.030 kg·CO2eq·ha−1 and 29.492 kg·CO2eq·t−1 of the green forage yield. The average NH3 emissions per hectare were 15,261.808 kg NH3 and 248.871 kg NH3·t−1 of yield. The strongest impact on the environment, due to the GHG emissions to the atmosphere, thus contributing to the greenhouse effect, is due nitrogen fertilisation, both mineral and natural. On average, in the technologies under study, 61% of the total GHG emissions came from fertilisation. The GHG emissions were correlated with the energy efficiency, calculated at the previous research stage, of the production technologies applied. There is a negative correlation (r = −0.80) between the features studied, which means that the higher the energy efficiency of the silage maize plantations, the lower the air pollution emissions in a form of the GHGs from the sources under study. It is so important to prevent environmental degradation to continue, conduct in-depth, interdisciplinary research on reducing the energy consumption of crop production technologies and striving to increase energy efficiency.

1. Introduction

Despite the different sites, as for the climate change, actions are being taken to decrease the greenhouse gas (GHG) emissions from agriculture and to stabilize their concentration in the atmosphere. To accomplish those goals, interdisciplinary research and the close cooperation of agronomists, soil scientists, ecologists and environmental authorities is indispensable. With the advancement of Poland’s socioeconomic development, the importance of the energy economy is also increasings in agriculture. The march of civilisation, scientific and technological advancement as well as the resulting economic development have been responsible for an ongoing increase in the consumption of electricity and fuels transported globally. Increases in the pollution concentration ultimately degrade the environment (soil, air and water). To prevent the consequences of these climate change-related phenomena, it is necessary to quickly reduce global emissions of greenhouse gases, of which the world emits about 50 billion tons every year, measured in carbon dioxide equivalents (CO2eq) [1]. The most onerous air pollutants which come from agriculture are ammonia, nitrous oxide, nitrogen oxides, methane, carbon dioxide, odours and particulates [2]. As reported by the International Energy Agency (IEA) [3], the present energy system is mostly based on energy obtained from conventional sources. According to the report by the Energy Information Administration (EIA) [4], by 2040 the global energy consumption will have increased by 56%, which will result in a corresponding 46% increase in global CO2 emissions. An increase in the energy intensity technology is correlated with a decrease in greenhouse gas emissions [5,6]. It was estimated that the agriculture sector in the European Union (EU) accounts for 10% of the total greenhouse gas emissions of the EU (Figure 1) [7].
The Commission’s Communication to the European Parliament presents GHG emission reductions under current policies (red line in the chart) and reduction options and forecasts of GHG emission reductions in the European Union by 2050, by sector, also from agriculture (Figure 2).
At the same time there are considered threats to the natural environment resulting from the application of conventional fuels and the issues of respecting the environment and the actions are taken to promote the production of energy from renewable sources. In fear of a competition between a production of energy crops and food crops [8], the biomass production effectiveness, the crops in the areas not covered by agricultural use [9], an increase in the use of by-products for energy purposes, e.g., to reduce the greenhouse gas emissions, are gaining importance [10].
Emissions reduction due to agricultural biogas production is not only an effect of limiting the emissions during storage and applying organic fertilisers but also of replacing some energy from conventional fuels by increasing recycling and reusing the resources contributes to “closing the cycle” in the product life cycle, which will be beneficial both for the environment and for the economy [12,13,14,15,16]. Maximising the use of materials, products and waste enhances energy saving and greenhouse gas emissions reduction [17].
The EU Renewable Energy Directive (RED) provides guidelines for sustainable development criteria systems and increasing the use of biofuels through sustainable production [18,19,20]. One of the requirements for biofuels to be considered sustainable is that they must also reduce the greenhouse gas emissions at least by 50%, as compared with fossil fuels [17]. For reporting purposes, there are national inventories of pollution emissions introduced to the atmosphere which, in international terms, are a set of data on the annual emissions of respective substances in the country. As for CO2, the inventory, next to emissions, also considers carbon absorption by forest biomass. The process of emissions inventory development and reporting is specified by international agreements. One of the essential features of the inventory development methodology is the principle of calculating data for the entire time series if new information is acquired or if new emissions inventory methodology is applied; emissions inventories are subject to regular updating. Direct emissions of N2O direct-N are calculated with the use of the coefficients recommended by the IPCC provided for in “Guidelines for National Greenhouse Gas Inventories” [21,22,23]. In Poland, the National Centre for Emissions Management (KOBiZE) of the Institute of Environmental Protection—the National Research Institute is a body responsible for annual emissions calculations, a national greenhouse gas inventory development and for reporting for the international climate convention, to perform the obligations to the European Union, compliant with the Greenhouse Gas and Other Substance Emissions Management System Act of 17 July 2009 (Journal of Law No 130, item 1070 with further amendments) [24]. Greenhouse gases, CO2, CH4, N2O, HFCs, PFCs, SF6, the annual reporting, as Poland’s obligations under the United Nations Framework Convention on Climate Changes (UNFCCC), and for the purpose of the domestic statistics and to satisfy the requirements of the European Union [25].
The pollution emissions are related to various areas and forms of human activity, mostly industrial activity. The chemical compounds reaching the atmosphere undergo many changes, react with other compounds, which sometimes leads to a production of new chemical compounds the negative impact of which on the environment is sometimes greater than the harmfulness of the initial pollution.
CO2, CH4 and N2O are gases contributing to the greenhouse effect by absorbing infrared radiation, and basically retaining heat in the atmosphere. A growing concentration of those gases in the atmosphere is mostly due to fossil fuel burning, the processes of industrialization and to land use changes. This is due to more and more intensive arable land cultivation and deforestation; over 90% of emissions resulting from a change in land use. Of the nitrogen oxides which occur at various levels of oxidation—N2O, NO, N2O3, NO2—the-most-and-the-longest-persisting-in-the-atmosphere is N2O. All those factors result in an increase in the GHGs concentration and they are some of the more considerable causes of anthropogenic climate changes. Just like in other sectors of the economy, also in agriculture, especially in plant production, new technological solutions are searched for to limit the greenhouse gas and ammonia (NH3) emissions without limiting the amount and deteriorating the quality of the yields [26]. Economic losses and nitrogen pollution of common water resources and the atmospheric air due to nitrates leaching below the root zone of crops and gas emissions, NH3 and N2O, can be prevented, e.g., by applying slow-release fertilisers and inhibitors [27,28].
Since 2016 reporting on the pollution emissions produced in the chain of production of substrates of agricultural origin (biomass) for energy use has been also an obligation of the agricultural sector [29]. All the entities which take part in a biocomponent or biofuel production chain are obliged to present an estimate of emissions, and the entity introducing the biofuel on the end market—the estimate of emissions and their reduction. Each successive agricultural material processing entity, next to the estimates of the emissions produced during their technological processes, must consider the emissions produced in agricultural production. The European Union requirements in terms of the level of reducing GHGs thanks to the use of biofuels and the conditions to be met by the source of materials for biofuel production as well as promoting the use of energy from renewable sources while, at the same time, ensuring environmental-friendliness, are provided for in, e.g., Directives 2009/28/EC [17] and 2009/30/EC [30].
A partial demand for biomass for energy purposes can be met by growing maize, a crop which is especially applicable for the use in the biogas plant. It shows, e.g., high green mass yields per area unit, a high yield of biogas and good ensiling properties [31,32]. In Poland, in the field harvest structure of fodder crops, maize accounts for the biggest planted acreage, representing more than 60% of the total fodder crops acreage [33]. Maize cultivation requires, however, high energy inputs; hence a need of studies on how to enhance the production energy efficiency and how to reduce the resulting GHG emissions. Through the adequate, optimal and adapted-to-the-requirements-of-the-farm selection of machinery and tools, a selection of machinery and tools can affect the energy intensity of respective processes in the production chain and enhanceing the agrotechnical practices can affect GHG emissions to the atmosphere [34,35]. The climate change forecasts have and will still have a high impact on plant growing conditions [36,37]. Maize must be considered a species which, thanks to its physiology, can easily adapt to unfavourable climate changes and which will use the effects of those transformations well [38]. It is expected that in Central Europe, also in Poland, an increase in maize yields will account for 14% [39]. Faber et al. [40] report on climate changes being capable of increasing the maize yields in Poland from 6 to 43% and on nitrogen efficiency in maize increasing from 2 to 17%. Nitrogen efficiency enhancement can limit unproductive nitrogen losses from the fertilisers applied, which can make the climate changes even greater due to nitrous oxide (N2O) and ammonia (NH3) emissions to the atmosphere and pollution of waters with nitrates [41,42]. The aim of the research was to identify the optimal technological variant in terms of greenhouse gas emissions, the amount of which is closely correlated with energy efficiency.

2. Methods

Table 1 provides information on the sources of emissions and the kinds of pollution, emitted to the atmosphere, covered by the analyses.
With the IPCC guidelines [21], the reports by KOBiZE [25,43,44] and EMEP/EEA 2016 [45], a pollution estimation methodology has been developed.

2.1. Emissions of N2O and CO2 from the Use of Natural and Inorganic Fertilisers

The calculations of N2O direct emissions from the application of natural fertilisers of animal origin, cattle and swine manure and slurry, as well as artificial nitrogen fertilisers were performed using the IPCC methodology [21]:
EN2ODirect-N = ESN + ENN
where EN2ODirect-N—direct emissions from soil, from fertilisers [kg·ha−1, kg·t−1 yield], ESN—emissions from the artificial nitrogen fertilisers applied [kg·ha−1, kg·t−1 yield],
ENN—emissions from the natural fertilisers of animal origin provided to soil [kg·ha−1, kg·t−1 yield].
The amount (kg N2O-N/kg) of N supplied with fertilisers was multiplied by 44/28 to estimate the emissions of N2O from the nitrogen supplied with the fertilisers applied [45].
Drawing on the IPCC methodology [21], a formula has been developed from which the CO2 emissions were estimated from the application of urea:
CO2 − C Emission = U·EFU
where CO2–C Emission—emissions of C from urea application [kg·ha−1, kg·t−1 yield], U—amount of urea [kg·ha−1] and EFU—emissions factor for urea = 0.2 [21].
To convert CO2−C emissions into CO2 emissions, the result must be multiplied by 44/12.

2.2. Emissions of N2O, CO2 and CH4 from the Fuel Consumption

In the technologies analysed, GHG (CO2, CH4 and N2O) emissions produced from diesel oil consumption in tractor and agricultural machinery engines were estimated. The real time of tractor or machinery engagement, next to the productive operation time, also consists of the time required to perform the actions related to their operation, e.g., returns, adjustments, as well as the time not directly allocated to the performance of the treatment, e.g., technical operation, the time of passes; a drive from the tractor, machinery or combined cultivator garaging place to the field [46,47].
The calculations were made based on the following formulae which applied the values of emissions factor of the gases [48]:
Emissions CO2P = Zp·EFONCO2P
Emissions CH4 = Zp·EFONCH4
Emissions N2O = Zp·EFONN2O
where Zp—fuel consumption [kg], EFONCO2P—potential emissions factor for CO2 = 3.170 [g·kg−1ON], EFONCH4—emissions factor for CH4 = 0.19 [g·kg−1ON] and EFONN2O—emissions factor for N2O = 0.16 [g·kg−1ON].
To convert the amount of the fuel consumed in dm3 into kg, compliant with Journal of Law 2018 Item 2527 [49], the following conversion factor was used: 1 dm3 ON = 0.84 kg.
The emissions of respective GHGs (N2O, CO2, CH4) from the sources under study were converted, compliant with the global warming potential (Table 2), into equivalent unit CO2eq, created to facilitate a comparison of the emissions of those gases [50]. The global warming potential expresses the number of kilograms of coal which, over 100 years, gives the same effect of global warming as 1 kg of the greenhouse gas analysed.

2.3. Emission of NH3

According to the current EMEP/EEA guidelines (2016) [45], to estimate the emissions of NH3, one can apply the Tier 1 method or a more accurate one, Tier 2. Tier 1 is the simplest method for estimating the emissions of ammonia from inorganic fertilisers, where the emissions factor for EF(NH3) has a fixed value of 0.05 kg NH3 per kilogram of N in the inorganic fertiliser applied, irrespective of the kind of the fertiliser. The study involved the use of a more accurate methodology, Tier 2, where the values of the emissions factor depend on the fertiliser type, soil pH, and on specific climate conditions. The analyses use the factor (Table 3) compliant with the EMEP/EEA guidelines (2016) [45] for the soils with pH below 7, found for about 80% of the soils of Poland, for the temperate climate zone.
To convert NH3-N emissions into NH3 emissions, the result must be multiplied by 17/14. Drawing on the assumptions made from the data reported in literature and the data declared by the manufacturers with the nitrogen content in the fertilisers applied, a formula has been developed for the estimate of NH3 emissions from the application of mineral nitrogen fertilisers:
Emissions NH3 = AN·EF·17/14
where AN—nitrogen rate (N) in the fertiliser applied [kg]; compliant with the percentage composition of the fertilisers provided by the manufacturer (Table 3) and EF—emissions factor for respective fertilisers containing nitrogen [g NH3·kg N−1 in fertiliser] (Table 3).
To convert NH3-N emissions into NH3 emissions, the result must be multiplied by 17/14.
The emissions of ammonia (NH3) were estimated from the application of natural fertilisers: cattle and swine slurry and manure.
The calculations of the emissions of NH3 from slurry were made with the formula:
NH3 emission = AG·kNG·EFG·17/14
where AG—slurry rate [kg], kNG—content of N in slurry [%] (Table 4), EFG—emissions factor [g NH3·kg N−1] (Table 4). To convert NH3-N emissions into NH3 emissions, the result must be multiplied by 17/14.
NH3 emissions produced as a result of cattle and swine manure application were estimated from the formula:
NH3 emissions = AO·kNO·EFO·17/14
where AO—manure rate [kg], kNO—content of N in manure [%] (Table 4), and EFO—emissions factor [g NH3·kg N−1] (Table 4).
To convert NH3-N emissions into NH3 emissions, the result must be multiplied by 17/14.

2.4. Scope of Research

The study was performed using the data from the farms located in the Podlaskie voivodship, in the south-eastern part of Poland (Figure 3). The region’s climate is temperate with a clear continental climate impact. In the Podlaskie voivodship, the average annual temperature is about +7 °C. The warmest month is July; the average daily temperature is +18 °C, and the coldest one—January; the average daily temperature −4.5 °C. The annual precipitation ranges from 550 to 580 mm.
It is a region dominated by agriculture, the key economic sector. The analyses were made for 13 silage maize cultivation technologies, referred to as MS1-MS13. The variety (FAO to 240) was adapted to the climate of the Podlaskie voivodship. The data for the research was taken from the technological charts. The plantation acreage ranged from 2 (MS2, MS7) to 13 (MS3) ha. The fields were 0.05 (MS2) to 2.5 (MS7, MS8) km away from the farm. The amount of the diesel oil consumed on agricultural plantations is also affected by the working conditions, especially the soil type and condition, the landform, field acreage and shape [52]. The yields fell within the range from 45 (MS13) to 80 (MS6) t·ha−1.
The variants selected differed in terms of the type and the amount of the fertilisation applied; natural (cattle and swine manure and cattle and swine slurry) and mineral (POLIFOSKA® 8-24-24, 6-20-30, 4-12-32, ammonium nitrate, ammonium phosphate, urea). With the amount of nitrogen and carbon supplied with fertilisers calculated, there were estimated the emissions of respective greenhouse gases (N2O and CO2) and ammonia (NH3) as well as the emissions of GHGs (N2O, CO2, CH4) from fuel (diesel oil) consumed by tractor and machinery engines.

3. Results

With the assumptions made, the information on the yield, the amount of fuel consumed and the calculation results for the amount of nitrogen supplied with fertilisers, calculated for the respective fertilisers, the amount of GHG and NH3 emissions for the silage maize production technologies were estimated. The silage maize production variants differed in terms of the type and the amount of the fertilisation applied. In 12 out of 13 cultivation variants, natural fertilisation was applied; in seven cases it was cattle manure and/or slurry (MS1–5, MS12–13), in five variants—pig manure and/or slurry (MS6, MS8–11). Technology MS7 involved the use of mineral fertilisation, while in MS13—natural fertilisation only. Together with the manure and slurry fertilisers, the plantations were supplied with 0.0 (MS7) to 207.6 kg N·ha−1 (MS1). The mineral fertilisation provided 0 (MS13) to 181.0 kg N·ha−1 (MS3) (Table 5). As converted into a pure component, the average N rate from natural fertilisers was 115.5 kg N·ha−1, and from mineral fertilisers—104.0 kg N·ha−1. The average total N rate per hectare was 219.4 kg N·ha−1.
The GHG and NH3 emissions for respective silage maize production technologies were referred to an area unit; hectare (Table 6) and to the yield unit; tonne (Table 7).
Table 8 provided the estimates of GHG and NH3 emissions [kg] released to the atmosphere as a result of the application of inorganic and organic fertilisers and fuel consumption per area unit [ha]. The amounts of pollution released in a form of GHGs ranged from 535.677 (technology MS13) to 2657.868 kg·CO2eq·ha−1 (technology MS1). The average emissions of those gases per hectare for the 13 technologies was 1848.030 kg·CO2eq·ha−1. As for the emissions of ammonia (NH3), the lowest amount was released in technology MS13—0.012 kg NH3·ha−1, where nitrogen is supplied only in a form of natural fertilisers. The highest amount of ammonia (NH3) per hectare was emitted in technology MS3—32,711.677 kg NH3. The average NH3 emissions per hectare for all the 13 technologies was 15,261.808 kg NH3·ha−1 (Table 6).
For the silage maize production technology variants, there was specified a percentage value of emissions from respective sources (Table 7). The analyses were made separately for GHGs and NH3. Assuming the emissions of GHGs from fertilisation and diesel oil consumption as 100%, the emissions from fertilisers accounted for 34.9% (MS13) to 79.8% (MS6). On average, the emissions from that source accounted for 61.1% of the total GHG emissions.
In the technologies under study, the key source of ammonia emissions were mineral fertilisers, the emissions accounted for 92% of NH3 emissions in total (Table 7).
The amounts of the GHG and NH3 emissions were also referred 1 tonne of silage maize produced. Producing 1 tonne of the yield resulted in the GHG emissions from 11.904 (MS13) to 40.853 kg CO2eq (MS3). The fertiliser GHG emissions ranged from 4.150 (MS13) to 32.575 kg CO2eq·t−1 (MS3), and the average value for the 13 technologies was 18.270 kg CO2eq·t−1 of the yield. ON burning produced 3.932 (MS6) to 20.538 (MS12) kg CO2eq·t−1 of the yield; on average fuel consumption for the production of 1 t of the yield resulted in 11.222 kg CO2eq·t−1. The average emissions of ammonia (NH3) per tonne of the yield amounted to 248.871 kg NH3·t−1 (Table 8).

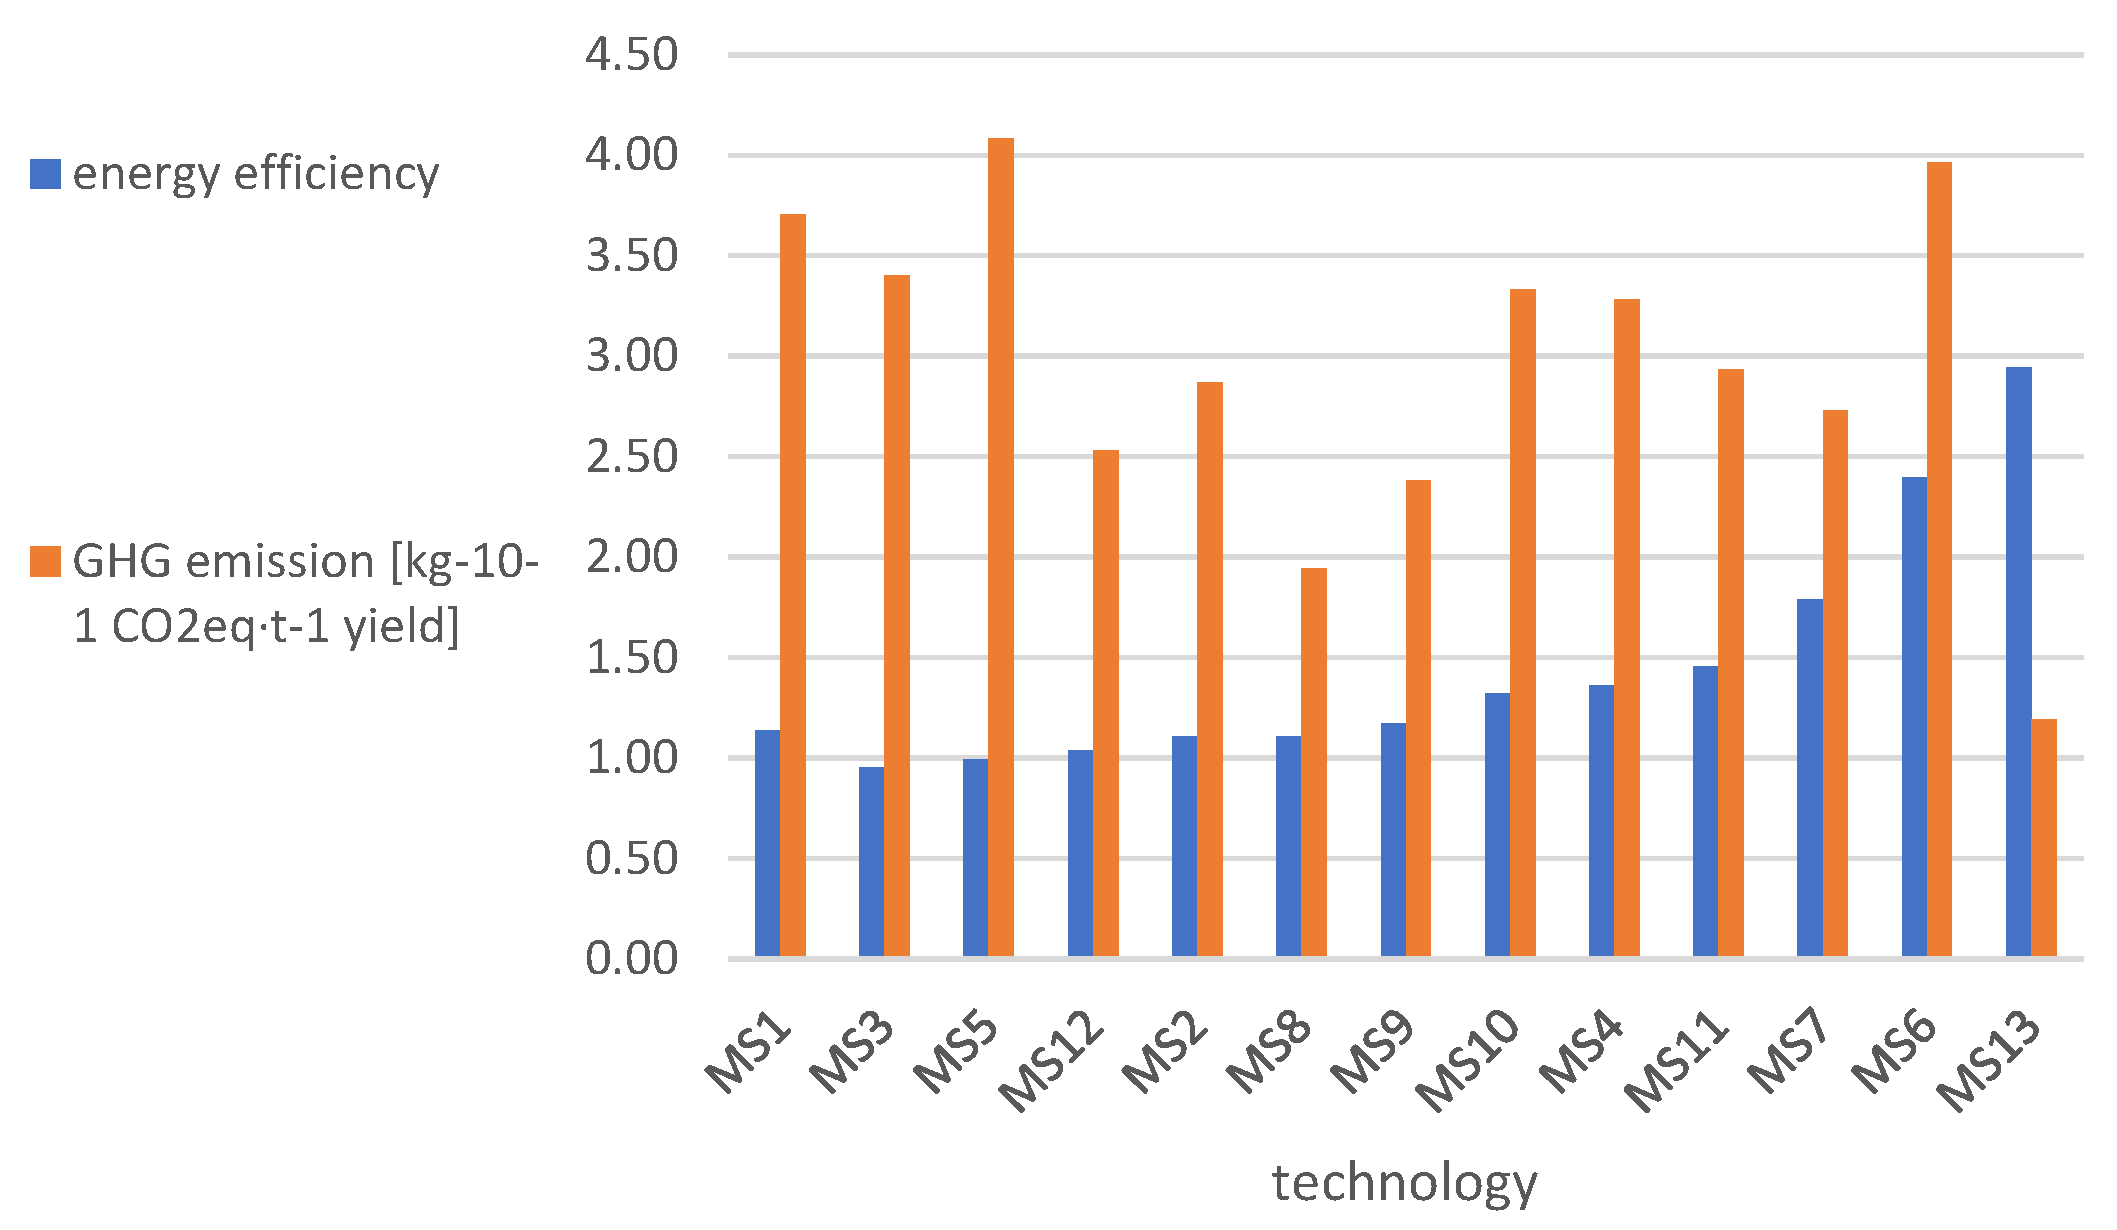
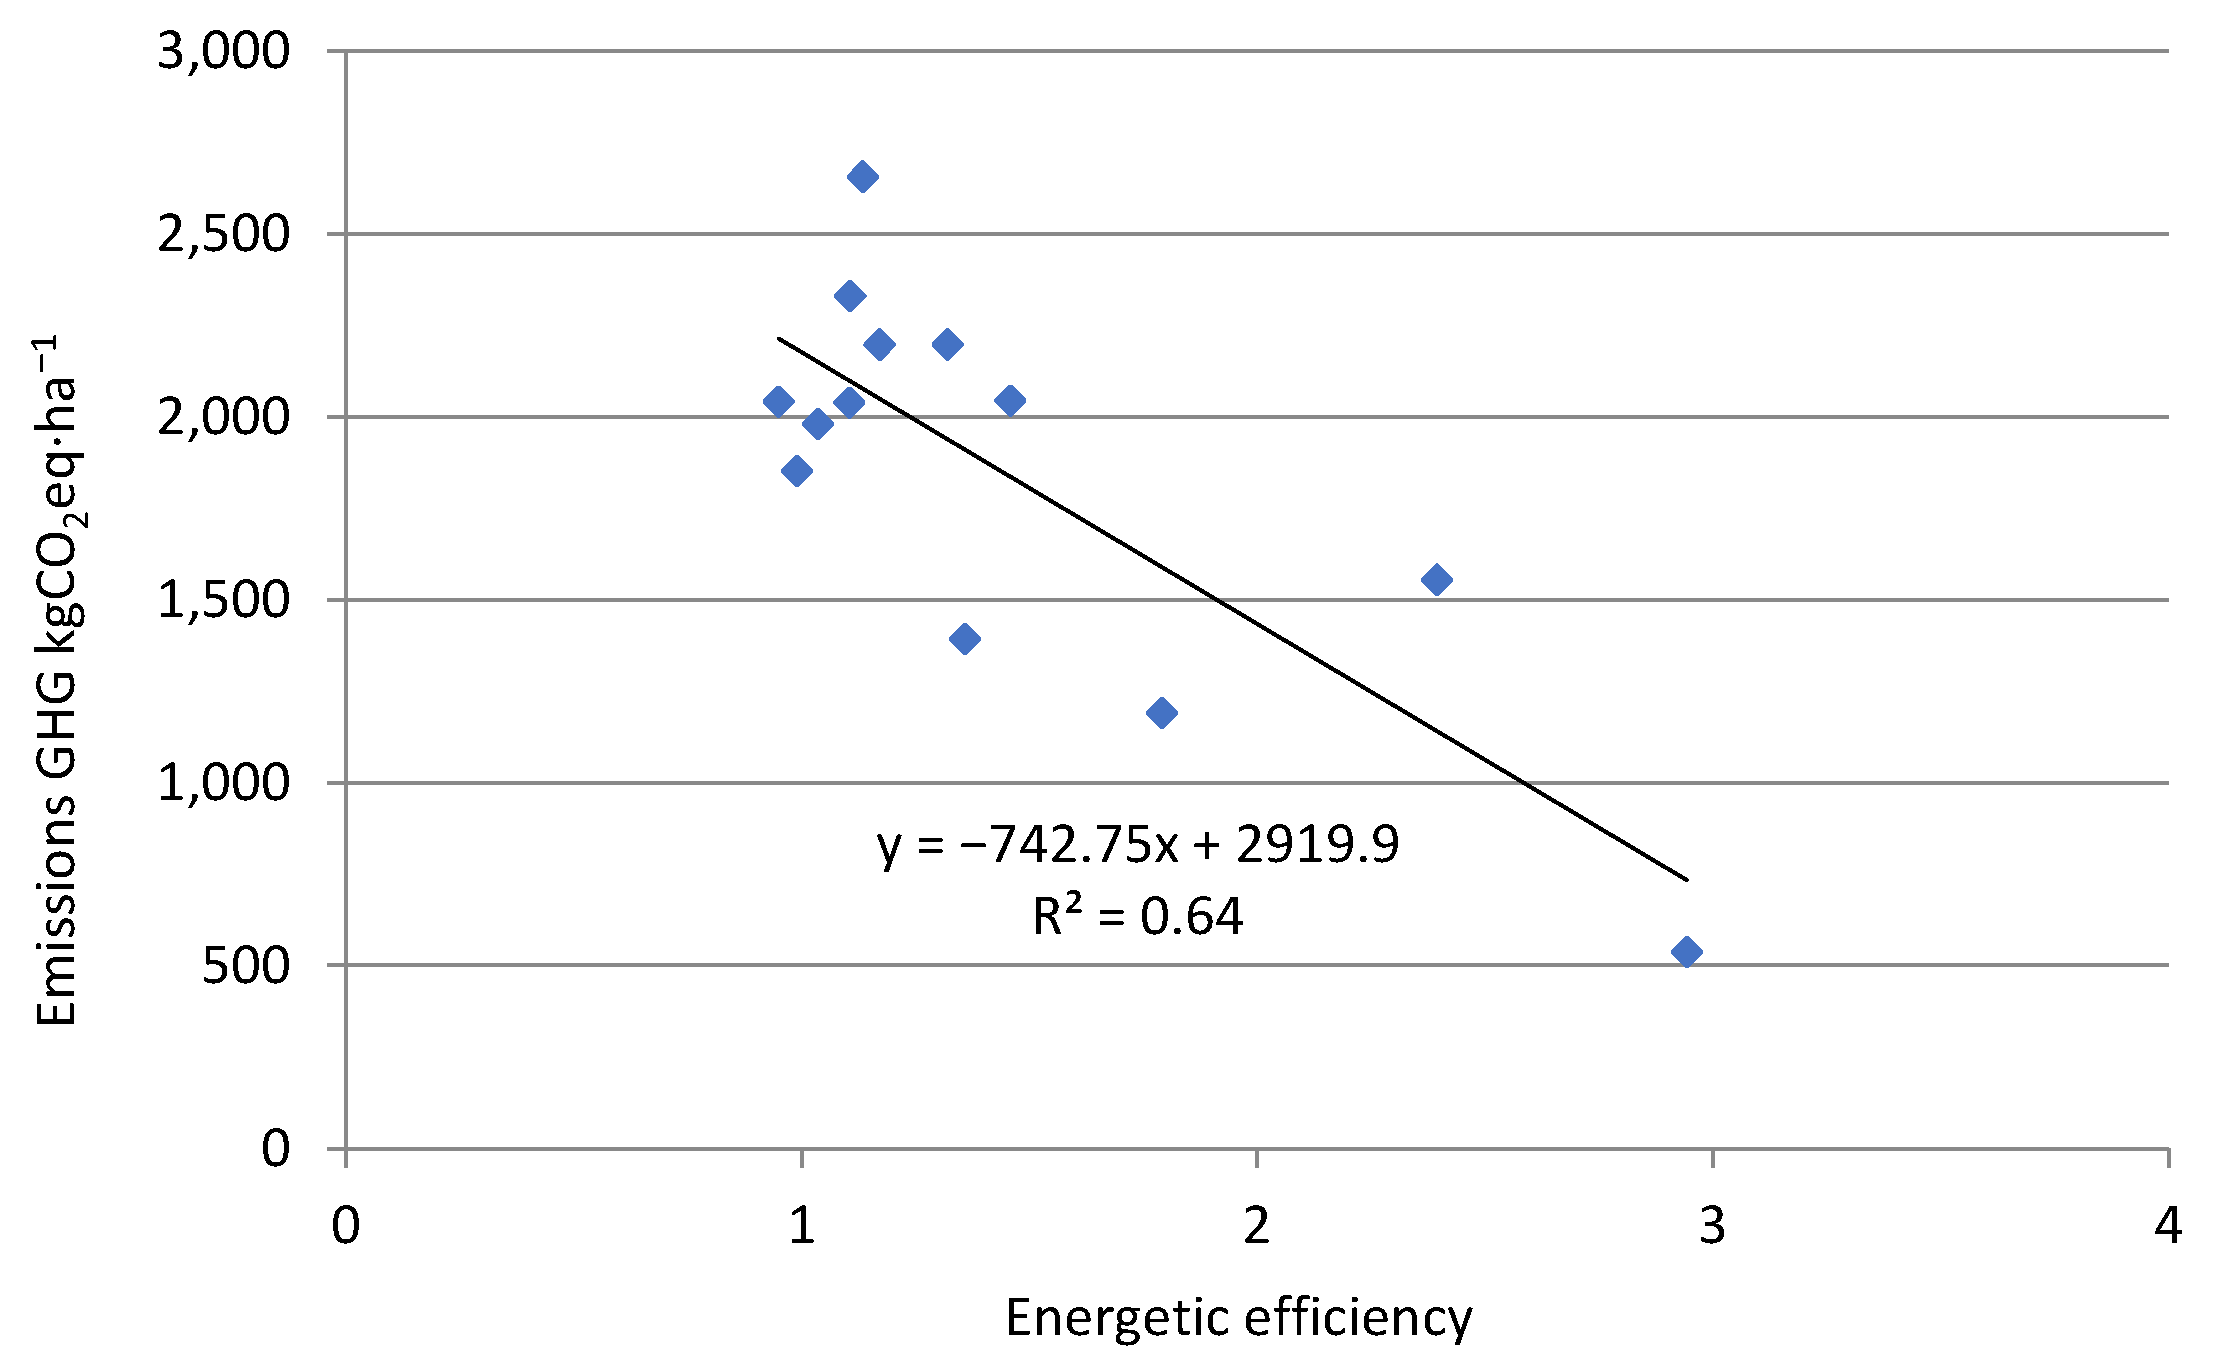
Correlation between Energy Efficiency and the Amount of GHG Emissions across the Silage Maize Cultivation Technologies

Technologies were ranked according to increasing energy efficiency and Figure 4 shows energy efficiency and GHG emissions of the technologies studied.
The energy efficiency values estimated in the early research period for the respective silage maize production technologies [54] were correlated with the results of the GHG emissions for those technologies.
To describe the correlation between the energy efficiency factor value calculated and the GHG emissions expressed in an equivalent unit per hectare of silage maize plantation, the value of Pearson’s correlation coefficient was calculated for those two traits. The calculations were made with the use of Microsoft Office 365 version 1807365 Excel spreadsheets(Figure 5). A negative correlation (r = −0.80) was found; the value ranged from −1 to 1.
This means that the higher the energy efficiency of silage maize plantations, the lower the air pollution emissions in a form of GHGs from the sources considered.

4. Discussion

The estimation methods for GHG (N2O, CO2 and CH4 and NH3) emissions to the atmosphere from the production of silage maize facilitated determining the effect of different variants of cultivation technology on the emissions produced throughout the cultivation period. The most favourable variant due to GHG emissions per area unit (ha) and the unit of the yield (t) was technology MS13. In that technology, the silage maize production chain (from fertilisation and ON burning) per ha resulted in the emissions of 535.677 kg CO2eq, while producing 1 tonne of the yield resulted in the emissions of 11.904 kg CO2eq. The variant with most GHG emissions to the atmosphere per ha was variant MS1—2657.868 kg CO2eq·ha−1, while, due to the unit of the yield (t) it was technology MS3—40.853 kg CO2eq·t−1. Assuming the emissions in technology MS1 as 100%, in technology MS3 the estimate of GHG emissions per hectare was 23% lower, whereas the MS3 yield was 30% lower than the MS1 yield, which affected the result. The GHG emissions from fertilisation resulting from the fertilisation rates applied in MS3 were 1628.744 kg CO2eq·ha−1. They were only 8.6% lower from the amounts in MS1. A lower yield in MS3 (50 t·ha−1) was not proportionally lower than the fertilisation rates changed.
The technology variant with the least unfavourable impact on the environment, due to NH3 emissions to the atmosphere, was technology MS13, with natural fertilisation only. Most ammonia was emitted in technology MS3. Assuming the amount of N supplied with fertilisers to soil as 100%, natural fertilisers accounted for 38.2%, and mineral fertilisers—for 61.8%. The amount of NH3 emissions was affected by a high share of mineral fertilisation and considerable differences in the value of the ammonia emissions factor in the fertilisers applied [45].
In the field silage maize production, the strongest impact on the environment, due to GHG emissions to the atmosphere and thus contributing to global warming, is found for nitrogen fertilisation, both mineral and natural, on average 61% of the total GHG emissions came in the technologies from that source, which is due to a high global warming potential of N2O. In the structure of the share in GHG emissions across the fertilisers, the share is similar; 50.5% natural and 49.5% mineral fertilisers. A considerable share of GHG emissions from mineral nitrogen fertilisation was also found by Jacobs et al. [55]; 41–55% of the total GHG emissions from soil caused by N from mineral fertilisers and post-harvest residue. Similar results were reported by Camargo et al. [56], Meyer-Aurich et al. [57]. With the above in mind, mineral nitrogen fertilisation is considered the most promising N2O emissions reducing practice. In the present research on family farms inconsiderable in acreage, from 2 to 13 ha, the GHG emissions from ON burning accounted for 20.2 to 62.1% of the total emissions from the sources under study, while on high-performance farms they accounted for 10 to 19% of GHG emissions in total [55]. In this paper the post-harvest emissions were disregarded as the study covered silage maize and harvest was performed at the development stage, in terms of moisture and cutting height, optimal for ensilaging processes [58].
The correlation between the estimates of GHG emissions and the energy efficiency factor values calculated for the same technologies showed a negative value (r = −80). The higher the efficiency, the lower the impact of GHG emissions on the environment (atmosphere).
Globally, like other branches of the economy, in agricultural production, together with cost-cutting per ha, one aims at cutting on the energy inputs. Technological solutions are being sought to increase the efficiency and thus to decrease pollution emissions to the atmosphere [55,59]. One of the solutions can be, e.g., changing from traditional farming to simplified farming [60,61,62]. A change in the farming system from traditional, through simplified, all the way to direct sowing, decreases the amount of the fuel consumed due to a complete or partial elimination of some agrotechnical practices which, next to cutting down on energy intensity, affect the emissions and absorption of gases, mostly CO2 and oxygen [63]. Limiting the CO2 emissions from the plantations to the atmosphere is also a result of an increased carbon sequestration due to a change in the farming system introduced [64,65]. The treatment the elimination of which most considerably decreases the energy intensity is ploughing. According to Cudzik et al., plough elimination facilitates up to a 35% reduction in the total fuel consumption. Smagacz reported that shallow plough use consumed about 43% fuel less than deep plough cultivation.
Reducing nitrogen losses and emissions of those pollutions are possible by complying with guidelines of the Code of Good Agricultural Practice [26]. The key recommended methods of reducing GHG emissions to the atmosphere from agricultural sources, plant production, include a modification of the agrotechnical methods, especially a decreased use of nitrogen fertilisers by applying rational rates based on soil richness and nutrient requirements of a given crop species, applying improved nitrogen fertilisation technologies, obeying the fertilisation and plant protection agents dates, a selection of the assortment of fertilisers with lower emissions during production, adjusting the production systems to maximise the use of animal faeces for plant farming, a better post-harvest residue management, following the adequate crop rotation and applying undersown crops, which bind carbon and can limit the nitrogen fertilisation requirements, as well as supporting perennial crops [55,66].
In the literature studies, an important indicator of sustainable agriculture in the case of silage maize concerns energy balance. This can improve the quality and accuracy of biogas industry evaluation from the point of view of the agricultural substrate supply most often using average values of variable inputs in the cultivation of biomass. The notion of life cycle analysis (LCA) is also mainstream in the energy efficiency literature. There are not many, however there are published works on this topic for maize in Europe [67], like alternative tillage practices [68].

5. Conclusions

The results and their analysis have confirmed a negative correlation between the energy efficiency and GHG emissions to the atmosphere from the silage maize plantations.
The results of the comparative analysis of GHG and NH3 emissions for respective silage maize technology variants, considering the production inputs as the sources of emissions: natural and mineral fertilisers as well as the use of fuel consumption per area unit and yielding, are planned to be used at successive stages of research involving a performance of analyses and considerations on the possibilities of cutting down on emissions from respective sources by introducing the agricultural production practices reducing the production of emissions.

Author Contributions

Conceptualization, A.K., K.R., K.B. and E.G.; Methodology, A.K. and K.R.; Software, A.K., K.R. and E.G.; Validation, A.K., K.R. and E.G.; Formal Analysis, A.K. and K.R.; Investigation, A.K.; Data Curation, A.K. and K.R.; Writing-Original Draft Preparation, A.K., K.R., K.B. and E.G.; Writing-Review & Editing, A.K., K.R. and E.G.; visualization, A.K., K.R., K.B. and E.G.; supervision, A.K., K.R. and E.G.; project administration, A.K., K.R. and E.G.; funding acquisition, A.K., K.R. and E.G. All authors have read and agreed to the published version of the manuscript.

Funding

The APC was funded by Institute of Wood Sciences and Furniture, Warsaw University of Life Sciences (WULS).

Institutional Review Board Statement

Not applicable.

Informed Consent Statement

Not applicable.

Data Availability Statement

MDPI Research Data Policies.

Conflicts of Interest

The authors declare no conflict of interest.

References

  1. Ritchie, H.; Roser, M. CO₂ and Greenhouse Gas Emissions. 2020. Available online: https://ourworldindata.org/co2-and-other-greenhouse-gas-emissions (accessed on 26 August 2021).
  2. Rzeźnik, W.; Bartkowiak, A.; Jadczyszyn, T.; Mac, J.; Matros, B.; Matyka, M.; Mielcarek, P.; Stekla, J.; Talarczyk, W.; Zbytek, Z.; et al. Różne Aspekty Wykorzystania Biomasy Pofermentacyjnej; Instytut Technologiczno-Przyrodniczy: Kraków, Poland, 2017; ISBN 978-83-65426-30-7. [Google Scholar]
  3. International Energy Agency. Renewables 2017. Analysis and Forecasts to 2022. Executive Summary. 2017 OECD/IEA 2017. Available online: https://www.iea.org/media/publications/mtrmr/Renewables2017ExecutiveSummary.PDF (accessed on 15 April 2021).
  4. Energy Information Administration. EIA Projects World Energy Consumption Will Increase 56% by 2040. 2015. Available online: https://www.eia.gov/todayinenergy/detail.php?id=12251 (accessed on 22 June 2021).
  5. Prindle, W. National Action Plan for Energy Efficiency 2009. Energy Efficiency as a Low-Cost Resource for Achieving Carbon Emissions Reductions; ICF International Inc.: Fairfax, VA, USA, 2009. [Google Scholar]
  6. Nadel, S.; Ungar, L. Halfway There: Energy Efficiency Can Cut Energy Use; Report U1907; American Council for an Energy-Efficient Economy: Washington, DC, USA, 2019. [Google Scholar]
  7. Eurostat. Statistics Explained. 2020. Available online: https://ec.europa.eu/eurostat/statisticsexplained/ (accessed on 21 May 2021).
  8. Ajanovic, A. Biofuels Versus Food Production: Does Biofuels Production Increase Food Prices? Energy 2011, 36, 2070–2076. [Google Scholar] [CrossRef]
  9. Stolarski, M.; Szczukowski, S.; Tworkowski, J. Efektywność energetyczna produkcji biomasy wierzby w systemie Eko-Salix. Fragm. Agron. 2011, 28, 62–69. [Google Scholar]
  10. Tworkowski, J.; Stolarski, M.J.; Szczukowski, S.; Krzyżaniak, M. Energetyczna efektywność produkcji biomasy wierzby systemem Eko-Salix. Zesz. Probl. Postępów Nauk. Rol. 2015, 582, 91–100. [Google Scholar]
  11. The European Commission. Communication From the Commission to The European Parliament, The Council, The European Economic and Social Committee and The Committee of The Regions. A Roadmap for Moving to a Competitive Low Carbon Economy in 2050 and Greenhouse Gas Emissions in Half by 2050. 2011. Available online: https://www.eea.europa.eu/policy-documents/com-2011-112-a-roadmap (accessed on 26 June 2021).
  12. Agostini, A.; Battini, F.; Giuntoli, J.; Tabaglio, V.; Padella, M.; Baxter, D.; Marelli, L.; Amaducci, S. Environmentally Sustainable Biogas? The Key Role of Manure Co-Digestion with Energy Crops. Energies 2015, 8, 5234–5265. [Google Scholar] [CrossRef]
  13. Agostini, A.; Battini, F.; Padella, M.; Giuntoli, J.; Baxter, D.; Marelli, L.; Amaducci, S. Economics of GHG emissions mitigation via biogas production from Sorghum, maize and dairy farm manure digestion in the Po valley. Biomass Bioenergy 2016, 89, 58–66. [Google Scholar] [CrossRef]
  14. Lovarelli, D.; Falconeb, G.; Orsia, L.; Bacenettia, J. Agricultural small anaerobic digestion plants: Combining economic and environmental assessment. Biomass Bioenergy 2019, 128, 105302. [Google Scholar] [CrossRef]
  15. Holly, M.A.; Larson, R.A.; Powell, J.M.; Ruark, M.D.; Aguirre-Villegas, H. Greenhouse gas and ammonia emissions from digested and separated dairy manure during storage and after land application. Agric. Ecosyst. Environ. 2017, 239, 410–419. [Google Scholar] [CrossRef]
  16. Romaniuk, W.; Mazur, K.; Borek, K.; Borusiewicz, A.; Wardal, W.J.; Tabor, S.; Kuboń, M. Biomass Energy Technologies from Innovative Dairy Farming Systems. Processes 2021, 9, 335. [Google Scholar] [CrossRef]
  17. European Parliament. Directive 2009/28/EC of 23.04.2009 on the Promotion of the Use of Energy from Renewable Sources, Dyrektywa Parlamentu Europejskiego i Rady 2009/28/WE z dnia 23 kwietnia 2009 r. w Sprawie Promowania Stosowania Energii ze Źródeł Odnawialnych Zmieniająca i w Następstwie Uchylająca Dyrektywy 2001/77/WE oraz 2003/30/WE; European Parliament: Brussels, Belgium, 2009. Available online: https://eur-lex.europa.eu/legal-content/PL/ALL/?uri=CELEX%3A32009L0028 (accessed on 26 June 2021).
  18. Adams, P.W.R.; McManus, M.C. Characterisation and variability of greenhouse gas emissions from biomethane production via anaerobic digestion of maize. J. Clean. Prod. 2019, 218, 529–542. [Google Scholar] [CrossRef]
  19. Borek, K.; Romaniuk, W.; Roman, K.; Roman, M.; Kuboń, M. The Analysis of a Prototype Installation for Biogas Production from Chosen Agricultural Substrates. Energies 2021, 14, 2132. [Google Scholar] [CrossRef]
  20. Roman, K.; Barwicki, J.; Hryniewicz, M.; Szadkowska, D.; Szadkowski, J. Production of Electricity and Heat from Biomass Wastes Using a Converted Aircraft Turbine AI-20. Processes 2021, 9, 364. [Google Scholar] [CrossRef]
  21. Intergovernmental Panel on Climate Change. Guidelines for National Greenhouse Gas Inventories. 2006. Available online: www.ipcc-nggip.iges.or.jp/public/2006gl/vol4.htm (accessed on 23 May 2021).
  22. Miatkowski, Z.; Turbiak, J.; Burczyk, P.; Myczko, A.; Karłowski, J. Prognozy Zmian Aktywności w Sektorze Rolnictwa Zawierające Informacje Niezbędne do Wyliczenia Szacunkowej Wielkości Emisji Gazów Cieplarnianych; Raport ITP; Instytut Technologiczno-Przyrodniczy: Bydgoszcz, Poland, 2010. [Google Scholar]
  23. Nyćkowiak, J.; Leśny, J.; Olejnik, J. Ocena bezpośredniej emisji N2O z gleb użytkowanych rolniczo województwa wielkopolskiego w latach 1960–2009 według metodologii IPCC. Woda Sr. Obsz. Wiej. 2012, 4, 203–215. [Google Scholar]
  24. Internetowy System Aktów Prawnych; Journal of Law. Ustawa z dn. 17 lipca 2009 r. o Systemie Zarządzania Emisjami Gazów Cieplarnianych i Innych Substancji; No 130, item 1070 with Further Amendments, Dz. U. 2009, nr 130, poz. 1070; Internetowy System Aktów Prawnych: Warszawa, Poland, 2009. [Google Scholar]
  25. Krajowy Ośrodek Bilansowania i Zarządzania Emisjami. Poland’s National Inventory Report 2018. Greenhouse Gas Inventory for 1988–2016. Instytut Ochrony Środowiska—Państwowy Instytut Badawczy, Krajowy Ośrodek Bilansowania i Zarządzania Emisjami: Warszawa, Poland, 2018. [Google Scholar]
  26. Snyder, C.S.; Bruulsema, T.W.; Jensen, T.L.; Fixen, P.E. Review of greenhouse gas emissions from crop production systems and fertilizer management effects. Agric. Ecosyst. Environ. 2009, 133, 247–266. [Google Scholar] [CrossRef]
  27. Abalos, D.; Jefrey, S.; Drury, C.F.; Wagner-Riddle, C. Improving fertilizer management in the U.S. and Canada for N2O mitigation: Understanding potential positive and negative side-effects on corn yields. Agric. Ecosyst. Environ. 2016, 221, 214–221. [Google Scholar] [CrossRef]
  28. Drury, C.F.; Yang, X.; Dan Reynolds, W.; Calder, W.; Oloya, T.O.; Woodley, A.L. Combining Urease and Nitrification Inhibitors with Incorporation Reduces Ammonia and Nitrous Oxide Emissions and Increases Corn Yields. J. Environ. Quality 2017, 46, 939–949. [Google Scholar] [CrossRef] [PubMed]
  29. Zalega, K. Znaczenie biopaliw i systemu ich certyfikacji–polityka energetyczna i klimatyczna Unii Europejskiej. Kontrola Państwowa 2017, 1, 40. [Google Scholar]
  30. European Parliament. Directive 98/70/WE, Dyrektywa Parlamentu Europejskiego i Rady 2009/30/WE z dnia 23 kwietnia 2009 r. Zmieniająca Dyrektywę 98/70/WE Odnoszącą się do Specyfikacji Benzyny i Olejów Napędowych oraz Wprowadzającą Mechanizm Monitorowania i Ograniczania Emisji Gazów Cieplarnianych oraz Zmieniającą Dyrektywę Rady 1999/32/WE; European Parliament: Brussels, Belgium, 2009.
  31. Podkówka, Z.; Podkówka, L. Use of Polish-bread maize hybrid for biogas production. J. Cent. Eur. Agric. 2015, 16, 463–475. [Google Scholar]
  32. Garcia, A. Corn Silage Production and Utilization. In iGROW Corn: Best Management Practices; Clay, D.E., Clay, S.A., Byamukama, E., Eds.; South Dakota State University: Brookings, SD, USA, 2016. [Google Scholar]
  33. Główny Urząd Statystyczny. Production of Agricultural and Horticultural Crops in 2019; Główny Urząd Statystyczny: Warsaw, Poland, 2020.
  34. Jaworski, A. Mechanizacja Uprawy Kukurydzy Paszowej; Małopolski Ośrodek Doradztwa Rolniczego w Karniowicach: Karniowice, Poland, 2012; ISBN 83-60394-03-2. [Google Scholar]
  35. Forte, A.; Fagnano, M.; Fierro, A. Potential role of compost and green manure amendment to mitigate soil GHGs emissions in Mediterranean drip irrigated maize production systems. J. Environ. Manag. 2017, 192, 68–78. [Google Scholar] [CrossRef] [PubMed] [Green Version]
  36. Czapiewska, G. Consequences of climate change for farming and rural areas. Studia Quat. 2020, 37, 51–56. [Google Scholar]
  37. Rokochinskiy, A.; Frolenkova, N.; Turcheniuk, V.; Volk, P.; Prykhodko, N.; Tykhenko, R.; Openko, I. The variability of natural and climatic conditions in investment projects in the field of nature management. J. Water Land Dev. 2021, 48, 48–54. [Google Scholar] [CrossRef]
  38. Michalski, T. Produkcja Wybranych Rolniczych Surowców Energetycznych. Odnawialne Źródła Energii. Rolnicze Surowce Energetyczne; Kołodziej, B., Matyki, M., Eds.; PWRiL Sp. z o.o.: Poznań, Poland, 2012; ISBN 978-83-09-01139-2. [Google Scholar]
  39. Knox, J.; Daccache, A.; Hess, T.; Haro, D. Meta-analysis of climate impacts and uncertainty on crop yields in Europe. Environ. Res. Lett. 2016, 11, 113004. [Google Scholar] [CrossRef]
  40. Faber, A.; Jarosz, Z.; Król, A. The Impact of Climate Change on the Efficiency of Nitrogen Use and its Losses. Probl. Rol. Swiat. 2019, 19, 37–46. [Google Scholar]
  41. EU Nitrogen Expert Panel. Nitrogen Use Efficiency (NUE)—An Indicator for the Utilization of Nitrogen in Agriculture and Food Systems; Wageningen University: Wageningen, The Netherlands, 2015. [Google Scholar]
  42. Oppeltová, P.; Boráková, J. Monitoring of basic physicochemical parameters in the flow and their possible influence on the quality of the small water source. J. Water Land Dev. 2020, 44, 106–117. [Google Scholar] [CrossRef]
  43. Krajowy Ośrodek Bilansowania i Zarządzania Emisjami. Krajowy Raport Inwentaryzacyjny 2018; Instytut Ochrony Środowiska—Państwowy Instytut Badawczy. Krajowy Ośrodek Bilansowania i Zarządzania Emisjami: Warszawa, Poland, 2018. [Google Scholar]
  44. Krajowy Ośrodek Bilansowania i Zarządzania Emisjami. Poland’s National Inventory Report 2017. Greenhouse Gas Inventory for 1988–2015; Instytut Ochrony Środowiska—Państwowy Instytut Badawczy. Krajowy Ośrodek Bilansowania i Zarządzania Emisjami: Warszawa, Poland, 2017. [Google Scholar]
  45. EMEP/EEA. 3.D Crop Production and Agricultural Soils; tab. 3.2, tab. 3.9; European Environment Agency: Copenhagen, Denmark, 2016.
  46. Muzalewski, A. Wskaźniki Eksploatacyjno-Ekonomiczne Maszyn i Ciągników Rolniczych w Poradnik PROW. Przepisy Ochrony Środowiska, Normatywy i Wskaźniki Funkcjonujące w Produkcji Rolniczej, 1st ed.; Pruszka, P., Ed.; Centrum Doradztwa Rolniczego w Brwinowie: Kraków, Poland, 2016; ISBN 83-88082-81-7. [Google Scholar]
  47. Felten, D.; Fröba, N.; Fries, J.; Emmerling, C. Energy balances and greenhouse gasmitigation potentials of bioenergy cropping systems (Miscanthus, rapeseed and maize) based on farming conditions in Western Germany. Renew. Energy 2013, 55, 160–174. [Google Scholar] [CrossRef]
  48. Radzimirski, S.; Taubert, S. Inwentaryzacja Emisji Wybranych Zanieczyszczeń Sektora Transportu Drogowego w 2008 r; Instytut Transportu Samochodowego, Centrum Ochrony Środowiska: Warszawa, Poland, 2009; Volume 7904. [Google Scholar]
  49. Internetowy System Aktów Prawnych. Dz. U. 2018 r. Poz. 2527; Rozporządzenie Ministra Środowiska w Sprawie Wykazów Zawierających Informacje i Dane o Zakresie Korzystania ze Środowiska oraz o Wysokości Należnych Opłat; Internetowy System Aktów Prawnych: Warszawa, Poland, 2018.
  50. Intergovernmental Panel on Climate Change. Climate Change 2007: The Physical Science Basis; Contribution of Working Group I to the Fourth Assessment Report of the Intergovernmental Panel on Climate Change; Solomon, S., Qin, D., Manning, M., Chen, Z., Marquis, M., Averyt, K.B., Tignor, M., Miller, H.L., Eds.; Cambridge University Press: Cambridge, UK; New York, NY, USA, 2007; ISBN 978-0-521-70596-7. [Google Scholar]
  51. Internetowy System Aktów Prawnych. Dz. U. 2018. Poz. 1339, Rozporządzenie Rady Ministrów z dnia 5 czerwca 2018 r. w Sprawie Przyjęcia „Programu Działań Mających na Celu Zmniejszenie Zanieczyszczenia Wód Azotanami Pochodzącymi ze Źródeł Rolniczych oraz Zapobieganie Dalszemu Zanieczyszczeniu”; Internetowy System Aktów Prawnych: Warszawa, Poland, 2018.
  52. Pawlak, J. Szacunkowe Zużycie Oleju Napędowego w Rolnictwie w Latach 2010–2015 w Układzie Wojewódzkim. Probl. Inż. Rol. 2017, 2, 55–65. [Google Scholar]
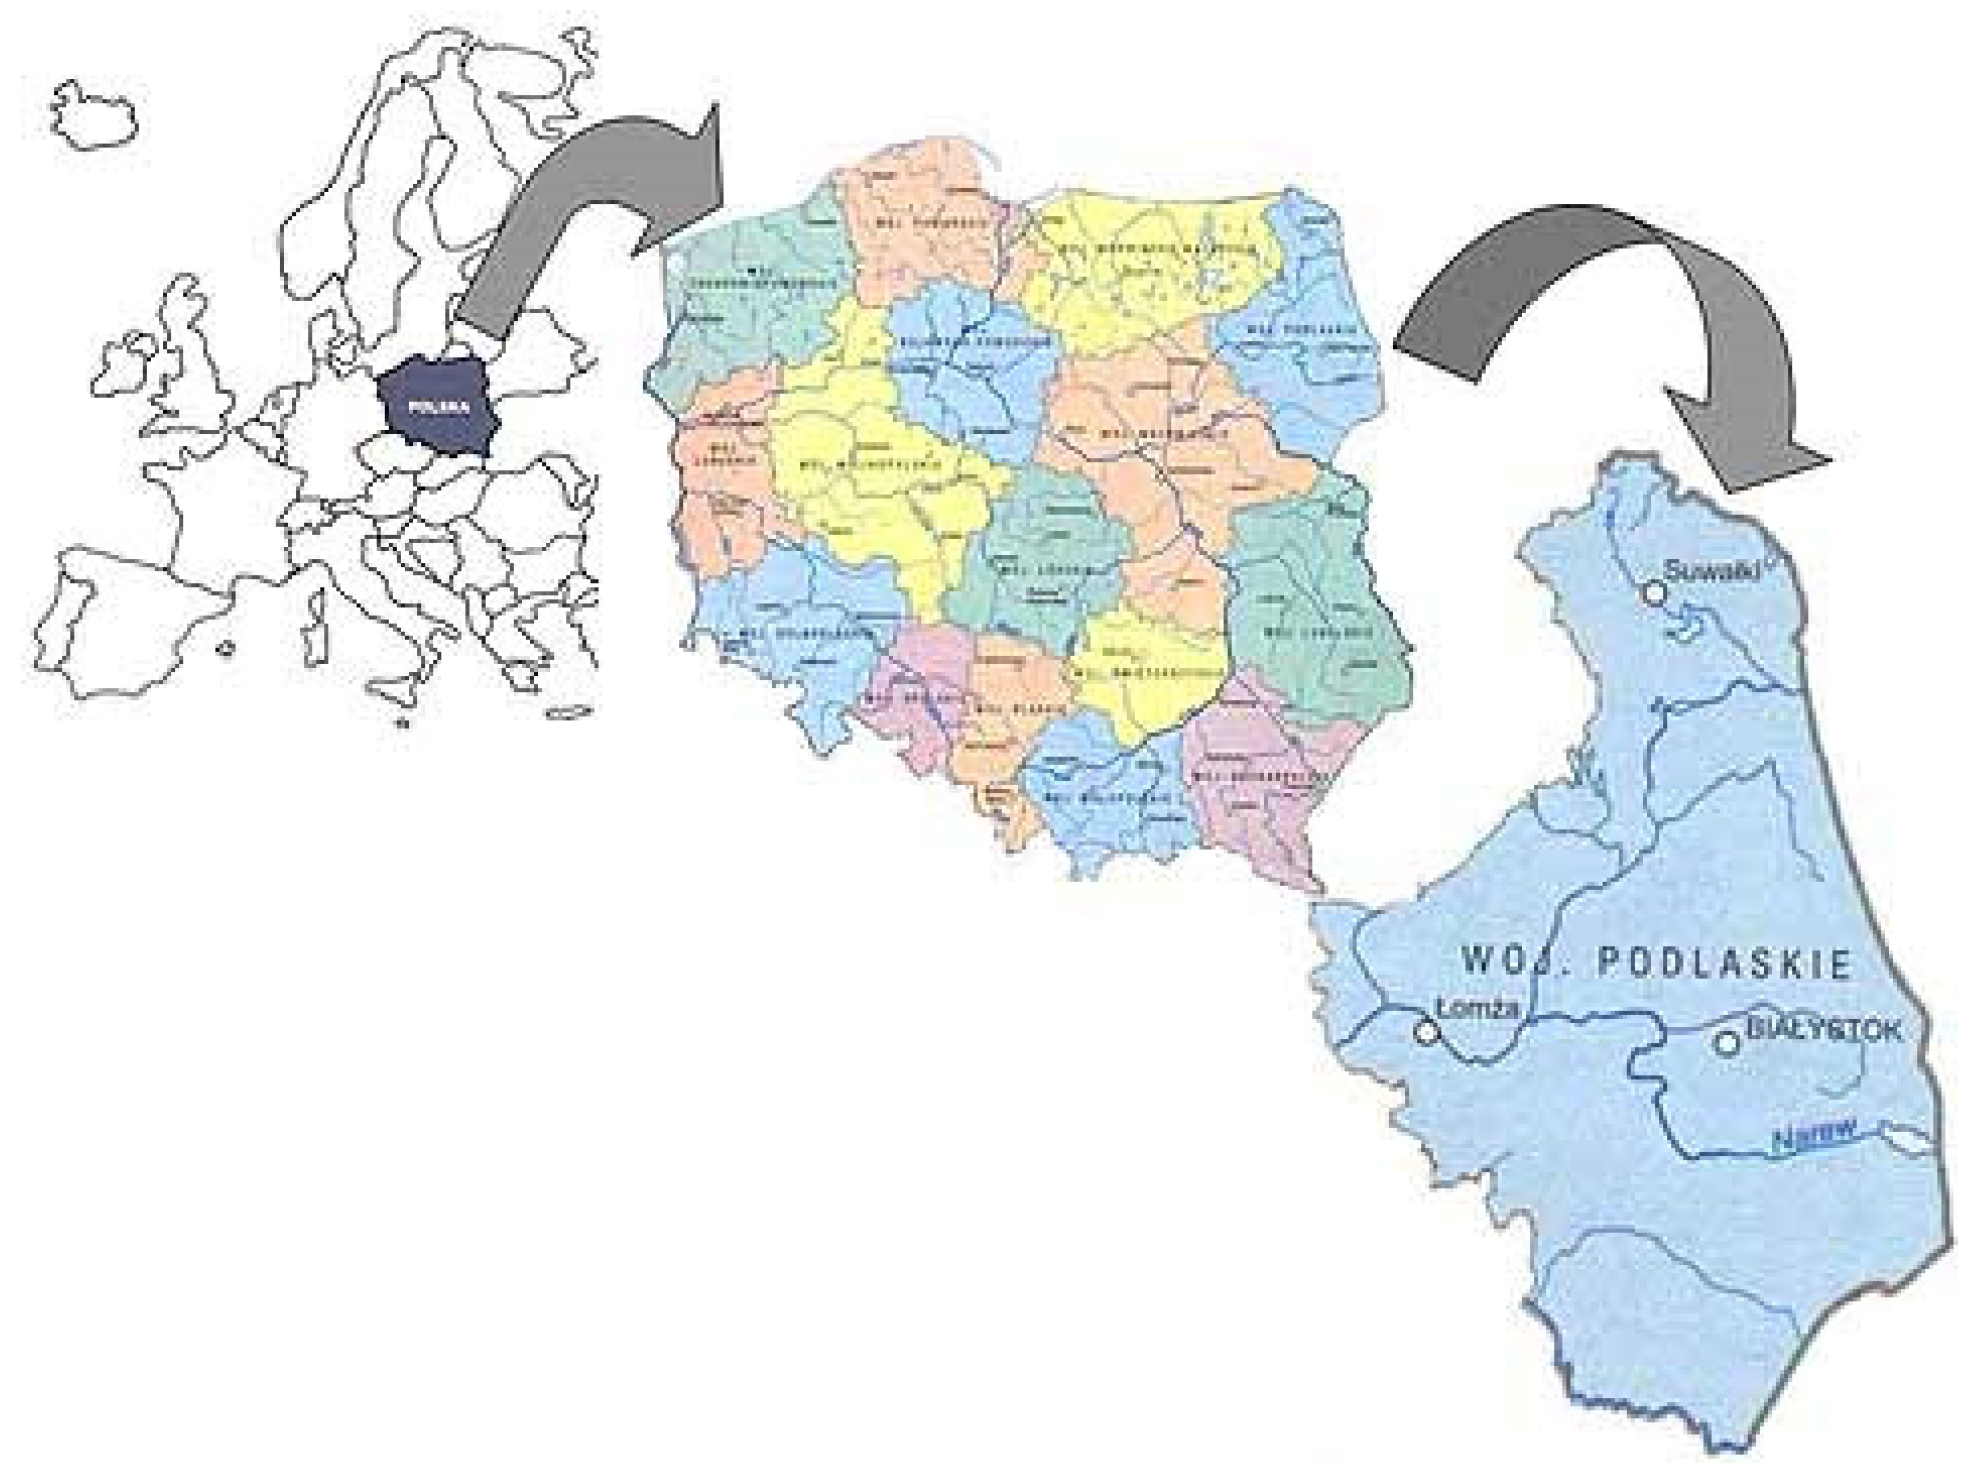
  53. Wrota Podlasia. Region Description. Available online: https://www.wrotapodlasia.pl/en/gospodarka/coi/Region_Description.html (accessed on 26 August 2021).
  54. Konieczna, A.; Roman, K.; Roman, M.; Śliwiński, D.; Roman, M. Energy Efficiency of Maize Production Technology: Evidence from Polish Farms. Energies 2021, 14, 170. [Google Scholar] [CrossRef]
  55. Jacobs, A.; Auburger, S.; Bahrs, E.; Brauer-Siebrecht, W.; Christen, O.; Götze, P.; Koch, H.J.; Rücknagel, J.; Märländer, B. Greenhouse gas emission of biogas production out of silage maize and sugar beet—An assessment along the entire production chain. Appl. Energy 2017, 190, 114–121. [Google Scholar] [CrossRef]
  56. Camargo, G.T.G.; Ryan, M.R.; Richard, T.L. Energy use and greenhouse gas emissions from crop production using the farm energy analysis tool. Bioscience 2013, 63, 263–273. [Google Scholar] [CrossRef] [Green Version]
  57. Meyer-Aurich, A.; Schattauer, A.; Hellebrand, H.J.; Klauss, H.; Plöchl, M.; Berg, W. Impact of uncertainties on greenhouse gas mitigation potential of biogas production from agricultural resources. Renew. Energy 2012, 37, 277–284. [Google Scholar] [CrossRef]
  58. Podkówka, W.; Podkówka, Z. Technologia Kiszenia Biomasy na Cele Paszowe i Biogaz Rolniczy; PWRiL: Warszawa, Poland, 2017; ISBN 978-83-09-01102-6. [Google Scholar]
  59. Taleghani, A.; Almassi, M.; Ghahderijani, M. Environmental evaluation and optimization of energy use and greenhouse gases mitigation for farm production systems in Mashhad, Iran. Environ. Sci. Pollut. Res. 2020, 27, 35272–35283. [Google Scholar] [CrossRef] [PubMed]
  60. Gorzelany, J.; Puchalski, C.; Malach, M. Ocena kosztów i nakładów energetycznych w produkcji kukurydzy na ziarno i kiszonkę. Inżynieria Rol. 2020, 8, 135–141. [Google Scholar]
  61. Jarosz, Z.; Księżak, J.; Faber, A. Assessment of greenhouse gas emissions in systems used in croping maize for bioethanol production. Rocz. Nauk. Stowarzyszenia Ekon. Rol. Agrobiz. 2017, 19, 60–65. [Google Scholar] [CrossRef]
  62. Miheev, V.V.; Ponomarev, A.G.; Eremin, P.A.; Mikheev, V.S. The Methodology of Modeling and Optimization of Technologies in Crop Production. Agric. Mech. Asia Afr. Lat. Am. 2020, 51, 52–57. [Google Scholar]
  63. Stošić, M.; Ivezić, V.; Tadić, V. Tillage systems as a function of greenhouse gas (GHG) emission and fuel consumption mitigation. Environ. Sci. Pollut. Res. 2021, 28, 16492–16503. [Google Scholar] [CrossRef] [PubMed]
  64. Freibauer, A.; Rounsevellb, M.D.A.; Smithc, P.; Verhagen, J. Carbon sequestration in the agricultural soils of Europe. Geoderma 2004, 122, 1–23. [Google Scholar] [CrossRef]
  65. Jia, Q.; Zhang, H.; Wang, J.; Xiao, X.; Chang, S.; Zhang, C.; Liu, Y.; Hou, F. Planting practices and mulching materials improve maize net ecosystem C budget, global warming potential and production in semi-arid regions. Soil Tillage Res. 2021, 207, 104850. [Google Scholar] [CrossRef]
  66. Narodowy Program Rozwoju Gospodarki Niskoemisyjnej; Ministerstwo Gospodarki: Warszawa, Poland, 2015.
  67. Król-Badziak, A.; Pishgar-Komleh, S.H.; Rozakis, S.; Księżak, J. Environmental and socio-economic performance of different tillage systems in maize grain production: Application of Life Cycle Assessment and Multi-Criteria Decision Making. J. Clean. Prod. 2021, 278, 123792. [Google Scholar] [CrossRef]
  68. Krasuska, E.; Faber, A.; Pudełko, R.; Jarosz, Z.; Borzecka-Walker, M.; Kozyra, J.; Syp, A. Emission saving opportunities for corn cultivation for ethanol in Poland. J. Food Agric. Environ. 2013, 11, 2050–2053. [Google Scholar]
Figure 1. Contribution of agriculture to total GHG emissions (%), EU-28, 2015 [7].
Energies 14 05574 g001
Figure 2. The course of reducing greenhouse gas emissions in the EU by 2050 (1990 = 100%) [11].
Energies 14 05574 g002
Figure 3. Podlaskie voivodship [53].
Energies 14 05574 g003
Figure 4. Energy efficiency and GHG emissions in silage maize production technologies.
Energies 14 05574 g004
Figure 5. Relationship between the energy efficiency and GHG emissions in silage maize production technologies.
Energies 14 05574 g005
Table 1. Sources of emissions and types of pollutants emitted to the atmosphere.
Source of the EmissionType of Contamination
Greenhouse Gases GHGNH3
N2OCO2CH4
Natural fertilizers+ +
Inorganic fertilizers, including urea++ +
Fuel consumption+++
Table 2. Global warming potential 1.
Counter for CO2 Equivalent
CO21
N2O298
CH425
1 IPCC 2007 [50].
Table 3. N content and emissions factor for NH3 for selected inorganic fertilisers 1.
Type/Name of the FertilizerN Content [%]The Emission Factor EF
N2O-NCO2-CNH3 [g NH3·kg N−1]
Ammonium sulphate340.01 16
Ammonium phosphate180.01 51
Ammonium sulfate210.01 92
Calcium nitrate150.01 8
Urea460.010.2159
Compound fertilizers (NPK) 0.01 67
1 Own study based on EMEP/EEA 2016, 3.D Crop production and agricultural soils [45]; Intergovernmental Panel on Climate Change 2006 [21], data of fertilizer manufacturers.
Table 4. N content in respective kinds of natural fertilisers 1.
Type/Name of the FertilizerN Content [%]The Emission Factor EF [g NH3·kg N−1]
Cattle manure0.3180.2500
Manure–pigs0.3520.7000
Cattle slurry0.3830.1892
Slurry–pigs0.3730.5355
1 Own study based on Journal of Laws, Journal Of Laws, item 1339 of 12 July 2018 [51].
Table 5. Selected technology-specific elements.
Technology No.Cultivation Area [ha]Distance from the Farm [km]Yield
[t∙ha−1]
N Content [%]The Amount of N from Fertilizers [kg∙ha−1]
NaturalMineralTotal
MS13.40,872323.5207.6173.0380.6
MS220.0560184.5174.0131.4305.4
MS3131.550152.9112.0181.0293.0
MS45.070.555147.5132.579.5212.1
MS53.250.665255.094.6114.6209.2
MS64.5180116.276.0148.4224.4
MS722.550120.00138.0138.0
MS83.52.570414.9156.875.6232.4
MS9102.267388.5140.078.2218.2
MS1051.675425.6122.575.4197.9
MS1182.275369.0122.575.4197.9
MS125150379.4122.981.0203.9
MS133.211.545128.939.9039.9
Table 6. GHG and NH3 emissions for the technologies under study per area unit (ha).
Technology No.Emissions
GHG [kg CO2eq·ha−1]NH3 [kg NH3·ha−1]
FertilizersON
Combustion
TotalThe Amount of N from Fertilizers [kg∙ha−1]
NaturalMineralTotalNaturalMineralTotal
MS1972.106810.1341782.240875.6272657.8680.0593856.5713856.630
MS2814.817725.3271540.145499.4122039.5570.04815,741.87915,741.926
MS3524.4801104.2641628.744413.9302042.6740.03432,711.64332,711.677
MS4620.686372.412993.098399.3531392.4510.0406470.0596470.099
MS5442.782719.6411162.423690.2451852.6670.02522,134.89722,134.921
MS6355.897885.6031241.500314.5951556.0950.04925,434.42925,434.478
MS70866.234866.234324.8211191.055026,643.85726,643.857
MS8734.272474.3661208.6381122.9522331.5910.12314,590.68414,590.807
MS9655.600490.8661146.4661051.5182197.9850.11915,098.18615,098.305
MS10573.650473.5411047.1911152.0322199.2230.10414,565.30914,565.413
MS11573.650473.5411047.191998.8242046.0160.10414,565.30914,565.413
MS12575.322379.311954.6341026.8981981.5320.0336589.9296589.962
MS13186.7310186.731348.946535.6770.01200.012
Min00186.731314.595535.677000.012
Max972.1061104.2641 82.2401152.0322657.8680.12332,711.64332,711.677
Mean540.769598.0961138.864709.1661848.0300.05815,261.75015,261.808
Standard deviation555.344572.8511128.196372.4201500.6150.0332727.0082727.041
Table 7. Percentage share of GHG and NH3 emissions from the sources studied in the total emissions.
Technology No.Emissions [%]
GHGNH3
FertilizersFertilizersON
Combustion
TotalFertilizers
NaturalMineralTotalNaturalMineralTotal
MS154.545.510067.132.91000.00299.998100
MS252.947.110075.524.51000100100
MS332.267.810079.720.31000100100
MS462.537.510071.328.71000.00199.999100
MS538.161.910062.737.31000100100
MS628.771.310079.820.21000100100
MS7010010072.727.31000100100
MS860.839.210051.848.21000.00199.999100
MS957.242.810052.247.81000.00199.999100
MS1054.845.210047.652.41000.00199.999100
MS1154.845.210051.248.81000.00199.999100
MS1260.339.710048.251.81000.00199.999100
MS13100010034.965.11001000100
Min00 34.920.2 00
Max100100 79.865.1 100100
Mean50.549.5 61.138.9 7.69392.307
Table 8. GHG and NH3 emissions for respective technologies per yield unit (t).
Technology No.Emissions
GHG [kg CO2eq·t−1 of Yield]NH3 [kg NH3·t−1 of Yield]
FertilizersON
Combustion
TotalFertilizers
NaturalMineralTotalNaturalMineralTotal
MS113.54711.28924.83612.20237.0380.00153.74353.743
MS213.58012.08925.6698.32433.9930.001262.365262.365
MS310.49022.08532.5758.27940.8530.001654.233654.234
MS411.2856.77118.0567.26125.3170.001117.637117.638
MS56.85211.13717.98910.68228.6700342.539342.540
MS64.44911.07015.5193.93219.4510.001317.930317.931
MS7017.32517.3256.49623.8210532.877532.877
MS810.4906.77717.26616.04233.3080.002208.438208.440
MS99.7857.32617.11115.69432.8060.002225.346225.348
MS107.6496.31413.96315.36029.3230.001194.204194.206
MS117.6496.31413.96313.31827.2800.001194.204194.206
MS1211.5067.58619.09320.53839.6310.001131.799131.799
MS134.15004.1507.75411.904000
Min004.1503.93211.904000
Max13.58022.08532.57520.53840.8530.002654.233654.234
Mean8.5729.69918.27011.22229.4920.001248.870248.871
Standard deviation6.6457.98314.6283.14517.7730.00038.00238.002
Publisher’s Note: MDPI stays neutral with regard to jurisdictional claims in published maps and institutional affiliations.

