Article

Determining Information Quality in ICT Systems

1
Faculty of Transport, Warsaw University of Technology, 75 Koszykowa St., 00-662 Warsaw, Poland
2
Department of Energy, Faculty of Mechanical Engineering, Technical University of Koszalin, 15-17 Raclawicka St., 75-620 Koszalin, Poland
3
Faculty of Electronic, Military University of Technology of Warsaw, 2 Urbanowicza St., 00-908 Warsaw, Poland
*
Author to whom correspondence should be addressed.
Energies 2021, 14(17), 5549; https://doi.org/10.3390/en14175549
Submission received: 10 July 2021 / Revised: 28 August 2021 / Accepted: 1 September 2021 / Published: 5 September 2021

Abstract

:
The article deals with the estimation of information quality (IQ) in information and communication technologies (ICT) systems. A number of recent publications were analyzed, as well as ISO standards concerning quality and information quality. Due to the limitations of the known methods of estimating IQ, the authors present their own proprietary concept based on multidimensional and multi-layer modeling using methods of estimating uncertainty. The modeling proposed in this publication uses sixteen dimensions of quality known from the literature. The features of dimensions are taken into account as another layer and information states as successive steps in the IQ model. An example of calculations is also presented in which the mathematical evidence method used in estimating the uncertainty is extended to the modeling of dependent elements. The article also presents a simulation based on the presented example. This simulation shows the assumed dependencies between the output and input values.

1. Introduction

Nowadays, assessing information quality (IQ) seems to be the first step in assessing a technical system. This is especially the case when it comes to ICT systems in areas such as transport, healthcare, or other emergency services, where the safety of people or transported people and loads frequently depends on the quality of the information provided. Assessing IQ seems to be the first step in assessing the energy supply of ICT systems too. IQ has been studied by many institutions worldwide. One of them launched the Massachusetts Institute of Technology Information Quality (MITIQ) program—an IQ research program carried out after 2000 at MIT [1]. In publications such as [2], the components of IQ dimensions called features are mentioned many times, but hardly any indication is made regarding how to determine these dimensions and features. Additionally, in the ISO 8000 standards [3] there is no reference to the IQ stored dimensions and how to define them. The authors of this article propose a method for determining IQ based on a multidimensional model based on uncertainty modeling. The model takes into account not only the features and dimensions of quality but also information states, due to which the model enables a comprehensive description of the entire ICT system.

2. State of the Art

According to the definition given in [3,4], information is knowledge about objects, such as facts, events, things, processes, or ideas, including concepts that have special meaning in a specific context, and knowledge that reduces or removes the uncertainty about the occurrence of a specific event from a given set of possible events. In turn, data stand for a reinterpretable representation of information that is formalized in a manner suitable for communication, interpretation, or processing. This suggests that data are items of information without a dimension attribute. For example, the detector transmits data about a measured physical quantity with a specific value, but only the attribute of the measurement unit transforms the data into information.
IQ can be called a coefficient (or set of coefficients) which indicates the value of IQ. The definition in the ISO standard includes three components [3]:
  • Syntactic IQ is the degree to which the data conform to a specific syntax;
  • Semantic is the unique and unambiguous conformance between identifiable data units and the entities represented;
  • Pragmatic quality is conformance with the requirements concerning the use.
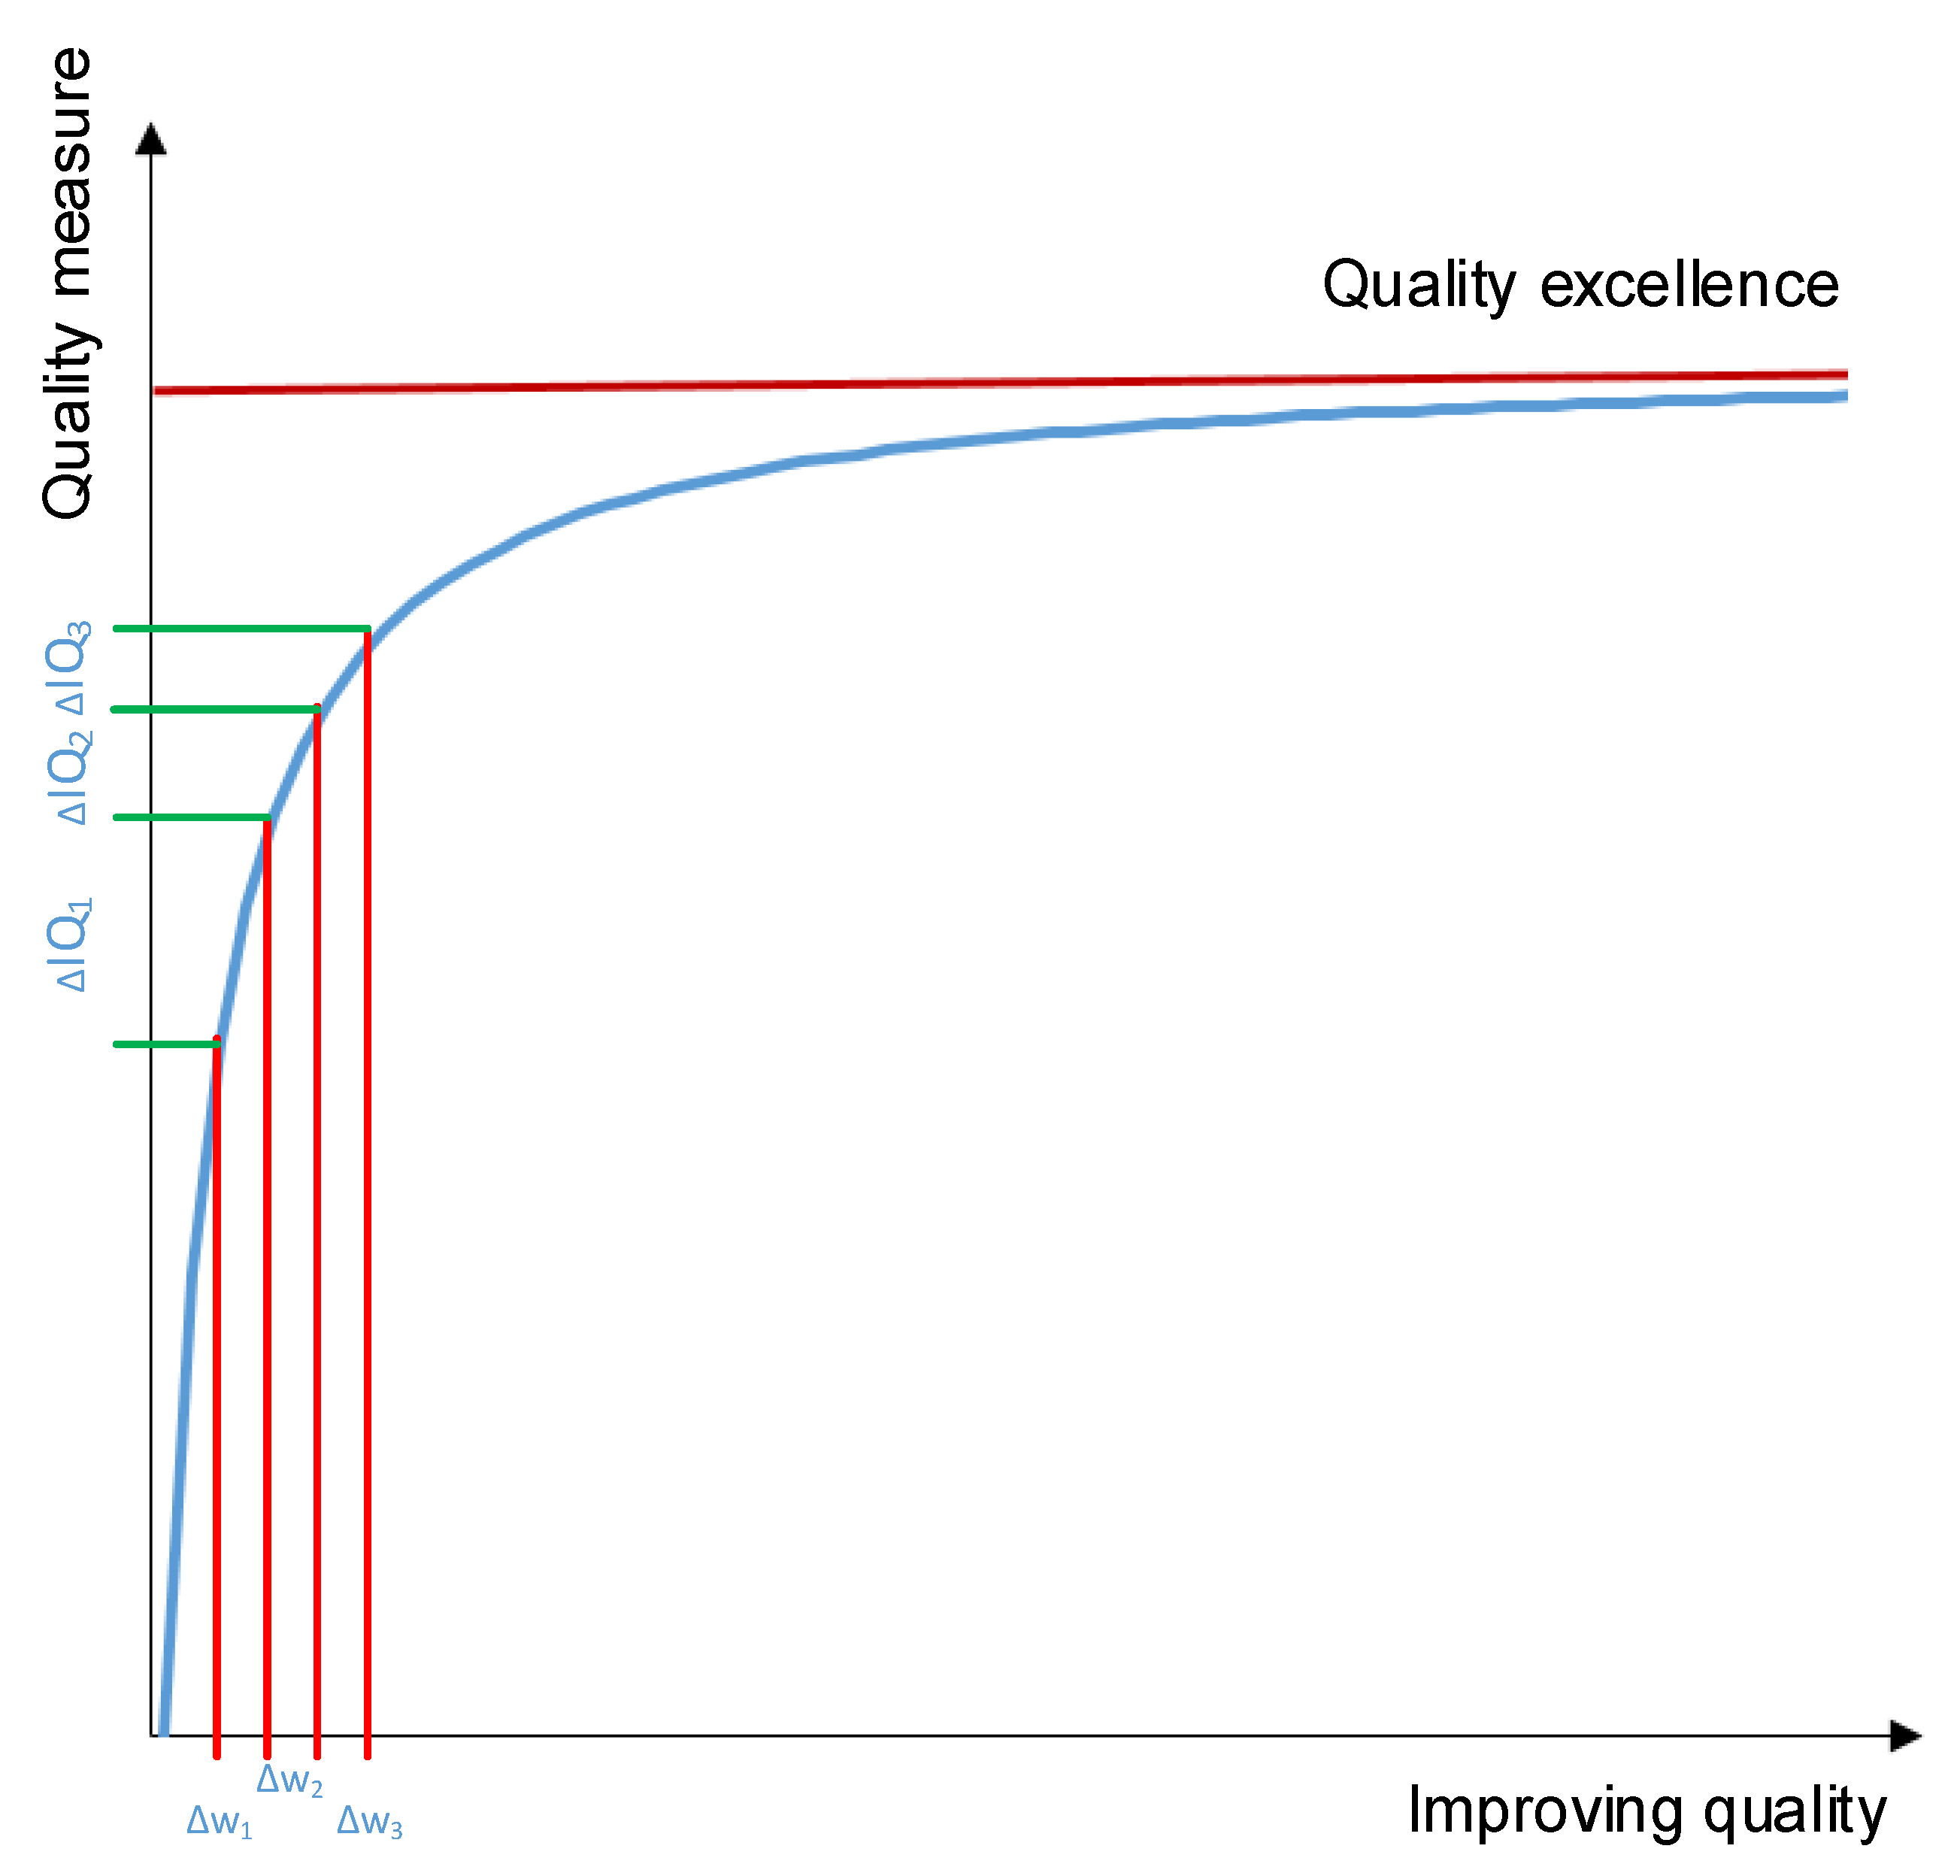
In this study, the applied methods enable the determination of IQ both in continuous modeling, presented as a set of IQ dimensions [2], and in discrete or hierarchical modeling, but also when divided into categories as in ISO 8000-8 [3]. The applied methods are based on the calculation of dependent and independent coefficients. This approach enables any modeling of multi-layer models (including hierarchical models adopted in the aforementioned ISO standard). Therefore, the rest of this article presents flat IQ models without categorizing. Such a division does not affect the modeling results of independent elements. Because these flat models can be combined into larger multi-layer structures which reflect hierarchical division as well, it can be said that the model described in ISO is one of the particular forms of multi-layer models.
Based on the work of the ancient philosophers Lao Tsu and Plato [5], the measure of quality can be expressed as the pursuit of perfection. Figure 1 shows quality improvement (a term defined in ISO 9000: 2015 [6]) as the pursuit of excellence. The graph in Figure 1 provides the important information that excellence is not achievable. It is the limit of the infinite quality improvement function. However, subsequent steps in improving the quality result in quality improvement (a measure of quality) and the approach to perfection.
Expressed in mathematical symbols:
lim n f ( w n ) = D
where:
D—perfection;
n—quality improvement steps;
wn—quality measure value string.
Based on Equation (1), it can be assumed that any function converging to some value at infinity can be a function that describes the quality measure well. The same dependencies also apply to IQ.

3. IQ Measure

In technical systems, IQ [3] has a large impact on the assessment of the system, especially when it comes to information systems used in such critical areas as healthcare, energy, and transport. All data can be affected by various errors that introduce a certain amount of uncertainty into the information. This uncertainty may indicate to us the IQ. Hence, the smaller the uncertainty, the higher the IQ. This may concern road traffic control or the uninterruptible power supply (UPS) of hospital equipment. An example of this is the communicativeness and legibility of signs controlling road traffic.
In the literature, there are many studies examining IQ. The following are those that seem to be specific and also characteristic of the subject matter of this article. The main generator of the publication was a project launched at the Massachusetts Institute of Technology under the name MIT Information Quality Program (MITIQ) [1]. Publications related to this project are the most frequently cited references in contemporary IQ studies. There are also many references to publications from this project in this paper. Two books are some of the most important items published under the MITIQ project. The first is “Information Quality” [8]. The book describes the multidimensionality of IQ, how to measure it, and how to manage it. Difficulties in scaling and interpreting IQ measurements are also described. This book mentions as many as one hundred and eighteen quality attributes (features) that can be included in fifteen dimensions of IQ. The second book published within the MITIQ program worth mentioning in this study is “Introduction to Information Quality” [2]. The book discusses the basics related to the currently understood multidimensionality of IQ, which is the basis for the proposed modeling methods in subsequent sections of this paper. The above-mentioned book also includes an extension of the previously crystallized view on the multidimensionality of IQ. It was supplemented, among others, with accessibility, security, and ease of manipulation. The book is the foundation for the guidelines published in 2010 on the US Department of Justice’s website regarding IQ.
In 2015, the ISO 8000-8 Information and Data Quality: Concepts and Measuring standard [3] was published partly as an alternative to the work of MITIQ. The standard rather modestly refers to what was developed by the MITIQ program, but cites authors from earlier publications, including the authors of the two above-mentioned books [2,8]. ISO 8000-8 is a set of standards describing the IQ dimensionality and hierarchical classification of IQ, and includes definitions of basic concepts such as: data, information, metadata, and data unit. This standard introduces a division of IQ into three main categories: synthetic, semantic, and pragmatic. It also schematically presents the general principles of measuring the overall IQ and the specific (subjective) IQ for each category. The model presented there is quite modest and its description does not reflect the real extent of the problem but only tries to standardize the approach, which by using the above-mentioned three categories seems quite limited. In the following sections, the concept of determining IQ is developed based on a multi-layer quality model. The model described in ISO 8000 is also compatible with the concept described; namely, it is its special case.
Successive publications appearing worldwide indicate the extent and variety of issues related to IQ, its determination, and interpretation. Publication [9] is a fine example. This publication presents approaches to IQ analysis in data integration framework schemes. It describes the integrated scheme quality assessment and distributed access to information systems, focusing on the minimum, consistency, and completeness of information. A multidimensional model of IQ was used for the evaluation. This approach is quite similar to that proposed in the following sections, although quite modest.
The publication [10] introduces a new approach to IQ measurement and uses the Six Sigma (6σ) method to estimate IQ. This approach focuses on continuously improving the IQ by systematically assessing many of the IQ dimensions. In particular, it deals with the correlation and the relative importance of the IQ dimensions. Thanks to this method, a precise and systematic criterion for assessing the quality of information is proposed. This concept seems quite attractive, but it does not exhaust the complexities of IQ modeling.
The article [11] discusses and analyzes the notion of IQ in terms of a pragmatic philosophy of language. It states that the concept of IQ is of great importance and must be situated better within a sound philosophy of information. It turns out that much research on IQ conceptualizes IQ as an inherent property of the information itself. A model of multidimensional IQ was presented, in which twenty-two dimensions were specified (accurate, appropriate, authentic, authoritative, balanced, believable, complete, comprehensive, correct, credible, current, good, neutral, relevant, reliable, objective, true, trustworthy, understandable, useful, usability, valid). These are more than the dimensions used in modeling conducted in the following sections. However, the modeling proposed in the following sections is open-ended and can theoretically be applied to an indefinite number of dimensions and may also include the number of dimensions shown in the article [11].
One of the co-authors (the main co-author) published the first original publications describing the IQ in 2013 and 2014 [12,13]. The articles present a model for determining IQ based on the Certainty Factor (CF) in highway telematics. Such modeling usually concerns expert systems or artificial intelligence. However, in highway telematics systems, the main elements are computer systems that analyze and process data on vehicle traffic. Modeling assumed multidimensionality of the IQ. These dimensions are shown as both dependent and independent.
In [14], the authors present the estimation of IQ in various domains. The article discusses the issues of portability of IQ modeling between domains. This led to the conclusion that an independent model should actually be created for each domain. The arguments presented in the following sections of this study lead to similar conclusions. In the proposed method of multidimensional, open modeling in this article, it is possible to build such an open model that will enable the description of IQ in many domains.
In 2014, the main co-author published two original works that provide the basis for this study [15,16]. Both publications were presented at the ESREL (European Safety and Reliability) Conference in 2014. The first paper [15] discusses the IQ estimation model of ICT systems based on CF modeling. This modeling practice was typically used in expert systems or artificial intelligence. Here, however, computer systems that use data from ICT systems are discussed. CF modeling is one of the methods that allow us to obtain information about the properties of a system when data about this system are incomplete. The model helps identify and locate the weakest system components that have a disastrous effect on IQ. The second publication [16] is a continuation of the previous works [12,13] involving the determination of IQ in various systems. When describing IQ, several basic dimensions were defined, such as: availability, actual value, completeness, reliability, flexibility, form, importance over time, accuracy, reliability, selectivity, and importance. One of the features of IQ dimensions was determined. The CF-modeling and Dempster–Shafer mathematical evidence methods were used.
The discussion on this topic was extended by the co-authors at the next ESREL 2015 conference [17]. The publication demonstrated that modeling the uncertainty of IQ can be achieved using the mathematical evidence theory as in the publication from ESREL 2014 [15,16]. While in the case of independent sources influencing the IQ, the use of evidence theory is quite simple, in the case of dependent sources, this modeling is not possible. This work proposes a method of determining the IQ for dependent sources (a serial model). A two-layer model consisting of dependent and independent elements was presented. This multi-layer modeling became the basis for the models shown in the following sections of this study.
A different approach can be seen in the study described in [18]. It attempts to investigate the importance of many information dimensions in measuring the IQ from the user’s point of view. The article provides a detailed analysis of the nature and importance of the various dimensions of IQ and their differences depending on the context and user demographics. This is an approach that takes into account only the subjective dimensions of IQ.
The next work [19] presents the issues of IQ measurability. The article examines the reasons underlying the differences in the measurability of IQ. Using the structure of Gigerenzer’s “building blocks”, it was hypothesized that the feasibility of using a set of heuristic principles when assessing different IQ dimensions is a key factor influencing the inter-rater agreement (content moderators) in IQ judgments. This method was used to assess IQ in Internet resources.
Alternative approaches to understanding and modeling IQ that typically involve a particular approach or partial quality assessment have been described above. The publications below display how IQ can be measured. This issue has been examined not only for studies related to technical systems.
In [20], the methodology for assessing the IQ for fifteen dimensions was defined and arranged in groups. The proposed methodology for IQ assessment (AIMQ) as a whole provides a practical tool for measuring IQ for an organization. It can apply at various organizational levels, such as the financial industry, healthcare, and manufacturing. The methodology is useful in identifying IQ issues, prioritizing areas of IQ improvement, and monitoring IQ improvements over time. This article presents a method that allows the IQ to be assessed in a hierarchical practical model arranged in groups. Such modeling usually has limitations; for example, such a model cannot be open because it is limited by groups. It has the same restrictions as the model described in ISO 8000 [3].
The article [21] presents a method that can be used in measuring the IQ of Internet resources. The presented method of measuring the IQ was limited to sixteen criteria, which partially overlapped with the dimensions presented in [2]. The method was based on four successive steps with repetitions of sections. The content of websites, traffic volume, understanding, and feedback were examined, which means that this method enables the measurement of the quality of both information content and the quality of the medium that the Internet is.
A different approach was presented in [22]. It attempts to indicate the best method of quality measurement yet, assuming that it is the definition of quality that imposes the measurement methodology. The paper includes a literature review and detects flaws in the methods presented there in the form of omitting the variability of requirements over time and different meanings of quality features. A method was proposed based on the division into analytical and synthetic measurements.
The study in [23] proposed the quality assessment on two levels. A quality assessment based on an information decomposition of the fusion system in its elementary modules was planned. The first (global), which describes the entire information fusion system, and the second (local), for each elementary module. The method was based on the multidimensionality of the IQ, and the fusion was performed by estimating the Bayes’ subjective probability. The method seems very complicated, which limits its use.
The following article, [24], presented an IQ model that shows how to understand IQ in the context of systems and also how to determine some common IQ indicators. The importance of predicting and modeling the IQ was also described. Building information chains automatically to meet the expected IQ was suggested. The limitation of this method is the application of chains that prevent the use of more complex structures.
Uncertainty modeling to determine IQ occurs very rarely in the literature. One of the few examples which do not belong to the authors of this paper is [25] and describes the relationship between IQ and uncertainty modeling. Information uncertainty was presented as part of the IQ model. This type of approach seems to be very attractive, as shown in the following sections. However, the article does not develop a method into full IQ modeling using uncertainty modeling.
Summarizing the above-mentioned publications, it seems obvious that there is no specific method for determining the IQ, especially in technical systems. The authors of this article are trying to fill in the lack of such a study. Another disadvantage of the methods proposed above is the fact that they are often limited to a specific model. That is, the lack of openness in modeling to new dimensions of quality or their features. Another restriction of the presented methods is often the dependence on individual groups of IQ dimensions, which limits the flexibility of modeling and confines this modeling to selected dimensions. Another limitation is the frequent omission of the possibility of multi-level modeling with even the simplest, minimal division of quality dimensions into features. There is also no link between the IQ and its subsequent states. The authors make an attempt to eliminate all these limitations in this study, presenting a multi-layer model of IQ using uncertainty modeling and taking into account information states known from the literature. The article uses the mathematical evidence method as an example of uncertainty modeling used to determine the IQ. In the following sections, in addition to the description of the method, an example of calculations for the selected model and the simulation of the model results depending on the input coefficients are also presented. A similar approach was presented by the main co-author in [7,26,27,28,29]. Applying the presented approach to the assessment and analysis of other systems by assessing reliability or risk, as presented in the works [30,31,32], is also expected. To use the modeling presented here in various other types of technical system assessments, such as diagnostics [33], risk assessment related to road and rail signaling [27,34], and development-related applications [35], seems possible too.

4. Research Problem and Research Methodology

On the one hand, in the definition of the problem, the information quality dimensions can be distinguished, which depend on their features. On the other hand, there might appear information states, which depend on the structure of the ICT system. In order to model information quality, a flat model of sixteen quality dimensions presented in [2] has been adopted [7,8,27]. This model exhibits great elasticity and enables us to define the features of quality dimensions and also to subordinate the dimensions from these features. This model applies the quality dimensions, which are presented in Table 1 and in Figure 2.
The second element which demands modeling is the structure of the ICT system. One can encounter in the literature many models describing diverse information states in systems. The ones mostly elaborated on occur in [36], where they are called information processes. The following types of information processes can be specified: generating, collecting, storage, processing, transmission, sharing, and interpreting (Figure 3).
Each of the seven above-named information states is a consecutive element influencing IQ. Thus, a formula can be devised in the following way:
IQ = f(w11,w12,…,w1m, w21,w22,…,w2m,… wnm)
where:
m—the number of dimensions, IQ components (equals 16 according to Table 1);
n—the number related to registration and data transmission in an ICT system (equals 7 according to Figure 3);
w—a variable determining the influence of the particular dimension (e.g., range of values [0,1]).
The general form of the matrix:
IQ = [ w 11 w 1 m w n 1 w nm ]
As it has been mentioned before, searching for a method to determine IQ dimensions appears obvious. Figure 4 presents the positioning of the quality dimensions features in respect to the dimensions themselves. It is worth noting that the dimensions as such can be completely independent, yet their features can be shared between the dimensions. This means that one feature can influence many IQ dimensions. For example, dimensions (see Table 1) no. 3 (believability) and no. 8 (free of error) can have mutual determining features, e.g., errors of transmission or of data storage, which constitute the information (Figure 5).
Figure 6 presents a universal diagram of an IQ model for an ICT system taking into account information states, IQ dimensions, and their dimension features.
A method to establish the value of factors of quality dimension features served as a method devised to determine IQ dimensions in publication [17]. This method is based on uncertainty modeling using mathematical evidence and dependent relations in serial models.
Taking into consideration what has been so far described in this study, when determining the IQ of a chosen ICT system, one should follow the flowchart in Figure 7. The first step is the choice of stages of information of the given ICT system on the basis of Figure 3 (first step in Figure 7). The second step is the choice of IQ dimensions on the basis of Figure 2 or Table 1. At this point, all dimensions can be taken into account, but this will complicate the calculations. Generally, it is not necessary to include all IQ dimensions presented in Table 1 to determine the IQ of a chosen system. In the third step, the features of the chosen dimensions (Figure 4) should be selected allowing for the fact that one feature can affect several dimensions (Figure 5). According to the literature [2], over one hundred and thirty features can be assigned to the presented sixteen dimensions. Only those features that have a significant impact on IQ, as in the example, should be selected. In the fourth step, it is possible to decide which of the information stages for the evaluated ICT system will be multiplied (Figure 6). The penultimate step is to create a model or models to describe the impact of subsequent elements on the IQ. The last step is the calculation leading to one final IQ indicator. This sequence is used in the example in Section 7.

5. Uncertainty Modeling on the Basis of the Theory of Mathematical Evidence

In the theory of mathematical evidence, it is possible to synthesize information for individual elementary probability measures. They can be synthesized even if they are contradictory or come from different sources [16,17,26,27,37,38]. This enables the synthesis of independent information. Such a synthesis can be defined by the formula:
m 3 = A i   B j = C   ( m 1 ( A i )   ·   m 2 ( B j ) ) 1 A i   B j =   ( m 1 ( A i )   ·   m 2 ( B j ) )
where A, B, and C—sources of observation that represent subsets of the set Θ; m1 and m2—sets of masses; and m3—a new set of masses, defined by Dempster as a certain degree of faith or subjective probability [37].
This synthesis is called the Dempster combination rule [27,38]. The Basic Belief Assignment (BBA) function is defined as follows:
m : 2 Θ   0 , 1 m [ ] = 0 A Θ m ( A ) = 1
Belief, abbreviated as Bel ∈ [0,1], measures the strength of the obtained observations supporting the belief that the set of hypotheses is true.
Bel ( A ) = B A m ( B )  
Plausibility, abbreviated as Pl ∈ [0,1], determines to what extent the belief about the truth of A is limited by the supporting evidence ¬A.
Pl ( A ) = B   A   m ( B )     Pl ( A ) = 1 Bel ( ¬ A )
Doubt, in short Dou ∈ [0,1], measures the strength of the obtained observations supporting the doubt as to the authenticity of the examined set of hypotheses.
Dou ( A ) = 1 - Bel ( A )
Disbelief, abbreviated as Dis ∈ [0,1], determines the extent to which the doubt of A’s authenticity is limited by the supporting evidence of ¬ A .
Dis ( A ) = 1 - Pl ( A )
The combination rule affects the belief function and can be expressed like this:
Bel 1 Bel 2 ( A ) = B A   m 1 m 2   ( A )  

6. Multi-Layer Modeling of Uncertainty Using the Hybrid Method

Multi-layer modeling demands serial connections (dependents). A mathematical description of dependent sensors which record observations was suggested in [39]. The study resulted in a formula based on a Cartesian product in the form of:
m = m 1 m 2 m n
where m1, m2 … mn—sets of masses; m—new set of mass.
Yet, in the case of the modeling presented in this article, the hypothesis factors on the dependent layer will be described on a single dimension. Thus, the formula can be simplified as follows:
m 3 = m 1 m 2

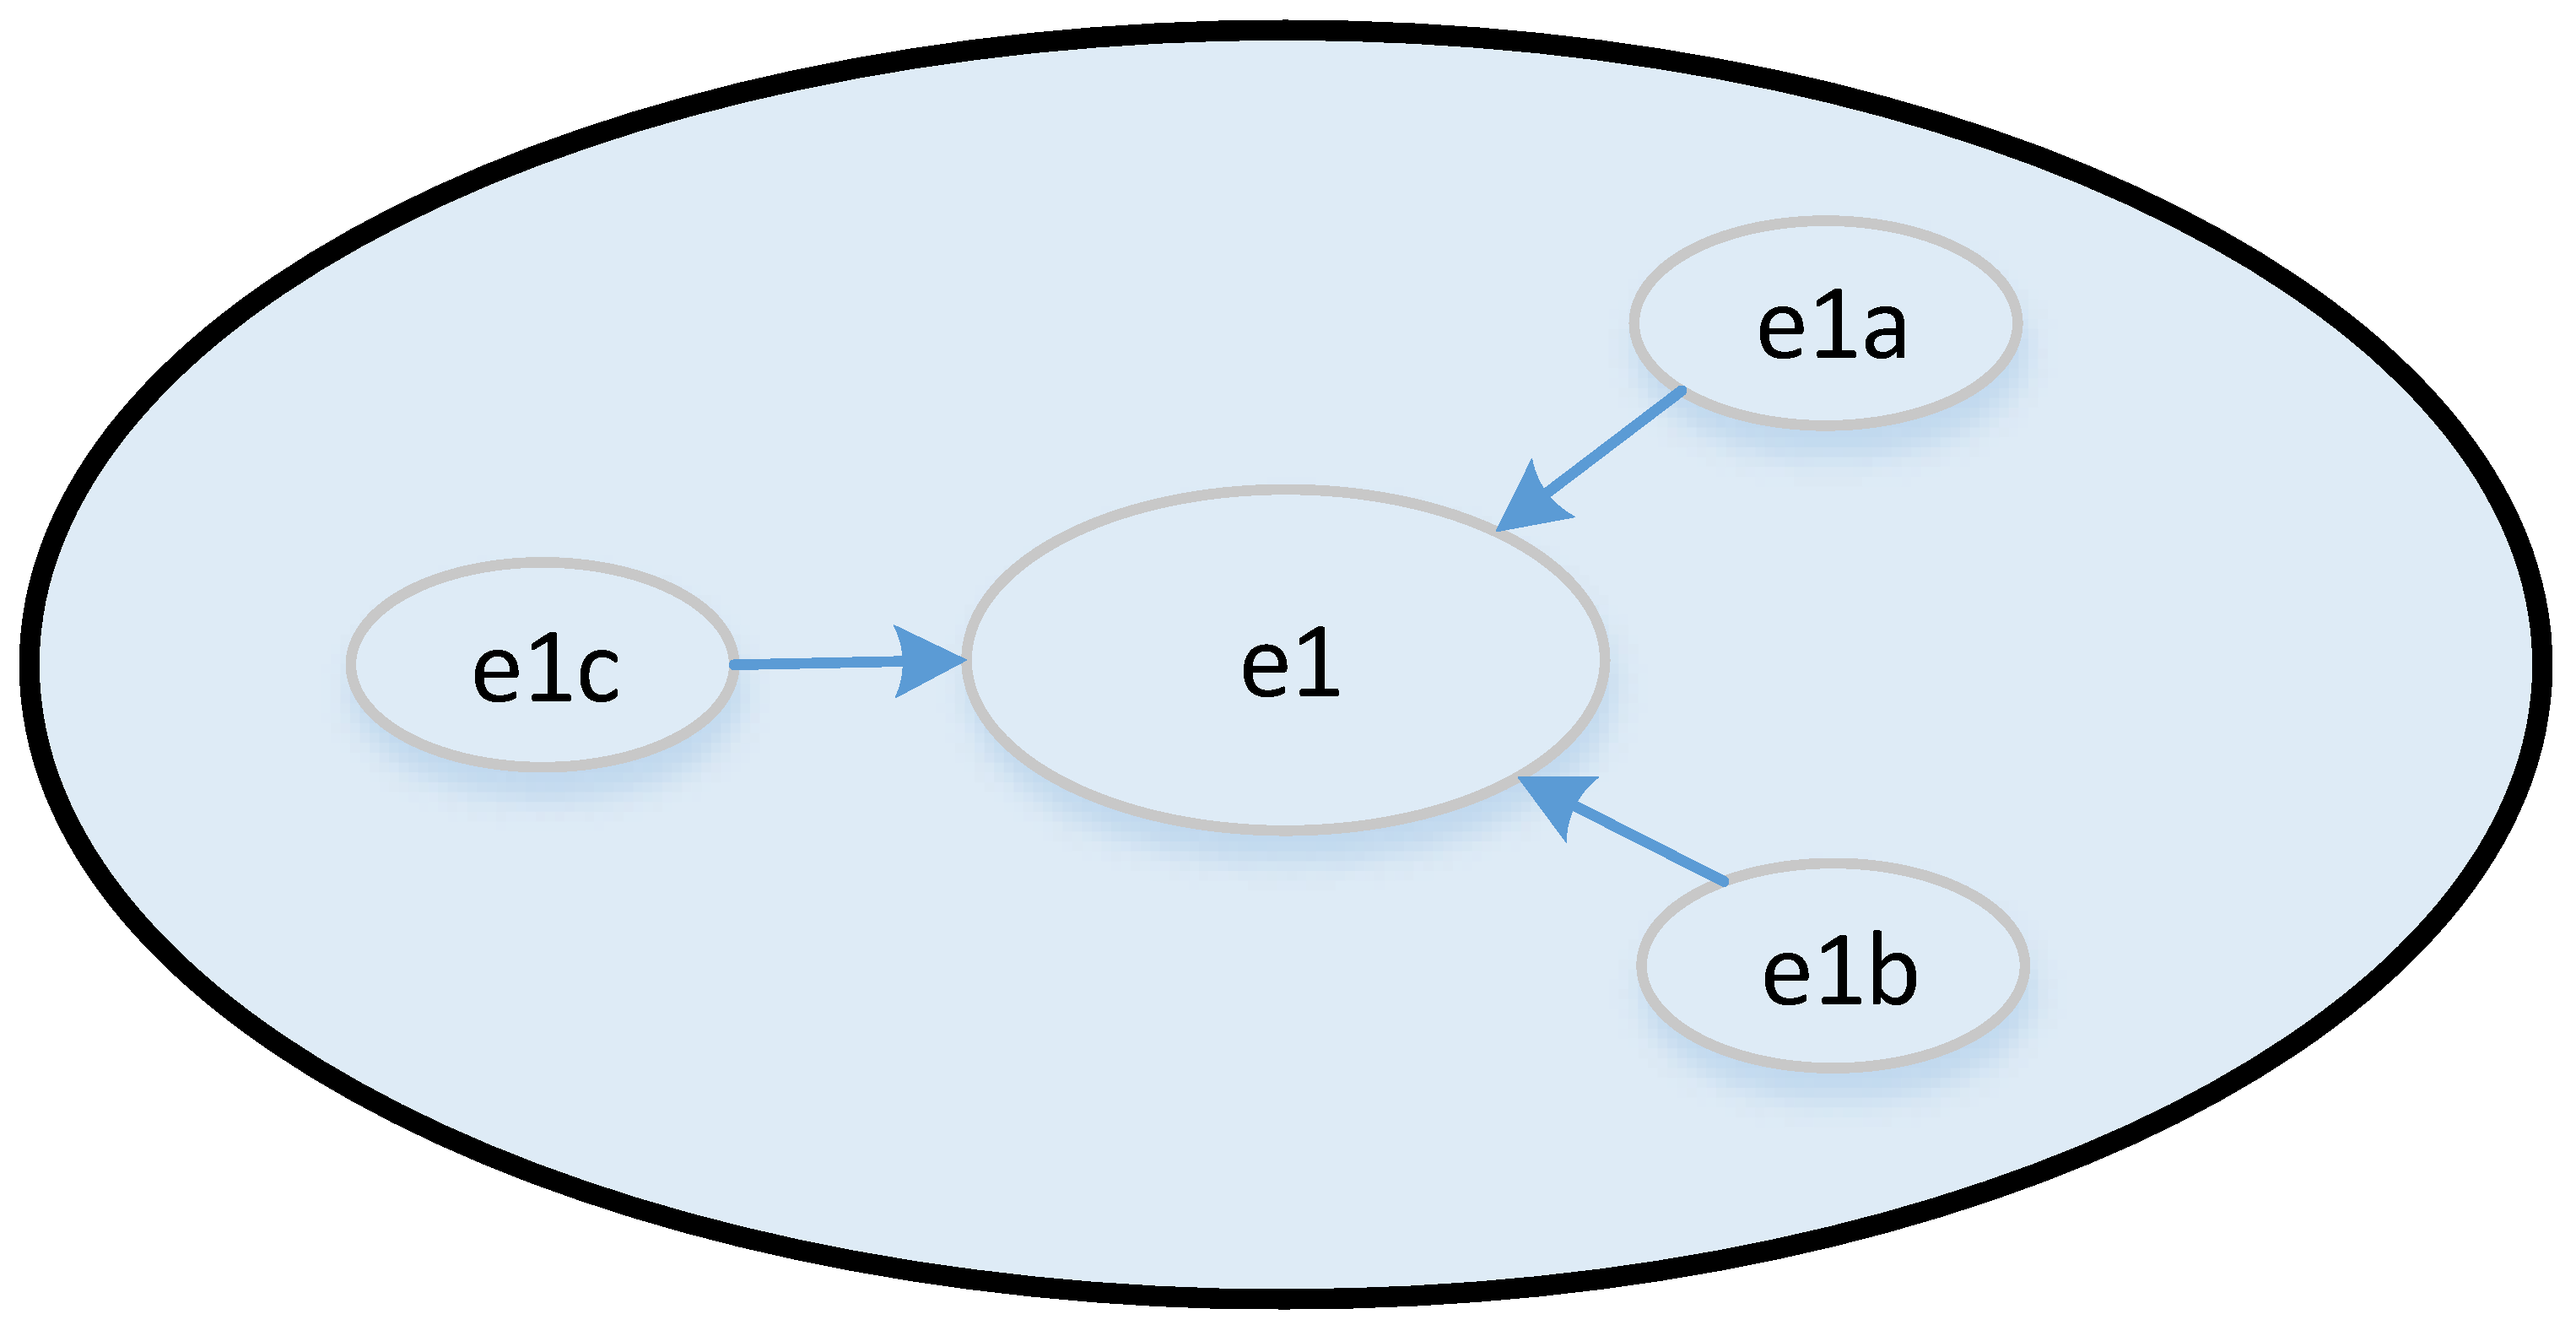
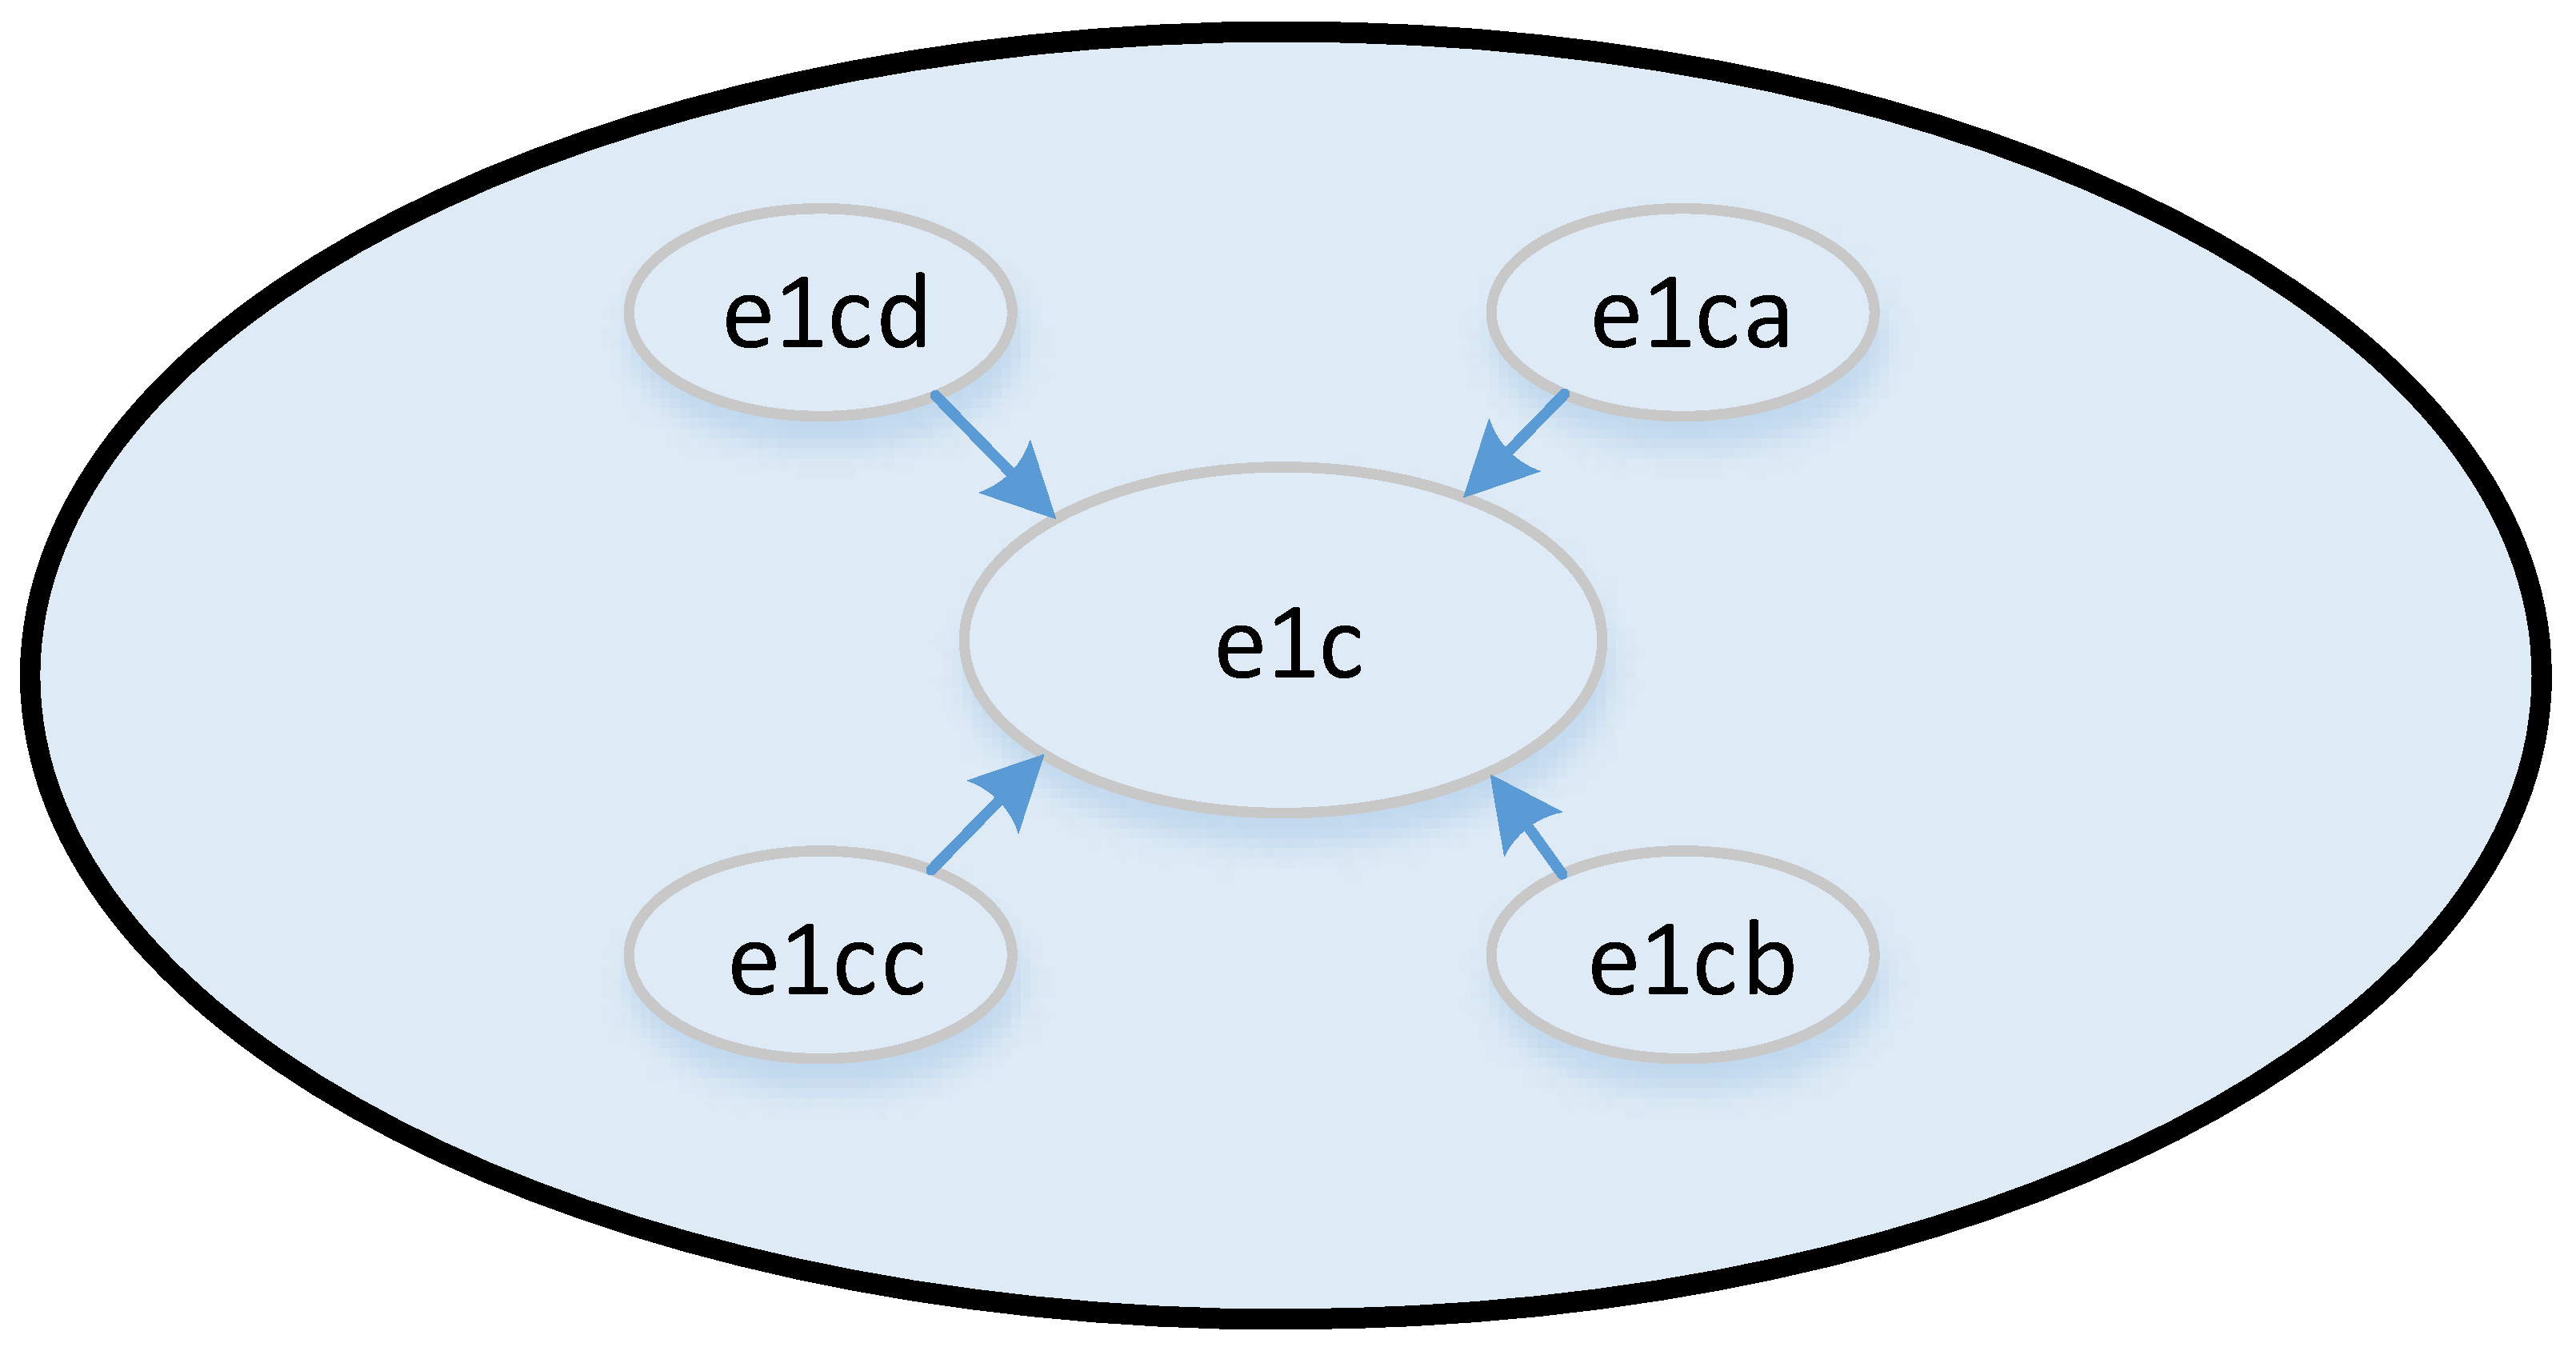
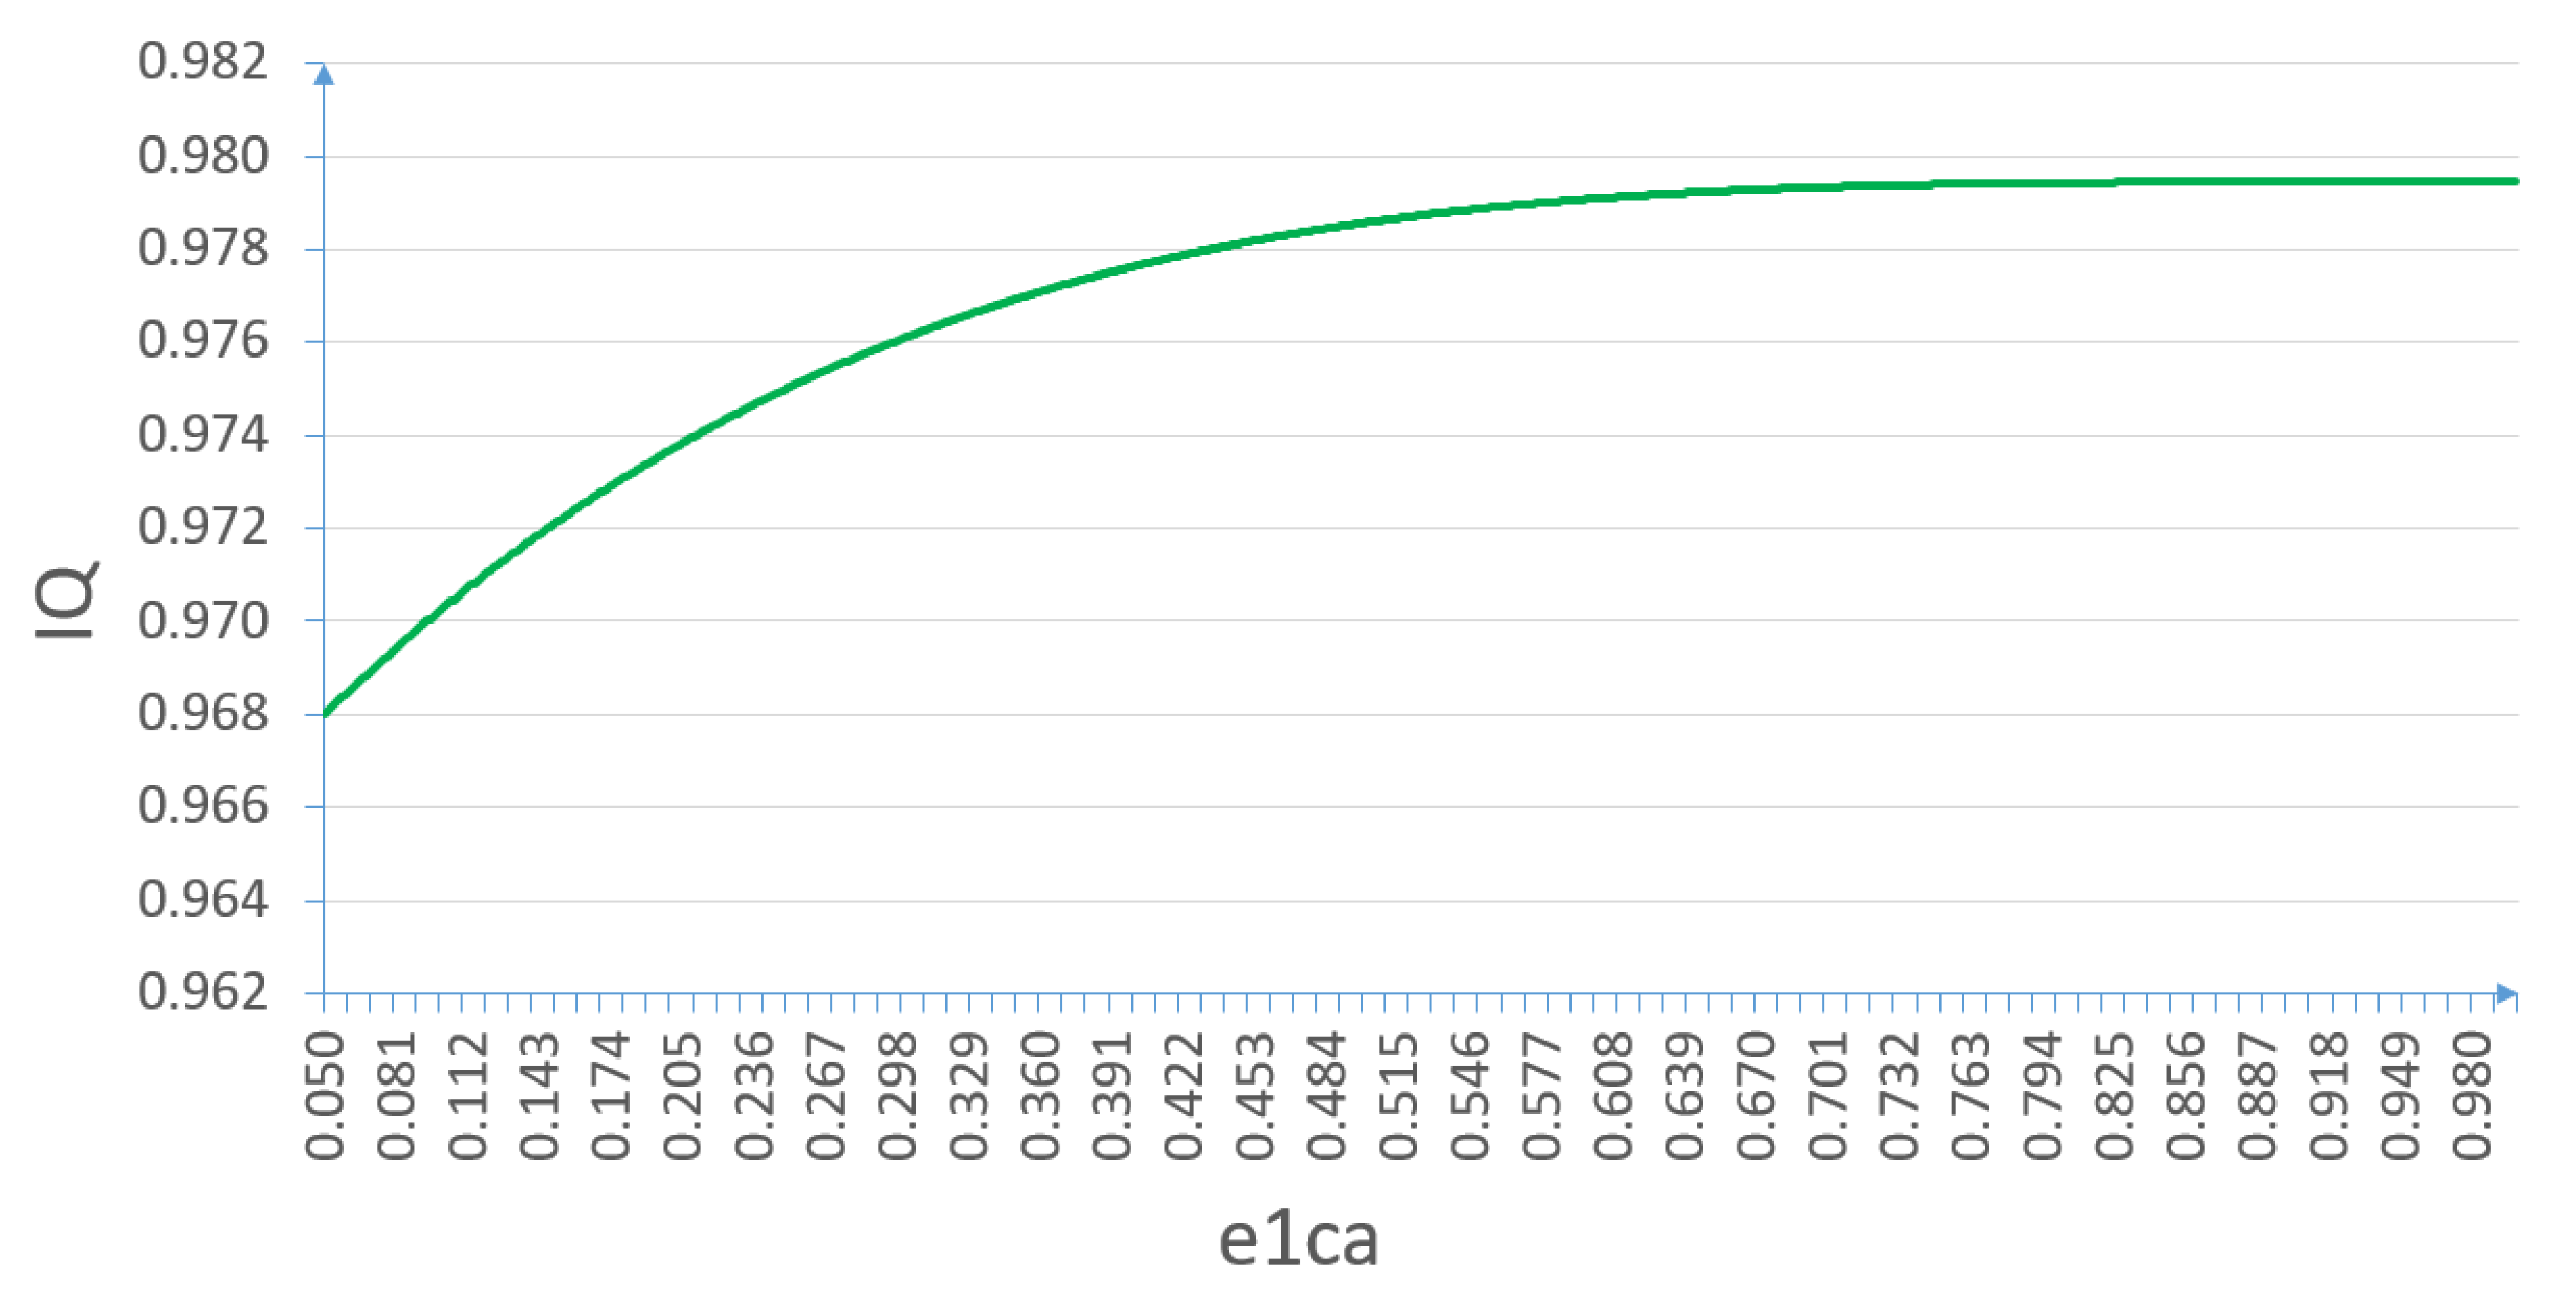
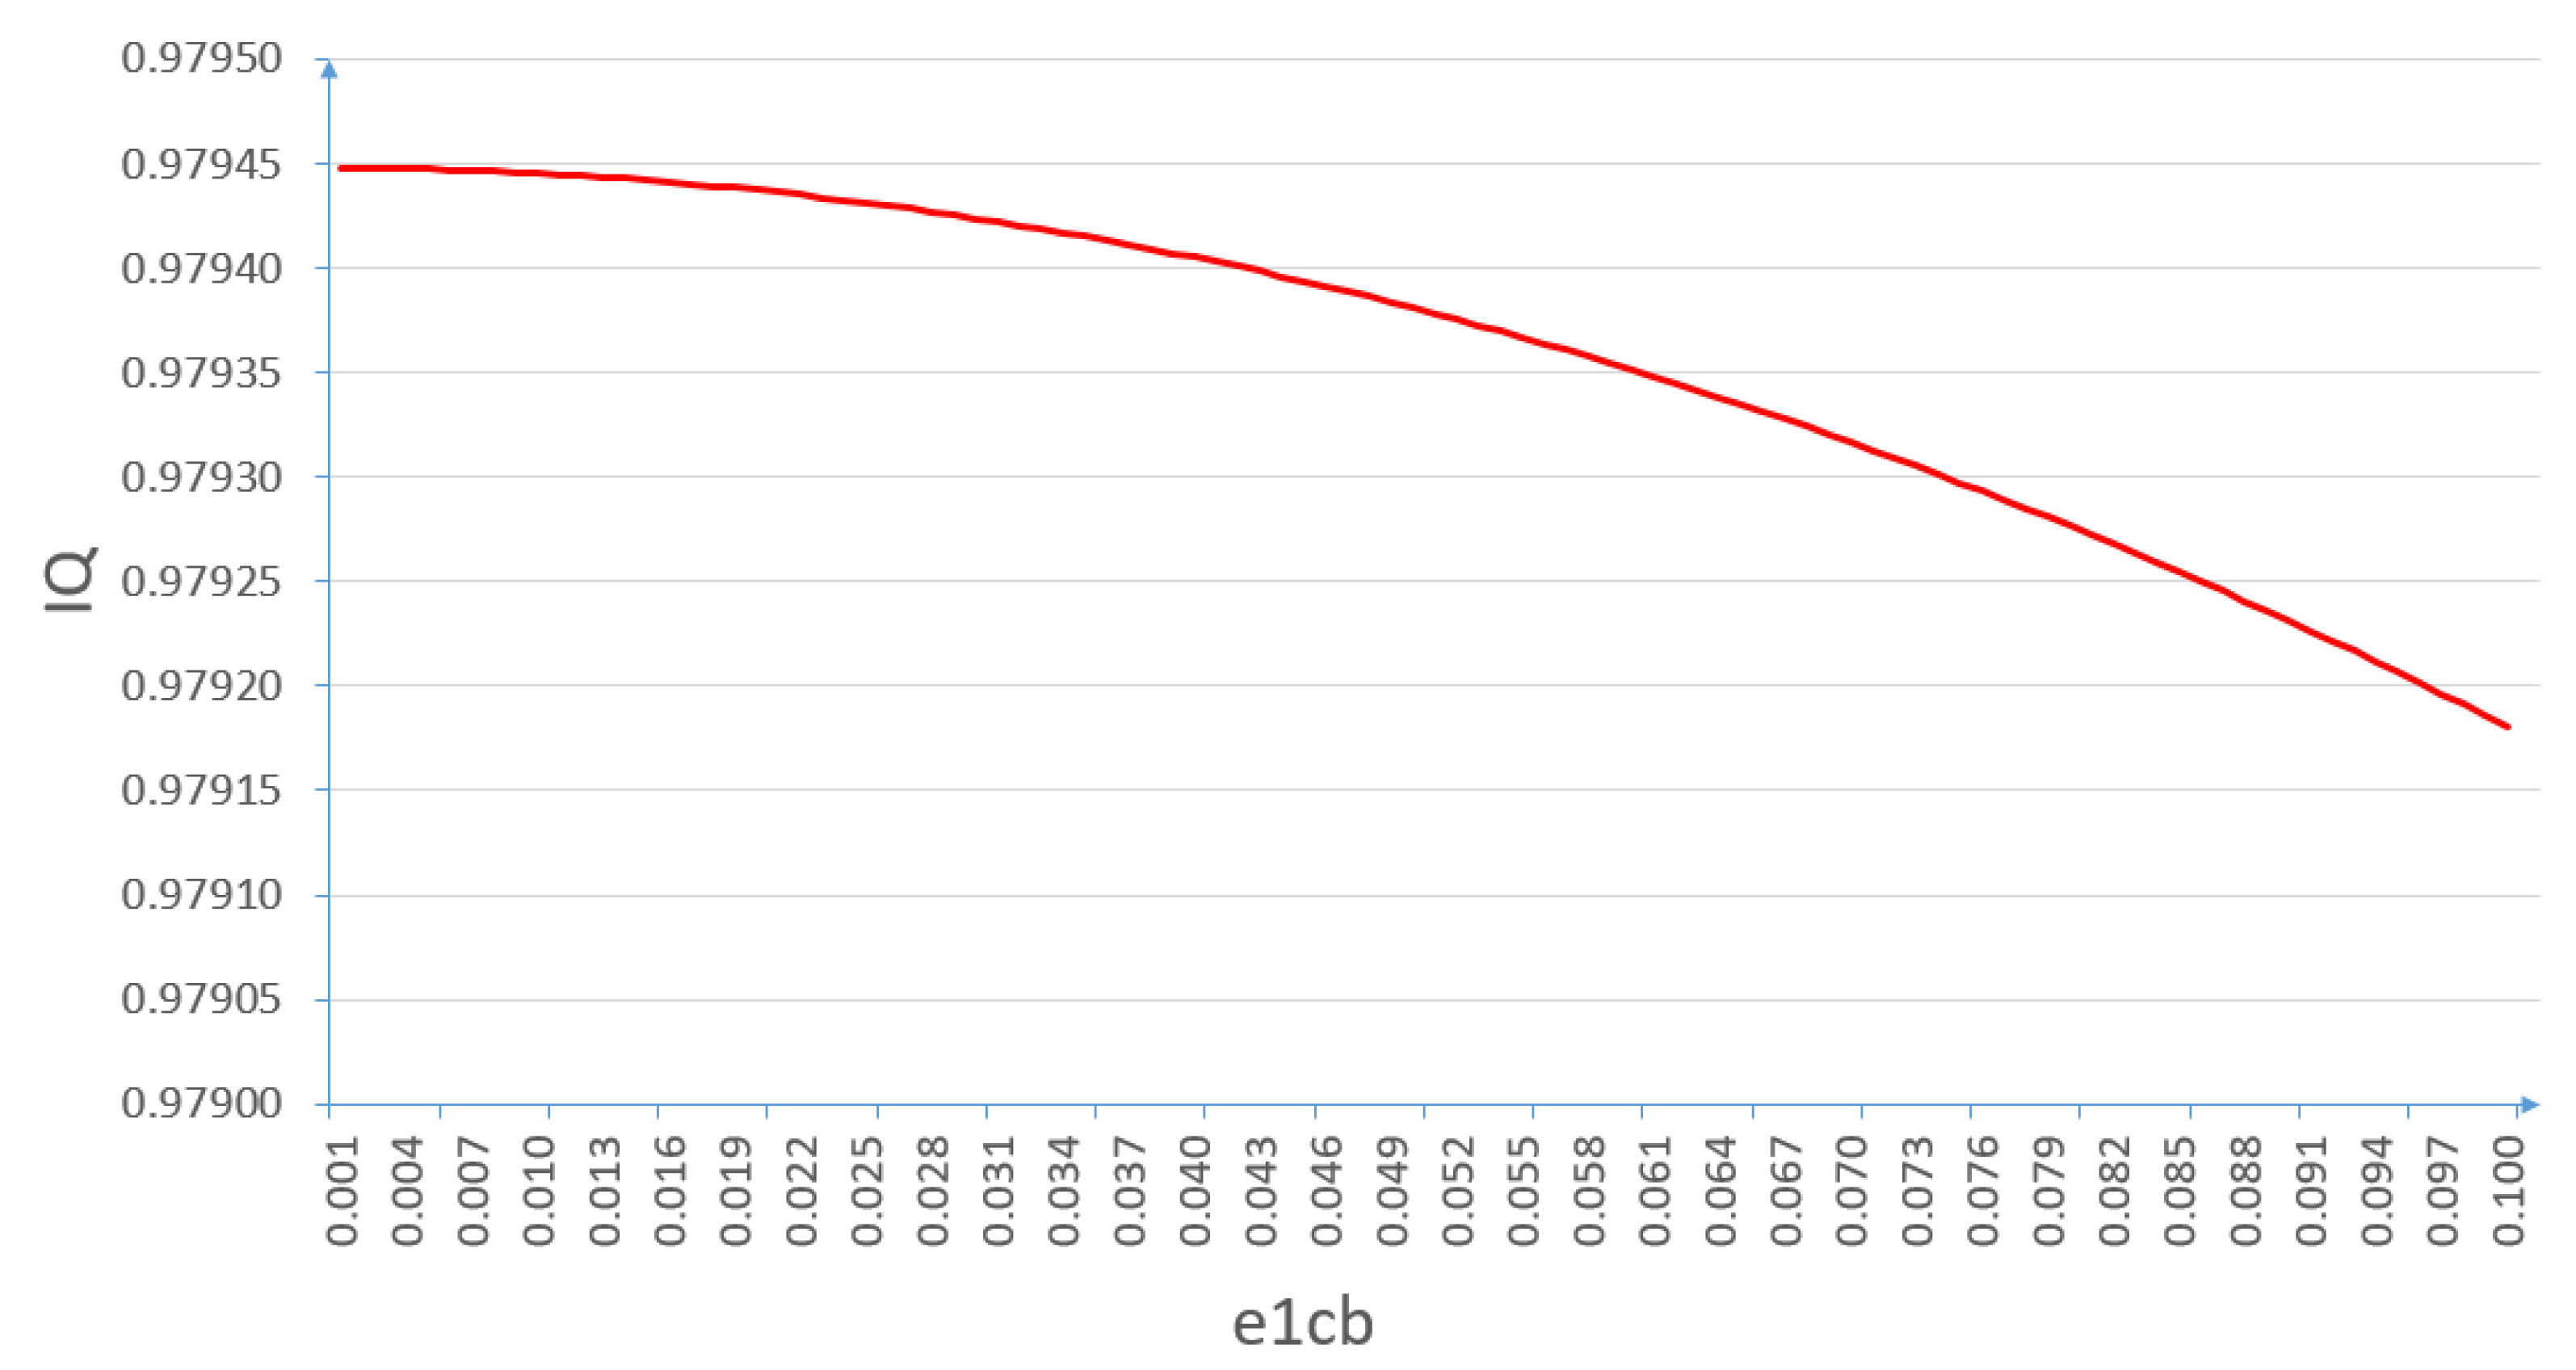
7. Method Demonstration

To demonstrate the method, a program was written simulating some features of one of the IQ dimensions, and the target final quality value for the model of the IQ ICT system is presented in Figure 8. This software was created by Marek Stawowy, one of the authors of this article. The software under the name DSHyb enables calculations for uncertainty models applying DS (mathematical evidence) and the hybrid method. From Figure 8, it is evident that the model was restricted to two states of information of an ICT system. State e1 stands for the state of information transmission, and state e2 stands for the state of information interpretation.
The model of IQ state e1 presented in Figure 9 includes three IQ dimensions:
e1a—appropriate amount of data;
e1b—believability;
e1c—error free.
The model of dimension e1c presented in Figure 10 includes four dimensions features:
e1ca—correct information transmission;
e1cb—transmission of faulty data;
e1cc—data assignment to attributes failure;
e1cd—wrong attributes.
Table 2 presents values that are assigned to the model of IQ dimension in Figure 9.
A table is the clearest way of presenting calculations for independent elements using the theory of mathematical evidence. Thus, presented in this form, it is possible to show dependencies in observation tables, as shown in Table 3, Table 4, Table 5 and Table 6.
Θ={e1ca,e1cb,e1cc,e1cd}
m1 (Θ) = 1
Table 3, Table 4, Table 5 and Table 6 show the subsequent stages of mass calculation. As a result, mass m9 with the index e1ca indicates the Bel result (e1ca).
Bel (e1ca) = m9 (e1ca)
The determination of the Bel value can also be presented in the form of a matrix. A detailed example of such an operation can be found among others in the following publications: [17,27].
Having assigned the value with the use of the hybrid method described above and in [17,27], e1c = Bel (e1ca) = 0.9801.
Table 7 presents values that are assigned to the model of IQ dimension in Figure 8.
Having assigned the value with the use of the hybrid method described in [17,27] and the example for calculating e1c, e1 = 0.99944.
Table 8 presents values that are assigned to the model of IQ states in Figure 7.
In this case, the elements are dependent (serial), so Equation (12) must be applied. Thus, h = e1 · e2 = 0.97945.
This value will be the IQ coefficient of the ICT system presented in the above example.
As in the articles [17,29], below is presented a simulation of IQ depending on the positive observation e1ca (Figure 11) and negative e1cb (Figure 12). In order to obtain a visualization of IQ dependency change as a function of one of the IQ dimension features, a simulation was performed for the e1ca (observation with a positive influence on the IQ) value with a range between 0.05 and 0.99. The results of this simulation are presented in the form of a diagram in Figure 11. As a result of the simulation, an approximate relationship was obtained, which is presented as an expected graph in Figure 1.
In order to obtain a visualization of IQ dependency change as a function of one of the IQ dimension features, a simulation was performed for the e1cb (observation with negative influence on the IQ) value with a range between 0.001 and 0c. The results of this simulation are presented in the form of a diagram in Figure 12.

8. Conclusions and Summary

This article proposes a method for determining the quality of information (IQ) founded on a multidimensional model based on uncertainty modeling. The model takes into account not only the features and dimensions of quality but also information states, thanks to which the model enables a comprehensive description of the entire ICT system. Therefore, the presented method allows determining multi-layer dependencies both dependent and independent (serial and parallel) in complex IQ models of ICT systems consisting of information states, IQ dimensions, and features of these dimensions. Due to this method, it is possible to narrow down the IQ of the ICT system to one indicator, which can also serve as an evaluation of the system. This article also describes an example and a simulation of the influence of the IQ dimensions on the ICT system IQ. The example uses mathematical evidence as a method to estimate the uncertainty of independent elements extended by the calculation of dependent elements. As a result of the simulation, an approximate relationship is obtained, which is presented as expected (Figure 1 and Figure 11). The next stage in the development of this method might be the application of other ways of modeling uncertainty, because the theory of mathematical evidence is of little practical use in multi-element models. This results from the fact that complications in calculations grow rapidly with regard to the number of independent objects in the model. A different direction for the development of the method presented in this study is devising new methods of calibration depending on the requirements of the given system.

Author Contributions

Conceptualization, M.S., S.D. and J.P.; methodology, M.S. and W.W.; software, M.S.; validation, J.P. and W.W.; formal analysis, S.D. and J.P.; investigation, M.S. and J.P.; resources, M.S. and W.W.; data curation, M.S. and W.W.; writing—original draft preparation, M.S., S.D., J.P. and W.W.; writing—review and editing, M.S. and J.P.; visualization, M.S. and W.W.; supervision, M.S. All authors have read and agreed to the published version of the manuscript.

Funding

This research received no external funding.

Institutional Review Board Statement

Not applicable.

Informed Consent Statement

Not applicable.

Data Availability Statement

Not applicable.

Conflicts of Interest

The authors declare no conflict of interest.

References

  1. Massachusetts Institute of Technology Information Quality (MITIQ) Program. Available online: http://mitiq.mit.edu (accessed on 3 June 2021).
  2. Fisher, C.; Lauria, E.; Chengalur-Smith, S.; Wang, R. Introduction to Information Quality; Authorhouse: Bloomington, IN, USA, 2011. [Google Scholar]
  3. International Organization for Standardization. Data Quality—Part 8: Information and Data Quality: Concepts and Measuring; ISO/IEC 8000-8:2015; ISO: Geneva, Switzerland, 2015. [Google Scholar]
  4. International Organization for Standardization. Information Technology—Vocabulary—Part 28: Artificial Intelligence—Basic Concepts and Expert Systems; ISO/IEC 2382:2015: 2121272, 2121271 & 2123204; ISO: Geneva, Switzerland, 2015. [Google Scholar]
  5. Tatarkiewicz, W. History of Philosophy, 22nd ed.; PWN: Warsaw, Poland, 2014; Volumes 1–3. [Google Scholar]
  6. International Organization for Standardization. Quality Management Systems—Fundamentals and Vocabulary; ISO/IEC 9000:2015; ISO: Geneva, Switzerland, 2015. [Google Scholar]
  7. Stawowy, M.; Olchowik, W.; Rosiński, A.; Dąbrowski, T. The Analysis and Modelling of the Quality of Information Acquired from Weather Station Sensors. Remote Sens. 2021, 13, 693. [Google Scholar] [CrossRef]
  8. Wang, R.Y.; Pierce, E.M.; Madnick, S.; Fisher, C.W. (Eds.) Information Quality. Advances in Management Information Systems; M.E. Sharpe: Armonk, NY, USA, 2005. [Google Scholar]
  9. Batista, M.D.; Salgado, A.C. Information Quality Measurement in Data Integration Schemas. In Proceedings of the Fifth International Workshop on Quality in Databases, QDB 2007, at the VLDB 2007 Conference, Vienna, Austria, 23 September 2007. [Google Scholar]
  10. Lee, S.; Haider, A. A Framework for Information Quality Assessment Using Six Sigma Approach. Communications of the IBIMA; IBIMA: King of Prussia, PA, USA, 2011. [Google Scholar] [CrossRef] [Green Version]
  11. Mai, J.E. The Quality and Qualities of Information. JASIST 2013, 64, 675–688. [Google Scholar] [CrossRef] [Green Version]
  12. Stawowy, M. Quality of Information Fed by Video Surveillance Systems Protecting Critical Infrastructure. WUT J. Transp. Eng. 2014, 104, 103–113. [Google Scholar]
  13. Stawowy, M. Determination of Information Quality of Motorway Telematics. WUT J. Transp. Eng. 2013, 92, 221–229. [Google Scholar]
  14. Illari, P.; Floridi, L. Information Quality, Data and Philosophy. In The Philosophy of Information Quality. Synthese Library (Studies in Epistemology, Logic, Methodology, and Philosophy of Science); Springer: Cham, Switzerland, 2014; Volume 358. [Google Scholar] [CrossRef]
  15. Stawowy, M. Comparison of uncertainty models of impact of teleinformation devices reliability on information quality. In Safety and Reliability: Methodology and Applications—Proceedings of the European Safety and Reliability Conference ESREL 2014; Nowakowski, T., Młyńczak, M., Jodejko-Pietruczuk, A., Werbińska–Wojciechowska, S., Eds.; CRC Press/Balkema: London, UK, 2015; pp. 2329–2333. [Google Scholar]
  16. Stawowy, M. Model for information quality determination of teleinformation systems of transport. In Safety and Reliability: Methodology and Applications—Proceedings of the European Safety and Reliability Conference ESREL 2014; Nowakowski, T., Młyńczak, M., Jodejko-Pietruczuk, A., Werbińska–Wojciechowska, S., Eds.; CRC Press/Balkema: London, UK, 2015; pp. 1909–1914. [Google Scholar]
  17. Stawowy, M.; Dziula, P. Comparison of Uncertainty Multilayer Models of Impact of Teleinformation Devices Reliability on Information Quality. In Safety and Reliability of Complex. Engineered Systems—Proceedings of the European Safety and Reliability Conference ESREL 2015; Podofillini, L., Sudret, B., Stojadinovic, B., Zio, E., Kröger, W., Eds.; CRC Press/Balkema: London, UK, 2015; pp. 2685–2691. [Google Scholar]
  18. Kumar, S.; Jakhar, M. Understanding user evaluation of Information Quality Dimensions in a digitized world. In Proceedings of the POMS Conference, Orlando, FL, USA, 6–9 May 2016. [Google Scholar]
  19. Arazy, O.; Kopak, R.; Hadar, I. Heuristic Principles and Differential Judgments in the Assessment of Information Quality. JAIS 2017, 18, 403–432. [Google Scholar] [CrossRef]
  20. Lee, Y.W.; Strong, D.M.; Kahn, B.K.; Wang, R.Y. AIMQ: A methodology for information quality assessment. Inf. Manag. 2002, 40, 133–146. [Google Scholar] [CrossRef]
  21. Eppler, M.; Muenzenmayer, P. Measuring Information Quality in the Web Context: A Survey of State-of-the-Art Instruments and an Application Methodology. In Proceedings of the Seventh International Conference on Information Quality (ICIQ ’02), Boston, MA, USA, 8–10 November 2002; pp. 187–196. [Google Scholar]
  22. Greal, G. The Framework of Quality Measurement. Management 2015, 10, 177–191. [Google Scholar]
  23. Todoran, I.; Lecornu, L.; Khencha, f A.; Le Caillec, J. Information quality evaluation in fusion systems. In Proceedings of the 16th International Conference on Information Fusion, Istanbul, Turkey, 9–12 July 2013; pp. 906–913. [Google Scholar]
  24. Keeton, K.; Mehra, P.; Wilkes, J. Do you know your IQ? A research agenda for information quality in systems. SIGMETRICS Perform. Eval. Rev. 2009, 37, 26–31. [Google Scholar] [CrossRef]
  25. Lesot, MJ.; Revault d’Allonnes, A. Information Quality and Uncertainty. In Uncertainty Modeling. Studies in Computational Intelligence; Kreinovich, V., Ed.; Springer International Publishing: Cham, Switzerland, 2017; Volume 683. [Google Scholar]
  26. Stawowy, M.; Rosiński, A.; Paś, J.; Klimczak, T. Method of Estimating Uncertainty as a Way to Evaluate Continuity Quality of Power Supply in Hospital Devices. Energies 2021, 14, 486. [Google Scholar] [CrossRef]
  27. Stawowy, M. Method of Multilayer Modeling of Uncertainty in Estimating the Information Quality of ICT Systems in Transport; Publishing House Warsaw University of Technology: Warsaw, Poland, 2019. [Google Scholar]
  28. Becerra, M.A.; Tobón, C.; Castro-Ospina, A.E.; Peluffo-Ordóñez, D.H. Information Quality Assessment for Data Fusion Systems. Data 2021, 6, 60. [Google Scholar] [CrossRef]
  29. Stawowy, M.; Rosiński, A.; Siergiejczyk, M.; Perlicki, K. Quality and Reliability-Exploitation Modeling of Power Supply Systems. Energies 2021, 14, 2727. [Google Scholar] [CrossRef]
  30. Rychlicki, M.; Kasprzyk, Z.; Rosiński, A. Analysis of Accuracy and Reliability of Different Types of GPS. Receiv. Sens. 2020, 20, 6498. [Google Scholar] [CrossRef]
  31. Klimczak, T.; Paś, J. Basics of Exploitation of Fire Alarm Systems in Transport Facilities; Military University of Technology: Warsaw, Poland, 2020. [Google Scholar]
  32. Duer, S. Applications of an artificial intelligence for servicing of a technical object. Neural Comput. Appl. 2013, 22, 955–968. [Google Scholar] [CrossRef]
  33. Bednarek, M.; Dąbrowski, T.; Olchowik, W. Selected practical aspects of communication diagnosis in the industrial network. KONBiN 2019, 49, 383–404. [Google Scholar] [CrossRef] [Green Version]
  34. Szmel, D.; Zabłocki, W.; Ilczuk, P.; Kochan, A. Selected issues of risk assessment in relation to railway signalling systems. WUT J. Transp. Eng. 2019, 127, 81–91. [Google Scholar] [CrossRef]
  35. Jacyna, M.; Żak, J.; Gołębiowski, P. The EMITRANSYS model and the possibilities of its application for the analysis of the development of sustainable transport systems. Combust. Engines 2019, 179, 243–248. [Google Scholar] [CrossRef]
  36. Oleński, J. Economics of Information. The Basics; PWE: Warsaw, Poland, 2001. [Google Scholar]
  37. Dempster, A.P. Upper and Lower Probabilities Inducted by a Multi-valued Mapping. Ann. Math. Stat. 1967, 38, 325–339. [Google Scholar] [CrossRef]
  38. Shafer, G. A Mathematical Theory of Evidence; PUP: Princeton, NJ, USA, 1976. [Google Scholar]
  39. Pieczynski, W. Unsupervised Dempster-Shafer Fusion of Dependent Sensors. In Proceedings of the 4th IEEE Southwest Symposium on Image Analysis and Interpretation, Austin, TX, USA, 2–4 April 2000; pp. 247–251. [Google Scholar]
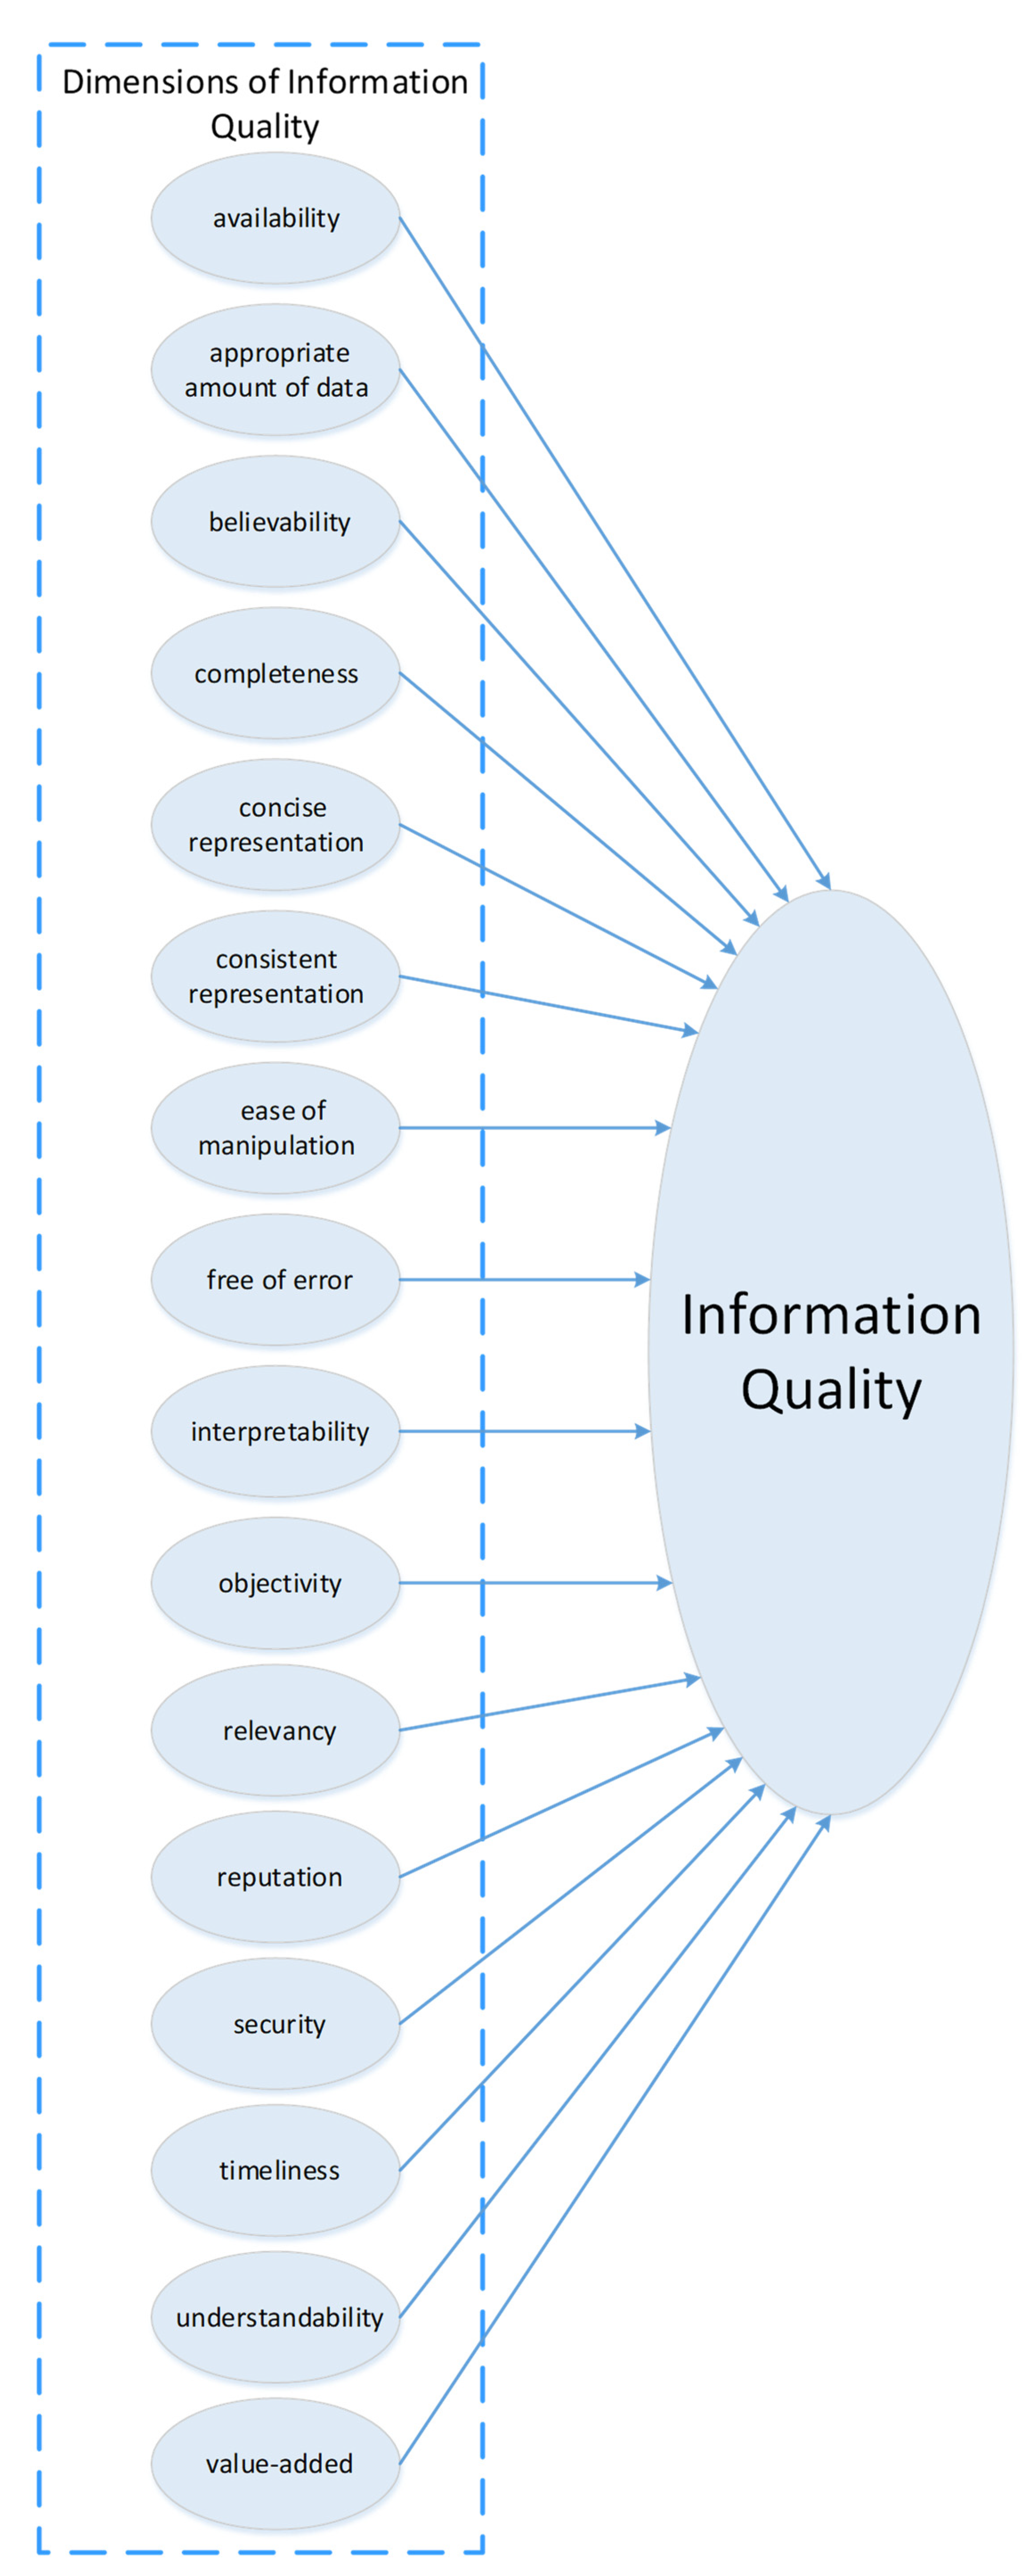
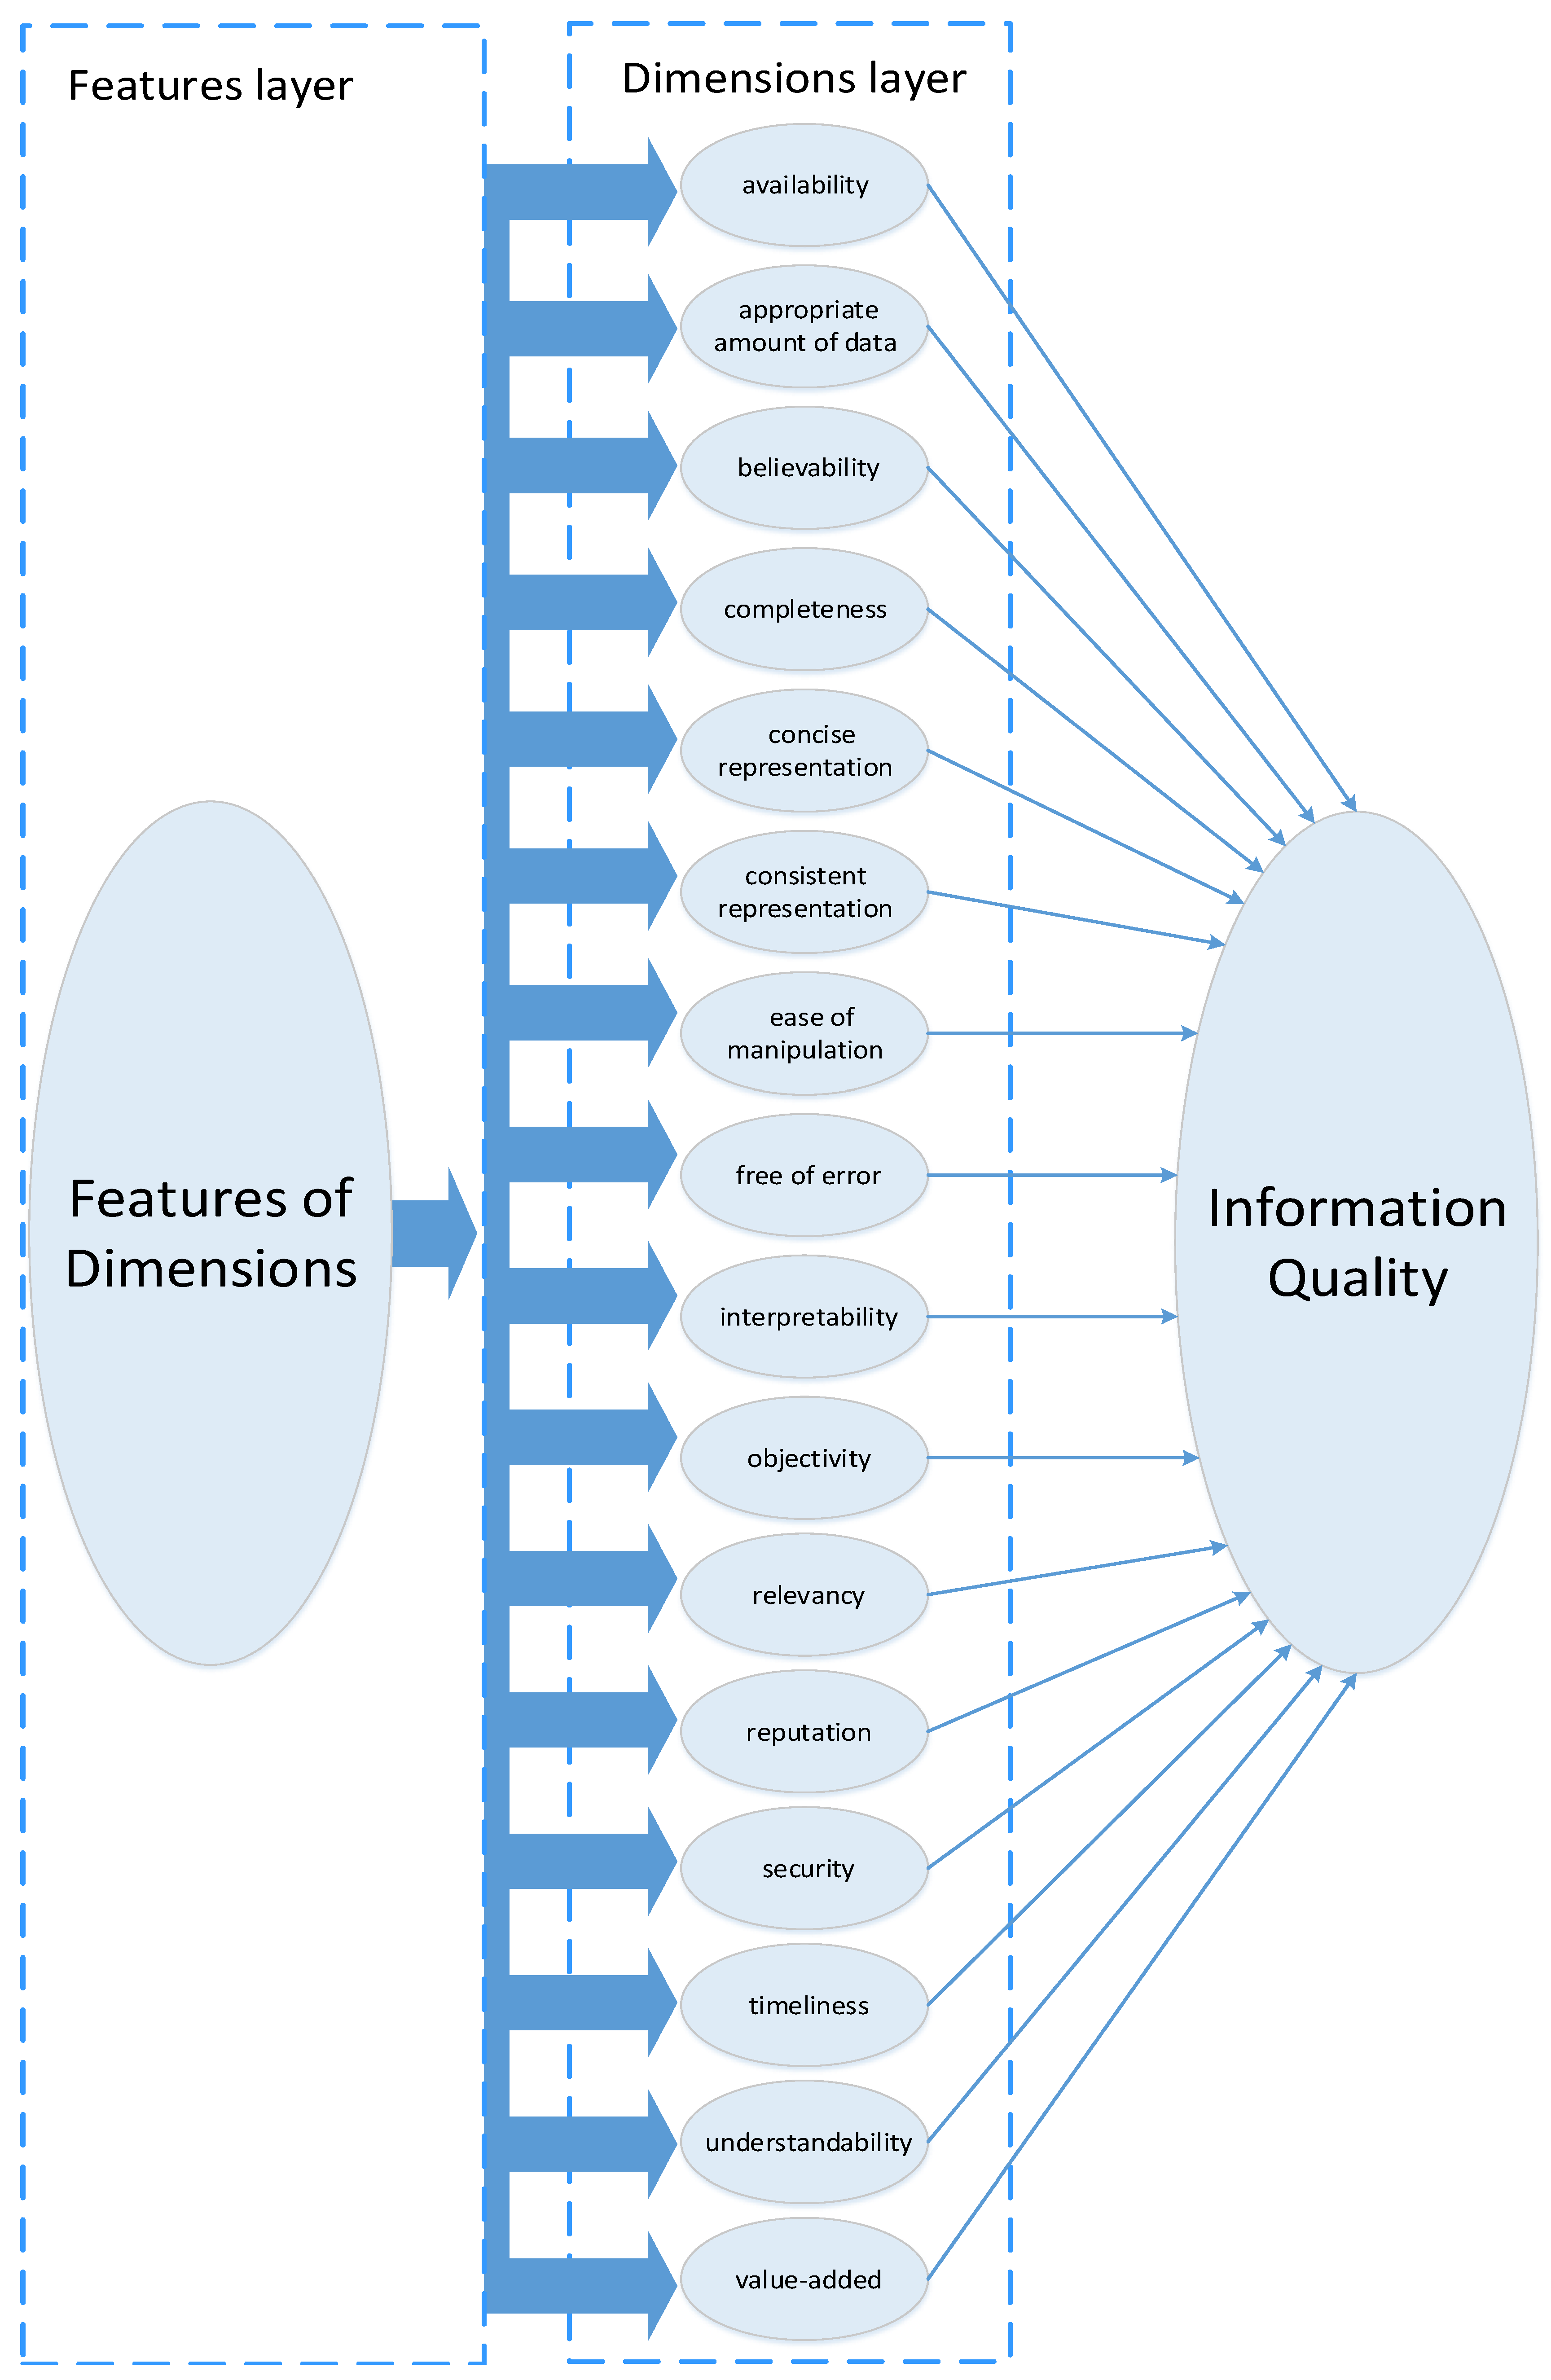
Figure 1. Improving quality as a pursuit of perfection, Δw1 = Δw2 = Δw3 and ΔIQ1 > ΔIQ2 > ΔIQ3 (own elaboration based on [7]).
Energies 14 05549 g001
Figure 2. Information quality dimensions. Own elaboration based on [7].
Energies 14 05549 g002
Figure 3. States related to registration and data transmission in an ICT system. Own elaboration based on [7,27,29].
Energies 14 05549 g003
Figure 4. A diagram of IQ model extension with its dimension features. Own elaboration.
Energies 14 05549 g004
Figure 5. A diagram showing dependencies between dimensions on the features layer. Own elaboration.
Energies 14 05549 g005
Figure 6. A diagram of IQ model extension. Own elaboration based on [7].
Energies 14 05549 g006
Figure 7. Flowchart on the basis of the described method. Own elaboration.
Energies 14 05549 g007
Figure 8. Model of ICT system quality as used in the example. Own elaboration.
Energies 14 05549 g008
Figure 9. Model of IQ state e1. Own elaboration.
Energies 14 05549 g009
Figure 10. Model of IQ dimension e1c. Own elaboration.
Energies 14 05549 g010
Figure 11. IQ dependency graph as a function of one of the IQ features, e1ca. Own elaboration.
Energies 14 05549 g011
Figure 12. IQ dependency graph as a function of one of the IQ features, e1cb. Own elaboration.
Energies 14 05549 g012
Table 1. Quality dimensions. Based on [7].
No.Name of the DimensionDimension’s Interpretation
1Availability (Dav)This dimension determines the possibility of exploiting the ICT element on demand in a given time and by using an authorized process. This dimension is directly related to the security of information.
2Appropriate amount of data (Daad)This dimension determines what amount of data are appropriate to enable task execution and simultaneously indicates that the given amount is sufficient and that more data could decrease the quality of information.
3Believability (Dbel)This dimension determines the degree to which information reflects reality. It can also be related to the believability of the source of information.
4Completeness (Dcom)This dimension determines whether the data are sufficient to execute a particular task.
5Concise representation (Dccr)This dimension determines the degree to which data are represented.
6Consistent representation (Dcsr)This dimension determines the degree to which data are represented with the same size.
7Ease of manipulation (Deom)This dimension determines how easy it is to process these data for different task applications.
8Free of error (Dfoe)This dimension determines to what degree data are free of error.
9Interpretability (Dinter)This dimension determines the degree to which data are clear and represented in appropriate languages and symbols.
10Objectivity (Dobj)This dimension determines to what degree data are not subjective, i.e., limited to a narrow scope.
11Relevancy (Drelev)This dimension determines the degree to which the data are applicable to this particular task.
12Reputation (Dreput)This dimension determines the degree to which data are evaluated for their source and content.
13Security (Dsec)This dimension determines the limitation of data access in order to ensure security and protect from unauthorized access.
14Timeliness (Dtim)This dimension determines the degree to which data are available on time in order to execute the task.
15Understandability (Duns)This dimension determines the data’s understandability.
16Value-added (Dvadd)This dimension determines the advantages of exploiting data and whether the data are beneficial for task execution.
Table 2. Values assigned to the quality dimension features for the model presented in Figure 9. Own elaboration.
ObservationValue
e1ca0.99
e1cb0.001
e1cc0.002
e1cd0.0005
Table 3. Observation e1ca.
m2 ({e1ca}) = 0.99
m2 (Θ) = 0.01
m2 ({e1ca})m2 (Θ)
m1 (Θ)m3 ({e1ca})m3 (Θ)
Table 4. Observation e1cb.
m4 ({e1cb}) = 0.001
m4 (Θ) = 0.999
m4 ({e1cb})m4 (Θ)
m3 ({e1ca})m5 ({Ø})m5 ({e1ca})
m3 (Θ)m5 ({e1cb})m5 (Θ)
Table 5. Observation e1cc.
m6 ({e1cc}) = 0.002
m6 (Θ) = 0.998
m6({e1cc})m6 (Θ)
m5 ({Ø})m7 ({Ø})m7 ({Ø})
m5 ({e1cb})m7 ({e1cb})m7 ({e1cb})
m5 ({e1ca})m7 ({Ø})m7 ({e1ca})
m5 (Θ)m7 ({e1cc})m7 (Θ)
Table 6. Observation e1cd.
m8 ({e1cd}) = 0.0005
m8 (Θ) = 0.9995
m8({e1cd})m8 (Θ)
m7 ({Ø})m9 ({Ø})m9 ({Ø})
m7 ({e1cc})m9 ({e1cc})m9 ({e1cc})
m7 ({e1cb})m9 ({e1cb})m9 ({e1cb})
m7 ({e1ca})m9 ({Ø})m9 ({e1ca})
m7 (Θ)m9 ({e1cd})m9 (Θ)
Table 7. Values assigned to the quality dimensions for the model presented in Figure 8. Own elaboration.
ObservationValue
e1a0.88
e1b0.91
e1c0.9801
Table 8. Values assigned to the information states for the model presented in Figure 7. Own elaboration.
ObservationValue
e10.99944
e20.98
Publisher’s Note: MDPI stays neutral with regard to jurisdictional claims in published maps and institutional affiliations.

