Article

Material Flux through an Innovative Recycling Process Treating Different Types of End-of-Life Photovoltaic Panels: Demonstration at Pilot Scale

by
Flavia Carla dos Santos Martins Padoan
1,
Pier Giorgio Schiavi
1,
Gianmaria Belardi
2,
Pietro Altimari
1,
Antonio Rubino
1,* and
Francesca Pagnanelli
1
1
Department of Chemistry, Sapienza University of Rome, Piazzale Aldo Moro 5, 00185 Rome, Italy
2
Department of Physics, Tor Vergata University of Rome, via della Ricerca Scientifica 1, 00133 Rome, Italy
*
Author to whom correspondence should be addressed.
Energies 2021, 14(17), 5534; https://doi.org/10.3390/en14175534
Submission received: 28 July 2021 / Revised: 27 August 2021 / Accepted: 31 August 2021 / Published: 4 September 2021

Abstract

:
A quantitative assessment of the material flux emerging from a pilot plant for the treatment of end-of-life photovoltaic panel waste was reported. The process included the manual dismantling of aluminum frames, mechanical treatment for size reduction, and the physical treatment of the milled materials for the release of coarse glass from the encapsulant polymer. Demonstration activities were performed using 1 ton of Si-, 1 ton of CdTe-, and 1 ton of CIGS-based photovoltaic panels (investigated separately), confirming the ability of the process to treat different photovoltaic technologies. The characterization of the input materials was performed and compared with previous literature data. The major bottleneck in the definition of an effective process option for the treatment of different panel technologies was emphasized by the high heterogeneity reported. Mass balances for the proposed process were derived by the recovered material flow. It was highlighted that in processes based on mechanical treatments, producing predominantly coarse fractions allows for the facile separation of most of the valuable components. In this perspective, the present work offers further insights into the design of recycling process to reach increased profitability/sustainability, especially considering the distributions of valuable metals in the process products.

1. Introduction

Photovoltaic panels (PVPs) for electric power generation represent one of the alternatives to exploit renewable energy sources, preventing environmental issues deriving from the use of fossil fuels. Considering the estimated global power generation capacities hand in hand with the actual and future energy needs, solar power is the one able to guarantee energy production on a terawatt (TW) scale [1]. Accordingly, electric power generation through photovoltaic technologies has become one of the most exploited alternatives, as demonstrated by the fast PVP market growth registered in recent decades [2]. Leader countries in photovoltaic power generation capacities are in the order of: China, Japan, the USA, and Germany [3]. In some countries, photovoltaic spread has also been facilitated by government incentives, such as in Italy where PVP installation increased 36 times during the 2008–2015 period [4], leading to a power generation capacity of 19.3 MW in 2017, just behind Germany in Europe [3].
Existing photovoltaic technologies are classified into three main generations: (i) mono- and poly-crystalline silicon (c-Si); (ii) thin film amorphous silicon (a-Si), cadmium telluride (CdTe), and copper indium gallium diselenide (CIGS); (iii) emerging technologies such as photovoltaic concentrators, dye-sensitized solar cells, organic cells, and hybrid cells [5]. However, PV modules based on crystalline silicon represent the technology that has dominated the market to date [6,7]. Regardless of the classification above, the mean time of life of PVPs actually on the market is estimated to be approximately 25 years [4]. In this perspective, simulations of global waste production predicted a large amount of end-of-life photovoltaic panels (EoL-PVPs)—specifically, 9.57 million tons by 2050 [8], with the EU at 1.5 million tons within 2040 [9]. Such projections led the European Union to include EoL-PVPs in the directive 2012/19/EU, which regulates Waste of Electrical and Electronic Equipment (WEEE) [10]. This directive set recycling and recovery rates at 80 and 85%, respectively, starting from 2018 [10].
For such PV technologies, the main component of the “sandwich” (i.e., PV module structure [11]) is represented by the glass top cover, ranging from 76 to 90% of the entire panel weight [4]. It could be concluded that accounting glass as the main recycling goal would be enough alone to meet EU directive rates. On the other hand, designing sustainable EoL-PVP recycling processes with some further requirements should be considered. For instance, there is a need to recycle toward high-value products [12] to improve the sustainability/profitability of the overall recycling process. When mechanically reducing PVPs, the glass top cover is recovered in different granulometric fractions: high-value clean coarse glass (>3 mm), exploitable in manufacturing new panels as well, or fine glass powders (<3 mm), which conversely can be reused only for low-value applications as compared to the original one (e.g., as inert matrixes in building material production).
In this perspective, although glass is the main component of the panels, the recovery of fractions containing valuable metals (e.g., Ag, Cu, In, Ga) should be considered in designing sustainable recovery process options, especially seeing to the economic sustainability of the process hand in hand with the next forecasts on the volumes of these wastes [8,9]. Two considerations can be made on this: (i) even though no specific target is fixed yet for metal recycling, not recycling these metals would mean losing resources (as secondary raw materials), which eventually end up in landfill; (ii) apart from the lack of specific targets in the directive, effective metal recycling is mainly hindered by the extreme heterogeneity of photovoltaic modules on the market due to both PV technology types and specific producers’ recipes. This makes it difficult to assess the definite compositions for such wastes. In fact, available literature data showed a wide range of concentrations concerning metals, limiting even a preliminary estimation of the economic figures in designing EoL-PVP recycling processes [9]. At the same time, considering the heterogeneity of EoL-PVP wastes, to the authors’ knowledge none of the proposed processes to date would be specifically designed for treating different types of panel technologies in the same plant. Generally, only specific types/technologies are addressed. This is a further aspect that would negatively affect the overall sustainability of the designed process. For instance, most of the processes developed to date for the treatment of c-Si EoL-PVPs are mainly focused on Si recycling by thermal and/or chemical operations [13]. At the same time, the concomitant Si overproduction determining production cost reductions [2] makes such recycling processes useless to reach both regulation targets and overall process sustainability.
In this scenario, the Photolife process [14] was developed with the main aim to guarantee the treatment of different EoL-PVP wastes and was demonstrated at pilot scale with an automated pilot plant within the activities of the EU Photolife project [15]. Products were high-grade glass, metallic filaments, Al frames, glass powder, and a polymeric residue containing the PV cell. The treatment of this latter product was further addressed successively and validated at lab scale [11]. Two main PVP technologies were treated during the demonstration activities of the Photolife project—silicon-based and compound PV technologies such as CdTe and CIGS [16]. The main differences between these technologies are metals constituting the photoactive elements [17]. Apart from this, other metals are the aluminum of the external PVP frame (where present) and metallic filaments applied on the photovoltaic cells’ interconnections (along the module) made up of copper, lead, and tin links, and a silver/aluminum-based conductive paste.
In this scenario, the specific novelty of this work is the quantitative assessment of the material fluxes emerging from the demonstration activities on the pilot plant. These were performed treating 3 tons of EoL-PVP wastes including both different PVP technologies listed above and different producers. The characterizations performed (as a picture of the EoL-PVP wastes’ heterogeneity) gave a preliminary evaluation on the destiny of metals in the various stages of the designed process. In this perspective, preliminary indications on how to improve recycling performances can be derived, as for the optimization/development of innovative and flexible processes toward increased profitability/sustainability.

2. Materials and Methods

2.1. EoL-PVP Wastes Treated in Photoloife Process

Three tons of different types of end-of-life photovoltaic panels were furnished by the company Eco Power Ltd. for the demonstartion activities of the Photolife project: specifically, 1 ton of end-of-life Si- (monocrystalline, polycrystalline, and amorphous), 1 ton of CdTe-, and 1 ton of CIGS-based panels. Table 1 summarizes EoL-PVP wastes assessed in the present work.

2.2. Characterization of the Input Material

Samples of the panels were pre-cut and crushed using a hammer crusher (RETSCH SM200), located at the Institute of Environmental Geology and Geoengineering of the National Research Council (IGAG-CNR) in Montelibretti (Rome, Italy). The chemical characterization was performed by mineralization of the shredded samples of panels with aqua regia (S/L ratio equal to 1:10) in microwave oven at 220 °C for 1 h (ETHOS 900, Milestone, Rosedale Auckland, New Zealand). The metal concentrations were determined employing an Atomic Absorption Spectrophotometer (AAS, contrAA® 300-Analytik Jena AG, Jena, Germany) with a flame atomizer fed with a C2H2/air mixture. Calibration solutions for the investigated metals were prepared employing a multi-standard solution (Merk Millipore 1000 mg/L HNO3 sol, Burlington, MA, USA).

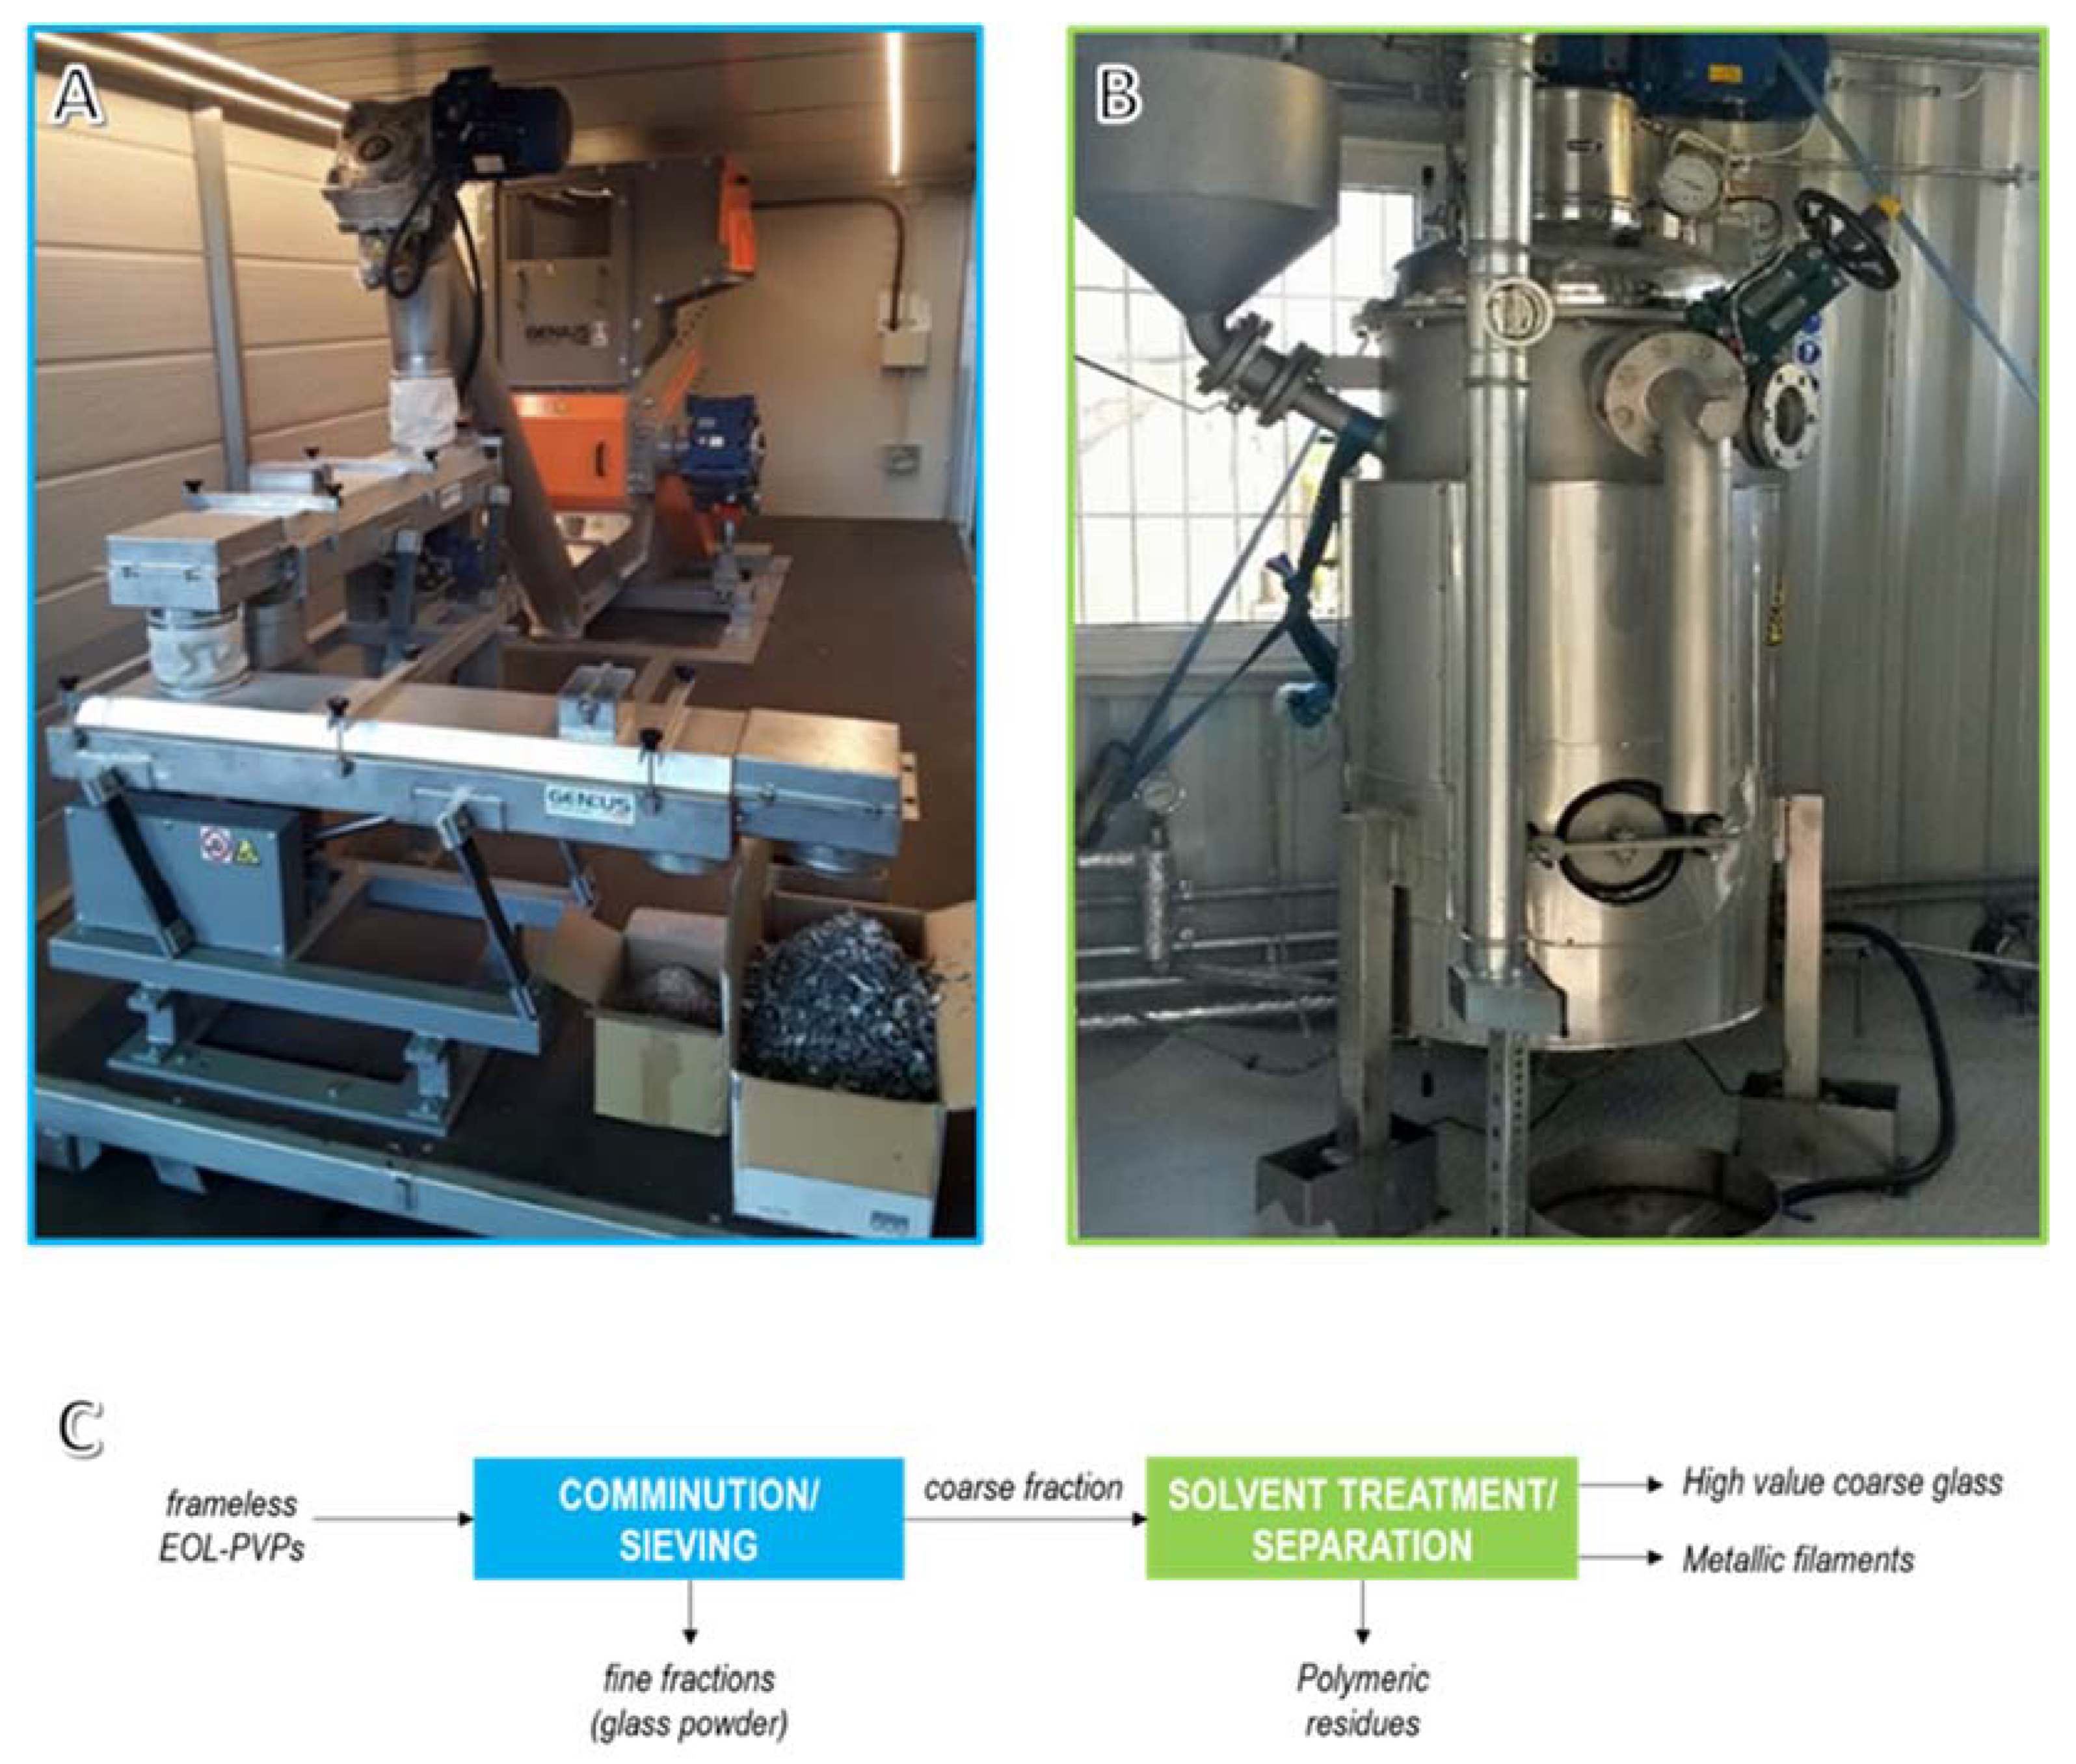
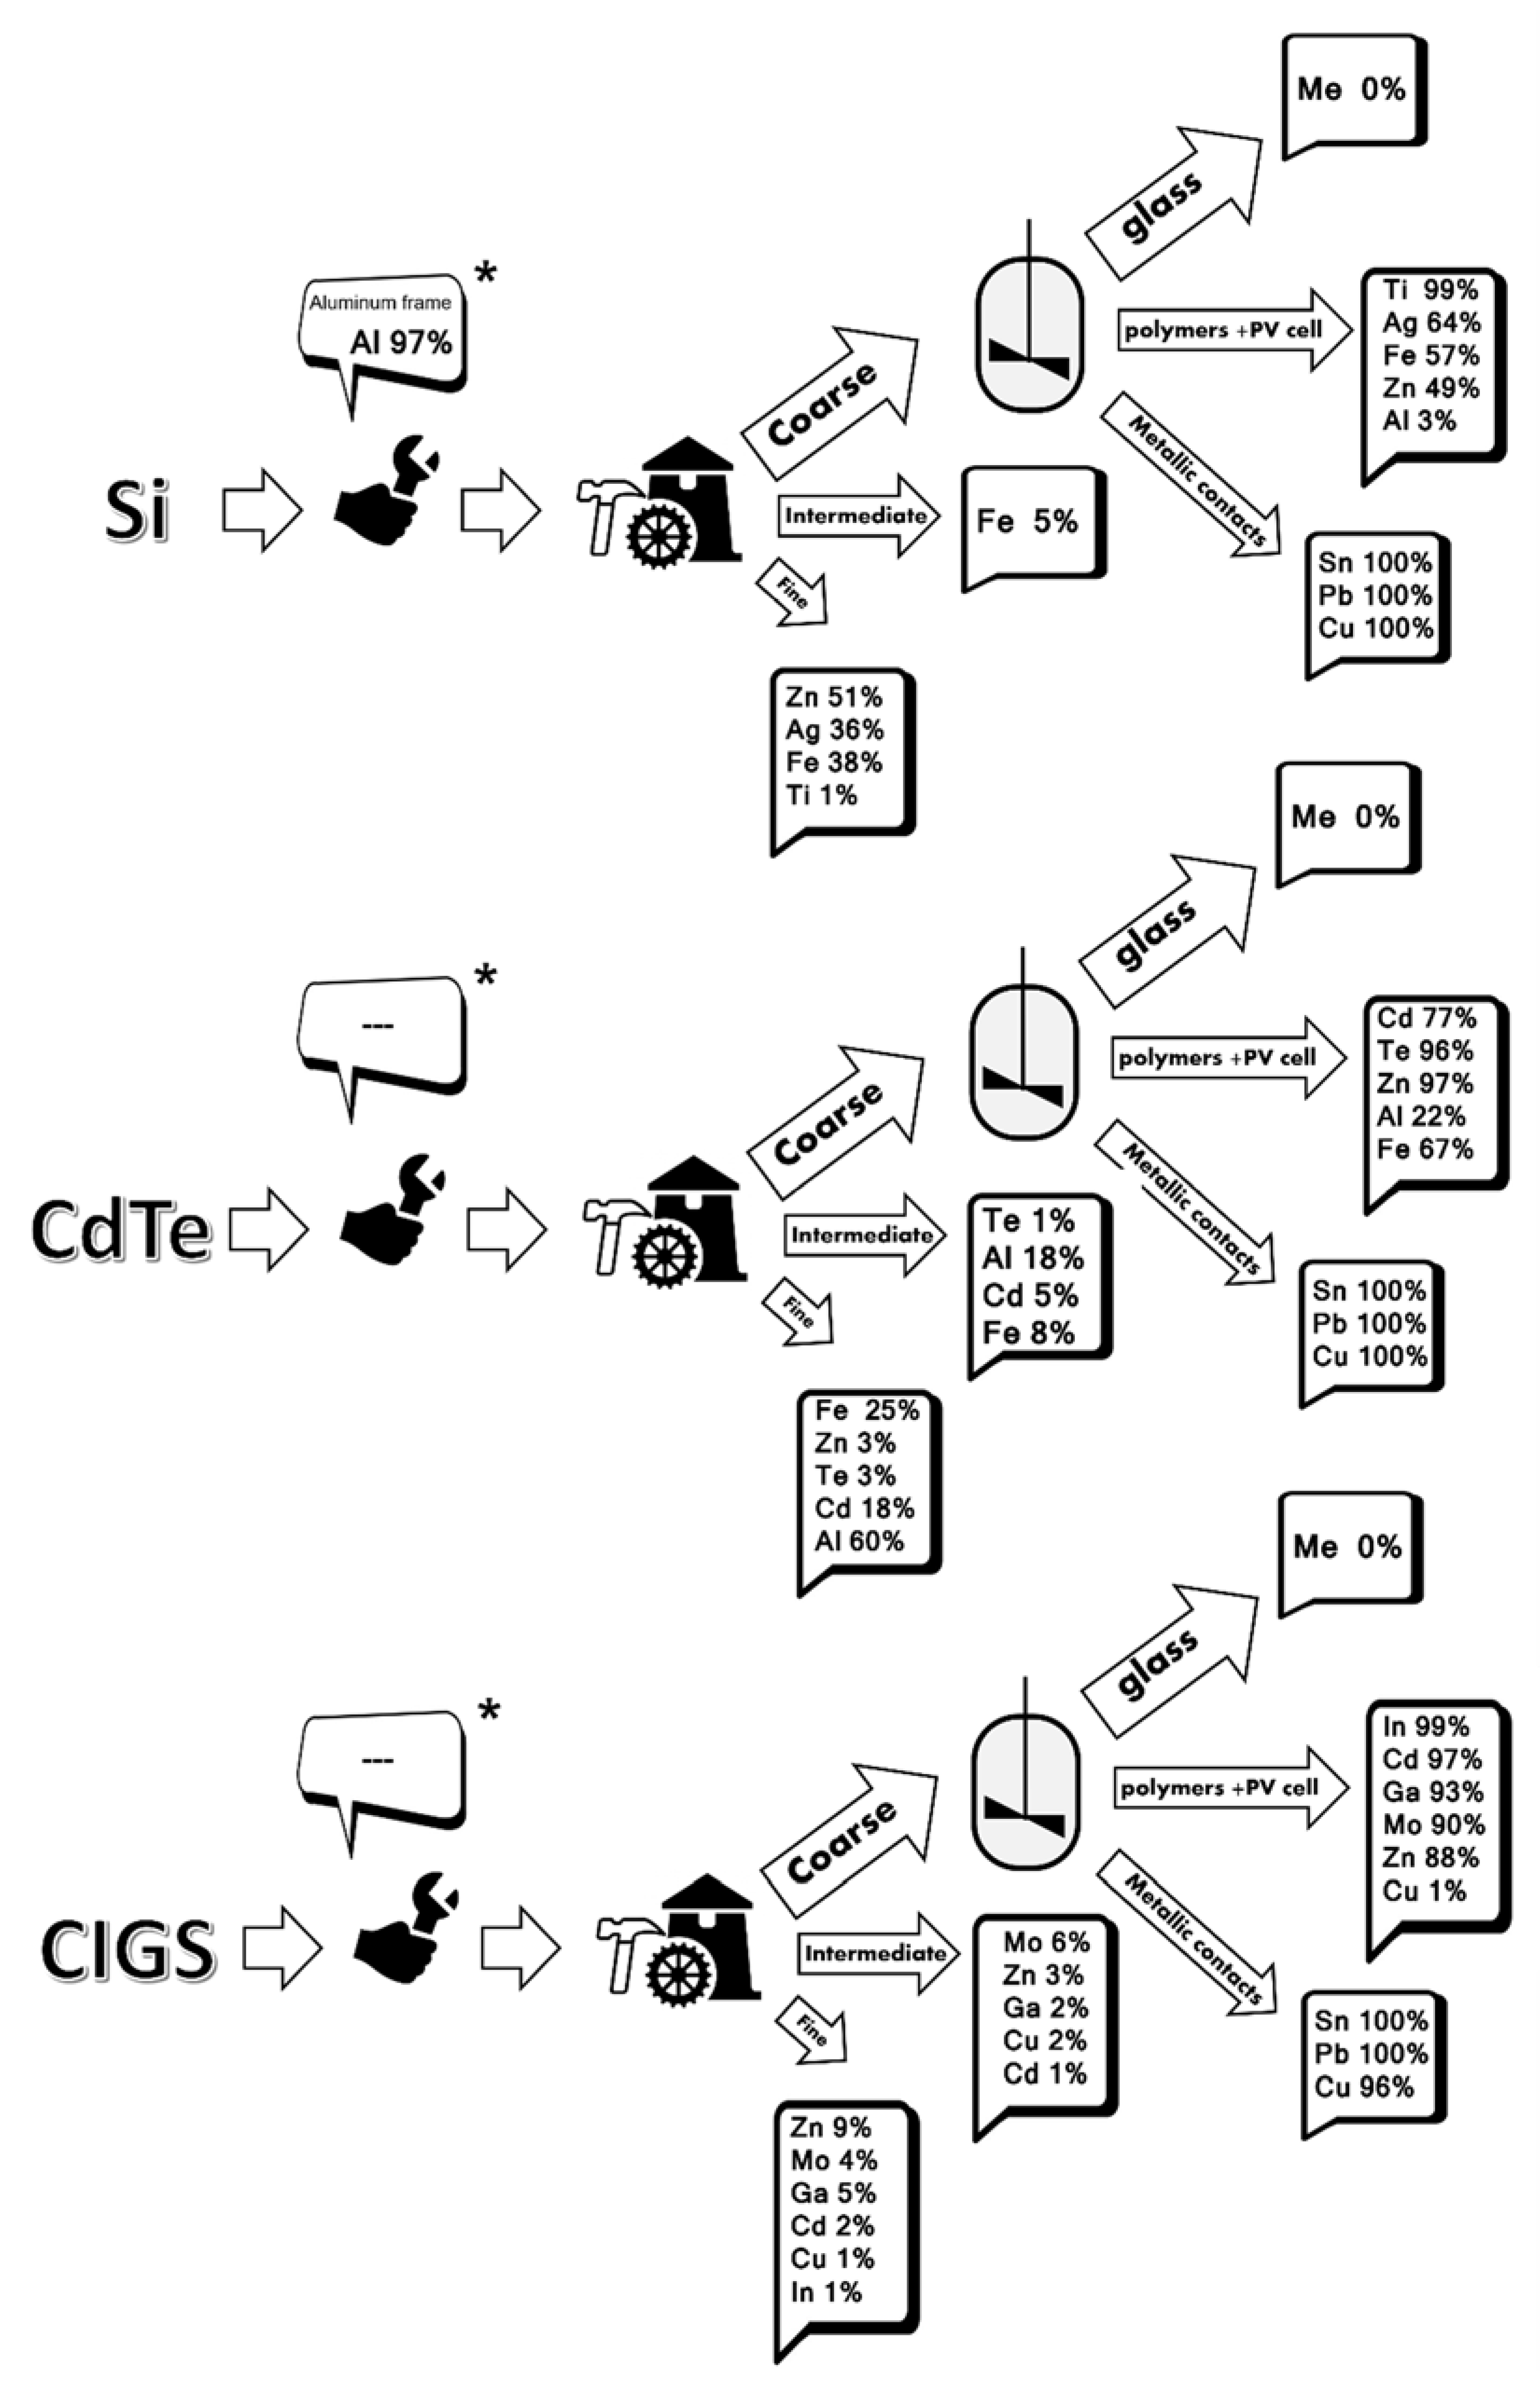
2.3. Photolife Recycling Process

The Photolife recycling process is briefly summarized in the block diagram of Figure 1C.
The process included the preliminary manual dismantling of Al frames (where present) and junction boxes, prior to being mechanically treated by a specifically designed single shaft shredder unit (Shredder M101, Camec, Melbourne, Australia). Once the EoL-PVP wastes were shredded, the exiting milled materials were fed, through a cochlea, into a system consisting of two vibrating sieves. The following granulometric fractions were thus separated:
-
Coarse fraction: 3 < x < 20 mm;
-
Intermediate fraction: 0.5 < x < 3 mm;
-
Fine fraction: x < 0.5 mm.
The coarse fraction was further treated in a second prototype (Indeco Ltd., Cheshire, UK) using cyclohexane (liquid/solid ratio 6) under stirred conditions at 60 °C for 1.5 h treatment in order to detach the different layers glued together (i.e., glass, EVA, Tedlar®, metallic contacts, and PV cell materials). After solvent treatment, solids were separated from the liquid phase by an integrated sieving emerging from the reactor bottom. Following this, glass and metal contacts were separated from the polymeric residue, which included polymers (i.e., Tedlar® and EVA) and PV cell materials. Metallic contacts were successively separated from the glass fraction using a vibrating sieve. The polymeric residue was not automatically separated at this stage of the original Photolife process. This is why the weight of the Tedlar® fraction was assessed after manual separation.

2.4. Photoloife Process Product Characterization

Coarse, intermediate, and fine fractions from the mechanical section were chemically characterized after acid digestion of solid samples. The resulting leach liquors were analyzed by means of Atomic Absorption Spectroscopy following analytical methods just described above. The same was performed on the polymeric residue exiting the solvent treatment operation.
Solid samples were further characterized through Field Emission Scanning Electron Microscopy (FE-SEM, Zeiss AURIGA, RIchmond, VA, USA), equipped with an Energy Dispersive X-ray analyzer (EDX, Bruker Quantax, Billerica, MA, USA) for the elemental analysis. The Everhart–Thornley detector for secondary electrons was used.

3. Results and Discussion

3.1. Characterization of the Input Waste Material
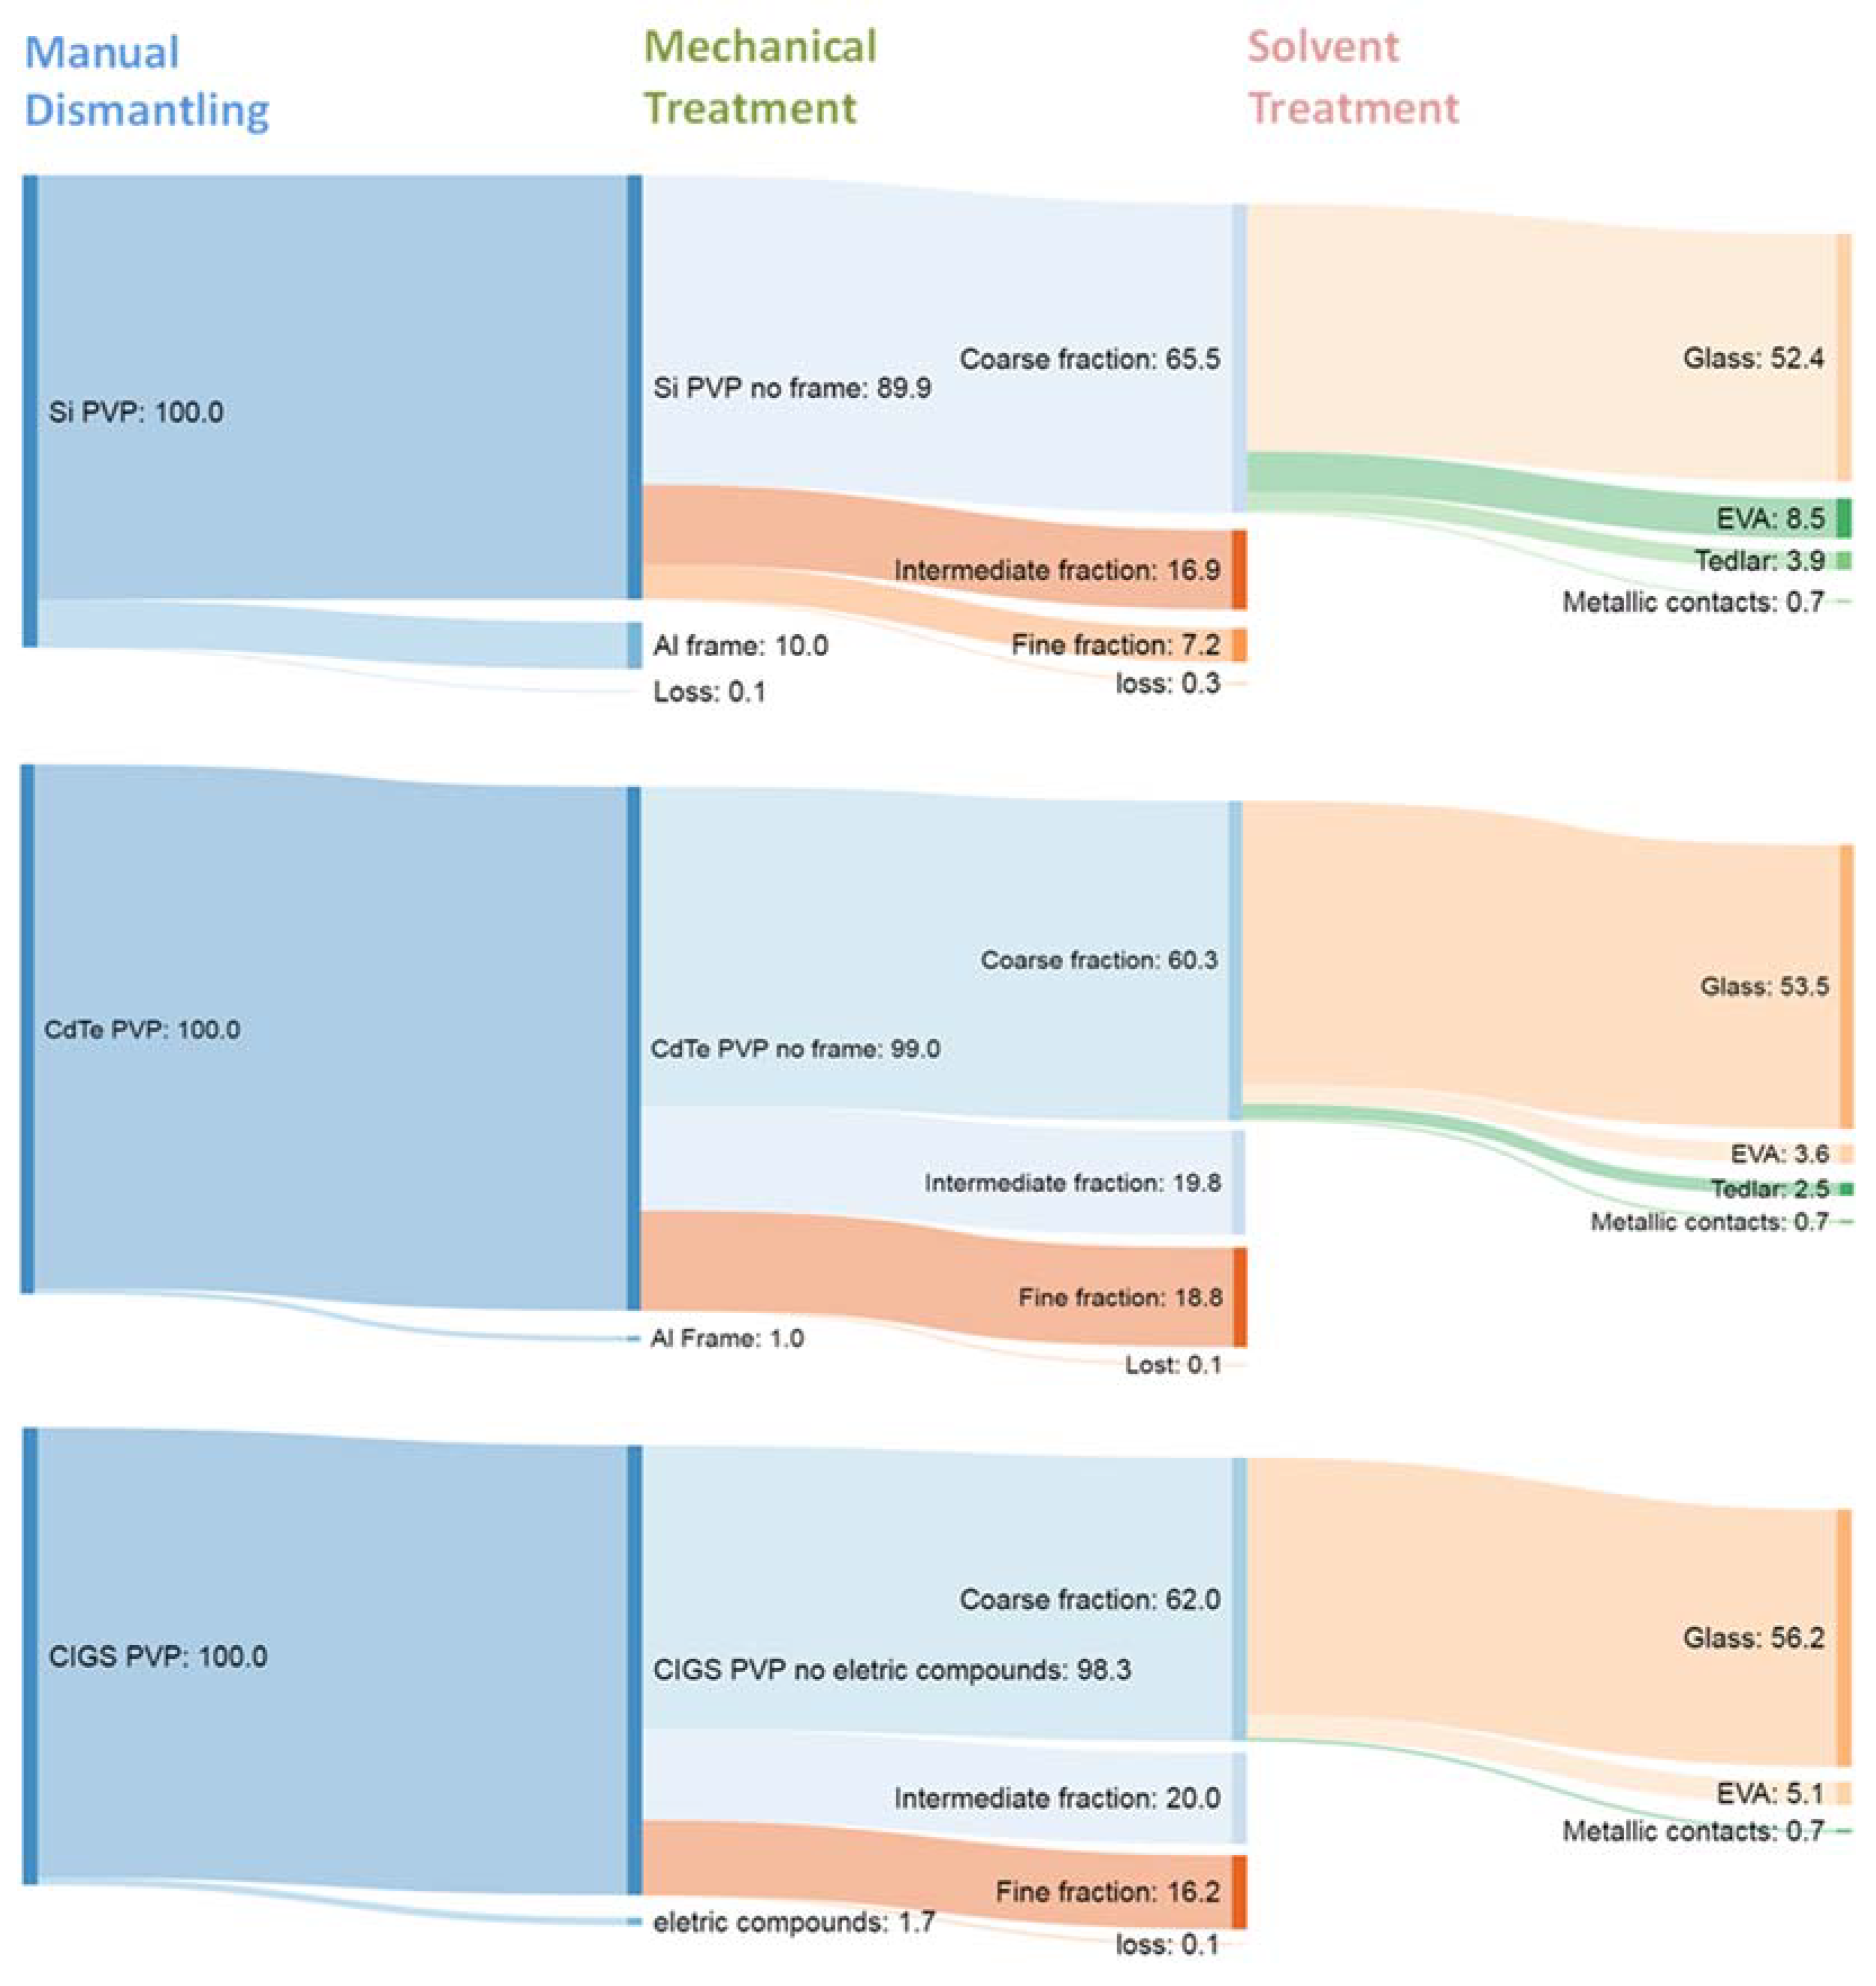
The characterization of the target metals for each EoL-PVP technology treated is shown in Table 2. Si-type panels presented higher concentrations of Al and Cu as compared to other technologies, in the order of 3000–4000 mg/kg, followed by Fe and Sn in the order of 400 mg/kg, attributable to metallic contacts, current collectors, and other connections. Ti was estimated at an average concentration of 187 mg/kg. Ag was estimated at an average concentration of 72 mg/kg. It is worth noting that silver is present only in the Si-based EoL-PVP technologies characterized in the present work. These latter metals can be addressed, respectively, to the antireflective material (based on TiO2) and the conductive paste along the PV cells.
In CdTe-type panels, cadmium and tellurium were quantified almost invariably in stoichiometric ratios, except for two specific manufacturers’ technologies where instead the Te content outweighed the Cd content.
In CIGS panels, Se was the most abundant, according to the following metal concentration order: Se > Mo > Zn = Cu = In > Ga > Cd.
The concentrations of metals estimated in the present work were compared to those available in the relevant literature, as shown in Table 3. A box plot representation of these data can be found in the Supplementary Materials (Figures S1–S3). It is worth noting at this stage that such comparison is based on different characterization methods. For instance, in the CdTe panels, some authors only consider the thin film for the quantification of metals [18], and others, for Si panels, only the wafer [19]. Accordingly, data reported in Table 3 are characterized by a high variability, not allowing for an easy correlation. Besides the characterization method, however, a major bottleneck in such definitions remains the extreme heterogeneity of the photovoltaic technology on the market as compared to the different manufacturers, whose evolution trend showed furthermore a decreased metal content [9]. This analysis would corroborate why among the available literature the general approach for sustainable EoL-PVP waste recycling is often focused only on specific PV or even manufactured technologies. On the other hand, giving detailed characterizations of wastes to be treated could help to optimize existing processes’ sustainability by flexible approaches allowing for the treatment of different PV types and technologies in the same plant.

3.2. Mass Balances

The mechanical treatment of EoL-PVP wastes resulted in three different fractions: coarse, intermediate, and fine fractions.
The mechanical section was specifically designed in order to maximize the production of coarse fractions, as shown by data reported in Table 4. Such experimental results do not include the manually disassembled parts (e.g., aluminum frame and junction box for Si-type panels). For Si panels, the mechanical treatment allowed the concentration of 73.1% of the milled materials in the coarse fraction. In the case of CdTe and CIGS panels, these values were lower, 61 and 63.1%, respectively. This is probably due to the higher fragility of the materials composing such thinner PVP technologies.
The material flow for each EoL-PVP technology is illustrated in Sankey diagrams summarized in Figure 2.
As a general trend, despite the treated EoL-PVP wastes, solvent treatment gave high-quality glass fractions, metallic filaments, and polymeric residues including Tedlar®, EVA, and PV cell fragments (Figure 3). As for the size of the glass (Figure 3A), the polymeric materials vary in size between 3 mm and 2 cm having been sieved (Figure 3C), while the metallic filaments have variable lengths and widths of the order of ~3 mm (Figure 3B). The recovered coarse glass can find high-value applications (i.e., solar grade glass), for instance, in the production of new PVPs, and metallic filaments can be directly recovered in pyrometallurgical plants as scraps of copper, while the polymeric residue is not automatically treated in the original Photolife process pilot. Anyway, the content of Tedlar® (100% recyclable material) estimated in the present work was assessed after manual separation from the polymeric residue (Figure 3D), giving a separated residue composed of aggregates of EVA and PV cell fragments (Figure 3E). The latter can be further treated for the recovery of valuable metals from the PV cell fragments [11].

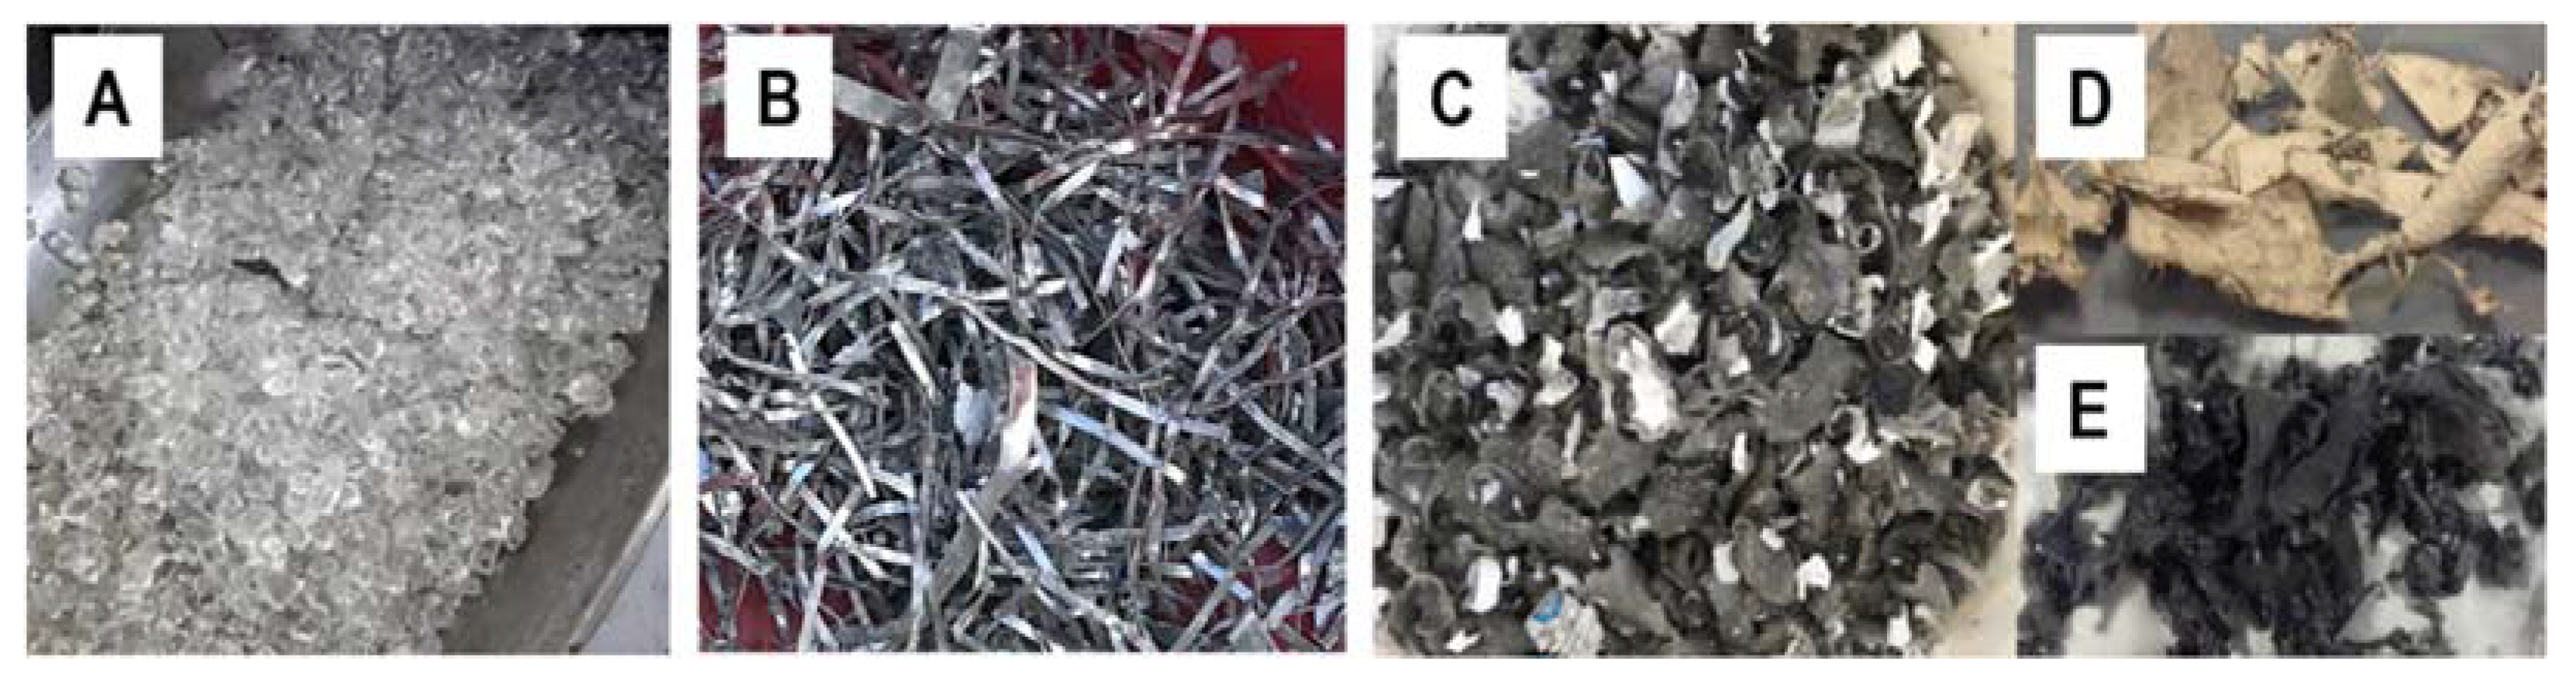
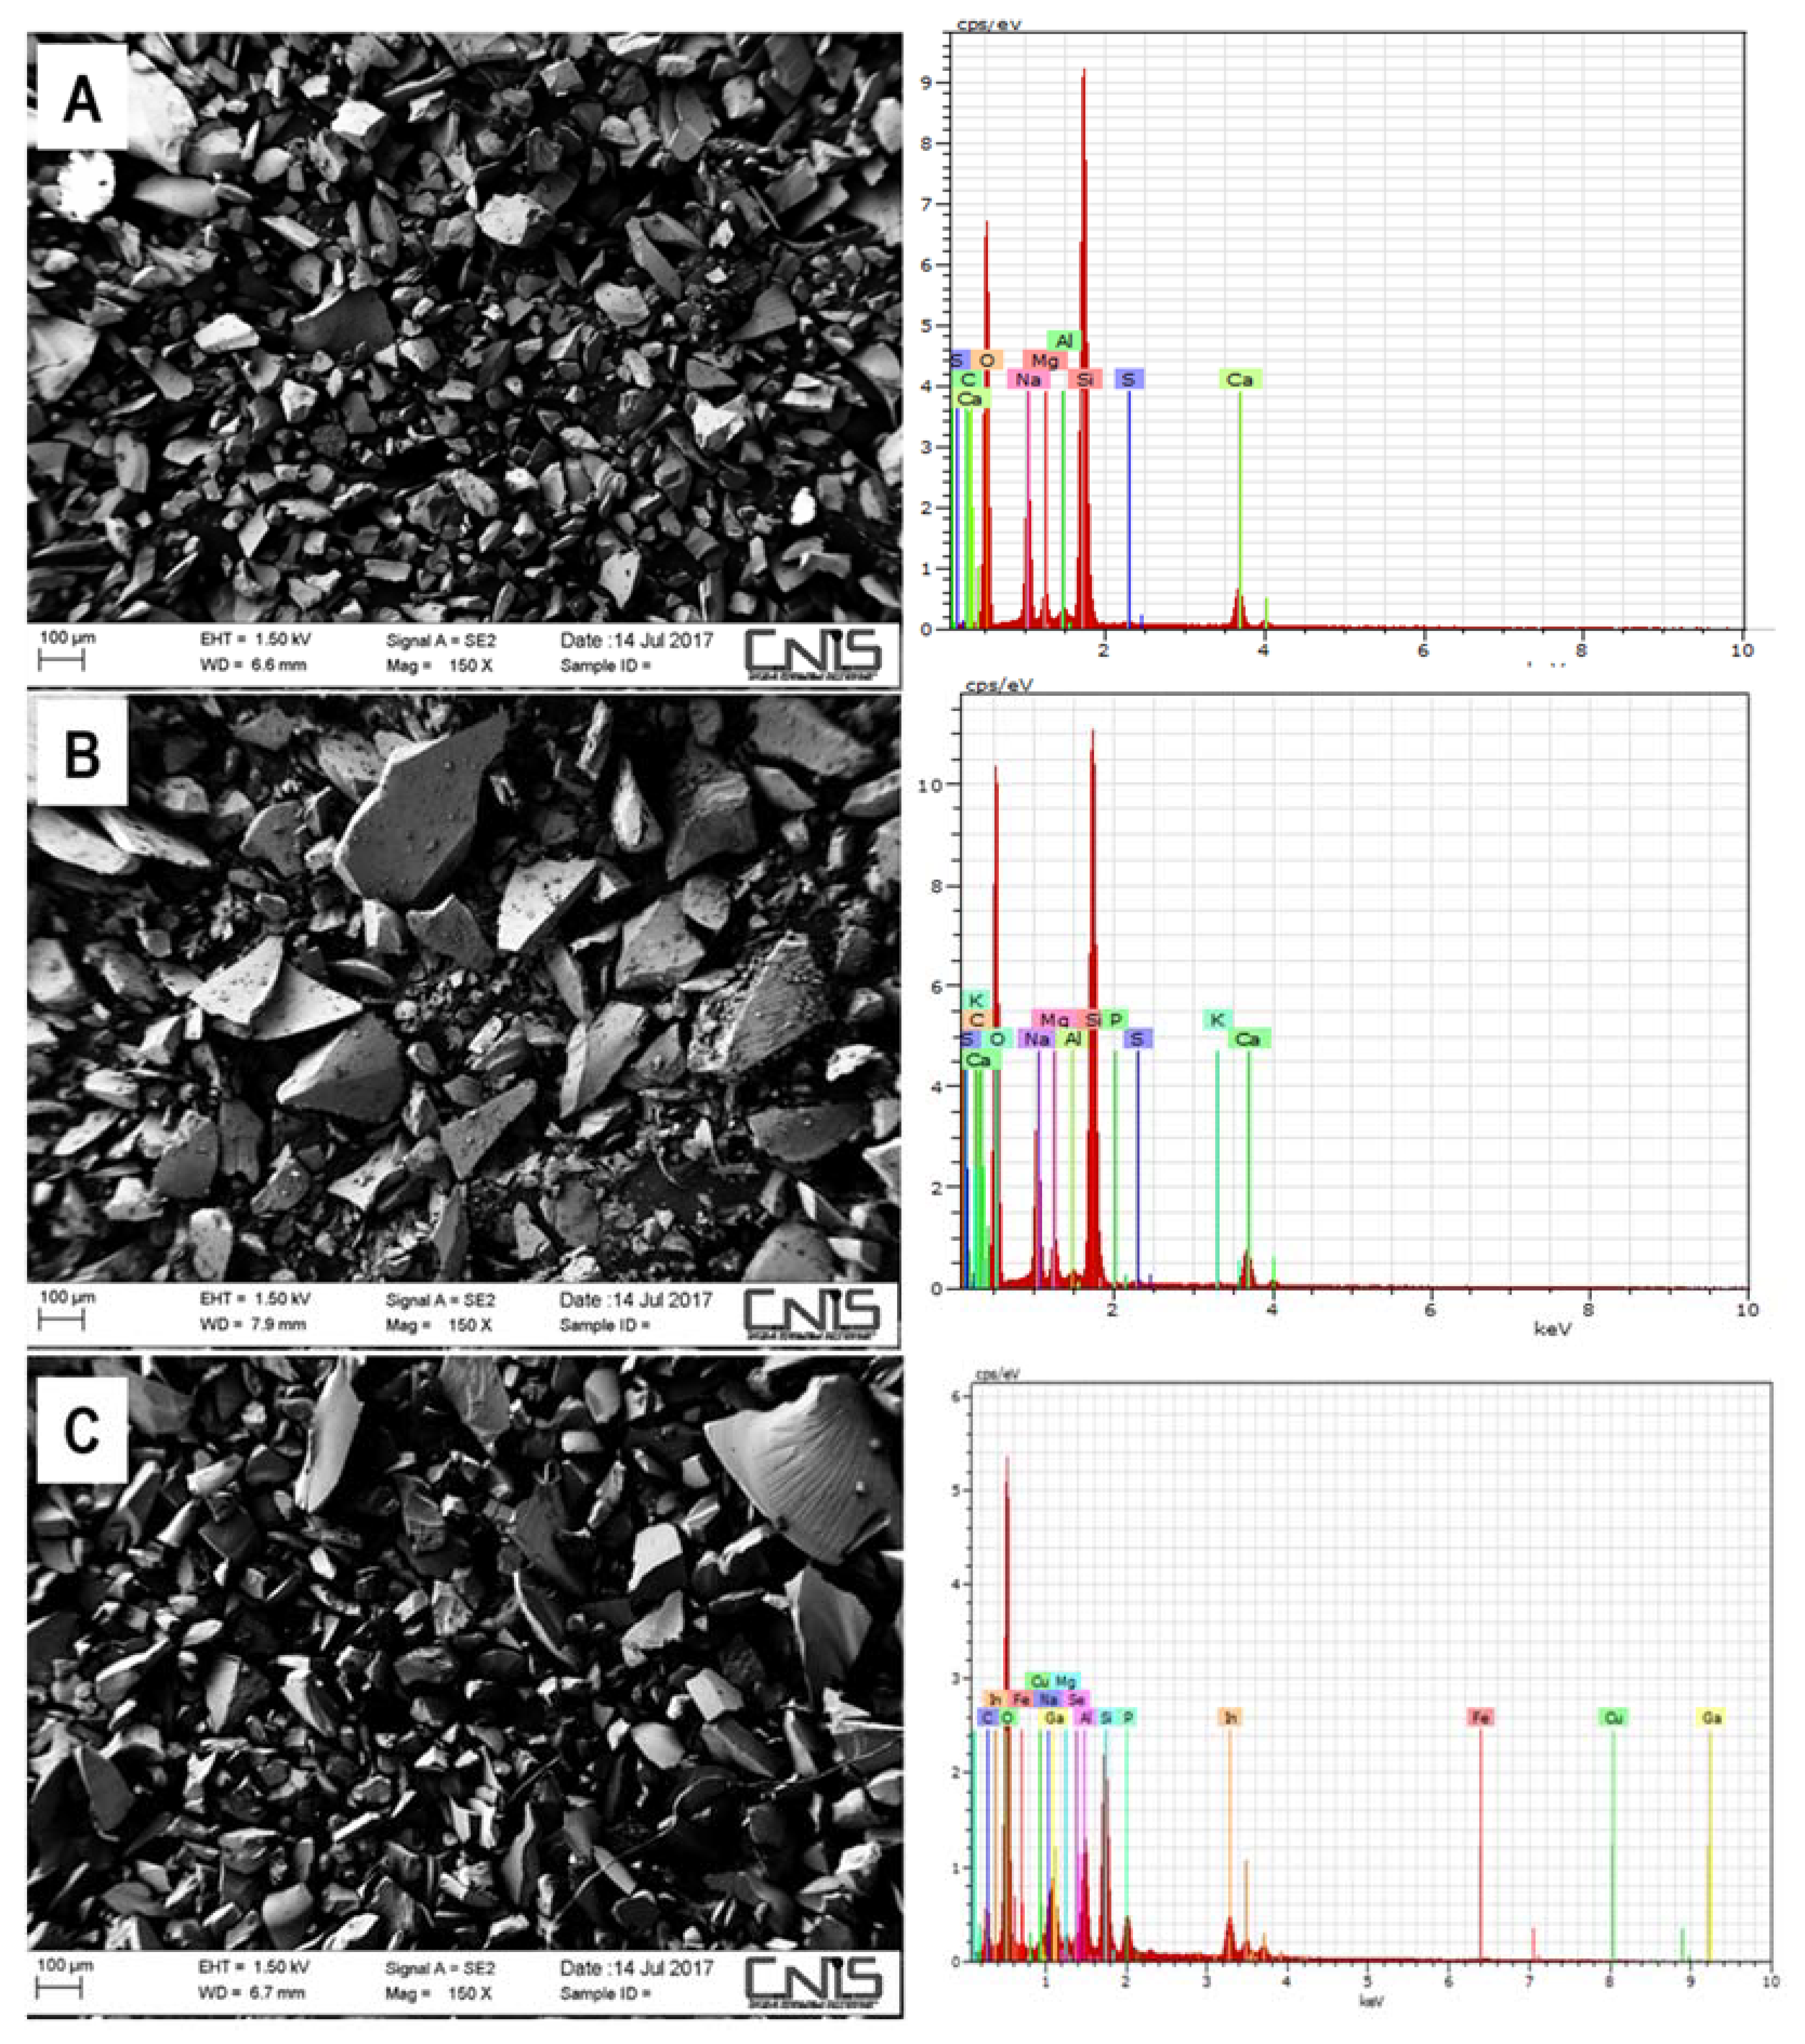
3.3. Characterization of Fractions Emerging from Mechanical Treatment

As stated above, the mechanical treatment of the Si, CdTe, and CIGS panels produced three different fractions: coarse, intermediate, and fine. Samples of such fractions were characterized as described in Section 2.4. The concentrations of metals estimated in the different fractions are shown in Table 5.
As shown, Ag was absent in CdTe- and CIGS-type panels, suggesting that conductive pastes containing silver are not common in these PV technologies. On the other hand, as emphasized in our previous work [20], when treating Si-type-based EoL-PVP wastes, silver recovery allows one to greatly enhance the process profitability. In large-scale plants, this aspect would contribute to the overall process sustainability as well [20].
Higher metal contents were found in fine fractions almost invariably (Table 5). This preliminarily indicates that in the fine glass, which is the main component of the fine fractions, their presence can be addressed as the content of impurities. The higher Al content for Si- and CdTe-type panels in the coarse fraction can be addressed to current collectors (Figure 3B). For CIGS-type panels, a higher content of Cd, In, Ga, and Mo was detected in the coarse fraction. Remarkably, these latter results indicate that most of the metals composing the PV cell are concentrated in the coarse fraction. This confirms the effectiveness of the adopted strategy in concentrating the most valuable elements in the coarse fractions (i.e., solar grade glass and valuable metals of the photoactive elements).
A further (qualitative) characterization was performed by means of FE-SEM/EDX (punctual analysis) on the fine fractions (Figure 4 and Table S2 in Supplementary Materials). Elemental analysis revealed that the fine materials contain elements such as Ca, Na, Al, Mg, and Si, with O and C invariably detected for the different EoL-PVP technologies. The corresponding oxides together with sodium carbonate are commonly present in glass composition. On the other hand, a more detailed analysis suggested that the presence of metals can be addressed in a small part to the PV cell fragments as well. This is confirmed, for instance, considering the Ga and In detected in the CIGS fine fraction (Figure 4C and Table S2 in Supplementary Materials).
This emphasizes the low value of such fine glass, having a low metal content due to the PV cell fragments being addressable only as an impurity. Furthermore, in the case of fine fractions from CdTe (Table 5), the presence of Cd implies environmental concerns with it being a hazardous metal. On the other hand, for CIGS, In content losses in such fine fractions (Table 5) imply the missed recovery of CRMs (Critical Raw Materials).

3.4. Overall Metal Distribution in Different Fractions Emerging from Photolife Process

The Photolife project produces several fractions recoverable in different stages of the process. The preliminary manual disassembly allows for the recovery of the aluminum frames where present. The mechanical treatment generated three different fractions, according to the granulometric distribution in Table 4. The coarse fraction, in turn, was treated with solvent in the physical process, producing solar grade glass, metal contacts, and polymer fractions consisting of EVA/Tedlar® and PV cell fragments.
As stated above, by the analysis of the metals’ distribution among the different fractions, the mapping of the photovoltaic cell elements can be addressed. To this purpose, Figure 5 summarizes the metal distributions among the different products for the different PV technologies treated.
For instance, considering Si-based technologies, with Si being the main component of both the glass and the photoactive material, in order to address the PV cell distribution Ag was identified as a reference metal [9]. This is because Ag is present in the conductive paste used for the metallic contacts along the PV cell. As shown (Figure 5, Si), Ag was detected only in two products: as an impurity metal in the finest fraction exiting the mechanical treatment and in the coarse polymeric fraction after exiting the solvent treatment unit. For CdTe-type panels, the two main elements addressing the PV cell distribution, Cd and Te, were found in the coarse fractions as in the previous case, while a further content was detected also in the intermediate fraction exiting the mechanical treatment (Figure 5, CdTe). The same distribution was addressed for In and Ga referring to CIGS technologies (Figure 5, CIGS).

4. Conclusions

The characterizations performed offered a quantitative assessment of the material fluxes emerging from a pilot plant designed for the treatment of different kinds of EoL-PVP wastes. This would be helpful for process optimization when mechanical treatments of the treated wastes are performed, addressing the metals’ distribution among the different recovery fractions.
With the process being purposefully designed for the treatment of different photovoltaic technologies, demonstration activities were performed on EoL-PVP wastes including 1 ton of Si-, 1 ton of CdTe-, and 1 ton of CIGS-type panels (treated separately in the same plant).
The characterization of input materials and mass balances defining material flows in different stages of the recycling process allowed us to define the distributions of metals within the recovered fractions. This was emphasized as the most valuable metals composing the different PV technologies were concentrated in two main fractions, namely the fine fractions exiting the mechanical treatment and the polymer fraction recovered by treating the coarse fractions with the solvent. Only for CdTe and CIGS, interesting metals were found in the intermediate fractions as well. Referring to the dominant technology on the market to date, mechanically treating Si panels allowed us to concentrate most of the valuable metals in the coarse fraction. In view of this, even though metals are not enough alone to reach targets set by the relevant regulation, their effective separation and recycling can be used as a tool to enhance the overall process profitability/sustainability.

Supplementary Materials

The following are available online at www.mdpi.com/article/10.3390/en14175534/s1, Figure S1: Box plot representation of data in Table S1 for Si-type panels, Figure S2: Box plot representation of data in Table S1 for CdTe-type panels, Figure S3: Box plot representation of data in Table S1 for CIGS-type panels, Table S1: (Table 3 in the main document) Metal contents from the literature for the different types of photovoltaic technologies. The variability represents the standard deviations. Table S2: Metal contents estimated by EDX analysis performed in different points of the samples shown in Figure 4 of the main document.

Author Contributions

Conceptualization, F.P. and P.A.; methodology, F.C.d.S.M.P. and P.G.S.; validation, A.R. and F.P.; investigation, F.C.d.S.M.P. and G.B.; data curation, F.C.d.S.M.P.; writing—original draft preparation, A.R.; writing—review and editing, A.R. and F.P.; supervision, F.P.; funding acquisition, F.P. and P.A. All authors have read and agreed to the published version of the manuscript.

Funding

This research was co-funded by the EU LIFE+ program (PhotoLife, grant number: LIFE13 ENV/IT/001033) and CNPq (Process 202624/2015-3).

Institutional Review Board Statement

Not applicable.

Informed Consent Statement

Not applicable.

Data Availability Statement

Data are contained within the article.

Conflicts of Interest

The authors declare no conflict of interest. The funders had no role in the design of the study; in the collection, analyses, or interpretation of data; in the writing of the manuscript, or in the decision to publish the results.

References

  1. Van de Krol, R.; Grätzel, M. Photoelectrochemical Hydrogen Production; Springer: Boston, MA, USA, 2012. [Google Scholar]
  2. IRENA. Renewable Power Generation Costs in 2017. 2018. Available online: https://www.irena.org/publications/2018/jan/renewable-power-generation-costs-in-2017 (accessed on 3 May 2021).
  3. SPE. Global Market Outlook. 2018. Available online: https://www.solarpowereurope.org/wp-content/uploads/2018/09/Global-Market-Outlook-2018-2022.pdf (accessed on 3 May 2021).
  4. Paiano, A. Photovoltaic waste assessment in Italy. Renew. Sustain. Energy Rev. 2015, 41, 99–112. [Google Scholar] [CrossRef]
  5. IRENA; IEA-PVPS. End of Life Management. Solar Photovoltaic Panels. 2016. Available online: www.irena.org (accessed on 3 May 2021).
  6. Latunussa, C.E.L.; Ardente, F.; Blengini, G.A.; Mancini, L. Life Cycle Assessment of an innovative recycling process for crystalline silicon photovoltaic panels. Sol. Energy Mater. Sol. Cells 2016, 156, 101–111. [Google Scholar] [CrossRef]
  7. Chantana, J.; Kamei, A.; Minemoto, T. Influences of environmental factors on Si-based photovoltaic modules after longtime outdoor exposure by multiple regression analysis. Renew. Energy 2017, 101, 10–15. [Google Scholar] [CrossRef]
  8. Xu, Y.; Li, J.; Tan, Q.; Peters, A.L.; Yang, C. Global status of recycling waste solar panels: A review. Waste Manag. 2018, 75, 450–458. [Google Scholar] [CrossRef] [PubMed]
  9. Padoan, F.C.S.M.; Altimari, P.; Pagnanelli, F. Recycling of end of life photovoltaic panels: A chemical prospective on process development. Sol. Energy 2019, 117, 746–761. [Google Scholar] [CrossRef]
  10. EU. Directive 2012/19/EU of the European Parliament and of the Council of 4 July 2012 on Waste Electrical and Electronic Equipment (WEEE) (Recast). 2012. Available online: https://eur-lex.europa.eu/LexUriServ/LexUriServ.do?uri=OJ:L:2012:197:0038:0071:en:PDF (accessed on 12 July 2021).
  11. Rubino, A.; Schiavi, P.G.; Altimari, P.; Pagnanelli, F. Valorization of polymeric fractions and metals from end of life photovoltaic panels. Waste Manag. 2021, 112, 89–99. [Google Scholar] [CrossRef] [PubMed]
  12. CEN and CENELEC. WORK PROGRAMME 2016 European Standardization and Related Activities. 2015. Available online: http://www.cencenelec.eu/news/publications/publications/cen-cenelec-wp2015_en.pdf (accessed on 2 July 2021).
  13. Doni, A.; Dughiero, F. Electrothermal heating process applied to c-Si PV recycling. In Proceedings of the 2012 38th IEEE Photovoltaic Specialists Conference, Austin, TX, USA, 3–8 June 2012; pp. 000757–000762. Available online: https://www.semanticscholar.org/paper/Electrothermal-heating-process-applied-to-c-Si-PV-Doni-Dughiero/3baf37ca8fda5e2a5a199a34dddb7376465672c3 (accessed on 12 July 2021).
  14. Toro, L.; Pagnanelli, F.; Granata, G.; Moscardini, E. Process for Treating Spent Photovoltaic Panels WO 2014/184816. 2014. Available online: https://patentscope.wipo.int/search/en/detail.jsf?docId=WO2014184816 (accessed on 12 July 2021).
  15. PhotoLife Project (LIFE13 ENV/IT/001033) 2014. Available online: http://www.photolifeproject.eu/ (accessed on 14 July 2020).
  16. Pagnanelli, F.; Altimari, P.; Toro, L.; Atia, T.A.; Baldassari, L.; Padoan, F.C.S.M. SIPS 2017 Vol. 7. Recyclying Second-Hand Batteies for Environment Protection; FLOGEN Star Outreach: Montreal, MO, Canada, 2017; pp. 114–120. [Google Scholar]
  17. Pagnanelli, F.; Moscardini, E.; Granata, G.; Atia, T.A.; Altimari, P.; Havlik, T.; Toro, L. Physical and chemical treatment of end of life panels: An integrated automatic approach viable for different photovoltaic technologies. Waste Manag. 2017, 59, 422–431. [Google Scholar] [CrossRef] [PubMed]
  18. Ramos-Ruiz, A.; Wilkening, J.V.; Field, J.A.; Sierra-Alvarez, R.J. Leaching of cadmium and tellurium from cadmium telluride (CdTe) thin-film solar panels under simulated landfill conditions. Hazard. Mater. 2017, 336, 57–64. [Google Scholar] [CrossRef] [PubMed] [Green Version]
  19. Yi, Y.K.; Kim, H.S.; Tran, T.; Hong, S.K.; Kim, M.J. Recovering valuable metals from recycled photovoltaic modules. Air Waste Manag. Assoc. 2014, 64, 797–807. [Google Scholar] [CrossRef] [PubMed]
  20. Rubino, A.; Granata, G.; Moscardini, E.; Baldassari, L.; Altimari, P.; Toro, L.; Pagnanelli, F. Development and Techno-Economic Analysis of an Advanced Recycling Process for Photovoltaic Panels Enabling Polymer Separation and Recovery of Ag and Si. Energies 2020, 13, 6690. [Google Scholar] [CrossRef]
Figure 1. Photolife (pilot) plant and process scheme: (A) section of mechanical treatment and sieving; (B) section of solvent treatment and separation; (C) block diagram.
Energies 14 05534 g001
Figure 2. Sankey diagrams for Photolife process demonstrated at pilot scale using Si-, CdTe-, and CIGS-based panels.
Energies 14 05534 g002
Figure 3. Recovered products from solvent treatment operations performed on the coarse fraction of the milled materials (Table 4): (A) high-value coarse glass; (B) metallic filaments; (C) polymeric residue containing Tedlar®, EVA, and cell materials; (D) Tedlar® manually separated from polymeric residue; (E) aggregate of EVA and PV cell fragments.
Energies 14 05534 g003
Figure 4. FE-SEM/EDX characterizations of fine fractions (<0.5 mm) emerging from the mechanical treatment for: Si (A), CdTe (B), and CIGS EoL-PVP technologies (C). In each image, EHT corresponds to the Extra High Tension of the primary beam, WD to the working distance, and Signal A to the imaging mode with SE2 indicating secondary electrons.
Energies 14 05534 g004
Figure 5. Metals’ distribution (%w/w) in the different fractions emerging from the Photolife process. The three operations represented by the sequence of icons, from left to right: manual dismantling, mechanical treatment, and solvent treatment. (*) Metal contents from electrical components such as junction boxes are not included in mass balances.
Energies 14 05534 g005
Table 1. EoL-PVP wastes treated in the present work.
TypeBrandModelYear of ManufactureTotal Amount
(kg)
Si crystallineSun EarthTPB156X156-60-P 240201221
TOPCO-SolarTOPCO-230S6201120
Lenus SolarPoly 250 Silverline201420
SunwaysSM60 P240201120
AXITECAC-250P/156-60201323
MAGE SOLARMage Solar Plus 230/6PE201123
Jinko SolarJKM235P-60201118
Risen EnergySYP235-60201119
Sun EarthTPB156X156-60-P 240201221
TOPCO-SolarTOPCO-230S6201120
Lenus SolarPoly 250 Silverline201420
Si amorphousSHARPNA-F121G5201024
SHARPNA-E135L5201324
SCHOTT SolarASI 100200821
First SolarFS 380201112
CdTeFirst SolarFS 382201212
First SolarFS2-80201112
CIGSFirst SolarFS2 82.5201212
Abound SolarABI-72B201112
SolyndraSL-001-182201032
Hanergy-SolibroSL2-110F201518
Mia SoléMS14066-02201018
Table 2. Metal contents in the different types of panels: silicon (a, amorphous; m, mono-crystalline; p, poly-crystalline), CdTe, and CIGS. Where reported, the variability represents the standard deviation.
EoL-PVP 1N° of Collected PanelsN° of ReplicasFeCuAgZnAlTiSnCdTeInGaSeMo
(mg/kg)
SiliconSunways (p)11609.717.93.211.93423.171.0-------
Schott (a)11247.411.73.312.1663.716.0-------
Axitec (p)11196.010,830.00.58.95102.0400.0-------
Sharp NA121 (a)11159.011,949.01.043.97017.0128.0-------
Sharp NA125 (a)12146 ± 1761.2 ± 1.545 ± 513.4 ± 0.2116 ± 2087 ± 2-------
Lenus (p)121347 ± 332405 ± 8135 ± 4210 ± 22763 ± 943139 ± 4450 ± 78------
Mage Solar (p)12359 ± 4979.1 ± 40.6 ± 0.013.2 ± 0.14406 ± 1574495.9 ± 19.8370.0 ± 33.3------
Sun Earth (p)12143 ± 183789.7 ± 132.64.1 ± 0.112.4 ± 0.95122 ± 872--------
Topco (m)12336 ± 12341 ± 2071.0 ± 2.710.5 ± 0.46041 ± 660--------
Risen (p)12326 ± 5818 ± 6346 ± 9412.4 ± 0.64094 ± 913450 ± 229-------
Jinko (p)12543.7 ± 45.141 ± 13183 ± 3215 ± 74576 ± 1742158 ± 68-------
CdTeFS 38033135 ± 25---181 ± 32--329 ± 35333 ± 15----
FS 38233173 ± 45---909 ± 103--370 ± 40390 ± 52----
FS2-8011155---350--312308----
FS 82522261 ± 117378 ± 327-6 ± 2199 ± 27--382 ± 57482 ± 112----
Abound Solar22220 ± 8717 ± 5-3 ± 12172 ± 220--503 ± 542191 ± 190----
CIGSSolyndra22-377 ± 99-------1024 ± 56131 ± 741350 ± 1731130 ± 112
Solibro22-169 ± 9-387 ± 1---34 ± 6-203 ± 10106 ± 21578 ± 100121 ± 14
Mia Solé62-3941 ± 1030-305 ± 17---15 ± 3-335 ± 7680 ± 3-682 ± 65
1 Details in Table 1.
Table 3. Metal contents from the literature for the different types of photovoltaic technologies. The variability represents the standard deviation.
Si
ReferenceAgCuSnAlZnFeTi
(mg/kg)(mg/kg)(mg/kg)(mg/kg)(mg/kg)(mg/kg)(mg/kg)
LiteratureDias et al., 20166322984558----
Paiano 20156057001200103,0001200--
Choi and Fthenakis 2014-10,000-175,000---
Pagnanelli 2017 (Si mono)18.88.2-199.8238.6388.930.5
Pagnanelli 2017 (Si poli)77.818.8-282.9450.3870.226.2
Latunussa et al., 2016530------
Jung et al., 2016378.96660.0-----
This work 172 ± 1102477 ± 4551410 ± 573700 ± 238214 ± 10401 ± 350187 ± 169
CdTe
ReferenceCuAlZnCdTeFe
(mg/kg)(mg/kg)(mg/kg)(mg/kg)(mg/kg)(mg/kg)
LiteraturePaiano 20155700103,000120016001900-
Fthenakis and Wang 2006100--550620-
Pagnanelli 2016-594816180126558
Pagnanelli 2017130180105200
Pearce 20140--748.3762.5-
This work 1189 ± 51197 ± 2554 ± 2762 ± 842379 ± 75741 ± 813
CIGS
CuZnInCdGaSeMo
(mg/kg)(mg/kg)(mg/kg)(mg/kg)(mg/kg)(mg/kg)(mg/kg)
LiteraturePaiano 2015800012002005100300-
Savvilotidou et al., 20176432466.778.7-15425210.1
McDonald and Pearce 2010--186.8-307.9--
Steeghs and Water 2016811921163.525180125
Sander et al., 200792.2277166.73.9101.2229.2241
This work 11496 ± 2120346 ± 5824 ± 13521 ± 441106 ± 251464 ± 161644 ± 50
1 From data in Table 2.
Table 4. Granulometric distribution of milled materials emerging from mechanical treatment.
FractionGranulometric Interval%w/w
SiCdTeCIGS
Coarse (C)>3 mm73.161.063.1
Intermediate (I)3 > x > 0.5 mm18.920.020.4
Fine (F)x < 0.5 mm8.019.016.5
Table 5. Metal concentrations distributed in the three fractions exiting the mechanical treatment (F: fine; I: intermediate; and C: coarse) of Si-, CdTe-, and CIGS-based panels.
FractionFeCuAgZnAlTiCdTeInGaMo
(mg/g_fraction)
SiliconF1.9-0.030.092.00.04-----
I0.1---0.2------
C0.3-0.310.0094.80.3----
CdTeF0.9--0.080.2-0.91.2---
I0.1---0.02-0.080.1---
C0.1--0.0051.1-0.40.4---
CIGSF-0.6-0.2--0.003-0.020.020.2
I-0.5-0.05--0.001-0.0010.0080.2
C-0.1-0.5--0.03-0.40.11.0
Publisher’s Note: MDPI stays neutral with regard to jurisdictional claims in published maps and institutional affiliations.

