Article

Analysis of the Possibility of Energetic Utilization of Biomass Obtained from Grass Mowing of a Large-Area Golf Course—A Case Study of Tuscany

1
Department of Applied Bioeconomy, Wroclaw University of Environmental and Life Sciences, 51-630 Wroclaw, Poland
2
Consiglio per la Ricerca in Agricoltura e L’Analisi Dell’Economia Agraria (CREA), Centro di Ricerca Ingegneria e Trasformazioni Agroalimentari, Via Della Pascolare 16, 00015 Monterotondo, Rome, Italy
3
Deutsche Golf Holding Ltd., Aktienstr. 177, D 45359 Essen, Germany
*
Author to whom correspondence should be addressed.
Energies 2021, 14(17), 5520; https://doi.org/10.3390/en14175520
Submission received: 28 June 2021 / Revised: 26 August 2021 / Accepted: 1 September 2021 / Published: 3 September 2021

Abstract

:
The mowing of sports fields generates a significant amount of waste biomass which requires appropriate management. On the largest scale, this problem affects golf courses with a grass surface area of up to 100 ha. Currently, the main directions for grass clippings management include composting, grass cycling, and waste. A certain alternative may be the energetic utilization of grass clippings, which not only solves the problem of organic waste management, but also brings measurable economic profits in the form of generated electricity and heat. This paper presents a techno-economic analysis of the application of a micro biogas plant, fed with grass clippings from a golf course project in Tuscany, with a grass surface of 111.21 ha. It has been shown that the annual biomass potential is 526.65 tDM∙year−1 (±45.64 tDM∙year−1), which makes it possible to build a micro biogas plant with an electric power of ca. 46 kW. The potential amount of electricity produced during the year is able to cover 16.95–37.35% (depending on the season) of electricity demand in the hotel resort, which includes two golf courses and practice facilities. The produced heat in the amount of 1388.41 GJ, in turn, is able to cover the annual heat demand in the range of 7.95–17.24% (depending on the season). In addition, the electricity and heat produced exceeds the energy expenditures for mowing, making the energy balance positive. Unfortunately, the analysis showed that the construction of a micro scale biogas plant is economically unprofitable and is characterized (in the period of 10 years) by negative IRR and ROI (−17.74% and −34.98%, respectively). However, it should be emphasized that with the additional income resulting from the avoidance of fees for the export and management of organic waste and the reduction of fertilization costs (fertilization of part of the golf course with digestate), the application of a micro biogas plant may turn out to be economically feasible (NPV > 0).

1. Introduction

Natural sports turf has many environmental benefits. They are related to the protection of groundwater, biodegradation of synthetic organic compounds, soil erosion control and dust stabilization, and improvement of atmospheric conditions (reducing noise levels by absorption, reflection and refraction of various sounds, and carbon dioxide absorption by plants through photosynthesis) [1]. It is also worth emphasizing that turf grasses soils may sequester atmospheric C [2] (carbon sequestration occurs when more CO2 (GHG) is removed from the atmosphere by photosynthesis than is returned to the atmosphere through respiration; “excess” C is retained in the soil [3]). Numerous studies conducted on golf courses have confirmed that the soil organic C sequestration rate in these areas is in the range of 0.32–1.2 tC·ha−1·year−1 [3,4,5,6,7]. However, due to the heavy load on the turf in the league season, related to the increased training, match, and tournament frequency, maintaining the natural surface in a proper condition involves additional financial outlays, including not only basic care treatments such as irrigation, mowing, or fertilization, but also specialized topdressing, scarifying, aeration, or overseeding [8]. The need to precisely perform these treatments requires the use of special vehicles, as a result of which a high amount of fuel is used, which has a negative impact on the environment [9]. While in the case of most treatments, their use is limited to a few times a year, turf mowing is a very common procedure due to the need to maintain the height of the grass at a certain level [10,11,12,13]. Additionally, frequent mowing of the turf is recommended due to the stimulation of the turf and increasing the density of the turf, which in most sports cases leads to better playability and tolerance to the use of pitches [14,15]. As a result, sports clubs seek to minimize the negative effects of mowing on the environment. The current trends are focused on the use of fully automatic mowers or improvement of mowing efficiency in order to measurably reduce the amount of fuel consumed [16,17,18]. Unfortunately, the side effect of these care activities is generation of waste biomass. During mowing, a significant amount of grass clippings is produced, requiring proper disposal. Annually, up to 7.2 tDM∙ha−1 grass clippings may be obtained from sports fields/courts [19].
Proper management of biomass is an important element of sustainable development and, in the case of sports clubs, a key element of ecological facility management. Depending on the mowing technique used, biomass in the form of grass clippings from a sports field can be utilized in various ways. Currently, the main directions for the utilization of grass clippings from sports grounds are grass cycling (leaving the clippings freely on the grass as a source of humus) and composting, but still, at many sites, it is common practice to store clippings for a long time and use it as waste [20]. Grass clippings are stored for a relatively long time in order to reduce their weight and volume, thus reducing the cost of their disposal and management by the municipal plant. While in the case of most sports that decide to use a natural grass surface, this problem is not so significant, due to the small area of the playing fields, not exceeding a few hectares. So far, the largest scale of the problem concerns golf courses whose grass surface can exceed 100 ha [21], thus being more than ten times larger than standard turfs used on other sports fields. Mowing golf courses is also characterized by a much higher primary energy consumption than in comparison to other sports fields/courts. Analysis of two golf courses in Sweden, at Sigtuna (52.5 ha) and Uppsala (76 ha) by Tiddaker et al. [22], showed that the energy requirements for maintenance and care were very high in these areas, with most of the energy required for mowing. The authors estimated that for the green area the primary energy consumption on golf courses is 21–27 GJ∙ha−1∙year−1 (160–198 mowing∙year−1), for the tee area 27–33 GJ∙ha−1∙year−1 (88 mowing∙year−1), for the fairway area 10 GJ∙ha−1∙year−1 (88 mowing∙year−1), and for rough area (also included manufacture and maintenance of machinery) 7.1–7.6 GJ∙ha−1∙year−1 (30 mowing∙year−1). The green area, despite the much lower frequency of mowing, is characterized by lower energy expenditure than the tee area, which may be mainly due to the lower power required for mowing, because the grass surface is mowed more often and the machines cut only small grass clippings [
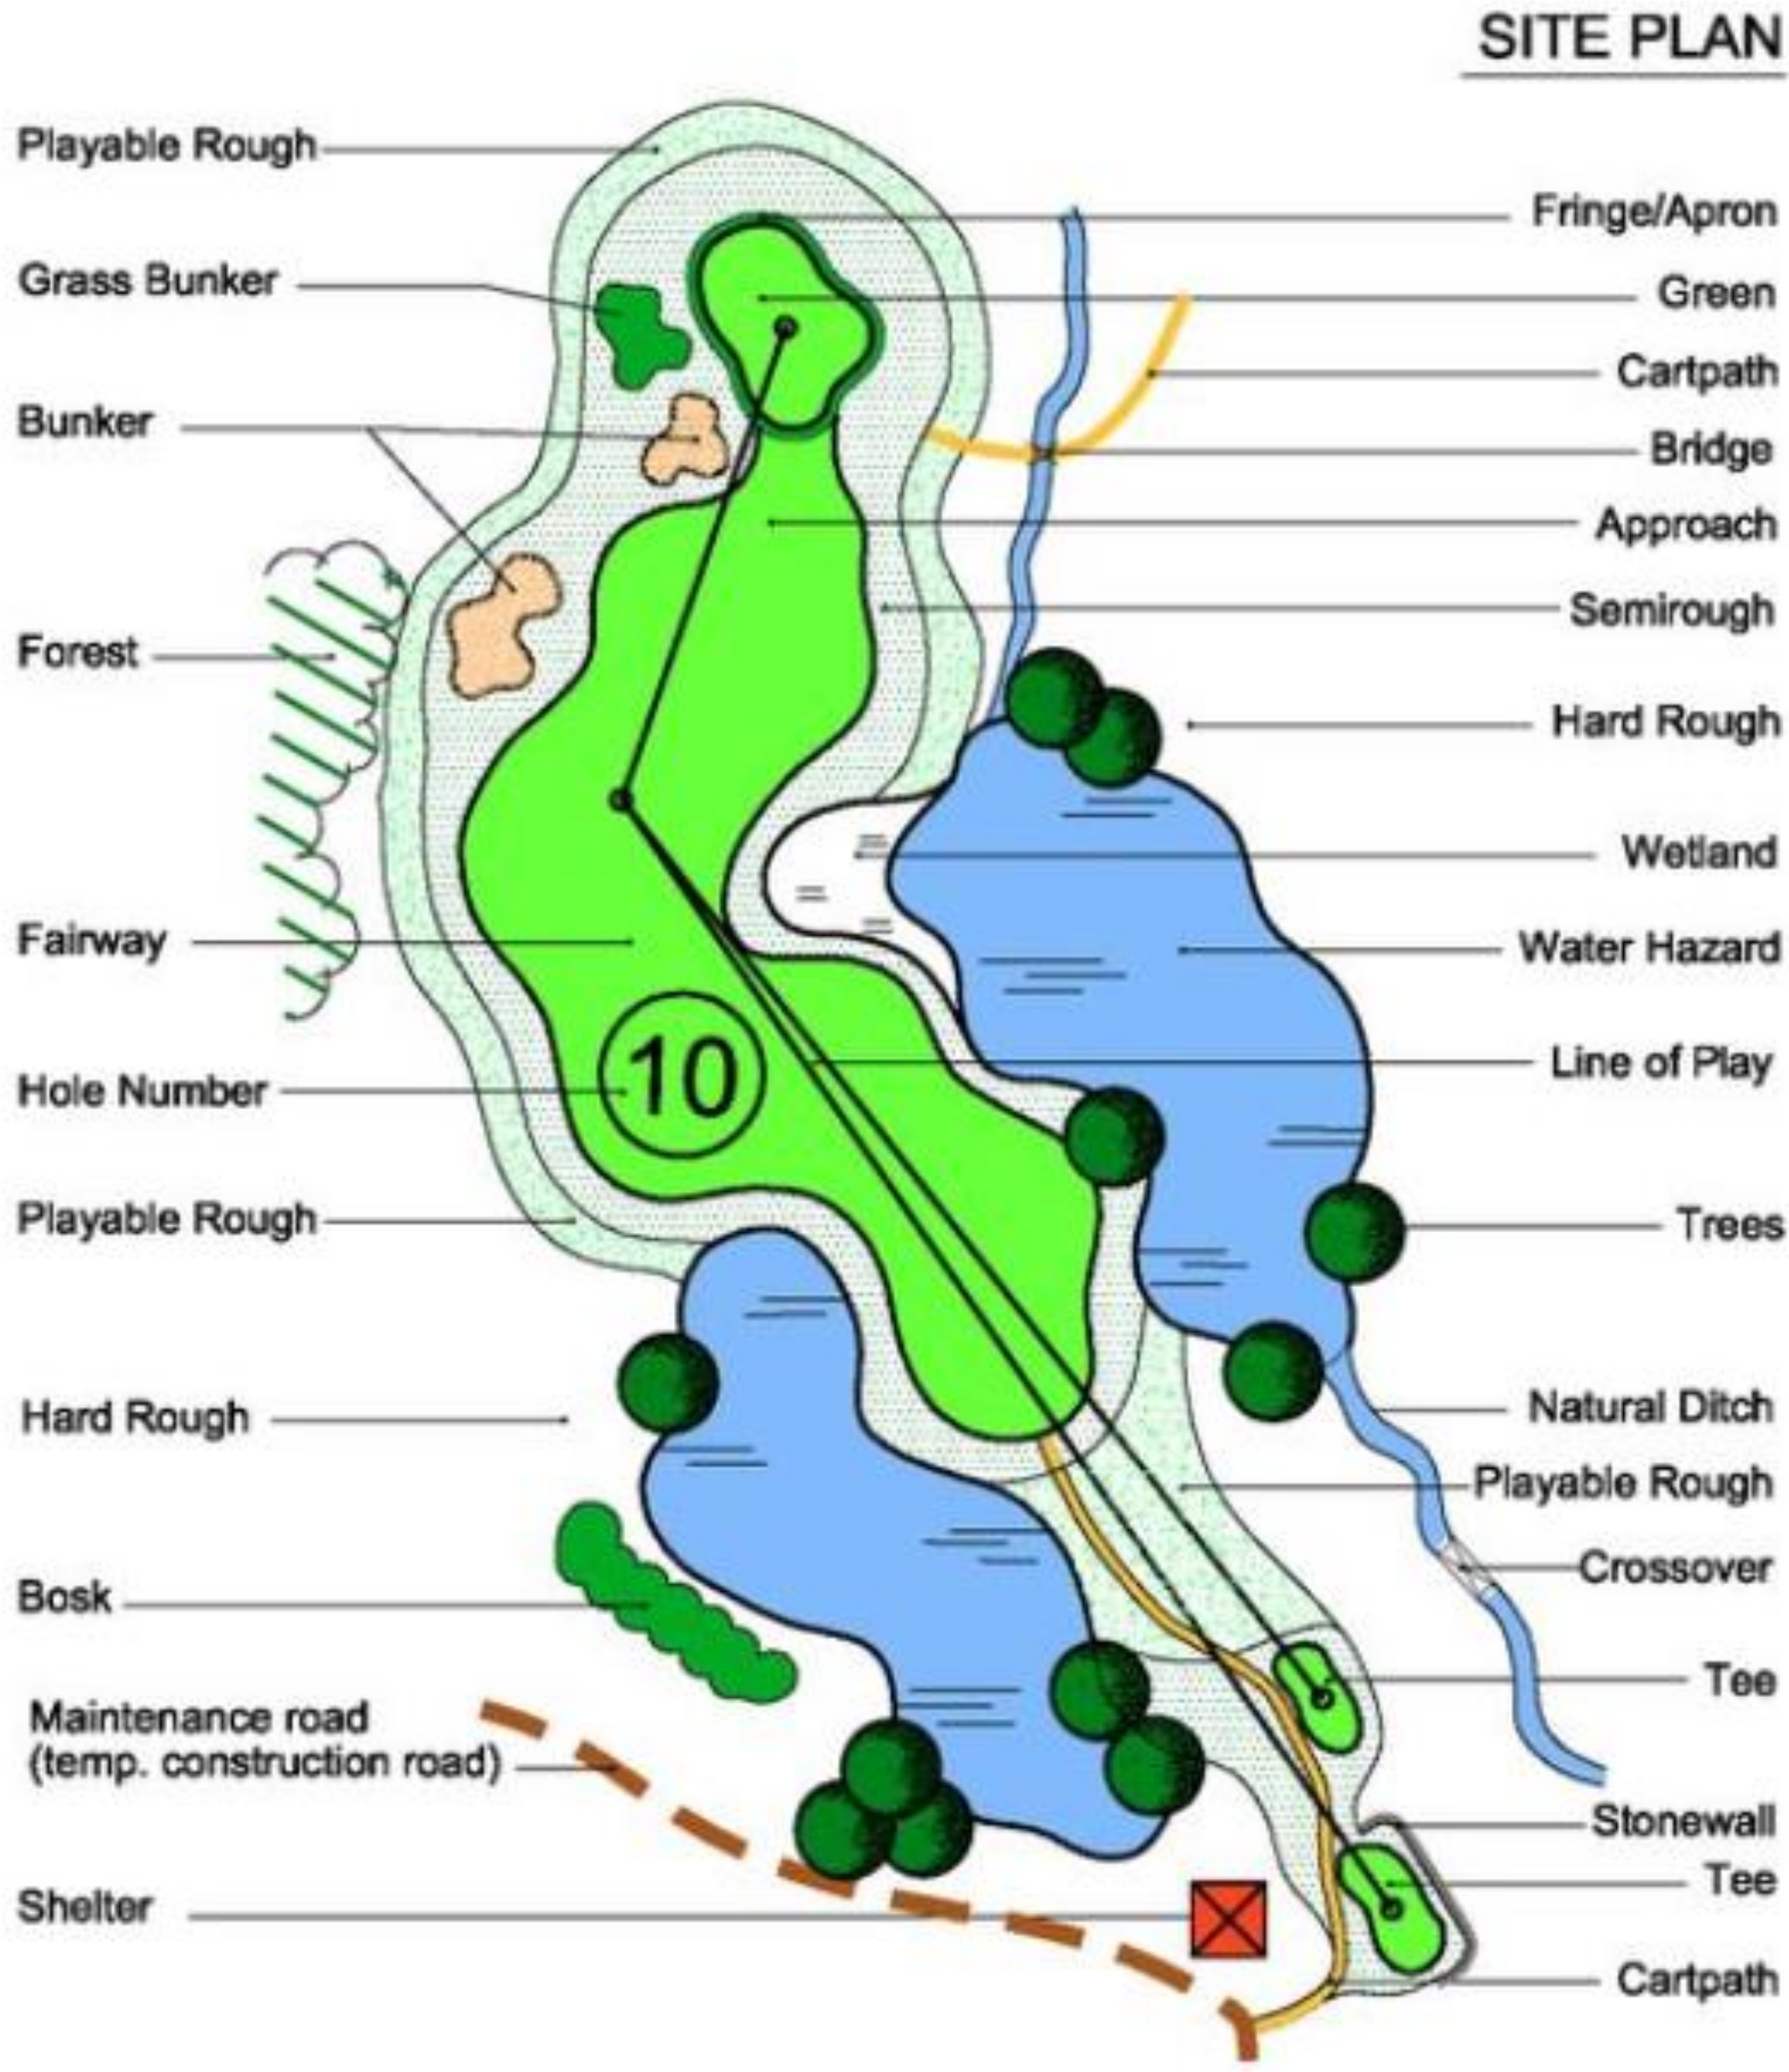
23]. Additionally, a standard golf course consists of several different parts for the game fields, each of them with different levels of mowing and maintenance. Typical golf course components are shown in Figure 1. The description of the individual components of the golf course along with the mowing and maintenance characteristics is included in Table 1.
As mentioned before, the basic directions for management and utilization of grass clippings from sports grounds are waste, composting, and subsequent fertilization of the area with the finished product, or leaving them on the soil immediately after mowing as a source of humus (grass cycling).
The first method is undesirable because in most cases the cuttings are packed in bags and transported to landfills or to plants processing organic waste, where they take up a lot of space, especially during the growing season [26]. In addition, it is common practice before this process to air dry the grass clippings in piles in order to reduce their volume, which is aimed at reducing the costs of disposal by the municipal plant, which, due to the area of standard golf courses and the frequency of mowing, can be a significant financial burden. Due to this action, not only valuable nutrients and plant organic matter are lost, but also the biological decomposition of organic matter leads to the emission of GHG (Green House Gases) and leachates, which may have a highly toxic effect on the environment and living organisms [27].
Until now, the best alternatives for taking grass clippings out of the sports club have been composting and grass cycling. Unfortunately, these methods are still considered ineffective in many cases and do not convince all sports surface administrators. Although one ton of grass clippings results in 200 pounds of degradable fibrous matter after composting [28], the main argument against composting grass clippings in sports grounds is that the amount of compost produced from grass clippings is not sufficient to cover the entire surface of the golf course. It is estimated that during the composting process, the weight of grass clippings and other residues can be reduced by about 70% [29], therefore, from 100 m3 of waste, only 30 m3 of compost can be produced. In addition, golf course managers do not want to decide to fertilize one part of the field with compost and the other part with specialized fertilizer, due to the potential occurrence of differences in the performance characteristics (valuation and functional) of the turf, such as color, turf density, stiffness, elasticity, or susceptibility to diseases [30]. The research performed [31] has shown that the application of leaf compost improves the physical properties of the soil and the playing surface, however, it may also reduce the surface hardness, increase the volumetric moisture of the soil and significantly change the physical and chemical properties of the soil. It is also worth emphasizing that when composting grass clippings, odor problems may occur, which is particularly unfavorable in sports facilities from the point of view of players and fans. In order to avoid them, the clippings have to be turned frequently, even twice a day, which can be a significant inconvenience due to the amount generated on the golf course [29,32].
The situation in the case of grass cycling is slightly different, as generally this method of biomass utilization on home lawns, recreational areas, and smaller sports fields are considered to be beneficial. A properly carried out grass recycling process assumes mowing the surface with the appropriate frequency so that during a single mowing, no more than one-third of the leaf blade is removed. The tests showed that returning grass clippings to the ground with a mulching mower improves the color of the clippings compared to the harvested yield [33]. Additionally, reducing the level of nitrogen fertilization by half when using grass cycling does not negatively affect the color of the turf. There are also reports [34,35,36] of an increase in the efficiency of nitrogen use, its absorption, and the total dry matter yield, thanks to the use of grass cycling. Law et al. [37] indicate that the “one-third” rule reduces mowing requirements by 31% and returning grass clippings adds about two mows a year. Such action, in the case of large-area golf courses, is not entirely desirable due to the high financial outlays that are incurred during mowing. Some golf courses also choose not to use grass cycling due to the functional aspect of the game. Grass clippings can inhibit the ball from rolling, so it can stop faster than on surfaces where the yield has been collected. Grass clippings can also stick to the ball, however, these are not considered loose obstacles and therefore cannot be removed. It is also worth mentioning that grass cycling cannot always be used. Grass cycling is only possible on fairways and tees. A particular barrier to this process is rainy weather and areas with low mowing frequency, such as the semirough, playable rough and hardrough [38].
Because of the above arguments, alternative solutions are sought that will allow partial elimination of the problematic management of grass clippings, to simultaneously use their potential valuable properties. One of the proposed solutions is the energy utilization of grass clippings. However, due to the high concentrations of chlorine, nitrogen, and sulfur (even after the application of mineral-reducing pretreatment) that have been reported [39] in sports field grass and which can lead to adverse emissions, pollution, and corrosion during traditional combustion, grass clippings are much more often considered as material for biogas production during anaerobic digestion [40]. Research has shown that grass residues can potentially serve as a substitute for maize silage in the production of heat and electricity, both as a raw material for mono- and co-fermentation [41]. In fact, the monofermentation of grass silage is a dynamic and complicated process, that requires strict control and monitoring of critical parameters [42]. Therefore, to ensure greater efficiency and better operating conditions, a combination of inputs is used in practice which assumes that the amount of grass as a substrate for biogas production may not exceed a certain degree. However, several authors proved that there is a proper technology allowing grass silage monofermentation [43] and biological stability [42].
There are works [44,45,46,47,48,49] showing the unit potential of methane/biogas production from mixed grass clippings from golf courses/sports grounds and the biomass potential of grass clippings, depending on the part of the playing field, characterized by different frequency and height of mowing; however, they did not analyze the complete case study, assuming only theoretically the possibility of electricity production and the existence of high-efficiency devices. It is worth emphasizing that studies to date, found in the literature, have demonstrated the potential of golf course biomass only in terms of dry weight and with inaccurate estimation of area by rounding specific areas of golf courses to their full values. As a result, the logistic chain profitability of building a micro biogas power plant and producing electricity and heat from anaerobic fermentation of grass clippings after mowing a golf course, is not known.
Taking these arguments into account, this study aims at: (i) detailed analysis of the grass surface of a selected large-area golf course (A > 100 ha) and its characterization in terms of mowing frequency; (ii) estimating the golf course biomass potential in the form of grass clippings; (iii) determination of the coverage degree of the energy used for golf course mowing by the energy generated in own micro-biogas plant fed by biomass waste (grass); (iv) evaluation of the profitability of building a micro-scale biogas power plant for a golf course.

2. Materials and Methods

2.1. Study Site

The golf project under study (designed by the golf course architect team Rainer Preißmann and Wilfried Moroder) is located in the municipality of Montaione, in the Tuscany region, in the province of Florence (Italy) (Figure 2). Golf is part of an 1100 ha tourist complex, which includes, among others, a 120-room hotel with heated swimming pool, a 30-room hotel, 1000 m2 spa with indoor and outdoor heated swimming pools, fitness center, restaurant complex, olive groves, and medieval castle. The golf project as part of the original masterplan has a total grass area of 111.21 ha and was divided into four main areas: Lake Course (51.11 ha), Mountain Course (43.53 ha), Practice Area (6.29 ha), and Short Course (10.28 ha). The division of individual areas into different parts of the golf course, used for playing and characterized by different levels of height and frequency of mowing, as well as a detailed map of the facility and the location of these zones are presented in Supplementary Materials S1. The operation of the Mountain Course, 9 holes of the Lake Course, and the Practice Area started in 2010. Reed mixes (Festuca arundinacea Schreb.) have been planted in fairways and semirough areas, fescue mixes have been planted in playable rough areas and meadow grass mixtures have been planted on hard rough areas. The base of golf course management is daily mowing of the greens, 3–4 times a week for tees, 1–2 times a week for fairways, semiroughs once a week and twice in the year for rough.

2.2. Estimation of the Biomass Potential of Grass Cuts from the Golf Course

To estimate the amount of biomass in the form of dry mass of grass clippings, literature indicators were used, taking into account the mass of the resulting biomass depending on the specific part of the golf course used for the game, characterized by a different level and frequency of mowing. The indicators are presented in Table 2. The following formulas were used:
P DM = P i · A i
where: PDM—golf course biomass potential as dry matter of grass clippings (t); Pi—unit potential of biomass in the form of grass clippings on a specified part of the golf course, characterized by a different level and frequency of mowing (t∙ha1); Ai—area of the individual part for the game on the golf course (ha).
Converting the dry matter content of grass clippings to fresh matter and dry organic matter:
P FM = P DM 1 MC  
P ODM = 1 AC · P DM
where: PFM—golf course biomass potential as fresh matter of grass clippings (t); POM—golf course biomass potential as dry organic matter of grass clippings (t); MC—average moisture content in the fresh matter (FM) of grass clippings from the golf course (%); AC—ash content in grass clippings (%).

2.3. Assumptions for Technical and Economic Analysis

The technical and economic analysis is a key stage in the planning of works on a biogas power plant, allowing determination of the energy potential of a specified installation. Taking into account investment outlays, revenues from energy sales (or savings), and operating and maintenance costs, its financial profitability can be determined. The assumptions taken for the analysis are presented in Table 3.

2.4. Calculation of Technological Parameters of Biogas Power Plants and Energy Production

The annual production of methane was calculated according to the formula:
R CH 4 = 1 L GC · P DM · ODM · V CH 4
where: RCH4—annual production of methane, (m3∙year−1); VCH4—potential for methane production from mixed golf course grass clippings, (m3∙tOM−1).
The theoretical thermal power was determined from the following formula:
N TH = H CH 4 · LHV CH 4 · η TH
where: NTH—theoretical thermal power (kW); HCH4—production of methane (m3∙h−1), LHVCH4—lower heating value of methane (kWh∙m−3); ηTH—thermal efficiency of the CHP (Combined Heat and Power) engine (%).
Gross heat production was determined from the formula:
QC BRUTTO = N TH · t  
where: QCBRUTTO—gross heat production (GJ∙year−1); t—engine operation time (CHP) (h∙year−1).
Heat consumption for technological purposes was calculated using the formula:
QC TECH = QC BRUTTO · Z c  
where: QCTECH—heat consumption for technological purposes (GJ∙year−1); ZC—own heat internal needs factor (-).
Net heat production was calculated according to the formula:
QC NETTO = QC BRUTTO QC TECH  
where: QCNETTO—net heat production (GJ∙year−1).
The theoretical electric power was determined from the following formula:
N EL = H CH 4 · LHV CH 4 · η EL  
where: NEL—theoretical electric power (kW); ηEL—electric efficiency of the engine (CHP) (%).
Gross electricity production was determined from the formula:
QE BRUTTO = N EL · t  
where: QEBRUTTO—gross heat production (kWh∙year−1).
Electricity consumption for technological purposes was calculated using the formula:
QE TECH = QE BRUTTO · Z E  
where: QETECH—electricity consumption for technological purposes (kWh∙year−1); ZE—own electricity internal needs factor (-).
Net electricity production was calculated according to the formula:
QE NETTO = QE BRUTTO QE TECH  
where: QENETTO—net electricity production (kWh∙year−1).
The reactor’s volume was calculated from the following formula, taking into consideration the volume needed for heating installation, stirrer, and roof construction [56]:
V R = P FM ρ d · HRT · k r  
where: VR—reactor’s volume (m3); PFM—substrate fresh mass stream (kg∙day−1); HRT—hydraulic retention time (period of fermentation of substrate in the chamber) (days); kr—volume ratio for the accompanying equipment (adopted kr = 1.25) (-); ρd—bulk density of mixed grass clippings (kg∙m−3).

2.5. Methods of Investment Project Assessment

2.5.1. Net Present Value (NPV)

The NPV indicator is the main method of evaluating investment projects in terms of time. This ratio discounts future cash flows resulting from the functioning investment with an assumed discount rate and then summing them together [61]. The indicator is calculated from the following formula:
NPV = t = 1 n CF t 1 + r t I o  
where: CFt—cash flow in the period t (€); r—assumed discount rate (%); Io—initial investment (€).

2.5.2. Internal Return Rate (IRR)

The IRR is the rate of return for which the NPV function is zero. The profitability of starting an investment increases with the higher value of this ratio [62]. The formula is as follows:
t = 1 n CF t 1 + IRR t I o = 0  
where: IRR—internal return rate (%).

2.5.3. Return on Investment (ROI)

Return on Investment (ROI) is the ratio of the return on investment to the cost of the investment. Investments are often equated to the Weighted Average Cost of Capital (WACC) value [63]. When the ROI value is greater than or equal to the WACC, the investment is profitable. The ratio is calculated from the following formula:
ROI = GFI CFI CFI  
where: ROI—return on investment (%); GFI—gain from investment; (€); CFI—cost of investment (€).

3. Results and Discussion

3.1. Biomass Potential of Grass Clippings from a Golf Course in Tuscany

Golf courses, compared to sports turfs used for other sports, due to their specific construction, are much more difficult to analyze in terms of the possibility of using the biomass generated in their areas for energy production. Firstly, the golf course does not have strictly defined grass surface dimensions, which means that the amount of biomass produced can vary significantly between different courses. In addition, each golf course is unique in terms of the terrain, the area of individual parts for the game, characterized by a different frequency, mowing height, facility management strategy, grass clippings management, and the individual biomass potential [64]. This means that even golf courses with a similar total area may have large differences in the amount of biomass generated, hence the importance of a detailed analysis of the structure of a given golf course, when estimating its resources for potential energy use.
Table 4 shows the division of the 4 main parts of a golf course in Tuscany (Lake Course, Mountain Course, Practice Area, Short Course) into smaller sectors and the total annual biomass potential of grass clippings. The estimated potential does not take into account the dry matter losses associated with the commencement of ensilage. The main objective of the analysis was to determine the potential of grass clippings in relation to dry matter, as this parameter is the most common indicator of estimating the theoretical potential of biomass in recreational and sports areas. The conducted analysis showed that the total annual biomass potential of grass clippings is 526.65 tDM∙year−1 (±45.64 tDM∙year−1). Lake Course had the greatest biomass potential, where about 245.83 tDM∙year−1 (±20.57 tDM∙year−1) can be harvested annually. The Mountain Course had slightly less grass clippings available for energy use (205.58 tDM∙year−1 ±16.90 tDM∙year−1). The last two parts of the golf course were characterized by a much lower amount of biomass, but they had a much smaller total area compared to the Lake and Mountain Course. The Short Course yields 49.83 tDM∙year−1 (±4.76 tDM∙year−1) annually, while the Practice Area only yields 25.42 tDM∙year−1 (±3.40 tDM∙year−1) of grass clippings.
However, it is worth analyzing the biomass potential of individual parts of the golf course in relation to the area unit. On average, the Short Course had the greatest biomass potential in this case—4.85 tDM∙ha−1∙year−1 (±0.46 tDM∙ha−1∙year−1). A slightly lower unit potential of grass clippings was recorded for the Lake Course—4.81 tDM∙ha−1∙year−1 (±0.40 tDM∙ha−1∙year−1)—and Mountain Course—4.72 tDM∙ha−1∙year−1 (±0.39 tDM∙ha−1∙year−1). The Practice Area was characterized by the lowest individual potential—4.04 tDM∙ha−1∙year−1 (±0.54 tDM∙ha−1∙year−1). This situation results directly from the share of the rough zone in the total share of the area of a particular part of the golf course. The rough area is the wild grass area with the highest average yield potential of any of the areas considered. In the case of the Short Course, the share of the rough area is 62.29%, hence it has the highest individual potential. The rough’s share of Lake Course and Mountain Course is 48.90% and 44.80%, respectively. In the Practice Area there is no wild grass area, hence the low biomass unit potential. Therefore, when planning the energy use of grass clippings, one should strive to increase the share of the rough area in the total area of golf courses. Of course, such a situation is not always possible, due to the need to provide golfers with adequate comfort as well as the conditions and amount of grass surface of the remaining playing areas. However, the unused squares of the golf course complex can be expanded with additional “rough” areas. Such an action could also have the added benefit of enhancing local flora and fauna biodiversity [65]. It should also be emphasized that golf courses sometimes divide the rough area into a “Hard Rough” area, mowed twice a year, and a “Playable Rough” area, mowed once a week. In this paper, the rough area is considered “Hard Rough” and the “Playable Rough” place is taken by the “Semirough” areas. The estimated unit potential of biomass from the entire golf course in Tuscany, amounting to 4.74 tDM∙ha−1∙year−1 (±0.41 tDM∙ha−1∙year−1), is greater than the potential of a typical golf course in Germany (4.56 tDM∙ha−1∙year−1) [45], and close to grass clippings potential from the Haghof (4.87 tDM∙ha−1∙year−1), Solitude (5.04 tDM∙ha−1∙year−1), and Sonnenbühl (5.33 tDM∙ha−1∙year−1) golf courses in southwestern Germany [44]. However, these golf courses had a large share of rough area in the total area. Grass biomass from golf courses has a slightly higher dry matter potential than roadside grass with an estimated yield of 3–4 tDM∙ha−1∙year−1 [66].
The estimated biomass potential of grass clippings was also related to the amount of fresh weight and dry organic matter, referring to sources directly examining the parameters of grass clippings obtained on golf courses and sports fields. When estimating the amount of fresh matter and dry organic matter, organic biomass may turn out to be crucial in planning the construction of a micro biogas plant and determining its technical parameters. The fresh weight potential of grass clippings on a golf course in Tuscany was set at 1979.90 tFM∙year−1 (±171.56 tFM∙year−1), assuming an average moisture content of MC = 73.40%. Noer [67] confirmed that the moisture content in the fresh mass of grass clippings during the growing season (April–November) is similar and amounts to 65.00–77.46%, with the lowest moisture content obtained for the last two tested months (October and November). It should be expected that also on the golf course in Tuscany, during the growing season, there will be no significant differences in the moisture content of the grass clippings, due to the regular irrigation of the surface in order to maintain the correct quality characteristics of the turf grasses [68]. In the case of dry organic matter, the clippings potential of the golf course was determined at 465.25 tDMO∙year−1 (±40.41 tDMO∙year−1), assuming the ash content AC = 11.66% [51]. In the literature, there is also a possibility of finding many similar results of ash content in the fresh mass of grass clippings from sports, recreational, or roadside verges. Piepenschneider et al. [69,70] determined the content of grass ash from roadside verges at the level of 10.84% and 7%. Nitsche et al. [39] obtained a slightly higher ash content for grass from sports fields (14.84%).

3.2. Technical Parameters and Methane Production

Table 5 shows the calculated parameters for a micro biogas power plant system, including: hourly methane production, gross heat production, heat consumption for technological purposes, net heat production, gross electricity production, electricity consumption for technological purposes, theoretical thermal power, theoretical electric power, and reactor’s volume.
The potential methane production from grass clippings coming from the golf course VCH4 = 340 m3∙tODM−1 [51] assumed in the calculations allowed determination of the hourly production of methane, which was 15.35 m3∙h−1 (±1.33 m3∙h−1). The assumed value of the methane production potential was taken from the work presenting a wide range of possibilities of using sports biomass for biogas production, including the applicability of cuttings from golf courses, other sports fields and mixtures of grasses located directly next to sports fields, but not belonging to playable areas. Methane yields are reported under standard conditions. The batch test was performed for 35 days in accordance with the conditions of VDI 4630. This potential is very close to the typical results obtained with grass clippings. Nitsche [39] obtained methane yields of 340.10 Ndm3·kg−1 VS, investigating the possibility of using biomass from sports grounds in anaerobic digestion. Meyer et al. [52], while testing the suitability of roadside grass for biogas production, determined that the theoretical potential of cut grass may be 490 m3 CH4·kg−1 VS, and the practical maximum 390 m3 CH4·kg−1 VS. Antonopoulu et al. [71], by studying grass lawn waste, obtained a methane potential of 339.86 dm3·kg−1 VS before the raw material pretreatment processes and 427.07 dm3·kg−1 VS after the pretreatment. In the literature, there are articles with a lower methane potential than assumed in this work. Hidaka et al. [72], investigating the possibility of co-fermentation of urban grass cuttings with sewage sludge, obtained the methane potential of grasses at the level of 90–200 Ndm3·kg−1 VS. Howewer, in this case, the material was taken from unmanaged areas, which could contain high fiber concentrations.
The conducted analysis showed that annually, from grass clippings, it is possible to generate 330.57 MWh (±28.65 MWh) of electricity and 1388.41 GJ of heat (±120.30 GJ). To determine the extent to which electricity fed into the grid is able to balance the annual energy expenditure of mowing a golf course, the indicators available in Table 6 were used.
The total energy consumption for mowing has been estimated at 968.21 GJ∙year−1. The largest energy expenditure should be incurred in the Fairways (280.18 GJ∙year−1), Rough (257.05 GJ∙year−1), Tee (169.19 GJ∙year−1) and Semirough (156.40 GJ∙year−1) areas. The remaining areas are characterized by relatively low energy consumption (7.32–68.60 GJ∙year−1). The average energy expenditure for mowing per unit area of a golf course in Tuscany (8.71 GJ∙ha−1∙year−1) was similar to that of the Sigtuna (7.98 GJ∙ha−1∙year−1) and Uppsala (8.74 GJ∙ha−1∙year−1) golf courses [22].
The analysis showed that the annual electricity fed into the grid, 330.57 MWh∙year−1 ± 28.65 MWh∙year−1 (equivalent of 1190.05 GJ∙year−1 ± 103.14 GJ∙year−1), coming from biogas produced from grass clippings from the golf course, is higher than the annual energy expenditure for mowing. This means that the Tuscan golf course is able to counterbalance/minimize the negative environmental effects of combustion of conventional fuels (diesel and petrol) in internal combustion engines by producing the renewable energy equivalent of biogas.

3.3. Supplying the Tourist Complex with Heat and Electricity

Electricity consumption in a tourist complex varies significantly from year to year, which is dictated by different tourist activity, changing weather conditions during the season, as well as the development of technology and the implementation of new devices in the resort. Figure 3 shows the electricity consumption of the complex from the 2016/2017 season to the 2019/2020 season. The lowest electricity consumption was observed in the 2016/2017 season, when consumption was 885 MWh∙year−1. In such a case, the production of electricity by micro scale biogas plants powered by grass clippings from the golf course would be able to cover the electricity demand to 37.35% (±3.24%). The highest electricity consumption was observed in the 2017/2018 season, when 1950 MWh was consumed, which would be equivalent to covering the consumption to 16.95% (±1.47%) if some electricity was produced from biogas during anaerobic digestion of grass clippings. In the remaining 2018/2019 and 2019/2020 seasons, electricity consumption in the tourist complex was 1684.3 MWh and 1421.7 MWh, respectively. Electricity from a micro scale biogas plant would be able to cover this consumption to 19.63% (±1.70%) and 23.25% (±2.02%). Taking into account the average value of electricity consumption from 4 seasons, amounting to 1485.3 MWh, which would be associated with the average possibility of covering the consumption with energy from biogas to 22.26% (±1.93%).
In the current system the farmhouses and the club-house have air–water and/or air–air heat pumps. The tourist resort also has its own thermal plant powered by various types of biomass for heating the buildings of the village. The heat produced from biomass differs significantly between seasons (Figure 4). The highest demand for heat was observed in the 2016/2017 tourist season, when the heating plant produced 17463.6 GJ of heat. In the following years, the amount of heat produced decreased and amounted to 14040.0 GJ, 11857.68 GJ, and 8053.24 GJ in the 2017/2018, 2018/2019 and 2019/2020 seasons, respectively. Therefore, it should be noted that the construction of a micro biogas plant powered by grass clippings from a golf course is able to significantly reduce the consumption of biomass in the thermal biomass plant. For the most demanding heating season among the last 4 seasons (2016/2017), a micro scale biogas plant would be able to cover the heat demand for heating buildings of the village to 7.95% (±0.69%). For subsequent seasons, as the demand for heat decreases, this indicator would increase and amount to 9.89% (±0.86%) for the 2017/2018 season, 11.71% (±1.01%) for the 2018/2019 season, and 17.24% (±1.49%) for the 2019/2020 season, respectively.

3.4. Results of Economic Analysis of Investment Scenario

Table 7 shows the investment costs, operating and maintenance costs, and incomes necessary to determine the profitability of building a micro scale biogas plant, fed with grass clippings, from a golf course at a tourist resort in Tuscany.
Table 8 shows the results of the economic analysis of the construction of a micro scale biogas plant powered by grass clippings from the mowing of the golf course. The investment turned out to be unprofitable, with the values of NPV, IRR, and ROI ratios of −235,000 €, −17.74%, −34.98%, respectively. In the study, savings (as an avoidance of costs) resulting from the purchase of electricity produced by biogas plants, and savings resulting from the lack of purchase of biomass for heat production, which was also produced in a biogas plant, were designated as income. The investment was considered for a period of 10 years. However, it should be mentioned that in the considered case, the avoidance of costs related to the management and disposal of green waste (grass clippings), which takes place on many golf courses and other sports fields, was not taken into account (due to the composting process of part of the grass clippings). Income from such an operation could significantly affect the profitability of the investment. Additionally, in the future, the income could be increased by avoiding part of the costs related to fertilizing the golf course with digestate. At present, however, it is not known how the functional and visual features of lawn turfs develop after fertilization with digestate. Odors and emissions, which are very undesirable in sports venues, could also be a potential problem.
Wąs et al. [80] examined the profitability of agricultural micro-scale biogas plants in Ukraine, and also concluded that the such investment is not satisfactory in terms of economic balance as the IRR was negative (biogas plant power 25 kW, IRR at −1.35%). In their study, a slightly higher profitability of the investment was obtained, but it should be mentioned that such a difference may be mainly due to higher operational and maintenance (O&M) costs in Italy.

3.4.1. Sensitivity Analysis

Some of the costs presented in the economic analysis are average values, related to investment outlays for small and medium-sized agricultural micro scale biogas plants. Operational and maintenance costs, as well as revenues are also taken into account to a significant extent, depending on the place where the investment is planned. For this reason, it is necessary to present the most important sensitivity analyses of the selected input data in the economic assessment for which the investment recommendation changes.
Figure 5 shows NPV value as a function of price decrease/increase for a given factor. The cost change of 6 factors was assessed: biogas plant, operational labor, microturbine, electricity price, wheel loader, and wood chips price. The possibility of a decrease or increase in the prices of a given factor by a maximum of 40% was taken into account.
Of all the parameters evaluated, the price of electricity is the most influential. This is due to the fact that savings resulting from the lack of purchase of electricity constitute the largest part of the income of an agricultural micro biogas plant. The 40% increase in electricity prices still shows a negative NPV value (−88,800 €), however, compared to the baseline scenario, it significantly improves the economic efficiency of the project. On the other hand, the dynamic reduction in electricity prices results in a sharp deterioration of financial results.
The investment cost related to the construction and purchase of the biogas plant and labor costs also had a high impact on the profitability of the investment. In the case of the considered scenarios (increase/decrease of prices by 40%), the range of the NPV coefficient values for the parameters under consideration is respectively −130,000 € to −340,500 € (biogas plant) and −154,000 € to −316,000 € (labor cost). Among the analyzed parameters, the cost of the microturbine and the price of wood chips have the least impact on the profitability of the project.

3.4.2. Additional Revenues

Due to the theoretical case studies, it was also decided to make an economic analysis based on additional revenues, related to the avoidance of the costs of management and disposal of green waste, as well as the use of digestate as fertilizer.
In the case of additional incomes related to the avoidance of fees related to the management and export of green waste (grass clippings), the following 5 scenarios were analyzed (Table 9). The revenue was estimated based on the tariff, the cost of managing organic waste (grass clippings), including transport, is 0.1 €∙kg−1 [81].
In the case of additional incomes related to the use of digestate, five scenarios were also analyzed (Table 10). The amount of digestate was determined based on the calculations of Czekała [82], who estimates that about 90% of the initial mass of the substrate still remains in the digestate. The value of the digestate as a soil fertilizer was defined as income amounting to 5 €∙t−1 [83]. The disposal costs of the unprocessed digestate (loading and spilling on the golf course) were also taken into account as 4 €∙t−1 [84].
The scenarios were combined with each other. The results of the economic analysis are shown in Figure 6 and Figure 7. The conducted analysis showed that the use of digestate (taking into account its market price) can support the financial performance of a biogas plant, however, the income significantly depends on the avoidance of costs related to the management and disposal of green waste. For the group of the most optimistic scenarios (W1D1, W1D2, W1D3, W1D4, W1D5), assuming the total export of fresh matter of grass clippings, the value of the NPV coefficient was 1,235,000–1,222,000 €, IRR coefficient was 69.22–68.62%, and ROI coefficient was 170.53–181.89%.
On the other hand, for the group of the least optimistic scenarios, which assumed the export and management of 50% of grass clippings, which reduced their weight by 50% and assumed the application of digestate (W5D1, W5D2, W5D3, W5D4, W5D5), the NPV coefficient varied from the value of 142,350 € to the value of 129,250 €, while IRR coefficient varied from 15.15% to the 14.37% and the ROI coefficient varied from the 19.65% to 19.24%. Therefore, it should be recognized that the analyzed additional sources of income can significantly affect the profitability of a micro biogas plant fed by grass clippings from sports fields. It is worth mentioning, however, that this income depends on the grass clippings management and utilization strategy undertaken by a specified sports company.

4. Conclusions

The frequency of mowing of sports turfs, resulting from the need to maintain the height of the grass at an appropriate level, stimulates turf cover and improves resistance to trampling, and causes the generation of a large amount of waste biomass (grass clippings). The ineffectiveness of composting processes and grass cycling makes golf course operators look for new, competitive methods of managing grass clippings, while using valuable organic matter.
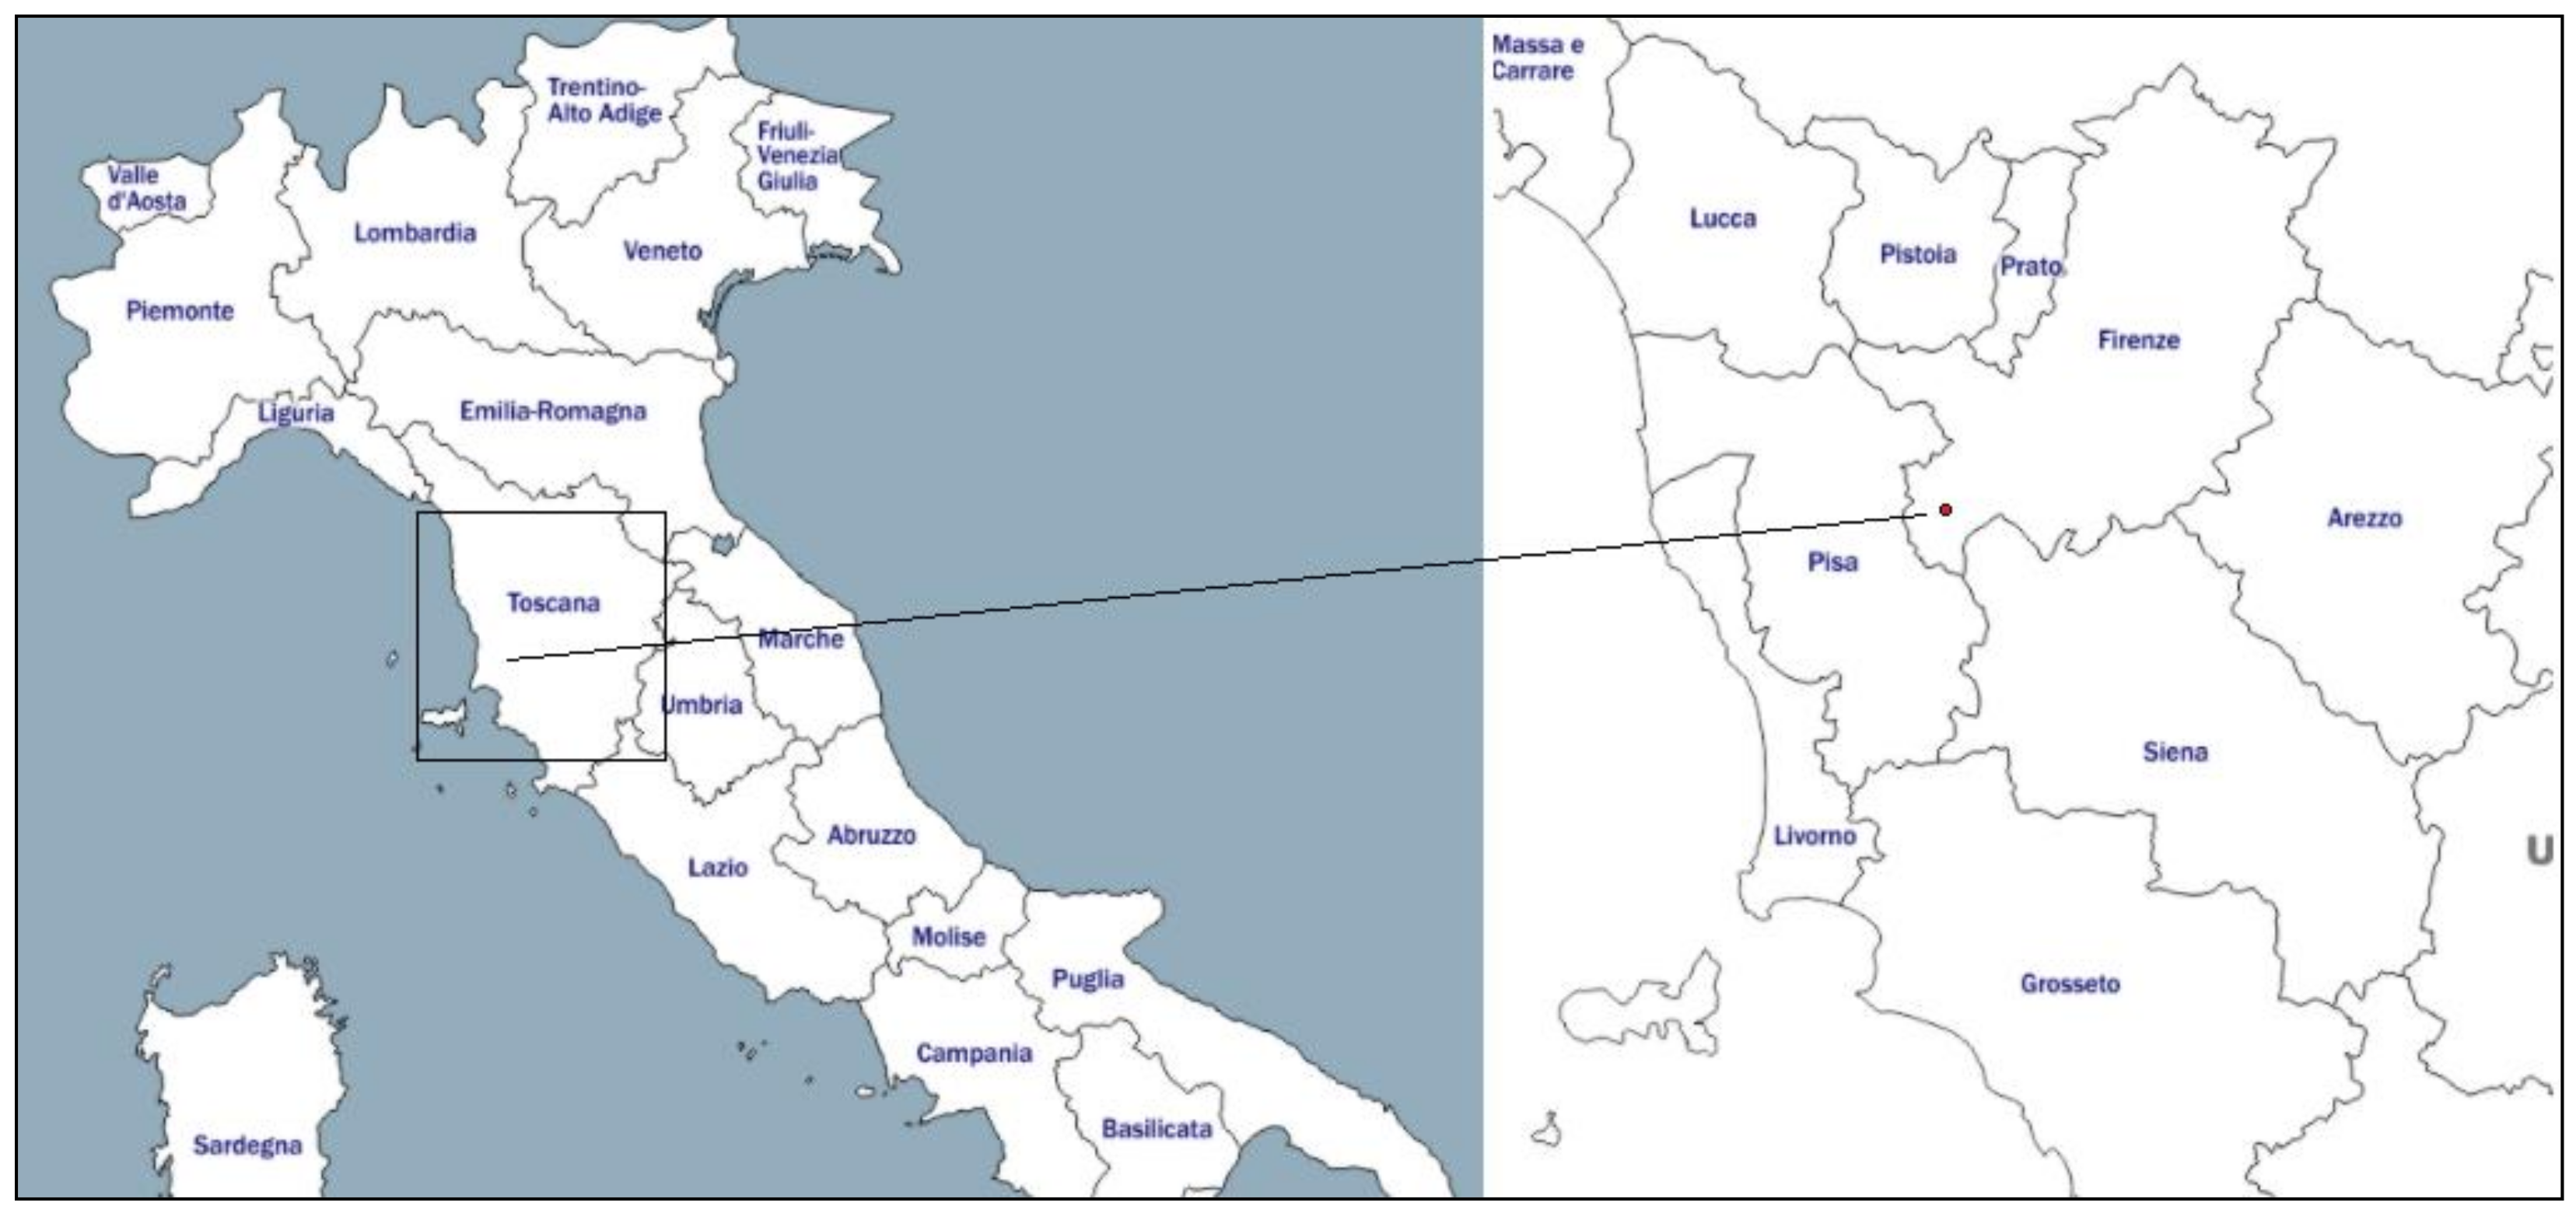
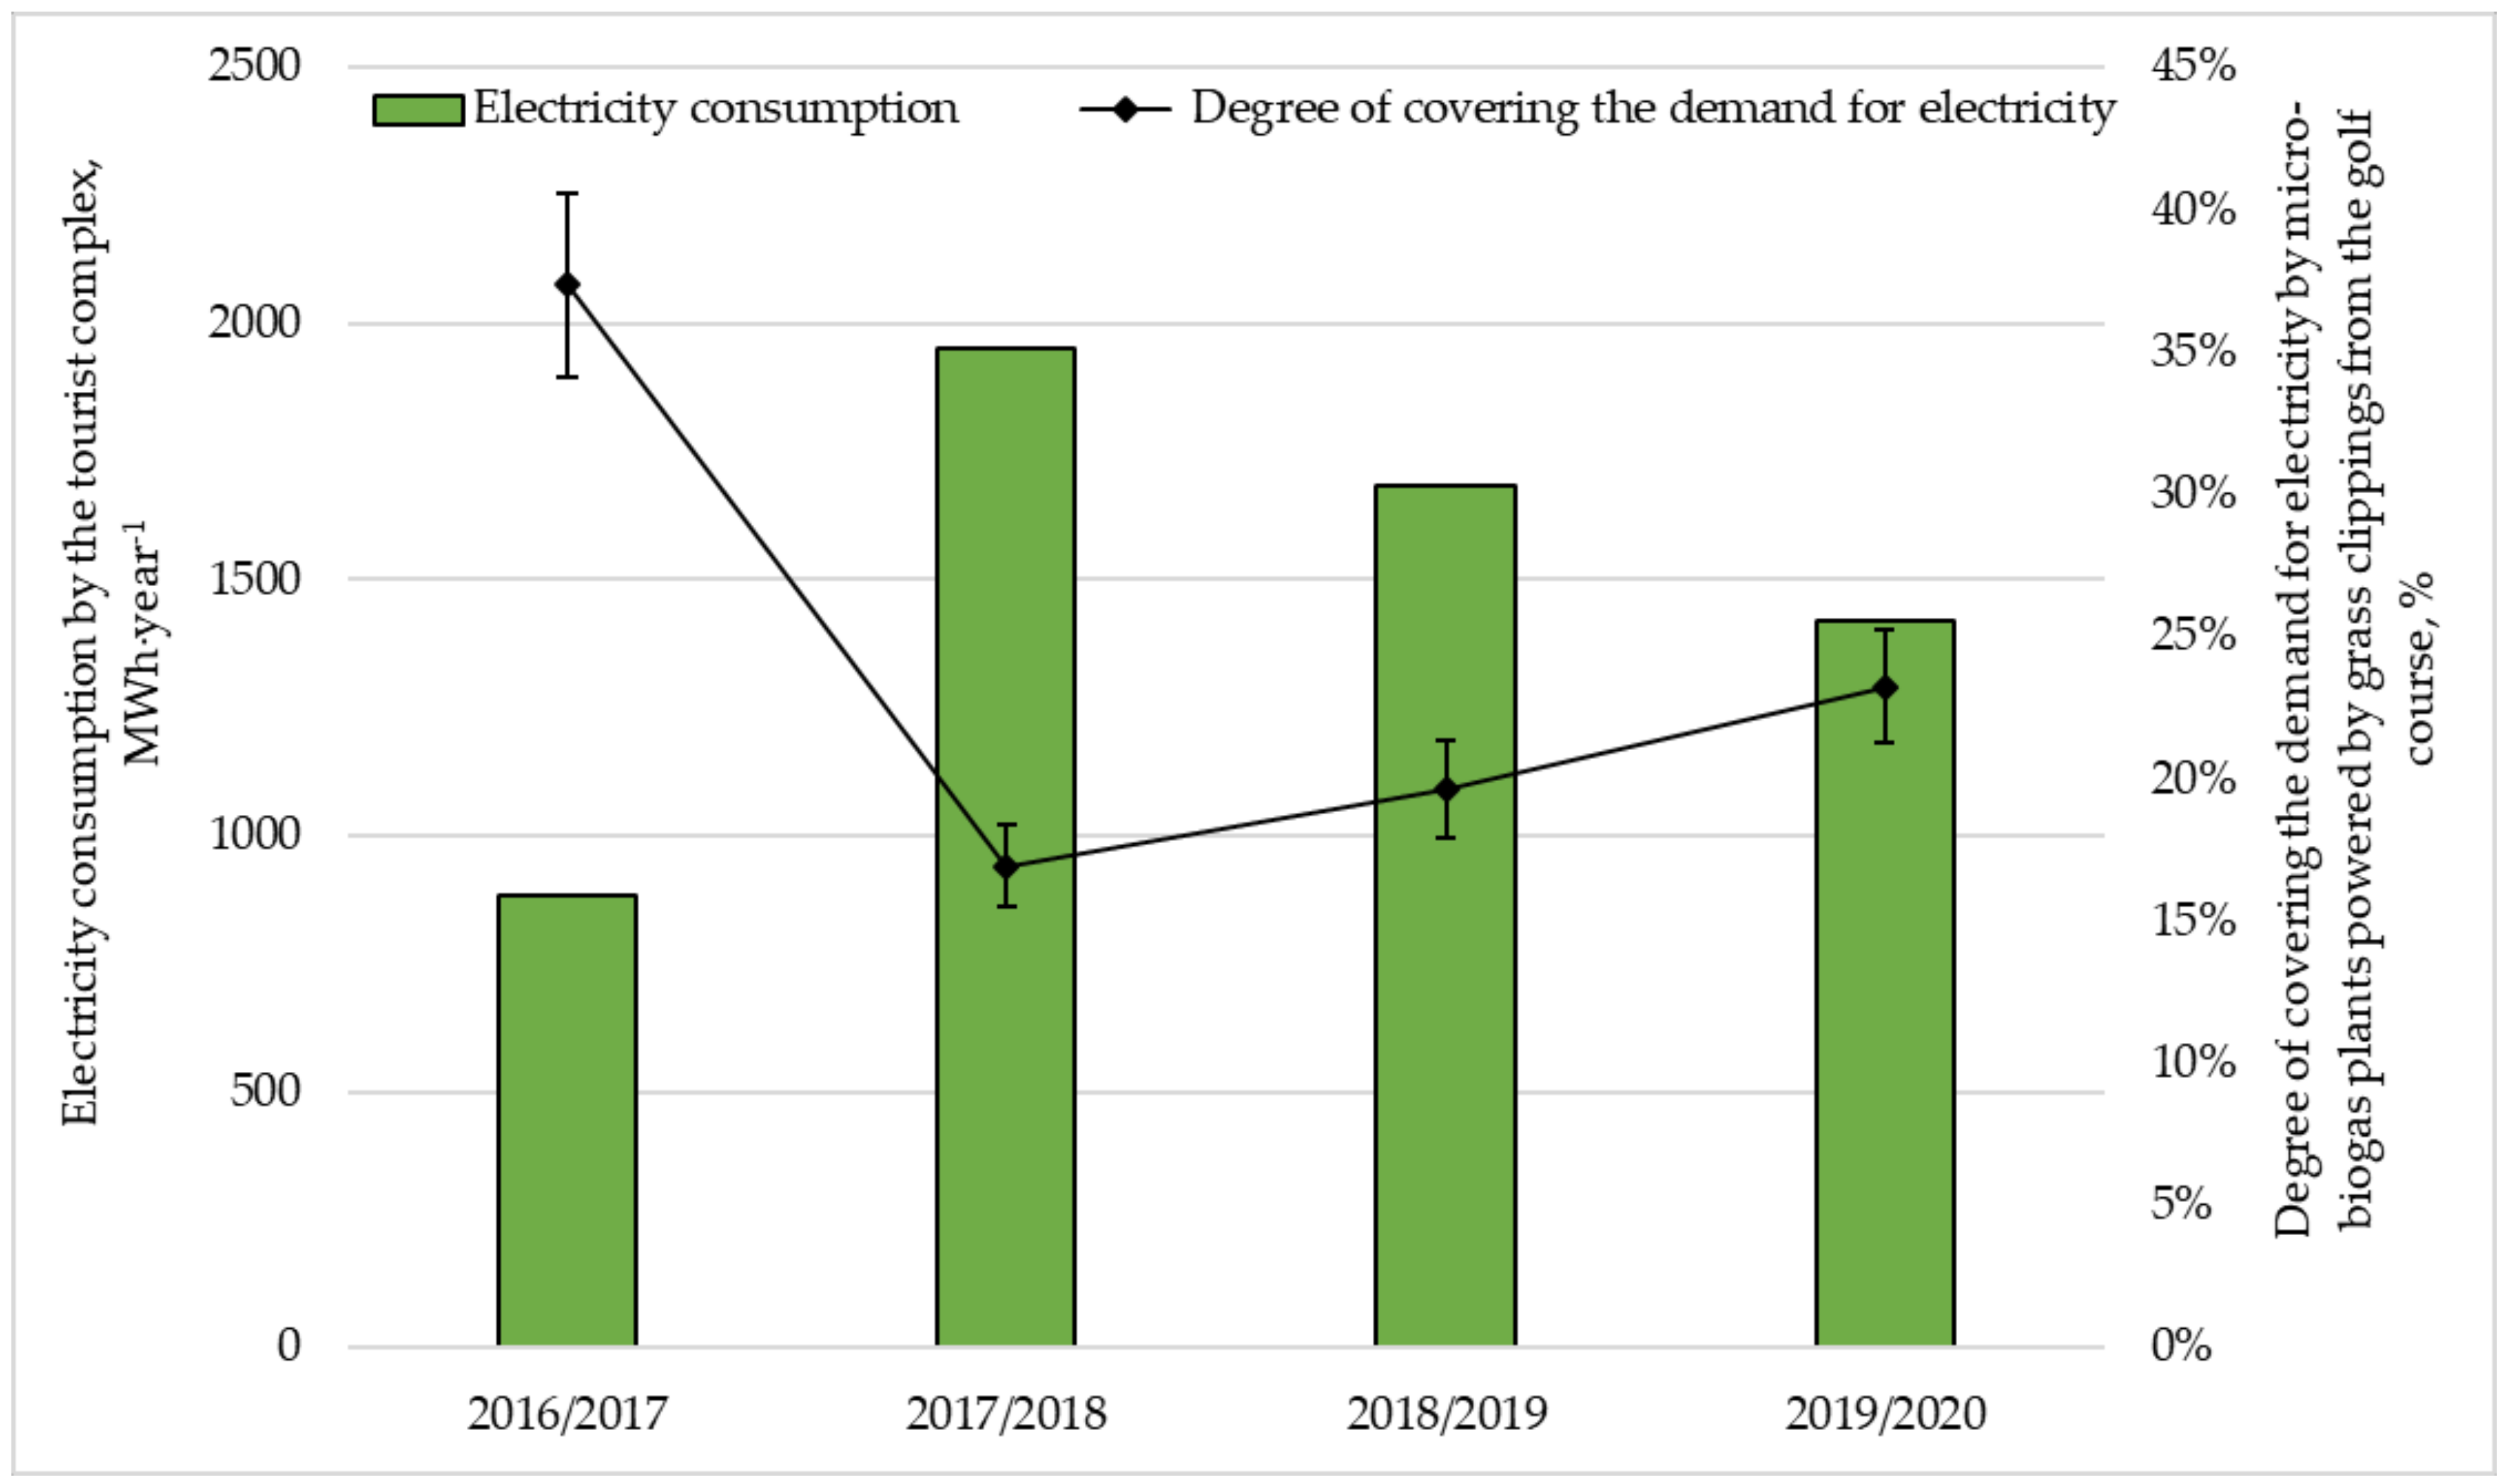
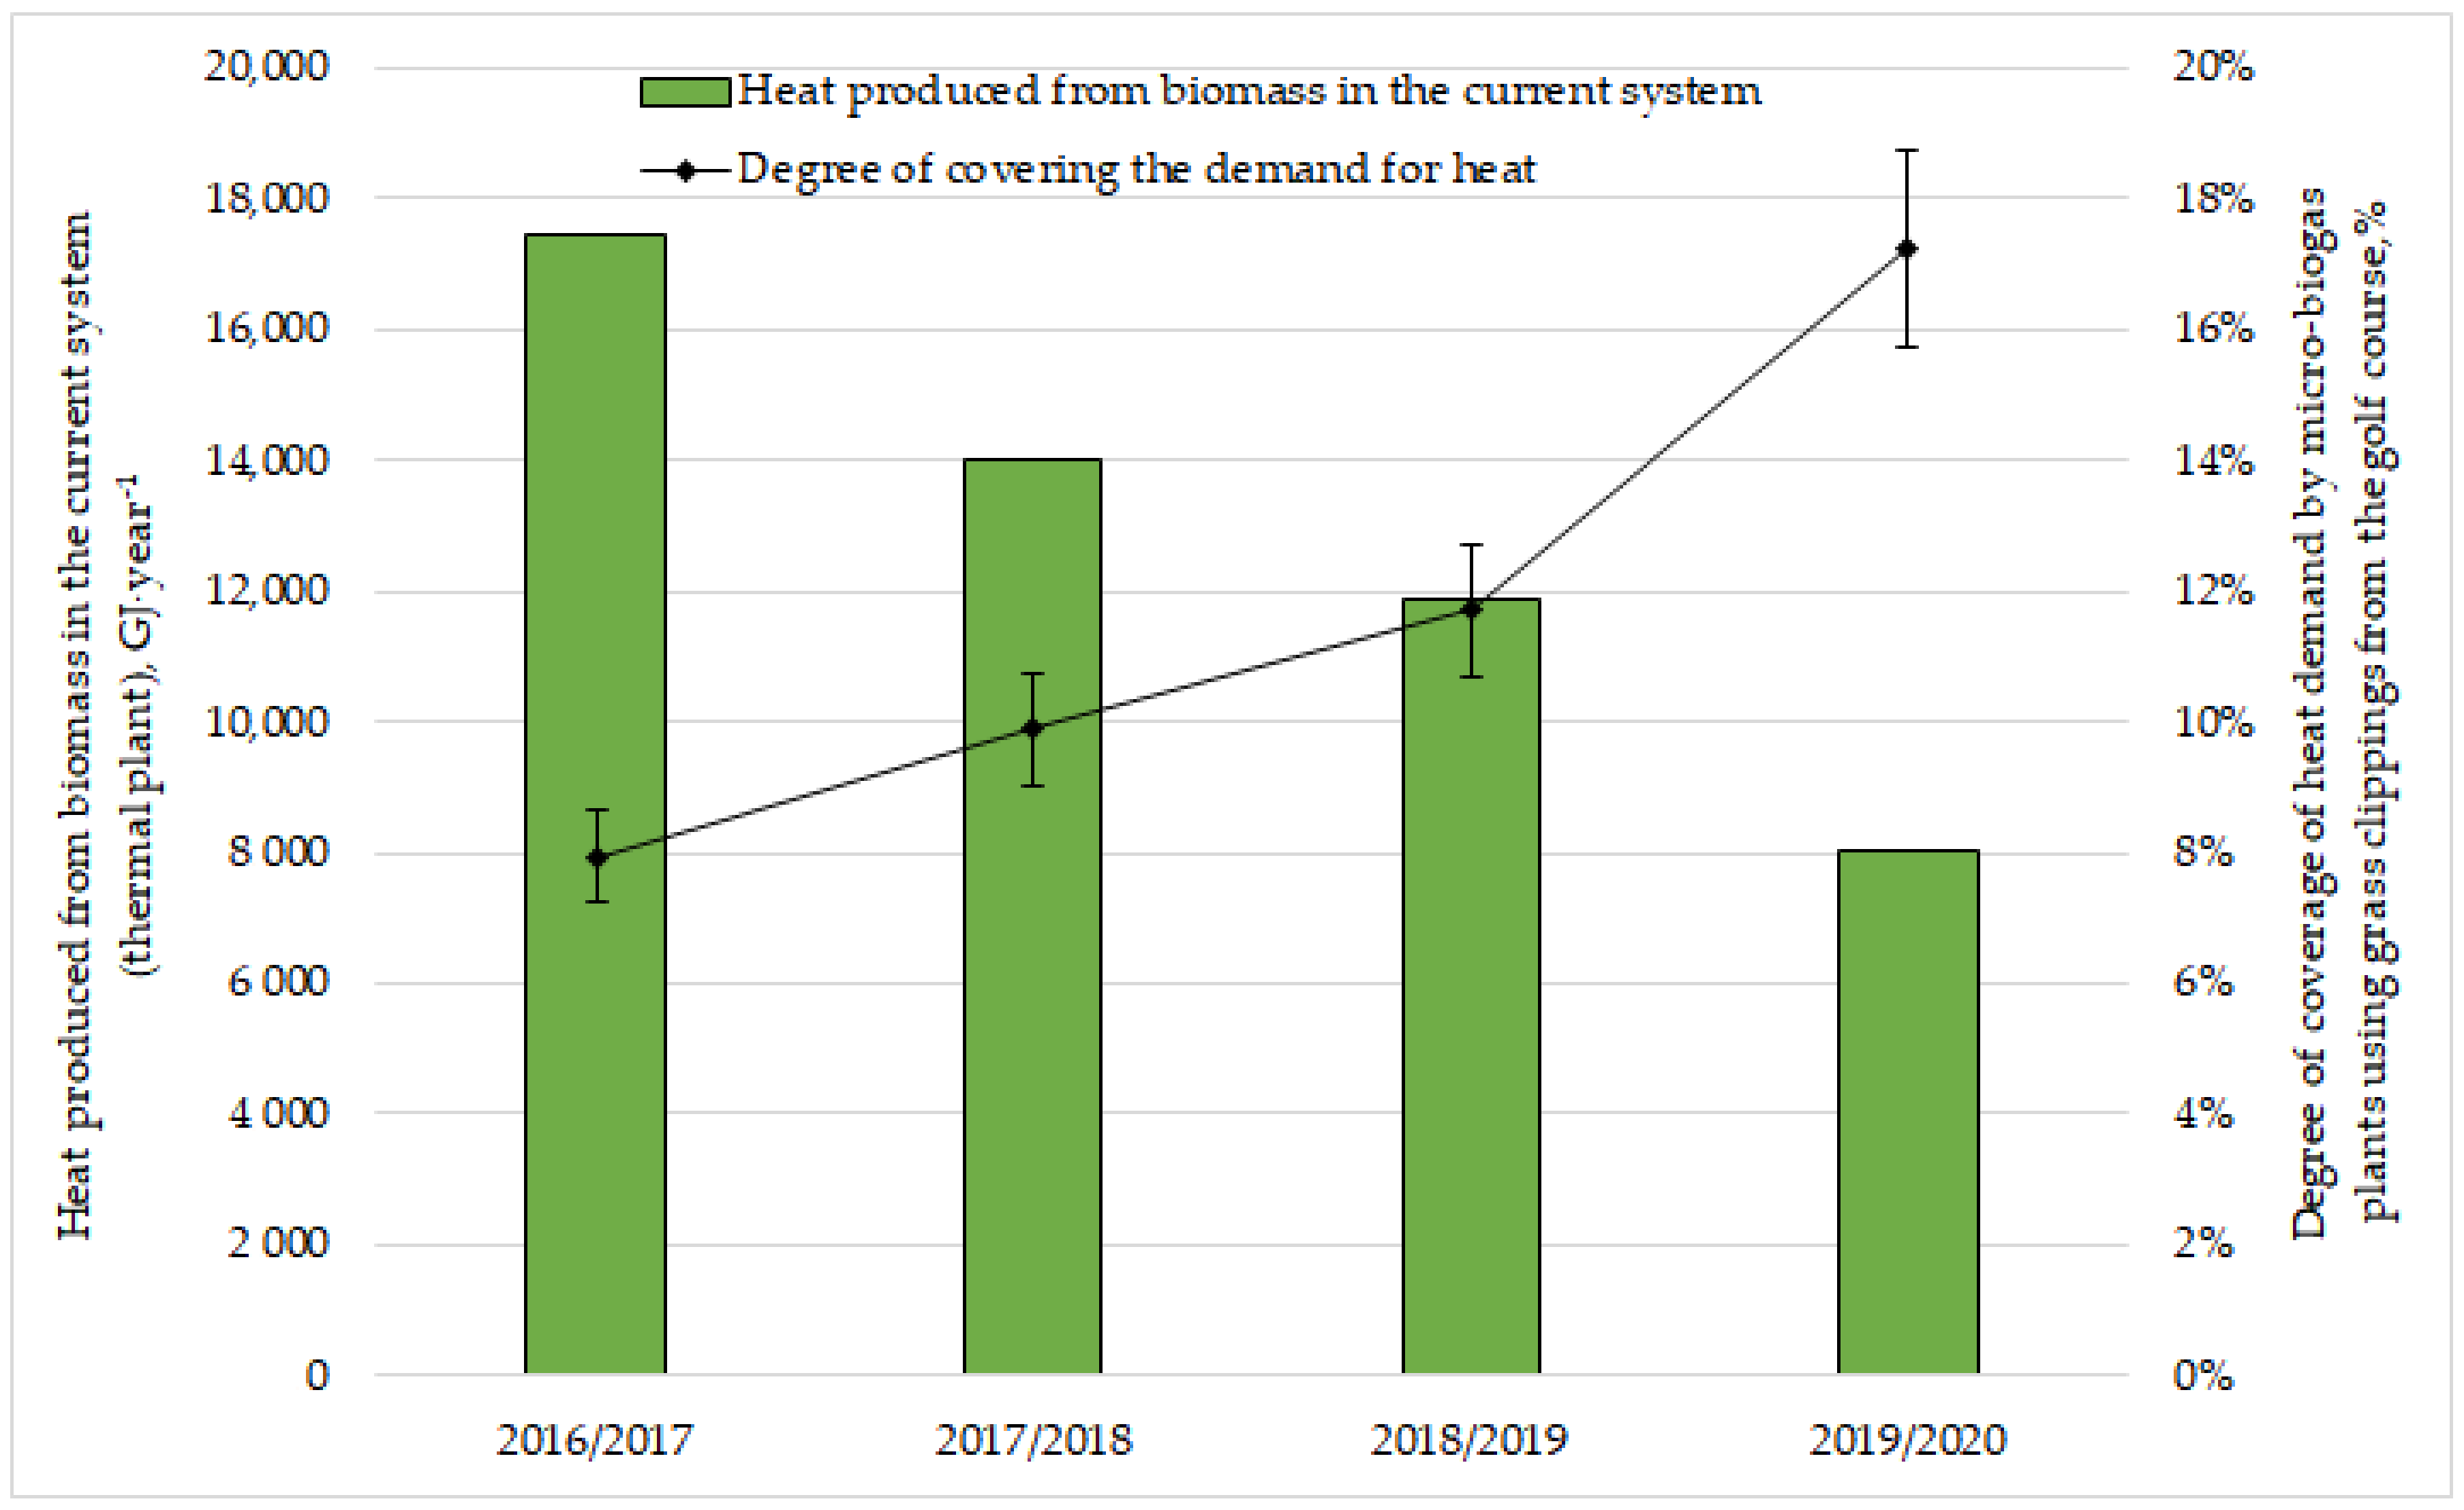
This article analyzes the possibility of energy utilization of grass clippings from a golf course in Tuscany, characterized by a grass surface of 111.21 ha. It was estimated that the annual biomass potential of grass clippings is 526.65 tDM∙year−1 (±45.64 tDM∙year−1), thanks to which it is possible to build a micro biogas plant with a capacity of ca. 46 kW. Electricity (330.57 MWh∙year−1) from the produced biogas is higher than the energy expenditure for mowing (968.21 GJ∙year−1), making the energy balance positive and, depending on the electricity consumption in the tourist resort, is able to cover demand in the range of 16.95–37.35%. Additionally, the generated heat is measurably able to limit heat production from a biomass-fired thermal plant located in a tourist resort. Production of 1388.41 GJ∙year−1 is able to cover demand in the range of 7.95–17.24%.
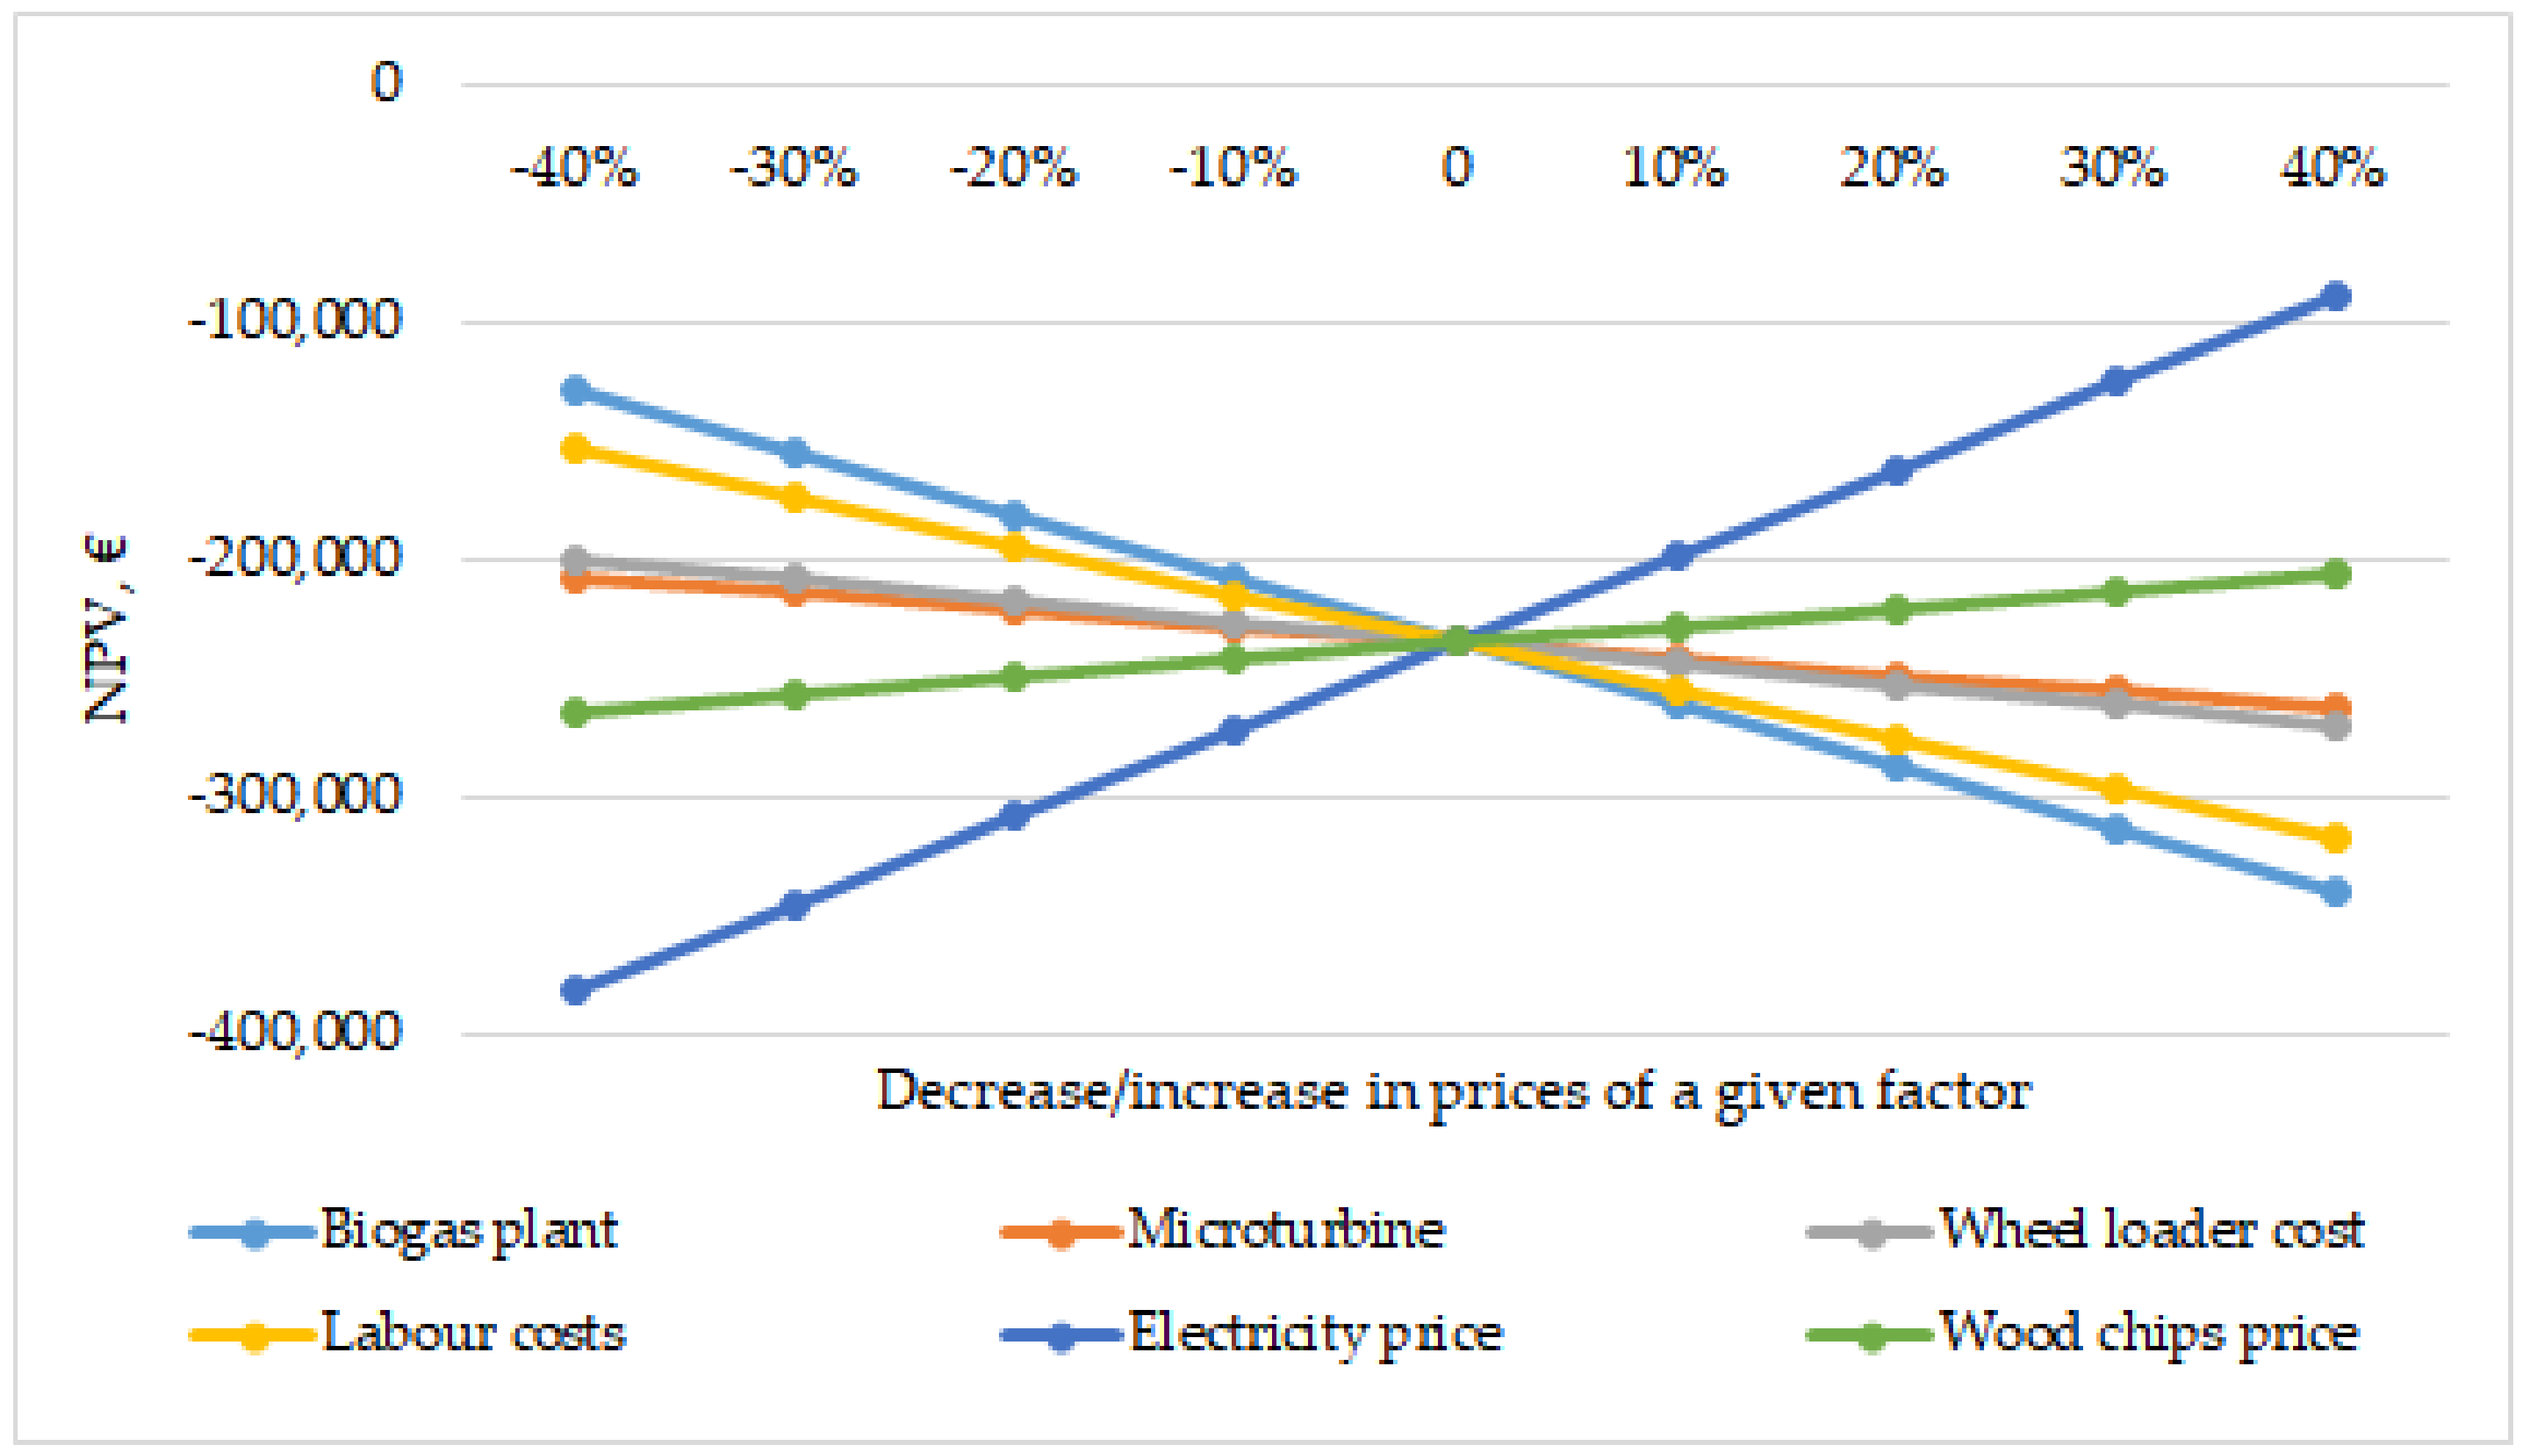
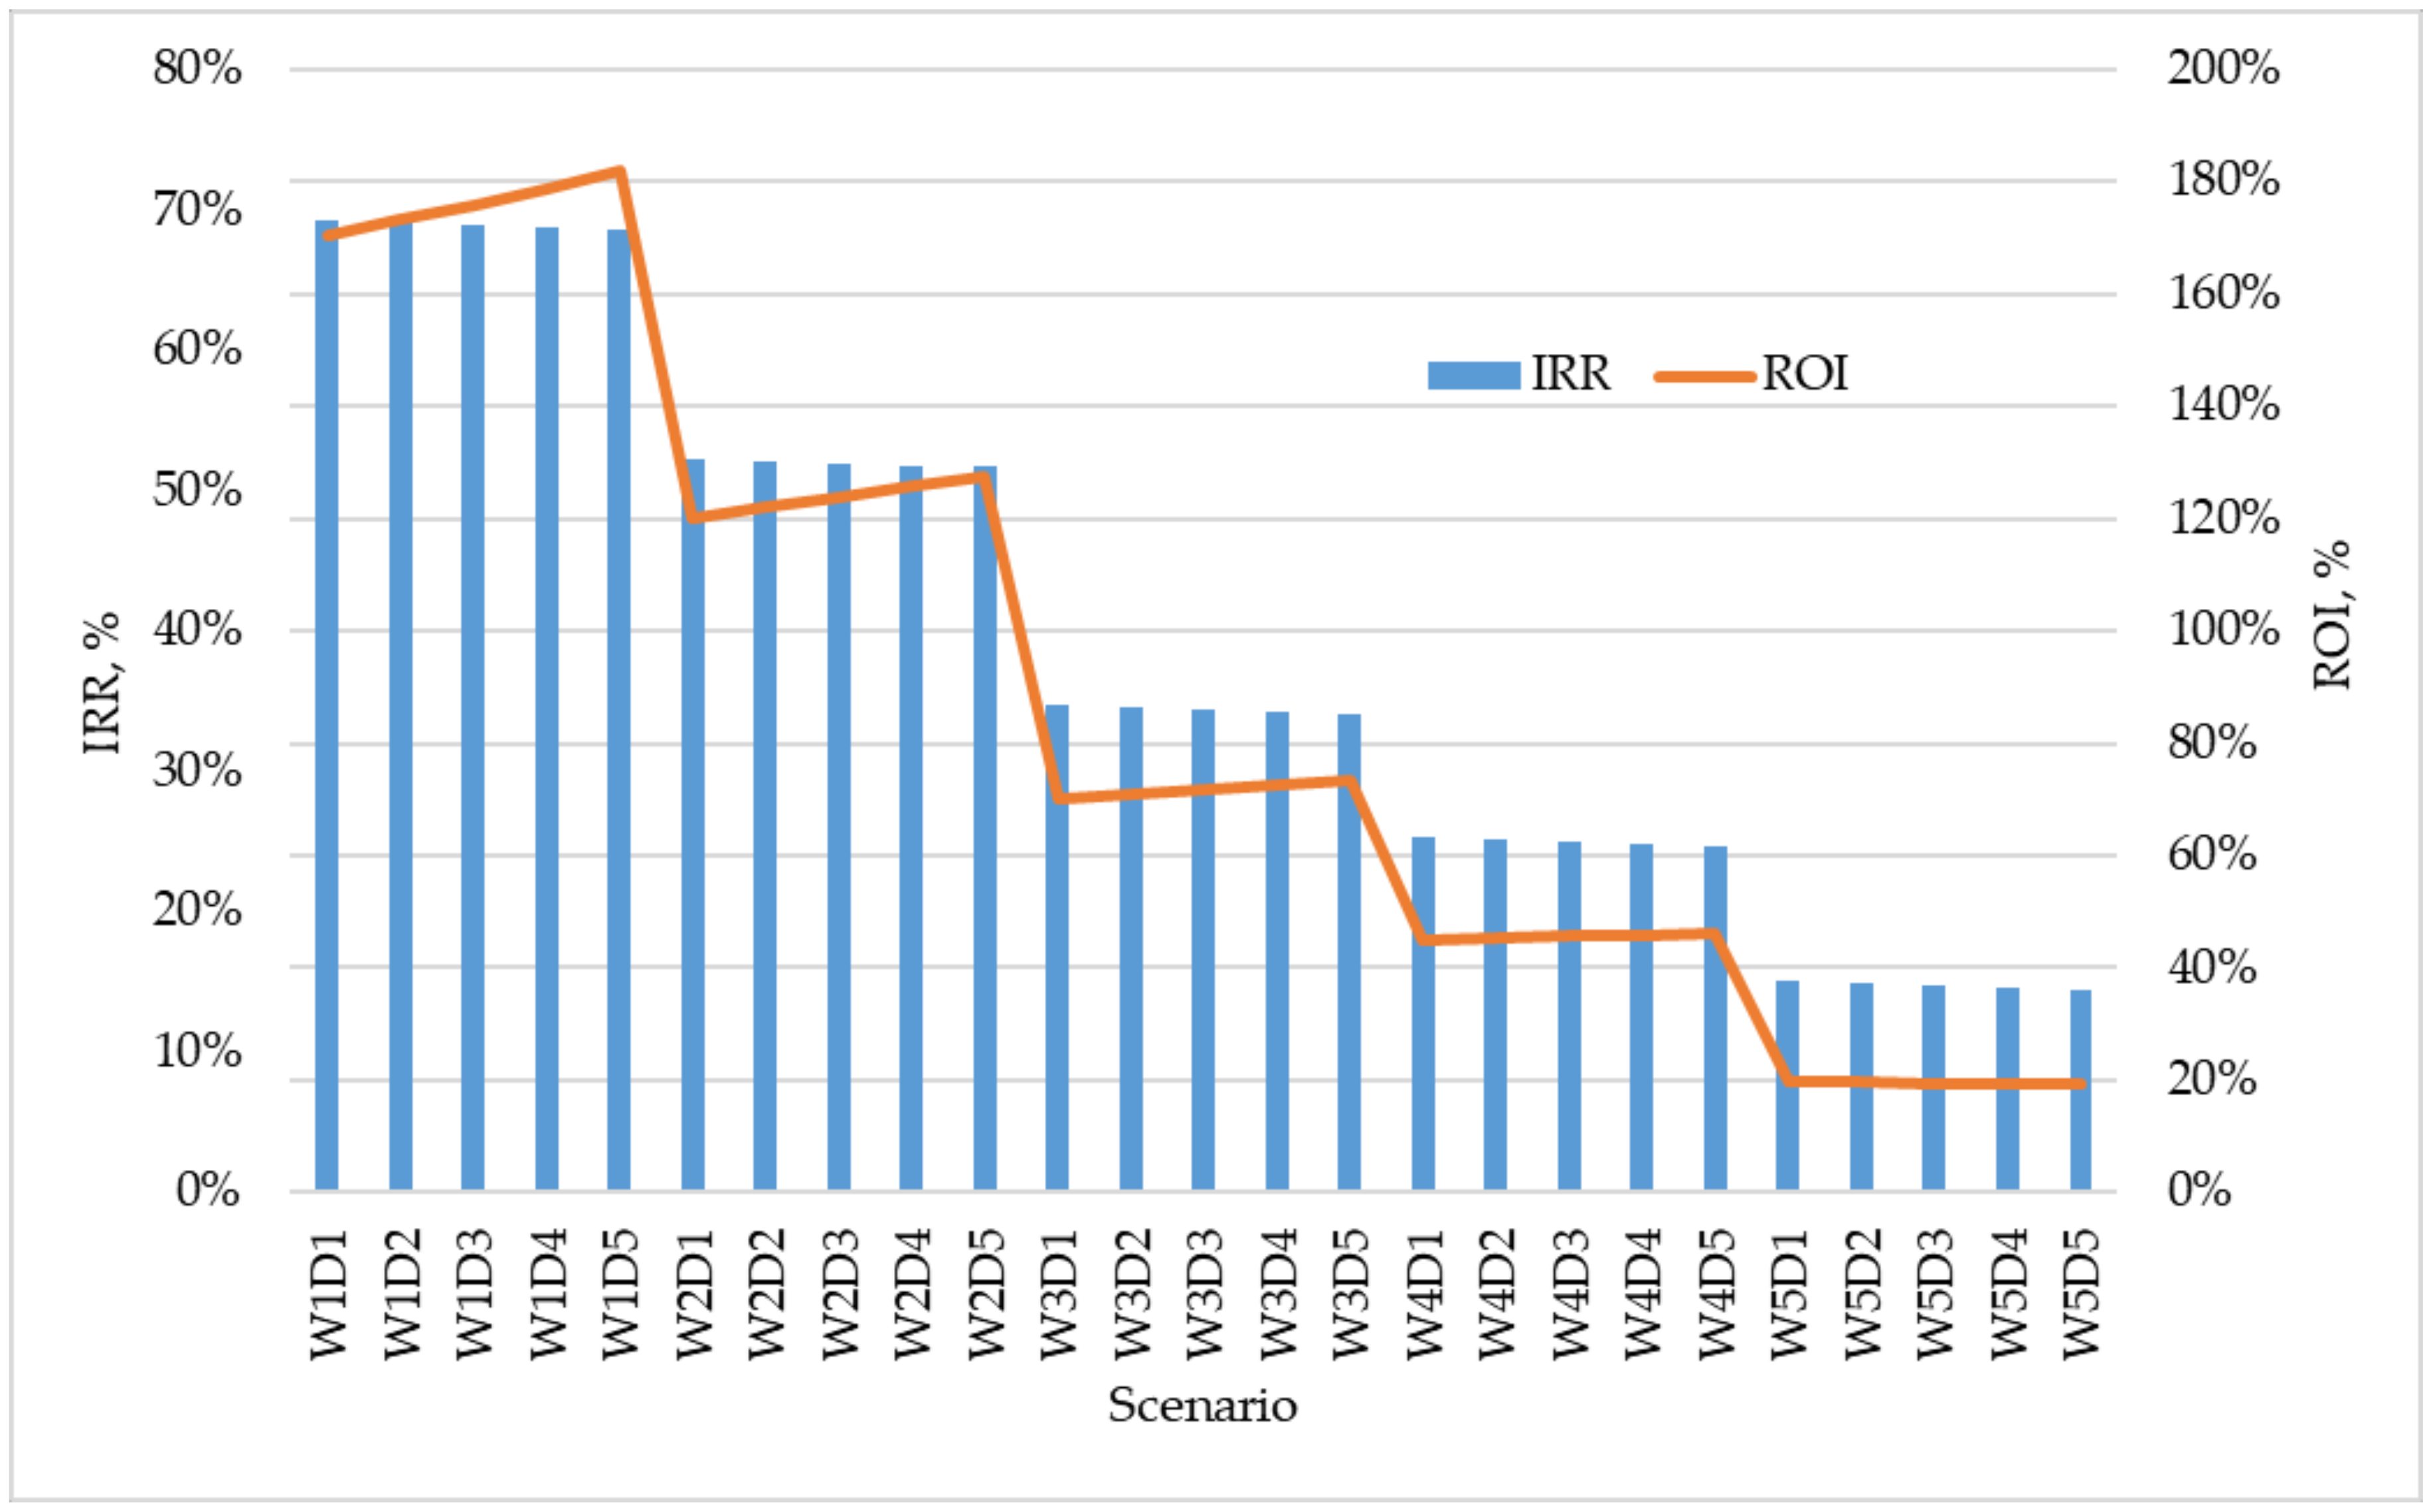
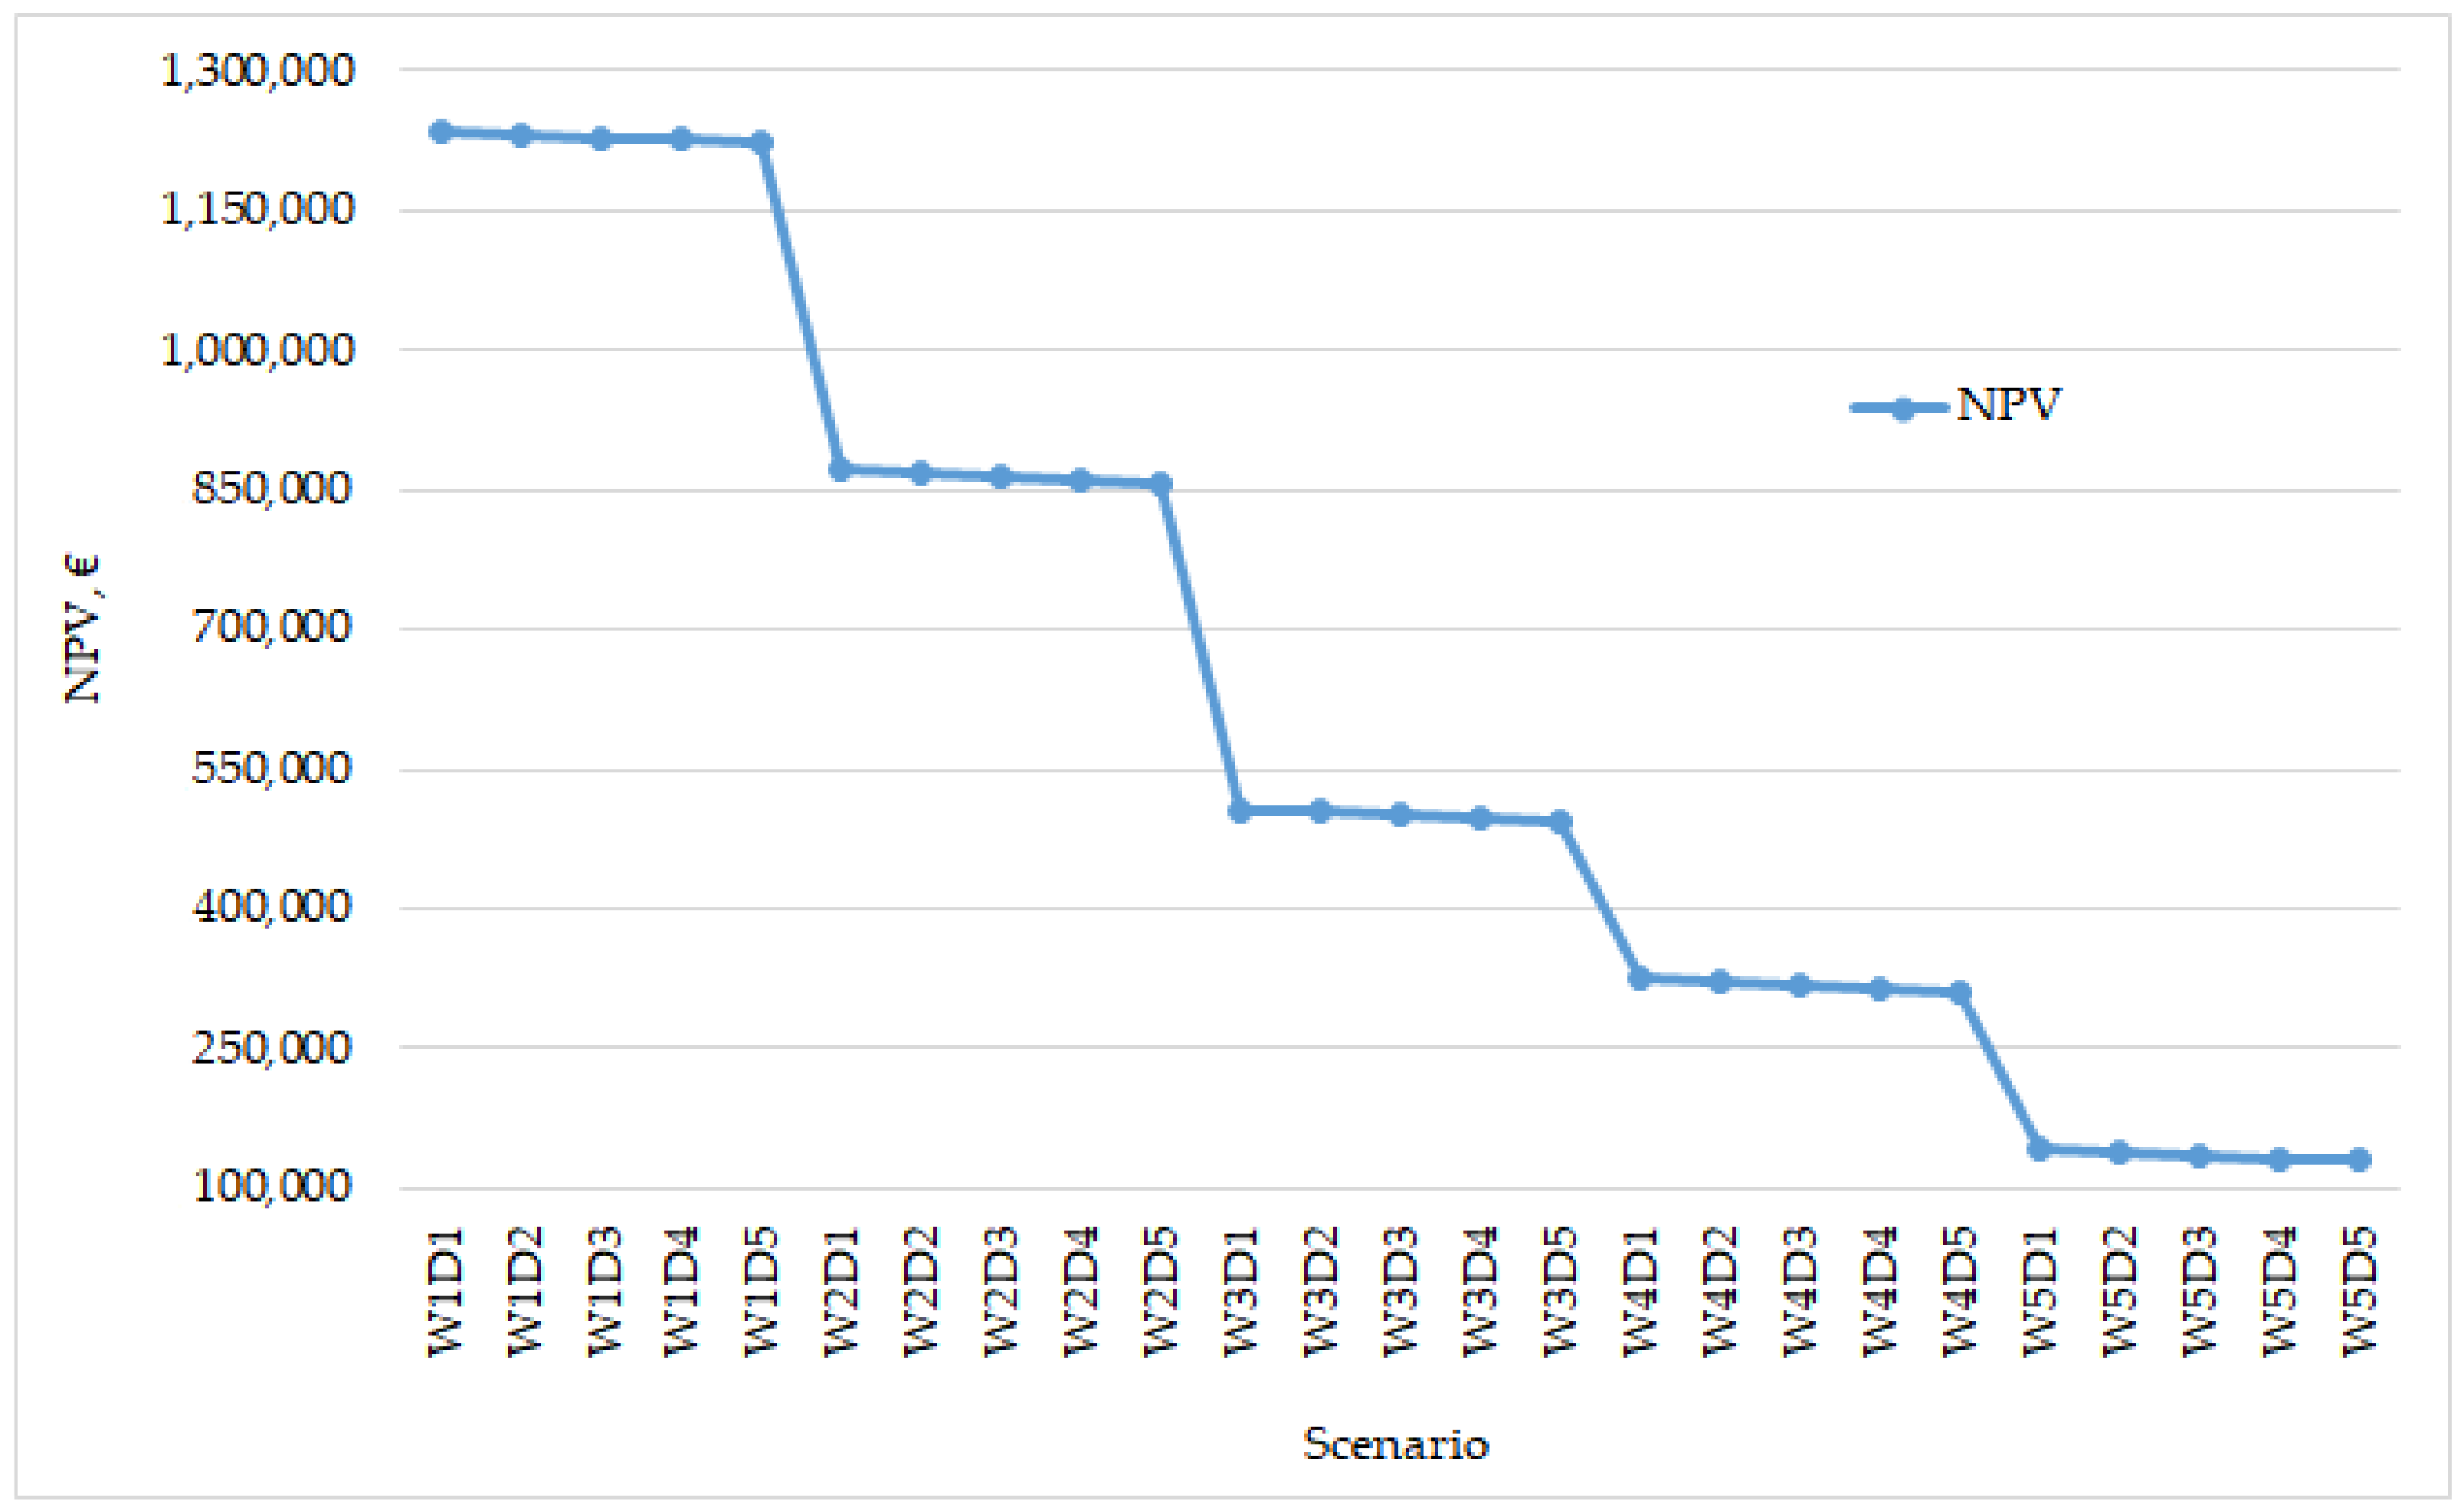
Unfortunately, the analysis showed that the investment is economically unprofitable and is characterized by negative values of the NPV, IRR, and ROI economic indicators (respectively: −235,000 €, −17.74%, −34.98%). It should be mentioned, however, that in the case of golf courses (depending on the management strategy of grass clippings and waste biomass), additional income may be the avoidance of fees related to the management and disposal of green waste. The potential post-fermentation mass can also be used in the fertilization of turf, however, it is necessary to conduct research on the functional and visual characteristics of sports turfs after fertilization with digestate. However, the conducted analysis showed that taking into account the income from these additional sources may make the investment profitable, with a positive NPV coefficient.
It is also worth mentioning that the profitability of the project, which is the construction of a micro biogas plant, fed with grass clippings from sports fields, is conditioned by several technical limitations. They are related not only to the difficulty and complexity of grass monofermentation, but also to the grass clippings management strategy, the availability of infrastructure for biogas plants and biomass storage stations, the possibility of using heat (as well as excess heat in the summer months), and connecting the heat pipeline, and exporting and managing the digestate. For this reason, planning the construction of micro biogas plants in sports facilities should be preceded by a strict case study examination and adaptation of the installation to the existing technical and organizational conditions.
The manuscript also creates space for further economic analyses of the profitability of energy utilization of grass clippings. Due to the need to implement a circular bioeconomy, it should be expected that grass clippings will be treated as a valuable product at an increasing number of sports fields, and the development of technology may contribute to the profitability of investments and the application of micro biogas plants.

Supplementary Materials

The following are available online at https://www.mdpi.com/article/10.3390/en14175520/s1, Table S1: Tuscany golf course specified regions

Author Contributions

Conceptualization, Ł.S. and A.D.; Data curation, Ł.S.; Formal analysis, Ł.S. and A.D.; Funding acquisition, A.D.; Investigation, Ł.S. and A.D.; Methodology, Ł.S. and A.D.; Resources, Ł.S., A.S. and R.P.; Software, Ł.S.; Supervision, A.D.; Validation, A.D. and A.S.; Visualization, Ł.S. and A.D.; Writing—original draft, Ł.S. and A.D.; Writing—review and editing, A.D.; All authors have read and agreed to the published version of the manuscript.

Funding

This research received no external funding.

Institutional Review Board Statement

Not applicable.

Informed Consent Statement

Not applicable.

Data Availability Statement

Data is contained within the article.

Acknowledgments

The authors wish to thank the members of Toscana Resort Castelfalfi for their availability. In particular, we would like to extend our sincere thanks to Manola Alberti (Golf Club Director), Eng. Claudia Tronci (Project Manager) and Daniele Micele (Power Plant Project Manager) for providing primary data of the resort used in this research.

Conflicts of Interest

The authors declare no conflict of interest.

References

  1. Sports Turf Managers Association. Natural Grass Athletic Fields; Sports Turf Managers Association: Lawrence, KS, USA, 2019. [Google Scholar]
  2. Qian, Y.; Follett, R.F.; Kimble, J.M. Soil organic carbon input from urban turfgrasses. Soil Sci. Soc. Am. J. 2010, 74, 366–371. [Google Scholar] [CrossRef]
  3. Braun, R.C.; Bremer, D.J. Carbon Sequestration in Zoysiagrass Turf under Different Irrigation and Fertilization Management Regimes. Agrosyst. Geosci. Environ. 2019, 2, 180060. [Google Scholar]
  4. Bandaranayake, W.; Qian, Y.L.; Parton, W.J.; Ojima, D.S.; Follett, R.F. Estimation of soil organic carbon changes in turfgrass systems using the CENTURY model. Agron. J. 2003, 95, 558–563. [Google Scholar] [CrossRef]
  5. Huh, K.Y.; Deurer, M.; Sivakumaran, S.; McAuliffe, K.; Bolan, N.S. Carbon sequestration in urban landscapes: The example of a turfgrass system in New Zealand. Aust. J. Soil Res. 2008, 46, 610–616. [Google Scholar] [CrossRef]
  6. Qian, Y.; Follett, R.F. Assessing soil carbon sequestration in turfgrass systems using long-term soil testing data. Agron. J. 2002, 94, 930–935. [Google Scholar] [CrossRef]
  7. Wang, Y.; Tu, C.; Li, C.; Tredway, L.; Lee, D.; Snell, M.; Zhang, X.; Hu, S. Turfgrass management duration and intensities influence soil microbial dynamics and carbon sequestration. Int. J. Agric. Biol. 2014, 16, 139–145. [Google Scholar]
  8. Puhalla, J.; Krans, J.; Goatley, M. Sports Fields: A Manual for Design, Construction and Maintenance; John Wiley & Sons, Inc.: Hoboken, NJ, USA, 1999; pp. 39–81. [Google Scholar]
  9. Pirchio, M.; Fontanelli, M.; Labanca, F.; Sportelli, M.; Frasconi, C.; Martelloni, L.; Raffaelli, M.; Peruzzi, A.; Gaetani, M.; Magni, S.; et al. Energetic Aspects of Turfgrass Mowing: Comparison of Different Rotary Mowing Systems. Agriculture 2019, 9, 178. [Google Scholar] [CrossRef] [Green Version]
  10. Aldous, D.E.; Martin, P.M.; Nektarios, P.A.; McAuliffe, K.W. Management of Sports Turf and Amenity Grasslands. Hortic. Plants People Places 2014, 2, 731–761. [Google Scholar]
  11. Christians, N.E. Fundamentals of Turfgrass Management, 4th ed.; John Wiley & Sons, Inc.: Hoboken, NJ, USA, 2011. [Google Scholar]
  12. Bell, M.J.; Baker, S.W.; Canaway, P.M. Playing quality of sports surfaces: A review. J. Sports Turf. Res. Inst. 1985, 61, 26–45. [Google Scholar]
  13. McCoy, E.; Sherratt, P.; Street, J. Landscaped Commercial Areas: Golf Course and Athletic Field Soils. Agric. Sci. Vol. II 2009, 2, 424–441. [Google Scholar]
  14. March, S.R.; Martins, D.; McElroy, J.S. Growth Inhibitors in turfgrass. Planta Daninha Viçosa-MG 2013, 31, 733–747. [Google Scholar] [CrossRef] [Green Version]
  15. Linde, D. How mowing affects turf. SportsTurf 2015, 31, 22–25. [Google Scholar]
  16. Montgomery, B. Efficient and economical mowing. SportsField Manag. 2019, 35, 34–37. [Google Scholar]
  17. Rice, K. Fuel Efficiency of Golf Course Mowing Equipment. Hole Notes 2010, 42, 7–9. [Google Scholar]
  18. Hameed, I.A.; Sorrenson, C.G.; Bochtis, D.; Green, O. Field robotics in sports: Automatic generation of guidance lines for automatic grass cutting, stripping and pitch marking of football playing fields. Int. J. Adv. Robot. Syst. 2011, 8, 113–121. [Google Scholar] [CrossRef]
  19. Grossi, N.; Volterrani, M.; Magni, S.; Miele, S. Tall Fescue Turf Quality and Soccer Playing Characteristics as Affected by Mowing Height. Acta Hortic. 2004, 661, 319–322. [Google Scholar] [CrossRef]
  20. Niekraś, L.; Moliszewska, E. Preliminary assessment of the possibility of supporting the decomposition of biodegradable packaging. In Proceedings of the 9th Conference on Interdisciplinary Problems in Environmental Protection and Engineering EKO-DOK, Boguszow-Gorce, Poland, 23–25 April 2017; p. 00066. [Google Scholar]
  21. Boumtje, P.I.; Florkowski, W.J.; Landry, G.W., Jr.; Escalante, C.L. Factors Affecting the Profitability of Golf Courses. In Proceedings of the Georgia 2004 Annual Meeting, Tulsa, OK, USA, 14–18 February 2004. [Google Scholar]
  22. Tidåker, P.; Wesström, T.; Kättererc, T. Energy use and greenhouse gas emissions from turf management of two Swedish golf courses. Urban For. Urban Green. 2017, 21, 80–87. [Google Scholar] [CrossRef]
  23. Grossi, N.; Fontanelli, M.; Garramone, E.; Peruzzi, A.; Raffaelli, M.; Pirchio, M.; Martelloni, L.; Frasconi, C.; Caturegli, L.; Gaetani, M.; et al. Autonomous Mower Saves Energy and Improves Quality of Tall Fescue Lawn. HortTechnology 2016, 26, 825–830. [Google Scholar] [CrossRef] [Green Version]
  24. Soldat, D.J.; Brosnan, J.T.; Chandra, A.; Gaussoin, R.E.; Kowalewski, A.; Leinauer, B.; Rossi, F.S.; Stier, J.C.; Unruh, J.B. Estimating Economic Minimums of Mowing, Fertilizing and Irrigating Turfgrass. Agric. Environ. Lett. 2020, 5, e20032. [Google Scholar] [CrossRef]
  25. Deutsche Golf Holding Ltd. Detail Overview Golf and Landscape Elements; Deutsche Golf Holding Ltd.: Essen, Germany, 2021. [Google Scholar]
  26. Waltz, C.; Griffin, B. Grasscycling: Let the Clippings Fall Where They May; Circular 1031; University of Georgia Extension, University of Georgia: GA, Athens, USA, 2017. [Google Scholar]
  27. Colt, W.M.; Rynk, R.; Bell, S.; Johnston, W.J. Don’t Bag It! Recycle Your Grass Clippings; University of Idaho, Ag Publications: Moscow, ID, USA, 1994. [Google Scholar]
  28. Hoyle, J. Recycling Grass Clippings; MF2110; Kansas State University Research and Extension: Manhattan, KS, USA, 2017. [Google Scholar]
  29. Sachs, P.D. Managing Healthy Sports Fields: A Guide to Using Organic Materials for Low-Maintenance and Chemical-Free Playing Fields; John Wiley & Sons, Inc.: Hoboken, NJ, USA, 2004. [Google Scholar]
  30. Wolski, K.; Talar-Krasa, M.; Świerszcz, S.; Biernacik, M.; Dradrach, A.; Szymura, M. Visual and functional evaluation of football turf. Electron. J. Pol. Agric. Universties 2016, 19, 4. [Google Scholar]
  31. Reyes-Torres, M.; Oviedo-Ocaña, E.R.; Dominguez, I.; Komilis, D.; Sánchez, A. A systematic review on the composting of green waste: Feedstock quality and optimization strategies. Waste Manag. 2018, 77, 486–499. [Google Scholar] [CrossRef]
  32. Tencza, B. Managing and Protecting Quality Turfgrass Areas: Assessing the Impact of Leaf Compost Topdressing on Organically Managed Athletic Fields and Evaluating the Effects of Portable Roadway Systems on Turfgrass Performance and Soil Physical Properties. Master’s Thesis, University of Connecicut, Storrs, CT, USA, 2014. [Google Scholar]
  33. Heckman, J.R.; Liu, H.; Hill, W.; DeMilia, M.; Anastasia, W.L. Kentucky bluegrass responses to mowing practice and nitrogen fertility management. J. Sustain. Agric. 2000, 15, 25–33. [Google Scholar] [CrossRef]
  34. Kopp, K.L.; Guillard, K. Clipping management and nitrogen fertilization of turfgrass. Crop Sci. 2002, 42, 1225–1231. [Google Scholar] [CrossRef]
  35. Starr, J.L.; DeRoo, H.C. The fate of nitrogen fertilizer applied to turfgrass. Crop Sci. 1981, 21, 531–536. [Google Scholar] [CrossRef]
  36. Bigelow, C.A.; Waddill, D.W.; Chalmers, D.R. Turf-type tall fescue lawn turf response to added clippings. Int. Turfgrass Soc. Res. J. 2005, 10, 916–922. [Google Scholar]
  37. Law, Q.D.; Bigelow, C.A.; Patton, A.J. Selecting Turfgrasses and Mowing Practices that Reduce Mowing Requirements. Crop Sci. 2016, 56, 3318–3327. [Google Scholar] [CrossRef] [Green Version]
  38. Bauer, S.; Weisenhorn, J.; Mugass, B.; Pedersen, B. What to Do with Lawn Clippings; University of Minnesota Extension: Minneapolis, MN, USA, 2018. [Google Scholar]
  39. Nitsche, M.; Hensgen, F.; Wachendorf, M. Using Grass Cuttings from Sports Fields for Anaerobic Digestion and Combustion. Energies 2017, 10, 388. [Google Scholar] [CrossRef] [Green Version]
  40. Oldenburg, S.; Westphal, L.; Körner, I. Energy Recovery of Grass Biomass. WIT Trans. Ecol. Environ. 2011, 143, 383–395. [Google Scholar] [CrossRef] [Green Version]
  41. Bedoić, R.; Čuček, L.; Ćosić, B.; Krajnc, D.; Smoljanić, G.; Kravanja, Z.; Ljubas, D.; Pukšec, T.; Duić, N. Green biomass to biogas—A study on anaerobic digestion of residue grass. J. Clean. Prod. 2019, 213, 700–709. [Google Scholar] [CrossRef]
  42. Thamsiriroj, T.; Nizami, A.S.; Murphy, J.D. Why does mono-digestion of grass silage fail in long term operation? Appl. Energy 2012, 95, 64–76. [Google Scholar] [CrossRef]
  43. Dussadee, N.; Unpaprom, Y.; Ramaraj, R. Grass silage for biogas production. In Advances in Silage Production and Utilization; IntechOpen: London, UK, 2016; p. 153. [Google Scholar] [CrossRef] [Green Version]
  44. Henle, W.; Hanisch, A.; Kaniecki, J.; Graeff-Hönninger, S.; Claupein, W. Untersuchungen zum Bioenergiepotential auf drei Golfplätzen in Südwestdeutschland. In Proceedings of the Energetische Nutzung von Grünlandaufwüchsen. 56. Jahrestagung der AGGF, Witzenhausen, Germany, 30 August–1 September 2012. (In German). [Google Scholar]
  45. Thumm, U.; Thonn, B.; Henle, W.; Schneider, H.; Claupein, W. Energetische Verwertung des Schnittgutes von Golfanlagen. EJTS 2009, 4, 133–136. (In German) [Google Scholar]
  46. Grigutsch, W.; Lütke Entrup, N.; Bocksch, M. Untersuchungen zur Bewertung von Rasengräserarten, -sorten und -mischungen über die Aufwuchsleistung. Rasen-Turf-Gazon 1999, 30, 44–48. (In German) [Google Scholar]
  47. Hardt, G. Einfluß von Stickstoff-Düngerform und N-Aufwand auf den N-Umsatz in Pflanze und Boden Sowie auf die Narbenqualität Eines. Golfgruns. Dissertation (Ph.D. Thesis), University of Hohenheim, Stuttgart, Germany, 1994. (In German). [Google Scholar]
  48. Krauter, C.; Schulz, H. Biomasseanfall verschiedener Pflanzenbestände auf Landschaftsrasen. Rasen-Turf-Gazon 1992, 23, 17–28, 40–45, 81–88. (In German) [Google Scholar]
  49. Lassen, D. Anforderungen von Naturschutz and Landschaftspflege an die ökologischen Standortbedingungen eines Golfplatzes. Rasen-Turf-Gazon 1989, 20, 68–71. (In German) [Google Scholar]
  50. CSIRO Food and Nutritional Sciences: Meat Industry Services. Composting of Slaughterhouse Waste Material and Dead Stock; CSIRO Food and Nutritional Sciences—Meat Industry Services: Brisbane, Australia, 2002. [Google Scholar]
  51. Leible, S.; Kälber, S.; Kappler, G.; Oechsner, H.; Mönch-Tegeder, M. Biogas aus Landschaftspflegegras Möglichkeiten und Grenzen; KIT Scientific Publishing: Karlsruhe, Germany, 2015. (In German) [Google Scholar]
  52. Meyer, A.K.P.; Ehimen, E.A.; Holm-Nielsen, J.B. Bioenergy production from roadside grass: A case study of the feasibility of using roadside grass for biogas production in Denmark. Resour. Conserv. Recycl. 2014, 93, 124–133. [Google Scholar] [CrossRef] [Green Version]
  53. Podkówka, W.; Podkówka, Z. Technologia Kiszenia Biomasy na Cele Paszowe i Biogaz Rolniczy (Technology of Silage of Biomass for Fodder and Agricultural Biogas); Powszechne Wydawnictwo Rolnicze i Leśne: Warsaw, Poland, 2017. (In Polish) [Google Scholar]
  54. Spyridonidis, A.; Vasiliadou, I.A.; Akratos, C.S.; Stamatelatou, Κ. Performance of a Full-Scale Biogas Plant Operation in Greece and Its Impact on the Circular Economy. Water 2020, 12, 3074. [Google Scholar] [CrossRef]
  55. Jarrar, L.; Ayadi, O.; Al Asfar, J. Techno-economic Aspects of electricity generation from a farm based biogas plant. J. Sustain. Dev. Energy Water Environ. Syst. 2020, 8, 476–492. [Google Scholar] [CrossRef] [Green Version]
  56. Tucki, K.; Klimkiewicz, M.; Mruk, R.; Piątkowski, P. Design of Digester Biogas Tank Part 1: Biogas Calculator—Tool to Perform Biogas Energy Calculations. TEKA. Commision Mot. Energetics Agric. 2015, 15, 75–82. [Google Scholar]
  57. Porcu, A.; Sollai, S.; Marotto, D.; Mureddu, M.; Ferrara, F.; Pettinau, A. Techno-Economic Analysis of a Small-Scale Biomass-to-Energy BFB Gasification-Based System. Energies 2019, 12, 494. [Google Scholar] [CrossRef] [Green Version]
  58. Cucui, G.; Ionescu, C.A.; Goldbach, I.R.; Coman, M.D.; Marin, E.L.M. Quantifying the Economic Effects of Biogas Installations for Organic Waste from Agro-Industrial Sector. Sustainability 2018, 10, 2582. [Google Scholar] [CrossRef] [Green Version]
  59. Carlini, M.; Mosconi, E.M.; Castellucci, S.; Villarini, M.; Colantoni, A. An Economical Evaluation of Anaerobic Digestion Plants Fed with Organic Agro-Industrial Waste. Energies 2017, 10, 1165. [Google Scholar] [CrossRef]
  60. Igliński, B.; Piechota, G.; Iwański, P.; Skrzatek, M.; Pilarski, G. 15 years of the Polish agricultural biogas plants: Their history, current status, biogas potential and perspectives. Clean Technol. Environ. Policy 2020, 22, 291–307. [Google Scholar] [CrossRef]
  61. Zizlavsky, O. Net present value approach: Method for economic assessment of innovation projects. Procedia Soc. Behav. Sci. 2014, 156, 506–512. [Google Scholar] [CrossRef]
  62. El Tahir, Y.; El Otaibi, D. Internal rate of return: A suggested alternative formula and its macro-economic implications. J. Am. Sci. 2014, 10, 216–221. [Google Scholar]
  63. Wunder, T. What is strategy? In Essentials of Strategic Management: Effective Formulation and Execution of Strategy; Schäffer-Poeschel Verlag: Stuttgart, Germany, 2016; pp. 1–38. [Google Scholar]
  64. Perkins, C. The Performance of Golf: Landscape, Place, and Practice in North West England. J. Sport Soc. Issues 2010, 34, 312–338. [Google Scholar] [CrossRef]
  65. Nooten, S.S.; Schultheiss, P.; Wright, J.; Macdonald, C.; Singh, B.K.; Cook, J.M.; Power, S.A. What shapes plant and animal diversity on urban golf courses? Urban Ecosyst. 2018, 21, 565–576. [Google Scholar] [CrossRef]
  66. Brown, A.E.; Ford, J.S.; Bale, C.S.E.; Camargo-Valero, M.A.; Cheffins, N.J.; Mason, P.E.; Price-Allison, A.M.; Ross, A.B.; Taylor, P.G. An assessment of road-verge grass as a feedstock for farm-fed anaerobic digestion plants. Biomass Bioenergy 2020, 138, 105570. [Google Scholar] [CrossRef]
  67. Noer, O.J. Yield and chemical composition of clippings from a green of Washington bent grass. Golfdom 1945, 2, 13–16. [Google Scholar]
  68. Bastug, R.; Buyuktas, D. The effects of different irrigation levels applied in golf courses on some quality characteristics of turfgrass. Irrig. Sci. 2003, 22, 87–93. [Google Scholar] [CrossRef]
  69. Piepenschneider, M.; de Moor, S.; Hensgen, F.; Meers, E.; Wachendorf, M. Element concentrations in urban grass cuttings from roadside verges in the face of energy recovery. Environ. Sci. Pollut. Res. 2015, 22, 7808–7820. [Google Scholar] [CrossRef]
  70. Piepenschneider, M.; Buhle, L.; Hensgen, F.; Wachendorf, M. Energy recovery from grass of urban roadside verges by anaerobic digestion and combustion after pre-processing. Biomass Bioenergy 2016, 85, 278–287. [Google Scholar] [CrossRef]
  71. Antonopoulou, G.; Vayenas, D.; Lyberatos, G. Biogas Production from Physicochemically Pretreated Grass Lawn Waste: Comparison of Different Process Schemes. Molecules 2020, 25, 296. [Google Scholar] [CrossRef] [PubMed] [Green Version]
  72. Hidaka, T.; Arai, S.; Okamoto, S.; Uchida, T. Anaerobic co-digestion of sewage sludge with shredded grass from public green spaces. Bioresour. Technol. 2013, 130, 667–672. [Google Scholar] [CrossRef] [PubMed]
  73. Wesström, T. Energy use and carbon footprint from lawn management. A case study in the Uppsala region of Sweden. Master’s Thesis, Uppsala University and Swedish University of Agricultural Sciences, Uppsala, Sweden, 2015. [Google Scholar]
  74. AEBIOM European Biomass Association. A Biogas Roadmap for Europe; Renewable Energy House: Brussels, Belgium, 2009. [Google Scholar]
  75. U.S. Environmental Protection Agency, Combined Heat and Power Partnership. Biomass Combined Heat and Power Catalog of Technologies; U.S. Environmental Protection Agency: Washington, DC, USA, 2007. [Google Scholar]
  76. Statista. Average Annual Gross Salary in Italy 2019, by Region. Statista. Hamburg, Germany. 2021. Available online: https://www.statista.com/statistics/708972/average-annual-nominal-wages-of-employees-italy-by-region/ (accessed on 26 June 2021).
  77. Perez Garcia, A. Techno-Economic Feasibility Study of a Small-Scale Biogas Plant for Treating Market Waste in the City of El Alto. Master’s Thesis, KTH School of Industrial Engineering and Management Energy Technology, Stockholm, Sweden, 2014. [Google Scholar]
  78. Statista. Prices of electricity for industry in Italy from 2008 to 2020. Statista. Hamburg, Germany. 2021. Available online: https://www.statista.com/statistics/595826/electricity-industry-price-italy/ (accessed on 26 June 2021).
  79. Sgroi, F.; Di Trapani, A.M.; Foderà, M.; Testa, R.; Tudisca, S. Economic assessment of Eucalyptus (spp.) for biomass production as alternative crop in Southern Italy. Renew. Sustain. Energy Rev. 2015, 44, 614–619. [Google Scholar] [CrossRef]
  80. Wąs, A.; Sulewski, P.; Krupin, V.; Popadynets, N.; Malak-Rawlikowska, A.; Szymańska, M.; Skorokhod, I.; Wysokiński, M. The Potential of Agricultural Biogas Production in Ukraine—Impact on GHG Emissions and Energy Production. Energies 2020, 13, 5755. [Google Scholar] [CrossRef]
  81. ADF Trasporti Srl. Costi Smaltimento Rifiuti. ADF Trasporti Srl, Rome, Italy. Available online: https://adftrasporti.it/costi-smaltimento-rifiuti/ (accessed on 4 August 2021).
  82. Czekała, W. Processing Digestate from Agricultural Biogas Plant to Obtain Financial and Environmental Benefits. In Proceedings of the 8th International Conference on Information & Communication Technologies in Agriculture, Food and Environment (HAICTA 2017), Chania, Greece, 21–24 September 2017; pp. 188–195. [Google Scholar]
  83. Seruga, P. The Municipal Solid Waste Management System with Anaerobic Digestion. Energies 2021, 14, 2067. [Google Scholar] [CrossRef]
  84. Aso, S.N. Digestate. In Renewable Energy-Technologies and Applications; IntechOpen: London, UK, 2020. [Google Scholar]
Figure 1. Golf course components (adopted from [25]). Reproduced with permission from Deutsche Golf Holding Ltd. Detail Overview Golf and Landscape Elements; Deutsche Golf Holding Ltd.: Essen, Germany, 2021.
Energies 14 05520 g001
Figure 2. Location of the golf course (adopted from the d-maps.com portal with a slight modification).
Energies 14 05520 g002
Figure 3. Electricity consumption in the tourist complex in the 2016/2017–2019/2020 seasons and the potential coverage of electricity demand by electricity produced from biogas, produced from grass clippings from the golf course.
Energies 14 05520 g003
Figure 4. Heat produced from biomass in the current system in the tourist complex in the 2016/2017–2019/2020 seasons and the potential coverage of heat demand by heat produced from biogas, produced from grass clippings from the golf course.
Energies 14 05520 g004
Figure 5. NPV value as a function of price decrease/increase for a given factor.
Energies 14 05520 g005
Figure 6. ROI and IRR values for extended economic analysis (additional income related to the avoidance of fees for the export and management of green waste and the use of digestate).
Energies 14 05520 g006
Figure 7. NPV values for extended economic analysis (additional income related to the avoidance of fees for the export and management of green waste and the use of digestate).
Energies 14 05520 g007
Table 1. Parts of golf courses with the most popular types of grass and the frequency and height of mowing (based on [24]).
Part of the Golf CourseDescriptionCommon Grass SpeciesMowing FrequencyMowing Height *, cm
TeeStarting area at the start of each holeLolium perenne L., Agrostis stolonifera L., Poa annua L., Cynodon dactylon L., Poa pratensis L., Zoysia spp.2–4 times a week1–1.5
GreenArea where the hole and flagstick are locatedAgrostis stolonifera L., Poa annua L., Cynodon dactylon L.3–7 times a week0.4–0.8
FairwayGrass as the main track of the gameLolium perenne L., Agrostis stolonifera L., Poa annua L., Cynodon dactylon L., Poa pratensis L., Zoysia spp.2 times a week1.25–2.5
RoughWild grass area outside the play areaCynodon dactylon L., Zoysia spp., Eremochloa ophiuroides, Stenotaphrum secundatum, Poa pratensis L., Lolium perenne L., Festuca arundinacea Schreb.,Hard Rough 2 time a year,
Playable Rough–1 time a week
4–10
Semirough“Regulated rough” as narrow stripes along the fairway “Cynodon dactylon L., Zoysia spp., Eremochloa ophiuroides, Stenotaphrum secundatumOnce a week2–3.2
Fringe/ApronUsually a 2′ wide ring around the greenLolium perenne L., Agrostis stolonifera L., Poa annua L., Cynodon dactylon L., Poa pratensis L., Zoysia spp.2–4 times a weekSlightly closer than fairway height
* Depends on grass selection.
Table 2. Literature indicators of biomass potential in the form of grass clippings from specified parts of the golf course and the adopted values for calculations (based on [44,45,46,47,48,49]).
Part of the Playing FieldRange of Biomass Potential (Pi)Average Adopted in the Calculations (Pi)Standard Deviation (SD)
tDM∙year−1tDM∙year−1tDM∙year−1
Green3.50–4.00 3.750.25
Tee3.50–5.004.250.75
Fairways5.00–5.30 5.150.15
Semirough2.25–2.752.500.25
Rough5.00–6.205.600.60
Table 3. Assumptions adopted for the technical and economic analysis.
Description of the Assumption MadeReferences
Grass clippings (1)Bulk density of mixed grass clippings ρd = 300 kg∙m−3[50]
Moisture content in the fresh matter of the mixed grass clippings from the golf course/sport field MC = 73.40%[51]
Dry organic matter content in the dry matter of mixed grass clippings from the golf course/sport field ODM = 88.34% DM[51]
Potential for methane production from golf course grass clippings VCH4 = 340 m3∙tODM−1[51]
Surplus grass clippings during the growing season will be stored in silage tubes [52]
Loss of dry matter during ensilage LGC = 15%[53]
Biogas power plant (2)Lower Heating Value of methane LHVCH4 = 9.971 kWh∙m−3[54]
Hydraulic Retention Time HRT = 35 days[51]
Electric efficiency of the engine (CHP) ηEL = 30%[55]
Thermal efficiency of the engine (CHP) ηTH = 45%[55]
Engine operation time (CHP) t = 8000 h∙year−1[55]
Coefficient of own needs for heat generated by biogas plant Zc = 0.3[56]
Coefficient of own needs for electricity generated by biogas plant ZE = 0.09[56]
Financial (3)Heat generated by biogas plant is used by the resort, leading to money-savings related to separate production of heat in thermal power plant fired by biomass fuel[57]
Electricity generated by biogas plant is used by the resort, leading to money-savings related to the lack of purchase of energy from the grid[58]
The discount rate, or the weighted average cost of capital WACC = 6%[59]
The operation of the biogas plant was established for 10 years[60]
Costs of land will not be considered for this study since it is assumed that there is an availability of it in the golf resort---
Tax issues were not taken into account---
There are no plans to reinvest/renovate the micro biogas plant in the period of 10 years---
Table 4. Estimated biomass potential in the form of grass clippings depending on the part of the golf course.
Specified RegionAreaFresh MatterDry MatterDry Organic Matter
hatFM∙year−1 (±SD)tDM∙year−1 (±SD)tODM∙year−1 (±SD)
Lake courseTee0.9014.38 (±2.54)3.83 (±0.68)3.38 (±0.60)
Green1.3519.03 (±1.27)5.06 (±0.34)4.47 (±0.30)
Fairways14.06272.26 (±7.93)72.42 (±2.11)63.98 (±1.86)
Semirough9.8192.19 (±9.22)24.52 (±2.45)21.66 (±2.17)
Rough25.00526.32 (±56.39)140.00 (±15.00)123.68 (±13.25)
Mountain courseTee0.9014.38 (±2.54)3.83 (±0.68)3.38 (±0.60)
Green1.0815.23 (±1.02)4.05 (±0.27)3.58 (±0.24)
Fairways12.60243.95 (±7.11)64.89 (±1.89)57.32 (±1.67)
Semirough9.4588.77 (±8.88)23.61 (±2.36)20.86 (±2.09)
Rough19.50410.53 (±43.98)109.20 (±11.70)96.47 (±10.34)
Practice areaDR-Training3.3553.56 (±9.45)14.25 (±2.51)12.58 (±2.22)
DR-Tee0.314.91 (±0.87)1.31 (±0.23)1.15 (±0.20)
Practice Green0.111.60 (±0.11)0.42 (±0.03)0.38 (±0.03)
Putting Course0.8311.71 (±0.78)3.12 (±0.21)2.75 (±0.18)
Sand bunkers *0.9513.46 (±0.90)3.58 (±0.24)3.16 (±0.21)
Water hazards *0.7310.32 (±0.69)2.75 (±0.18)2.43 (±0.16)
Short courseTee0.182.88 (±0.51)0.77 (±0.14)0.68 (±0.12)
Green0.324.44 (±0.30)1.18 (±0.08)1.04 (±0.07)
Fairways1.3626.23 (±0.76)6.98 (±0.20)6.16 (±0.18)
Semirough2.0319.03 (±1.90)5.06 (±0.51)4.47 (±0.45)
Rough6.40134.74 (±14.44)35.84 (±3.84)31.66 (±3.39)
* The area of grass around these hazards has been taken into account.
Table 5. Calculated parameters for micro biogas power plant system.
ParameterUnitValue (±SD)
HCH4m3∙h−115.35 (±1.33)
QCBRUTTOGJ1983.45 (±171.87)
QCTECHGJ595.03 (±51.57)
QCNETTOGJ1388.41 (±120.30)
QEBRUTTOMWh367.30 (±31.83)
QETECHMWh36.73 (±3.18)
QENETTOMWh330.57 (±28.65)
NELkW45.91 (±3.98)
NTHkW68.87 (±5.97)
VRm3576.34 (±49.94)
Table 6. Primary energy consumption by mowing (based on [22,73]).
Specified RegionAreaAverage Primary Energy Consumption by MowingTotal Energy Consumption
haGJ∙ha−1∙year−1GJ∙year−1
Tee5.6430169.19
Green2.862468.60
Fairways28.0210280.18
Semirough21.287.35 *156.40
Rough50.905.05 *257.05
Putting Course0.832419.94
Sand bunkers *0.95109.55
Water hazards *0.73107.32
Total111.218.71968.21
* It is assumed that most of the Rough area is considered as “Hard Rough”, hence the value of primary energy consumption adopted for the “Meadow Lawns” indicator included in the references.
Table 7. Investment costs, operating and maintenance costs, and incomes resulting from the construction of a micro scale biogas plant powered by grass clippings from the golf course.
Type of Cost/IncomesItemUnit ValueReferenceTotal Cost, k€
InvestmentBiogas plant5000 €∙kWel−1[74]230
Microturbine (installed as CHP system)1300 €∙kWel−1[75]60
Heat pipeline connection--8
Biomass storage infrastructure--2.5
Operation and Maintenance (O&M) costsMaintenance of biogas plant2% investment cost∙year−1[74]6
O&M microturbine0.01 €∙kWh−1[75]3.3
Labour costs2300 €∙person−1∙month−1[76]27.6
Wheel loader costs40 €∙h−1[77]12
Microbiological preservative and foil15 €∙ha−1[53]1.7
Incomes/savingsElectricity savings0.1503 €∙kWh−1[78]50
Biomass fuel (wood chips) savings from thermal power production90 €∙t−1[79]9.7
Table 8. Calculated parameters for micro biogas power plant system.
ParameterUnitValue
NPV−235,000
IRR%−17.74
ROI%−34.98
Table 9. Revenue scenarios related to the avoidance of fees related to the management and disposal of grass clippings.
ScenarioDescription
W1Removal and management by a municipal external plant of 100% of grass clippings without mass reduction
W2Removal and management by a municipal external plant of 100% of grass clippings after 25% mass reduction due to air-drying/decomposition
W3Removal and management by a municipal external plant of 100% of grass clippings after 50% mass reduction due to air-drying/decomposition
W4Removal and management by a municipal external plant of 50% of grass clippings after 25% mass reduction due to air-drying/decomposition
W5Removal and management by a municipal external plant of 50% of grass clippings after 50% mass reduction due to air-drying/decomposition
Table 10. Revenue scenarios related to the avoidance of fees related to use of digestate.
ScenarioDescription
D1Use 100% digestate at the golf course
D2Use 75% digestate at the golf course
D3Use 50% digestate at the golf course
D4Use 25% digestate at the golf course
D5Use 0% digestate at the golf course
Publisher’s Note: MDPI stays neutral with regard to jurisdictional claims in published maps and institutional affiliations.

