Article

An Expert-Driven Probabilistic Assessment of the Safety and Security of Offshore Wind Farms

by
Oscar Hernán Ramírez-Agudelo
1,*,
Corinna Köpke
2,
Yann Guillouet
3,
Jan Schäfer-Frey
4,
Evelin Engler
5,
Jennifer Mielniczek
6 and
Frank Sill Torres
3
1
German Aerospace Center (DLR), Institute for the Protection of Terrestrial Infrastructures, Rathausallee 12, 53757 Sankt Augustin, Germany
2
Fraunhofer Institute for High-Speed-Dynamics, Ernst-Mach-Institut, EMI, Am Klingelberg 1, 79588 Efringen-Kirchen, Germany
3
German Aerospace Center (DLR), Institute for the Protection of Maritime Infrastructures, Fischkai 1, 27572 Bremerhaven, Germany
4
FICHTNER GmbH & Co. KG, Sarweystrasse 3, 70191 Stuttgart, Germany
5
German Aerospace Center (DLR), Institute for Communications and Navigation, Kalkhorstweg 53, 17235 Neustrelitz, Germany
6
Ing. J. Mielniczek, Safety Engineer (Freelance), Hedwig-Augustin-Str. 27, 25348 Glückstadt, Germany
*
Author to whom correspondence should be addressed.
Energies 2021, 14(17), 5465; https://doi.org/10.3390/en14175465
Submission received: 18 June 2021 / Revised: 23 August 2021 / Accepted: 25 August 2021 / Published: 2 September 2021
(This article belongs to the Special Issue Special Issue of ESREL2020 PSAM15)

Abstract

:
Offshore wind farms (OWFs) are important infrastructure which provide an alternative and clean means of energy production worldwide. The offshore wind industry has been continuously growing. Over the years, however, it has become evident that OWFs are facing a variety of safety and security challenges. If not addressed, these issues may hinder their progress. Based on these safety and security goals and on a Bayesian network model, this work presents a methodological approach for structuring and organizing expert knowledge and turning it into a probabilistic model to assess the safety and security of OWFs. This graphical probabilistic model allowed us to create a high-level representation of the safety and security state of a generic OWF. By studying the interrelations between the different functions of the model, and by proposing different scenarios, we determined the impacts that a failing function may have on other functions in this complex system. Finally, this model helped us define the performance requirements of such infrastructure, which should be beneficial for optimizing operation and maintenance.

1. Introduction

The offshore wind industry provides a reduced-emissions form of energy production that is continuously gaining importance. Its annual growth rate averaged 24% between 2013 and 2020 [1]. With the newly installed capacity of 6.1 GW offshore wind, the total installed capacity reached 35.3 GW globally in 2020 [1,2]. The global offshore wind market outlook illustrates this continuous importance of the wind industry: annual installations of around 20 GW are expected in 2025, and up to 30 GW in installations are expected in 2030 [1]. Key government and industry bodies are setting their sights significantly higher for offshore wind in 2050. In the EU, 450 GW is the target capacity for 2050, assuming industrial clusters in the North Sea, Atlantic Ocean, Baltic Sea, and southern European water areas [1]. As for global development, the Ocean Renewable Energy Action Coalition (OREAC)—a global group of leading offshore wind development companies, technology providers, and turbine suppliers—announced, in March 2019, their expectation of more than 1400 GW of installed capacity worldwide within the next 30 years [3]. Furthermore, the Global Wind Energy Council (GWEC) predicts more than 70 GW of offshore capacity will be added worldwide in 2021–2025 [1]. In 2020, Europe had total offshore wind electricity production of 83 TWh, which corresponds to 2.9% of the EU’s total electricity consumption in 2020 (2.797 TWh consumption in the EU) [4]. This trend also has economic implications, reflected by the prediction that by 2030 offshore wind power shall be responsible for 8% of the total ocean economy, adding USD 230 billion in value [5].
Besides the economic implications, offshore wind farms (OWFs) are confronted with safety and security threats. These threats are recognized as risks relate to, but are not limited to, (I) personal safety, (II) the environment, (III) assets, and/or (IV) organizations [6]. These are the results, in part, of their harsh marine environment—e.g., distance to shore, weather impact, access, and egress. Further, the considerable complexity of the assets and stakeholders, and their role in power generation contribute to the safety and security threats and risks. For example, during the operation and maintenance (O&M) phase, failing components are recurring obstacles in OWFs, requiring well-established maintenance processes [7]. These failing components could be risks to the health and safety of employees on site. As the O&M phase progresses, the risk of, e.g., material fatigue, increases. Consequently, these processes are prone to further challenges in terms of safety and security. The earlier (ideally during the planning phase) safety and security threats and their associated risks are identified and classified, the higher the chances of reducing the risks to acceptable levels by implementing measures. This can be done, for example, as part of a risk assessment, and as part of further studies, such as hazard identification studies (HAZIDs) and hazard and operability studies (HAZOPs). Inevitably, risks and measures undertaken must be continuously examined for their effectiveness, and if necessary, improved.
Generally, a key performance indicator (KPI) is used as a performance metric for a specific business activity [8]. It contains information relevant to the application context, which is determined by specific stakeholder interests: e.g., operation, finance, maintenance, and safety [9]. It is used to define goals or evaluate what has been achieved. KPIs can be measured directly, are determined using performance indicators of the subsystems involved and other factors, or are derived from expert surveys [9,10]. In order to achieve clear statements and comparability, it is important that the measurement and formation rules of KPIs are well defined. In the best case, a KPI is standardized, traceable over time, and comprehensible in its meaning. Comparisons between achieved and target KPIs provide stakeholders the information needed to assume that problems have occurred or are emerging. The differences observed can be considered as key risk identifiers (KRIs), describing the current risk profile of the system or organization [11]. This makes KPIs attractive for evaluating and monitoring safety and security.
Meanwhile, KPIs are also widely used in the wind industry to define performance metrics in contracts, for operations management, and in decision support systems. A comprehensive list of OWF KPIs is presented in [9,12]. There, KPIs are classified in terms of their applications: OWF performance; maintenance; reliability; and health, safety, and environment (HSE). The International Electrotechnical Commission (IEC) has already developed guidelines and standards that define KPIs for wind turbine design and operation [13,14]. In addition, several studies have discussed the use of KPIs for operations management and maintenance of offshore and onshore wind turbines [12,15]. Safety-related KPIs discussed in [9,12,16,17] refer either to more technical aspects (reliability), to the occupational safety of the O&M personnel (health, injury prevention), or to the handling of disruptive environmental influences (weather). The relationships between safety and security requirements and economic, environmental, and regulatory compliance requirements are rarely discussed [16,18]. These interrelations become more important when the resilience of OWFs as part of the transnational energy supply becomes the focus of an investigation [19]. In this study, the main stakeholder goals in OWFs were classified on a functional level, the interrelations were elaborated using the functional resonance analysis method [20], and Monte-Carlo simulations were performed to determine the functions of OWFs with highest vulnerability potential. In [21], the authors proposed an extension of that model by adopting Bayesian network (BN) analysis. That approach made the first steps in enabling the exploration of cross-system interrelations.
In this work, and based on the work presented by [19], we continue to improve the BN-model presented in [21]. The aim is to end up with a more formal approach for exploring relations within OWFs in terms of safety and security. Using the resulting model, and with help of expert knowledge, one can determine how a failing function impacts other functions in this complex system and can design changes—e.g., the hardening of selected functions—influencing the system’s stability.
The rest of this work is structured as follows. Section 2 reviews the important items, such as OWFs (see Section 2.1), BNs (see Section 2.2), the functional resonance analysis method (FRAM; see Section 2.3), and the stakeholder view (see Section 2.4). Section 3 describes the methodology adopted in this work. Section 4 presents the expert knowledge and stakeholder goals. The model is presented on Section 5. The results and implications are discussed in Section 6. Conclusions are summarized in Section 7.

2. Preliminaries

This section presents relevant information that supports the understanding of this work.

2.1. Offshore Wind Farms

Offshore wind farms (OWFs) are complex cyber-physical systems, with the following principal elements: Wind turbines, offshore substations (OSS), control and operation centers, and power and communication cables. Furthermore, OWFs can be characterized by the interaction of several interdependent abstraction layers—energy conversion, physical structures, automated control and protection, maintenance (O&M), and IT communication [22,23,24]. Between these individual layers, several types of flow exist, e.g., energy, data and information, people, and components.
Due to the nature of the complexity of offshore wind farm projects, there are various different stakeholders involved in each project. These stakeholders are, among others: wind farm owner, operator, technology suppliers, O&M companies, logistics and transport companies, authorities, fishery, shipping, etc. (see Section 2.4 for more details).
Many stakeholder groups have different interests, and therefore the operations-related safety and security goals may differ between different stakeholder groups. Besides technical safety and security goals, there are commercial, environmental, reputational, and supply reliability-related aspects to consider for an offshore wind farm.
This paper outlines the methodology and processes used to determine and assess the safety and security of offshore wind farms probabilistically (see Section 3, Section 4 and Section 5).

2.2. Bayesian Networks

BNs are probabilistic graphical models consisting of directed acyclic graphs. BNs are suitable for taking an event that occurred and predicting the likelihoods of possible causes contributing to it. In this formulation, the nodes of such a graph or network represent the systems variables as probability distributions, and the edges represent their probabilistic dependencies. In this description, a given node can be either independent or dependent. A node is conditionally independent when it does not have any parent node. In the same way, a node is conditionally dependent when it is a descendant of a parent node (for a more detailed explanation about BNs, please see Section 3.1 of [21]).
BNs are usually used with discrete variables. At the same time, the probability of a node ( N i ) depends on whether it is independent or dependent. For an independent node, the probability of failure P ( N i = S 1 ) is given by a discrete value. The nodes are represented by conditional probability distributions (CPDs), depending on their parent nodes. The probability of a system of variables v i ... v N to be in a given state S is the combined probability of the single variables to be in that respective state:
P r ( S ) = i = 1 N P r ( v i = x i | P a r ( v i ) )
With the graph structure defined, the parametrizations of CPDs break down to conditional probability tables (CPT), in which the probabilities have to be defined for each combination of parent states. Given a system of discrete binary variables, a node with m parents takes 2 m parameters to fully define the conditional probabilities of each possible case. This is usually achieved by fitting given data, or by using expert knowledge. In [25], some approaches are presented to reduce the number of parameters required by defining how exactly the parent states influence the probabilities.
BNs allow one to perform inference, i.e., to take into account incomplete and uncertain evidence on observed variables, and thus dynamically update the marginal distributions of the missing ones. This makes them especially useful for reasoning about the specific causes of the observations, and for estimating their consequences. In the following sections, we introduce step by step the concepts on which the BN model relies. Section 3 Section 4 introduce the methodology and the stakeholders’ goals. Based on this, Section 5 presents the probabilistic model.

2.3. FRAM

FRAM is a graph-based representation of the system of interest developed by Hollnagel [20]. It enables one to represent the system in terms of functions, which can be of different types, such as technological, human, and organizational. FRAM has been applied successfully in various domains—e.g., to study performance variabilities and incidents in complex systems such as air traffic management [26,27], urban transport systems [28], and vessel traffic services [29], and environmental aspects of a sinter plant [30].
FRAM is based on following four main principles:
  • Functions fail and succeed in the same ways.
  • Failure or success arises from the performance variability of functions.
  • The variability of several functions can lead to non-linear behavior.
  • Functional resonance is caused by unintended variability interactions of functions.
Each function consists of six so-called aspects, which enable the exchange of information or material with other functions of the system (see Figure 1). These aspects are:
  • Input: something that is used by the function.
  • Output: something that is produced by the function.
  • Precondition: a state that is needed for the function to be executed.
  • Resource: something that is consumed by the function.
  • Control: something that controls execution of the function.
  • Time: something that, e.g., delays the execution of the function in time.
In the example presented in Figure 1, Function 1 outputs some information or material that is used as input to Function 2.

2.4. Stakeholder View

The consideration of expert knowledge is mandatory for any safety and security assessment of complex socio-technical systems (STSs). This includes that the actual behavior of the STS needs to be properly understood with the help of experts. However, not only does the view of the operator of the STS need to be considered; all kinds of stakeholders have a legitimate interest in the STS. Additionally, their views can offer valuable insights. Stakeholders can be defined as: “Persons or groups that have, or claim, ownership, rights, or interests in a corporation, and its activities, past, present, or future.” They can be divided into different groups of close (primary) or loosely (secondary) coupled parties [31].
Stakeholders can have aligned or opposed interests towards the system dependent on their perspectives. Thus, it is important to refer to all kinds of stakeholders and to not exclude any group. Most stakeholders support the system’s safety, but they could also have an interest in sabotage or destruction. In times of global terrorism and evolving threats, most of the safety objectives cannot be ensured without sufficient consideration of security aspects [32]. The STS’s vulnerability against criminal and terrorist attacks can be decreased by the implementation of defense mechanisms in the endangered system. This can include means for protection, observation, and intervention [20,33]. The degree of fulfillment of stakeholder interests can serve as a measure to quantify the safety and security level of the infrastructure dependent on the corresponding perspective.

3. Methodology

This section outlines the proposed methodology of the expert-driven probabilistic assessment of the safety and security of OWFs. The development of the methodology was driven by the observation that the high complexity of socio-technical systems such as OWFs, in combination with the assessment of safety and security, does not allow for purely quantitative solutions, as discussed by [34]. Nevertheless, we believe that the access to expert knowledge should be realized in a structured manner to provide an applicable outcome of the assessment. It is important to note that this analysis is not meant to replace a classical risk assessment. However, it offers the application of expert knowledge to improve the assessment of the safety and security of this complex socio-technical system.
The first step of the proposed methodology is the survey and analysis of stakeholder goals, which is a standard procedure for stakeholder assessment [35]. Therefore, the stakeholders and experts were consulted for general goals and objectives in terms of safety and security in OWF. Next, specific goals and related measures and sensor systems were identified. Due to the complexity of these goals, measures and sensor systems are only described on a high level (abstractly). Consequently, one has to understand the results produced by this methodology as a qualitative measure of the safety and security aspects.
The following step is the expert-driven structuring, which focuses on determining and characterizing the interrelations among specific goals, measures, and senors systems. Therefore, the type of interrelation between each function is determined by applying the categories (aspects) provided by FRAM (see also Section 2.3), i.e., input, output, precondition, resource, control, and time. The following characterization was motivated by the intention of this work to assess how failing elements and services of an OWF can impact its safety and security. Therefore, for each function, a failure probability was defined. The available options were restricted to a discrete set of values, i.e., low, medium, and high, to acknowledge the high level of abstraction. Furthermore, the impact a failure of a function has on the operability of the depending functions was weighted, too. Again, only a discrete set of options existed.
In the third and final step, the generation of probabilistic model, the generated FRAM model is transferred into a BN. This allows one to estimate impact of failing functions on the safety and security of the whole system in probabilistic terms. Note, this analysis does not replace a classical risk assessment but offers the use of expert knowledge for simulating and thus predicting possible critical situations.

4. Expert Knowledge and Stakeholder Goals

A widely applied strategy to assess global aspects such as the safety and security of complex STS is the involvement of experts, who have specific knowledge about internal processes, dependencies, failures, etc. Furthermore, such an assessment also requires the consideration and harmonization of the views and goals of the stakeholders of the STS, as outlined in Section 2.4.
This section presents our approach for structuring and organizing such knowledge and goals for assessing the safety and security of OWF. The analysis and tables presented in the subsequent subsections are based on the interrelations developed in Section 2 by [19]. Here we extend their work.

4.1. The Survey and Analysis of Stakeholder Goals

In the first step, the general safety and security goals of a OWF had to be identified. With the help of experts and stakeholders, nine categories were defined, which are further explained in Table 1 [9,12,16,36].
Next, the stakeholder groups had to be identified. Similarly to the discussions in [35,37], generic OWF stakeholder groups, as listed in Table 2, can be defined. Furthermore, the stakeholder interests must be related to the general safety and security goals in OWF, as defined in Table 1.
Subsequent to this initial analysis, one can try to explore redundancies between the general goals to reduce the complexity of further steps. In case of the identified goals, four can be integrated within the remaining five; i.e., one can assume that the removed goals are fulfilled when the others are fulfilled, too. The remaining general goals are: accident prevention, security, occupational safety, plant safety, and environmental protection.
Next, the general goals were broken down into specific goals, which should be achieved through adequate measures, and monitored and supervised via proper sensor systems. Table 3, Table 4, Table 5, Table 6 and Table 7 list these measures and sensors.

4.2. Structuring Expert Knowledge

After having the relevant specific goals and the related measures and sensors at hand, these must be structured and characterized. The proposed methodology employs FRAM (see also Section 2.3) for this task, as this method provides a structured means for representing the operation and dependencies of socio-technical systems [18].
In the first step, the measures, goals, and senor systems were transferred into FRAM functions with the related aspects (see also Figure 1). Table 8 lists all identified high-level functions that are relevant for fulfilling the safety and security goals in an OWF.
Next, interrelations between the functions and goals must be determined with the help of experts and stakeholders. This includes also the definitions of the types of the interrelation with respect to the FRAM aspects, i.e., input, output, precondition, resource, control, and time [19,38,39]. Figure 2 depicts the extracted representations of all stakeholder goals (goals 1–9; see Table 1), along with the sixty-four (64) functions, which are classified as goals (functions 1–21), measures (functions 22–53), and sensor data analysis (function 54–64; see Table 3, Table 4, Table 5, Table 6 and Table 7).
In the next step, the interrelations and the actual functions must be characterized. As discussed in Section 3, this characterization refers to the failure probability of a function and the impacts failing parent functions may have on that probability. The latter is called an inherent influencing factor. The failure probability p i of a function F i defines the likelihood that F i fails in a given time, i.e., within one year.
As it regards the influencing factors, two types of interrelations have been defined: (I) supportive dependence and (II) compulsory dependence. In case of (I), a function provides services for other functions that have supportive character, but are not crucial for the actual operation. In regard to the FRAM method, these services can be of following exchange type: precondition, resource, control, output, and time (see Section 2.3). For interrelations of type (II), a function provides a service that is essential for other functions. The related FRAM type of exchange is: input. As discussed in Section 3, only a discrete set of options exist for p i —i.e., low, medium, and high.
A supportive dependence means that a failure of the supporting function F j increases the failure probability p i of the function F i , which receives its services though the influencing factor f j , s . In other words, a failure of F j amplifies the reasons responsible for a failure of F i . That means the new failure probability of F i results from p i · f j , s . For example, a failure in access control (function 53 in Table 8) does not directly lead to a failure of function prevent espionage (function 50), but disturbs internal processes responsible for protecting information and knowledge.
In contrast, a compulsory dependence means that a failure of the supporting function F j increases the probability that F i fails by the value of the influencing factor f j , c . That means, a failure of F j has a direct impact on the service provision of F i . Consequently, the new failure probability of F i results from p i + f j , c . For example, a failure of IT security (function 49) has direct impact on Safe communication (function 20).

5. The Transfer to a Probabilistic Model

This section presents the third and final step, i.e., the transfer of the functional model to a probabilistic model (see also Section 3). From now on, the words node and function are used indistinguishably. With the functional model and the relevant functions at hand, it is time to define their failure probabilities and the parameterized interrelations. This information must be used to analyze how the failure probabilities of functions are interconnected. Therefore, BNs are employed, which enable this kind of analysis.
In a first step, the architecture of the functional model (see also Figure 2) is converted into a BN one by transforming each function into a node N i and the exchange connections into edges of the BN. Each node can take one of two distinct states: S 0 , i.e., working, and S 1 , i.e., broken.
In the second step, the probabilities of the nodes are defined. As already mentioned, the probability of a given node depends on whether it is an independent or dependent one. For the former case, the probability of failure ( P r ( N i = S 1 ) ) is given by:
P r ( N i = S 1 ) = p i
where p i refers to the probability of failure of node N i given in Table 8.
As for the dependent nodes, CPTs are generated for every node by combining the inherent failure probability  p i and the influencing factors.
As discussed in the previous section, a supportive dependence means that a failure of a parent node N j increases the inherent failure probability by a factor f j , s ; i.e., P r ( N i = S 1 | N j = S 1 ) = p i f j , s . In contrast, a compulsory dependence means that a failure of a parent node N j increases the probability that N i enters the failure state S 1 , too, by the value f j , c , i.e., P r ( N i = S 1 | N j = S 1 ) = p i + f j , c . Consequently, for each combination of parent states, the respective row in the CPT can be computed in the following way:
P r ( N i = S 1 ) = p i j S u p N j = S 1 f j , s + j C o m p N j = S 1 f j , c
with S u p and C o m p being the sets of supportive and compulsory relations between nodes, respectively. In order to have a better understanding of Equation (3), Appendix A picks up two exemplary cases of a network with two and three nodes, respectively, and shows their explicit forms.
Having defined the probabilistic model (i.e., Equations (2) and (3)), the failure probability P ( N i = S 1 ) of a node N i can be obtained by considering the discrete values of p i and f i of low, medium, and high, respectively, presented in Table 8. Table 9 lists the respective numeric values according to supportive and compulsory dependence. 
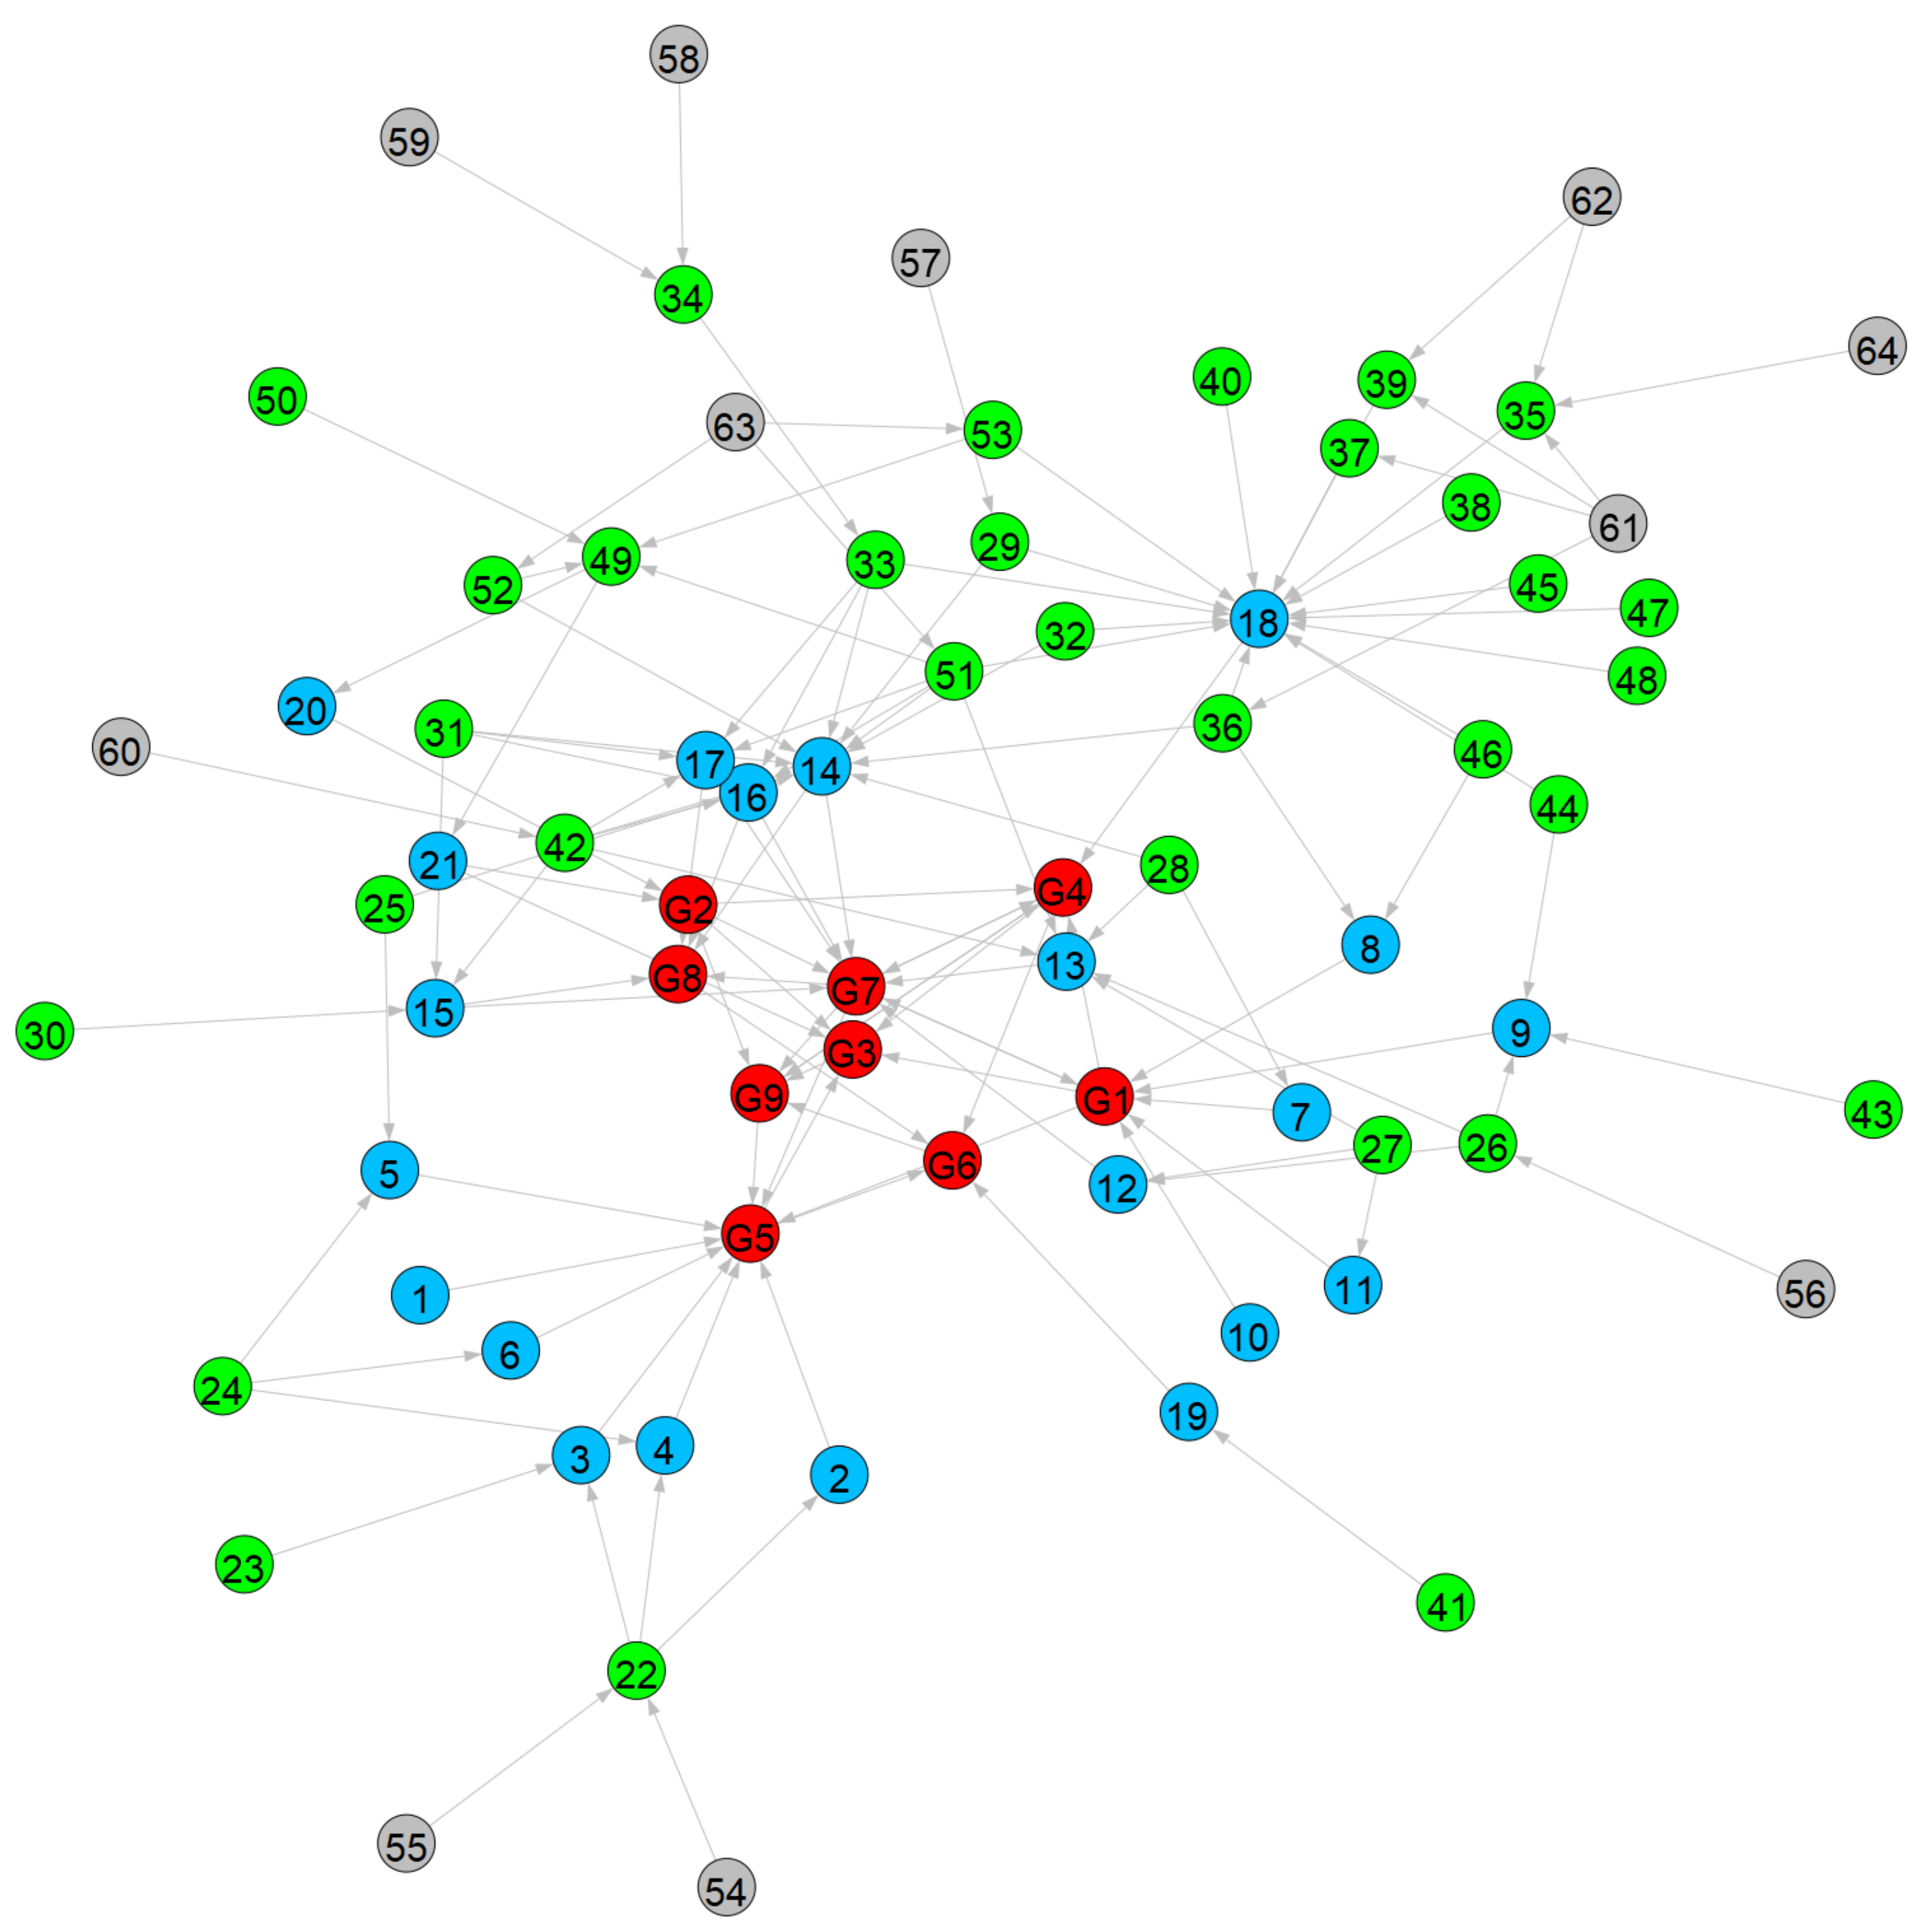
Figure 3 shows the resulting BN model in the context of the safety and security of OWFs. The network has a total of twenty seven independent nodes and thirty seven dependent nodes (see also Section 4.1 of [21]). The edges are presented in different colors according to their dependence. Compulsory dependence corresponds to the FRAM aspect: input (black). Supplementary dependence consists on the following FRAM aspects: preconditions (red), controls (orange), and resource (purple).

6. Results and Discussion

The BN model graph presented in Figure 3 represents how the availability of different high-level nodes in a generic OWF impacts other nodes and the respective safety and security goals. Thus, one can determine, for example, nodes with highest impact, the consequences of improved or deteriorated failure probabilities, and the effect of the loss of an individual node. This section explores the applicability of the implemented and parameterized model.

6.1. Initial Model

In Section 5 we have introduced the probabilistic model. Based on Equations (2) and (3), in combination with the definitions provided in Table 8 and Table 9, and the respective supplementary or compulsory dependence of the edges, we have determined the probability failure values for the 64 nodes in our model. Figure 4 depicts the resulting failure distribution P ( N i = S 1 ) for each node in the network, with S 1 is indicating the failure state. The average failure probability of the network is P ( N i = S 1 ) ¯ = 0.012 ± 0.007 . Table 10 summarizes the five nodes with the highest P ( N i = S 1 ) protect rotor/nacelle (node 14 in Table 8) is the most susceptible node.
The following sections explore scenarios in the context of the safety and security of a generic OWF.

6.2. Variation of the Independent Nodes

In this scenario, it was assumed that the probability of failure of the independent nodes was modified, i.e., decreased or increased by 20%. In Table 8, entries in column 1 marked in boldface correspond to the independent nodes. There are 27 nodes in total. Figure 5 shows the ratios of the resulting failure probabilities P ( N i = S 1 ) with respect to initial model defined in Section 6.1. The decreased and increased failure probabilities of the independent nodes are clearly noticeable—i.e., the indicators with values of 0.8 and 1.2 , respectively. The failure probabilities of the dependent nodes varied in a range between 0.8 and 1.2 . For some, the variation was significant; for others, there were only slight changes.

6.3. Loss of Selected Nodes

In this work, we also wanted to assess the stability of the developed model. In order to do so, we have studied different scenarios where the integrity of the network was compromised. This not only allowed us to explore cross-system interrelations, but also to determine how the failing nodes impact others in this complex system. In this section we present two main representative scenarios.
Figure 6 depicts the failure probabilities P ( N i = S 1 ) of the network for a case when—(i) AIS failed (panel a) and when (ii) warning lights, AIS, regular maintenance, and access control lost their integrity (panel b). The results could be summarized as follows:
In case (i), the node AIS was set to fail with P ( N 56 = S 1 ) = 1.0 . This means that a sensor data analysis node was set to fail (see Section 4.2). As a result, collision avoidance (node 26) and measures helicopter (node 36) suffered the highest impacts: their probabilities of failure were both about 0.5 . Additionally, safety plane, safety helicopter, safety ship, safety submarine, protect foundation, protect OSS, protect converter station, and safety of worker (i.e., nodes 7, 8, 9, 11, 12, 16, 17, and 18, respectively) formed a second group with P ( N i = 7 , 8 , 9 , 11 , 12 , 16 , 17 = S 1 ) of about 0.2 . The nodes protect tower and protect rotor/nacelle (i.e., # 13 and 14, respectively) formed a separate group with P ( N i = 13 , 14 = S 1 ) at about 0.1 . Finally, the failure probabilities for the remaining nodes did not vary significantly; the changes were in the order of a few percent when compared to those of the initial model.
As for the case (ii), the nodes warning lights, AIS, regular maintenance, and access control (i.e., nodes # 28, 42, 53, and 56) were set to fail with P ( N i = 28 , 42 , 53 , 56 = S 1 ) = 1.0 . That means that besides the sensor data analysis node AIS, we added three more nodes from the measures (see Section 4.2). As a result, measures helicopter (node 36) suffered the highest impact with a probability of failure P ( N 36 = S 1 ) of about 0.8 . Subsequently, the nodes protect rotor/nacelle, protect OSS, protect converter station, collision avoidance, avoid technical failure, and firefighting (i.e., # 14, 16, 17, 26, 31, and 33, respectively) had new P ( N i = 14 , 16 , 17 , 26 , 31 , 33 = S 1 ) of about 0.5 . This outcome shows that all aforementioned nodes lost their integrity in the network.
To continue with case (ii) of Figure 6, the nodes safety of worker and avoid collision plant/animal (i.e., nodes 18 and 25, respectively) formed a second group with P ( N i = 18 , 25 = S 1 ) of about 0.35 . Additionally, protect birds, protect bats, safety plane, safety helicopter, safety ship, safety submarine, protect foundation, and protect tower (i.e., nodes 5, 6, 7, 8, 9, 11, 12, and 13, respectively) had a P ( N i = 5 , 6 , 7 , 8 , 9 , 11 , 12 , 13 = S 1 ) between 0.1 and 0.2. Interestingly, this last group of nodes contributes to the detailed goals [19]. As for the remaining nodes, their failure probabilities were not significantly impacted, as their measurements remained unchanged compared to the initial model.

6.4. Discussion

The initial model (Section 6.1) was the outcome of the expert knowledge formulated in a probabilistic BN model. The probability failure distribution of the system (Figure 3) is, of course, governed by the discrete levels of low, medium, and high of p i and f i (Table 8) and the compulsory and supportive dependence of the edges (Table 9). This model provides an alternative representation of the functionality in a generic OWF where operators in the O&M, or even stakeholders, can determine the performance of this complex system.
The different scenarios presented (Section 6.2 and Section 6.3) allowed us to study variations of the initial model where the integrity of a selection of functions was lost. The results clearly indicate the strength of this work. The implemented BN model enables decision makers to explore the impacts of failure probabilities on the whole system, and based on them, extract requirements for the implementation of each function.

7. Conclusions

Based on [19,21], this work developed a BN model for the high-level representation of the safety and security state of a generic OWF. Here we proposed a compulsory and supportive type of dependence in the probabilistic model. By studying the interrelations between the functions, and by introducing different scenarios, we determined the impacts that a failing function may have in this complex system. This work enables the extraction of requirements to acquire the desired level of performance in a generic OWF, which in turn will help one to assess its correct operation and maintenance.

Author Contributions

Conceptualization, O.H.R.-A., C.K., Y.G., J.S.-F., E.E., J.M. and F.S.T.; methodology, O.H.R.-A., C.K., Y.G., E.E., J.M. and F.S.T.; software, O.H.R.-A. and Y.G.; validation, O.H.R.-A., C.K. and F.S.T.; formal analysis, O.H.R.-A., C.K., J.S.-F., E.E., J.M. and F.S.T.; investigation, O.H.R.-A., C.K. and F.S.T.; writing—original draft preparation, O.H.R.-A., C.K., Y.G., J.S.-F., E.E., J.M. and F.S.T.; writing—review and editing, O.H.R.-A. and F.S.T.; visualization, O.H.R.-A., C.K. and Y.G. All authors have read and agreed to the published version of the manuscript.

Funding

This research received no external funding.

Institutional Review Board Statement

Not applicable.

Informed Consent Statement

Not applicable.

Data Availability Statement

Not applicable.

Conflicts of Interest

The authors declare no conflict of interest.

Abbreviations

The following abbreviations are used in this manuscript:
KPIKey Performance Indicator
KRIKey Risk Identifier
O&MOperation and Maintenance
FRAMThe Functional Resonance Analysis Method
OWFOffshore Wind Farm
BNBayesian Network
CPDConditional Probability Distribution
CPTConditional Probability Table
STSSocio-Technical System

Appendix A. Conditional Probability Table

Section 5 introduced the probabilistic model used for the BN formulation. In this work, the probabilities of failure for the dependent nodes depend on whether the nodes have compulsory or supportive dependence. Here we show Table A1 and Table A2, which refer to Equation (3) for the two types of dependence when a given network has only two or three nodes. These tables show these two specific examples so that the reader may get familiarized with our formulation.
Table A1. CPT rules for two nodes. The CPT of node N 2 is shown.
Energies 14 05465 i001
Table A2. Exemplary CPT rules for three nodes. The CPT of node N 3 is shown.
Energies 14 05465 i002

References

  1. Lee, J.; Zhao, F. Global Offshore Wind Report 2021; Global Wind Report; Global Wind Energy Council: Brussels, Belgium, 2021. [Google Scholar]
  2. O’Sullivan, M. Industrial life cycle: Relevance of national markets in the development of new industries for energy technologies—The case of wind energy. J. Evol. Econ. 2020, 30, 1063–1107. [Google Scholar] [CrossRef]
  3. Sykes, B.; Bull, S. The Power of Our Ocean; Ocean Renewable Energy Action Coalition, Global Wind Energy Council: Brussels, Belgium, 2020. [Google Scholar]
  4. Komusanac, I.; Brindley, G.; Fraile, D.; Ramirez, L. Wind Energy in Europe—2020 Statistics and the Outlook for 2021–2025; WindEurope: Brussels, Belgium, 2021. [Google Scholar]
  5. OECD. The Ocean Economy in 2030; OECD Publishing: Paris, France, 2016.
  6. DNVGL-ST-0145 Standard—Offshore Substation. 2016. Available online: https://rules.dnv.com/docs/pdf/DNV/ST/2016-04/DNV (accessed on 31 August 2021).
  7. Carroll, J.; McDonald, A.; McMillan, D. Failure rate, repair time and unscheduled O&M cost analysis of offshore wind turbines. Wind Energy 2016, 19, 1107–1119. [Google Scholar] [CrossRef] [Green Version]
  8. KPI. Available online: https://dictionary.cambridge.org/de/worterbuch/englisch/kpi (accessed on 4 April 2021).
  9. Gonzalez, E.; Nanos, E.M.; Seyr, H.; Valldecabres, L.; Yürüşen, N.Y.; Smolka, U.; Muskulus, M.; Melero, J.J. Key Performance Indicators for Wind Farm Operation and Maintenance. Energy Procedia 2017, 137, 559–570. [Google Scholar] [CrossRef]
  10. Roubtsova, E. KPI Design as a Simulation Project. In Proceedings of the 32nd European Modeling and Simulation Symposium, Online, 16–18 September 2020. [Google Scholar] [CrossRef]
  11. Engler, E.; Göge, D.; Brusch, S. ResilienceN—A Multi-Dimensional Challenge for Maritime Infrastructures. Int. J. Marit. Sci. Technol. 2018, 65, 123–129. [Google Scholar] [CrossRef]
  12. Pfaffel, S.; Faulstich, S.; Sheng, S. Recommended key performance indicators for operational management of wind turbines. J. Phys. Conf. Ser. 2019, 1356, 012040. [Google Scholar] [CrossRef] [Green Version]
  13. IEC 2017 Power Performance Measurements of Electricity Producing Wind Turbines (IEC 61400-12-1); IEC: Geneva, Switzerland, 2017.
  14. VGB PowerTech eV, Technical and Commercial Key Indicators for Power Plants; VGB PowerTech Service GmbH: Essen, Germany, 2020.
  15. Burton, T.; Jenkins, N.; Sharpe, D.; Bossanyi, E. Wind Energy Handbook; John Wiley and Sons: Hoboken, NJ, USA, 2011. [Google Scholar]
  16. Seyr, H.; Muskulus, M. Safety Indicators for the Marine Operations in the Installation and Operating Phase of an Offshore Wind Farm. Energy Procedia 2016, 94, 72–81. [Google Scholar] [CrossRef] [Green Version]
  17. Skobiej, B.; Niemi, A.; Kulev, N.; Sill Torres, F. Influence of the Personnel Availability on Offshore Wind Farm Maintenance. In Proceedings of the European Safety and Reliability Conference (ESREL), Venice, Italy, 1–5 November 2020; pp. 644–651. [Google Scholar] [CrossRef]
  18. The Four Basic Principles of the FRAM. Available online: http://functionalresonance.com/basic-principles.html (accessed on 25 April 2021).
  19. Köpke, C.; Schäfer-Frey, J.; Engler, E.; Wrede, C.P.; Mielniczek, J. A joint approach to safety, security and resilience using the functional resonance analysis method. In Proceedings of the REA Symposium, Kalmar, Sweden, 24–27 June 2019. [Google Scholar] [CrossRef] [Green Version]
  20. Hollnagel, E. FRAM: The Functional Resonance Analysis Method: Modelling Complex Socio-Technical Systems; Ashgate Publishing Limited: Farnham, UK, 2012. [Google Scholar]
  21. Ramírez-Agudelo, O.H.; Köpke, C.; Sill Torres, F. Bayesian Network Model for Accessing Safety and Security of Offshore Wind Farms. In Proceedings of the 30th European Safety and Reliability Conference and 15th Probabilistic Safety Assessment and Management Conference (ESREbibtex SSL 2020 PSAM 15), Venice, Italy, 1–5 November 2020; ISBN 978-981-14-8593-0. [Google Scholar]
  22. Sansavini, G. Engineering Resilience in Critical Infrastructures. In Critical Infrastructures Resilience Policy and Engineering Principles; Routledge: London, UK, 2017; pp. 189–203. [Google Scholar] [CrossRef]
  23. Dannenberg, L. Offshore Wind Energy. In Understanding Wind Power Technology; John Wiley & Sons, Ltd.: Hoboken, NJ, USA, 2014; chapter 11; pp. 406–454. [Google Scholar] [CrossRef]
  24. Kulev, N.; Reuter, A.; Eichhorn, O.; Engler, E.; Wrede, C.P. Non-resilient behavior of offshore wind farms due to cyber-physical attacks. In Proceedings of the REA Symposium, Kalmar, Sweden, 24–27 June 2019. [Google Scholar] [CrossRef] [Green Version]
  25. Fischer, Y.; Beyerer, J. Defining dynamic Bayesian networks for probabilistic situation assessment. In Proceedings of the International Conference on Information Fusion, Singapore, 9–12 July 2012. [Google Scholar]
  26. Patriarca, R.; Di Gravio, G.; Costantino, F. A Monte Carlo evolution of the Functional Resonance Analysis Method (FRAM) to assess performance variability in complex systems. Saf. Sci. 2017, 91, 49–60. [Google Scholar] [CrossRef]
  27. Herrera, I.; Woltjer, R. Comparing a multi-linear (STEP) and systemic (FRAM) method for accident analysis. Reliab. Eng. Syst. Saf. 2010, 95, 1269–1275. [Google Scholar] [CrossRef]
  28. Bellini, E.; Nesi, P.; Pantaleo, G.; Venturi, A. Functional resonance analysis method based-decision support tool for urban transport system resilience management. In Proceedings of the IEEE International Smart Cities Conference (ISC2), Trento, Italy, 12–15 September 2016; pp. 1–7. [Google Scholar] [CrossRef]
  29. Praetorius, G.; Hollnagel, E.; Dahlman, J. Modelling Vessel Traffic Service to understand resilience in everyday operations. Reliab. Eng. Syst. Saf. 2015, 141, 10–21. [Google Scholar] [CrossRef]
  30. Patriarca, R.; Di Gravio, G.; Costantino, F.; Tronci, M. The Functional Resonance Analysis Method for a systemic risk based environmental auditing in a sinter plant: A semi-quantitative approach. Environ. Impact Assess. Rev. 2017, 63, 72–86. [Google Scholar] [CrossRef]
  31. Clarkson, M.B. A stakeholder framework for analyzing and evaluating corpora. Academy of Management. Acad. Manag. Rev. 1995, 20, 92. [Google Scholar] [CrossRef]
  32. Beyerer, J.; Geisler, J. A Framework for a Uniform Quantitative Description of Risk with Respect to Safety and Security. Eur. J. Secur. Res. 2016, 1, 135–150. [Google Scholar] [CrossRef] [Green Version]
  33. Lichte, D.; Wolf, K. Bayesian Network Based Analysis of Cyber Security Impact on Safety. In Proceedings of the European Safety and Reliability Conference (ESREL), Hannover, Germany, 22–26 September 2019; pp. 1502–1509. [Google Scholar] [CrossRef]
  34. Roracher, H. Analyzing the Socio-Technical Transformation of Energy Systems: The Concept of “Sustainability Transitions”. In Oxford Handbook of Energy and Society; Oxford University Press: Oxford, UK, 2018. [Google Scholar] [CrossRef]
  35. Ahsan, D.; Pedersen, S. The influence of stakeholder groups in operation and maintenance services of offshore wind farms: Lesson from Denmark. Renew. Energy 2018, 125, 819–828. [Google Scholar] [CrossRef] [Green Version]
  36. Sill Torres, F.; Kulev, N.; Skobiej, B.; Meyer, M.; Eichhorn, O.; Schäfer-Frey, J. Indicator-based Safety and Security Assessment of Offshore Wind Farms. In Proceedings of the Resilience Week (RWS), Salt Lake City, UT, USA, 19–23 October 2020; pp. 26–33. [Google Scholar] [CrossRef]
  37. Wever, L.; Krause, G.; Buck, B.H. Lessons from stakeholder dialogues on marine aquaculture in offshore wind farms: Perceived potentials, constraints and research gaps. Mar. Policy 2015, 51, 251–259. [Google Scholar] [CrossRef] [Green Version]
  38. Riccardo, P.; Gianluca, D.P.; Giulio, D.G.; Francesco, C. FRAM for Systemic Accident Analysis: A Matrix Representation of Functional Resonance. Int. J. Reliab. Qual. Saf. Eng. 2018, 25, 1850001. [Google Scholar] [CrossRef] [Green Version]
  39. Lundberg, J.; Woltjer, R. The Resilience Analysis Matrix (RAM): Visualizing functional dependencies in complex socio-technical systems. In Proceedings of the Symposium on Resilience Engineering Managing Trade-Offs, Soesterberg, The Netherlands, 24–27 June 2013; p. 105. [Google Scholar]
Figure 1. An example presentation of a FRAM model with two functions and information/material exchange. I: input, O: output, P: precondition, R: resource, C: control, T: time.
Energies 14 05465 g001
Figure 2. A graphical representation of all stakeholder goals (red), along with 64 functions, which are classified in detailed goals (blue), measures (green), and sensor data analysis (gray).
Energies 14 05465 g002
Figure 3. The Bayesian network model for assessing the safety and security in an OWF. This graphical representation has the 64 nodes which are classified into goals (blue), measures (green), or sensor data analysis (gray). The edges distinguish between compulsory and supplementary dependence. The former belongs to the FRAM aspect: input (black). The latter represents the following FRAM aspects: preconditions (red), controls (orange), and resource (purple).
Energies 14 05465 g003
Figure 4. Probability failure P ( N i = S 1 ) value obtained in the model as a function of each of the 64 nodes. The x-axis indicates the nodes, which are identical to the functions listed in Table 8.
Energies 14 05465 g004
Figure 5. Probability failure P ( N i = S 1 ) value obtained in the model as a function of each of the sixty-four nodes for two cases, namely: (i) when the independent nodes decreased by 20% (red stars) and (ii) p i of the independent nodes increased by 20% (green triangles).
Energies 14 05465 g005
Figure 6. Probability of failure P ( N i = S 1 ) for two scenarios, namely: (a) the node AIS fails and (b) the nodes warning lights (W-L), AIS, regular maintenance (R-M), and access control (A-C) fail.
Energies 14 05465 g006
Table 1. General OWF safety and security goals.
#Safety and Security GoalsShort Description
1Accident preventionAvoidance of accidents between the plant and e.g., ships
2SecurityDefense against e.g., attacks, vandalism
3ComplianceRespecting laws and regulations
4Occupational safetySafety of people in the OWF
5Environmental protectionProtection of flora and fauna
6ReputationImage of stakeholders
7Plant safetyFunctioning of the OWF including O&M
8Supply reliabilityGuarantee of energy supply
9FinanceMonetary interests
Table 2. OWF stakeholders and their direct interests (indicated by an ✓) in: (1) accident prevention, (2) security, (3) compliance, (4) occupational safety, (5) environmental protection, (6) reputation, (7) plant safety, (8) supply reliability, and (9) finances.
Stakeholder/Goal #123456789
Owner
Operator/Works manager
Turbine supplier
Maintenance provider
Logistic companies
Grid connection
Public authorities
Coast guard
Trade control
Rescue forces
Vessel and air traffic services
International organizations
Insurance companies
Investors
Energy exchange market
Media
Society
Environmental associations
Fishery
Shipping
Stakeholders per goal11101816118678
Table 3. Specific goals and related measures and sensors for the general goal environmental protection.
Specific GoalMeasureSensor System
Protect plantsAvoid pollutantsObserve leakage, Observe water quality
Protect water qualityAvoid pollutantsObserve leakage, Observe water quality
Protect whalesBubble curtain
Observe population
Protect fishAvoid pollutantsObserve leakage, Observe water quality
Protect birdsObserve population, Avoid collisions plant/animal
Protect batsObserve population, Avoid collisions plant/animal
Table 4. Specific goals and related measures and sensors for the general goal accident prevention.
Specific GoalMeasureSensor System
Safety planeCollision avoidance (Sonar transponder, Warning lights, traffic control, guard vessel)AIS
Safety helicopterCollision avoidance (Sonar transponder, Warning lights, traffic control, guard vessel)AIS
Safety shipCollision avoidance (Sonar transponder, Warning lights, traffic control, guard vessel)AIS
Safety ROVUXO clearance
Extreme weather measuresWeather data
Safety submarineCollision avoidance (Sonar transponder, Warning lights, traffic control, guard vessel)AIS
UXO clearance
Table 5. Specific goals and related measures and sensors for the general goal plant safety.
Specific GoalMeasureSensor System
Protect foundationUXO clearance
Collision avoidance (Sonar transponder, Warning lights, traffic control, guard vessel)AIS
Protect tower (Protect foundation)Extreme weather measuresWeather data
Protect rotor and nacelle (Protect tower)Avoid technical failure (regular maintenance)CMS
Lightning protectionweather data
Extreme weather measuresweather data
Avoid collisions plant/animals (Warning lights)
Protect cableUXO clearance
Protect OSSLightning protectionweather data
Avoid technical failure (regular maintenance)CMS
Firefighting (fire detection)Heat detection, smoke detection
Collision avoidance (Sonar transponder, Warning lights, traffic control, guard vessel)AIS
Protect converter stationLightning protectionweather data
Avoid technical failure (regular maintenance)CMS
Firefighting (fire detection)Heat detection, smoke detection
Collision avoidance (Sonar transponder, Warning lights, traffic control, guard vessel)AIS
Table 6. Specific goals and related measures and sensors for the general goal occupational safety.
Specific GoalMeasureSensor System
Safety of workerCollision avoidance (Sonar transponder, Warning lights, traffic control, guard vessel)AIS
Firefighting (fire detection)Heat detection, smoke detection
Safe transfer (PPE, extreme weather measures)Weather data, people tracking
Measures helicopter (Landing area, safe communication, firefighting)EPIRB, CCTV, AIS
Measures climbing (PPE, trainings)
Measures diving (decompression chamber, extreme weather measures)Weather data
Rescue chain (Safe communication, extreme weather measures)PLB, CCTV, weather data
Telemedicine (Safe communication)
Shipwrecked men rescuedRescue chain (Safe communication, extreme weather measures)PLB, CCTV, weather data
Shelter
Table 7. Specific goals and related measures and sensors for the general goal security.
Specific GoalMeasureSensor System
Safe communicationIT-security
Safe dataPrevent espionage (IT-security, access control)
Safe workerRepel attacks (access control)
Protect cableRepel attacks (access control)
Avoid manipulation (Access control)
Protect OSSRepel attacks (access control)
Avoid manipulation (Access control)
Protect converter stationRepel attacks (access control)
Avoid manipulation (Access control)
Table 8. A list of all functions with their respective probability of failure p and influencing factor f. Values are either low (L), medium (M), or high (H) and presented in Table 9. ROV (remotely operated vehicle), OSS (offshore sub-station), UXO (unexploded ordnance), PPE (personal protection equipment), AIS (automated identification system), CMS (condition monitoring system) EPIRP (emergency position-indicating radio beacon), CCTV (close-circuit television), PLB (personal life beacon). Source: Table adapted from [19].
#Function Namepf#Function Namepf
1Protect plantsLL33FirefightingLH
2Protect water qualityMM34Fire detectionLH
3Protect whalesLL35Safe transferLH
4Protect fishLL36Measures HelicopterLH
5Protect birdsLL37Measures climbingMM
6Protect batsLL38Measures divingMM
7Safety planeLH39Rescue chainLH
8Safety helicopterMH40TelemedicineMM
9Safety shipMH41ShelterLM
10Safety ROVHL42Regular maintenanceLH
11Safety submarineLH43Traffic controlLM
12Protect foundationLH44Guard vesselML
13Protect towerLH45PPEML
14Protect rotor/nacelleMH46Landing areaML
15Protect cableLH47TrainingsLL
16Protect OSSLH48Decompression chamberLL
17Protect converter stationLH49IT-securityMH
18Safety of workerMM50Prevent espionageLH
19Shipwrecked men rescuedLL51Repel attacksLH
20Safe communicationMM52Avoid manipulationLH
21Safe dataLM53Access ControlLH
22Avoid pollutantsLH54Observe leakageLM
23Bubble curtainLL55Observe water qualityLM
24Observe populationLL56AISLH
25Avoid collision plant/animalMM57Weather dataMM
26Collision avoidanceLM58Heat detectionLH
27Sonar transponderLM59Smoke detectionLH
28Warning lightsMM60CMSLM
29Weather measuresMM61EPIRBLH
30UXO clearanceLH62People trackingLM
31Avoid technical failureMM63CCTVMM
32Lightning protectionLH64PLBML
Table 9. Discrete values for function properties.
Parameter/RatingLow (L)Medium (M)High (H)
Failure probability p/year0.0050.0150.02
Influence factor f s (supportive)1.525
Influence factor f c (compulsory)0.10.30.5
Table 10. The five nodes with the highest probability of failure P ( S 1 ) in the generic OWF.
#Node Name P ( S 1 )
14Protect rotor/nacelle0.034
18Safety of worker0.031
17Protect converter station0.028
16Protect OSS0.028
10Safety ROV0.027
Publisher’s Note: MDPI stays neutral with regard to jurisdictional claims in published maps and institutional affiliations.

