1. Introduction
Human influence has warmed the climate at a rate that is unprecedented for at least the last 2000 years driven by emissions from human activities. The latter includes the impact of buildings, as our built environment is responsible for nearly half of energy consumption and carbon emissions. This is reflected in the continuous increase of energy costs in buildings due to changing lifestyles, including associated services and comfort levels. This cost increase has a direct correlation with building user behaviours including the amount of time people spend in buildings.
With these underlying factors, the process of reducing building costs by adopting energy efficiency strategies represents a priority for regulation bodies (at both the regional and international levels) [
1]. Several energy optimisation strategies have been proposed and validated as efficacious for tackling energy management; however, the actual adoption and implementation has been delayed due to social, cultural and political factors that are identified across communities. Such strategies usually involve changes in building operations through the use of control systems, thus, resulting in significant cost savings for building operations [
2,
3,
4].
With the adoption of the “Smart Technology Readiness Level” in the European Union, the instrumentation of buildings with smart devices is necessary in order to promote sustainable practices while engaging with the ongoing strategies to mitigate the effects of climate change. In the UK, the cost of domestic energy usage accounts for 20–25% of total energy costs. Furthermore, the Department for Energy and Climate Changes aims to reduce UK energy consumption (with associated reduction in greenhouse gas emissions) by 80% until 2050—focusing on influencing a change in householder perception of sustainable energy practices [
5,
6].
Understanding how tariffs (costs) associated with energy use and efficiency can impact energy demand is an important consideration. The following characterise this impact: (i)
Price perspective: increased energy efficiency leads to reduced costs of use for consumers, generally leading to greater consumption; (ii)
Macroeconomic perspective: increased productivity identified by energy-oriented sectors investing in energy efficiency can reallocate resources in the economy, favouring energy sectors over others. From this perspective, there is an acute need to promote energy use education to help users understand the importance of best practices around energy management and develop a “smarter” energy society [
7,
8].
We use a scenario-based approach to investigate the costs associated with HVAC energy optimisation using cloud environments. Energy optimisation analysis is undertaken using the EnergyPlus software, and we investigate how costs vary when employing specific EnergyPlus optimisation techniques. The results presented in this paper are part of the EU FP7 “Sporte2” project. The reminder of this paper is structured as follows: in
Section 1, we provide an overview of energy cost optimisation, followed by related work covering economic models in
Section 2. In
Section 3, we present a use-case description identifying the key concepts related to cost and energy. We then present our proposed model, followed by an evaluation of the costs based on the computing infrastructure used and costs with energy optimisations in
Section 5. We present our conclusions and lessons learned from this work in
Section 9.
2. Related Work
The European Commission’s focus on cost reduction and energy optimisation is the result of extensive studies in the field of an energy efficiency gap [
9] and forms the driving agenda of the current European Green Deal that advocates the transition to a “circular” economy [
10]. Such a gap reflects a lack of consistency in energy targets identified at the design phase and the operation phase where the actual energy consumption overcomes the expected targets.
Interest in energy efficiency has led scientists to evaluate key aspects in cost reduction. This is an intensively debated topic amongst economists, engineers and other scientists, e.g., Jaffe and Stavins [
11], who suggested that energy efficiency has been neglected in a wide range of situations [
12]. Gillingham et al. [
12] stated that the two main areas necessitating energy efficiency improvements and cost reductions are transport and buildings.
Shogren and Taylor [
13] demonstrated that behavioural economics in the context of environmental policy does not allow a wholesale rejection of rational choice theory. Their research findings show
deviated behaviours in energy consumption and confirm that a continuing analysis of economic circumstances, institutional designs and social contexts is required. Further studies by Neij et al. [
14] investigated the foundations for the
micro-motivation of household decisions for observing energy efficient behaviour. These studies demonstrated that developing energy efficiency products and assets that are more accessible to householders in terms of prices, brand/designs and performance can significantly contribute to reducing the risks of non-adoption of such decisions.
Another group of economists [
15] developed a number of hypotheses to determine the trigger factors for this apparent gap—which include hidden costs with energy efficiency, including search costs as well as reductions in other product attributes. Both Metcalf [
16] and Sanstad et al. [
15] explained how the uncertainty of future energy savings can lead a rational investor to require a rate-of-return that is lower than the market discount rate. This happens because energy efficiency investments often tend to serve as a hedge against other risks.
Considering the actual state-of-the-art in the field of ICTs applied to the built environment, two main actors are positioned at the extremes of construction value chain. At one extreme, there is the BIM (Building Information Modeling) technology, which represents the performance under standard conditions including all the information of the building and its components [
17].
At the opposite extreme, there is the Building Management System (BMS), which actuates controls under real conditions [
18]. However, there is a missing ring to connect the two extremes of the building efficiency chain. Most of the building controls and systems are provided with data sheets reporting their performance in standard conditions [
19]. While incorrect installation, interaction with multiple systems, over-complexity, inaccurate bedding-in and calibration, real operation related to the occupants behaviours and inexperienced management are the principal reasons for the performance decrease.
In this study, we aim to develop and address the following research questions:
RQ1: How can edge and cloud computing facilitate implementation of sustainable energy strategies for sports facilities?
RQ2: What cost implications are identified when undertaking energy optimisation in sport facilities?
RQ3: What lessons and best practices should be adopted for supporting transition towards “smarter net-zero” sports facilities ?
Our approach aligns with these related studies by acknowledging this gap, and we address an instance of this by referring to large scale buildings, such as sport facilities, and demonstrate how cost and energy use can be balanced by undertaking energy optimisation. On the other hand, our work differs from these existing approaches in two ways: (i) the costs associated with energy optimisation and (ii) the costs associated with the use of computing infrastructure to manage data to support energy efficiency. Our analysis of literature has indicated that these two aspects are often ignored.
3. Approach
We investigate how energy usage optimisation can be conducted by building facility managers using edge and cloud environments. Existing approaches aggregate data from buildings via sensors and other control devices to better understand building use and identify optimisation scenarios that can lead to cost reduction for energy use [
20,
21,
22]. However, undertaking energy optimisation with specialist infrastructures, such as edge and cloud computing has not been explored.
A key barrier to adoption is the cost that a facilities manager needs to pay for using cloud services [
23], and these costs are often difficult to fully quantify (if the building use varies over time). Quantifying the benefit and value of this investment remains unclear and is seen by facilities managers as a cost that cannot be fully justified. We propose a flexible computational framework with edge and cloud environments hosting simulation-based optimisation workflows utilising EnergyPlus [
24] that allow for the exploration of “what-if” scenarios in relation to a set of input and output parameters.
EnergyPlus has been used in a wide range of energy scenarios related to simulations of building energy efficiency that include sequential runs coupling lighting/daylighting, HVAC, water hearing and the on-site generation of energy. EnergyPlus will use two inputs to measure the heating and cooling loads required to manage HVAC control set points: (i) the Input Data File (IDF) includes a set of energy related input parameters and (ii) the Weather Data File (EPW) includes parameters for the exterior climate of a building. The simulation also considers aspects related to the building configuration, shape, orientation, technological and materials.
An energy simulation is carried out over a time interval to produce results and actionable insights with time limited benefits, that can be implemented as set points using actuation-based interfaces within a building. Such completion time impacts both facility managers and cloud infrastructure providers in terms of costs whereby a longer completion time can determine additional costs associated with using the computing infrastructure and limited interventions potential within a building (see
Figure 1).
Energy optimisation can be implemented in large infrastructures, such as a sports facilities and stadiums with multiple indoor parameters that need to be optimised. Such infrastructure involves complex energy optimization interventions, which must also take account of how people use such facilities, and consider their subsequent impact on facility operations.
Therefore, energy optimisation needs to be executed at different intervals of time in order to capture building use, in terms of the operation changes from user requirements. Executing energy interventions in a timely manner is essential to improve the costs of energy consumption and support a more informed decision making in building operation [
25,
26]. Equally important in the context of building optimisation is an adequate computing infrastructure to support data analysis for control and actuation based on sensors readings, capturing the dynamics in building operation.
Edge and cloud infrastructure offer flexibility and elasticity for hosting such energy optimisation workflows. When an optimization request is submitted for execution, a cost-based approach must be employed to determine computational resources required to achieve an actuation outcome within a pre-defined time interval (if this interval cannot be met, this is equivalent to the outcome becoming useless) [
27,
28].
EnergyPlus optimisation in this context involves two parameters that have a direct impact on cost: (i) Complexity of the IDF building model (e.g., a domestic building vs. a sports stadium) impacts the average simulation time and the associated cost; (ii) Period to simulate (which has an impact on the overall simulation time and cost). The relationship between the cost of the computational infrastructure and simulation period is, however, not straightforward, as cloud providers often use pre-defined periods (1 h of usage) to calculate costs. Simulations that run for 5, 30 and 55 min will incur the same computational cost when deployed on a public cloud. This is changing recently with availability of “serverless” and function-based computational approaches.
The energy consumption in buildings has increased continuously in the last 20 years with HVAC systems accounting for approximately 40% of the total building energy consumption. Implementing specialised optimisation strategies for energy consumption in buildings becomes critical as people tend to spend more time indoors—an aspect also observed during the pandemic. Simulation-based optimisation strategies were demonstrated to be efficient when dealing with complex buildings where changes of indoor and outdoor ecosystems are frequent. Such optimisation involves multiple time and environmental variables that need to be analysed in order to determine the actuation set points.
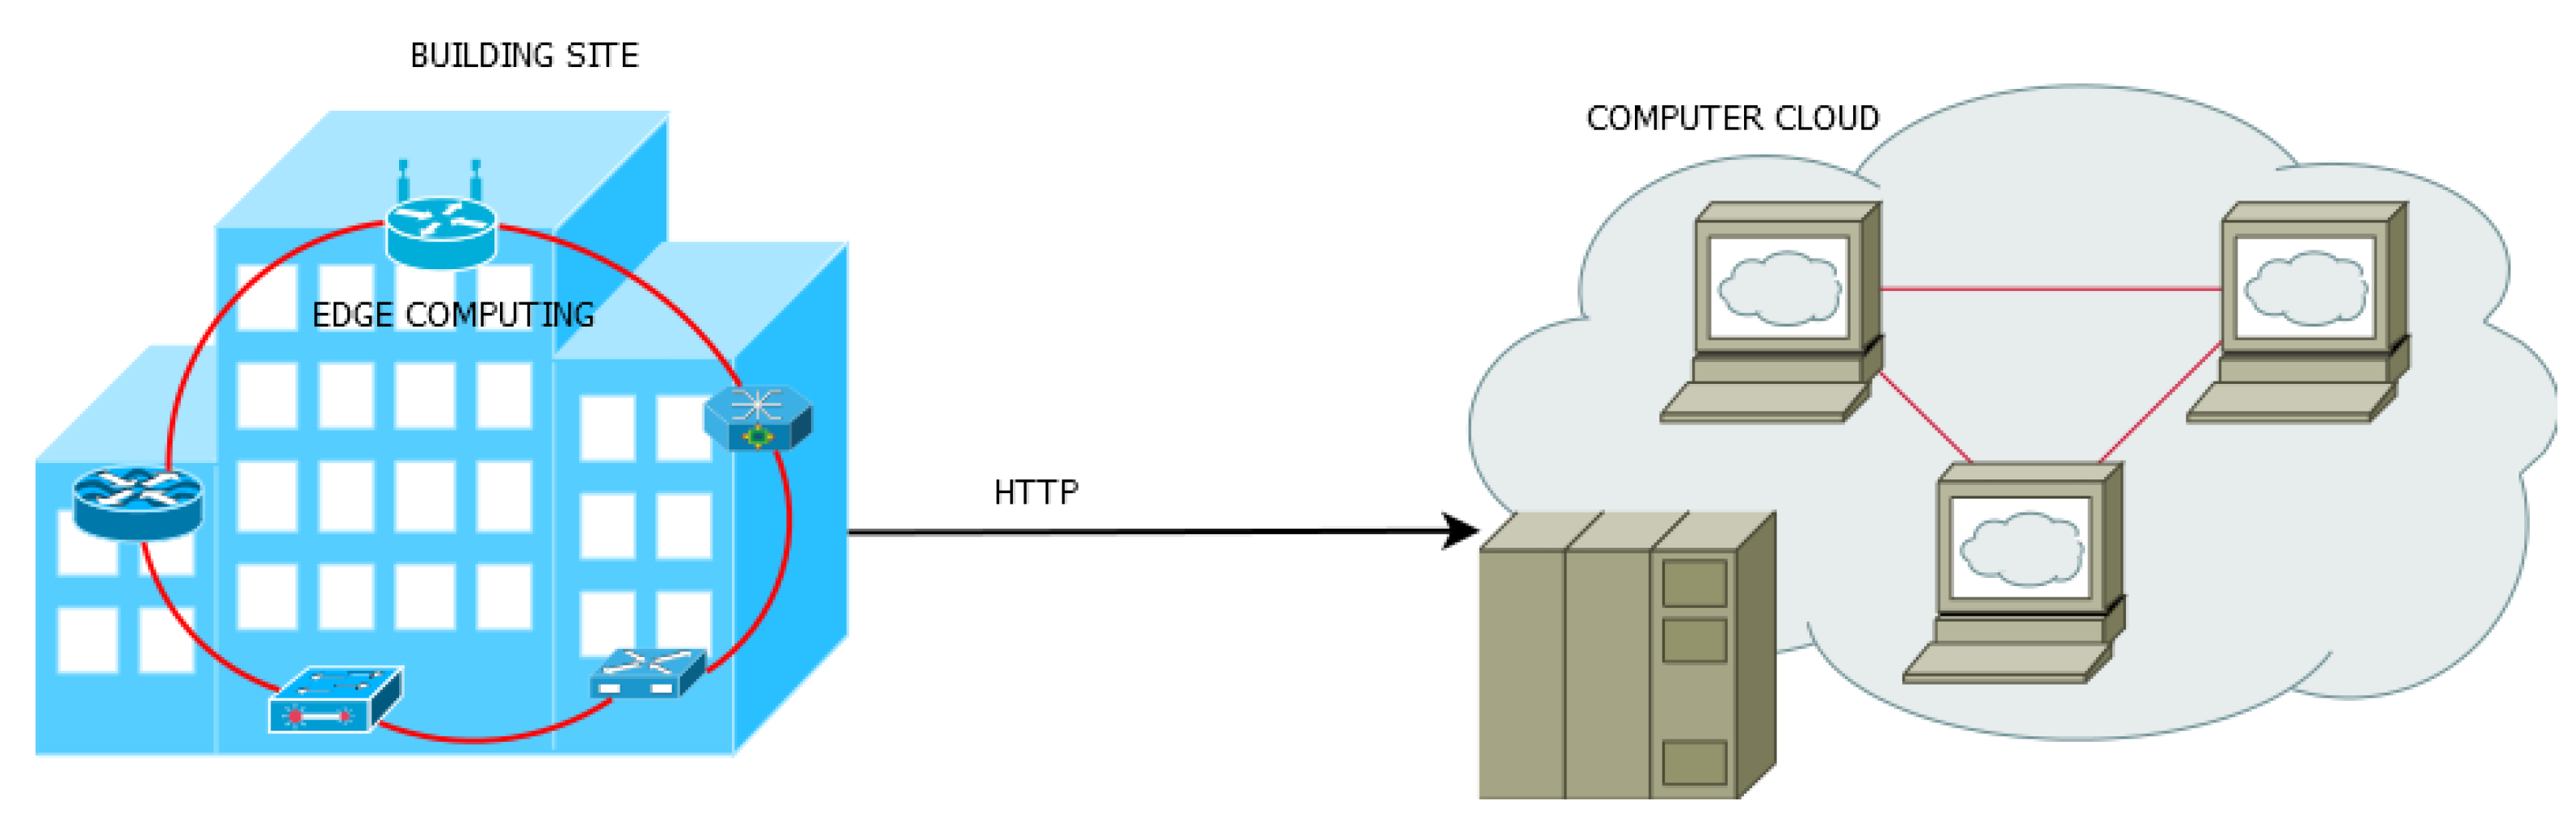
Recently, building assets are deploying a range of IoT devices, including data streams sent to a cloud for storage, and thus it is possible to deploy such optimisation tasks on either cloud or edge systems. We, therefore, propose a method for hosting energy optimisation workflows on edge/cloud layers that can be directly accessible via an HVAC system. This involves the execution of several optimisation tasks at the edge (in proximity to an HVAC system) to reduce the optimisation and execution time.
4. Methodology
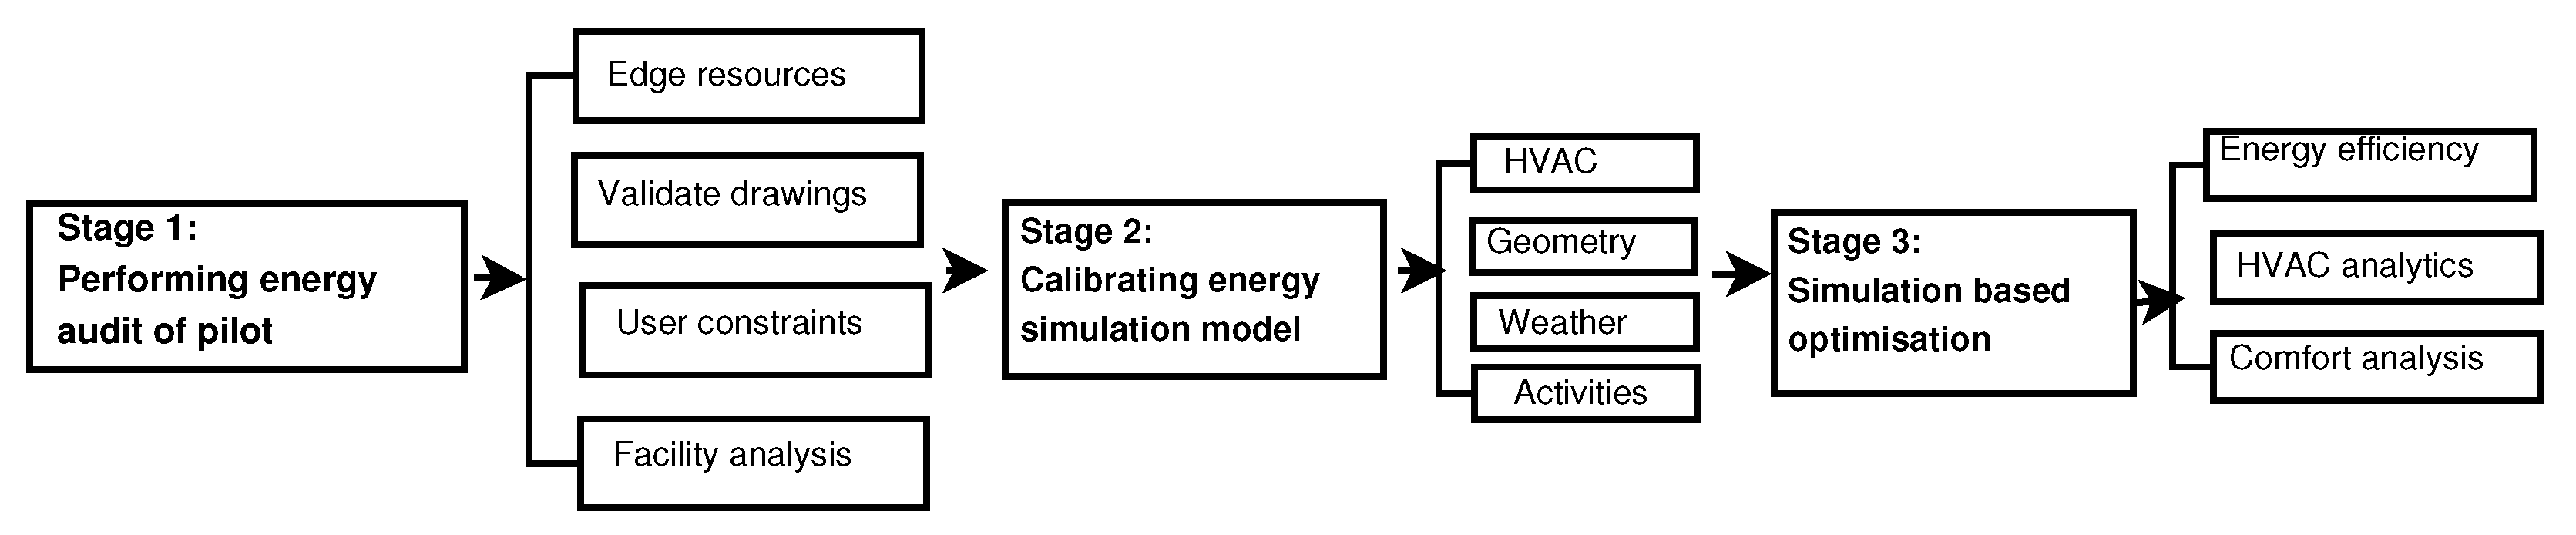
For developing the research questions, we adopt a holistic methodological approach starting from the requirements elicitation to understand the complexity of the pilot project followed by a model development phase for supporting what-if analysis. The optimisation phase uses the simulation model configured with pilot input parameters and objectives, such as energy efficiency, comfort and carbon emissions.
The proposed methodology involves the following stages (
Figure 2):
Stage 1: Performing energy audit of the pilot.
Stage 2: Calibrating energy simulation model.
Stage 3: Undertaking simulation-based optimisation.
This stage involves an energy audit of the pilot to understand and map (a) the energy systems in place and ways in which these are operated, (b) energy consuming equipment across the station and their operating schedule, (c) existing sensing and control infrastructure as well as their control systems and (d) user requirements (pilot users) and their associated behaviours.
Based on the specifications in stage 1, this stage involves the development of an energy simulation model with associated recommendations for energy improvements based on the initial modelling. A calibration will be applied to factor in all fabric and mechanical systems and equipment information based on information and assumptions gathered from the auditing exercise.
The optimisation phase utilises standard GA optimisation algorithms to find the optimal values and setpoints for a population of candidate solutions. The input of the GA optimisation is obtained from multiple simulation instances where parameters values are customised to suit the constraints obtained from the auditing phase.
Based on the above stages, we develop a two-fold cost analysis for identifying the cost implications of running energy optimisation and the cost with edge and cloud infrastructure necessary to host energy optimisation.
5. Cost Analysis and Specifications
We calculated the cost of energy optimisation as identified in the Sporte2 project. We installed the edge HVAC optimization on different pilot computer resources and measured the costs over a 42-day interval. We report scenarios from the EU
FP7 project. The HVAC analytics were applied on a sport facility pilot called FIDIA (
http://www.asfidia.it, accessed on 15 March 2021)—a public sports building facility located in Rome (Italy).
The pilot building has 9 cm of wooden exterior walls and 9 cm of wooden roof. The floor is formed of concrete, and the windows are single glazing with a 5.7 W/mK thermal transmittance and a solar gain of 0.7. The pilot has a Gable roof with Hmin = 3 m and Hmax = 6 m, with window surfaces of about 70 m. Sensors and actuators are installed throughout the sports facility for data capture, control, and optimization. The electricity, coal, biomass, water, and thermal energy usage are all monitored through the building’s metering system. Such data can be obtained and analysed using a computer interface. Thermal and electrical energy sub-metering is located in different areas (gym/fitness and swimming pool).
For the GA optimisation, we used a standard GA model [
29] where each individual in the population has a fitness value as a measure of the proposed solution. To develop a new generation of candidate solutions, the best solutions were chosen based on their fitness ratings with all positive attributes dominating over several generations. The energy scenario implemented as a EnergyPlus simulation model and utilised for the GA optimisation process involves the following input and output parameters:
Input parameters: day, month, year, occupancy, indoor temperature, humidity, outdoor temperature, air-flow rate, air temperature;
Output parameters: Energy consumption, Projected Mean Vote (PMV) comfort, and Carbon emission; The Projected Mean Vote (PMV) comfort index (measuring average reaction to a thermal sensation scale from a group of users of the building—such as hot, mild to cool and cold) in these areas is one of the most commonly known metrics of thermal comfort and is measured based on usage and occupancy of a specific part of the building. In the gym, exercise rooms and the swimming pool area, occupancy was also tracked. All these variables were monitored with sensing equipment, and setpoints obtained from the optimisation process were implemented via a set of actuators.
6. Cost of Edge HVAC Infrastructure
The infrastructure is based on CometCloud [
30], which is a decentralized coordination system based on an autonomous computing engine that supports a highly heterogeneous and dynamic cloud/HPC infrastructure, allowing public/private clouds and autonomic cloudbursts (where multiple cloud resources are integrated to meet data processing demand) to be combined with a view to comply with requirements of workloads and demands.
The CometCloud site tuple-space contains a number of available workers and a master that receives requests from CometCloud users. There are two possible execution methods: (i) edge execution: tasks processed on the CometCloud platform hosted by a data center; and (ii) cloud execution: tasks are processed on the CometCloud platform in the data centre.
To help task processing, different edge devices can be dynamically combined, e.g., we can build one edge cluster consisting of five Raspberry Pi devices, or independently consider each device for processing. Edge resources are limited in their processing capability especially when the task completion is dependant on a deadline. Instead, a cluster of edge devices can aggregated enough capability to execute an energy simulation task. A cost comparison provides including storage, data transfer, and execution as a means to measure the reliability of the infrastructure.
where
is the cost of using computational resources (e.g., CPU/GPU),
represents the amount of transferred data (and cost of transmission) and
represents the cost of data storage over a particular time frame. The costs reported in the experiments are based on Amazon EC2 small instances in US dollars(
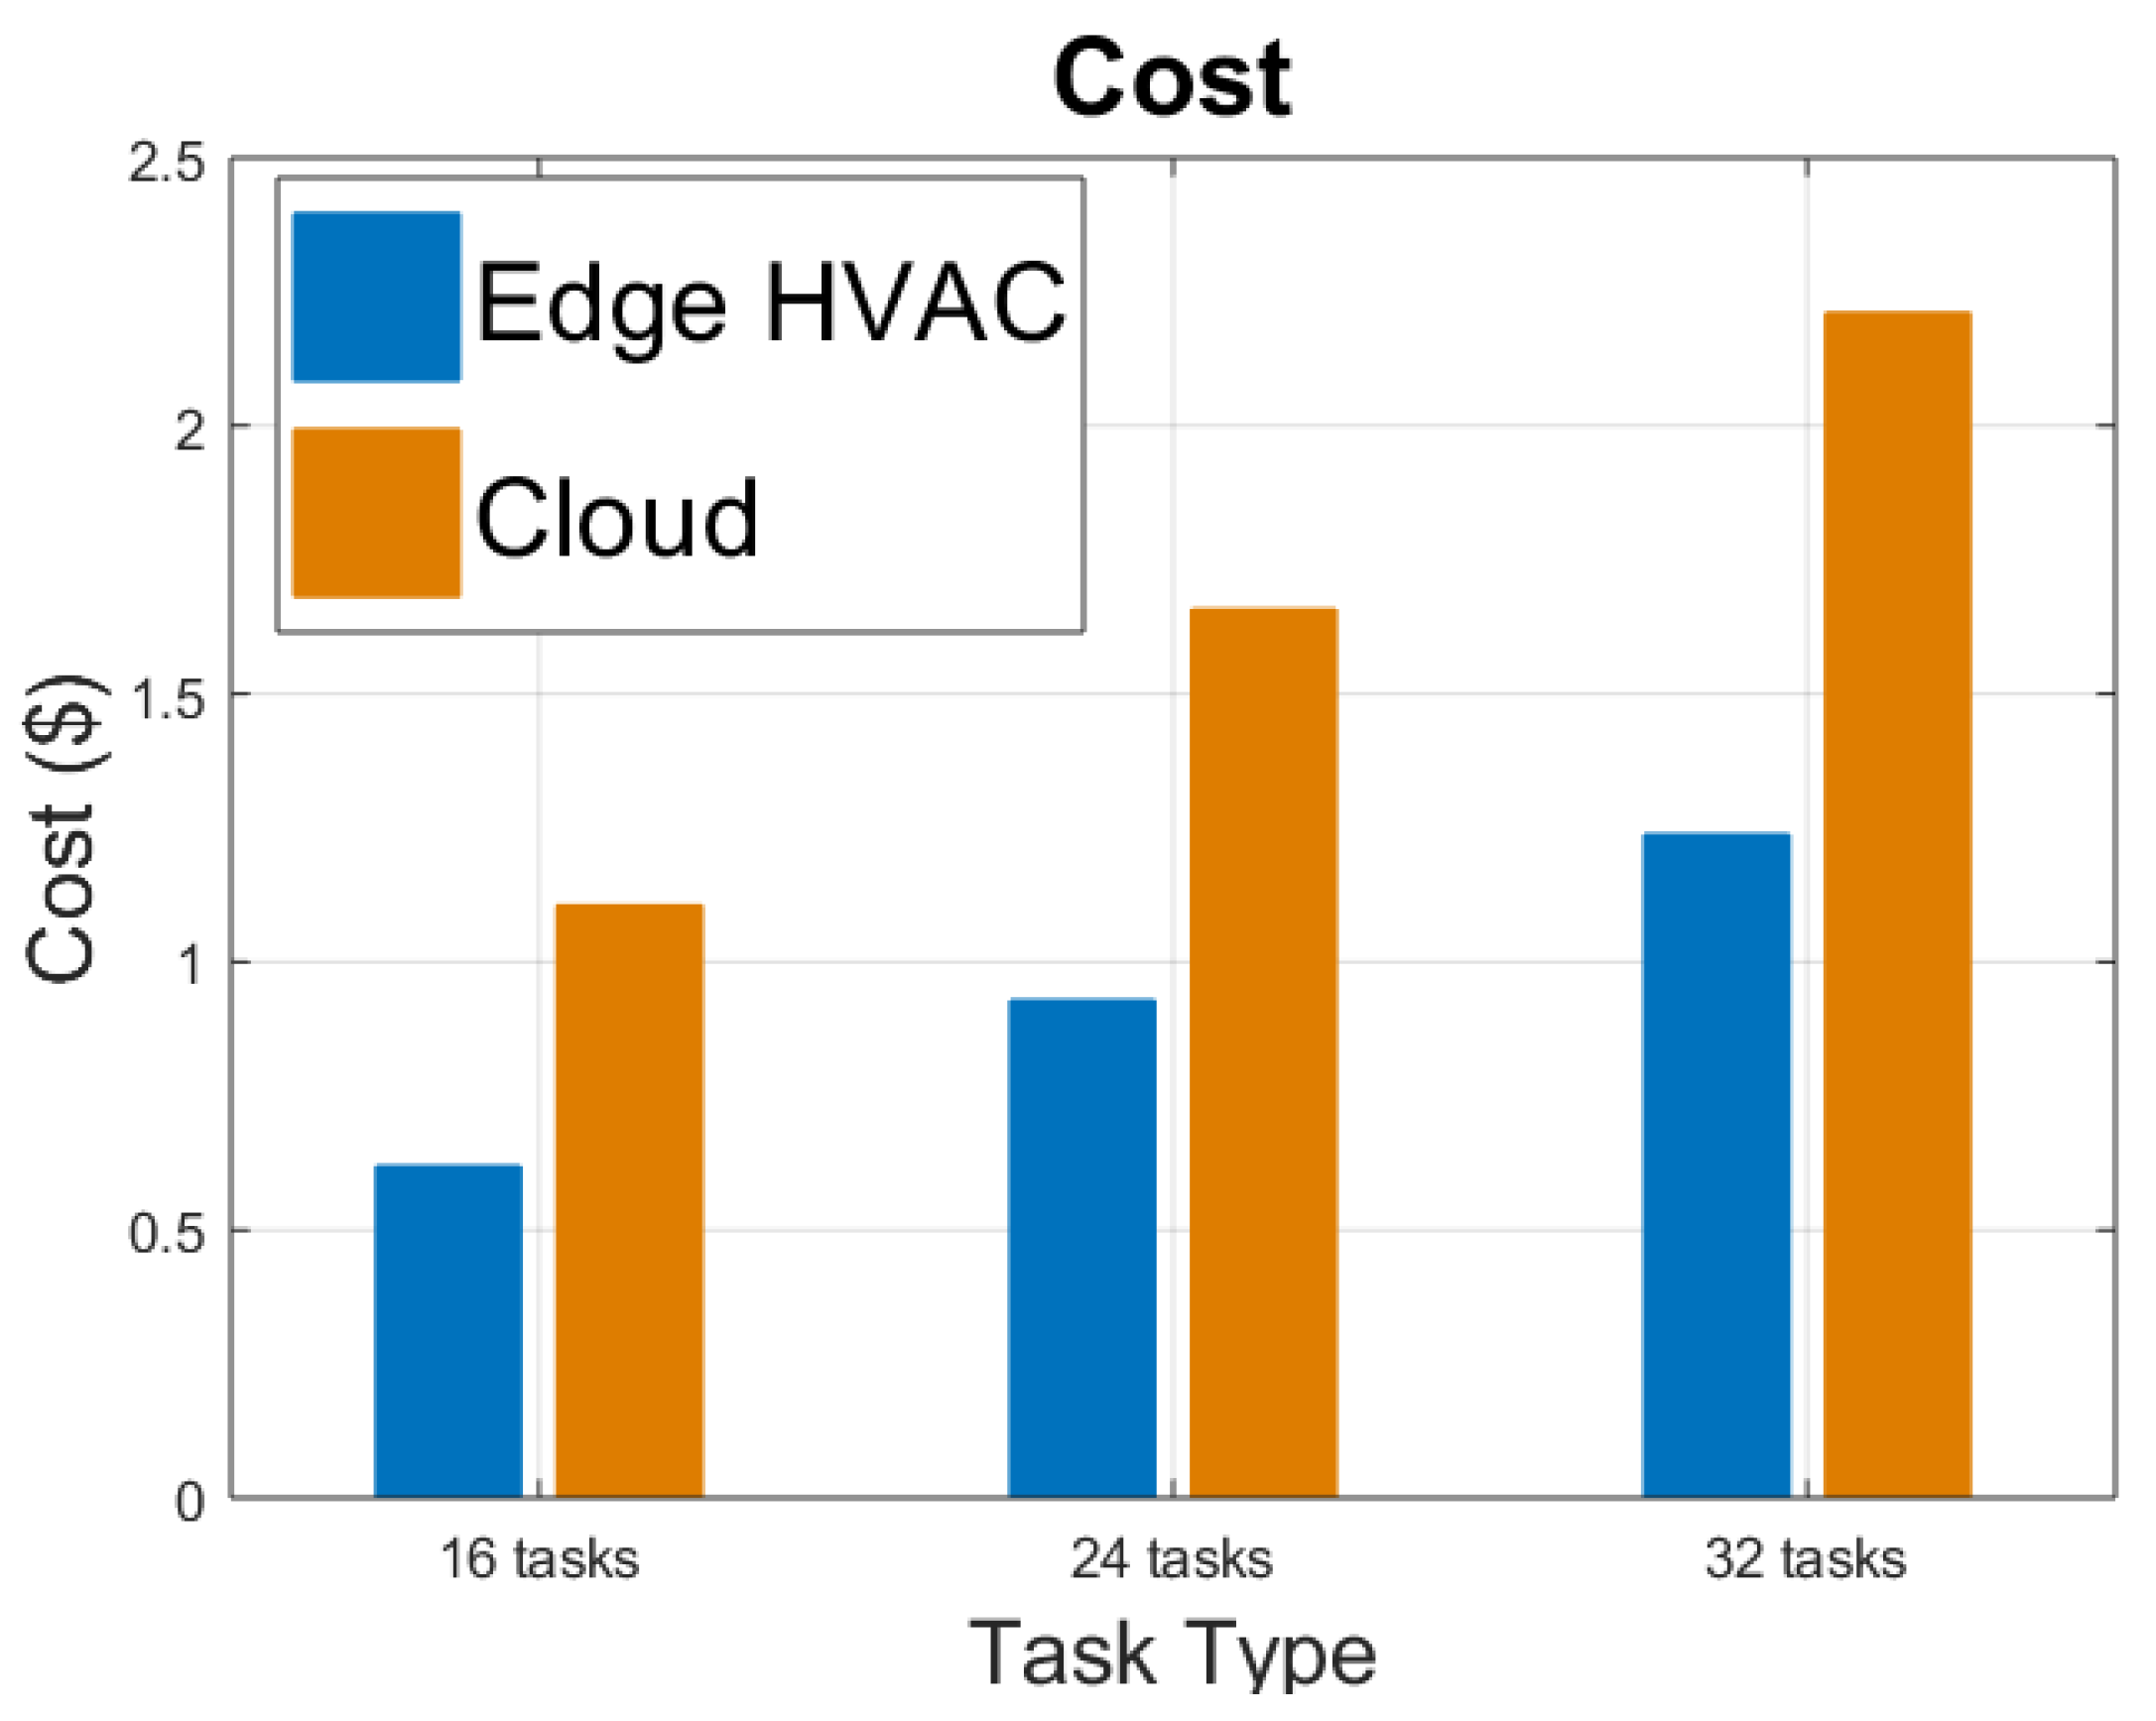
$). In total, we explore different scenarios in this work, as listed below:
Figure 3 identifies the costs for different sized jobs, deployed over varying types of infrastructure (e.g., edge vs. cloud systems). In this experiment, we test different optimisation workflows where each optimisation is composed of 16, 24 or 32 EnergyPlus simulations. The highest operational cost occurs when using edge resources, primarily due to the long execution time (requiring an edge resource to be used over a much longer time frame compared to cloud resources), and the size of the transferred and stored data. Conversely, the cost is the lowest when using CometCloud deployed at a data centre (due to lower computational, storage and data transfer cost).
7. Cost and Energy
To demonstrate the impact of costs with energy consumption, we analyse different optimisation scenarios aimed at providing a more optimised building ecosystem in terms of the energy consumption of comfort.
There are two components of FIDIA HVAC energy consumption: thermal energy and electricity consumption, which can be expressed as: E = + , where, and represent the consumption of thermal and electrical energy. E reflects the cumulative energy that the building uses and is the predicted mean value comfort used as a constraint.
In our evaluation we compare the energy cost incurred in the proposed optimisation with cost resulting from traditional actuation carried out manually by building operators. These manually applied operations include switching off the boiler, turning off/on ventilation fans, managing the lights etc. The edge HVAC optimisation, on the other hand, generates control actions that optimise the buildings ecosystem via actuation setpoints.
Interval Cost—, is a metric to show the cost impact involving represents the interval cost, represents the energy consumption value and represents the average price for energy ;
Day Average Energy Cost—, where n represents the number of intervals per day (i.e., how many optimisations per day).
7.1. Results
To demonstrate the edge HVAC optimisation, we provide two experiments where energy optimisation is implemented for the building pilot. We provide a comparison between Edge HVAC supported optimisation and traditional (manual) optimisation. Traditional optimisation refers to direct user manual interventions for actuating and controlling HVAC units.
7.1.1. Experiment 1: Day Energy Consumption Costs: Edge HVAC Optimisation vs. Manual Optimisation
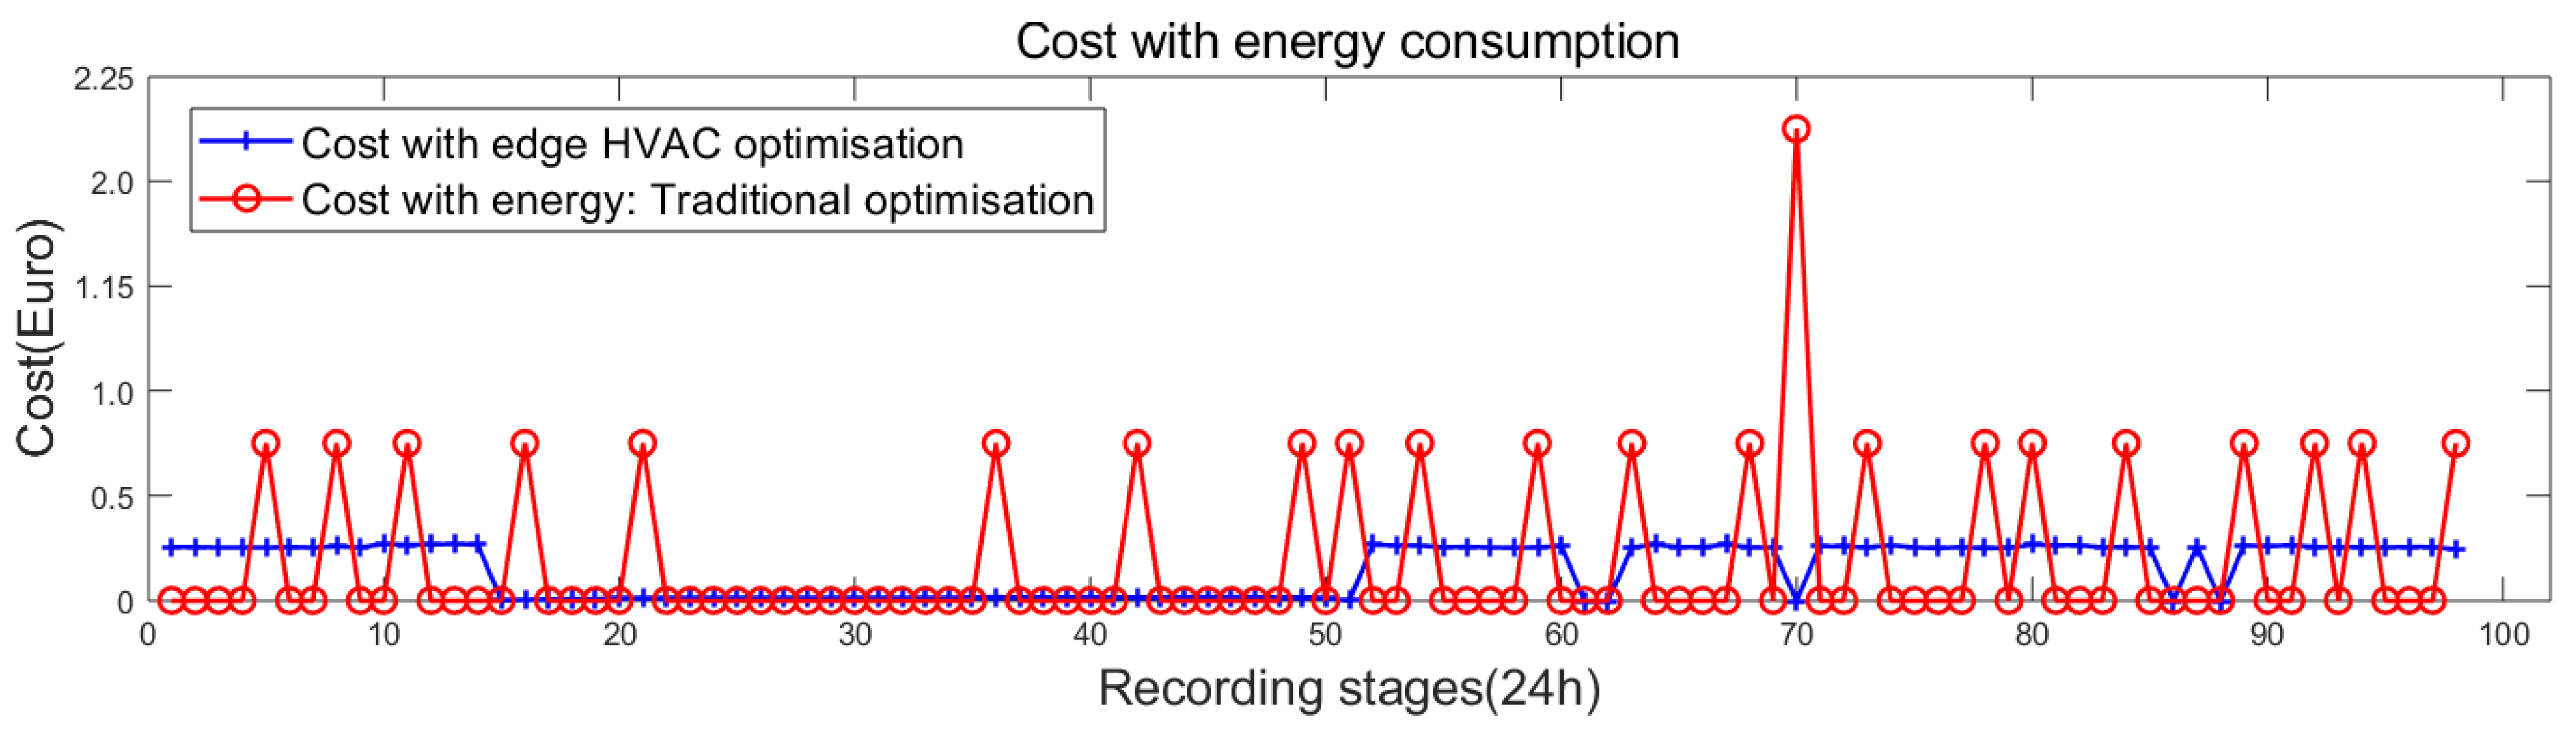
The experiment reported in
Figure 4 shows the cost of energy consumption for FIDIA over a 24 h period. When using manual optimisation, the cost fluctuates between 0 and 0.7 Euros with a peak value of 2.3 Euros. For edge HVAC optimisation, the building identifies a cost with the optimisation in the interval of [0–0.25] Euros. The experiment demonstrates that edge HVAC optimisation supports a higher order of automation and a lower overall cost as well as a value that is more consistent.
Two consumption schedules are illustrated in
Figure 4: (i) day schedule with a specific consumption cost and (ii) night schedules. We provide, as a comparison, baseline consumption with manual optimisation involving no intelligent decision making process. Edge HVAC optimisation is based on deploying simulation-based optimisation workflow with real-time sensor data over 15 min intervals. The edge HVAC optimisation can lead to significant cost savings, as presented in the experiment, reducing the costs of energy consumption by approximately 39%.
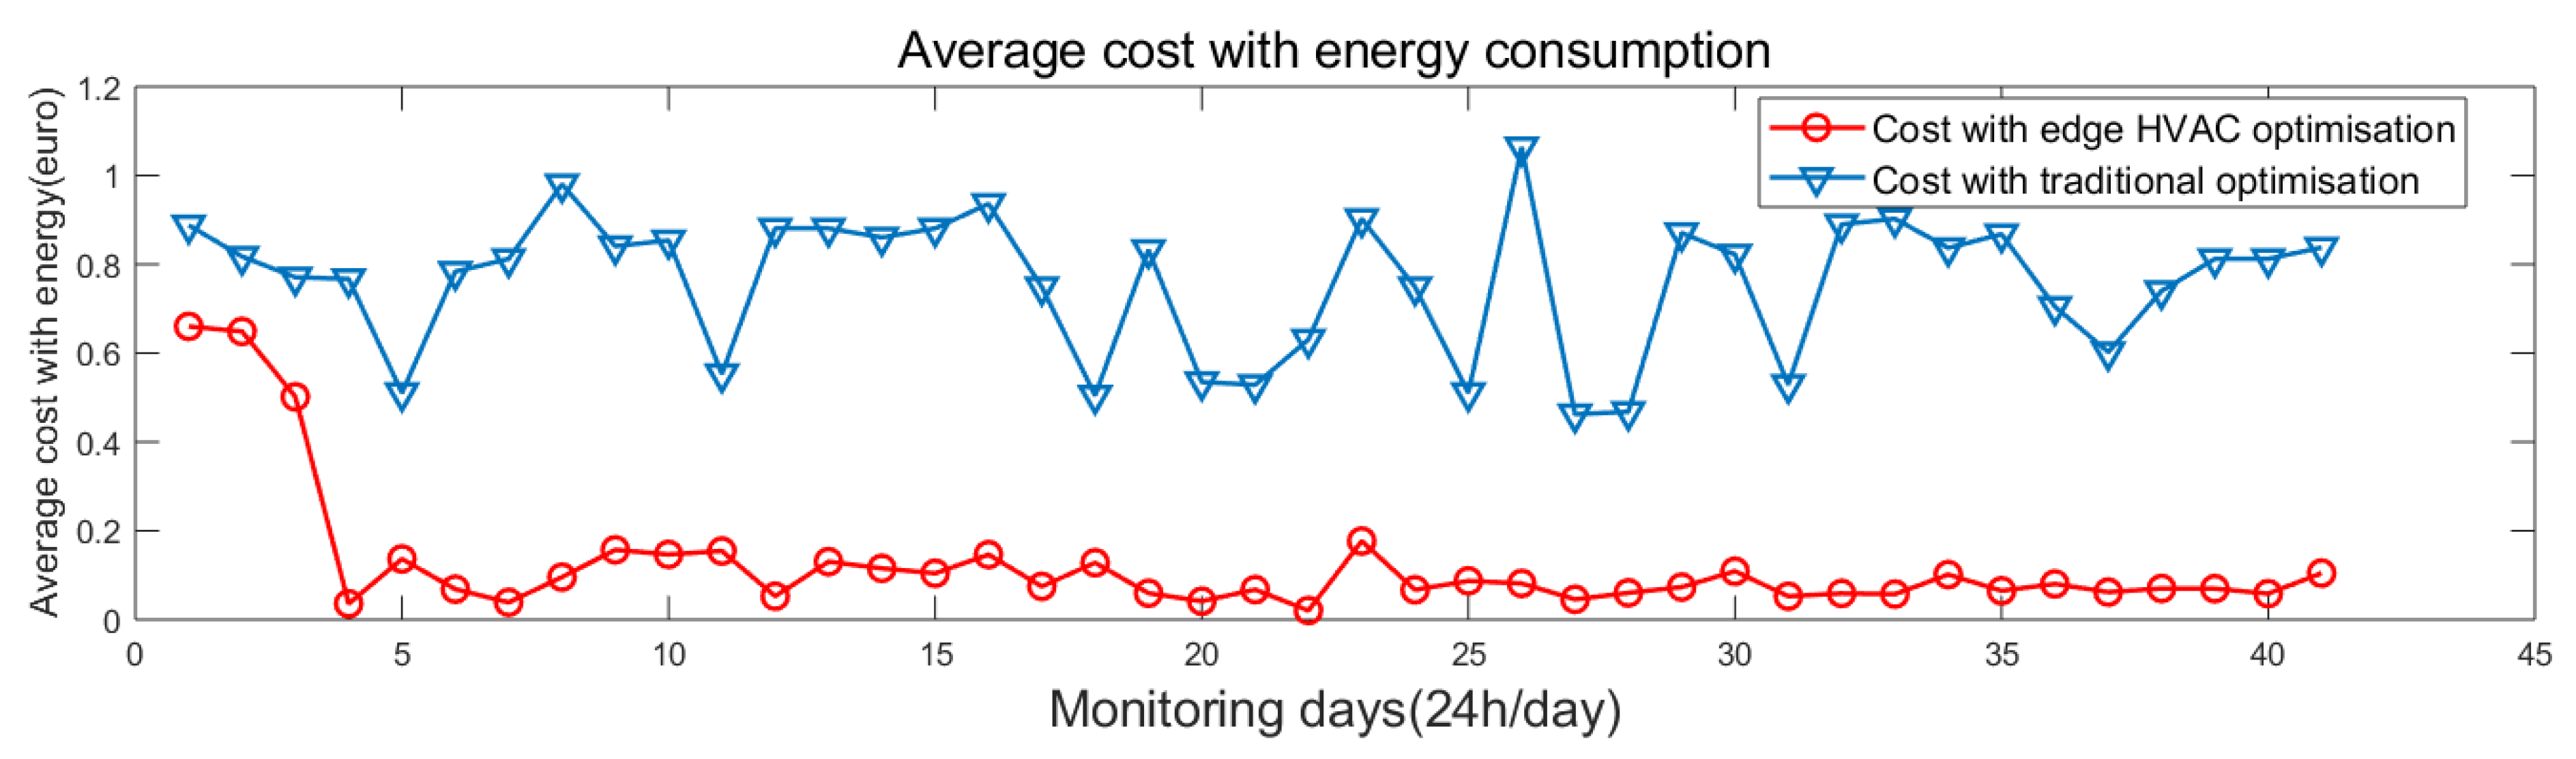
7.1.2. Experiment 2: Energy Consumption Costs: Edge HVAC Optimisation vs. Manual Optimisation
In this experiment, the energy consumption changes across the two considered scenarios: (i) Edge HVAC optimisation and (ii) traditional (manual) optimisation. The results reported in
Figure 5 show edge HVAC optimisations that lead to cost savings. We present the average cost of energy consumption per day over a 42-day monitored interval, with manual optimisation achieving a cost of 0.61 Euros per day. The cost of edge HVAC optimisation varies over the interval [0.01–0.55] Euros with an average of 0.09 Euros per day. The set points obtained based on the edge HVAC optimisation leads to a reduction of cost when implemented at every 15 min intervals, enabling the actuation system to respond to any changes observed over this interval.
8. Discussion: Edge-Based HVAC
Computer technologies have the ability to transform the construction sector by using the growth of digitalized information and data to deliver a higher order of intelligence for built assets. Many types of applications can be created based on data, allowing efficient physical time-series data collection, processing and exploitation for various usages so as to offer fine-tuned services to end users. Having access to massive sets of data promotes the enhanced evaluation of services, assists in decision-making, allows optimized use of resources and, to a certain extent, anticipates future needs.
Current built environments are intensive real-time data generation systems, the monitoring and control require powerful analysis tools, and extensive digital information. This complexity is further prevalent for zero and positive energy built environment.
Given the context for HVAC systems, we explain how smart buildings can make direct use of Internet of Things (IoT) devices directly available in their proximity (e.g., within a home or office environment). These IoT and Edge devices can be used to support both data capture and initial analysis to determine usage trends. The management of buildings using HVAC systems should take into consideration the following aspects:
Devices that are available closer to user owned resources can be used to monitor trends in how users utilize appliances.
We can embed computational capability directly into consumer appliances—either through the use of an add-on software, or through the use of a hub that sits within a home—Google Nest, British Gas Hive.
The implementation of Smartness Technology Readiness indicators in buildings requires an optimal instrumentation in terms of edge devices( sensors, actuators and controllers) necessary to support sustainable building practices and their associated costs.
In this paper, we investigated the optimisation of buildings using edge and cloud systems for conducting HVAC analytics. The optimisation of building systems identifies two main cost components (i) cost with computing infrastructure required to host the overall optimisation process for storage, transfer and execution of optimisation and simulation tasks and (ii) cost with energy of the building involving various consumption units (HVAC) that are identified in the building pilot.
Edge HVAC analytics represents an efficacious alternative to cloud optimisation, as often an edge/IoT infrastructure is available within the building and deployed as part of a construction phase. The contribution we provide leverages on edge capability to support energy optimisation in buildings as a reliable alternative to traditional/manual optimisation. The edge HVAC approach is also aligned with digital twinning strategies recently adopted in the construction industry to achieve a higher order of digitalisation.
9. Conclusions
The construction industry presents a major opportunity to make substantial progress in reducing energy demand, improving efficiency and reducing carbon emissions. Such transformation involves strategic objectives, including to cut the “acceptable” level global warming through a wide range of measures, including considerate built-environment interventions.
Understanding how the use of HVAC systems can be optimised in an automated manner represents a key challenge that can influence the adoption of sustainable practices in buildings. In this paper, we presented a cost perspective on energy optimisation as identified in EU FP7 “Sporte2” project, which is specifically focused on energy optimisation in sports facilities. We considered: (i) the costs of using computing infrastructure and (ii) cost reductions arising from energy optimisation. The proposed solution was informed by primary sources of evidence derived from an in-depth energy audit and has clear applicability for buildings types that require optimisation of the energy use and/or a more seamlessly integration of renewable sources.
We demonstrated how an edge and cloud-hosted simulation can be efficiently used to addressed the problem of high cost with energy consumption and to provide sustainable solutions for better energy practises. We showed how the cost of both thermal and electrical energy varied over a monitored interval, and demonstrate the benefits of using the automated energy management approach supported with edge HVAC capabilities. Although the initial cost of computing infrastructure can impose barriers to adoption, we demonstrated that energy optimisation can be undertaken with a cloud computing infrastructure, making use of a pay-as-use model.
We also observed that building energy optimisation is being undertaken across a cloud and edge environment which also consumes energy. Edge computing resources, due to their limited computational capacity, consume small amounts of energy (a Raspberry Pi consumes approx. 10 W of power). However, where a cloud infrastructure and network transmission is involved, power consumption can increase considerably.
Our work does not account for the aggregate power consumption “end-to-end”—e.g., building energy saving offset by combining energy consumed through the cloud-hosted simulation vs. energy saved based on results of the simulation. Due to variation in resources at a cloud data centre and potentially other competing workload, an accurate number for this would be difficult to estimate. Future work will explore ways in which HVAC edge analysis can embed machine learning algorithms to reduce execution times and costs.


