Article

Diversity and Changes in Energy Consumption by Transport in EU Countries

1
Institute of Economics and Finance, Warsaw University of Life Sciences, 02-787 Warsaw, Poland
2
Management Institute, Warsaw University of Life Science, ul. Nowoursynowska 166, 02-787 Warszawa, Poland
3
Department of Agrotechnology and Agribusiness, Faculty of Agriculture and Forestry, University of Warmia and Mazury in Olsztyn, ul. Oczapowskiego 2, 10-719 Olsztyn, Poland
*
Author to whom correspondence should be addressed.
Energies 2021, 14(17), 5414; https://doi.org/10.3390/en14175414
Submission received: 22 June 2021 / Revised: 17 August 2021 / Accepted: 27 August 2021 / Published: 31 August 2021
(This article belongs to the Special Issue Energy Supplies in the Countries from the Visegrad Group)

Abstract

:
The main purpose of this paper is to present the differences in the volume of energy consumption in transport in the EU (European Union) countries. The specific objectives aim to determine the directions of changes and the degree of concentration in the volume of energy utilized by the transport sector in EU states, showing various models in this area, to establish the association between energy absorption and the parameters of the economy and in the field of transport. All EU countries were selected for research by the use of the purposeful selection method as of 31 December 2018. The analyzed period covered the years 2004–2018. For the examination of data, grading data analysis was used as one of the methods of multivariate data analysis. Descriptive, tabular and graphic methods were used to present the results. Findings reveal that there is a general tendency to reduce total energy consumption in the EU countries. The same is the case of energy in transport. Only in 2016–2018 was there an increase in energy absorption in transport. The reason was the better economic situation in this period. Road conveyance is the most important factor in energy utilization (over 90%). The share of other modes of transport was very small. Economically developing countries were the fastest in increasing energy absorption in transport per capita. In turn, highly developed states recorded slight growth and were stable in this aspect. There was a close relationship between energy utilization in transport per capita and GDP per capita. The reduction of energy consumption in transport depends on changes in road haulage, e.g., the pace of introducing innovative energy-saving technologies in automotive transport.

1. Introduction

1.1. The Importance of Transport in Energy Consumption

The transport sector is one of the industries with the highest energy absorption in the world. In 2018, this form of business accounted for about 64% of global oil consumption and around 29% of total final energy absorption [1]. Both passenger and freight conveying exploit energy. As a rule, it is not possible to split energy consumption solely into any of these modes of transport [2]. Dingil et al. [3] found that a significant increase in transport energy intensity occurs in cities with a low population density. The main reason for the high energy absorption of transport in such municipalities was the high share of private means of transportation. Brownstone and Golob [4] achieved similar results. More fuel was used in sparsely populated areas. Schippl and Arnold [5] demonstrated that political measures that limit automotive car mobility would also be needed to achieve a full-scale transition towards multimodal urban mobility. Newman and Kenworthy [6] argued for an energy compromise in transport. In downtowns, energy efficiency was lower than in suburban areas. However, the total fuel depletion is smaller in these areas. The conclusions from the presented research are similar. Urbanization and patterns of settlement used in a given country have a significant impact on the energy efficiency of passenger conveyance.
Thus, the energy consumption of transport may be related to the economic situation and the mobility of the society. Enhanced energy absorption in transport is associated with increased total energy utilization in the economy [7,8,9,10,11]. Such relationships were found in the Banister and Stead studies. They showed that the strong relationship between economic activity and transport demand significantly increases energy consumption and, consequently, carbon dioxide emissions [12]. Thus, higher economic growth leads to increased energy utilization. Conversely, the use of large volumes of energy reflects high levels of economic growth. There is a great number of research confirming such relationships [13,14,15,16,17,18,19,20,21,22,23,24,25]. Ozturk and Acaravci [26] presented the feedback between energy absorption and economic growth in Hungary. Belloumi conducted similar research in Tunisia [27].
The increase in transport output causes an enhancement in energy consumption. Innovations are needed to reduce transport energy absorption and to reduce air pollution. For example, advances in vehicle technology can decrease the energy intensity of the transport sector and improve the energy efficiency of haulage activities. As a result, the positive importance of transport in global economic activity will increase. Solutions such as electric drive, hybrid plug-ins, and hydrogen are implemented to reduce energy consumption. Cars also use other innovative technologies that facilitate driving and reduce energy consumption [28,29,30,31,32,33,34]. Another way is to maximize the use of the load capacity of the means of transport for the movement of goods and the number of seats for the conveyance of people [35]. When transporting people in cities, no car traffic zones are introduced to force urbanites to use public transport [36,37,38,39,40].
Change in transport is heading towards ecological and economic balancing (sustainability) [41]. Thus, various forms of transportation are used. In general, there is a tendency towards intermodal transport to utilize the best properties of individual means of transport. Scientific research has focused mainly on energy efficiency in road transport [42,43,44]. Many studies also refer to the efficiency of urban transport, which uses various types of transport [45,46,47].

1.2. Selected Ways to Improve Energy Efficiency

Technological progress allows for benefits in terms of productivity and technology of energy utilization, which contribute to the reduction of greenhouse gas emissions. A move towards renewable energy production by emphasizing cleaner energy carriers (such as electricity and hydrogen) would improve urban air quality [48,49]. Efficient use of energy is a very attractive way of reducing the impact of energy on the environment and health. Achieving the same outcomes with less energy should theoretically reduce costs and emissions of local pollutants and greenhouse gases [50,51,52].
The improvement of global energy efficiency is indicated by the ratio of energy consumption to gross national income (GNI). Historically, total energy absorption per person has steadily increased. This was because the surged energy efficiency coexisted with economic growth, rising expectations, social changes and population growth. Therefore, people must reduce energy-related emissions of greenhouse gases and other pollutants [48,53,54,55].

1.3. Relationship between Sustainable Transport Development and Economic Growth

Many studies emphasize the two-way symbiosis between transport and economic growth, which influence each other through feedback. Transport is important to the development of a sustainable economy that aims to provide new services. Transport should enable the movement of goods and people, and at the same time, contribute to environmental protection and ensure safety [56,57,58,59,60]. Sustainable development requires an efficient and safe transport system powered by clean, low-emission, secure and inexpensive energy. Energy used in transport enables social and economic development. Therefore, energy policy in transport should result from the program of sustainable development of the economy [61,62,63].
The relationship between energy consumption by transport and pollutant emissions (mainly CO2 and other harmful compounds) is known. The environmental Kuznets curve is empirically tested in many countries and regions using various indicators of environmental degradation and many econometric techniques of cross-sectional and panel data. The Kuznets curve shows the relationship between GDP per capita and inverted U-measures of environmental degradation [64]. Industrialization increases the negative environmental influence of economic activity up to a point where the impact decreases with continued economic growth. Individual EU states differ in terms of economic development, which means that they may be at different stages of evolution. The environmental impact of these countries may also vary. Obtained results and relationships can be related to transport, which absorbs a lot of energy and emits many pollutants at the same time. Energy consumption was used as a variable in many studies [65,66,67,68,69,70,71,72,73,74,75,76]. Some researchers also negate the assumptions of the existence of the Kuznets curve. It all depends on the type of contamination [77,78,79,80]. As a result, in each state or group of countries, it is possible to obtain different outcomes confirming or negating the existence of the Kuznets curve. The results received will largely depend on the level of energy efficiency of the country and region. In general, in states with high GDP, the Kuznets curve was most often used. Examples are France [81,82], Canada [83], Spain [84] and the United States of America [85]. Patterns are also confirmed in countries with average GDP levels, such as Malaysia [86], China [87], Turkey [74], Romania [88], Tunisia [89] and Latin America and the Caribbean [90]. Many studies have confirmed that the use of fossil fuel energy increases air pollution. An example is the use of crude oil to power internal combustion engines [91,92,93].
It should also be mentioned that there is an interaction between economic growth, energy consumption and environmental quality. These relationships are the subject of energy economics research [94,95,96]. Environmental quality can generate positive or negative externalities. Consequently, it stimulates economic growth by focusing on human health, which is potentially affected by emissions. The link between energy variables, progress and environmental quality has been the subject of conflicting and paradoxical goals set by policymakers. This relationship is the basis for creating a sound economic policy consistent with its environmental and energy policy objectives. Empirical work on the tripartite causality link between energy, economic growth and the environment can be broken down into three lines of research. The first concerns the relationship between energy variables and economic growth. According to the assumptions, very good economic results require a high level of energy absorption, and effective energy utilization requires large economic growth [97,98,99,100,101,102,103,104].
The sustainable development of the transport sector can be divided into three main sections: society, economy and environment. The evolution of transport requires sustainability to achieve the minimum expectations in these three sectors. Increasing the role of transport in sustainable development is realized by promoting public transport, demand management, improved road management, pricing policy, improved vehicle technology, using clean fuels and transport planning [105,106]. From their current structure to one that is compatible with sustainable development, transforming global transport systems is likely to be a long-term process involving continuous changes in several physical, technological and institutional systems [107].

1.4. Justification, Aims and Structure of the Article

The subject matter of the article is important and up-to-date. Transport is a significant energy consumer. Many research papers are describing the relationship between energy absorption in transport and the parameters of the economy. A novelty is the application of multidimensional analysis using the Gradestat software. As a result, it was possible to investigate the situation in individual countries regarding energy consumption in transport and GDP (Gross domestic product). Data per capita were also calculated in the research, which enabled an accurate comparison of countries with different levels of economic development.
There is a research gap that this article can fill. The literature review shows no previous studies on the relationship between energy consumption and economic development. For instance, we found only one publication that reported the relationship between energy absorption in transport per capita and GDP per capita. In addition, our research will cover the area of the EU, which is still quite diverse. In addition, the quite rare method, the GCA algorithm (grid-based clustering algorithm), was used in the study. The above aspects make the research necessary and original.
The main goal of the article is to present the differences and changes in the volume of energy utilization by transport in the EU states. The specific objectives are:
  • Identifying the directions of changes and the degree of concentration in the volume of energy consumption in transport in EU countries;
  • Showing various models in the area of energy absorption in transport;
  • Determining the relationship between energy consumption by transport and the parameters of the economy and in the field of transport.
One research hypothesis was formulated in the paper:
Hypotheses: the rate of changes in energy absorption in transport per capita is closely related to the level of economic development of the country.
The organization of this paper is as follows: Section 1 provides an introduction to the subject. The importance of transport in energy consumption, ways of improving energy efficiency, the tripartite relationship between transport energy use, environmental pollution and economic growth are presented. This section also contains the justification and aims of the article. Section 2 proposes methods to identify differences and changes in the volume of energy absorbed by transport in the EU states. In Section 3, the research findings are presented. In Section 4, the reference is made to other research results that dealt with the relationships tested. Finally, Section 5 concludes this paper.

2. Materials and Methods

2.1. Data Collection, Processing and Limitations

All EU countries were selected for this research using the purposeful selection method as of 31 December 2018. In total, 28 EU states were examined. When presenting the results in tables and graphs, the abbreviations of country names were used. Acronyms of the country name were used in work in accordance with ISO 3166-1 alfa-2. They are as follows: Austria (AT), Belgium (BE), Bulgaria (BG), Cyprus (CY), Czechia (CZ), Germany (DE), Great Britain (GB), Denmark (DK), Estonia (EE), Spain (ES), Finland (FI), France (FR), Greece (GR), Croatia (HR), Hungary (HU), Ireland (IE), Italy (IT), Lithuania (LT), Luxembourg (LU), Latvia (LV), Malta (MT), Netherlands (NL), Poland (PO), Portugal (PT), Romania (RO), Sweden (SE), Slovenia (SI), Slovakia (SK).
The research period covered the years 2004–2018. This is because 2004 saw a significant expansion of the EU with 10 new states, and 2018 was the last year when complete research data were available.
The data used in the study come from Eurostat for the 15 years 2004–2018. To ensure the stability and transparency of the obtained results, this period was most often divided into 3-year sub-periods. Data collection is limited by the lack of detailed and timely information on energy in transport. Additionally, these data are aggregated at the country level, so there is a problem with performing analyses at the regional level.
Energy absorption was measured in the toe. The ton of oil equivalent (toe) is a unit of energy defined as the amount of energy released by burning 1 ton of crude oil. It is approximately 42 gigajoules or 11.630 megawatt-hours, although as different crude oils have different calorific values, the exact value is defined by convention [1].
The study is a result of the authors’ previous research on transport. Quite recently, the field of the writers’ interest has been power engineering. These two areas are closely connected because without energy, transport is impossible. The vast majority of authors are economists. Therefore, the aspect related to economics was raised. Additionally, it was noted that there are no current academic studies on the relationship between energy consumption in transport and economic development.

2.2. Applied Methods

The research was divided into stages. Figure 1 shows a diagram of the conducted research.
The first stage of the research shows the concentration of energy consumption in total and transport in individual EU states. The data concern 2018, the last year of the analyzed period. As a result, it was possible to compare the degree of concentration of energy absorption in total with energy intended for transport. All EU countries were examined. Furthermore, all 3-year periods in 2004–2018 were investigated. As a result, it was possible to notice the current trends in the EU in terms of total energy utilization and in transport.
In the second stage of the research, the structure of energy consumption in transport with the division into modes of transport was shown. The purpose of this section was to identify the importance of different modes of transport in the EU. Additionally, trends in individual modes of transport were presented.
The third stage of the research presents changes in GDP per capita in individual EU states. For data examination, the grading data analysis method was implemented as one of the multivariate data analysis techniques that can be used to graphically present the dynamics of phenomena or differences between objects in the form of overrepresentation maps.
The GCA algorithm (grid-based clustering algorithm) also allows creating groups, but it generates them in a way that allows creating, in this case, 3 objects that are characterized by the greatest possible differentiation among themselves. These clusters are formed as a result of combining objects that ensure such differentiation, and for this purpose, a certain independence index, Ro or Tau, is optimized [108].
There are many proposals in the literature for the construction of structure dissimilarity indicators. Distances are often used for this purpose, e.g., Minkowski metric [109].
d ( x , y ) = ( i = 1 n | x i y i | p ) ) 1 p
If we have two structures: x and y, where:
x i 0    i = 1 n x i = 1    y i 0    i = 1 n y i = 1
this measure certainly meets two conditions:
  • The distance between objects with the same structure is equal to “0”, that is: d(x,x) = 0.
  • The distance between the Y object and the X object is the same as between X and Y and is not less than “0”, that is: d(x,y) ≥ 0.
Λ n k > j > i 1 d ( x , x i j , ε ) d ( x , x i k , ε )
However, one can have some doubts as to the correctness of the fulfillment of the third condition by the dissimilarity index:
3.
The distance measure changes according to the “transfer sensitivity” adopted in the concentration indices. The increase in the value of the dissimilarity index at a constant transfer value is the greater the “richness” of the object to which the transfer was made.
x = ( x 1 , ,   x i , ,   x j , , x k , ,   x n )  
x i j , ε = ( x 1 , ,   x i ε , ,   x j + ε , , x k , ,   x n )  
x i k , ε = ( x 1 , ,   x i ε , ,   x j , , x k + ε , ,   x n )  
In the case of this study of energy consumption from transport, it is about shifting the value of energy absorption between years (the more years shifted, the greater the value of the dissimilarity index should be) because we are interested in which countries have experienced faster growth in energy consumption. The construction of the dissimilarity index of structures meeting condition three can then be based on the concentration index (Gini coefficient) and the Lorentz curve.
By analogy with the Lorentz curve, the dissimilarity of the Y structure to the X structure can be presented as a broken line connecting certain points, the coordinates of which in this case are successive cumulative structures, and the measure of the dissimilarity of the Y structure to the X structure also by analogy—this time with the Gini coefficient—is the measure “ar”.
a r ( y : x ) = a r ( C [ y : x ] ) = 1 2 0 1 C [ y : x ] ( t ) d t
where C [ y : x ] : [ 0 , 1 ] [ 0 , 1 ] belongs to the group of continuous functions.
By measuring the distances between structures (in the case of our study, e.g., dynamics of changes in the GDP per capita of the European Union countries) using the ar measure, we can spot subtleties to which Minkowski’s metric is insensitive. Visualization of the structures was made with the use of overrepresentation maps. Overrepresentation, in this case, is the ratio of the component structures (in this case, the structures for individual countries in periods) to the average value. Thus, as an average, we understand the ratio of the sum of the quantities, e.g., energy consumption in individual periods, to energy consumption in the entire period under examination for the entire EU.
After determining the average values, we can calculate the so-called “overrepresentation indicators”. The overrepresentation indicator shows how far the observed value differs from that which would be expected given the ideal proportionality of the distribution. For an ideal representation, the indicator will take the value 1. Those determined overrepresentation coefficients allow drawing the “map of overrepresentation” where, with appropriate values of the indicators, different shades of gray are encoded (the overrepresentation map for the proportional distribution would be uniformly gray without any shades). The map of overrepresentation is a square with sides equal to 1, wherein in this case, the rows are EU countries, and the columns are energy consumption in particular periods. Colors show overrepresentation (extreme black) or underrepresentation (extreme white). The map has rows and columns of varying heights and widths:
  • Height is determined by the percentage share of energy consumption value for each period to the amount of energy consumption for the entire period.
  • Width of the columns is the average energy consumption structures by EU countries in the interested period.
The concepts discussed: the concentration curve, the ar index and the overrepresentation map are closely related to the Grade Data Analysis (GDA). As part of the Grade Data Analysis, some quite complex operations are performed. The main issue in GDA is studying the diversity of rows and columns and striving to arrange them in the data matrix in such a way as to achieve the maximum contrast between the outermost rows and columns. This goal is implemented by the GCA (Grade Correspondence Analysis) algorithm. It rearranges the rows and columns of the data matrix to maximize a certain dependency ratio. In this case, only the rows are rearranged as the columns are in chronological order. This dependency index is the rho-Spearman or Kendall’s tau correlation coefficient and depends mainly on the dissimilarity index ar. Based on these indicators, clusters are built in such a way as to maximize the differentiation between them. In contrast, the differentiation between two clusters is understood as the differentiation between two objects formed from these groups as the sum of the objects included in them.
The number of clusters, in this case, depends on the number of observations (there are only 28). Therefore, it is a subjective choice of the authors.
The third stage of the research also shows the relationship between energy consumption and GDP in individual EU countries. The aim was to determine whether such a correlation exists and whether it concerns all EU states or a group of countries. Looking for a linear relationship between two rankings, it was decided to perform a procedure that allowed to reconcile the classic approach of the Spearman rank correlation coefficient rs with Pearson’s linear correlation coefficient r [110,111].
Descriptive, tabular and graphic methods were also used to present some of the findings.

3. Results

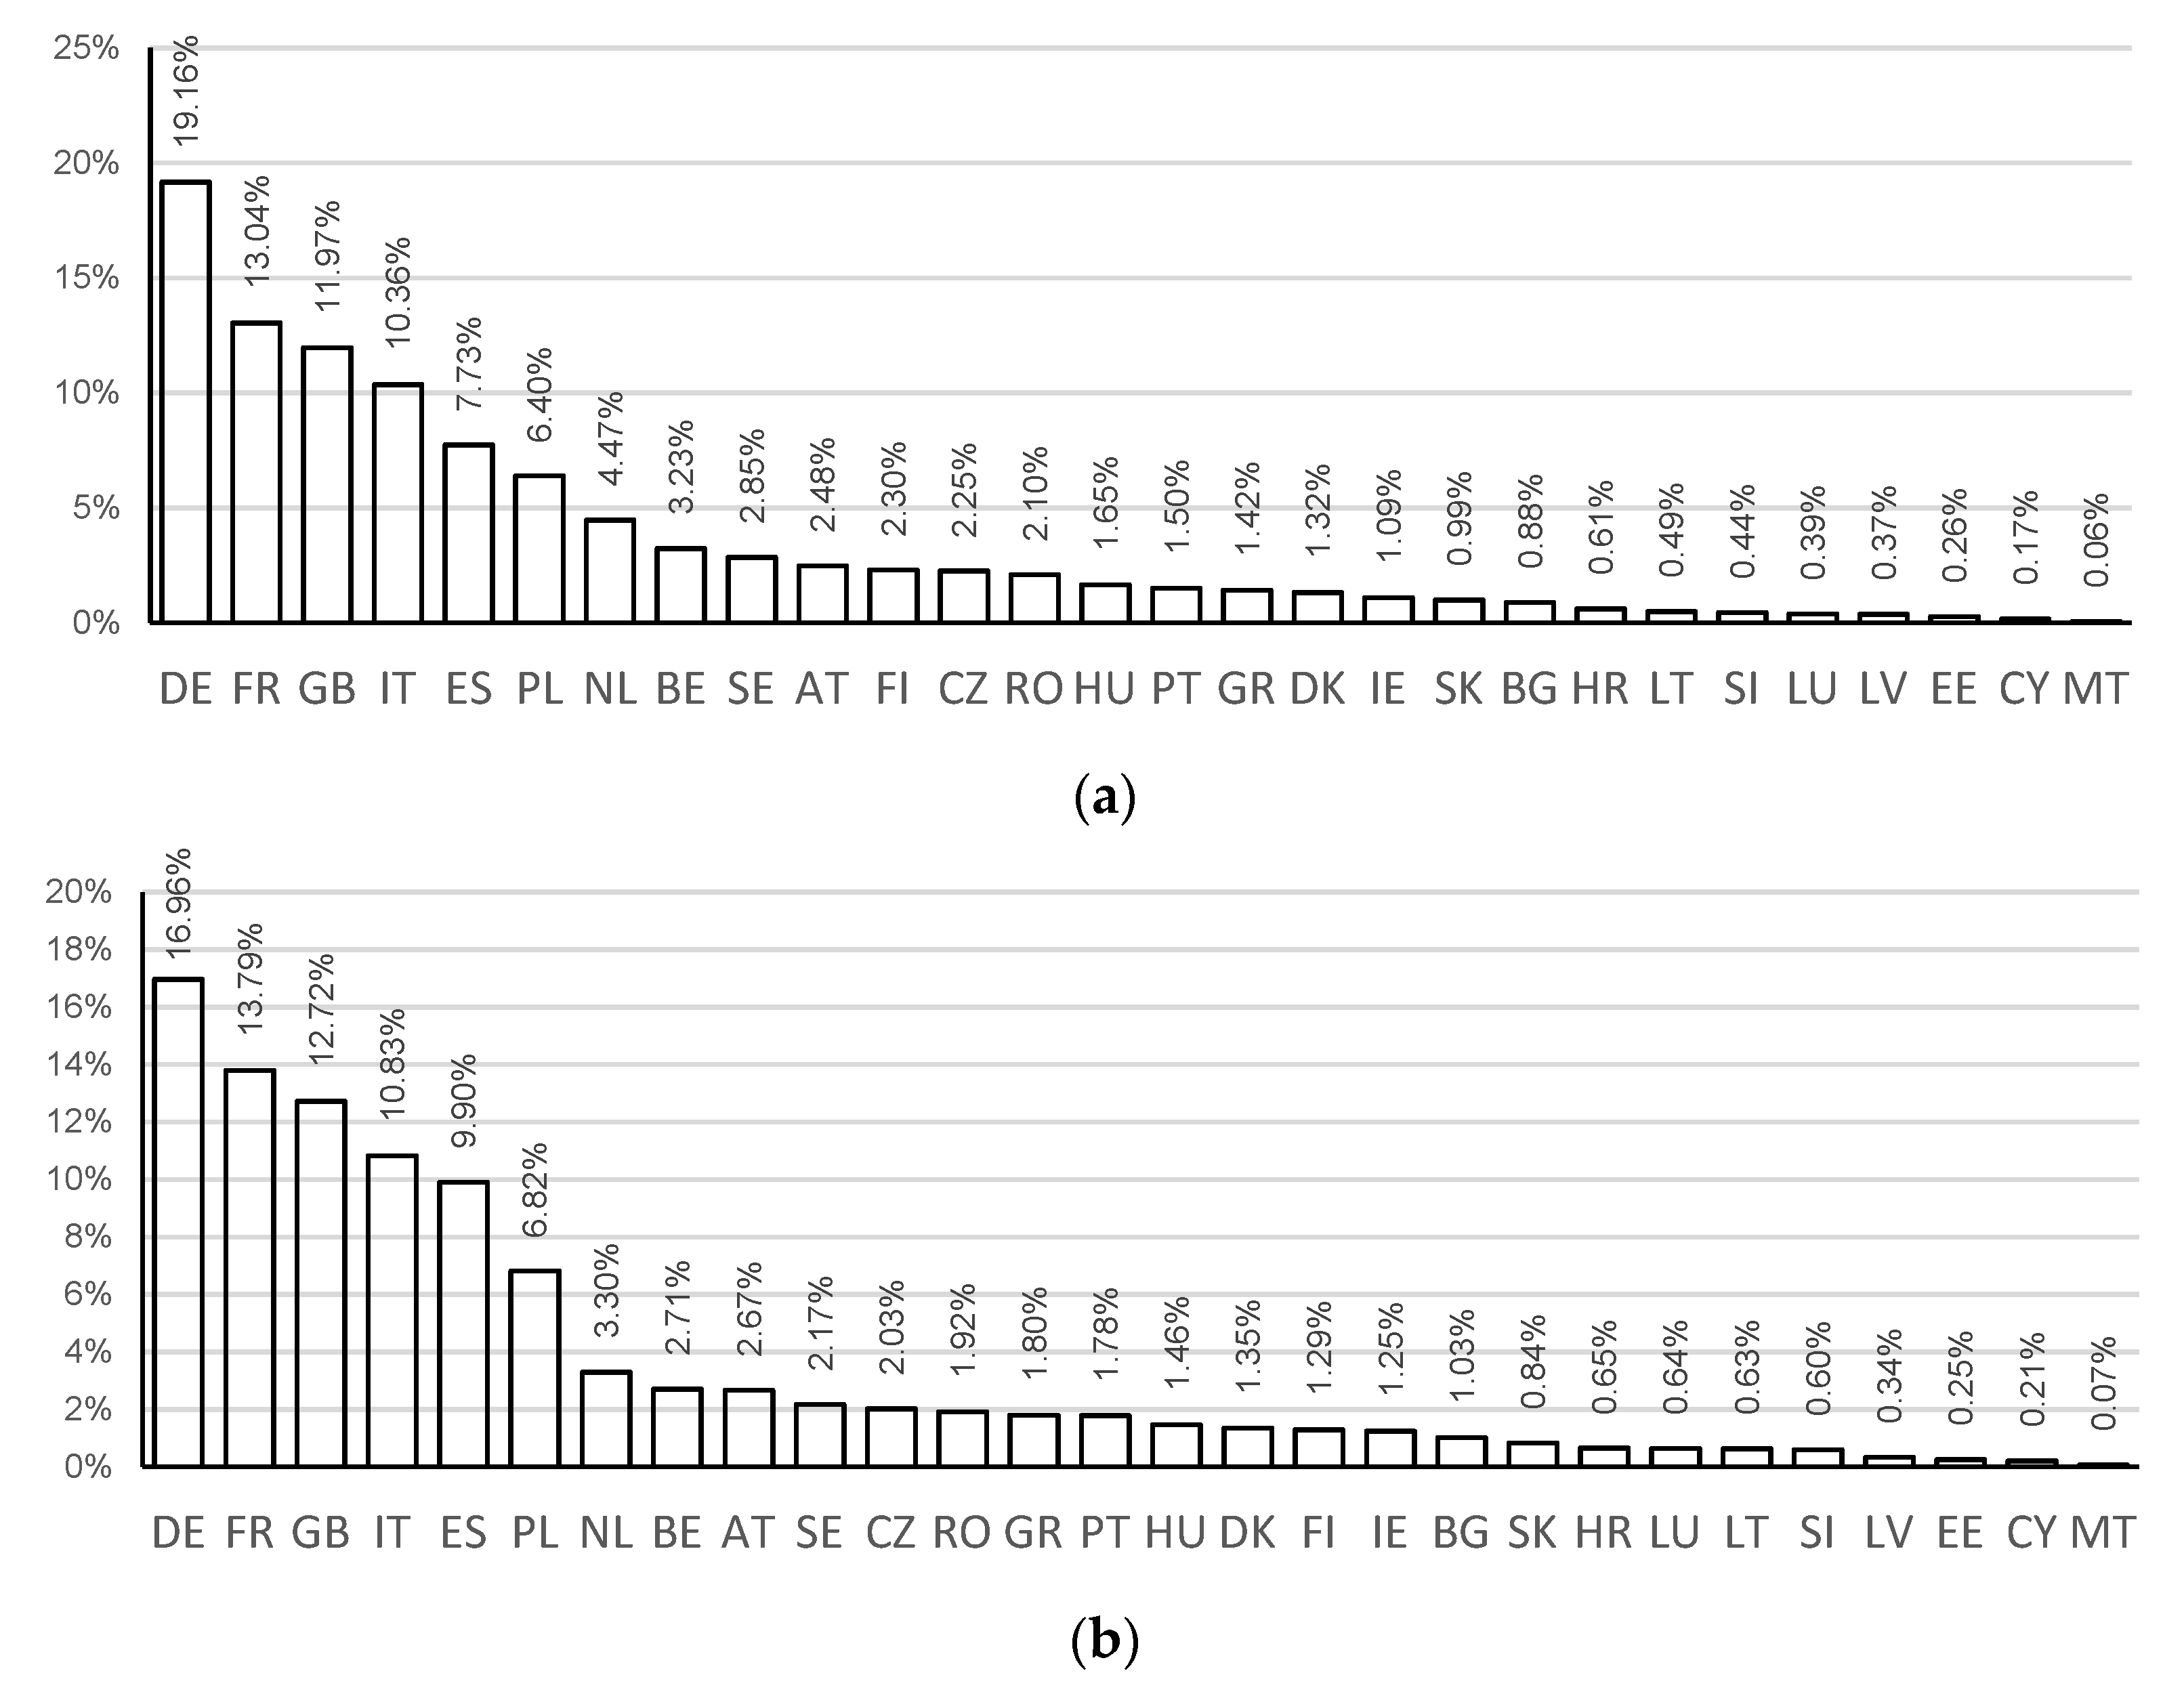
3.1. Energy Consumption in the EU Countries

As an introduction to the study, it seems reasonable to define energy consumption in EU countries compared to the entire EU. For this purpose 2018, was taken into account. It should come as no surprise that the EU states in terms of energy absorption in the analyzed period were dominated by the countries with the largest population, i.e., Germany, France, Great Britain and Italy, which together consumed more than 50% of energy for the entire EU (Figure 2a). Figure 2a shows the share of individual countries in energy consumption compared to the EU as a whole for 2018.
Bearing in mind that in the scale of the entire EU, approx. 30% of energy consumption resulted from transport, Figure 2b, which, in this case, is a certain supplement to the list in Figure 2a. On the EU scale, in terms of energy absorption for transport, countries with the highest energy utilization are very similar. A total of 30% of the share of transport in energy consumption applies to the entire EU. However, the share of energy used in transport varied across states. Figure 3 shows the countries (where 2018 was included for the sake of comparability with Figure 2a), where the absorption of energy from transport to the total energy consumption was relatively the highest.
With this approach to the problem, among the states from Figure 3, there is no leader in the ranking with the highest energy consumption in the EU. For example, Germany had a lower share of energy utilization in transport than the total EU average. Only Spain was included in the list of large countries. On the other hand, the energy absorption due to transport was significantly higher in Luxemburg and Slovenia than in the EU. For the sake of completeness, it can be added (which is not shown in Figure 3) that for 2018 the lowest percentage share in energy utilization from transport was in Sweden, the Netherlands and Finland.
Energy consumption in the EU in 2004–2018 was characterized by a rather downward trend (Figure 4a). Considering the 3-year periods, the lowest level of energy absorption in the EU states occurred in 2013–2015. This significant decrease was due to the improvement in energy efficiency. Only in the years 2016–2018 was there an increase in energy utilization by 2.53% compared to the previous 3 annums. In 2016–2018, the economic situation was exceptionally favorable. However, this consumption was still 6.24% lower than in the years 2004–2006. Transport energy absorption has undergone slightly different changes to total energy consumption. The transport sector had made little use of renewable energy sources. It was also less prone to efficiency gains. The transport sector was also closely related to the economic situation in the country. Therefore, these changes were quickly visible in the trend of demand for transport and, consequently, in demand for energy in transport.

3.2. Structure and Trends of Energy Consumption in Transport in the EU Countries

The next stage presents the results concerning the structure and trends of energy consumption in transport. There was no relatively regular direction in the energy absorption of transportation in the EU countries. Considering the Eurostat nomenclature, the following sectors are distinguished within the energy consumption in the transport sector: rail transport, road transport, domestic aviation, domestic navigation, pipeline shipping and not elsewhere specified. In the EU states, different modes of transport have varying levels of energy intensity. Sometimes these differences were significant.
The largest share in energy consumption due to transport was recorded in road transport, which accounted for over 90% of the total energy utilization in the whole transport sector (Figure 5). For example, the list of individual components in the transport sector 2018 is presented. The results were similar in previous years. This means that the structure of energy absorption in transport within the EU is stabilized. Obviously, from the point of view of sustainable transport development, a large share of energy consumption in road transport is disadvantageous.
To find the relationship between the dynamics of changes related to energy absorption due to transport and the dynamics of changes in economic indicators, it was first decided to compare trends in the value of gross added value in current prices in one million euro gross for individual modes of transport and gross domestic product current prices, euro per capita in 2004–2018 (Figure 6).
It is easy to notice that the trends of changes in transportation and storage, land conveyance and pipelines shipping and GDP are practically identical. Due to this and the fact that energy consumption in road transport accounted for more than 90% of the total energy utilization in the transport sector, it can be concluded that the other industries are of minor importance in the total energy consumption in transport.

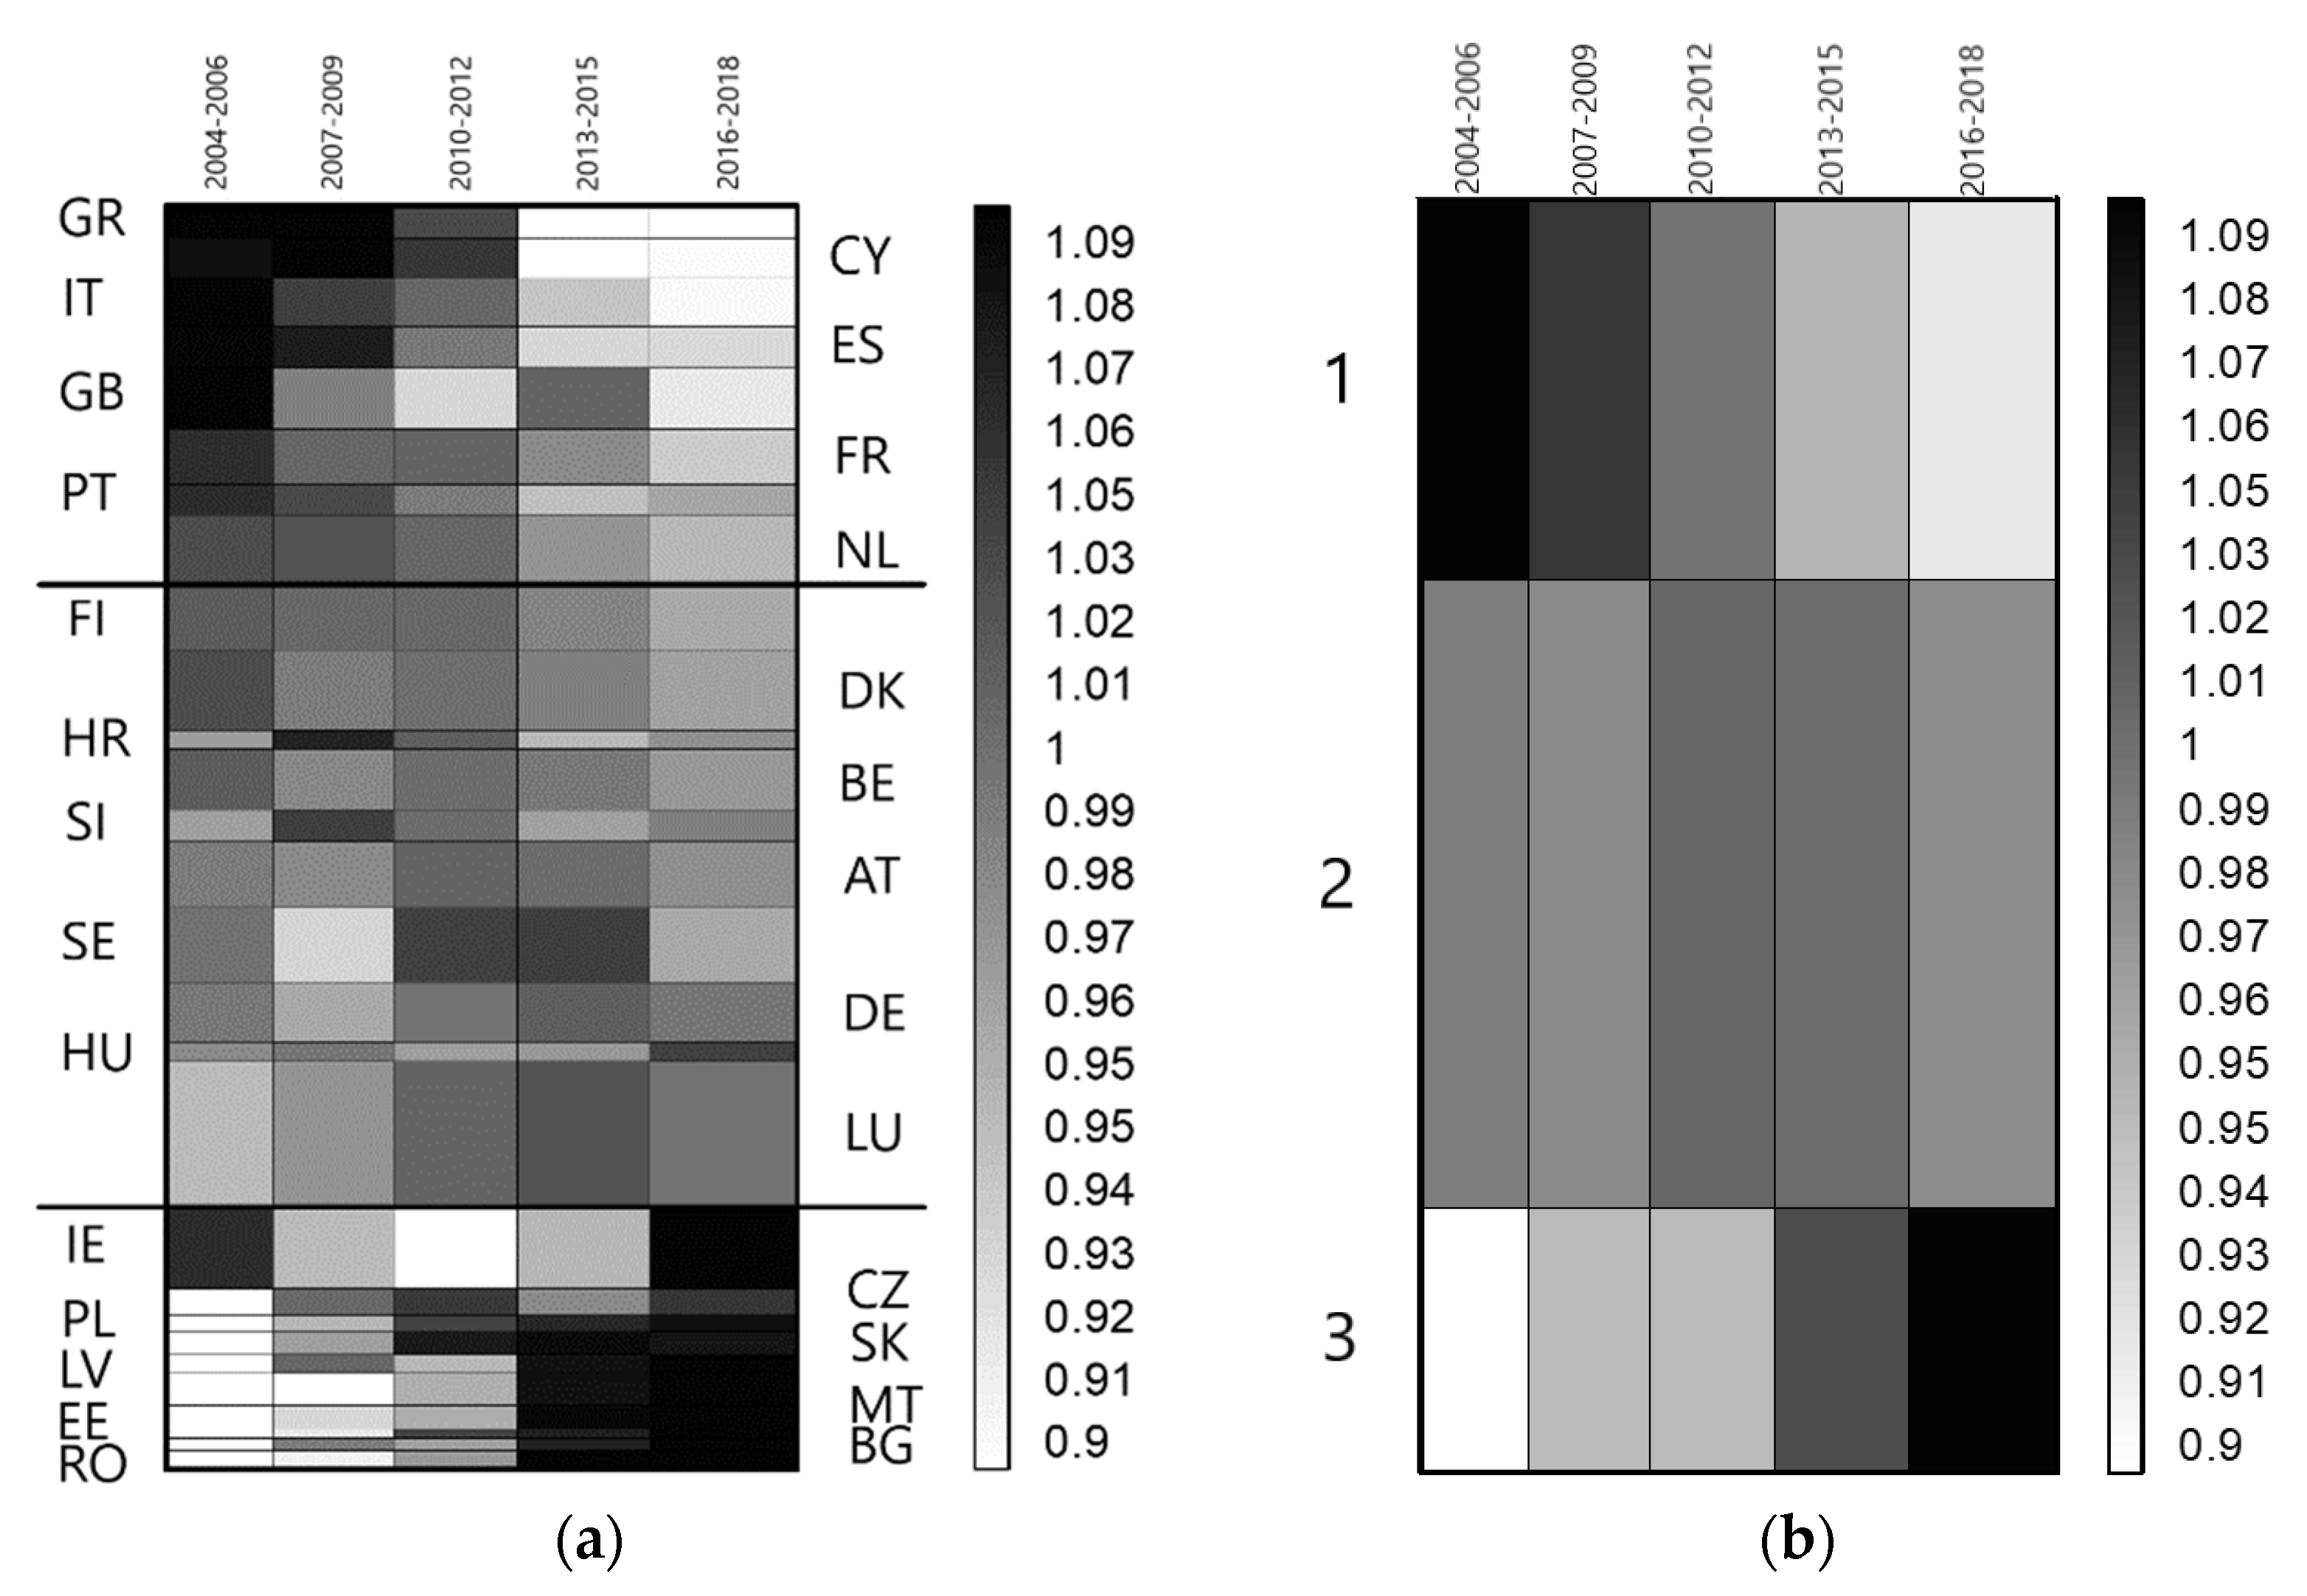
3.3. The Level and Changes in GDP per Capita in the EU Countries

The next stage presents the differentiation between EU countries in terms of GDP per capita. Comparing the direction of changes in energy consumption due to transport with the dynamics of alterations in GDP per capita, it is worth noting that GDP per capita shows large differences depending on the EU country, as shown in Figure 7, which compares GDP with the average for the EU in general. All the disproportions in this comparison are too visible. Luxembourg is particularly distinct from the EU average, exceeding it more than twice. Most countries had a lower level of GDP per capita than the EU average. This group included all Central and Eastern European countries that joined the EU in 2004 and in subsequent years. Thus, there were large disparities between the EU countries. It is a background to define the dynamics of his trend.
The dynamics of GDP per capita changes against the background of the entire EU can be presented using the so-called overrepresentation maps. Figure 8a shows the dynamics of GDP per capita in an orderly manner. The countries were divided into three groups. First, declining dynamics were found in highly developed countries, such as Spain, Italy, Great Britain and France. Then, in turn, the third group includes the fastest developing countries. First of all, these are the countries of Central and Eastern Europe that develop rapidly because they want to move closer to the level of development of Western European states.
Based on scores, it is possible to rank states depending on the strength of the growth dynamics, in this case—GDP per capita compared to the EU. The countries with the corresponding scores and their group members are presented in Table 1. The economically developed states of Western Europe were in the cluster with the lowest GDP growth per capita. The group with the average dynamics included both economically developed and developing countries. This group included Germany, but also Hungary and Slovenia. The bunch of countries with the highest growth of GDP per capita mainly included Central and Eastern European states that joined the EU in 2004 and later. The only exceptions were Malta and Ireland. Such a division into clusters is not surprising. Economically developing countries need to catch up with the differences that separate them from highly developed countries. Such a situation is beneficial for the entire EU, as it leads to more minor differences in the economic development of individual countries. As a result, the area of the EU may be more cohesive in the coming years.

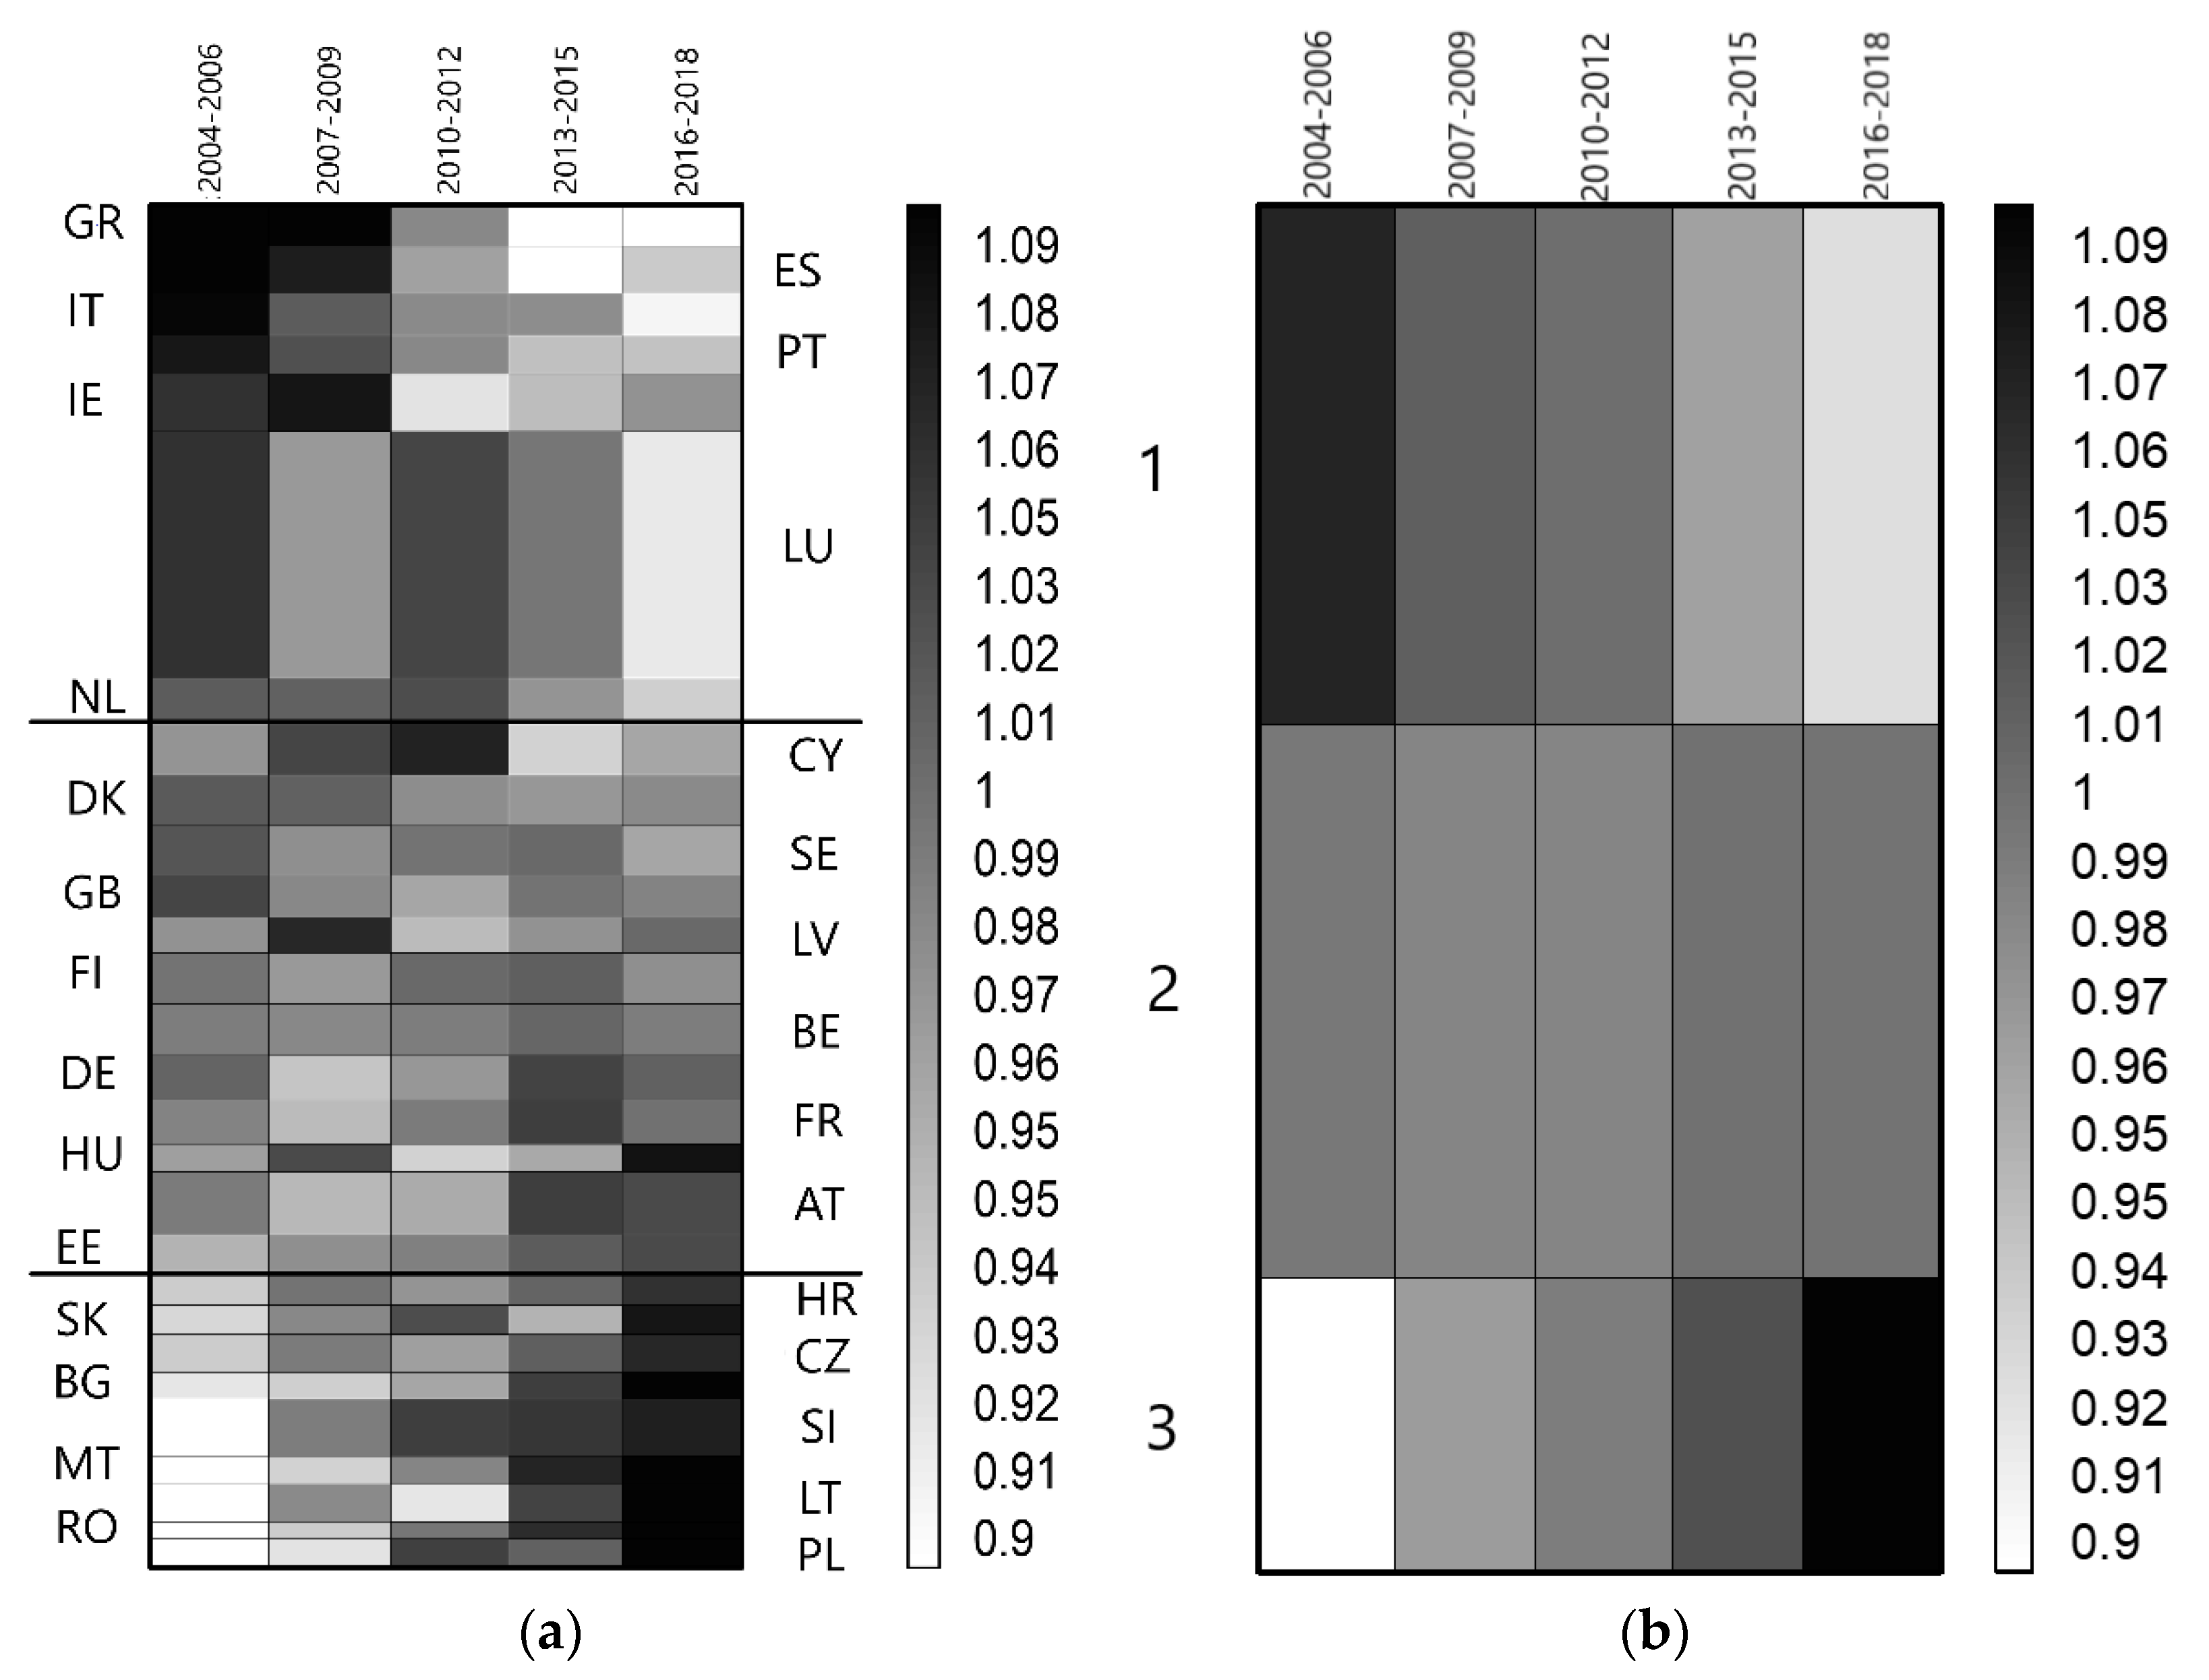
3.4. The Level and Changes in Energy Consumption by Transport per Capita in the EU Countries

The same operation on the overrepresentation maps as in the case of GDP per capita was repeated for the data on energy consumption in transport. Additionally, to ensure the comparability of the results with GDP per capita, the data on energy absorption from transport in kToe were converted per capita. In this approach, we remove the number of people in countries on energy consumption.
The map clearly shows the width of the row for Luxemburg, which means the highest energy utilization from transport per capita in this country (Figure 9a), and this result is greater than for the other states. The dynamics of changes for this country are not homogenous, but the trend is decreasing compared to the rest of the European states. On the opposite side is Romania, which belongs to the countries with the lowest energy absorption from transport per capita, and its direction of the trend is increasing. The majority of EU states have a moderate value of energy consumption from this industry per capita.
The first group, broken down by the GCA algorithm, consists of countries with lower energy absorption in transport than the average value of consumption in the EU countries. There are countries with stronger dynamics of changes in the third group than the average rate for the EU (Table 2). Developing states such as Romania, Slovakia and Poland are among the countries where more energy is utilized due to transport than the EU average.
The split carried out is mainly similar to that made in the case of GDP per capita. Highly developed states introduce technological innovations in transport to a greater extent. Of course, the energy efficiency of means of transport changes relatively slowly. Nevertheless, there is a clear advantage of these states over economically developing countries. On the other hand, in developing economies, higher energy consumption in transport is due to greater economic growth. Growing production and absorption in these societies must be handled by transport. These economies do not introduce technological innovations in transport on a large scale. An additional factor may be the expansion of the road network in economically developing countries. Huge funds from the EU have been allocated for this purpose. Another reason could be the rapid increase in the number of vehicles in Eastern European states. The increased wealth of the society and better roads resulted in greater availability of private cars. Transport companies from Eastern EU successfully competed with enterprises from Western Europe. An example is Poland, which dominated this market. Polish organizations performed about 30% of international road transport.

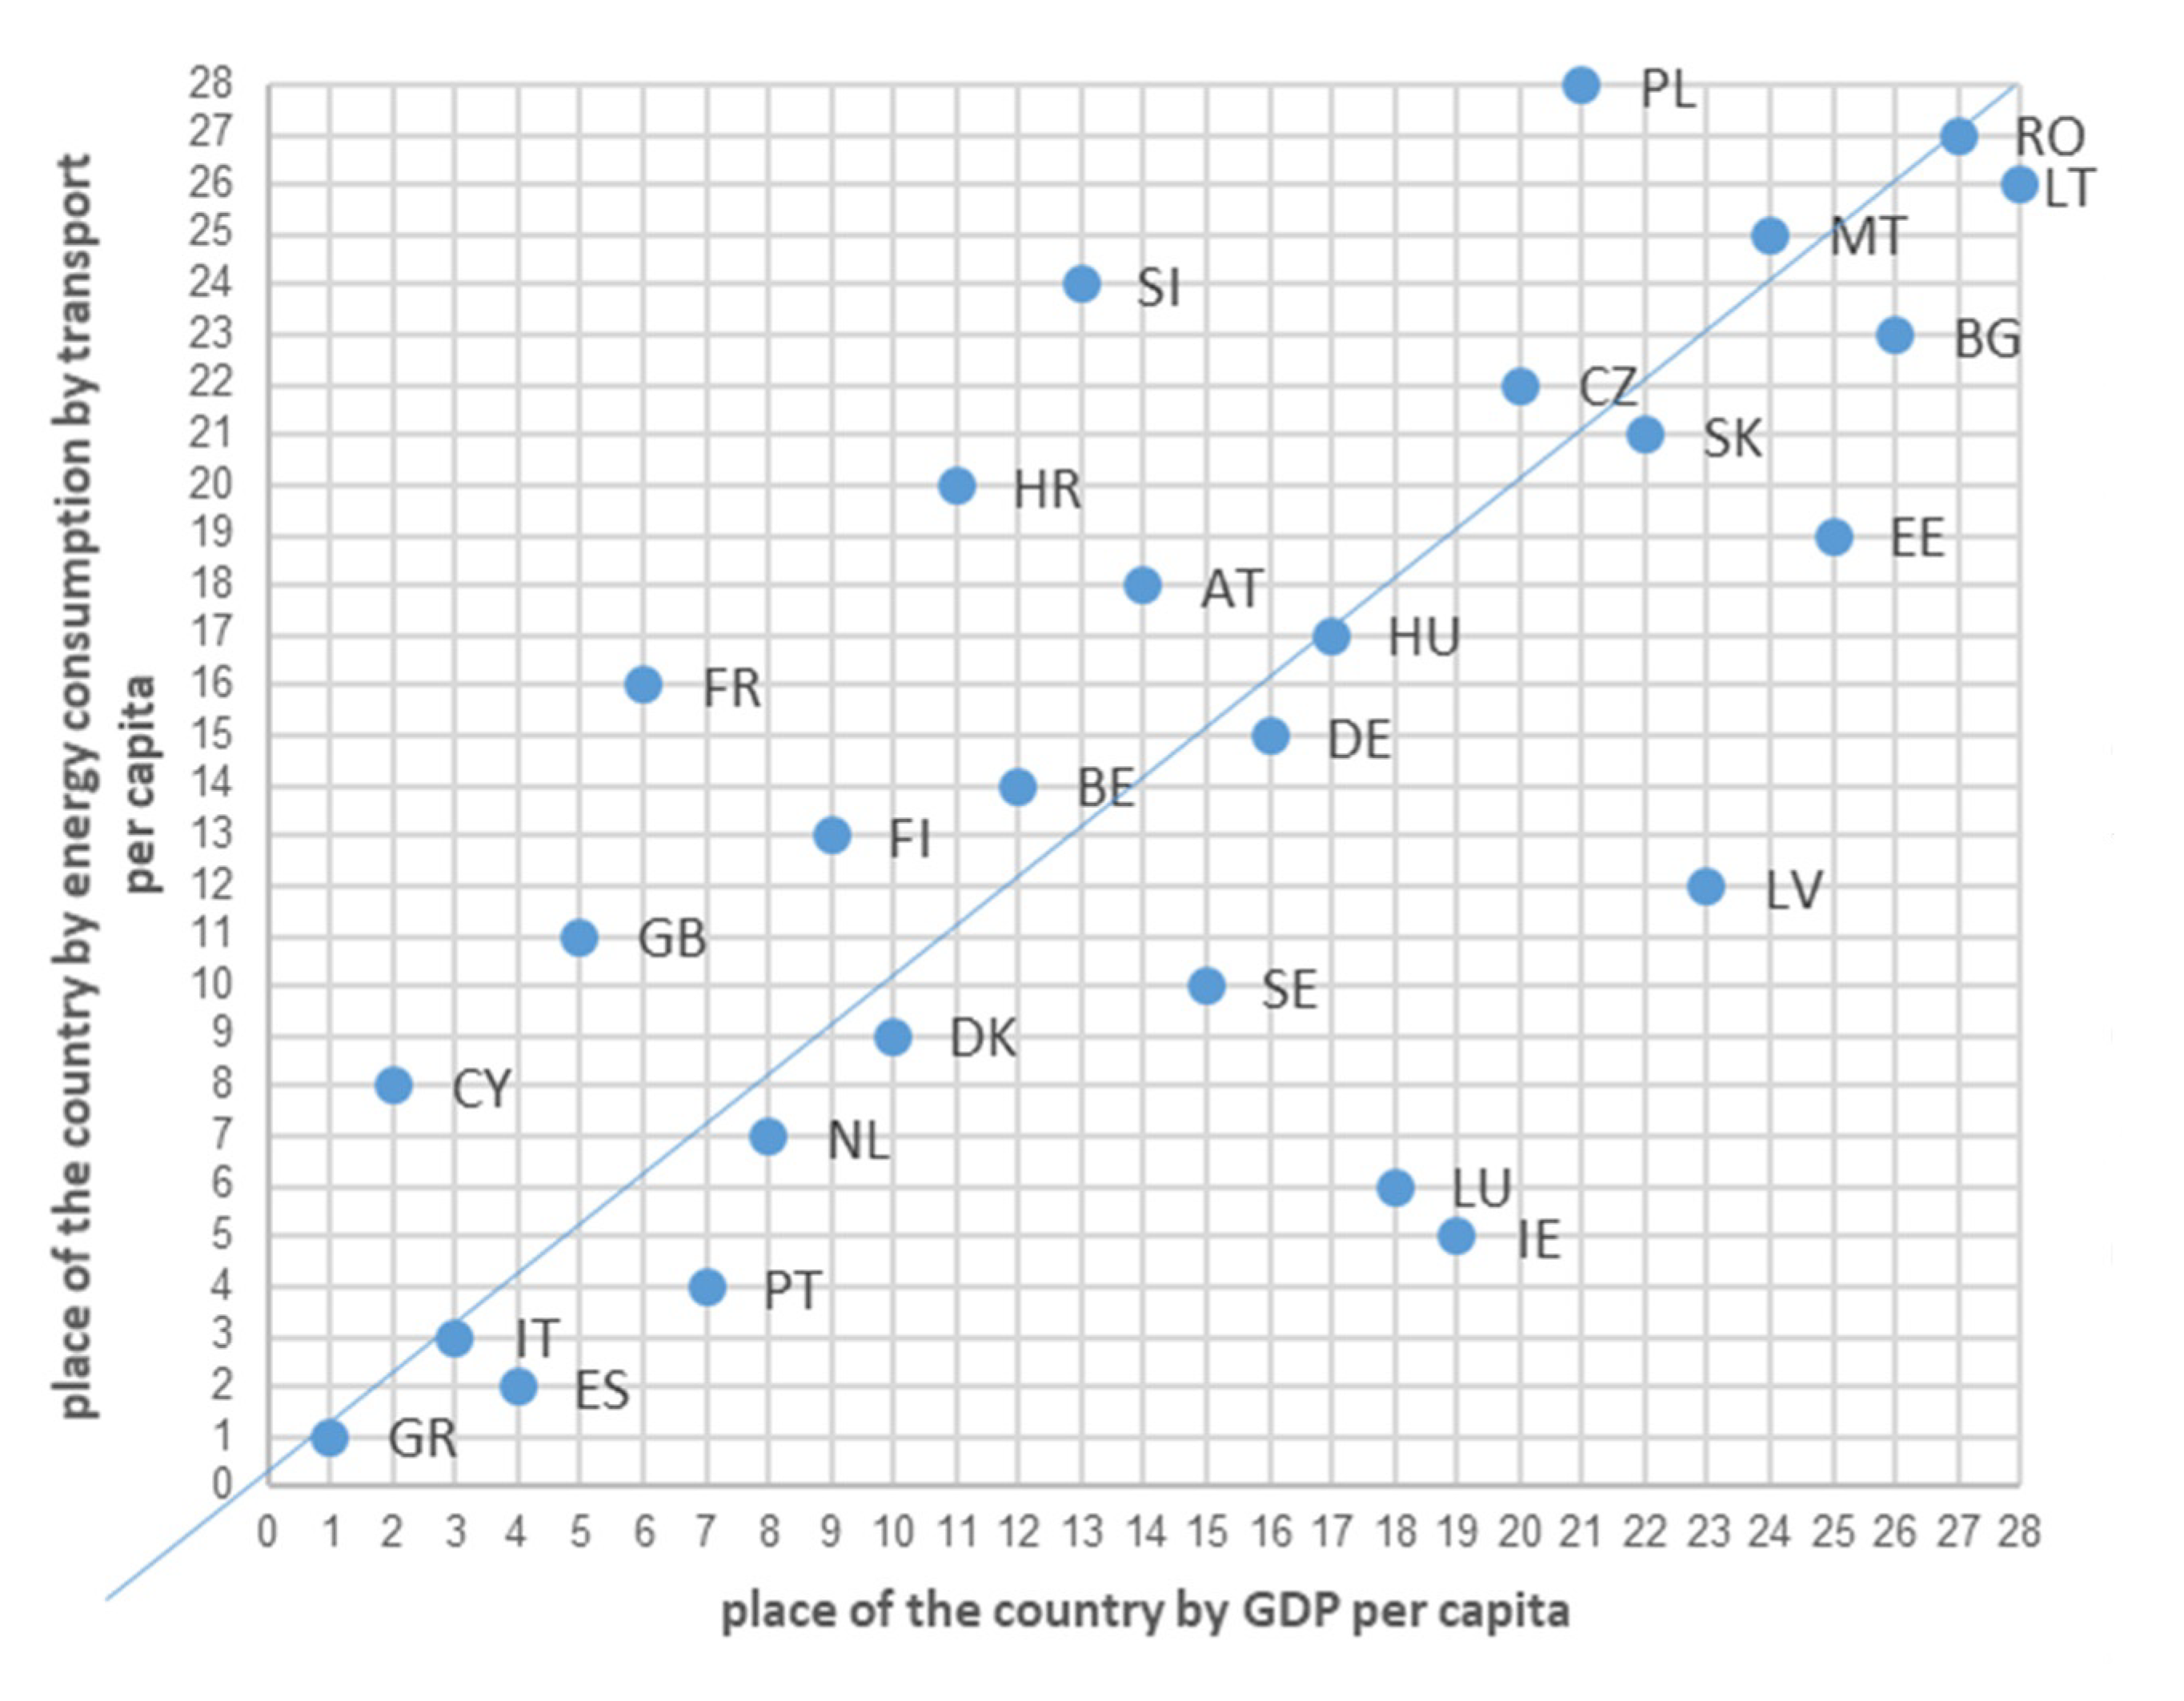
3.5. Relationships between Energy Consumption by Transport and GDP per Capita in EU Countries

The next stage presents the relationship between energy consumption by transport and economic growth. Based on two rankings of dynamics of changes in GDP and energy absorption in transport, the rank correlation coefficient was calculated (rs = 0.7219). The high dependence can be easily observed in Figure 10.
On the vertical axis, positions from the ranking of alterations in energy consumption from transport per capita are marked (by the maps in Figure 9a). On the horizontal axis, positions are taken in the ranking of changes in GDP per capita. Most of the points representing the positions for States are located close to the diagonal of the square, which reflects the perfect agreement of both rankings. Nevertheless, there are quite significant and clear exceptions to this rule. This applies to Luxembourg, which, despite the GDP per capita growth in line with the pace of changes in the EU, clearly shows a slower pace of changes in energy absorption in transport per capita than the EU average. The situation is similar in Ireland (IE) and less clear but visible in Latvia (LV). It can be considered that these are cases of positive actions compared to the entire EU. Countries for which the points in Figure 9 are above the diagonal of the square and are significantly distant from it are the opposite. These include Slovenia (SI), France (FR) and Croatia (HR). Here, the increase in energy consumption from transport per capita to the GDP per capita growth rate is disproportionately higher than in the EU states. Immediately after these countries is Poland (PL), which also turned out to be the state with the highest growth rate of energy absorption in this sector in the entire EU.
Despite these cases, which can be considered outliers, attention should be paid to the very high value of Spearman’s rank correlation coefficient. If the data for the countries with the greatest discrepancies in terms of places in both rankings, i.e., Luxemburg (LU) and Ireland (IE), were removed, the value of this coefficient would increase to the level of rs = 0.8114. The results confirm a high correlation in most countries between GDP per capita growth rate and the rate of energy consumption in transport per capita.

4. Discussion

According to Ibrahiem [112], energy consumption by road transport determines economic growth both in the short and long term. In contrast, economic growth causes energy absorption of road conveyance in the short term. Thus, there are feedbacks. Ibrahiem conducted his research on the example of Egypt in the years 1980–2011. Nasreen et al. [28] examined the relationship between economic growth, freight shipping and energy consumption for 63 developing countries for 1990–2016. Country panel analysis was used. Countries were divided into three sub-panels, namely middle–low income countries, medium–high-income countries and high-income states. The findings showed a two-way causal relationship between economic growth and freight transport for all selected panels and between economic growth and energy absorption for high-income and medium-high income panels. For the lower–middle-income panel, causation was one way, from energy consumption to economic growth. Additionally, the results indicate that the relationship between freight conveyance and energy consumption was bidirectional for high-income countries and one-way from freight to energy consumption for higher-middle-income and lower-middle-income countries. We obtained similar findings in our research. Economically developing states in the EU tended to proportionally absorb more energy (see Figure 10).
Liddle and Lung [113] conducted panel studies on 107 countries covering the years 1971–2009. They found that transport has been an important energy aggregation as transport energy consumption has increased in highly developed and developing countries. They distinguished between three balanced income-based panels, i.e., 40 high-income countries, 39 middle-income states and 28 low-income countries. Energy absorption in transport per capita was the dependent variable, and GDP per capita was an independent variable. The share of countries with significant positive correlations ranged from three-quarters (for high- and low-income panels) to two-thirds (for middle-income panels). However, there was no unanimity. Our research also showed a high correlation between GDP per capita growth rate and the trend of energy consumption in transport per capita. After removing a few outliers, the rs correlation coefficient was 0.8114.
Achour and Belloumi [114] explored the causal relationships between transport infrastructure (rail and road), transport value added, gross accumulation and energy intensity of transport in Tunisia in 1971–2012. A one-way relationship between energy consumption in transport and economic growth was found. Infrastructure and population density had a significant impact on the energy consumption of transport. Achour and Belloumi [115] conducted another study on Tunisia’s example in 1985–2014. They found that energy intensity played the dominant role in decreasing energy absorption during the study period. Improving the transport intensity exerts a significant effect on saving energy. These studies are interesting and justify why energy utilization grows proportionally slower in the most economically developed countries than in developing countries. We found such patterns in our research.
Rehermann and Pablo-Romero [116] analyzed how the GDP per capita affects transport energy consumption, testing possible nonlinear relationships between variables. The research concerned 22 Latin American and Caribbean countries in 1990–2014. It was found that the elasticity values of transport energy absorption, with respect to GDP per capita, do not show a tendency to decrease in the long term. Saidi et al. [117] explored the impact of transport energy consumption and transport infrastructure on economic growth by utilizing panel data on MENA countries (the Middle East and North Africa region) for 2000–2016. The research confirmed that the causal relationship between energy absorption in transport and economic growth was heterogeneous. There was different flexibility depending on the level of development of the country. Our analysis also showed that the level of economic growth affects the rate of energy consumption in transport. We have demonstrated it in the example of the EU. As demonstrated by the literature review in other countries and regions, these regularities are similar to our research.
Belke et al. [118] analyzed the long-term relationship between energy consumption and real GDP, including energy prices, in 25 OECD countries in 1981–2007. Energy absorption and economic growth are cross-sectionally correlated. The reason is regional and macroeconomic links, which are manifested through common global economic crises, mutual commercial and financial institutions and local externalities between countries or regions. There is also a division into blocs of states in the EU. One is formed by the economically developed countries of Western Europe, and the other by the developing state of the Eastern EU. Different groups of countries react differently to crises and changes, including in terms of energy consumption. In our research, such divisions were visible.
Gherghina et al. [119] examined the nexus between the main forms of transport, related investments, specific air pollutants and sustainable economic growth. The research concerned the EU countries in 1990–2016. They found that it is important to invest in modern transport infrastructure that facilitates the use of more energy-efficient methods and alternative solutions that positively impact the economy while minimizing negative externalities. This study covered the EU area. Based on our research, it can also be concluded that the key is the use of more energy-efficient methods and alternative technologies in transport. Then, energy consumption in transport will increase less than proportionally to GDP growth.

5. Conclusions and Recommendations

5.1. Conclusions

The conducted research allows for a few generalizations.
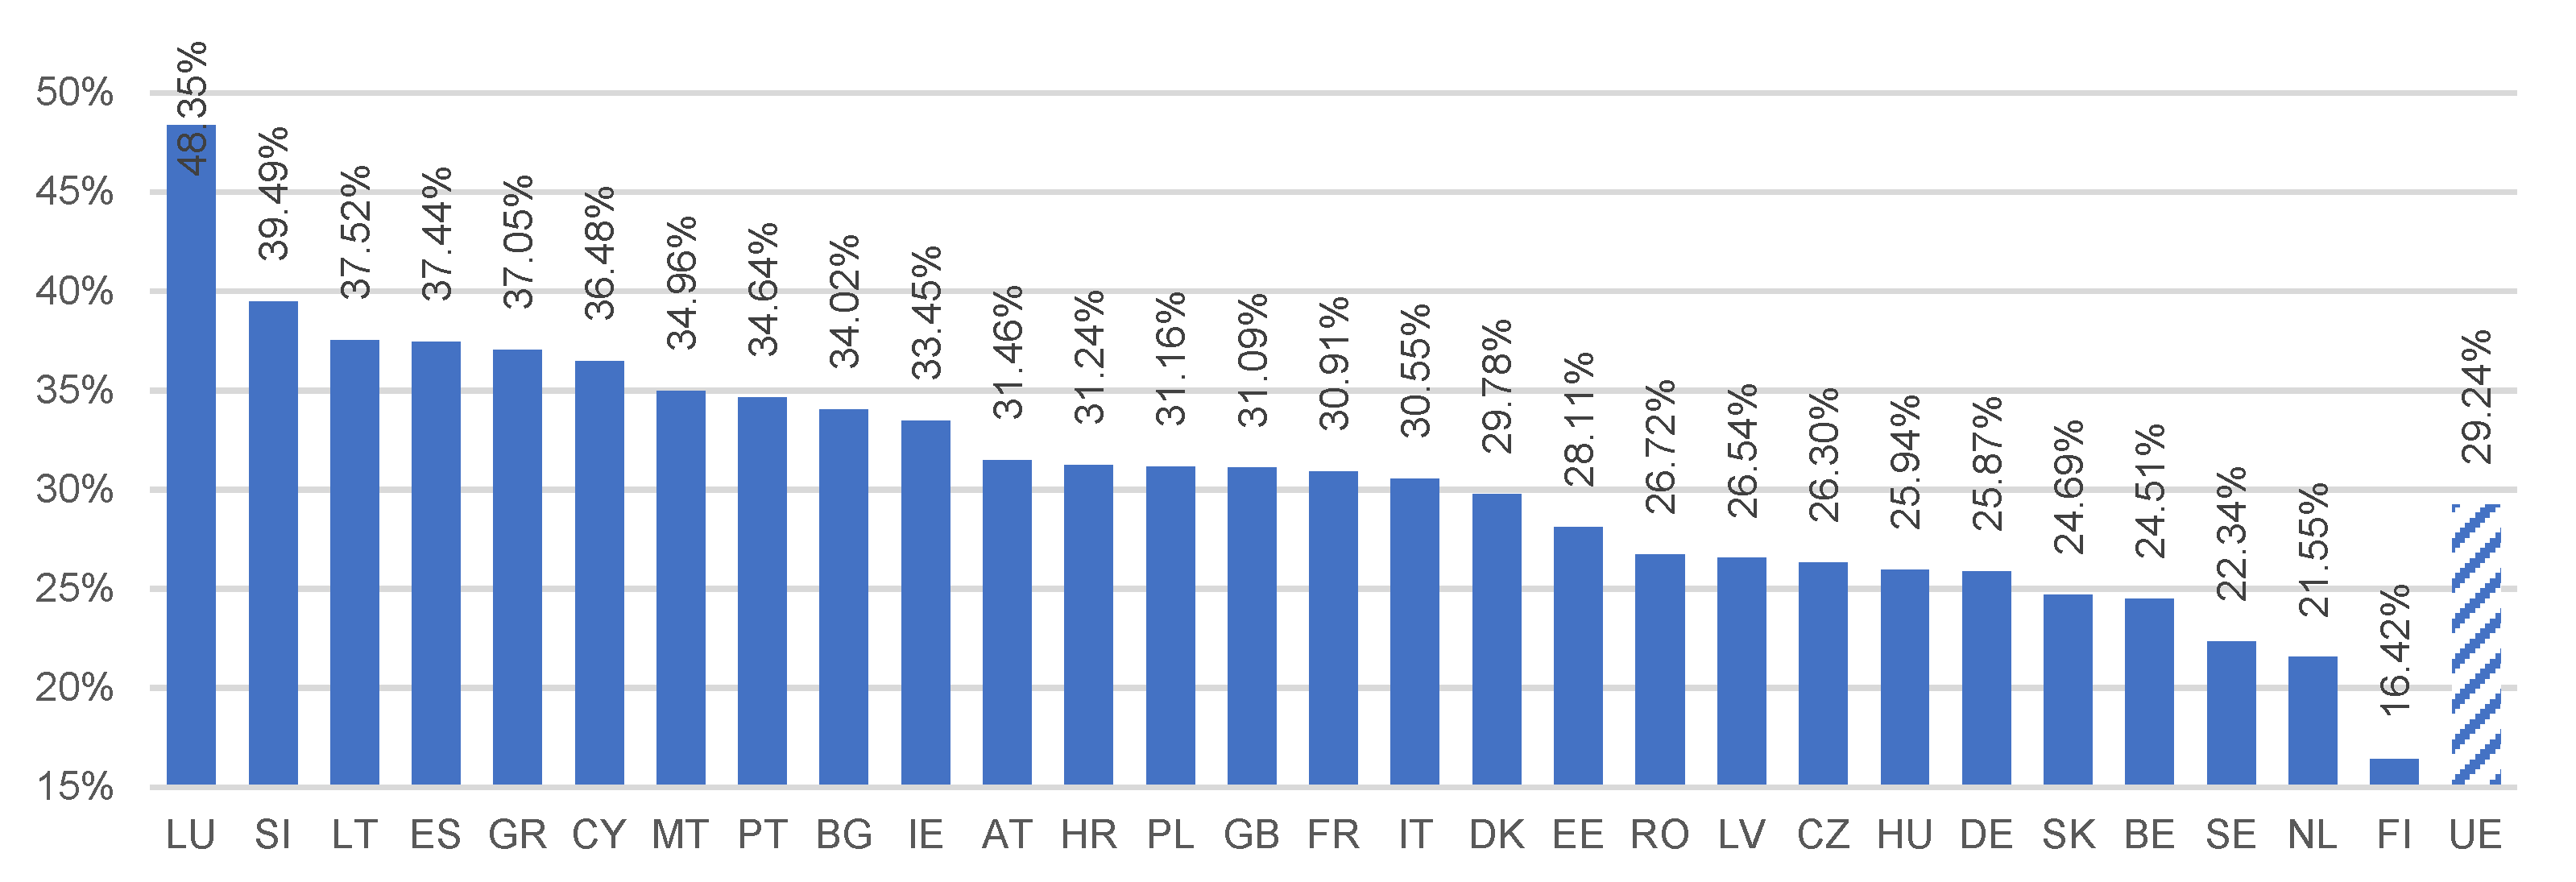
  • Total energy absorption in transport was more significant in the states with the greatest area and the highest population. Conversely, in the smallest countries, energy from transport had the largest share in total energy consumption.
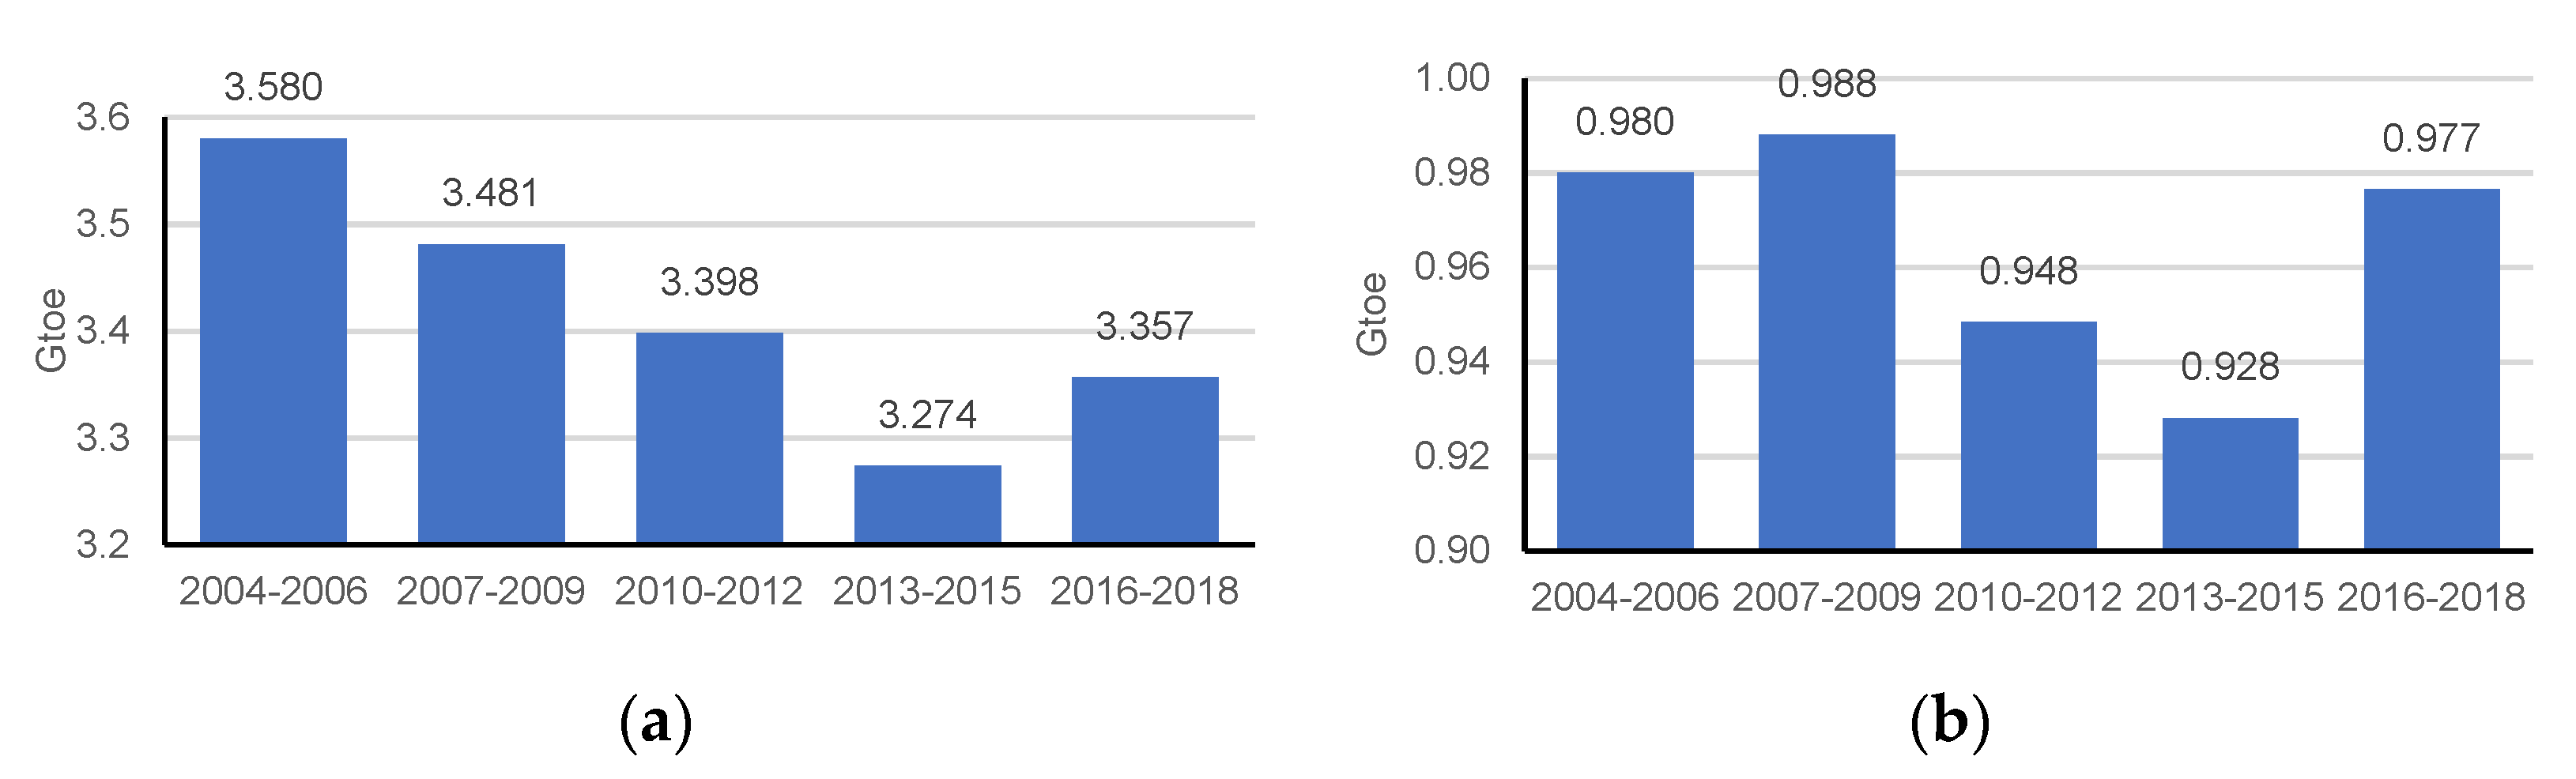
  • There is a general tendency to reduce the total absorption of transport energy. This was due to the introduction of energy-saving technologies.
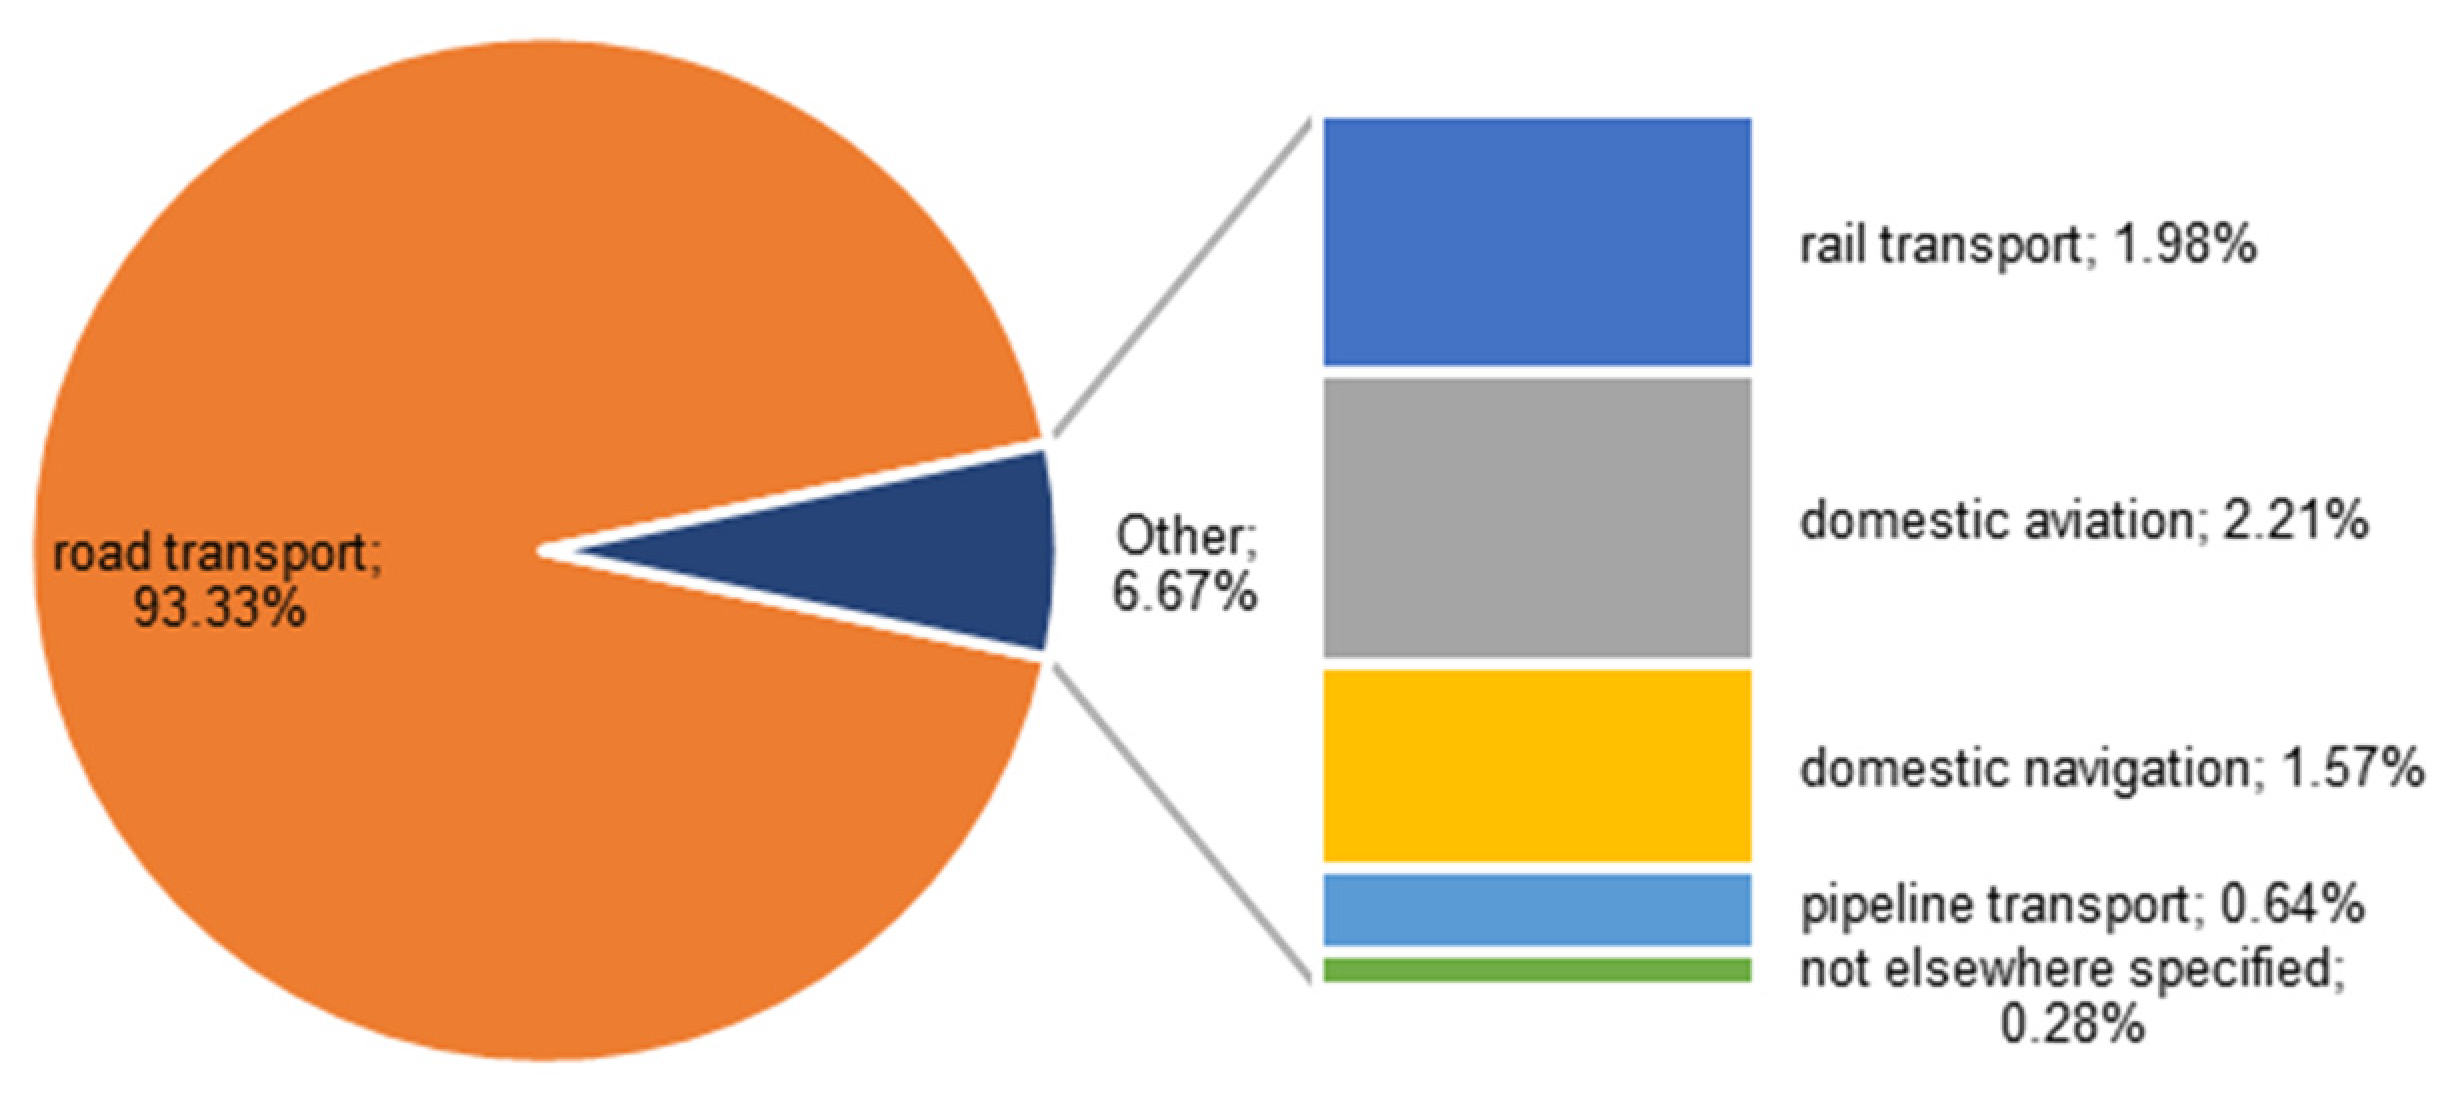
  • The transport structure in the EU is relatively constant. Road transport was of the most significant importance in terms of energy consumption (over 90%). The share of other means of transportation was minimal.
  • In the EU, economically developing countries have, as a rule, been catching up with highly developed states. This is evidenced by the difference in the dynamics of GDP per capita growth.
  • In energy consumption by transport per capita, the dependencies were very close to GDP per capita. The economically developing countries were the fastest in increasing energy consumption in transport per capita. In turn, highly developed states recorded slight increases and were stable in this respect. Of course, it is easy to link the results with the rate of change in GDP per capita. Transport is closely related to the economic situation. Thus, the research hypothesis was confirmed.
  • An important reason for the significant increase in energy absorption per capita in Central and Eastern Europe is taking over the transport markets by enterprises from this region as a result of offering lower rates for transport.

5.2. Recommendations

The relationship between energy consumption in transport and the economic situation has not been the subject of systematic research. There are no studies on the association between energy absorption in transport per capita and the level of economic development measured in GDP per capita. The authors found only one project of this type. Furthermore, there were no such studies related to the EU.
The limitations in conducting such academic studies are the lack of available current and detailed data on energy consumption in individual modes of transport. A possible direction of further research is linking energy absorption in transport with environmental pollution and economic development. In this case, it should be based on data concerning per capita. Additionally, the investigation of the interconnections between the various modes of transport would be interesting since EU states differ significantly in this respect. Another direction of academic analysis is the examination of dependencies occurring in regions.

Author Contributions

Conceptualization, T.R., G.K. and L.O.; methodology, G.K. and L.O.; software G.K. and L.O.; validation T.R.; formal analysis G.K., L.O. and T.R.; investigation, T.R. and G.K.; resources, T.R., A.B.-B., G.K. and L.O.; data curation, G.K., T.R. and L.O.; writing—original draft preparation, T.R., G.K., L.O., K.W., M.R., H.S., K.M., P.B. and A.B.-B.; writing—review and editing, T.R., G.K., L.O., K.W., M.R., H.S., K.M., P.B. and A.B.-B.; visualization, G.K.; supervision, L.O. and T.R.; project administration, L.O.; funding acquisition, L.O. All authors have read and agreed to the published version of the manuscript.

Funding

This research received no external funding.

Conflicts of Interest

The authors declare no conflict of interest.

References

  1. IEA (International Energy Agency). Key World Energy Statistics 2020; OECD/IEA: Paris, France, 2020; Available online: https://www.iea.org/reports/key-world-energy-statistics-2020/final-consumption#abstract (accessed on 22 June 2021).
  2. Ramanathan, R. Estimating energy consumption of transport modes in India using DEA and application to energy and environmental policy. J. Oper. Res. Soc. 2005, 56, 732–737. [Google Scholar] [CrossRef]
  3. Dingil, A.E.; Schweizer, J.; Rupi, F.; Stasiskiene, Z. Updated Models of Passenger Transport Related Energy Consumption of Urban Areas. Sustainability 2019, 11, 4060. [Google Scholar] [CrossRef] [Green Version]
  4. Brownstone, D.; Golob, T.F. The impact of residential density on vehicle usage and energy consumption. J. Urban Econ. 2009, 65, 91–98. [Google Scholar] [CrossRef] [Green Version]
  5. Schippl, J.; Arnold, A. Stakeholders’ Views on Multimodal Urban Mobility Futures: A Matter of Policy Interventions or Just the Logical Result of Digitalization? Energies 2020, 13, 1788. [Google Scholar] [CrossRef]
  6. Newman, P.W.; Kenworthy, J.R. The transport energy trade-off: Fuel-efficient traffic versus fuel-efficient cities. Transp. Res. Part A Gen. 1988, 22, 163–174. [Google Scholar] [CrossRef]
  7. Lin, W.; Chen, B.; Xie, L.; Pan, H. Estimating energy consumption of transport modes in China using DEA. Sustainability 2015, 7, 4225–4239. [Google Scholar] [CrossRef] [Green Version]
  8. Feng, C.; Wang, M. Analysis of energy efficiency in China’s transportation sector. Renew. Sustain. Energy Rev. 2018, 94, 565–575. [Google Scholar] [CrossRef]
  9. Sharif, A.; Shahbaz, M.; Hille, E. The transportation-growth nexus in USA: Fresh insights from pre-post global crisis period. Transp. Res. Part A Policy Pract. 2019, 121, 108–121. [Google Scholar] [CrossRef]
  10. Rokicki, T.; Ratajczak, M.; Bórawski, P.; Bełdycka-Bórawska, A.; Gradziuk, B.; Gradziuk, P.; Siedlecka, A. Energy Self-Subsistence of Agriculture in EU Countries. Energies 2021, 14, 3014. [Google Scholar] [CrossRef]
  11. Rokicki, T.; Perkowska, A.; Klepacki, B.; Bórawski, P.; Bełdycka-Bórawska, A.; Michalski, K. Changes in Energy Consumption in Agriculture in the EU Countries. Energies 2021, 14, 1570. [Google Scholar] [CrossRef]
  12. Banister, D.; Stead, D. Reducing transport intensity. Eur. J. Transp. Infrastruct. Res. 2002, 2. [Google Scholar] [CrossRef]
  13. Yu, E.S.; Choi, J.Y. The causal relationship between energy and GNP: An international comparison. J. Energy Dev. 1985, 10, 249–272. [Google Scholar]
  14. Masih, A.M.; Masih, R. Energy consumption, real income and temporal causality: Results from a multi-country study based on cointegration and error-correction modelling techniques. Energy Econ. 1996, 18, 165–183. [Google Scholar] [CrossRef]
  15. Rafiq, S.; Salim, R.A. Temporal causality between energy consumption and income in six Asian emerging countries. Appl. Econ. Q. 2009, 55, 335. [Google Scholar] [CrossRef]
  16. Azam, M.; Khan, A.Q.; Bakhtyar, B.; Emirullah, C. The causal relationship between energy consumption and economic growth in the ASEAN-5 countries. Renew. Sustain. Energy Rev. 2015, 47, 732–745. [Google Scholar] [CrossRef]
  17. Narayan, P.K.; Smyth, R. Energy consumption and real GDP in G7 countries: New evidence from panel cointegration with structural breaks. Energy Econ. 2008, 30, 2331–2341. [Google Scholar] [CrossRef]
  18. Costantini, V.; Martini, C. The causality between energy consumption and economic growth: A multi-sectoral analysis using non-stationary cointegrated panel data. Energy Econ. 2010, 32, 591–603. [Google Scholar] [CrossRef] [Green Version]
  19. Joyeux, R.; Ripple, R.D. Energy consumption and real income: A panel cointegration multi-country study. Energy J. 2011, 32, 107–141. [Google Scholar] [CrossRef]
  20. Narayan, P.K.; Popp, S. The energy consumption-real GDP nexus revisited: Empirical evidence from 93 countries. Econ. Model. 2012, 29, 303–308. [Google Scholar] [CrossRef]
  21. Liddle, B.; Lung, S. Revisiting energy consumption and GDP causality: Importance of a priori hypothesis testing, disaggregated data, and heterogeneous panels. Appl. Energy 2015, 142, 44–55. [Google Scholar] [CrossRef]
  22. Pala, A. Which energy-growth hypothesis is valid in OECD countries? Evidence from panel Granger causality. Int. J. Energy Econ. Policy 2016, 6, 28–34. [Google Scholar]
  23. Klepacki, B.; Kusto, B.; Bórawski, P.; Bełdycka-Bórawska, A.; Michalski, K.; Perkowska, A.; Rokicki, T. Investments in Renewable Energy Sources in Basic Units of Local Government in Rural Areas. Energies 2021, 14, 3170. [Google Scholar] [CrossRef]
  24. Rokicki, T.; Perkowska, A. Diversity and Changes in the Energy Balance in EU Countries. Energies 2021, 14, 1098. [Google Scholar] [CrossRef]
  25. Rokicki, T.; Perkowska, A. Changes in Energy Supplies in the Countries of the Visegrad Group. Sustainability 2020, 12, 7916. [Google Scholar] [CrossRef]
  26. Ozturk, I.; Acaravci, A. The causal relationship between energy consumption and GDP in Albania, Bulgaria, Hungary and Romania: Evidence from ARDL bound testing approach. Appl. Energy 2010, 87, 1938–1943. [Google Scholar] [CrossRef]
  27. Belloumi, M. Energy consumption and GDP in Tunisia: Cointegration and causality analysis. Energy Policy 2009, 37, 2745–2753. [Google Scholar] [CrossRef]
  28. Nasreen, S.; Saidi, S.; Ozturk, I. Assessing links between energy consumption, freight transport, and economic growth: Evidence from dynamic simultaneous equation models. Environ. Sci. Pollut. Res. 2018, 25, 16825–16841. [Google Scholar] [CrossRef]
  29. Nasreen, S.; Mbarek, M.B.; Atiq-ur-Rehman, M. Long-run causal relationship between economic growth, transport energy consumption and environmental quality in Asian countries: Evidence from heterogeneous panel methods. Energy 2020, 192, 116628. [Google Scholar] [CrossRef]
  30. Abdallah, K.B.; Belloumi, M.; De Wolf, D. International comparisons of energy and environmental efficiency in the road transport sector. Energy 2015, 93, 2087–2101. [Google Scholar] [CrossRef]
  31. Kobayashi, S.; Plotkin, S.; Ribeiro, S.K. Energy efficiency technologies for road vehicles. Energy Effic. 2009, 2, 125–137. [Google Scholar] [CrossRef]
  32. Saisirirat, P.; Chollacoop, N. A scenario analysis of road transport sector: The impacts of recent energy efficiency policies. Energy Procedia 2017, 138, 1004–1010. [Google Scholar] [CrossRef]
  33. Poran, A.; Thawko, A.; Eyal, A.; Tartakovsky, L. Direct injection internal combustion engine with high-pressure thermochemical recuperation–Experimental study of the first prototype. Int. J. Hydrog. Energy 2018, 43, 11969–11980. [Google Scholar] [CrossRef]
  34. Rokicki, T.; Perkowska, A.; Klepacki, B.; Szczepaniuk, H.; Szczepaniuk, E.K.; Bereziński, S.; Ziółkowska, P. The Importance of Higher Education in the EU Countries in Achieving the Objectives of the Circular Economy in the Energy Sector. Energies 2020, 13, 4407. [Google Scholar] [CrossRef]
  35. Ahmad, M.; Zhao, Z.Y. Empirics on linkages among industrialization, urbanization, energy consumption, CO2 emissions and economic growth: A heterogeneous panel study of China. Environ. Sci. Pollut. Res. 2018, 25, 30617–30632. [Google Scholar] [CrossRef]
  36. Bagloee, S.A.; Ceder, A.A.; Sarvi, M.; Asadi, M. Is it time to go for no-car zone policies? Braess Paradox Detection. Transp. Res. Part A Policy Pract. 2019, 121, 251–264. [Google Scholar] [CrossRef]
  37. Ceder, A. Urban mobility and public transport: Future perspectives and review. Int. J. Urban Sci. 2020, 1–25. [Google Scholar] [CrossRef]
  38. Cheng, Z.; Zhao, L.; Li, H. A Transportation Network Paradox: Consideration of Travel Time and Health Damage due to Pollution. Sustainability 2020, 12, 8107. [Google Scholar] [CrossRef]
  39. Ahn, K.; Rakha, H. The effects of route choice decisions on vehicle energy consumption and emissions. Transp. Res. Part D Transp. Environ. 2008, 13, 151–167. [Google Scholar] [CrossRef]
  40. Tuero, A.G.; Pozueco, L.; García, R.; Díaz, G.; Pañeda, X.G.; Melendi, D.; Rionda, A.; Martínez, D. Economic impact of the use of inertia in an urban bus company. Energies 2017, 10, 1029. [Google Scholar] [CrossRef] [Green Version]
  41. Grubler, A. Energy transitions research: Insights and cautionary tales. Energy Policy 2012, 50, 8–16. [Google Scholar] [CrossRef]
  42. Fosgerau, M.; Kveiborg, O. A review of some critical assumptions in the relationship between economic activity and freight transport. Int. J. Transp. Econ. 2004, 31, 247–261. [Google Scholar]
  43. Sorrell, S.; Lehtonen, M.; Stapleton, L.; Pujol, J.; Champion, T. Decomposing road freight energy use in the United Kingdom. Energy Policy 2009, 37, 3115–3129. [Google Scholar] [CrossRef]
  44. Mraihi, R.; ben Abdallah, K.; Abid, M. Road transport-related energy consumption: Analysis of driving factors in Tunisia. Energy Policy 2013, 62, 247–253. [Google Scholar] [CrossRef]
  45. Rødseth, K.L. Productivity growth in urban freight transport: An index number approach. Transp. Policy 2017, 56, 86–95. [Google Scholar] [CrossRef]
  46. Flora, M.; Ewbank, H.; Vieira, J.G.V. Framework for urban freight transport analysis in medium-sized cities. urbe. Rev. Bras. Gestão Urbana 2019, 11, 11. [Google Scholar]
  47. Sanz, G.; Pastor Moreno, R.; Benedito Benet, E.; Domenech Léga, B. Evaluating urban freight transport policies within complex urban environments. Int. J. Transp. Econ. 2018, 45, 515–532. [Google Scholar]
  48. Wilkinson, P.; Smith, K.R.; Beevers, S.; Tonne, C.; Oreszczyn, T. Energy, energy efficiency, and the built environment. Lancet 2007, 370, 1175–1187. [Google Scholar] [CrossRef]
  49. Haines, A.; Smith, K.R.; Anderson, D.; Epstein, P.R.; McMichael, A.J.; Roberts, I.; Wilkinson, P.; Woodcock, J.; Woods, J. Policies for accelerating access to clean energy, improving health, advancing development, and mitigating climate change. Lancet 2007, 370, 1264–1281. [Google Scholar] [CrossRef]
  50. Ortiz, M.A.; Kurvers, S.R.; Bluyssen, P.M. A review of comfort, health, and energy use: Understanding daily energy use and wellbeing for the development of a new approach to study comfort. Energy Build. 2017, 152, 323–335. [Google Scholar] [CrossRef]
  51. Thoyre, A. Energy efficiency as a resource in state portfolio standards: Lessons for more expansive policies. Energy Policy 2015, 86, 625–634. [Google Scholar] [CrossRef]
  52. Wilkinson, P.; Smith, K.R.; Joffe, M.; Haines, A. A global perspective on energy: Health effects and injustices. Lancet 2007, 370, 965–978. [Google Scholar] [CrossRef]
  53. Woodcock, J.; Banister, D.; Edwards, P.; Prentice, A.M.; Roberts, I. Energy and transport. Lancet 2007, 370, 1078–1088. [Google Scholar] [CrossRef]
  54. Watson, M. How theories of practice can inform transition to a decarbonised transport system. J. Transp. Geogr. 2012, 24, 488–496. [Google Scholar] [CrossRef] [Green Version]
  55. Banister, D.; Anderton, K.; Bonilla, D.; Givoni, M.; Schwanen, T. Transportation and the environment. Annu. Rev. Environ. Resour. 2011, 36, 247–270. [Google Scholar] [CrossRef] [Green Version]
  56. Deakin, E. Sustainable Development & Sustainable Transportation: Strategies for Economic Prosperity, Environmental Quality, Equity (No. UCTC No. 519). Available online: https://escholarship.org/content/qt0m1047xc/qt0m1047xc.pdf?t=lnr4d9 (accessed on 18 July 2021).
  57. Köhler, J. Globalization and sustainable development: Case study on international transport and sustainable development. J. Environ. Dev. 2014, 23, 66–100. [Google Scholar] [CrossRef]
  58. Bamwesigye, D.; Hlavackova, P. Analysis of sustainable transport for smart cities. Sustainability 2019, 11, 2140. [Google Scholar] [CrossRef] [Green Version]
  59. Gudmundsson, H.; Höjer, M. Sustainable development principles and their implications for transport. Ecol. Econ. 1996, 19, 269–282. [Google Scholar] [CrossRef]
  60. Figueroa, M.J.; Ribeiro, S.K. Energy for road passenger transport and sustainable development: Assessing policies and goals interactions. Curr. Opin. Environ. Sustain. 2013, 5, 152–162. [Google Scholar] [CrossRef]
  61. McCollum, D.L.; Echeverri, L.G.; Busch, S.; Pachauri, S.; Parkinson, S.; Rogelj, J.; Krey, V.; Minx, J.C.; Nilsson, M.; Stevance, A.-S.; et al. Connecting the sustainable development goals by their energy inter-linkages. Environ. Res. Lett. 2018, 13, 033006. [Google Scholar] [CrossRef]
  62. Nilsson, M.; Chisholm, E.; Griggs, D.; Howden-Chapman, P.; McCollum, D.; Messerli, P.; Neumann, B.; Stevance, A.-S.; Visbeck, M.; Stafford-Smith, M. Mapping interactions between the sustainable development goals: Lessons learned and ways forward. Sustain. Sci. 2018, 13, 1489–1503. [Google Scholar] [CrossRef] [Green Version]
  63. Grossman, G.M.; Krueger, A.B. Environmental Impacts of a North American Free Trade Agreement (No. w3914). Available online: https://www.nber.org/system/files/working_papers/w3914/w3914.pdf (accessed on 20 July 2021).
  64. Pearson, P.J. Energy, externalities and environmental quality: Will development cure the ills it creates? In Surrey Energy Economics Centre; Department of Economics, University of Surrey: Guildford, UK, 1994; pp. 199–216. [Google Scholar]
  65. Shafik, N.; Bandyopadhyay, S. Economic Growth and Environmental Quality: Time-Series and Cross-Country Evidence; World Bank Publications: Washington DC, USA, 1992; Volume 904. [Google Scholar]
  66. Shafik, N. Economic development and environmental quality: An econometric analysis. Oxf. Econ. Pap. 1994, 46, 757–773. [Google Scholar] [CrossRef]
  67. Selden, T.M.; Song, D. Neoclassical growth, the J curve for abatement, and the inverted U curve for pollution. J. Environ. Econ. Manag. 1995, 29, 162–168. [Google Scholar] [CrossRef]
  68. Stern, D.I.; Common, M.S.; Barbier, E.B. Economic growth and environmental degradation: The environmental Kuznets curve and sustainable development. World Dev. 1996, 24, 1151–1160. [Google Scholar] [CrossRef]
  69. Heil, M.T.; Selden, T.M. Panel stationarity with structural breaks: Carbon emissions and GDP. Appl. Econ. Lett. 1999, 6, 223–225. [Google Scholar] [CrossRef]
  70. Friedl, B.; Getzner, M. Determinants of CO2 emissions in a small open economy. Ecol. Econ. 2003, 45, 133–148. [Google Scholar] [CrossRef]
  71. Halicioglu, F. An econometric study of CO2 emissions, energy consumption, income and foreign trade in Turkey. Energy Policy 2009, 37, 1156–1164. [Google Scholar] [CrossRef] [Green Version]
  72. Tamazian, A.; Chousa, J.P.; Vadlamannati, C. Does higher economic and financial growth lead to environmental degradation: Evidence from the BRIC countries. Energy Policy 2009, 37, 246–253. [Google Scholar] [CrossRef]
  73. Menyah, K.; Wolde-Rufael, Y. Energy consumption, pollutant emissions and economic growth in South Africa. Energy Econ. 2010, 32, 1374–1382. [Google Scholar] [CrossRef]
  74. Shahbaz, M.; Mutascu, M.; Azim, P. Environmental Kuznets curve in Romania and the role of energy consumption. Renew. Sustain. Energy Rev. 2013, 18, 165–173. [Google Scholar] [CrossRef] [Green Version]
  75. Shahbaz, M.; Tiwari, A.K.; Nasir, M. The effects of financial development, economic growth, coal consumption and trade openness on CO2 emissions in South Africa. Energy Policy 2013, 61, 1452–1459. [Google Scholar] [CrossRef] [Green Version]
  76. Pablo-Romero, M.D.P.; De Jesús, J. Economic growth and energy consumption: The energy-environmental Kuznets curve for Latin America and the Caribbean. Renew. Sustain. Energy Rev. 2016, 60, 1343–1350. [Google Scholar] [CrossRef]
  77. Dasgupta, S.; Laplante, B.; Wang, H.; Wheeler, D. Confronting the environmental Kuznets curve. J. Econ. Perspect. 2002, 16, 147–168. [Google Scholar] [CrossRef] [Green Version]
  78. Saboori, B.; Sulaiman, J. Environmental degradation, economic growth and energy consumption: Evidence of the environmental Kuznets curve in Malaysia. Energy Policy 2013, 60, 892–905. [Google Scholar] [CrossRef]
  79. Al-Mulali, U.; Saboori, B.; Ozturk, I. Investigating the environmental Kuznets curve hypothesis in Vietnam. Energy Policy 2015, 76, 123–131. [Google Scholar] [CrossRef]
  80. Ang, J.B. CO2 emissions, energy consumption, and output in France. Energy Policy 2007, 35, 4772–4778. [Google Scholar] [CrossRef]
  81. Iwata, H.; Okada, K.; Samreth, S. Empirical study on the environmental Kuznets curve for CO2 in France: The role of nuclear energy. Energy Policy 2010, 38, 4057–4063. [Google Scholar] [CrossRef] [Green Version]
  82. Hamit-Haggar, M. Greenhouse gas emissions, energy consumption and economic growth: A panel cointegration analysis from Canadian industrial sector perspective. Energy Econ. 2012, 34, 358–364. [Google Scholar] [CrossRef]
  83. Esteve, V.; Tamarit, C. Threshold cointegration and nonlinear adjustment between CO2 and income: The environmental Kuznets curve in Spain, 1857–2007. Energy Econ. 2012, 34, 2148–2156. [Google Scholar] [CrossRef]
  84. Plassmann, F.; Khanna, N. Household income and pollution: Implications for the debate about the environmental Kuznets curve hypothesis. J. Environ. Dev. 2006, 15, 22–41. [Google Scholar] [CrossRef]
  85. Saboori, B.; Sulaiman, J.; Mohd, S. Economic growth and CO2 emissions in Malaysia: A cointegration analysis of the environmental Kuznets curve. Energy Policy 2012, 51, 184–191. [Google Scholar] [CrossRef]
  86. Jalil, A.; Feridun, M. The impact of growth, energy and financial development on the environment in China: A cointegration analysis. Energy Econ. 2011, 33, 284–291. [Google Scholar] [CrossRef]
  87. Yavuz, N.Ç. CO2 emission, energy consumption, and economic growth for Turkey: Evidence from a cointegration test with a structural break. Energy Sources Part B Econ. Plan. Policy 2014, 9, 229–235. [Google Scholar] [CrossRef]
  88. Fodha, M.; Zaghdoud, O. Economic growth and pollutant emissions in Tunisia: An empirical analysis of the environmental Kuznets curve. Energy Policy 2010, 38, 1150–1156. [Google Scholar] [CrossRef]
  89. Zilio, M.; Recalde, M. GDP and environment pressure: The role of energy in Latin America and the Caribbean. Energy Policy 2011, 39, 7941–7949. [Google Scholar] [CrossRef]
  90. Lean, H.H.; Smyth, R. CO2 emissions, electricity consumption and output in ASEAN. Appl. Energy 2010, 87, 1858–1864. [Google Scholar] [CrossRef]
  91. Apergis, N.; Payne, J.E. CO2 emissions, energy usage, and output in Central America. Energy Policy 2009, 37, 3282–3286. [Google Scholar] [CrossRef]
  92. Du, L.; Wei, C.; Cai, S. Economic development and carbon dioxide emissions in China: Provincial panel data analysis. China Econ. Rev. 2012, 23, 371–384. [Google Scholar] [CrossRef]
  93. Ang, J.B. Economic development, pollutant emissions and energy consumption in Malaysia. J. Policy Model. 2008, 30, 271–278. [Google Scholar] [CrossRef]
  94. Apergis, N.; Payne, J.E. A panel study of nuclear energy consumption and economic growth. Energy Econ. 2010, 32, 545–549. [Google Scholar] [CrossRef]
  95. Omri, A. CO2 emissions, energy consumption and economic growth nexus in MENA countries: Evidence from simultaneous equations models. Energy Econ. 2013, 40, 657–664. [Google Scholar] [CrossRef] [Green Version]
  96. Kraft, J.; Kraft, A. On the relationship between energy and GNP. J. Energy Dev. 1978, 3, 401–403. [Google Scholar]
  97. Bozoklu, S.; Yilanci, V. Energy consumption and economic growth for selected OECD countries: Further evidence from the Granger causality test in the frequency domain. Energy Policy 2013, 63, 877–881. [Google Scholar] [CrossRef]
  98. Pao, H.T.; Fu, H.C. Renewable energy, non-renewable energy and economic growth in Brazil. Renew. Sustain. Energy Rev. 2013, 25, 381–392. [Google Scholar] [CrossRef]
  99. Yoo, S.H.; Kim, Y. Electricity generation and economic growth in Indonesia. Energy 2006, 31, 2890–2899. [Google Scholar] [CrossRef]
  100. Jobert, T.; Karanfil, F. Sectoral energy consumption by source and economic growth in Turkey. Energy Policy 2007, 35, 5447–5456. [Google Scholar] [CrossRef]
  101. Mozumder, P.; Marathe, A. Causality relationship between electricity consumption and GDP in Bangladesh. Energy Policy 2007, 35, 395–402. [Google Scholar] [CrossRef]
  102. Hu, J.L.; Lin, C.H. Disaggregated energy consumption and GDP in Taiwan: A threshold co-integration analysis. Energy Econ. 2008, 30, 2342–2358. [Google Scholar] [CrossRef]
  103. Bartleet, M.; Gounder, R. Energy consumption and economic growth in New Zealand: Results of trivariate and multivariate models. Energy Policy 2010, 38, 3508–3517. [Google Scholar] [CrossRef]
  104. Dagher, L.; Yacoubian, T. The causal relationship between energy consumption and economic growth in Lebanon. Energy Policy 2012, 50, 795–801. [Google Scholar] [CrossRef]
  105. Mosaberpanah, M.A.; Khales, S.D. The role of transportation in sustainable development. In Proceedings of the ICSDEC 2012: Developing the Frontier of Sustainable Design, Engineering, and Construction, Fort Worth, TX, USA, 7–9 November 2012; pp. 441–448. [Google Scholar] [CrossRef]
  106. Wiederkehr, P.; Gilbert, R.; Crist, P.; Caïd, N. Environmentally Sustainable Transport (EST). Eur. J. Transp. Infrastruct. Res. 2004, 4, 11–25. [Google Scholar]
  107. Turton, H. Sustainable global automobile transport in the 21st century: An integrated scenario analysis. Technol. Forecast. Soc. Chang. 2006, 73, 607–629. [Google Scholar] [CrossRef]
  108. Rossi, G.C.; Testa, M. Euclidean versus Minkowski short distance. Phys. Rev. D 2018, 98, 054028. [Google Scholar] [CrossRef] [Green Version]
  109. Spearman, C. The proof and measurement of association between two things. Am. J. Psychol. 1904, 15, 72–101. [Google Scholar] [CrossRef]
  110. Kowalczyk, T.; Pleszczyńska, E.; Ruland, F. Grade Models and Methods for Data Analysis with Applications for the Analysis of Data Populations; Springer: Berlin/Heidelberg, Germany; New York, NY, USA, 2004; Volume 151, ISBN 978-3-540-21120-4. [Google Scholar]
  111. Szczesny, W.; Kowalczyk, T.; Wolinska-Welcz, A.; Wiech, M.; Dunicz-Sokolowska, A.; Grabowska, G.; Pleszczynska, E. Models and Methods of Grade Data Analysis: Recent Developments; Institute of Computer Science Polish Academy of Sciences: Warsaw, Poland, 2012. [Google Scholar]
  112. Ibrahiem, D.M. Road energy consumption, economic growth, population and urbanization in Egypt: Cointegration and causality analysis. Environ. Dev. Sustain. 2018, 20, 1053–1066. [Google Scholar] [CrossRef]
  113. Liddle, B.; Lung, S. The long-run causal relationship between transport energy consumption and GDP: Evidence from heterogeneous panel methods robust to cross-sectional dependence. Econ. Lett. 2013, 121, 524–527. [Google Scholar] [CrossRef]
  114. Achour, H.; Belloumi, M. Investigating the causal relationship between transport infrastructure, transport energy consumption and economic growth in Tunisia. Renewable and Sustainable. Energy Rev. 2016, 56, 988–998. [Google Scholar]
  115. Achour, H.; Belloumi, M. Decomposing the influencing factors of energy consumption in Tunisian transportation sector using the LMDI method. Transp. Policy 2016, 52, 64–71. [Google Scholar] [CrossRef]
  116. Rehermann, F.; Pablo-Romero, M. Economic growth and transport energy consumption in the Latin American and Caribbean countries. Energy Policy 2018, 122, 518–527. [Google Scholar] [CrossRef]
  117. Saidi, S.; Shahbaz, M.; Akhtar, P. The long-run relationships between transport energy consumption, transport infrastructure, and economic growth in MENA countries. Transp. Res. Part A Policy Pract. 2018, 111, 78–95. [Google Scholar] [CrossRef]
  118. Belke, A.; Dobnik, F.; Dreger, C. Energy consumption and economic growth: New insights into the cointegration relationship. Energy Econ. 2011, 33, 782–789. [Google Scholar] [CrossRef] [Green Version]
  119. Gherghina, Ş.C.; Onofrei, M.; Vintilă, G.; Armeanu, D.Ş. Empirical evidence from EU-28 countries on resilient transport infrastructure systems and sustainable economic growth. Sustainability 2018, 10, 2900. [Google Scholar] [CrossRef] [Green Version]
Figure 1. Diagram of the conducted research.
Energies 14 05414 g001
Figure 2. Final energy consumption in EU in 2018. (a) Total energy consumption. (b) Transport energy consumption.
Energies 14 05414 g002
Figure 3. Transport sector energy use in UE in 2018.
Energies 14 05414 g003
Figure 4. Final energy consumption in UE 2004–2018 in gigatons of oil equivalent (Gtoe). (a) Energy total. (b) Transport sector.
Energies 14 05414 g004
Figure 5. Energy consumption in different transport in various branches of transport by EU countries in 2018.
Energies 14 05414 g005
Figure 6. Trends in changes in gross value added in transport and the trend of gross domestic product in 2004–2018 (current prices, million euro). (a) Transportation and storage. (b) Land transport and transport via pipelines. (c) Water transport. (d) Air transport. (e) Postal and courier activities. (f) Gross domestic product at market prices.
Energies 14 05414 g006
Figure 7. GDP per capita in UE countries in 2018 in comparison to the average in UE.
Energies 14 05414 g007
Figure 8. Dynamics of the pace of changes in the GDP per capita of the European Union countries in 2004–2018. (a) Dynamics in countries. (b) Dynamics in group of countries.
Energies 14 05414 g008
Figure 9. Overrepresentation maps of energy consumption by transport per capita in European Union countries in 2004–2018. (a) Dynamics in countries. (b) Dynamics in group of countries.
Energies 14 05414 g009
Figure 10. Countries’ positions in the rankings of changes in energy consumption by transport per capita and GDP per capita.
Energies 14 05414 g010
Table 1. Ranking of countries by the strength of GDP per capita growth in accordance with the GCA algorithm.
Group 1Group 2Group 3
CountryScoreCountryScoreCountryScore
GR0.01FI0.33IE0.82
CY0.04DK0.38CZ0.87
IT0.08HR0.42PL0.88
ES0.11BE0.45SK0.90
GB0.15SI0.49LV0.92
FR0.20AT0.53MT0.94
PT0.23SE0.58EE0.96
NL0.27DE0.64BG0.97
HU0.67RO0.98
LU0.73LT0.99
Table 2. Ranking of countries according to the dynamics of energy absorption in transport per capita according to GCA algorithm.
Group 1Group 2Group 3
CountryScoreCountryScoreCountryScore
GR0.02CY0.4HR0.8
ES0.05DK0.44SK0.82
IT0.08SE0.47CZ0.84
PT0.11GB0.51BG0.87
IE0.15LV0.54SI0.9
LU0.26FI0.57MT0.93
NL0.36BE0.61LT0.95
DE0.64RO0.97
FR0.67PL0.99
HU0.7
AT0.73
EE0.77
Publisher’s Note: MDPI stays neutral with regard to jurisdictional claims in published maps and institutional affiliations.

