Abstract
The global energy mix is undergoing an accelerating transformation driven by new resources, novel technologies, and climate change-related commitments. Changes in the use and availability of energy resources have affected fossil fuels (coal, oil, and natural gas) trade patterns. Some economies enjoy increasing energy independence, whereas others become more dependent on imports to satisfy their energy needs. Using 2000–2018 United Nations Commodity trade and International Energy Agency energy- and monetary-flow data, we examine the evolution of the international network of energy flows to reveal new patterns and understand their energy security implications. Our work explores how the growth in the U.S. unconventional resources, European Union renewable energy, China’s natural gas consumption, and changes in other country energy flows affect economy positions and trade-network connectivity. Testing the small-world property helps us understand the diffusion of new technologies, including energy-demand electrification and renewable energy adoption. A modified energy-security index is introduced to highlight the interplay between fuel type and trade partner diversification and domestic supply and consumption balance. The results provide insights about the energy transition and its effect on the international network of energy flows and energy security.
1. Introduction
The past two decades have brought dramatic changes to the energy landscape. Technological advances helped untap abundant unconventional natural gas and oil resources and led to nearly exponential growth in renewable energy production. The shares of unconventional resources in global natural gas and oil production have grown from less than 1% in 2000 to about 15% and 12%, respectively, in 2019 [1]. Over the same period of time, the supply of renewable energy has increased by about 50%, reaching 5% of global total primary energy consumption [2]. An increased number of countries have adopted the Paris Agreement and have introduced policies to encourage and accelerate deployment of low-carbon technologies. The process referred to as “the energy transition” aims to decrease carbon and other emissions, mitigating climate-change issues. The transition is underpinned by supply-side transformation, as well as demand-side reconfiguration. Developments in battery and other energy-storage technologies, adoption of circular economy principles, and employment of innovative materials are among the key drivers behind the decreasing energy intensity of global GDP.
Innovations and exploitation of new energy resources have been unevenly introduced and implemented among the different countries. While many developed countries have been deploying clean-energy resources and reducing final energy consumption, fast-growing developing countries have been increasing their energy consumption, importing increasing volumes of energy. Over the past two decades, the European countries have reduced their consumption by an average of 5% [3]. In the meantime, the leading Asian economy, Japan, has decreased its energy demand by about 15%. Canada has led the transition, reducing its energy intensity by almost 20%, whereas the United States has managed to decouple its energy consumption from GDP and has held its energy demand fairly flat [4]. In contrast, primary energy use in China and central Africa has almost tripled, and, in India, eastern Africa, and the Middle East, primary energy use has more than doubled, pushing global energy use to a 40% increase. Only partially satisfied by the increase in the renewable energy supply, the growing energy demand brings new disturbances to the status quo of fossil fuel trade [5].
Those changes in the global and individual-economy energy-mix compositions have been enabled by and have impacted the international energy trade [6]. The structure of the energy supply has a profound effect on energy security and is an important factor in geopolitical decisions. Hence, understanding the effect of changes brought by the energy transition, especially the energy-trade evolution and its energy-security implications, is crucial for revealing new vulnerabilities and risks [7].
The purpose of this paper is to provide insights about the effects of the energy transition and fossil-fuel use on the international energy trade and energy security. First, we update and enhance the quantitative description of the international network of energy flows (INEF). By examining the evolution of fossil-fuels trade patterns, we intend to reveal whether energy and economic integration continues or the transition away from coal, substituted by natural gas and renewable energy resources, has weakened existing trade links and reduced network connectivity. Second, we aim to explore the changes in individual economy positions in natural gas, coal, and oil trade, which are crucial for understanding the competition and price dynamics. Particularly, we want to reveal whether the European Union’s (EU) recent energy and environmental policies, China’s strategies for carbon neutrality, and U.S. energy exports have affected the metaphorical systemic gravity of those regions and their suppliers. Finally, we tackle energy-security questions focusing on the effect of supply diversification under the changing (traded) energy mix, shifts in production capabilities, and domestic fossil-fuel demand shrinkage.
Economic integration, expansion of fuel transportation routes and infrastructure, demand electrification, and new energy and environmental policies have led to the surge in studies focusing on and emphasizing the geographical aspects of the energy transition [6,8]. The large number of involved countries, the complexity of energy-network flows, and multidimensionality have induced scientists to step away from the traditionally used general equilibrium-based international trade models, turning instead to complex network- and graph-based models instead. Such models could be combined with input–output analysis or other economic approaches to investigate spatial and economic embeddedness of countries and their dynamics [6]. The increasing number of works applying network methods include but are not limited to the following: studies of international trade linkages, interdependencies, and energy communities [9,10]; assessments of the carbon footprint, carbon leakage, and environmental impacts of the fossil-fuels trade [11,12,13]; and analyses of energy security, environmental regulations, and sustainability [6,14,15].
While the diversity of the fast-growing body of literature addresses the expanding number of relevant questions, several drawbacks call for further contributions. First, the revealed dynamics in the trade and security of supply suggests that the analysis should be regularly updated [7]. Second, the network models often separate energy and monetary flows, raising the question of how to compare them [16,17,18,19]. Third, with a few exceptions, analyses focus on one particular fuel (e.g., natural gas [20], coal, or oil) or combine all energy sources together. Such approaches prevent researchers from understanding the role of individual fuels and the importance of their substitutability, which plays a key role in the energy transition [21]. Finally, numerous studies on energy security, offering a wide range of security indexes and comparisons of them, traditionally limit their attention to one or two of the following aspects: (1) supply diversification, thus rarely considering the security or vulnerability of exporters; (2) one selected fuel or all fuels without insights about individual fuel contributions; and (3) individual energy-system component changes, namely interfuel substitution, or a change in the domestic demand or supply level [22,23]. However, understanding trade-offs among various energy-security components is essential in the time of the energy transition and developments of new production possibilities [24,25,26]. The study on the global security index study concludes that various measures are required to understand energy security, as countries vary in their capabilities, priorities, expectations, and preferences [27].
Our analysis aims at updating the previous studies, filling in the gaps in the existing methodologies and providing an alternative, secure measure useful for all the economies and their diverse transition strategies. Hence, we contribute to this literature in several ways. First, we update the previous studies with recent data on energy production, consumption, and trade, expanding the previously investigated time frame to 2000–2018. We compare the two most-used publicly available databases, that of the International Energy Agency (IEA) and United Nations Commodity Trade (UNCT), linking our study to a large number of the earlier analyses. Furthermore, along with the energy-flow data, we compile the associated monetary flows, enabling deeper economic understanding. Our data analysis helps to enrich the intuitions provided by similar works and to support future studies.
Second, with the data on the individual fuel flows covering a period of two decades, we characterize individual-economy energy systems’ evolution, getting insights about the trade developments, and we relate variation in regional trade dynamics to the evolution of energy-system components. We pay special attention to the centers of gravity within the global energy trade system, including the EU, with its largest primary energy consumer, Germany, the United States, and China, by tracking the changes in absolute and relative strength of economies. We apply the complex-network method to examine the evolution of trade through the dynamics of strength and connectivity distributions. Then, we test the small world property to reveal how the clustering and network distances for different fuels change over time. Commonly used for network description, the small world property indicates trade interconnectedness, tightness of competition, and diffusion efficiency. Hence, in the context of the global energy system, this property helps researchers understand how fast and far-reaching the transition to low-carbon fuels may be.
Alternative approaches to studying the motives behind transition to a low-carbon economy and focusing on de-industrialization are based on the environmental Kuznets Curve (EKC). Works employing the EKC report that oil-producing countries exhibit hardly any decrease in greenhouse gas emissions when their capita income growth is considered. Instead, the observed decrease in GHGs is associated with the expansion of the service sectors, i.e., underlying de-industrialization [28,29].
Finally, we suggest a modified energy-security index, capturing and reflecting developments in demand, supply, and trade. Exporting economies are often advised to diversify their economies, yet existing security indexes are not designed to suggest preferable diversification policies [30]. Building on the classical Herfindahl–Hirschman Index, we offer a measure useful for energy importers and exporters alike. Our index is designed for consistency in discussions among international trade participants, informing them of energy-security implications of the energy transition and trade changes.
The rest of the paper is organized as follows: We start with the compiled dataset description discussing the issues associated with the use of two different datasets. Then, we turn to the methodology for the trade and energy-security analysis. We highlight the similarities to and differences from the previous studies. Finally, we present the empirical results, including the conclusions about the overall trade-network development and shifts in energy security across all the considered economies. After that, we characterize dynamics related to the top exporters and importers, focusing on the role of individual fuel trade. We conclude with insights regarding the trends in trade and energy security for individual fuels and their contributions to international energy-system dynamics.
2. Data
To analyze the international energy trade evolution and its implications, we compiled a comprehensive dataset using the UNCT and IEA World Energy Balances databases [4]. We retrieved the data describing historical production, consumption, and trade of oil, natural gas, coal, and renewable energy resources. This section describes the selected variables and provides details on the database construction, addressing issues including missing and erroneous data. Further technical details can be found in the Appendix A.
2.1. Dataset Description
For 245 countries included in the UNCT and IEA databases, we extracted data for the period of 2000 through 2019 on:
- total primary energy consumption (TPEC) by energy type,
- total final energy consumption,
- domestic energy production for coal, oil, natural gas, and other sources of energy (including RE),
- import of coal, oil, and natural gas, with economy of origin specified for each flow, and
- export of coal, oil, and natural gas with its destination.
Within and across the databases, different units of measurement are used. For instance, import and export flows are given in kilograms and the U.S. dollar value. For consistency and cross-comparison, we converted all energy units into Joules (J) based on the net calorific values, as described in Appendix A. In what follows, we distinguish “energy flows” (in J) and “monetary flows” (in USD).
UNCT database employs Harmonized Commodity Description and Coding Systems, or HS code, to classify goods and services. In our study, the following codes have been used: 2701 (oil), 271111 (natural gas in liquefied state) and 271121 (natural gas in gaseous states), and 2709 (coal) for correspondence with the previous analogous studies [6,19,31].
2.2. Data Processing and Verification
With access to the two databases, we have an opportunity to fill in the gaps in data, detect erroneous data, perform a general verification, and comprise a more comprehensive database. The majority of data categories can be found in both databases; however, the UNCT database contains more comprehensive bilateral trade information, whereas IEA has more granular data on produced and consumed energy [32]. To combine the data extracts and expand our dataset, in support of a more granular analysis, we checked the data for consistency.
The verification exercise was complicated by the occurrence of erroneous and missing data. So, we test the hypothesis of data compatibility by running a linear regression for the UNCT against IEA data [33]. We perform this exercise for the entire dataset and for individual classes of data. Thus, the results for the natural gas data, cleaned of outliers, are represented in Figure 1. The results of the regression analysis do not allow to reject the hypothesis on the slope equals to one for each individual fuel dataset. Hence, we confirm the similarity between the UNCT and IEA data and conclude that the two datasets could be merged complimenting each other.
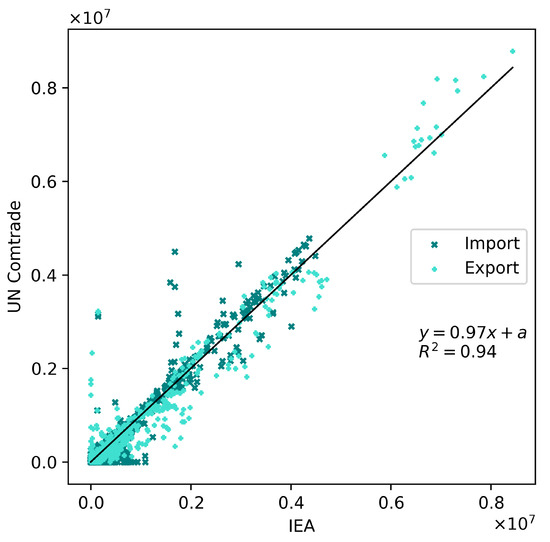
Figure 1.
Comparison of the IEA and UNCT datasets for natural gas data.
Combining the data allows us to fix various data issues and address problems, such as bilateral asymmetry. We find that, in some cases, the reported import quantity by economy i from economy j is not equal to the reported export quantity from j to i. We combat such a bilateral asymmetry by averaging over reported quantities or correcting it referring to the second dataset. Further details on the comparison are provided in Appendix A.
We use the final dataset to map energy import and export data and grasp the radical changes in the world energy landscape analyzed in detail in the empirical analysis presented in Section 5 (Figure 2 and Figure 3).
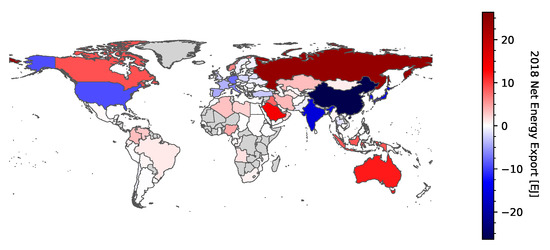
Figure 2.
The map of net energy export of fossil fuels in 2018 based on UNCT database.
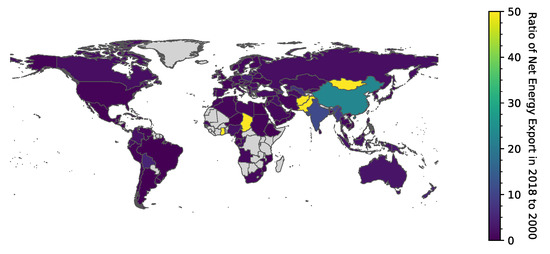
Figure 3.
The ratio of net energy exports in 2018 to 2000 (below) based on UNCT database.
3. Network Analysis
The international energy trade, accounting for almost 90% of the total primary energy consumption, is described by the directed oil, natural gas, and coal flows and can be seen as a network [1]. Such a network, or INEF, is formed by nodes, countries, and links, import and export flows, connecting the nodes. Analyzing INEF as a complex network, we can characterize its structure, detect economically and environmentally relevant properties, reveal trade patterns, and monitor the dynamics. The methodology presented in this section was developed to answer questions relevant to the energy transition and shed light on the impact of shifts in fossil energy use. We introduce concepts to help answer questions, such as: Does the regional integration continue or is it disrupted by the reduction in carbon-heavy coal consumption and production? Who are the most pivotal players on the energy market? How do the energy transition and adoption of new technology affect their positions? These and other relevant questions can be addressed. Our goal is to a provide quantitative description of the individual and total energy trade, reveal the channels of its evolution, and track the changes between 2000 and 2018.
To allow for different levels of aggregation, we specify a directed weighted network for individual fuels and all the flows combined. A network for fuels —coal, natural gas, and oil, respectively, is defined by the set of economies and the set of flows between all the pairs of economies i and j. The matrix, formed by elements, is called the adjacency matrix and has zeros on its diagonal. The elements of the adjacency matrix are net flows, so that:
We use notation to count non-zero elements, i.e., =1 for all exporters j of economy i, and is the total number of exporters for i. Counting all the non-zero elements, we get the number of importers serving economy i, known as in-degree . Summing up over all the possible export destinations, we calculate out-degree . Combined the two values determine the number of trade links or net trading partners, i.e., economy’s degree :
We analyze the evolution of trade connections by examining the dynamics in the number of links, namely looking at changes in individual economy degrees and the global degree distributions. Figure 4 provides an example of the cumulative distribution reporting the number of links associated with a given percent of the total energy traded. The distribution reveals that, in 2018, 95% of the total energy traded has been supplied by 22%, or 490 out of 2180, links. The trade links are arranged by the trade volume, with the smallest contributor standing last, depicting the concentration of flows. In what follows, we focus on the essential links falling into the 95th percentile, reducing the size of the network. Such a link cut-off is applied to each fuel separately and recalculated for every year.
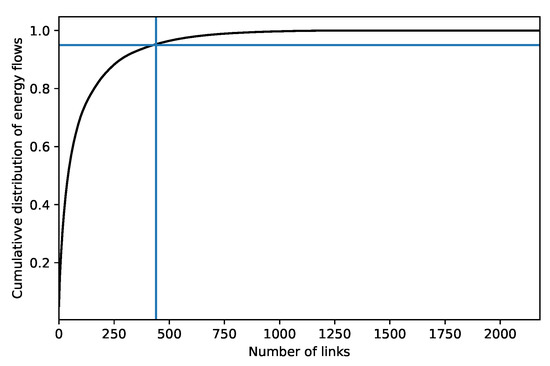
Figure 4.
The cumulative distribution for the total fossil fuels trade in 2018.
The usefulness of the degree analysis is limited because it does not account for flow volumes. To that end, we use the link strength analysis characterizing the trade embeddedness or trade volume. Formally, economy’s strength is the sum of its in- and out-strength and is equal to the total trade volume:
where accounts for the out-flows of economy i, and measures the inflow volumes.
The shape of the degree and strength distributions helps demonstrate the heterogeneity among economies. Thus, the 2018 distributions exhibit the power-law character pointing out to a high dispersion in economies trade positions (Figure 5). The majority of economies have less than five trading partners, and only a handful have more than 20 trading partners. Among those highly connected are the major importers, including China, India, Korea, Japan, the U.S., European economies, and the largest exporters, such as Russia, Saudi Arabia, Canada, and Australia. In the Section 5, we pay special attention to them.
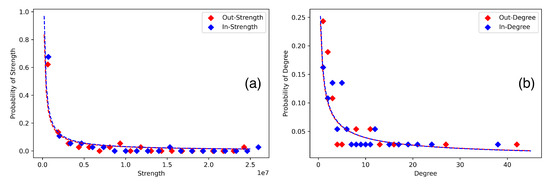
Figure 5.
The strength (a) and degree (b) distributions for fossil fuels energy trade in 2018.
Finally, along with the degree and strength measures, networks can be characterized by density, D, telling us what portion of all possible links has been realized on a given network. For a directed network, it is calculated as:
We calculate the INEF density for individual fuels and total fossil energy flows to discuss the changes in the networks connectivity and globalization trends.
Testing the Small World Hypothesis
In addition to measuring degrees and strengths, we investigate whether the INEF possesses the “small-world” property. In a small-world network, most nodes are not directly connected, but, if needed, almost any node can be reached by every other through a small number of transitors. Therefore, a small-world network is characterized by (a) short average path length L, implying that trade between any pair of economies involves only a few transitors and (b) high clustering. The latter implies that some economies are highly interconnected in a way that makes them form a single market. The clustering coefficient quantifies how close the trade partners of a given economy from forming a completely connected sub-network. Hence, the small-world measure provides insights about regional network structure and the existence of “trade communities”.
Clustering coefficient C is defined by the number of links connecting trade partners of economy i and is averaged over the total number of economies , as suggested by Reference [34]:
The small-worldness can be quantified with coefficient —a measure comparing the clustering and the average path length of a given network to an analogs of an equivalent random network. We choose the Watts-Strogatz (WS) approach to generate the random network with the same number of nodes, links, and the average degree, as proposed by Reference [34], and calculate the small-world coefficient:
The network is said to possess the small-world property if the coefficient [35]. Despite its sensitivity to network size, serves as a helpful measure showing the changes in the network connectivity. In reality, the small-world feature is often associated with networks consisting of several interconnected communities. The increase in the number of links or closer integration often results in higher or strengthening of the small-worldness. However, if the location of the new links does not shorten the average distance and/or coincides with the disappearance of links and decreasing clustering, the small-worldness may be weakened. Figure 6 demonstrates how the INEF has experienced a reduction in the small-worldness. To develop further understanding of the drivers behind the small-world measure reduction, in Section 5, we provide the clustering coefficients and the average shortest path lengths estimates for individual fuel networks.
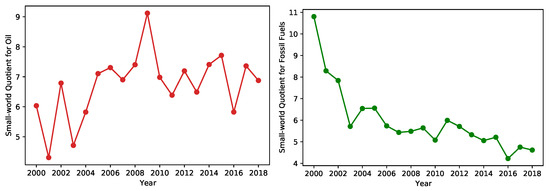
Figure 6.
The evolution of small-world coefficient for oil (left) and the INEF (right).
The small-world effect has some crucial implications. First of all, the closer the small-world quotient to 1, the more interconnected the economies and the faster diffusion processes are expected to be. Thus, the small-world coefficient dynamics may explain the spread of new technologies, price signals, or the effects of regulation. Furthermore, recent research has been focusing on the link between the network robustness or shock-resiliency and small-worldness [36]. Those implications call for special attention to the small-world property in the context of the energy transition.
4. Energy Security Analysis
Energy security is a complex concept brought in the context of geopolitical and policy discussions, highlighting risks of physical availability of energy. The energy transition has led to an expansion of the security notion to embrace other elements critical for the energy supply. The enhanced definition includes the following aspects of energy security [17,37]:
- Availability—geological existence of a resource in some location.
- Accessibility—geopolitical aspect of the access to energy.
- Affordability—economical aspect of energy availability.
- Acceptability—environmental and societal preference.
Approaches to energy security vary and may focus on a single or multiple elements of the above-provided definition. Moreover, it may include aspects, such as puzzle of greenhouse gas footprints of fossil fuels abundance [28,29] and environmental policy goals [38]. In our study, we consider energy security indicators based on bilateral energy exchange between economies, neglecting the issues of availability and acceptability.
The network analysis, presented in the previous section, provides insights into the changes in the overall network and reveals economies’ embeddedness in trade. The degree and strength analysis also points to economies with central and peripheral positions and diversification of trade. However, to understand the security implications of the network evolution, additional measures are required. Various energy security indexes, calculated with the datasets used for the network analysis, are commonly applied to quantify and compare energy security among the economies or changes over time [26]. We start this section by reviewing the widely known HHI-based indexes. We discuss their weaknesses and introduce new modified measures, namely consumption security index (CSI) and production security index (PSI). To develop intuition and highlight the advantages of the proposed indexes, we construct an illustrative example with interpretations linked to the energy transition strategies of some economies. We conclude with insights employed in the next section, where we present our empirical results.
4.1. Traditional HHI-Based Indexes
Various indexes, public and commercial, have been developed to quantify energy security. Several previous studies focusing on the INEF have estimated the classical Herfindahl–Hirschman Index (HHI), also known as Simpson index, relating security to supply concentration [6,19,26]. However, the obtained results have not been addressing security concerns raised in the energy transition discussions, suggesting the need for improvements in the index or the use of different measures.
Traditionally, the HHI index quantifies trade concentration and is calculated, solely, based on the trade flows of type for coal, natural gas, oil, and aggregation over fossil fuels, correspondingly, as:
To analyze the import competition, the summation over all the import sources j is used. The same expression is applied to quantify economy’s j export concentration , in which case the summation shall be done over all export destination i.
The expression (7) reveals that HHI does not account for any changes in domestic production or fuel consumption mix. If an economy decreases its energy import, e.g., thanks to the growth in domestic energy production, it is likely to limit the number of trading partners. In this case, HHI might increase, suggesting the worsening energy security situation. While this, indeed, leads to the higher import vulnerability, the overall economy security may improve with the energy self-sufficiency. Hence, the HHI index would lead to misleading conclusions. Another situation in which HHI could result in erroneous conclusions is when an economy serves as a hub.
Those and other related considerations have led to the development of another class of security index, including consumption into consideration, hence resolving “hub” situations. It has also been realized that energy security shall account for fuel substitutability and energy mix. These arguments have led the International Energy Agency to develop the HHI-based energy security index (ESI), combining the concentration index for individual fuels with supplier-economy risk weights, , and fuel shares in the supply:
Here, is the primary energy consumption of fuel k, whereas is the total primary energy supply in economy i. ESI has been designed to measure energy security from an importer perspective and does not provide an appropriate measure for energy export risk exposure. Changing weather conditions, global crises, and fuel preferences make exporting economies face acute supply risks and speak of supply security. Thus, the COVID-19 pandemic has resulted in a sharp drop in oil use, having a detrimental effect on the oil exporters. Besides, economy-specific import constraints are a commonly used instrument for political and economic pressure [39]. Among the most well-known examples are financial and trade sanctions on Iran that were imposed starting in 1970, reintroduced by the U.S., and the E.U. several times. Iran suffered from the curtailed export, forced to search for new buyers for its oil and develop new supply routes [40]. Under the energy transition, some exporters become especially vulnerable, facing changing fuel preferences and shrinking supply opportunities. The carbon neutrality targets adopted by the increasing number of economies suggest changes in the future coal production and trade possibilities, calling for coal export security analysis.
Hence, the enhancements that make ESI superior to HHI are not sufficient to address exporters’ concerns. ESI captures the changes in the consumption mix but is ignorant to possible changes in the production mix, determining exporters’ supply risk exposure under the energy transition. To tackle that issue, we introduce modified security indexes distinguishing exporter and importer perspectives.
4.2. Importer and Exporter Perspective on Energy Security
It is logical to assume that exporters may mitigate their supply risk by managing their trade flow concentration. However, we have already established that concentration of trade flows alone is not sufficient to reflect the security. One has to consider the weight of the trade in economy’s energy balance. In other words, the concentration index shall be modified to account for total energy. Importers improve their security by becoming self-sufficient, for instance, decreasing the share of consumption imported. Therefore, importer index shall be consumption-based measure, and we call it consumption security index (CSI). In contrast, the exposure of exporters stem from the share of the total production traded. So, exporters would be less vulnerable the more their production is consumed domestically or spread among a larger number of buyers. Hence, exporter or production security index (PSI) shall weigh the export concentration against the fuel production.
We incorporate the above thinking into our analysis and modify the traditional HHI and HHI-derived indexes normalizing the trade concentration to the total production of fuel , , and total fuel consumption, , deriving the security index for exporters and importers as:
Note that the presented indexes allow to identify hub economies with index values . For economies that import or export energy for their own utilization, and values are in the range .
It is important to recall that the difference between the domestic production and consumption, for any given fuel type, is determined by the sum of net flows, or strength in a particular direction:
Although developed with importer and exporter perspectives in mind, both indexes may be applied by the economy serving as a hub or have strong export and import trade connections. An excellent example of such an economy is the U.S., strengthening its trade position with the growing domestic production of renewable energy and unconventional oil and natural gas resources, increasing exported volumes. The fossil energy resource depletion in the past has made the U.S. rely on energy import, a substantial portion of which is reserved despite its own growing supply.
The modified indexes help distinguish between in- and out-flow related risks informing economies, such as the U.S., on the security management needs in different directions. Yet, as suggested by ESI, an aggregate index evaluating the total energy portfolio security is needed for the economy-wide analysis. The IEA approach is valuable but, as noted, suffers from the production mix ignorance and inability to isolate the role of the consumption versus production mix changes. We try to address those issues with our total consumption and total production security indexes, and , respectively.
Formally speaking, different types of fossil fuels are not perfect substitutes. If economy i imports from economy j, while economy j exports energy type O from economy i, such that in energy value, the loss of a trade partner would require both economies to make additional investments to compensate for the energy supply losses. This issue is often addressed by introducing of the conversion efficiency, , or degree of substitutability. Thus, for any two energy types k and :
The change in energy generation and utilization technologies makes a dynamic variable whose value may change across the economies. Without loss of generality, we leave the technical details outside the scope of our paper and, in what follows, assume perfect substitutability, i.e., for ∀. In this case, and the flow of fossil fuels between any two economies i and j is equal to the sum of net flows of coal, natural gas, and oil, and Equation (10) is rewritten as:
Then, we can estimate an economy’s aggregate energy security, calculating security for individual fuels and combining those values based on the fuel shares in the total consumption share and production:
The derived aggregate indexes are able to account for the changes in consumption and production mixes. Notably, the indexes will show whether the growth in domestic production and the resulting increase in self-sufficiency is compensated or outweighed by the change in the trade flow concentration stemming from the drop of some trade-partners, e.g., for political or environmental reasons.
4.3. Illustrative Example
To develop the intuition behind the introduced security indexes and ease their comparison to the established HHI-based measures, we construct an illustrative example. Consider an economy, named A, consuming two fuels, c and g. Let there be two exporters, supplying A, called B and C. Assuming all the economies have similar political risk, we normalized it to one: . We evaluate the changes in energy security caused by the energy transition, e.g., changes in the fuel use, and the growth in the domestic production, resulting in the energy trade evolution.
Focusing on the import-oriented indexes, we calculate CSI, PSI, ESI, and HHI. We start by considering the indexes for one fuel, 1 (Table 1). The consumption of that fuel is set to be fixed ; we drop the superscript to save on notations. We distinguish four possibilities for trade and production to develop. In cases 1.1 and 1.2, economy A imports more than half of the consumed energy, whereas, in cases 1.3 and 1.4, the economy reduces its import in half, raising own energy production. In all the cases, the economy may either import the required energy from one exporter or split the export equally between B and C, but the volume of import is twice as high in the first two cases. The situation described can be associated with the developments in Germany and the U.S., reducing their natural gas imports and growing domestic energy production.

Table 1.
Energy Security indexes for economy A, the case of one fuel.
The results presented in Table 1 provide two important insights. First, we see that the HHI values have been affected only by export distribution and not by the change in the domestic production, as discussed earlier in this section. Second, ESI has the same values in cases 1.1 and 1.4, suggesting that the increase in own production balances out the loss associated with the increased import concentration. Hence, the substitution of an import flow with the own production has no impact on the security. In contrast, our CSI shows that domestic production strengthening the security of supply. The latter argument is frequently brought in political debates. Furthermore, comparing the ESI and CSI estimates, we find that both have the highest values in case 1.2 and the lowest in 1.3. Hence, we confirm IEA insights about the role of diversification and the total import size.
Next, we turn to 2 to explore the role of the energy mix and its effect on security under the energy transition. Here, we assume again that the total consumption level remains unchanged and distinguish five possible scenarios with respect to domestic production and import diversification. In cases 2.1–2.3, economy A keeps the domestic production unchanged, whereas, in cases 2.4 and 2.5, it is increased by 25%. Case 2.1 is a business-as-usual situation, with all other cases representing the situation when carbon-heavy C fuel has to be substituted by G in the consumption profile. The substitution leads to the changes in trade, i.e., introduction of or and in cases 2.2 and 2.3 accordingly. Hence, in cases 2.2 and 2.5, the economy diversifies its imports for both fuels. Case 2.4 corresponds to the situation, when the economy loses one of its trading partners and starts to import more from the remaining partner. We associate this situation with the developments in China; the country has been reducing its coal consumption, increasing natural gas use and trade.
The estimation results of all the situation reported in Table 2. Examining the multi-fuel situation, the weakness of HHI becomes even more apparent, as the index takes only two values. The ESI estimates, however, reveal some similarity to our CSI, but we first discuss the differences to make the rationing behind our modification more transparent. First of all, one may notice that the largest ESI value is assigned to case 2.1, whereas CSI reaches its maximum in case 2.2. This result implies that our security index values fuel diversification more than supply concentration. In other words, the more balanced the energy mix is, the better it is for energy security. Second, it appears that ESI is loses its sensitivity to supply diversification, as the volume of import decreases, as follows from the minor difference between the values in cases 2.4 and 2.5. In comparison, our index continues to show the benefit of the supply diversification boosted by the increased fuel variety. Lastly, CSI value in case 2.3 is lower than in 2.4, with the opposite true for EIS. Similar to the one fuel case, it highlights the greater importance of the domestic production boost over the import concentration.
Table 2.
Energy Security indexes for economy A, the case with two fuels.
Hence, we conclude with several essential insights supported by our modified indexes. First, without changes to the total consumption and production levels, fuel diversification would have a greater impact on energy security than import diversification. Second, a boost in domestic production brings more security benefits than fuel or supply diversification. Hence, the investments in renewables improve the energy security of any economy, along with the increase in domestic production of other energy sources. The transition away from coal would help improve energy security in countries, with coal outweighing other fuels in the energy mix. For instance, countries, such as China, would benefit from a more balanced consumption mix. However, reducing the equality among fuels due to the transition and witnessing new dominant fuels, such as natural gas, economies may experience worsening of their security situation. With those insights, we proceed to the empirical analysis to test and verify the usefulness of our network description and developed security indexes.
5. Results
Following the developed methodology, we start the presentation of results with the quantitative description of the INEF. We provide insights about the evolution of individual fuel and altogether fossil energy trade, paying particular attention to the changes associated with the production and consumption energy mix changes accompanying the energy transition and adoption of technologies. We discuss the global trends and country-specific developments and trends, reporting the estimates for the top 10 global economies, which are also the largest energy consumers. Then, we proceed with the results for energy security, focusing on the interplay between fuel and supply diversification and changes in energy mixes. We select the most noticeable results, keeping further observations and results in Appendix B.
5.1. Energy Transition and Trade Network Evolution
To put the observed developments into context, it is worth recalling that the world population and the global GDP continue to grow, explaining the increase in the global primary energy consumption. Although fossil energy continues to be the dominant energy source, the share of renewable and nuclear energy steadily increases. For the analyzed period of 2000–2019, RE generation has grown by ∼50%; yet, despite the accelerated installations of RE capacities, about ∼95% of energy demand is covered by fossil fuels [41]. Hence, the world increasingly relies on fossil energy, and almost 85% of it is delivered through the international trade network.
5.1.1. Flow Analysis
The compiled dataset allows us to see how the volume of energy trade has witnessed an almost 50% increase between 2000 and 2019. This trade growth has not been even across the fuels: the coal trade has risen by about 150%, natural gas—by close to 70%, whereas oil has increased by less than 30% (Figure 7). The changes in coal and natural gas trade have roughly coincided with the changes in the monetary flows. In contrast to the mild growth in trade, monetary flows associated with oil have undergone dramatic perturbations over the last two decades.
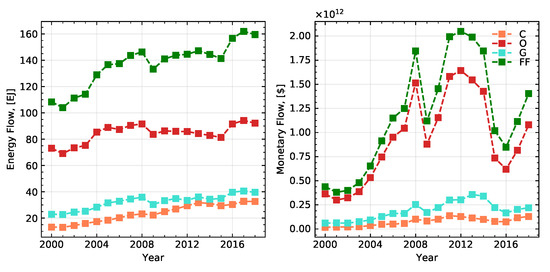
Figure 7.
The evolution of fossil fuel trade in energy (Exajoules = ) and monetary (USD ) terms.
To understand such uneven developments, we turn to the network analysis and explore the changes in the number of links and the associated flows, namely degrees and strength distributions. First, we observe that the increase in the trade volume has been accompanied by the increase in the number of economies involved (Figure A1). Yet, looking into the truncated network, applying 95% cut-off, we find that the scope of the network has hardly changed (Figure 8). However, the number of trade destinations for natural gas has increased by 55%, for coal by mere 10%, and, for oil, it went down by almost 10%.
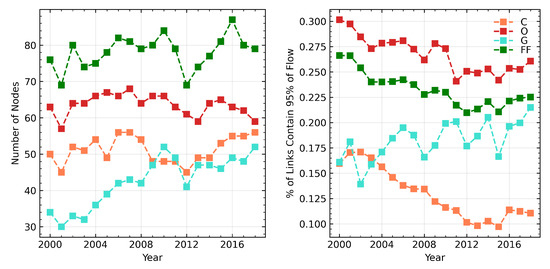
Figure 8.
Changes in the number of nodes and links accounting for 95% of INEF.
While the number of nodes for coal remained fairly stable, the percent of links responsible for the 95% of flows dramatically decreased, suggesting the market concentration related to the changes in China’s and India’s consumption, as we discuss next. The expansion of the liquified natural gas trade and the emergence of new gas spot markets stands behind the upward trend or decrease in flow concentration. Finally, we see a possible explanation for the fluctuations and the rise in oil monetary flows in the oil trade concentration, as depicted by the statistics on the links.
As marked in the methodology section, we have to check the distribution of strengths for a better understanding of the trade dynamics. We focus on the results for China (CHN), Europe (EU) and Germany (DE), the United States (USA), Russian Federation (RUS), and Australia (AUS). The results shall give us insights into whether the concentration has increased or the reduction in the number of links has led to the unification of flows. The shape of cumulative energy flow distribution has already suggested that there are only a few major players in the network (Figure 4). Investigating the changes in country strengths, we, therefore, turn to the top ten economies. We estimate and report the in- and out-strengths for the largest importers and exporters (Figure 9). The presented plots reveal that two main results. First, we find that the total energy strength distribution is driven by the oil (Figure 10) flows surpassing other fuels by volume and monetary values by far. Second, we see that oil importers have increased in size and become more homogeneous. In other words, the number of large consumers increased, and those consumers became more comparable in size. Thus, China has grown its oil consumption, while the U.S. and EU have been slowly decreasing in their demand. The changes on the export side have been less dramatic, with the exception of the emergence of a new exporter—the U.S. Such evolution in strength helps explain the oil price dynamics, highlighting the role of buyer versus seller competition.
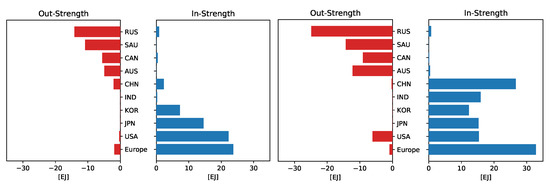
Figure 9.
The change in the fossil fuels trade concentration from 2001 (left) to 2018 (right).
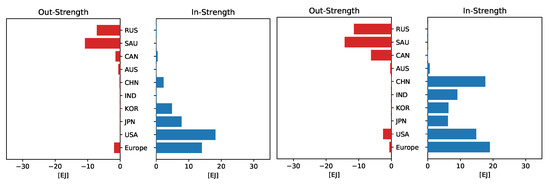
Figure 10.
The change in the oil trade concentration from 2001 (left) to 2018 (right).
Similarly, we examine the distributions and their dynamics for natural gas and coal networks. We confirm the original intuition that the development of the liquefied natural gas trade has resulted in the increased natural gas network density and connectivity (Table 3). Intensified electrification worldwide and the energy transition have contributed to the homogenization of natural gas import flows. The enhanced ability to grow domestic production, owing to the unconventional resources, has mitigated the increase in absolute strength of natural gas compared to oil. Transition away from coal for environmental reasons, such as in China and Germany, or economic, such as in the U.S., has coincided with the growth in coal power generation in Asia. As a result, both in- and out-flows have become more uniformly distributed. The densities of coal, natural gas, and oil networks decrease, fluctuate, and grow, correspondingly, with the overall the INEF density going up.
Table 3.
The evolution of networks densities for coal, natural gas, oil, and fossil fuels networks.
The concentration of oil and coal flows is often linked to their price dynamics, e.g., as discussed by Reference [42]. Yet, the energy network literature rarely includes monetary flows data. We address that weakness of the previous studies, such as Reference [6], reporting on the monetary flows associated with individual fuels, as well as the total energy trade (Figure 7). Combining the strength and degree analysis with the monetary observations, we find that the inequality in import and export are responsible for the observed monetary flow dynamics. However, the pressure or boost to the prices may also stem from the inter-fuel network developments. Thus, we highlight the reduced weights of oil flows coupled with the homogenization of imports and exports. These findings justify our equal attention to import and export concentration and consumption and production mixes in the energy security analysis.
5.1.2. Small-Worldness
Networks for different types of fossil fuels provide the grounds for the analysis of trade communities and trade structure dynamics. The characteristic feature used in such analysis is small-worldness. The higher the small-world coefficient is, the larger is the size of communities in the network and the smaller the characteristic path between them. We describe the trade evolution addressing the question on whether the developments in consumption and fuel transportation infrastructure boosted the energy integration and trade globalization. We calculate the clustering coefficients and the average path lengths for individual fuels and plot the evolution of the small-world coefficient for natural gas and coal (Figure 11).
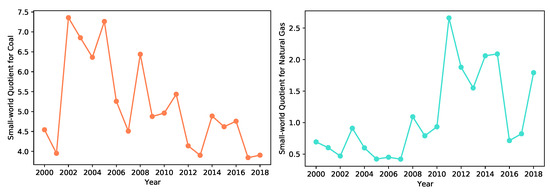
Figure 11.
The evolution of small-world coefficient for coal (left) and natural gas (right).
Figure 6 reveals that, during the considered period, small-worldness is decreasing for the fossil fuels network. This decrease is primarily driven by the developments in the coal trade. Pressure on establishing new coal trade relationships, the decrease in demand, and the removal of some destinations lead to the strengthening of distanced regional communities. At the same time, the growth of the LNG trade has turned the natural gas trading network into a small-world network with an increasing number of destinations and links. Before the LNG trade expansion, the size of communities was smaller, while the distance between them was larger when compared to the present-day natural gas network. However, this growth of the small world coefficient for the natural gas network has not compensated for the lost trading relationships in coal networks.
The network analysis helped us to reveal the following significant trends. First, we established that the number of network participants had been slowly increasing. The trade embraces almost the entire world; yet, only a small number of economies continue to hold the position of gravity centers, including China, the U.S., the European Union, India, Australia, and a few others. We revealed that the transition away from coal by the major consumers had a weakening effect the trade integration leading to increased trade regionality. The development of natural gas resources and technologies, in contrast, has led to the increased global integration and the emergence of new trade channels. Finally, we notice the redistribution in oil trade flows resulting in the unification among the major oil importers and the emergence of the U.S. as the new exporter. The homogenization in the buyer market is likely to explain the monetary flow fluctuations. With those observations, we proceed with the energy security analysis. Further details are represented in Appendix B, Table A3.
5.1.3. Energy Security Overview
To get a general picture of how energy security evolves, we start by presenting the estimated aggregate CSI and PSI indexes distributions for the entire network (Figure 12). We show the violin plots depicting the change in CSI and PSI distributions over time and allowing for their cross-comparison. Hence, the PSI and CSI help to find detect a small number of energy hubs, for instance, the Netherlands, with index values over 1. Along with that, we show the results for the HHI, calculated based on the energy and monetary flows (Figure 13).
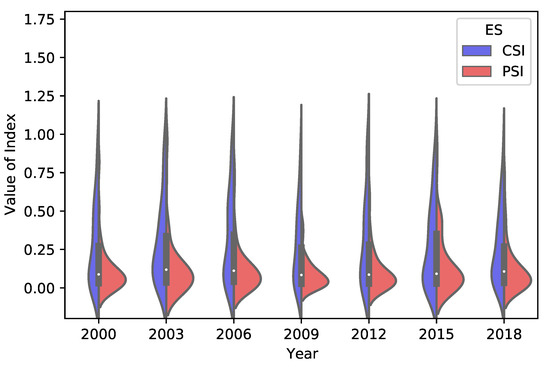
Figure 12.
Distributions of country PSI and CSI based on the aggregate fossil energy trade.
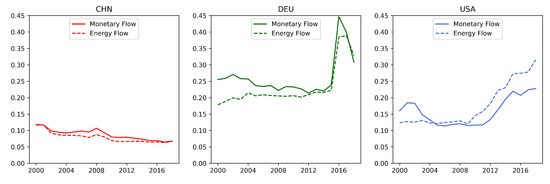
Figure 13.
The evolution of individual country HHI for the fossil energy import.
Examining the modified index estimations, we make two interesting observations. First, see that CSI has a longer distribution tail and features of a log-normal distribution. It implies that a larger number of consumers have supply-related concerns. In contrast, the smaller number of net exporters tend to be reasonably well secured with much lower exposure to supply risk. That suggests other than environmental reasons for the energy transition by the net energy importers. Thus, over the past two decades, the mean value of CSI has decreased by 7%, indicating that the overall position of energy-importing economies has improved, whereas the mean value of PSI has gone up by 13%, implying weakening of the energy-exporting economies positions. Second, we see the impact of the negative oil price drop impact on exporters’ security in 2015, which is likely to be seen in the recent COVID-19 time data once it becomes available.
Turning to HHI results, we confirm that HHI has low sensitivity to the on-going developments associated with the energy transition and changes in energy use. However, the exercise using energy and monetary flow helps to answer sometimes brought critique, showing the close correspondence in the values calculated with the two flows. For comparison, we present the HHI based on monetary and energy flows for natural gas (Figure 14). It enables us to show how the differences in price for a single type of energy are less than for all fossil fuels.
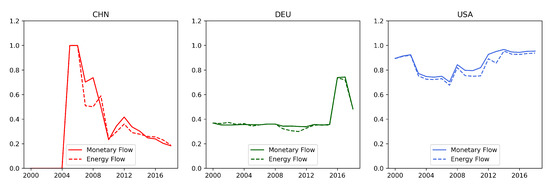
Figure 14.
The evolution of individual country HHI for natural gas.
5.1.4. Energy Security: Individual Country Analysis
To get further insights about changes in energy security, we turn to the security assessments for the largest importers and exporters, China, Europe, and the U.S. (see Figure 9). Most of the countries play either a net importer or exporter roles in the considered period of time. However, thanks to the unconventional resource production growth, the U.S. has become the net fossil fuels exporter in 2019 [1]. We use the unique opportunity and examine the U.S. security development in the course of its conversion, including the country into the set of importers and exporters.
To start our discussion, we begin with the description of the total primary energy consumption (TPEC) focusing on the shares of fossil fuels in the energy mix. Figure 15 shows how China’s TPEC has been continuously increasing, supporting its fast GDP growth. However, aggressive investments in nuclear and renewable energy, including hydro, have helped the country break the increasing trend. In addition, since 2011–2012, China has been slowly decreasing the share of fossil fuels in TPEC. In 2019, before the COVID-19 disruption, in power generation and consumption, coal accounted for 59% of China’s total energy consumption, about 1.5 percentage points down on the previous year. So, for almost a decade, China has been gradually reducing the share of coal in its energy mix and decreasing its consumption in absolute terms, too. That transition has been supported by the growing share of low-carbon and energy, including natural gas, hydro, solar, and wind, which accounted for 23% of the total energy consumption. That led to slow down the rising vulnerability in coal import, as indicated by CSI (Figure 16). The trend has been mainly supported by the transition away from coal (Figure 17 and Figure 18).
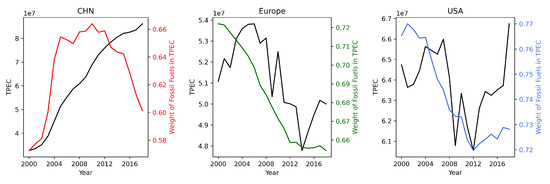
Figure 15.
The evolution of the TPEC and the share of fossil fuels in TPEC.
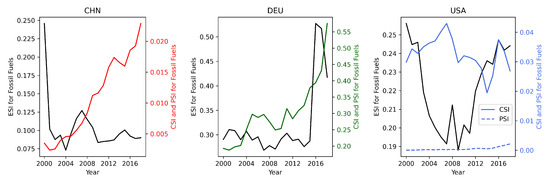
Figure 16.
Comparison of ESI and CSI dynamics.
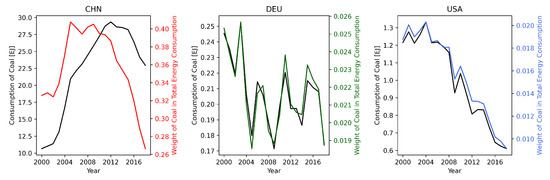
Figure 17.
The evolution of coal consumption and its share in the total energy mix.
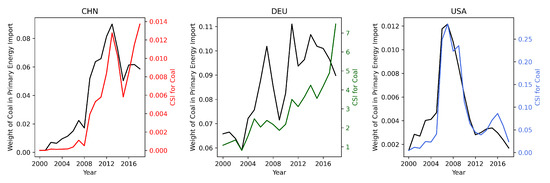
Figure 18.
The evolution of CSI for coal importers.
It is crucial for energy security analysis to recognize that the substitution of fossil fuels boosted the country’s reliance on domestic production. However, the limitations in coal use could not be compensated solely by renewable and nuclear energy production. Since 2011, China has been increasing its natural gas production, consumption, and import. In total, the dependence of China’s economy on natural gas has soared along with its security index, implying the increased exposure to supply risk (Figure 19). With a somewhat similar situation around oil, China’s aggregated energy security index is going up, confirming and explaining the concerns raised in the country’s energy transition and development strategy. Hence, our index and analysis go in line with the current observations and reflect real-world developments. In contrast, IEA’s measure has hardly captured the dynamics and cannot provide a clear explanation to the standing concerns. China’s ESI shows minor fluctuations around a relatively constant level (Figure 16).
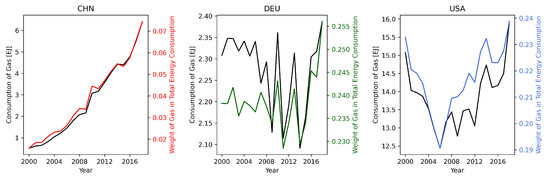
Figure 19.
The evolution of natural gas consumption and its share in the total energy mix.
Analyzing the energy mix dynamics for Europe and Germany specifically, we first confirm the widespread image of the region as the pioneer in the energy transition. Energy efficiency measures and carbon-reduction commitments, despite heterogeneity across EU-members [43], result in Europe’s decreasing TPEC and the share of fossil energy, with some weather-driven fluctuations. Import of the natural gas to Europe is going through significant changes, as well, with the growth of LNG import and decrease in volume of natural gas imported via pipeline through Ukraine [44]. Yet, looking at the transition in detail, we reveal that the electrification and the drop in domestic coal production have induced the country to import more coal, even though the total coal consumption decreased. Furthermore, substituting coal consumption, Germany has been increasing the share of natural gas in primary energy imports and consumption. Based on the insights from our illustrative example, the decrease in total domestic energy production, combined with the re-balance in the fuel consumption and import mix, translates into the increasing aggregate and individual fuel CSI (Figure 20). This result goes against the common belief that an increase in RE would inevitably lead to an improvement in energy security. Hence, our analysis informs policy-makers of the importance to account for the changes in domestic production, i.e., whether RE compensates for the lost coal production, consumption mix, monitoring for the imbalance, and shifts towards high reliance on one fuel, and supply diversification.
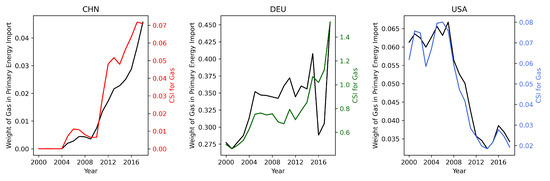
Figure 20.
The evolution of CSI for natural gas importers.
Looking into the U.S. security and energy trade dynamics, we must analyze its importer and exporter positions in parallel. Driven by resource availability and market demand, the U.S.’s use of fossil energy has undergone dramatic changes over the past two decades. At the beginning of the millennia, the country faced the depletion of economically recoverable fossil fuel resources and grew energy imports under relatively stable TPEC. After 2005, the shale revolution has enabled the country to elevate domestic energy production, surpassing the depletion of conventional fossil fuels. Thus, the surge in domestic production has led to dramatic natural gas and then oil price drops. With minimum policy support, the U.S. squeezed out coal, substituting it with natural gas. In the last few years, the drop in coal demand and flooding of the market with natural gas and oil turned the country into an exporter.
Those developments are reflected in CSI and PSI. The increase in imports in the early 2000s is captured by the increasing aggregate and individual fuel CSI. At that time, PSI has been negligible. The rise in energy-sufficiency has dropped CSI, whereas PSI has been slowly growing, reflecting the export developments. In the last years, CSI eliminating security of supply concerns from the government’s agenda. However, the expansion in exports shall soon bring increasing PSI concerns. The COVID-19 situation has demonstrated that the U.S. is already exposed to the export supply risks, calling for fuel or export destination diversification to mitigate future risks.
We shall highlight that while, for China, ESI demonstrated limited dynamics, the estimates for Germany and the U.S. appear to be misleading. In the time of the domestic production uplift, the U.S.’s ESI has fallen markedly, suggesting the security improvements, which ignore the increasing coal import exposure. In the last few years, the ESI values have been going up without indicating that the vulnerability stems from the export this time. Germany’s ESI had remained fluctuating around the same level until 2016 when the conflict with Russia led to the necessity to use other suppliers affecting the concentration component of the index. Hence, we confirm our earlier observation that ESI has limited use in the case of production mix change.
For the individual exporter analysis, we choose Russia, Australia, and the U.S., highlighting their increasing role in the INEF. Examining the coal production dynamics for those countries, observe a striking correlation with the changes in coal share in the total energy production for all the three exporters (Figure 21). As a result, the PSI dynamics mimics the change in the weight of coal in primary energy export. Thus, the increase in the coal’s share results in the increased risk and elevated PSI values (Figure 22). This linkage is only slightly broken in the case of the U.S. due to the natural gas development described above.
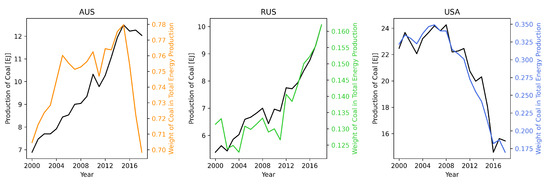
Figure 21.
The evolution of coal production and its share in the total energy mix.
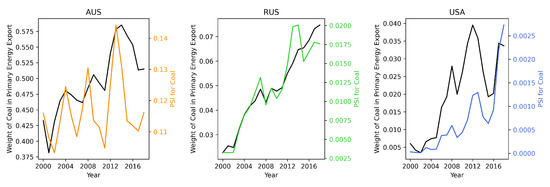
Figure 22.
The evolution of PSI for coal exporters.
The situation is quite similar for the natural gas export. The increase in resource production coincides with export growth (Figure 23 and Figure 24). Higher reliance on the trade translates into an upward trend in PSI. Some deviation can only be found in the case of Russia. Growing coal production and export to Asian and European regions surpass natural gas leading to a downward trend in the natural gas share in the total energy production. This imbalance benefits natural gas security, harming PSI for coal. Hence, the intuition used in the case of importers applies to the exporter’s risk assessment. Namely, the disproportional shift in one fuel export would translate into an increased supply, just as the overall increasing reliance on export.
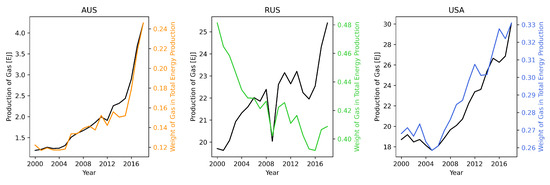
Figure 23.
The evolution of natural gas production and its share in total energy mix.
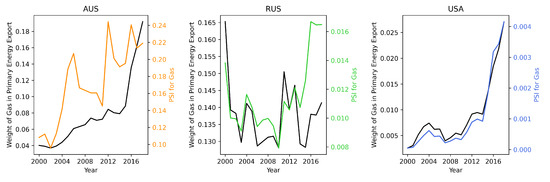
Figure 24.
The evolution of PSI for natural gas exporters.
In summary, we find that the increasing number of net energy importers adopt climate goals and implement the energy transition affecting the international trade of fossil energy. Despite the common belief that investments in RE improve countries’ energy security, we find that most countries either saw little change in their security or experience its worsening. In line with the developed intuition, we find that reduction in coal consumption shifts the balance in fuel diversification, weakening the security. The increased reliance on natural gas could have had a stronger negative impact on energy security, but the expanding LNG trade, spot trade, and entry of new exporters, such as the U.S., reduce the negative impact. Finally, we find that the growth in the global energy demand induces the major energy exporters to produce more, exposing them to supply risk. However, the symmetry in the situation with importers helps keep the global average security close to a constant level.
6. Conclusions
Motivated by the observed changes in the global and individual country energy mixes, we aimed at updating the earlier studies describing the effect of the energy transition and shifts in energy use on the international energy trade. To account for the global developments, we had to enhance previous studies, including all the fossil energy sources and all the countries with energy statistics. To embrace the complexity of the trade, we paid attention to dynamics associated with imports, as well as exports. Finally, realizing that political concerns regarding energy security often shape trade, we included it in our analysis. While we followed the existing methodology on complex network analysis for the trade network description, we found that the traditionally used Herfindahl–Hirschman Index-based security indexes are ill-suited for the transition analysis. As a result, we developed modified security indexes useful for importers and exporters alike and applicable to individual fuel analysis or aggregate energy supply description.
Our methodology for energy security analysis and the accompanying illustrative example helped us develop the intuition, which we later verified with the real data analysis. First, our indexes suggest that energy security is highly sensitive to the ability to produce energy resources domestically. Second, (import or export) supply concentration may be outweighed by the imbalance in fuel (consumption and production) mix. Third, the interplay of these three factors shall be seen in the global interdependency perspective.
In the empirical analysis, we have confirmed the importance of the increasing impact of the energy transition and new technology adoption, translating into the shifts in production and consumption mixes, on the international trade. Thanks to the most up-to-date energy data, we have been able to describe the consequences of China’s coal consumption reduction, Germany’s boost in renewable energy, and the U.S. export growth. Among the most interesting results, we revealed the homogenization among the major energy importers of oil and natural gas, and continuous regional integration. In contrast to coal, we find the tightening of the regional communities, as the increasing number of countries limits its coal trade.
We find that the transition away from coal pushes energy importers to rely more on natural gas. Countries for which this leads to a reduction in fuel diversification have a negative energy security impact. However, the regions for which this implies a transition to a more balanced fuel portfolio and/or ability to boost the domestic production strengthen their security. Hence, we reveal that RE as an instrument to increase domestic energy production improves the energy security situation, but the policies constraining the use of coal, resulting in the decrease in the total energy production and increase in the share of natural gas, shall be warned.
We see several prospective venues for future research. First, we believe that the evolution of energy communities for individual fossil fuels should be analyzed to gain further understanding of coal-related developments and discuss the issues, such as carbon leakage. Second, one shall focus on energy conversion and substitutability, accounting for the dynamics related to the introduction and adoption of new technologies. Finally, we find that further insights may be developed about the linkage between importer and exporter energy security. For further analysis, data on CO2 emissions may be also included to see the nexus between CO2 emissions and resource rent [45].
Author Contributions
Contribution of S.I.: conceptualization, methodology, validation, data curation, writing—review and editing, and supervision. Contribution of S.B.: software, formal analysis, writing—original draft preparation, and visualization. All authors have read and agreed to the published version of the manuscript.
Funding
This research received no external funding.
Data Availability Statement
In the period between of March 2020 and March 2021, the authors had a paid institutional subscription to IEA database. UNCT database is open access data.
Acknowledgments
We thank Sebastian Schwenen, Bridget Scanlon, Emery Goodman, James Henderson, participants of the Brown Bag seminar at the TUM School of Management, and researchers at the Center for Energy Economics at the Bureau of Economic Geology at the University of Texas at Austin for their helpful comments and discussions.
Conflicts of Interest
The authors declare no conflict of interest related to the presented study.
Abbreviations
The following abbreviations are used in this manuscript:
| INEF | International network of energy flows |
| IEA | International Energy Agency |
| UNCT | United Nations Commodity Trade |
| TPEC | Total primary energy consumption |
| HHI | Herfindahl–Hirschman Index |
| CSI | Consumption security index |
| PSI | Production security index |
| ESI | Energy Security index |
| TPES | Total primary energy supply |
| CHN | China |
| EU | Europe |
| DE | Germany |
| USA | the United States |
| RUS | Russian Federation |
| AUS | Australia |
Appendix A
The appendix is an optional section that can contain details and data supplemental to the main The data for the total primary energy consumption (TPEC) and energy production by type were also taken from the IEA database [4]. In the UNCT database, the volume of trade is measured both in dollars and in kilograms Table A1.
Table A1.
Used Databases and corresponding data units.
Table A1.
Used Databases and corresponding data units.
| Database | Units |
|---|---|
| UN Comtrade | kilograms; US dollars |
| IEA Gas imports by origin | Terajoules (TJ); |
| IEA World Energy Balances and statistics | Thousands of British thermal unit (MBtu) |
However, since the goal of the presented paper is to investigate the energy flow, kilograms were converted into terajoules (TJ) to have the ability to compare the amount of energy [31,46] contained in oil, natural gas and coal. For the conversion, net calorific value, which shows what amount of heat is realised by burning one kilogram of fuel, was used. In reality, depending on fuel’s type and quality net calorific values may vary significantly. Used values of net calorific values may be found in Table A2.
Table A2.
In our data source, the unit of commodities is kilogram. Net calorific value was used for every type of fuel [47]. Net calorific value shows what amount of energy is contained in one kilogram of resource.
Table A2.
In our data source, the unit of commodities is kilogram. Net calorific value was used for every type of fuel [47]. Net calorific value shows what amount of energy is contained in one kilogram of resource.
| Fuel | Net Calorific Value (MJ/kg) | Relative Error |
|---|---|---|
| Coal | 25.75 | 10% |
| Oil | 43.05 | 3% |
| Natural Gas | 45.86 | 9% |
To compare two databases (Comtrade and IEA) we sum over all imports for every economy and region that is contained in both databases for each type of fuel. This approach was also used in the paper by Gephart et al. [33]. It was revealed that UN Comtrade contains some out layers for natural gas trade which was corrected by IEA database where possible based on IEA Gas imports by origin. The largest out layers correspond to the flow between USA and Mexico for the period of 2014 to 2018. Another out layer was import of natural gas from Myanmar to China in 2016. This out layer was corrected based by BP database [3]. Due to that correction the portion of the variability in UN Comtrade database that can be explained by IEA database for natural gas has increased from 0.016 to 0.99 for export and from 0.007 to 0.96 for import. For coal and oil, the portion of variability in UN Comtrade database that can be explained by IEA database is greater than 0.97 for both: import and export. After the correction of UN Comtrade database all slope coefficients are close to 1.
Appendix B
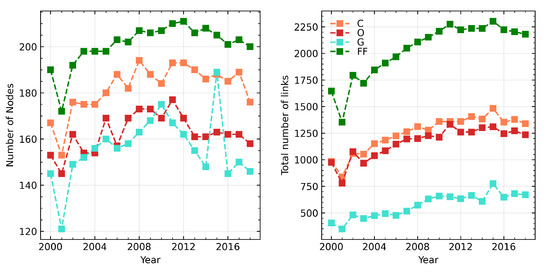
Figure A1.
The evolution of networks characteristics (number of nodes and number of links) for coal (C), oil (O), natural gas (G), and fossil fuels ().
Table A3.
The evolution of small-worldness of the INEF.
Table A3.
The evolution of small-worldness of the INEF.
| Year | |||||||||
|---|---|---|---|---|---|---|---|---|---|
| 2000 | 0.09 | 0.06 | 0.09 | 0.08 | 0.13 | 0.08 | 4.54 | 0.69 | 6.03 |
| 2010 | 0.11 | 0.07 | 0.08 | 0.10 | 0.21 | 0.07 | 4.96 | 0.93 | 6.98 |
| 2015 | 0.12 | 0.07 | 0.10 | 0.10 | 0.09 | 0.07 | 4.61 | 2.09 | 7.71 |
| 2018 | 0.11 | 0.06 | 0.09 | 0.10 | 0.10 | 0.08 | 3.90 | 1.79 | 6.88 |
References
- U.S. Energy Information Administration Monthly Energy Review. 2020. Available online: https://www.eia.gov/energyexplained/us-energy-facts/imports-and-exports.php (accessed on 12 May 2021).
- IEA. World Energy Outlook 2018; IEA: Paris, France, 2018. [Google Scholar]
- Statistical Review of World Energy 2018; British Petroleum Co.: London, UK, 2018.
- International Energy Agency. World Energy Balances; IEA: Paris, France, 2016. [Google Scholar] [CrossRef]
- Gonzalez-Salazar, M.A.; Kirsten, T.; Prchlik, L. Review of the operational flexibility and emissions of gas- and coal-fired power plants in a future with growing renewables. Renew. Sustain. Energy Rev. 2018, 82, 1497–1513. [Google Scholar] [CrossRef]
- Chen, B.; Li, J.; Wu, X.F.; Han, M.; Zeng, L.; Li, Z.; Chen, G. Global energy flows embodied in international trade: A combination of environmentally extended input—Output analysis and complex network analysis. Appl. Energy 2018, 210, 98–107. [Google Scholar] [CrossRef]
- Finley, M. Energy Security and the Energy Transition: A Classic Framework for a New Challenge; Baker Institute Report no. 11.25.19; Rice University’s Baker Institute for Public Policy: Houston, TX, USA, 2019. [Google Scholar] [CrossRef]
- Bridge, G.; Bouzarovski, S.; Bradshaw, M.; Eyre, N. Geographies of energy transition: Space, place and the low-carbon economy. Energy Policy 2013, 53, 331–340. [Google Scholar] [CrossRef]
- Kali, R.; Reyes, J. The architecture of globalization: A network approach to international economic integration. J. Int. Bus. Stud. 2007, 38, 595–620. [Google Scholar] [CrossRef]
- Zhong, W.; An, H.; Shen, L.; Dai, T.; Fang, W.; Gao, X.; Dong, D. Global pattern of the international fossil fuel trade: The evolution of communities. Energy 2017, 123, 260–270. [Google Scholar] [CrossRef]
- Gan, Y.; El-Houjeiri, H.M.; Badahdah, A.; Lu, Z.; Cai, H.; Przesmitzki, S.; Wang, M. Carbon footprint of global natural gas supplies to China. Nat. Commun. 2020, 11, 824. [Google Scholar] [CrossRef] [Green Version]
- Bernard, A.; Vielle, M. Assessment of European Union transition scenarios with a special focus on the issue of carbon leakage. Energy Econ. 2009, 31, S274–S284. [Google Scholar] [CrossRef]
- Aichele, R.; Felbermayr, G. Kyoto and Carbon Leakage: An Empirical Analysis of the Carbon Content of Bilateral Trade. Rev. Econ. Stat. 2015, 97, 104–115. [Google Scholar] [CrossRef] [Green Version]
- Zhong, W.; An, H.; Gao, X.; Sun, X. The evolution of communities in the international oil trade network. Phys. A Stat. Mech. Its Appl. 2014, 413, 42–52. [Google Scholar] [CrossRef]
- Jamasb, T.; Pollitt, M. Security of supply and regulation of energy networks. Energy Policy 2008, 36, 4584–4589. [Google Scholar] [CrossRef]
- Sovacool, B.K. Evaluating energy security in the Asia pacific: Towards a more comprehensive approach. Energy Policy 2011, 39, 7472–7479. [Google Scholar] [CrossRef]
- Kruyt, B.; van Vuuren, D.; de Vries, H.; Groenenberg, H. Indicators for energy security. Energy Policy 2009, 37, 2166–2181. [Google Scholar] [CrossRef]
- An, H.; Zhong, W.; Chen, Y.; Li, H.; Gao, X. Features and evolution of international crude oil trade relationships: A trading-based network analysis. Energy 2014, 74, 254–259. [Google Scholar] [CrossRef]
- Gao, C.; Sun, M.; Shen, B. Features and evolution of international fossil energy trade relationships: A weighted multilayer network analysis. Appl. Energy 2015, 156, 542–554. [Google Scholar] [CrossRef]
- Chen, Z.; An, H.; Gao, X.; Li, H.; Hao, X. Competition pattern of the global liquefied natural gas (LNG) trade by network analysis. J. Nat. Gas Sci. Eng. 2016, 33, 769–776. [Google Scholar] [CrossRef]
- Vivoda, V. Diversification of oil import sources and energy security: A key strategy or an elusive objective? Energy Policy 2009, 37, 4615–4623. [Google Scholar] [CrossRef]
- Hughes, L. The four ‘R’s of energy security. Energy Policy 2009, 37, 2459–2461. [Google Scholar] [CrossRef]
- Sovacool, B.K. An international assessment of energy security performance. Ecol. Econ. 2013, 88, 148–158. [Google Scholar] [CrossRef]
- Podbregar, I.; Šimić, G.; Radovanović, M.; Filipović, S.; Šprajc, P. International Energy Security Risk Index—Analysis of the Methodological Settings. Energies 2020, 13, 3234. [Google Scholar] [CrossRef]
- Narula, K.; Reddy, B.S. Three blind men and an elephant: The case of energy indices to measure energy security and energy sustainability. Energy 2015, 80, 148–158. [Google Scholar] [CrossRef]
- Gasser, P. A review on energy security indices to compare country performances. Energy Policy 2020, 139, 111339. [Google Scholar] [CrossRef]
- Azzuni, A.; Breyer, C. Global Energy Security Index and Its Application on National Level. Energies 2020, 13, 2502. [Google Scholar] [CrossRef]
- Sadik-Zada, E.R.; Loewenstein, W. Drivers of CO2-Emissions in Fossil Fuel Abundant Settings: (Pooled) Mean Group and Nonparametric Panel Analyses. Energies 2020, 13, 3956. [Google Scholar] [CrossRef]
- Sadik-Zada, E.R.; Gatto, A. The puzzle of greenhouse gas footprints of oil abundance. Socio-Econ. Plan. Sci. 2021, 75, 100936. [Google Scholar] [CrossRef]
- Ross, M.L. What do we know about export diversification in oil-producing countries? Extr. Ind. Soc. 2019, 6, 792–806. [Google Scholar] [CrossRef]
- Hao, X.; An, H.; Qi, H.; Gao, X. Evolution of the exergy flow network embodied in the global fossil energy trade: Based on complex network. Appl. Energy 2016, 162, 1515–1522. [Google Scholar] [CrossRef]
- United Nations Comtrade Database. Available online: https://comtrade.un.org/data (accessed on 1 May 2021).
- Gephart, J.A.; Pace, M.L. Structure and evolution of the global seafood trade network. Environ. Res. Lett. 2015, 10, 125014. [Google Scholar] [CrossRef] [Green Version]
- Watts, D.J.; Strogatz, S.H. Collective dynamics of ‘small-world’ networks. Nature 1998, 393, 440–442. [Google Scholar] [CrossRef]
- Humphries, M.D.; Gurney, K. Network ‘Small-World-Ness’: A Quantitative Method for Determining Canonical Network Equivalence. PLoS ONE 2008, 3, e0002051. [Google Scholar] [CrossRef] [PubMed]
- Peng, G.S.; Tan, S.Y.; Wu, J.; Holme, P. Trade-offs between robustness and small-world effect in complex networks. Sci. Rep. 2016, 6, 37317. [Google Scholar] [CrossRef]
- Asia Pacific Energy Research Centre (APERC). A Quest for Energy Security in the 21st Century; Institute of Energy Economics: Japan, Tokyo, 2007. [Google Scholar]
- Sadik-Zada, E.R.; Ferrari, M. Environmental Policy Stringency, Technical Progress and Pollution Haven Hypothesis. Sustainability 2020, 12, 3880. [Google Scholar] [CrossRef]
- Ikonnikova, S.; Zwart, G.T. Trade quotas and buyer power, with an application to the e.u. natural gas market. J. Eur. Econ. Assoc. 2014, 12, 177–199. [Google Scholar] [CrossRef]
- Katzman, K. Report RS20871: Iran Sanctions. 2021. Available online: https://fas.org/sgp/crs/mideast/RS20871.pdf (accessed on 7 July 2012).
- BP Statistical Review of World Energy 2019. Available online: https://www.bp.com/en/global/corporate/energy-economics/statistical-review-of-world-energy (accessed on 7 July 2012).
- Fattouh, B. The drivers of oil prices: The usefulness and limitations of non-structural models, supply-demand frameworks, and informal approaches. EIB Pap. 2007, 12, 128–156. [Google Scholar]
- Włodarczyk, B.; Firoiu, D.; Ionescu, G.H.; Ghiocel, F.; Szturo, M.; Markowski, L. Assessing the Sustainable Development and Renewable Energy Sources Relationship in EU Countries. Energies 2021, 14, 2323. [Google Scholar] [CrossRef]
- Božić, F.; Karasalihović Sedlar, D.; Smajla, I.; Ivančić, I. Analysis of Changes in Natural Gas Physical Flows for Europe via Ukraine in 2020. Energies 2021, 14, 5175. [Google Scholar] [CrossRef]
- Bekun, F.V.; Alola, A.A.; Sarkodie, S.A. Toward a sustainable environment: Nexus between CO2 emissions, resource rent, renewable and nonrenewable energy in 16-EU countries. Sci. Total. Environ. 2019, 657, 1023–1029. [Google Scholar] [CrossRef]
- United Nations Energy Statistics Yearbook 2017. Available online: https://unstats.un.org/unsd/energystats/pubs/yearbook/2017/07umc.pdf (accessed on 7 July 2012).
- International Energy Agency. Key World Energy Statistics. 2020. Available online: https://www.iea.org/reports/key-world-energy-statistics-2020 (accessed on 7 July 2012).
Publisher’s Note: MDPI stays neutral with regard to jurisdictional claims in published maps and institutional affiliations. |
© 2021 by the authors. Licensee MDPI, Basel, Switzerland. This article is an open access article distributed under the terms and conditions of the Creative Commons Attribution (CC BY) license (https://creativecommons.org/licenses/by/4.0/).