
Model Based Generation Prediction of SPV Power Plant Due to Weather Stressed Soiling


 ,
,  ,
,
Abstract
:1. Introduction
2. Methods
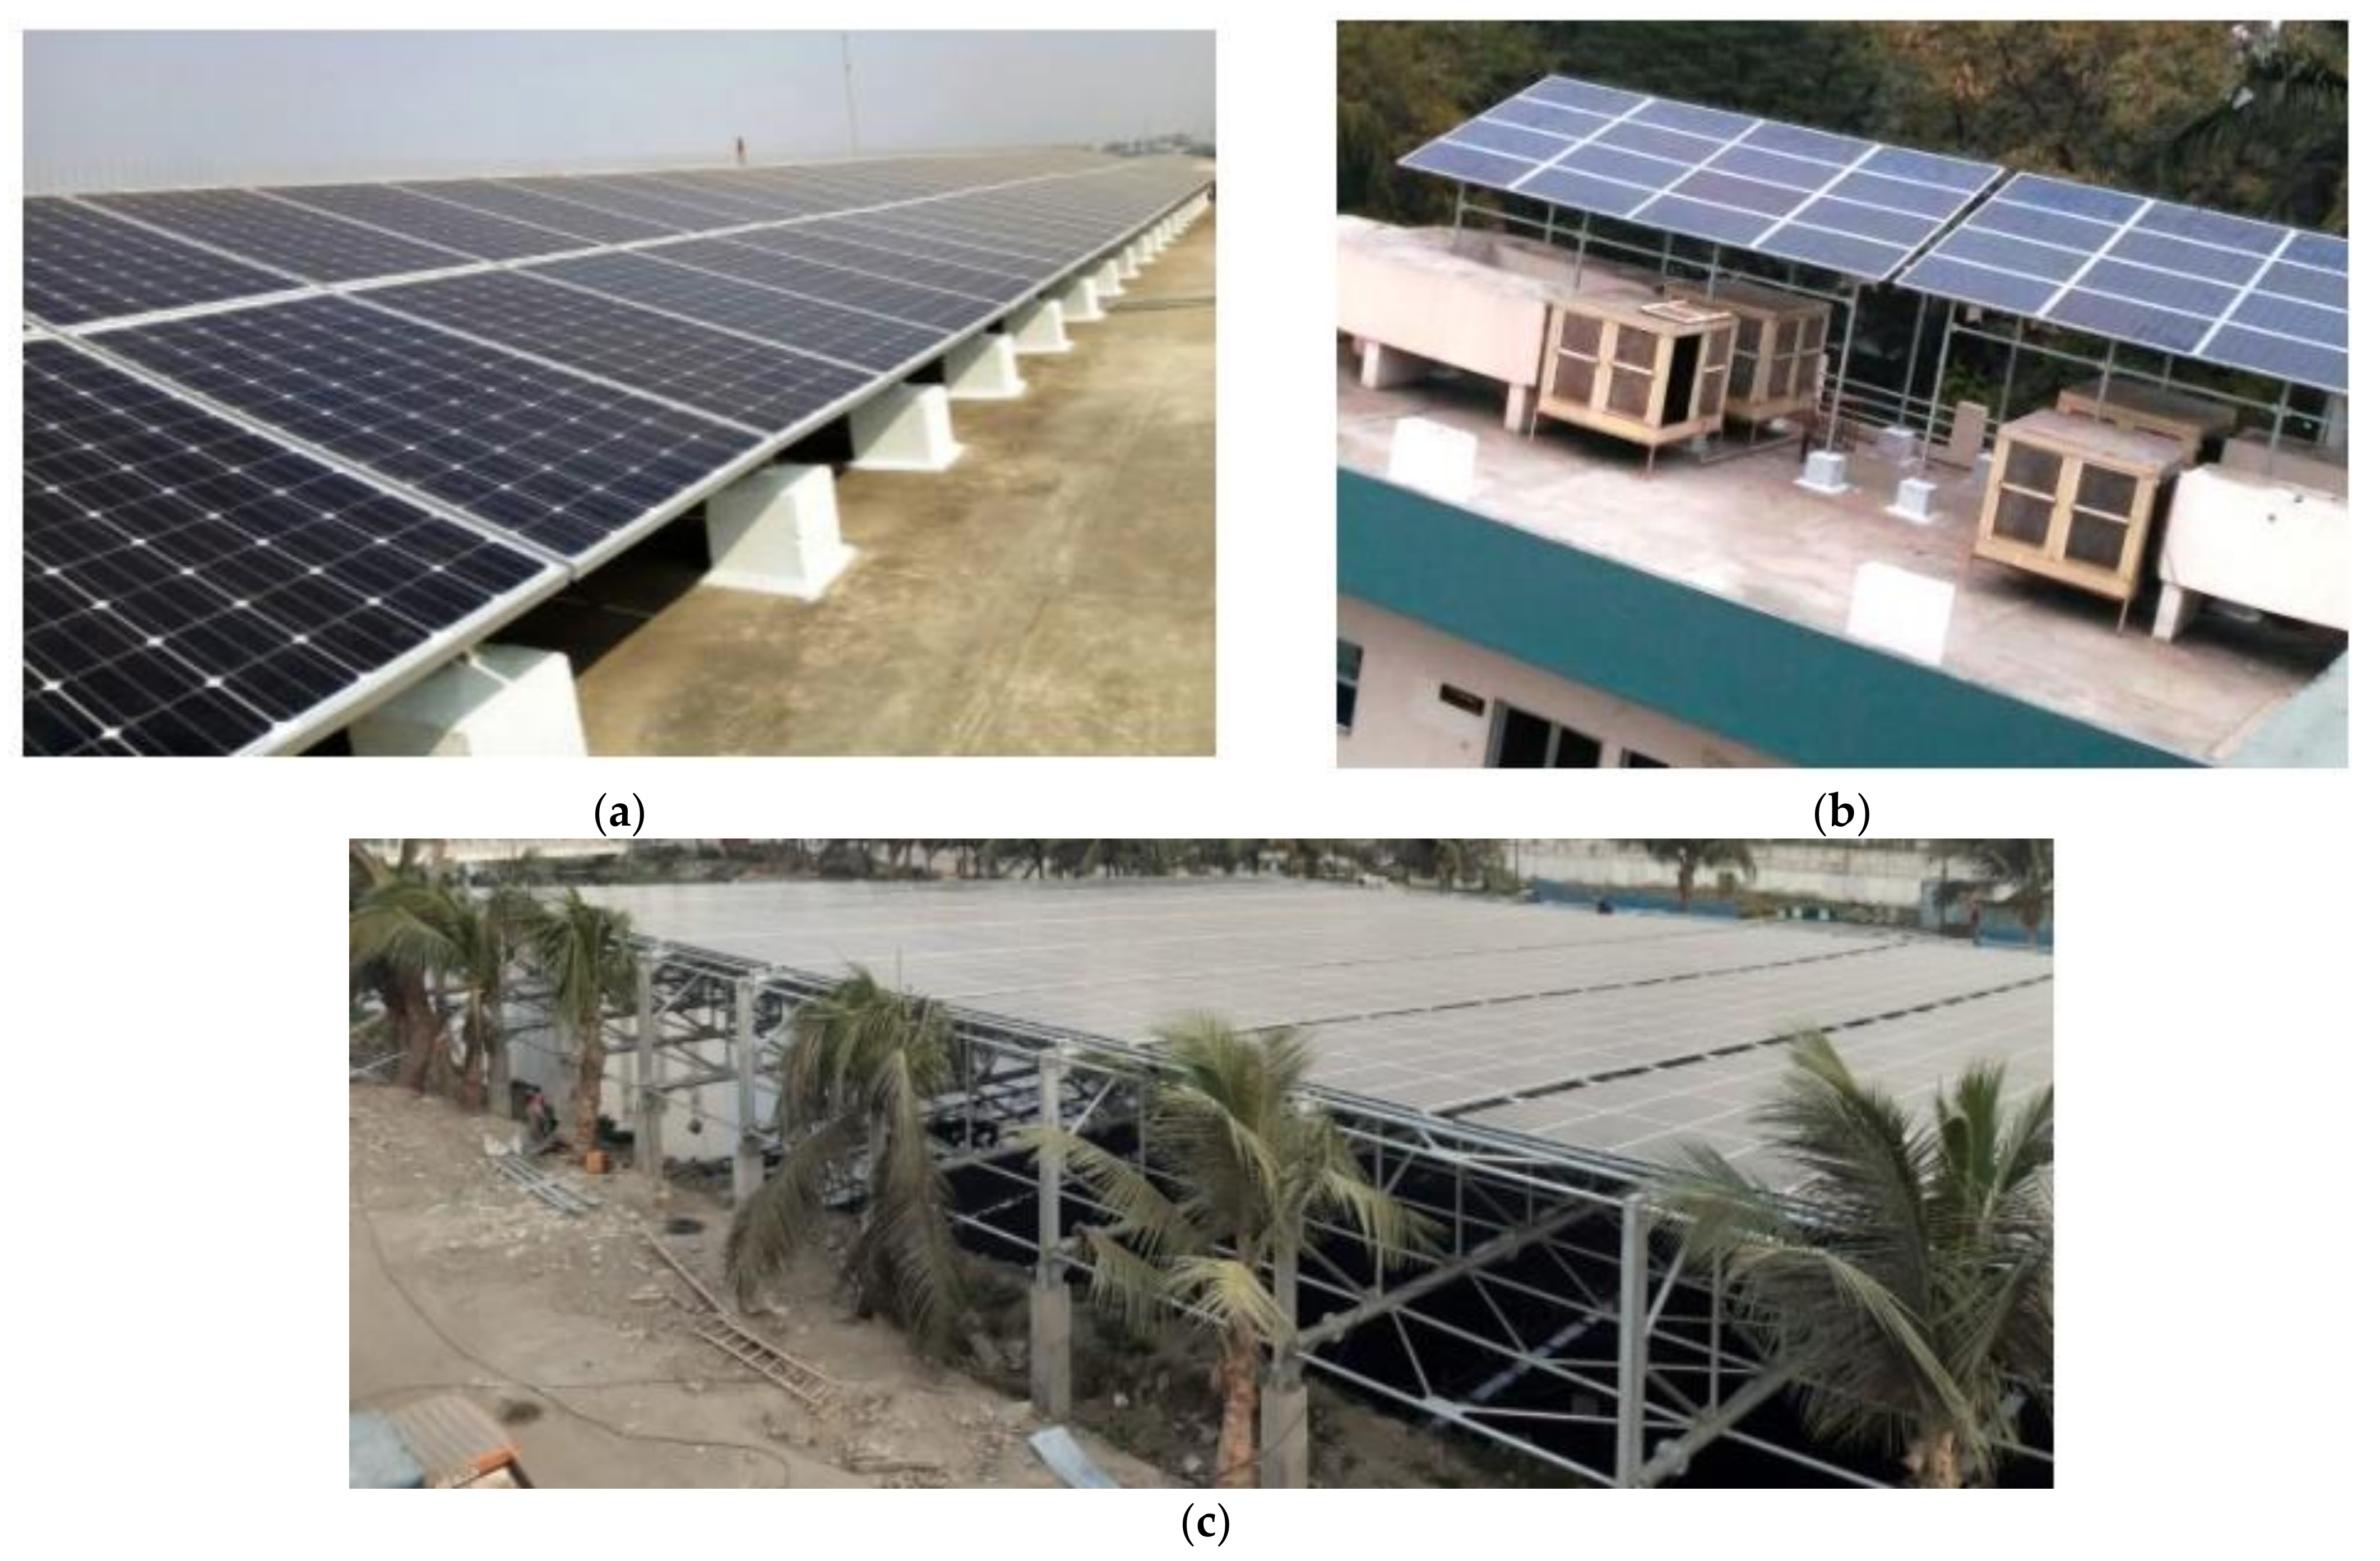
3. PV Plant Details
4. Results and Discussion
4.1. Validation of Model with and without Soiling Effect
4.2. Validationof the Model for Composite Climate Condition
4.3. Validation of Model for Different Locations and Different Capacity
4.4. Generation Prediction and Its Validation by Model
5. Conclusions
- (a)
- A model has been formulated for energy generation considering composite weather parameters and validated for four different SPV plants.
- (b)
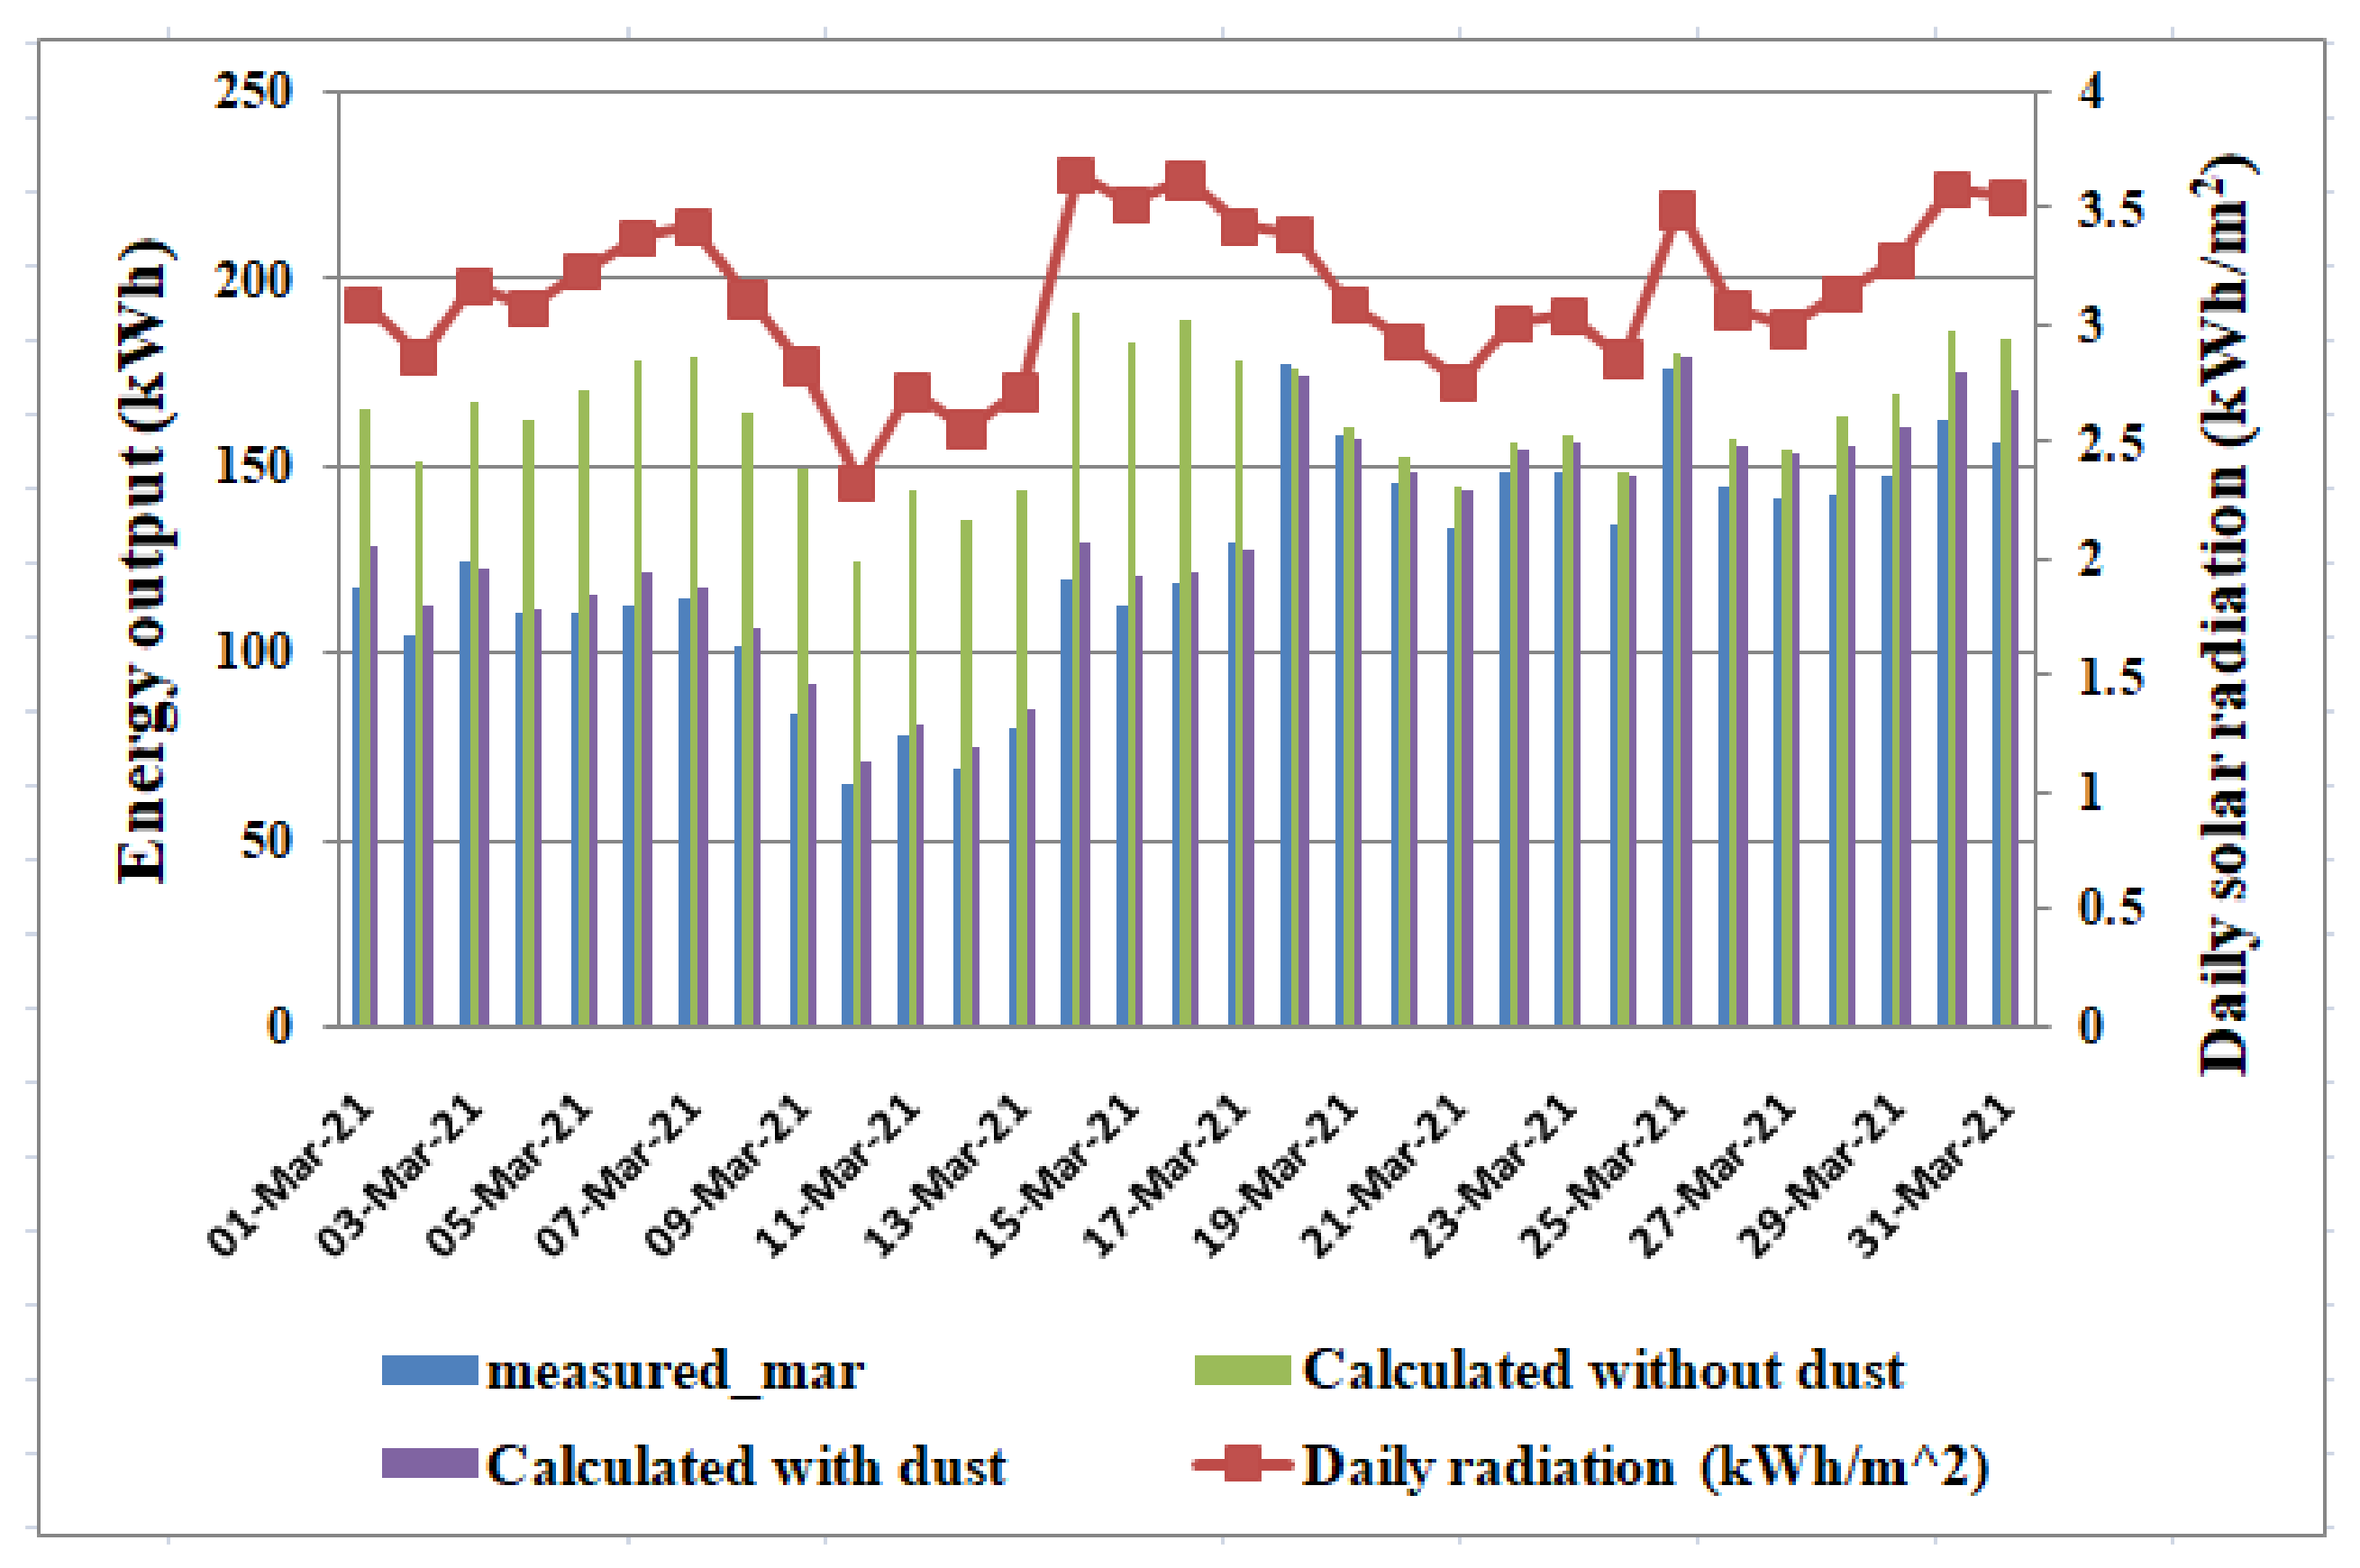
- The generation loss calculated from field data reaches upto ~50% (Figure 6) which is sufficiently high. For the same radiation ~3.08 kWh/m2, on 4 March 2021 the generation loss is 32.2% which comes down to 8.15% on 26 March 2021 after cleaning (Figure 5 and Figure 6). This establishes the effect of cleaning.
- (c)
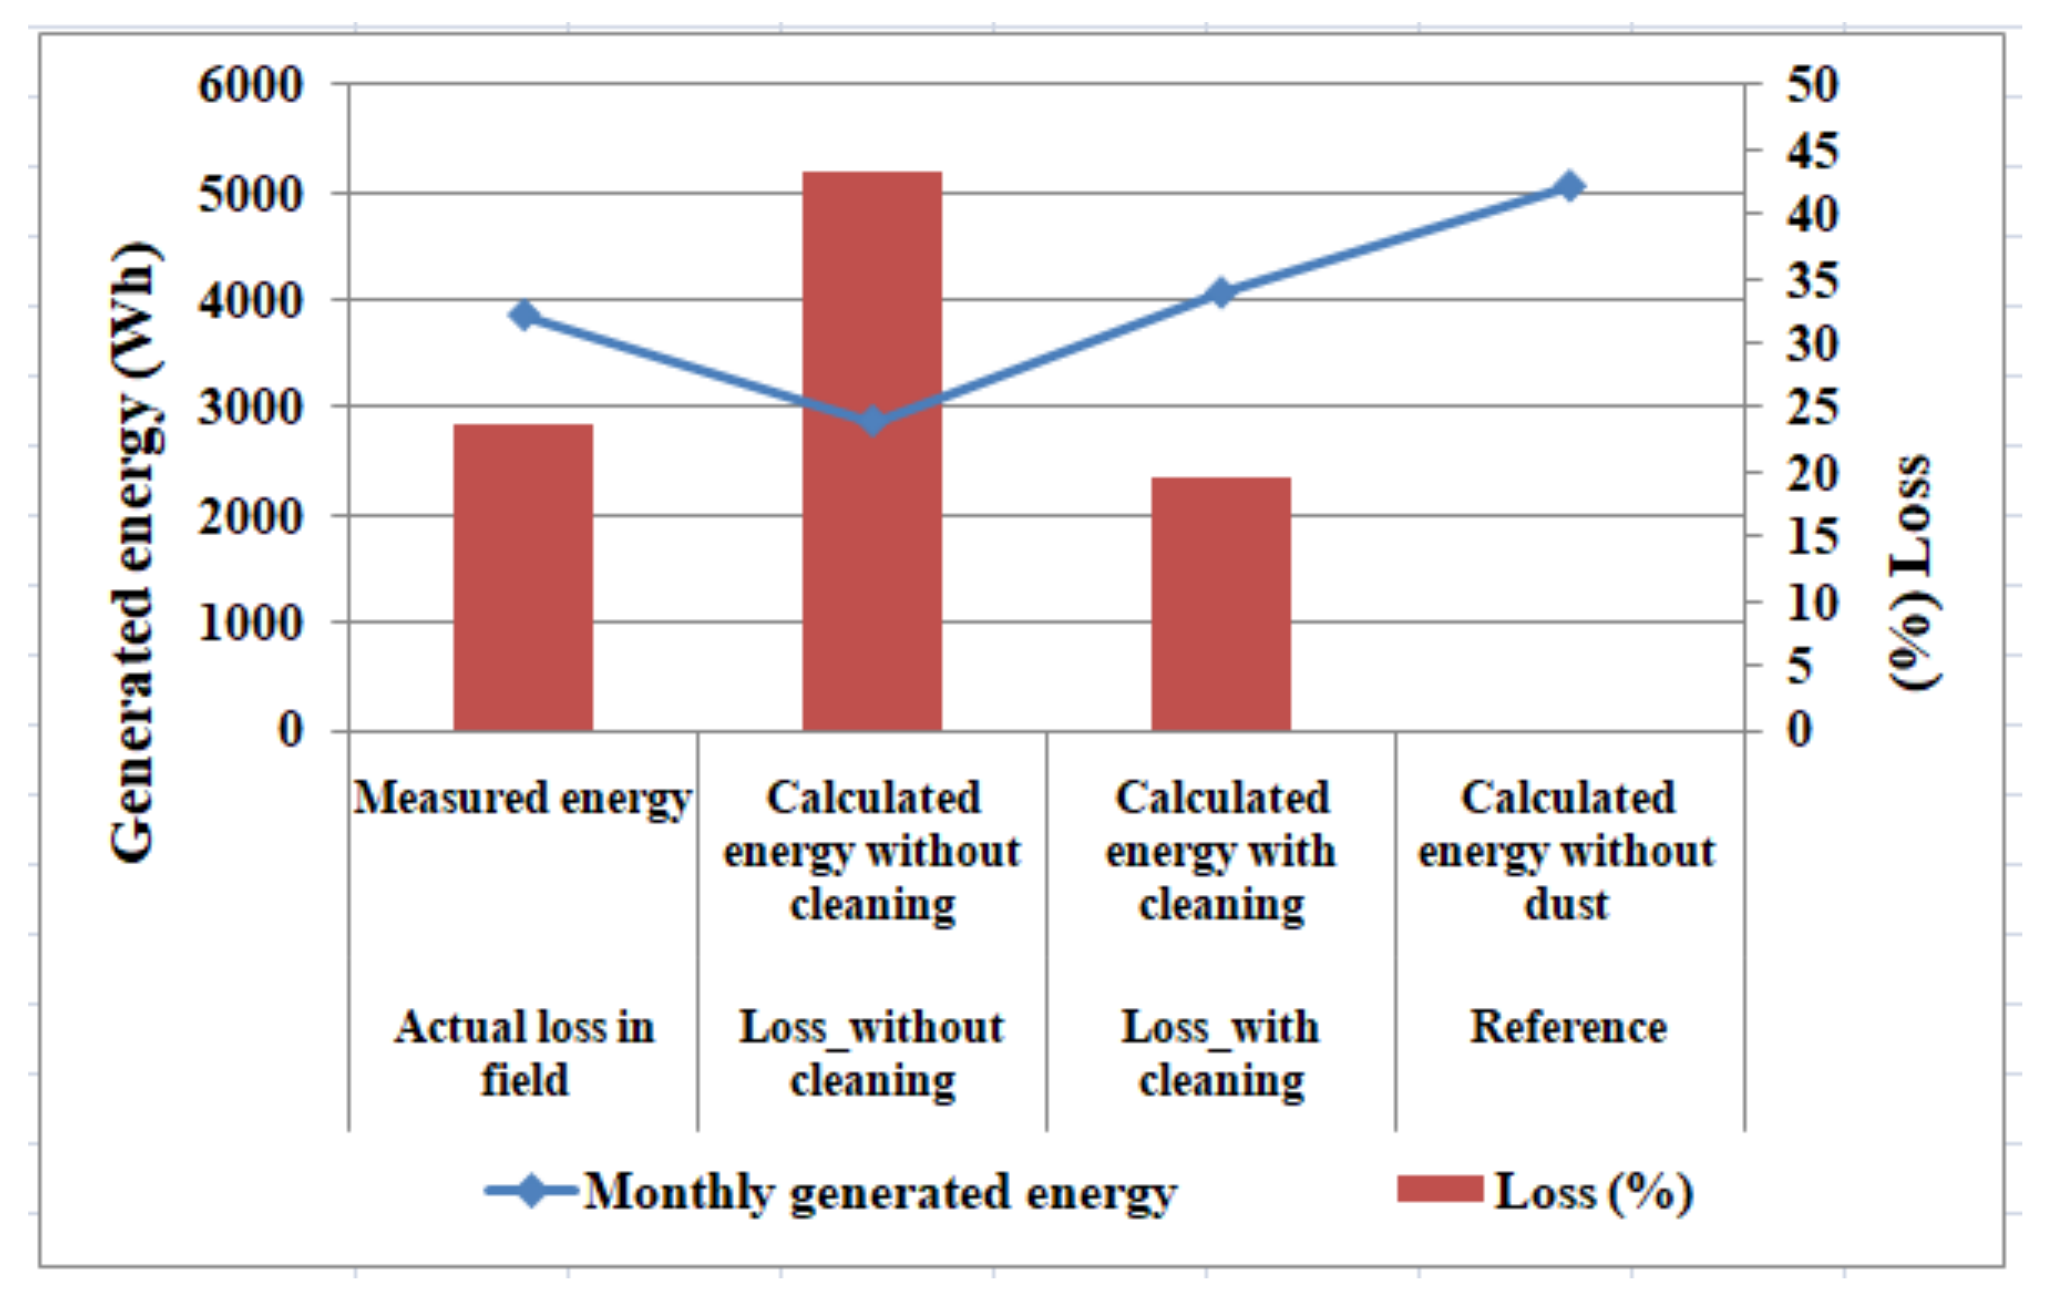
- Validation of the model with and without soiling effects is carried out for RBI, Kolkata, SPV plant. Figure 7 demonstrates that the soiling loss is calculated as 43.3% for no cleaning over the month and 19.7% with one time cleaning for the same period. The field condition loss comes out to be 23.7% with one time cleaning. The model based assessment is well comparable with the field value.
- (d)
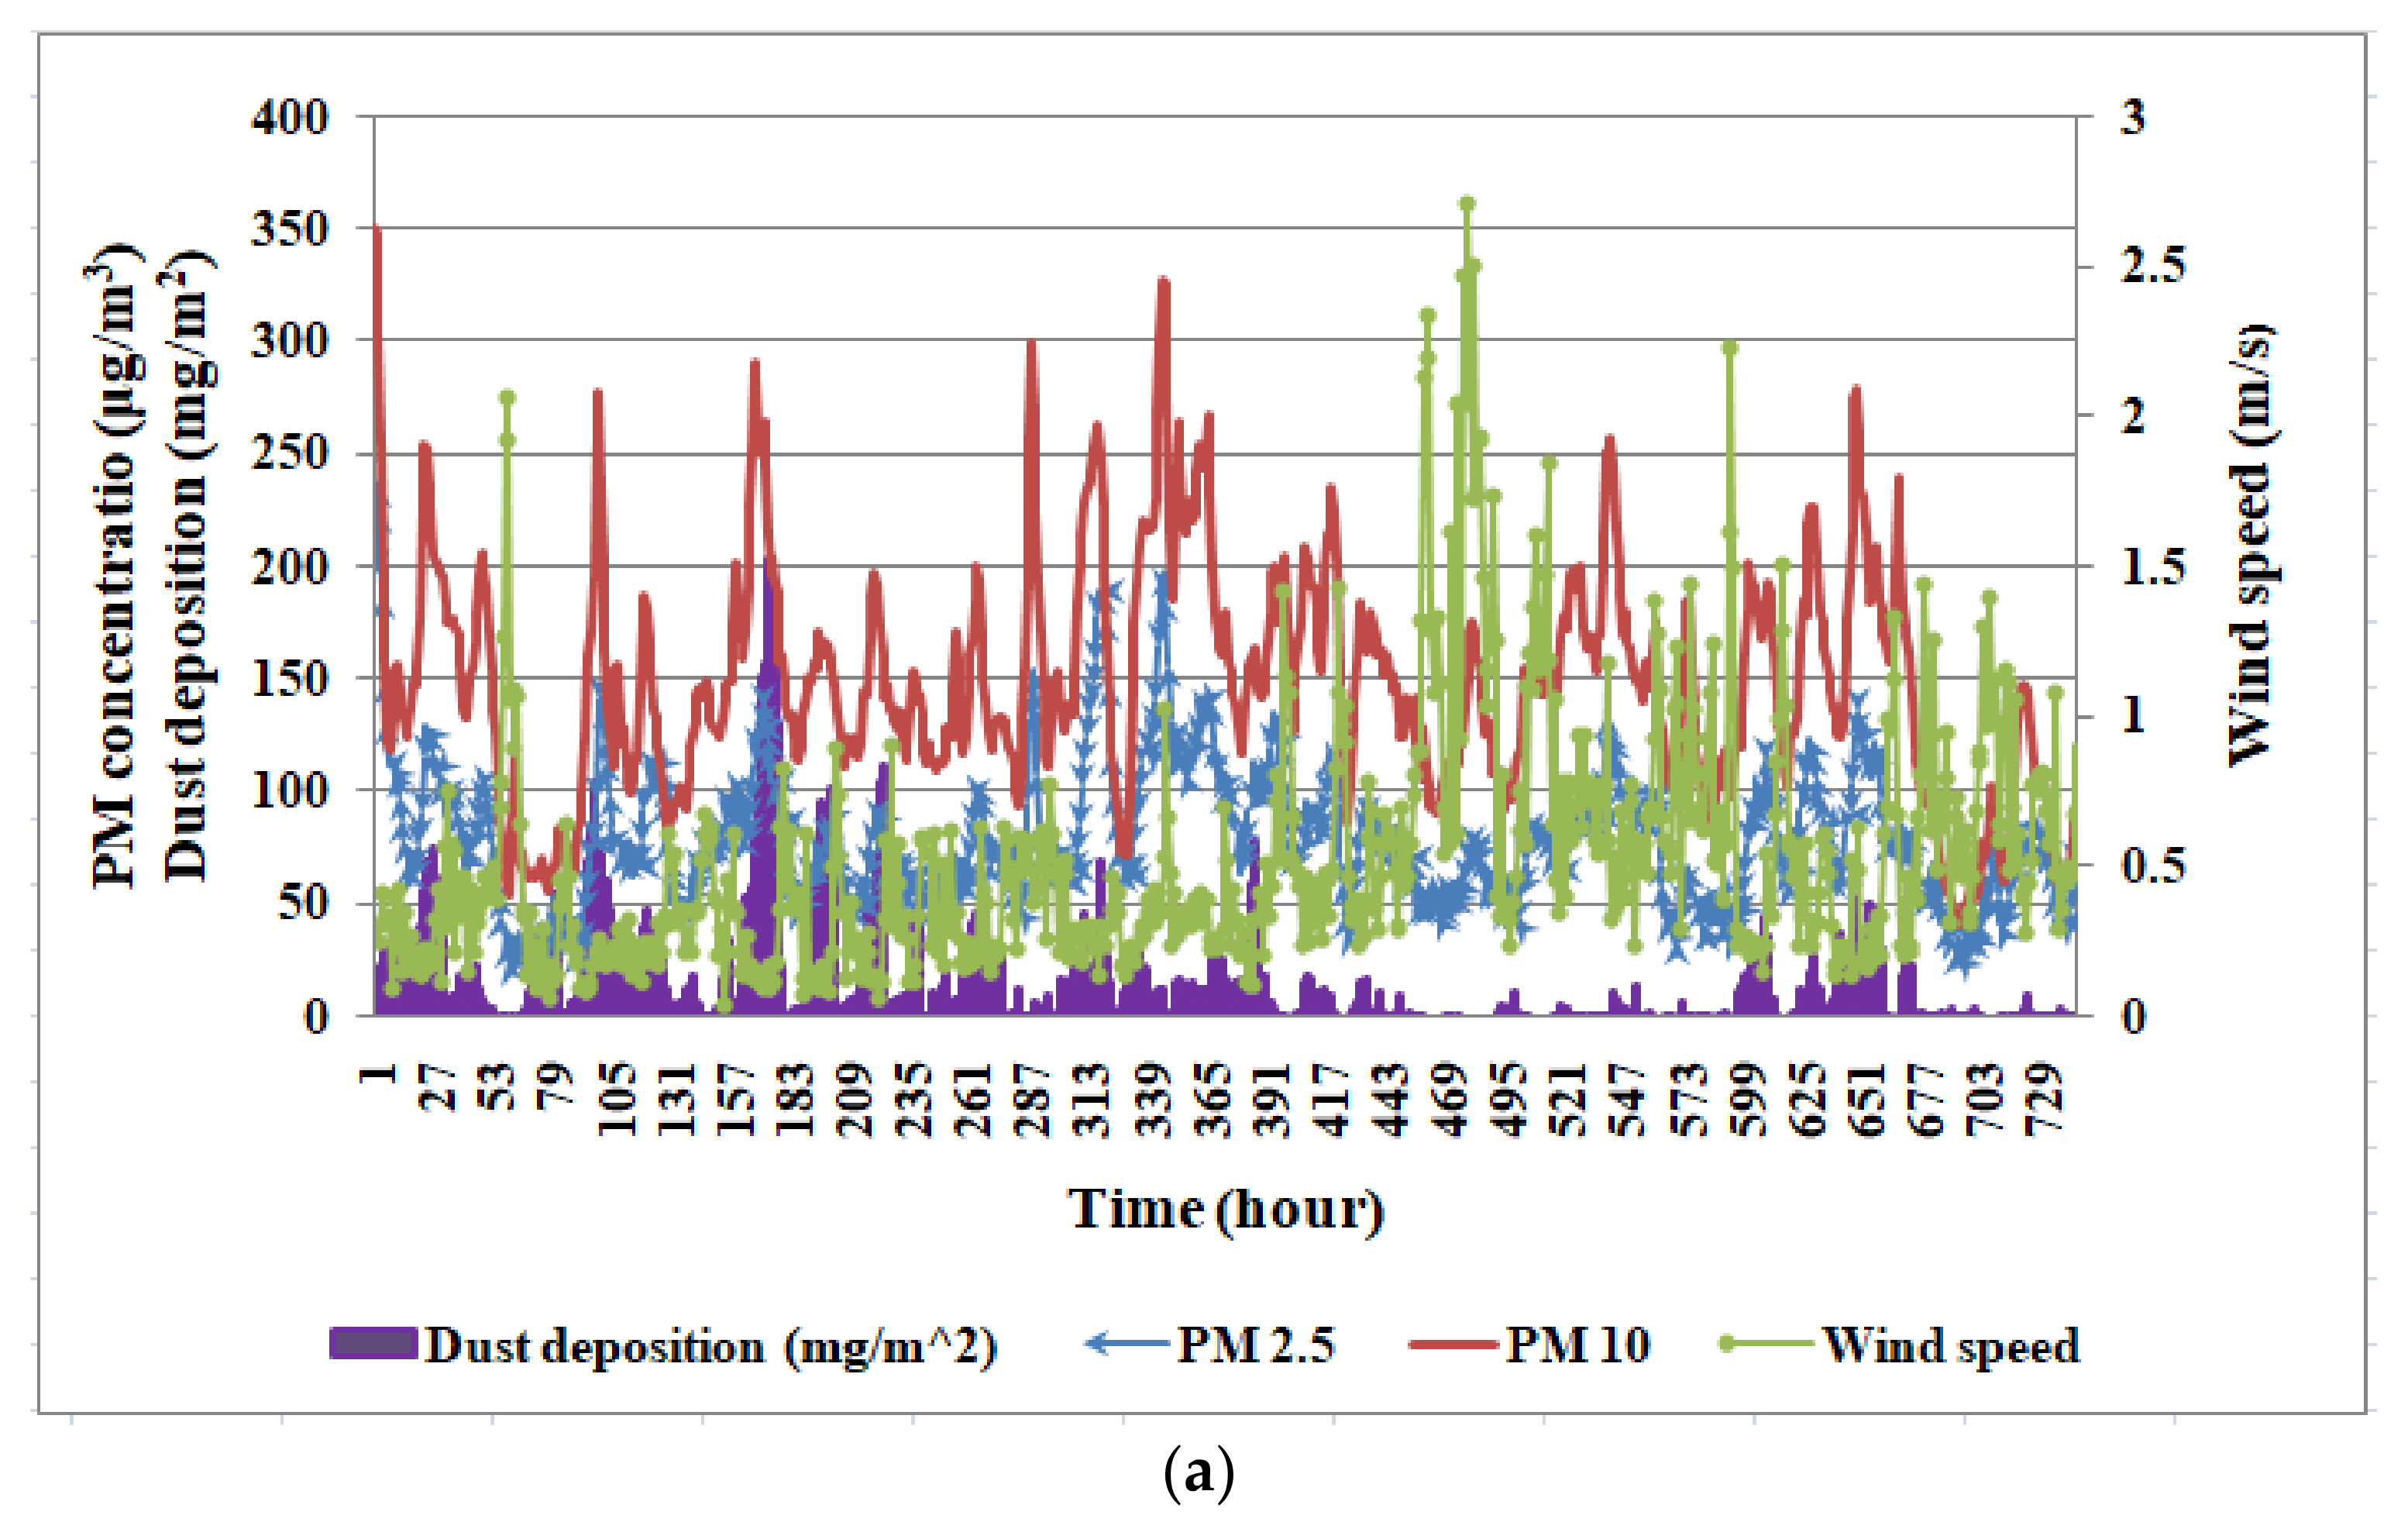
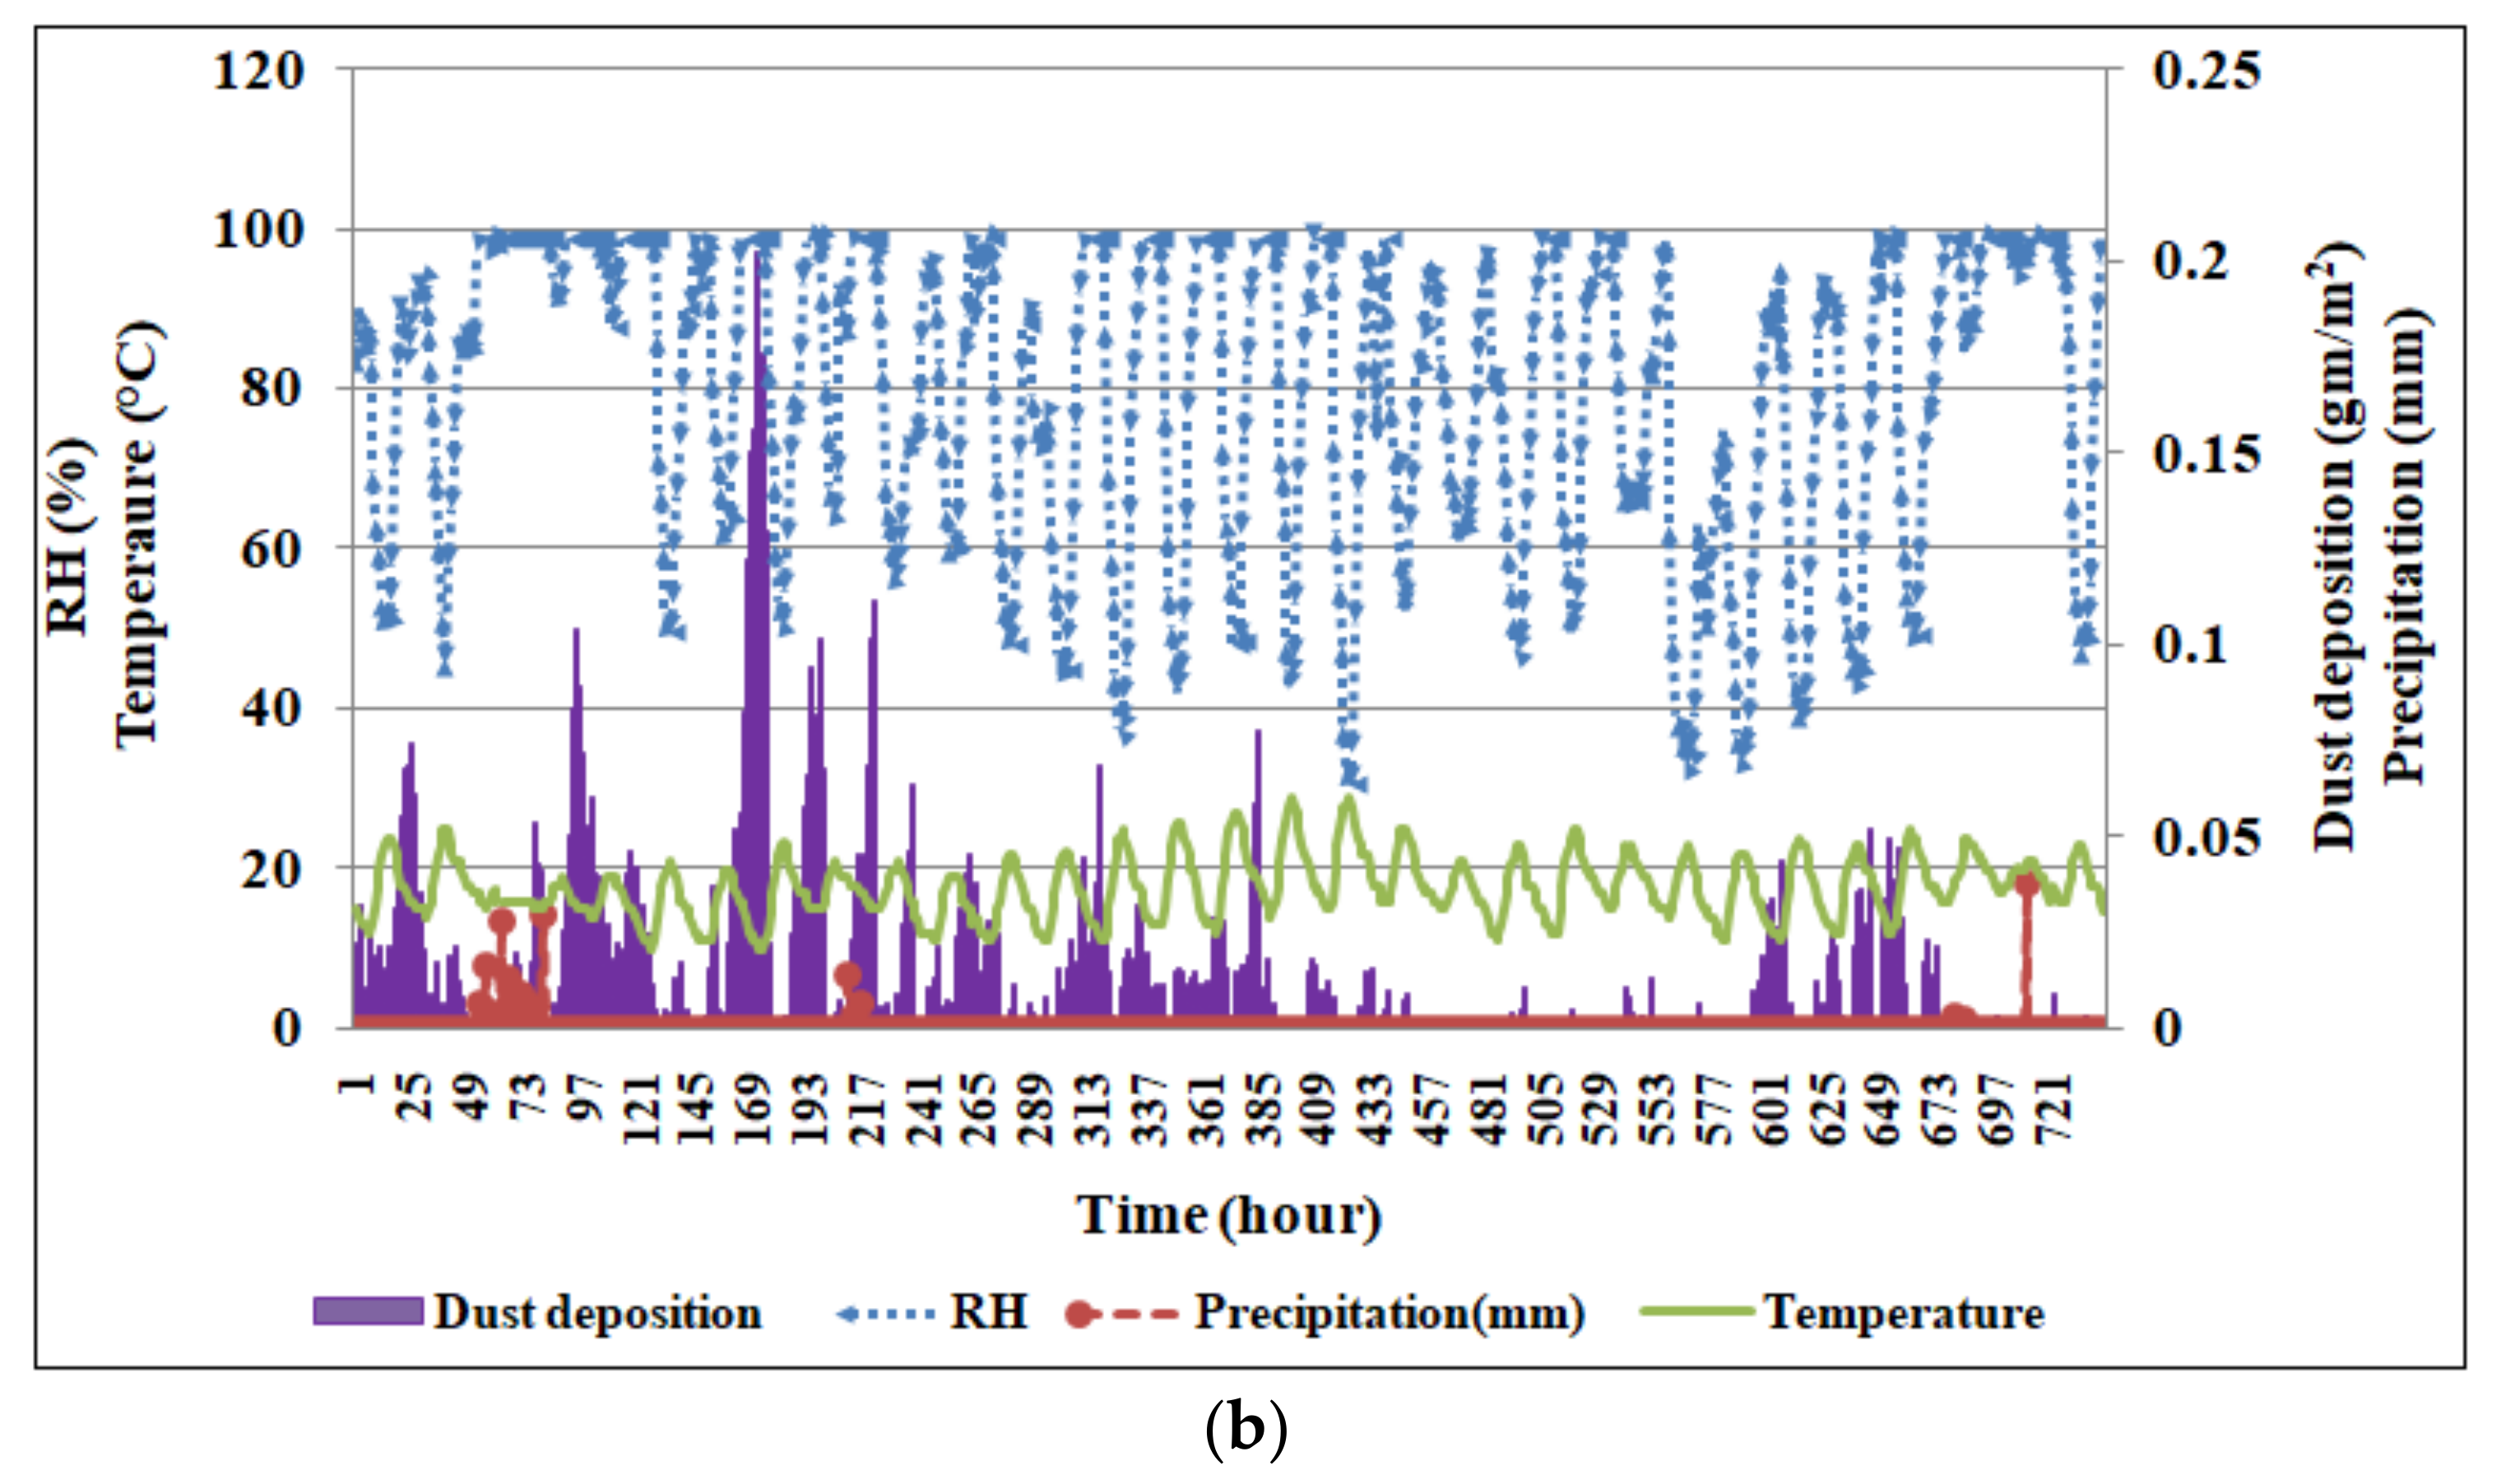
- Expected dust accumulation variation with different climatic conditions e.g., effect of no rain, high wind speed, natural cleaning, soiling due to drizzling, all are established with the model based calculation for another plant at NKDA, Rajarhat, Kolkata for one month (Figure 8a,b).
- (e)
- In the next step of validation, this model is used to calculate reduced generation for dust accumulation for three plants at different locations with different capacities (Figure 9) which shows monthly average loss for those plants ranges from 5–12%.
- (f)
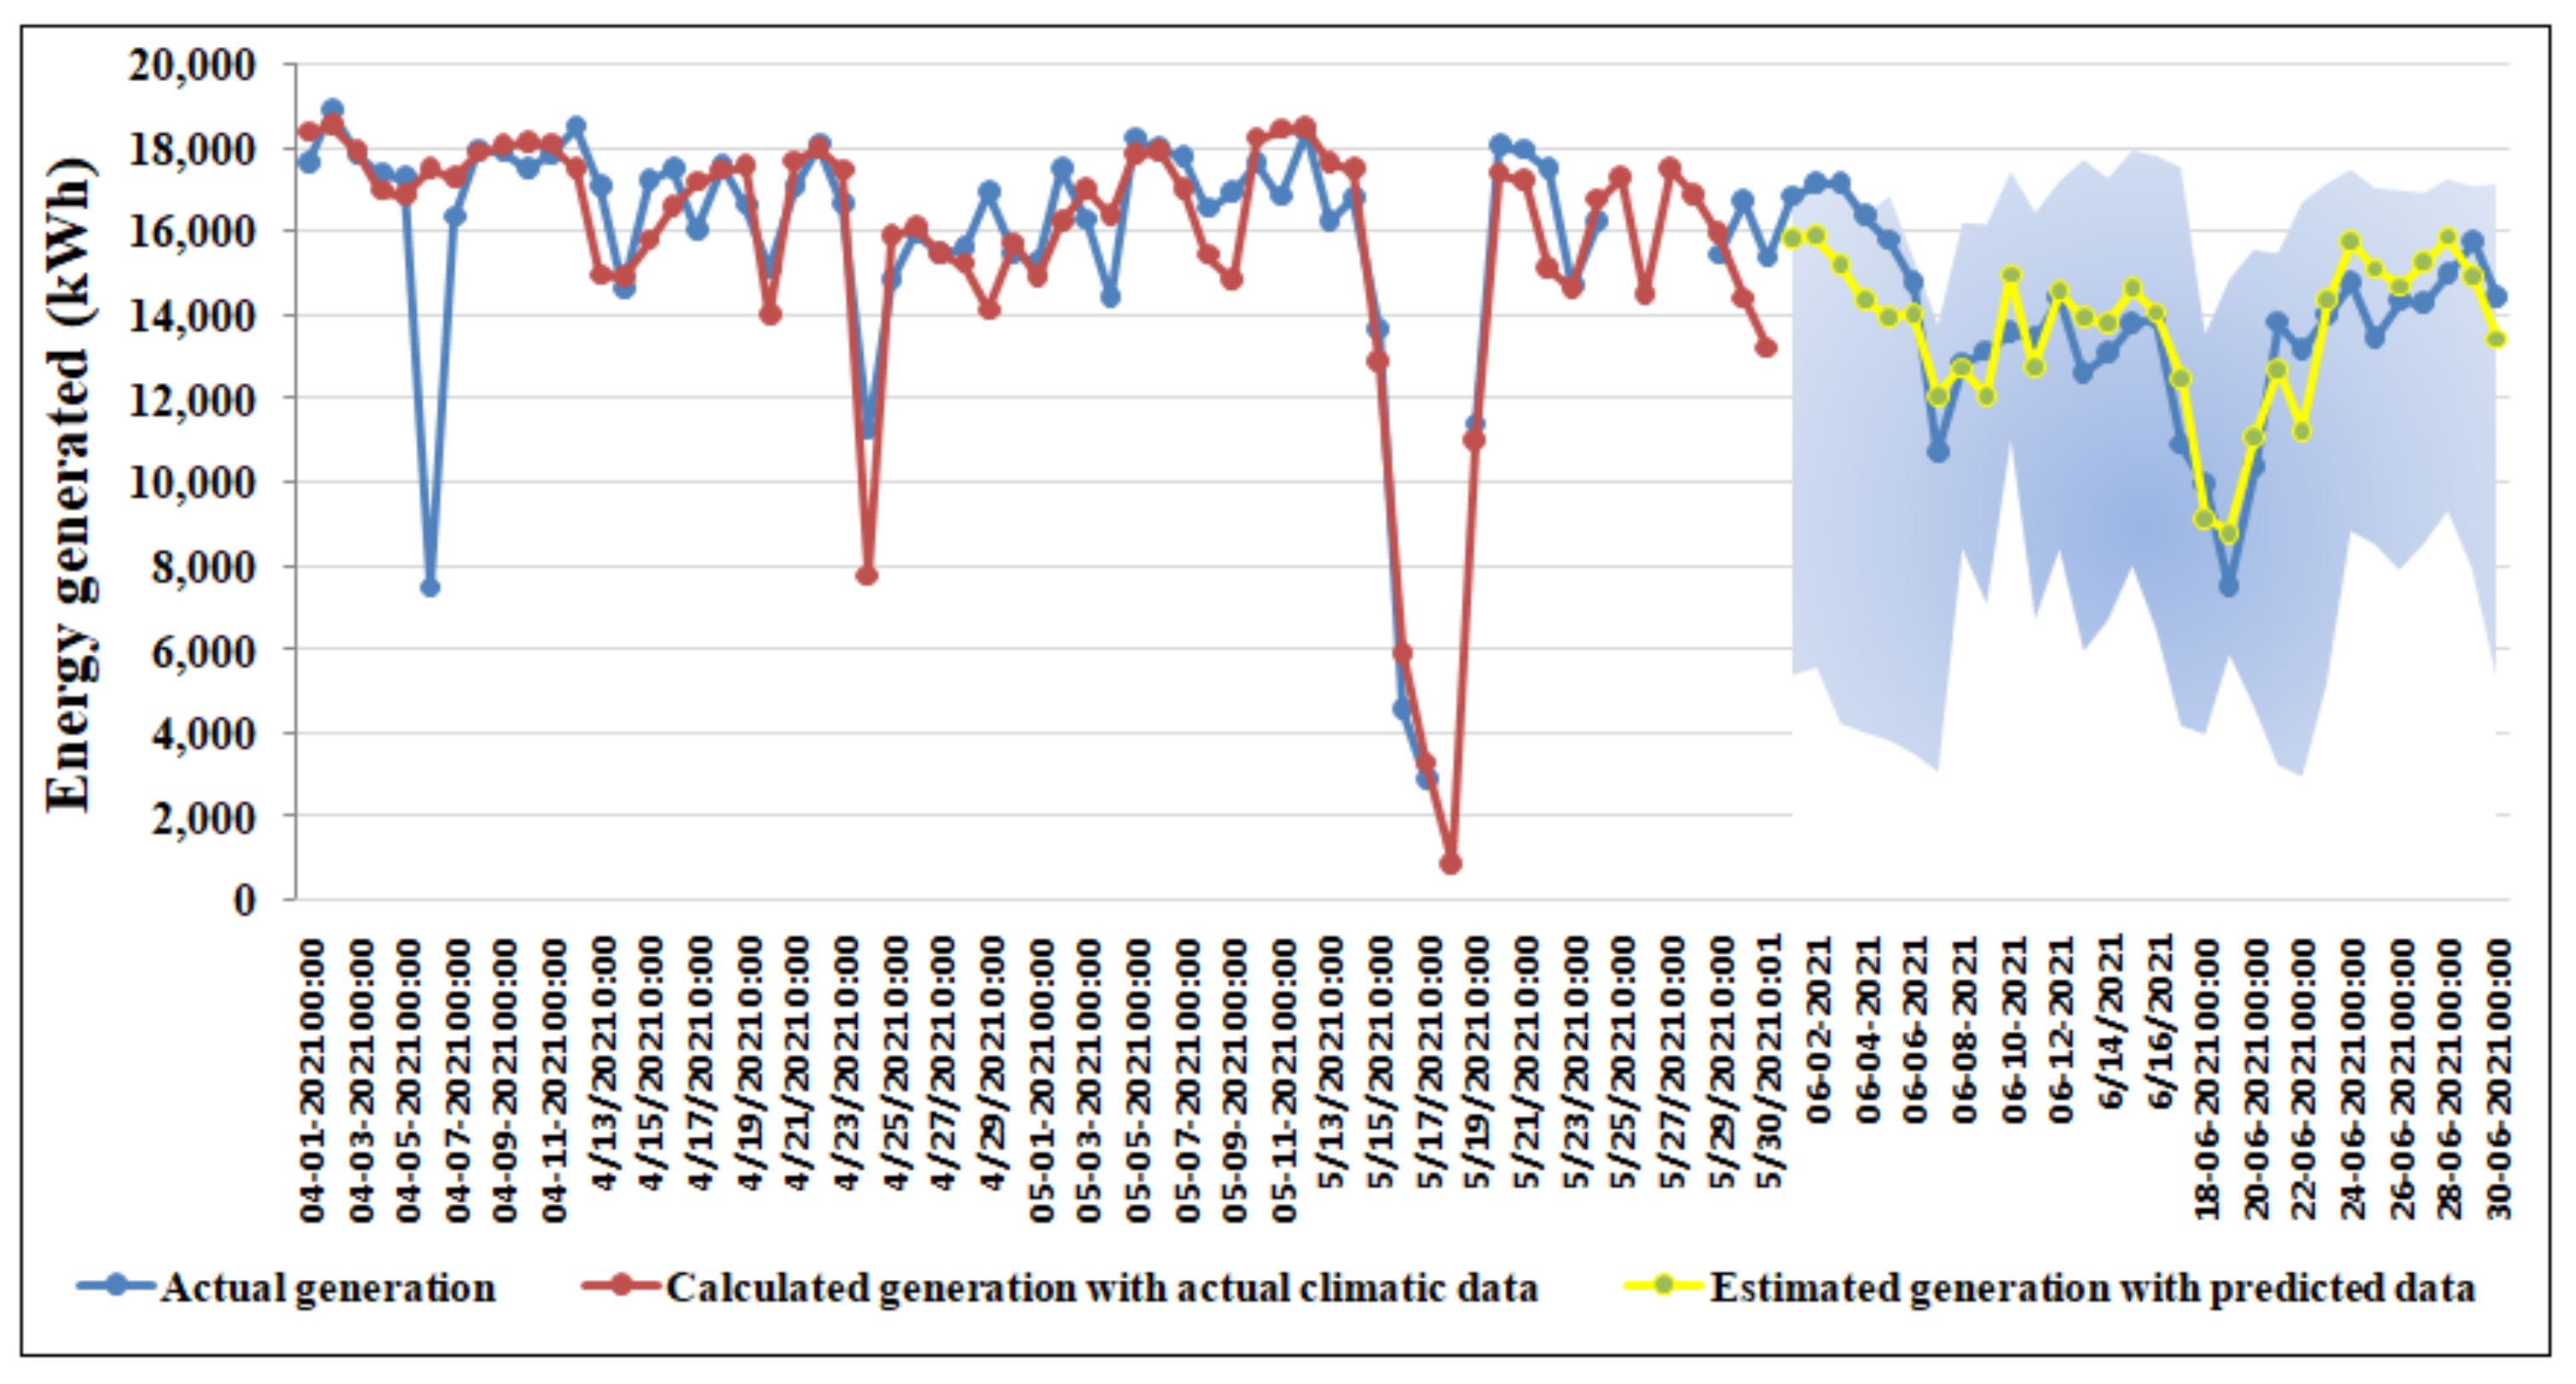
- Finally generation prediction is carried out for a 3 MWP PV plant (Figure 10) and compared with the measured one showing a good match between them.
Author Contributions
Funding
Data Availability Statement
Acknowledgments
Conflicts of Interest
Nomenclature
| ed | Eddy diffusion cofficient |
| Dd | Molecular diffusion cofficient |
| aE | Radiation-temperature coefficient |
| Tmod | Module temperature |
| ξPM | PM concentration |
| Vt | Terminal velocity of the particle |
| Vk | Deposition velocity |
| θt | Panel tilt angle |
| Fext | External force |
| Uw | Wind speed |
| θsw | Contact angle between surface and water in radian |
| ϑd | kinematic viscosity of air (m2/s) |
| L | Height at which module is placed |
| CP | Particle concentration at the height L |
| rd | Particle diameter |
| µw | Cofficient of friction |
| Ere | Rebound energy |
| Ed | Deposition energy |
| βc | filling angle |
| θpw | Contact angle between particle and water in radian |
| hc | distance between particle and surface |
| aW | Hamaker constant with water as medium |
| aa | Hamaker constant with air as medium |
| APV | Area of photovoltaic module |
| γS | Surface tension energy |
| εinv | Efficiency of the inverter |
| Eref | Reference radiation (1000 W/m2) |
| TaT | Ambient temperature |
| ρw | Density of water |
| e | Cofficient of restituion |
| Kinetic energy of deposition | |
| Dm | Mean-diameter of raindrop |
References
- Miller, B.G. Coal and energy security. Clean Coal Eng. Technol. 2011, 1, 585–612, ISBN 9781856177108. [Google Scholar]
- Speight, J.G. Energy security and the environment. Nat. Gas 2019, 2, 361–390, ISBN 9780128095706. [Google Scholar]
- IEA. World Energy Outlook 2019; IEA: Paris, France, 2019. [Google Scholar]
- Haegel, N.M.; Atwater, H.; Barnes, T.; Breyer, C.; Burrell, A.; Chiang, Y.-M.; De Wolf, S.; Dimmler, B.; Feldman, D.; Glunz, S.; et al. Terawatt-scale photovoltaics: Transform global energy. Science 2019, 364, 836–838. [Google Scholar] [CrossRef] [PubMed] [Green Version]
- Ghosh, A.; Sundaram, S.; Mallick, T.K. Colour properties and glazing factors evaluation of multicrystalline based semi-transparent Photovoltaic-vacuum glazing for BIPV application. Renew. Energy 2019, 131, 730–736. [Google Scholar] [CrossRef]
- Alrashidi, H.; Issa, W.; Sellami, N.; Ghosh, A.; Mallick, T.K.; Sundaram, S. Performance assessment of cadmium telluride-based semi-transparent glazing for power saving in façade buildings. Energy Build. 2020, 215, 109585. [Google Scholar] [CrossRef]
- Karthick, A.; KalidasaMurugavel, K.; Ghosh, A.; Sudhakar, K.; Ramanan, P. Investigation of a binary eutectic mixture of phase change material for building integrated photovoltaic (BIPV) system. Sol. Energy Mater. Sol. Cells 2020, 207, 110360. [Google Scholar] [CrossRef]
- Karthick, A.; Ramanan, P.; Ghosh, A.; Stalin, B.; Kumar, R.V.; Baranilingesan, I. Performance enhancement of copper indium diselenide photovoltaic module using inorganic phase change material. Asia-Pac. J. Chem. Eng. 2020, 15, e2480. [Google Scholar] [CrossRef]
- Alrashidi, H.; Ghosh, A.; Issa, W.; Sellami, N.; Mallick, T.K.; Sundaram, S. Thermal performance of semitransparent CdTe BIPV window at temperate climate. Sol. Energy 2020, 195, 536–543. [Google Scholar] [CrossRef]
- Sarver, T.; Al-Qaraghuli, A.; Kazmerski, L.L. A comprehensive review of the impact of dust on the use of solar energy: History, investigations, results, literature, and mitigation approaches. Renew. Sustain. Energy Rev. 2013, 22, 698–733. [Google Scholar] [CrossRef]
- Ghosh, A. Soiling Losses: A Barrier for India’s Energy Security Dependency from Photovoltaic Power. Challenges 2020, 11, 9. [Google Scholar] [CrossRef]
- Adinoyi, M.J.; Said, S.A.M. Effect of dust accumulation on the power outputs of solar photovoltaic modules. Renew. Energy 2013, 60, 633–636. [Google Scholar] [CrossRef]
- Wei, J.; Zhang, Y.; Wang, J.; Cao, X.; Khana, M.A. Multi-period planning of multi-energy microgrid with multi-type uncertainties using chance constrained information gap decision method. Appl. Energy 2020, 260, 114188. [Google Scholar]
- Wei, J.; Zhang, Y.; Wang, J.; Wu, L. Distribution LMP-Based Demand Management in Industrial Park via a Bi-Level Programming Approach. IEEE Trans. Sustain. Energy 2021, 12, 1695–1706. [Google Scholar]
- Ilse, K.K.; Figgis, B.W.; Werner, M.; Naumann, V.; Hagendorf, C.; Pöllmann, H.; Bagdahn, J. Comprehensive analysis of soiling and cementation processes on PV modules in Qatar. Sol. Energy Mater. Sol. Cells 2018, 186, 309–323. [Google Scholar] [CrossRef]
- Ilse, K.; Micheli, L.; Figgis, B.W.; Lange, K.; Daßler, D.; Hanifi, H.; Wolfertstetter, F.; Naumann, V.; Hagendorf, C.; Gottschalg, R.; et al. Techno-Economic Assessment of Soiling Losses and Mitigation Strategies for Solar Power Generation. Joule 2019, 3, 2303–2321. [Google Scholar] [CrossRef] [Green Version]
- Said, S.A.M. Effects of dust accumulation on performances of thermal and photovoltaic flat-plate collectors. Appl. Energy 1990, 37, 73–84. [Google Scholar]
- Styszko, K.; Jaszczur, M.; Teneta, J.; Hassan, Q.; Burzyńska, P.; Marcinek, E.; Łopian, N.; Samek, L. An analysis of the dust deposition on solar photovoltaic modules. Environ. Sci. Pollut. Res. 2019, 26, 8393–8401. [Google Scholar] [CrossRef] [PubMed] [Green Version]
- Figgis, B.W. Investigation of PV Soiling and Condensation in Desert Environments Via Outdoor Microscopy. Ph.D. Dissertation, ICube Lab., Uni. Strasbourg, Strasbourg, France, 2018. [Google Scholar]
- Beattie, N.S.; Moir, R.S.; Chacko, C.; Buoni, G.; Roberts, S.H.; Pearsall, N.M. Understanding the effects of sand and dust accumulation on photovoltaic modules. Renew. Energy 2012, 48, 448–452. [Google Scholar] [CrossRef] [Green Version]
- Mekhilef, S.; Saidur, R.; Kamalisarvestani, M. Effect of dust, humidity and air velocity on efficiency of photovoltaic cells. Renew. Sustain. Energy Rev. 2012, 16, 2920–2925. [Google Scholar] [CrossRef]
- Micheli, L.; Muller, M. An investigation of the key parameters for predicting PV soiling losses. Prog. Photovolt, Res. Appl. 2017, 25, 291–307. [Google Scholar] [CrossRef]
- Micheli, L.; Muller, M.; Kurtz, S. Determining the effects of environment and atmospheric parameters on PV field performance. In Proceedings of the 2016 IEEE 43rd Photovoltaic Specialists Conference (PVSC), Portland, OR, USA, 5–10 June 2016; pp. 1–6. [Google Scholar]
- Micheli, L.; Caballero, J.A.; Fernandez, E.F.; Smestad, G.P.; Nofuentes, G.; Mallick, T.K.; Almonacid, F. Correlating photovoltaic soiling losses to waveband and single-value transmittance measurements. Energy 2019, 180, 376–386. [Google Scholar] [CrossRef] [Green Version]
- Azarov, V.; Sergina, N.; Sidyakin, P.; Kovtunov, I. Seasonal variations in the content of dust particles PM10 and PM 2.5 in the air of resort cities depending on intensity transport traffic and other conditions. IOP Conf. Ser. Earth Environ. Sci. 2017, 90, 1–10. [Google Scholar] [CrossRef] [Green Version]
- Tanesab, J.; Parlevliet, D.; Whale, J.; Urmee, T. Seasonal effect of dust on the degradation of PV modules performance deployed in different climate areas. Renew. Energy 2017, 111, 105–115. [Google Scholar] [CrossRef]
- Costa, S.C.S.; Sonia, A.; Diniz, A.C.; Kazmerski, L.L. Dust and soiling issues and impacts relating to solar energy systems: Literature review update for 2012–2015. Renew. Sustain. Energy Rev. 2016, 63, 33–61. [Google Scholar] [CrossRef] [Green Version]
- Costa, S.C.S.; Diniz, A.S.A.C.; Kazmerski, L.L. Solar energy dust and soiling R and D progress: Literature review update for 2016. Renew. Sustain. Energy Rev. 2018, 82, 2504–2536. [Google Scholar] [CrossRef]
- Boyle, L.; Flinchpaugh, H.; Hannigan, M. Assessment of PM dry deposition on solar energy harvesting systems: Measurement–model comparison. Aerosol Sci. Technol. 2016, 50, 380–391. [Google Scholar] [CrossRef] [Green Version]
- Zhang, L.; Gong, S.; Padro, J.; Barrie, L. A size segregated particle dry deposition scheme for an atmospheric aerosol module. Atmos. Environ. 2001, 35, 549–560. [Google Scholar] [CrossRef]
- Figgis, B.; Guo, B.; Javed, W.; Ahzi, S.; Rémond, Y. Dominant environmental parameters for dust deposition and resuspension in desert climates. Aerosol Sci. Technol. 2018, 52, 788–798. [Google Scholar] [CrossRef] [Green Version]
- Chanchangi, Y.N.; Ghosh, A.; Sundaram, S.; Mallick, T.K. An analytical indoor experimental study on the effect of soiling on PV, focusing on dust properties and PV surface material. Sol. Energy 2020, 203, 46–68. [Google Scholar] [CrossRef]
- Sharma, R.; Goel, S. Performance analysis of a 11.2 kWp roof top grid-connected PV system in Eastern India. Energy Rep. 2017, 3, 76–84. [Google Scholar] [CrossRef]
- Kumar, B.S.; Sudhakar, K. Performance evaluation of 10 MW grid connected solar photovoltaic power plant in India. Energy Rep. 2015, 1, 184–192. [Google Scholar] [CrossRef] [Green Version]
- Shukla, A.K.; Sudhakar, K.; Baredar, P. Simulation and performance analysis of 110 kWp grid-connected photovoltaic system for residential building in India: A comparative analysis of various PV technology. Energy Rep. 2016, 2, 82–88. [Google Scholar] [CrossRef] [Green Version]
- Sengupta, S.; Maiti, S.; Ghosh, S.; Das, A.; Sengupta, S.; Saha, H. A long term PV power degradation prediction due to dust fouling and environmental stresses. In Proceedings of the 2019 IEEE Region 10 Symposium (TENSYMP), Kolkata, India, 7–9 June 2019; pp. 179–183. [Google Scholar]
- Beegum, S.N.; Gherboudj, I.; Chaouch, N.; Couvidat, F.; Menut, L.; Ghedira, H. Simulating aerosols over Arabian eninsula with CHIMERE: Sensitivity to soil, surface parameters and anthropogenic emission inventories. Atmos. Environ. 2016, 128, 185–197. [Google Scholar] [CrossRef]
- Liu, X.; Yue, S.; Lu, L.; Li, J. Study on dust deposition mechanics on solar mirrors in a solar power plant. Energies 2019, 12, 4550. [Google Scholar] [CrossRef] [Green Version]
- Picotti, G.; Borghesani, P.; Cholette, M.E.; Manzolini, G. Soiling of solar collectors–modelling approaches for airborne dust and its interactions with surfaces. Renew. Sustain. Energy Rev. 2018, 81, 2343–2357. [Google Scholar] [CrossRef]
- Sengupta, S.; Sengupta, S.; Saha, H. Comprehensive modeling of dust accumulation on PV modules through dry deposition processes. IEEE J. Photovolt. 2020, 10, 1148–1157. [Google Scholar] [CrossRef]
- Sengupta, S.; Sengupta, S.; Chanda, C.K.; Saha, H. Modeling the Effect of Relative Humidity and Precipitation on Photovoltaic Dust Accumulation Processes. IEEE J. Photovolt. 2021, 11, 1069–1077. [Google Scholar] [CrossRef]
- Anderson, A.J. Photovoltaic Translation Equations: A New Approach; Final Subcontract Rep. TP-411-20279; Nat. Renewable Energy Lab.: Golden, CO, USA, 1996. [Google Scholar]
- Wang, J.; Gong, H.; Zou, Z. Modeling of Dust Deposition Affecting Transmittance of PV Modules. J. Clean Energy Technol. 2017, 5, 217–221. [Google Scholar] [CrossRef] [Green Version]
- Slinn, W.G.N. Some approximations for the wet and dry removal of particles and gases from the atmosphere. Water Air Soil Pollut. 1977, 7, 513–543. [Google Scholar] [CrossRef] [Green Version]
- Stempniewicz, M.M.; Komen, E.M.J.; de With, A. Model of particle resuspension in turbulent flows. Nuclear Eng. Des. 2008, 238, 2943–2959. [Google Scholar] [CrossRef]
- Shin, S.S.; Park, S.D.; Choi, B.K. Universal Power Law for Relationship between Rainfall Kinetic Energy and Rainfall Intensity. Adv. Meteorol. 2016, 2016, 1–11. [Google Scholar] [CrossRef] [Green Version]
- Zhou, G.; Wei, X.; Yan, J. Impacts of eucalyptus (Eucalyptus exserta) plantation on sediment yield in Guangdong Province, Southern Chin— a kinetic energy approach. CATENA 2002, 49, 231–251. [Google Scholar] [CrossRef]
- Available online: https://www.visualcrossing.com/weather/weather-data-services#/viewData (accessed on 18 May 2020).
- Available online: https://solcast.com/ (accessed on 24 June 2020).
- Available online: https://waqi.info/ (accessed on 10 May 2021).


| Plant Name | Capacity | Location | Module Type | Inverter Type | Tilt Angle |
|---|---|---|---|---|---|
| PGCIL, Nagpur, Maharastra | 40 kWP | 21.14°N, 79.08° E | 315 WP, Multicrystalline | 2 × RPI M20A (Delta) | 20° |
| RBI, New Alipore, Kolkata | 50 kWP | 22.57°N, 88.36° E | 305 WP, Multicrystalline | 2 × RPI M10A 1 X RPI M30A (Delta) | 20° |
| HPCL, Vishakhpatanam, Andhra Pradesh | 100.8 kWP | 17.68° N, 83.19° E | 315 WP, Multicrystalline | 5 × RPI M20A (Delta) | 18° |
| NKDA, Rajarhat | 500 kWP | 22.605691° N, 88.467579° E | 295 WP, Polycrystalline | 25 × TRIO-20.0-TL-OUTD-400 | 7° |
Publisher’s Note: MDPI stays neutral with regard to jurisdictional claims in published maps and institutional affiliations. |
© 2021 by the authors. Licensee MDPI, Basel, Switzerland. This article is an open access article distributed under the terms and conditions of the Creative Commons Attribution (CC BY) license (https://creativecommons.org/licenses/by/4.0/).
Share and Cite
Sengupta, S.; Ghosh, A.; Mallick, T.K.; Chanda, C.K.; Saha, H.; Bose, I.; Jana, J.; Sengupta, S. Model Based Generation Prediction of SPV Power Plant Due to Weather Stressed Soiling. Energies 2021, 14, 5305. https://doi.org/10.3390/en14175305
Sengupta S, Ghosh A, Mallick TK, Chanda CK, Saha H, Bose I, Jana J, Sengupta S. Model Based Generation Prediction of SPV Power Plant Due to Weather Stressed Soiling. Energies. 2021; 14(17):5305. https://doi.org/10.3390/en14175305
Chicago/Turabian StyleSengupta, Saheli, Aritra Ghosh, Tapas K. Mallick, Chandan Kumar Chanda, Hiranmay Saha, Indrajit Bose, Joydip Jana, and Samarjit Sengupta. 2021. "Model Based Generation Prediction of SPV Power Plant Due to Weather Stressed Soiling" Energies 14, no. 17: 5305. https://doi.org/10.3390/en14175305
APA StyleSengupta, S., Ghosh, A., Mallick, T. K., Chanda, C. K., Saha, H., Bose, I., Jana, J., & Sengupta, S. (2021). Model Based Generation Prediction of SPV Power Plant Due to Weather Stressed Soiling. Energies, 14(17), 5305. https://doi.org/10.3390/en14175305