Abstract
The paper aims at establishing an associative link between supervisory board members’ independence and the dynamics of environmental policy transformations in the energy sector. To that end, we apply static panel models and binary logistic regression analysis to an international sample of 358 energy companies observed over the period between 1990 and 2020. Our empirical results point to a lack of any persistent link between board independence and energy transition after controlling for country-specific effects and firm-level financials. Although firms with a higher percentage of independent directors on boards are more likely to set emission targets and implement resource reduction policies, they are simultaneously more likely to be involved in environmental controversies and increase coal output. They are also significantly less likely to enforce an energy efficiency policy. No significant link is found between board independence and environmental expenditures, CO2 equivalent emissions, and renewable energy use by energy companies. Overall, despite the widespread expectation that independent boards will accelerate energy transition, empirical evidence suggests that they are more likely to maintain the status quo. Delving into the problem of incentives in the energy sector, we find that executive compensations and corporate profitability exhibit a persistent positive link with CO2 emissions.
1. Introduction
The energy sector is notoriously conservative in reforming its corporate governance mechanisms. The rigidity of corporate oversight [1], which features among the industry’s critical shortcomings, may stem from the unique nature of strategic business choices that energy firms are forced to tackle. The advancement of issues related to climate change in the global political and societal agenda drew a wedge between executives of energy giants. The primary difference of opinions resides in the perception of the speed of upcoming changes in the sector’s modus operandi. While some placed early bets on the acceleration of transition towards renewable energy, others continue to rely on upward projections of demand for fossil fuel, therefore continuing to invest in their core business of oil, gas, and coal. With the latter group being subject to public outcry, regulators across the majority of jurisdictions are looking for ways to accelerate the sector’s transition towards sustainable and clean energy.
Switching from commitment to fossil fuel to renewable energy involves a complex array of pre-requisites, including top-down legislative action, imposition of environmentally-focused market discipline, and overhaul of internal governance structures. However, with regulatory action moving slowly across many of the highest-pollution jurisdictions and market discipline exercising only a moderate impact on strategic financial decisions within energy conglomerates [2], internal corporate governance settings are frequently regarded as a suitable transmission mechanism for accelerating change.
The advocates of independent corporate governance postulate that replacement of insider directors with independent supervisory board members carrying contrarian views should prompt a fundamental revision of energy firms’ corporate strategies [3,4]. The latter should trickle down to the level of tactical and operational decision-making, thus setting the firms’ transition in motion.
The present study subjects this premise to empirical verification. Relying on an international panel dataset of 378 energy companies observed between 1990 and 2020, we attempt to establish whether board independence is associated with shifts towards more environmentally friendly operations and climate-focused internal policies.
The nexus between board independence and energy transformation is analyzed along a number of dimensions. In particular, we check whether changes to the supervisory board structure are associated with subsequent shifts in renewable energy production and use, setting resource reduction and emission targets, scaling up environmental expenses, and engaging into environmental controversies.
The research problem tackled in the paper is of significant relevance for regulators engaged in designing incentive mechanisms in the energy sector. The problem of interconnection between corporate governance mechanisms and firms’ strategic decisions remains scarcely covered in the extant empirical literature. The prevailing consensus posits that the instruments fostering independent corporate oversight may be sufficient to push energy firms towards environmental policy transition without concomitant coercive regulatory action. However, this postulate lacks any corroboratory empirical evidence. The present study aims at providing such evidence by studying rich empirical material.
Our findings unequivocally suggest that board independence is not significantly associated with energy firms’ transition towards sustainable energy generation. We find no relationship between board independence on one hand and renewable energy use, environmental expenses, and CO2 emissions on the other. While firms with a higher share of independent directors on board are more likely to set emission targets and implement resource reduction policies, they are simultaneously more likely to be involved into environmental controversies and increase coal output instead of slashing it.
The findings reported in the paper carry significant business and regulatory implications. First, we show that independent corporate oversight is unlikely to accelerate transformation within energy companies on its own. Therefore, bottom-up societal action and top-down regulatory pressure constitute necessary pre-requisites for enforcement of sustainable energy generation. Secondly, investors seeking to incite strategic changes within firms’ development path should look for mechanisms supplementing corporate governance levers, since the latter appear insufficiently effective at catalyzing internal changes [5].
Delving deeper into the possible causes of the discovered empirical relationships, we find that the existing regulatory framework failed to create economic incentives to dynamize energy transition. In particular, we demonstrate that executive compensation and overall business profitability remain positively correlated with energy-firms’ CO2 emissions, regardless of the board structure. Thus, we postulate that modifying the current economic incentives and promoting board independence, rather than just focusing on the latter, constitutes the critical factor for shaping internal changes in the energy sector.
The paper contributes to the growing body of empirical literature exploring the role of independent corporate governance in advancing environmental and social causes [6]. While the conventional wisdom postulates that independent and competent supervisory boards may precipitate or accelerate business transformations, we argue that oversight is only one of the co-requisites, which by itself is insufficient to re-shape corporate strategy and alter incentives. To date, this is the first study presenting comprehensive international evidence on the nexus between board independence and transition towards sustainable energy.
The remainder of the paper is organized as follows. First, we present a literature review along with the key research question. Then we summarize the data collection process and present the methodology applied in the paper. Discussion of empirical findings concludes.
2. Literature Review and Research Question
The extant empirical literature presents an overwhelming consensus regarding the beneficial role of independent corporate oversight in improving business performance and promoting corporate accountability. However, the declared positive impact hinges upon two critical functions performed by boards of directors with a two-tier system of corporate governance-advisory and monitoring [7].
The presence of independent supervisory board members is primarily supposed to preclude board capture by executives [8]. Directors are expected to impartially analyze and assess the viability of strategic business decisions contemplated by senior management. Excessive forbearance of supervisory board members with respect to managerial initiatives stemming from the long-standing social ties, material business relationships, or executives’ impact on the hiring process may bear detrimental consequences for shareholders by creating favorable ground for managerial opportunism [9]. In addition to disciplining managers, independent directors are presumed to be better positioned to fulfil their advisory functions by bringing external expertise, resources [10], connections, and diverse viewpoints with regards to the firms’ strategic challenges.
Numerous empirical studies demonstrated that board independence allows to improve executive accountability, ameliorate the efficiency of corporate resource allocation [11], and preclude corporate fraud or internal irregularities. Additionally, by virtue of possessing valuable market expertise, independent boards are able to draft long-term strategies for firms without being constrained by short-termism [12], the latter being more prevalent among executives whose compensation package is frequently tied to short-term shareholder wealth outcomes. In light of academic research, most jurisdictions have taken legislative action aimed at increasing board independence and thus enhancing the effectiveness of corporate governance mechanisms.
Within the context of energy sector, the nexus between independent governance and corporate outcomes has been much less studied [13]. The number of papers exploring the link between the quality of corporate governance and environmental transition with energy firms is lower still [14].
The fundamental research question we attempt to answer may be formulated as follows:
RQ. Does board independence accelerate energy firms’ transition towards sustainable development, cleaner energy generation and more environmentally friendly operations?
The formulated research question requires empirical investigation, since the extant literature offers viable explanations for both positive and negative answers.
To start with, transition towards environmentally friendly operations involves substantial up-front financial outlays, which carry long-term payback periods [15]. As part of the process, firms have to launch a distinct pipeline of investment projects, which carry no immediate explicit incremental cash flow growth, but rather divert a significant part of internally generated cash flows towards non-core activities. The upside potential of such investments hinges upon upcoming regulatory action, burdensome institutional mechanisms, and long-term projections, which are not commensurate with the relatively short-term operational decision-making cycle. Within such environments, the long-term contingent upside may not compensate for the costs of strategic shifts [16]. Since independent board members are primarily tasked with protecting shareholder value and maximizing economic efficiency of resource deployment within a company [17], they may be reluctant to advocate environmentally friendly policies whenever the predominant structure of economic incentives does not put a sufficient premium on them. Regardless of their composition, boards are unlikely to occupy a contrarian position with respect to sustainable transition issues whenever the latter contradicts the principal objective of shareholder value maximization. Therefore, if one assumes that the boards’ standpoint derives from the prevailing system of economic incentives, one should expect no significant relationship between board composition and firms’ transition towards environmentally friendly policies. Rather, the causal nexus is expected to be intermediated by institutional settings, regulatory action [18], and bottom-up societal pressure.
The alternative viewpoint—arguing that independent boards are expected to actively promote a strategic shift towards environmentally responsible and sustainable modes of operations in the energy sector—stands on a different set of assumptions. To start with, independent boards are presumed to adequately assess and reconcile the interests of a broad and diverse group of firms’ stakeholders, including employees, clients, and suppliers, with the goal of overall utility maximization for the broader community [19]. This comprehensive focus implies prioritization of large-scale business risks, which are not internalized within the existing market structure. This assumption relies on the premise that stakeholder utility and shareholder value are ultimately closely interrelated, which is not always the case. Independent boards are also expected to pay attention to and anticipate the changing societal attitudes, public consensus, and regulatory reaction. The gain from adoption of environmentally responsible policies and carbon-neutral technologies comprises direct pecuniary savings from ‘cap-and-trade’-like schemes, regulatory penalties and the future costs of compliance, lower cost of capital [20], higher customer recognition, reputational improvements [21], etc. Early transition towards environmentally responsible energy generation is supposed to give firms a long-lasting competitive edge, improve their chances of survival, and make them primary beneficiaries of any pilot incentive schemes designed to foster transition of industry laggards. Assuming reasonable expectations with regards to pending regulatory changes, early transition may thus represent a rational long-term bet on large-scale institutional changes. Independent supervisory boards, by virtue of their capability to collect material non-public information on such changes, may be well-positioned to plan, implement, and enforce large-scale strategy shifts.
The described decision-making logic, however, does not change the fact that supervisory boards are reacting to external circumstances and pressure rather than driving the changes relying on a pre-specified set of values. Therefore, the boards’ policy priorities represent a superset of the existing institutional settings and economic incentives embedded in the market structure. The existing empirical evidence largely supports this line of reasoning.
To start with, energy firms’ propensity to invest in environmental transition has been shown to depend on executive compensation structure [22]. In particular, firms in which senior management’s remuneration carries a variable component tied to the fulfilment of environmental, social, and governance (ESG) goals have been documented to channel more resources towards implementing environmentally friendly policies. In this context, the role of independent supervisory boards is limited to enforcement of managerial accountability by making sure that pay actually tracks ESG performance. In turn, the pressure to implement ESG-related compensation packages comes from outside the firms, i.e., from the regulatory action and societal attitudes. Some studies [23] attribute the recurrence to ESG-linked compensation to independent supervisory boards: independent directors are presumed to prioritize the interests of all stakeholders over those of shareholders. However, two essential factors weaken this argument. First, ESG-tracking remuneration mechanisms tend to be implemented in waves [24] in response to either a regulatory push or shift in institutional investors’ requirements. Secondly, while a part of executive compensation may be tied to the fulfillment of environmental goals, the bulk of remuneration is contingent upon the performance of firms’ core operations, whose environmental footprint may outweigh the gains from ESG goals pursuit.
A growing body of literature recognizes that regardless of organization-level settings and internally enforced policies, any large-scale shifts towards sustainable energy generation are possible only if they are likely to bring material gains in shareholder value or limit the scale of value destruction. In view of the capital intensity and disruptive nature of changes, which need to be implemented to bring energy transition to fruition, the only possible scenario in which such changes allow firms to reach positive short- and medium-term shareholder wealth effect is the one in which markets put a significant premium on such decisions detached from short-term economic fundamentals. Evidence of the presence of such premia marks an important shift in investors’ expectations towards scenarios, in which energy transition brings material pecuniary benefits in the medium term. Empirical literature already corroborated the validity of such expectations across a range of developed markets. In particular, energy firms with a good performance record in the domain of environmental policy enforcement have been evidenced to enjoy lower cost of capital [25], while another study [26] found that such stocks generated positive long-term abnormal returns compared to peers that did not embark on energy transition. Importantly, the superior performance of firms with improved ESG scores is not related to the dynamics of their cash flows—the primary marker of shareholder value. Rather, it is the perceived riskiness of the said stocks which drives shareholder gains. Thus, investors appear to put a premium on energy firms transitioning towards sustainable energy operations, while simultaneously imposing a discount on their peers, who are likely to face steep compliance costs and turbulent transformations in the long term. Some studies [27] found that higher ESG scores are associated with better operational performance. However, such studies inevitably face the problem of reverse causality. Superior performance and the resulting spare financial resources may fuel implementation of ESG policies. While the board can and should perform the role of steward navigating the firm through changes aimed at benefiting from shifts in investors’ sentiment, their decisions are reactive with respect to the broader shifts in the investors’ community.
The crucial question, which necessitates an answer, is whether independent supervisory boards in energy companies are capable by themselves of becoming a catalyst of the sector’s transition towards clean energy. Some believe they are [28]. Promoting environmentally responsible decision-making may thus become the personal cause of board members. However, any such initiatives may eventually halt if their economic outcomes clash with shareholder value maximization principles.
The existing empirical literature investigating the role of corporate governance in accelerating energy transition has important gaps in terms of methodology, geographical coverage, and theoretical framework [29]. The majority of studies approach the problem by analyzing the determinants of energy firms’ carbon footprint. Cross-sectional econometric analysis comparing firms’ performance in terms of key environmental indicators remains the tool of choice in the majority of studies. While being suited to ranking firms and designing economic incentives within cap-and-trade network, this methodological framework does not allow to explore the determinants and causal links standing behind firms’ strategic choices and energy transition initiatives. Multiannual longitudinal analysis controlling for organization-level changes appears to be better suited to investigate problems of similar scope. Secondly, the existing studies are largely constrained to mature markets, where shifts in public opinions have already initiated changes to the regulatory framework. Comparative international studies englobing multiple jurisdictions with heterogenous disclosure and mitigation requirements remain scarce [30]. The present study attempts to fill these gaps by employing panel econometric analysis to a broad international sample of energy companies in order to bring empirical evidence to the problem of nexus between corporate governance and environmental transition in the energy sector.
3. Database Design and Methodology
For the purposes of the study, we compiled a longitudinal dataset covering 378 publicly listed energy companies from across 73 countries over the period between 1990 and 2020.
The data collection process started with filtering the population of public companies, for which financial data were available in the Thomson Reuters Database. In order to qualify for sample inclusion, a company had to meet a number of criteria. To start with, it had to operate fully or partially (in case of holding companies and vertically integrated conglomerates) in one of the following industries: (1) oil/gas/energy consumables (including exploration/refining/storage/delivery); (2) energy equipment and services; (3) electric/gas utilities; (4) power/electricity producers. The industry classifications/subclassifications comply with the Global Industry Classification Standard (GICS). Importantly, the listed types of activity had to feature in the firms’ core business profile description.
Secondly, the company had to be publicly listed. This criterion is dictated by the constraints related to data availability. Only listed companies fulfil disclosure requirements with regards to variables which are of interest for the present study (such as CO2 emissions, executive compensation, or board structure). It is worth noting that the stringency of disclosure requirements, as well as control of adherence to regulatory standards, differ across the studied jurisdictions, which introduced an additional methodological complication into our empirical analysis.
Since the studied sector is comprised of large capital-intensive businesses frequently operating as natural monopolies on national markets, choosing a single jurisdiction for analysis would not yield sufficient empirical material for quantitative analysis. Therefore, a decision was made to create an international sample and control for its geographical heterogeneity by including appropriate controls into regression models. The sample is reasonably well-balanced in terms of geographical structure, with the largest jurisdiction (USA) taking up ca. 25.4% of firm-year observations (data are allotted based on the relative size of economies constituting the sample).
We ejected firms that had gaps in the time series of financial data present. Similarly, a reported zero value of assets or revenues during any year in the time series disqualified a company from consideration. We did not impose any requirements with regards to the length of time series for sampled firms. The resulting panel dataset is, therefore, unbalanced.
The data we assembled for each firm may be broken down into the following four categories: (1) general data; (2) corporate governance proxies; (3) environmental policies proxies; (4) financial data. The frequency of data points is one calendar year. The first category of data comprises the date of incorporation, age, time of listing, ownership structure (whether a company is state-owned), and industry classification codes for activities carried out by firms during a given year. The set of corporate governance variables include board size, percentage of independent board members, average number of directors’ outside affiliations (defined as having a directorship or executive position within another company not operating with the current employer’s capital structure), departures of directors (voluntary and involuntary) during a given year, whether or not CEO is a board member and whether there is a separation between CEO and board chair positions, total board member and executive compensation (comprising any compensation enhancement tools such as options), whether or not executives receive variable compensation comprising a part linked to fulfilment of specific operational goals. The set of environmental policy proxies comprises reported CO2 emissions, renewable energy production and use, total environmental expenses (including any remediation fees and cleanup costs but excluding penalties), implementation of resource and emission reduction targets, implementation of environmental policies, and occurrences of environmental controversies. The latter variable encodes environmental accidents/disputes (including those reported in the media) regardless of the scale/damages/parties involved/geographical scope. It is worth noting that regulatory standards of dealing with environmental accidents differ across jurisdictions, therefore, occurrences of such events are much more likely to be reported and brought to public attention on mature markets, making cross-geography generalizations difficult.
The category of financial data comprises a set of standard normalized financial metrics. These include total reported assets, revenues, operating profit margins, overall business profitability (return on assets—ROA), cash reserves, indebtedness, and total tangible investments.
Qualitative data were re-coded into binary variables. Nominal variables were first scaled using standard deflators utilized in the extant literature (such as total assets or total revenues) and then winsorized at 1% and 99% levels to eliminate outliers. The definitions of variables collected and used in the present study are presented in Table 1. Summary statistics (after winsorization) are shown in Table 2.

Table 1.
Definitions of variables.
Table 2.
Descriptive statistics.
In order to ascertain and quantify the strength of the link between supervisory board independence and environmental policies in the energy sector, we rely on univariate tests and static panel regression modeling. The key experimental variables used in our analysis comprehensively describe energy firms’ transition towards sustainable energy generation. The baseline specification of panel regression models are as follows:
where —explained variable operationalizing firms’ energy transition (a number of alternative proxies are tested), —a vector of corporate governance proxies controlling for the quality of internal corporate oversight, —a set of firm−level financial controls. All models include time and country fixed effects in order to control for sample heterogeneity. Whenever the explained variable is binary, we use binary logit regression analysis relying on the same equation specification.
The set of variables describing firms’ energy transition includes the following: (1) environmental controversies (ENV.CONTR); (2) emission targets (EMISS.TGT); 3) resource reduction policy (RES.RED.POL); (4) energy efficiency policy (ENERG.EFF.POL); (5) total environmental expenses (ENV.EXP); (6) renewable energy output (RENEW.ENERG); (7) coal output (COAL.PROD); (8) CO2 equivalent emissions (CO2.EQUIV.EMIS). The use of a multitude of different proxies for firms’ environmental policies allows for robust generalization and corroboration of empirical results.
The key regressor measures board independence (IND.BOARD). Importantly, we utilized a number of alternative proxies for the degree of board independence to conduct robustness checks. In particular, we recorded instances (firm−years) when energy firms hired new independent supervisory board members in place of insiders, thus increasing the overall board independence (IND.INCREASE). Using the occurrence of such events as a natural experiment, we attempted to verify whether similar changes in the board structure initiate changes in firms’ energy transition pace. As an extension of these tests, we created another variable (DIR.REPLACE) binary−coding instances of any voluntary or involuntary departure of supervisory board members, regardless of the underlying reason of departure. This variable allows us to conduct placebo tests and compare the obtained results against those for the IND.INCREASE variable. If changes to firms’ environmental policies following the appointments of new supervisory board members are similar regardless of whether directors are independent, the effect may not be unequivocally attributed to independence as a distinct explanatory factor.
We also checked for the presence of non-linearities in the nexus between board independence and energy transition. To that end, we created a binary variable encoding firms where board independence exceeds 75% (IND.HIGH.75). Thus, we attempted to establish whether boards dominated by independent directors are associated with speedier energy transition and whether the said effect accelerates in the tail of the IND.BOARD variable’s distribution.
In the concluding part of our empirical analysis, we delved into the problem of incentives in the energy sector. Trying to elucidate the link between the pace of energy transition and corporate governance settings, we checked whether the existing performance management system and compensation structure in the energy sector incentivizes implementation of environmentally friendly policies or slows them down.
4. Empirical Results
We began with graphical analysis of the key experimental variables and univariate statistical tests to catch the principal associative links between them. Figure 1 presents the intertemporal evolution of board independence and CO2 equivalent emissions (log-transformed) in the energy sector. The computed correlation between the graphed variables is negative after 2010, with board independence on the rise (from 60% to 65%) and the average CO2 equivalent emissions experiencing a slight decrease (ca. −4.3% over a 10-year period) or staying level. It would appear, therefore, that changes in corporate governance may be at least in part responsible for the observed changes in the emitted CO2 levels.
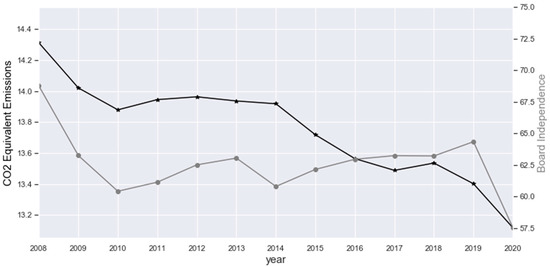
Figure 1.
Board independence vs. CO2 equivalent emissions (log-transformed).
While CO2 emissions of the energy sector have exhibited a steady downward trend, different dynamics are observed in coal output (Figure 2). Our findings suggest that over the last decade (2010–2019) the average coal output in the energy sector increased by ca. 1.8%, driven primarily by emerging markets. At the same time, across all geographies we documented a steady increase in independence of supervisory boards of energy firms. Thus, our preliminary graphical analysis suggests that the nexus between board independence and transition towards sustainable energy operations depends on geography and may vary significantly across time.
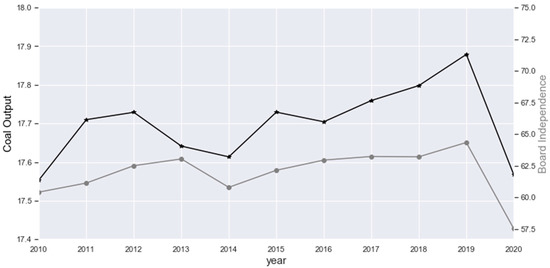
Figure 2.
Board independence vs. energy firms’ average coal output (log-transformed).
For further empirical investigation, we used univariate statistical tests of differences in means. First, we split the research sample into three equal subsamples based on firms’ board independence (subsample 1 features firms with the lowest level of board independence in the sample; subsample 3—with the highest). We subsequently compared the created subsamples across a number of parameters characterizing their environmental policies and energy transition. The results are presented in Table 3. It is worth noting that the tests are based on comparison of subsample means, which may be subject to distortionary impact of outliers. In order to rule out this possibility, we ran variable winsorization and checked for normality of distributions of the tested variables (results are not shown). Log-transformation was used in the event that variables’ distributions deviated from normal.
Table 3.
Univariate test results.
To start with, we demonstrate that firms with higher board independence are significantly more likely to be involved in environmental controversies (5.5% higher chances—as measured by cross-sample contrast—in subsample 2 compared to subsample 1; 4.8% higher chances in subsample 3 compared to subsample two). Firms in subsamples 2 and 3 are also significantly less likely to implement resource use reduction targets (contrast: −8.9%; sig.: 1%). The same negative link is observed between board independence and firms’ propensity to adopt energy efficiency policy (contrast: −25.06% between subsamples 2 and 1; sig.: 1%).
Coal output, in contrast, is positively associated with board independence. Firms from the top tercile in terms of board independence have the highest coal output (contrast: 1.32; sig.: 1%), with a gradual decrease observed across the remaining subsamples. Likewise, CO2 equivalent emissions are also rising along with board independence (contrast: 0.78 between subsamples 3 and 1; sig.: 1%). The production of renewable energy exhibits no link with board independence, possibly due to the fact that many of the sampled companies are not involved in this type of activity. Environmental expenses are significantly lower in firms with a higher percentage of independent directors.
Overall, univariate statistical tests strongly suggest that board independence is not associated with faster transition towards sustainable energy generation or better environmental performance. In contrast, we find that energy companies with the highest percentage of independent directors report lower environmental expenses and higher coal output. In order to ensure robustness of the obtained results, we verified them relying on multivariate econometric analysis (model specification (1)).
Table 4 summarizes the results of logit regression models exploring factors affecting energy firms’ likelihood of being involved in environmental controversies. Our findings clearly suggest that board independence is positively associated with the likelihood of such events (coefficient: 0.047; sig.: 1%). The highest likelihood of environmental controversies is reported in the subsample of firms where the share of independent directors exceeds 75% (odds ratio: 4.76; sig.: 1%). Importantly, neither replacements of supervisory board members with outsiders nor voluntary/involuntary incumbents’ departures appear to alter the discovered pattern. While it is unlikely that the described nexus is causal, independent boards appear to be incapable of reducing the likelihood of environmental controversies. Since the latter are frequently occurring for reasons related to deficient compliance controls or supervisory forbearance, further investigation is necessary to investigate the fundamental reasons behind the reported empirical links. Other corporate governance settings, such as average board tenure or the presence of CEO on the board, do not affect the likelihood of adverse events.
Table 4.
Environmental controversies/disputes.
Table 5 reports the findings of binary logit models in which the explained variable is a dummy encoding the presence of emission targets within sampled energy companies. It is worth emphasizing that disclosure of emission targets in firms ESG reports does not necessarily translate into enforcement of the said targets. Therefore, their purpose is frequently to signal intentions rather than outline a strategic plan of energy transition. We demonstrate that emission targets are more likely to feature in ESG reports of firms, where independent directors constitute a majority in the supervisory boards (OR: 1.55; sig.: 1%). Two-tier corporate oversight structures, where supervisory boards have greater autonomy, are also documented to increase the likelihood of emission targets’ implementation (OR: 2.32; sig.: 1%). Similar findings concern resource reduction policies implementation (Table 6). We established that firms where board independence exceeds 75% are 1.65 times more likely to report implementing dedicated policies aimed at reducing their carbon footprint, improving the efficiency of operational processes and cutting costs. While these policies are gradually becoming a standard element of firms’ CSR strategy, the targets set in those policies remain optional. Thus, we established a robust link between board independence and declarative commitment to emission reduction. It suggests that within specific institutional environments, independent supervisory boards may become effective conduits for environmentally responsible energy policies.
Table 5.
Emission targets.
Table 6.
Resource reduction policy.
In addition to frequently declarative resource reduction policies and emission targets, we investigated the more rigorously enforced energy efficiency policies, which consisted of implementation of operational solutions aimed at reducing energy inputs per unit of output and revenue. In contrast to those already discussed, energy efficiency policies carry enforceable and measurable key performance indicators, and therefore their implementation may be regarded as actual progress towards sustainable energy operations.
In Table 7, we present the results yielded by binary logit models exploring the likelihood of implementation of energy efficiency policies. We demonstrate that such policies are more likely to be implemented within a two-tier system of corporate governance, where supervisory boards wield greater decision-making power. At the same time, such policies are much rarer (OR: 0.71; sig.: 5%) in firms where the share of independent board members exceeds 75%. Dynamic changes to the supervisory board structure are found to exercise no impact on the likelihood of energy efficiency policy adoption.
Table 7.
Energy efficiency policy.
Environmental expenses in the form of remediation fees, cleanup costs, and environmentally friendly technology improvements constitute one of the most important pecuniary elements of energy firms’ environmental policies. While the nominal value of such expenses has been on a steady rise over the last decade, important differences are observed between companies. Our study aims at verifying whether independence of supervisory boards of energy firms is associated with higher value of environmental expenses. We modeled ENV.EXP as a function of firms’ financials and corporate governance proxies. Our findings are reported in Table 8. We documented no significant link between board independence and firm-level environmental costs, regardless of a firms’ carbon footprint. Changes to board structure are evidenced to exercise no impact on the intertemporal dynamics of these costs. The only variable which turned out to be a strong reliable predictor of the scale of firms’ environmental costs is state ownership; the difference in environmental expenses borne by state-owned energy companies approaches 20%.
Table 8.
Total environmental expenses.
We also find that the output of renewable energy exhibits no associative link with board independence or any other corporate governance proxies (Table 9). None of the studied variables have been found to be a reliable predictor of renewable energy output. This result should be interpreted with caution, since many of the studied companies are not engaged in renewable energy business (therefore, we assign zero to their records of energy output).
Table 9.
Renewable energy output.
In contrast, the coal output exhibits a strong and statistically significant link with board independence (Supplementary 1, Table S1). On average, an increase of board independence by one percentage point between companies was found to be associated with a 0.19% increase of coal output. The highest coal output is recorded among firms where independent supervisory board members constitute more than 75% of the board. The largest producers of coal are state-owned (coeff.: 1.77; sig.: 1%). Interestingly, we find that an increase of board independence following a replacement of insider director with an independent board member is associated with a subsequent reduction of coal output by ca. 2.4%. However, the coefficient is not robust under different model specifications and carries statistical significance of 10%, therefore, it should be interpreted with caution. Overall, our findings suggest that higher board independence is unlikely to lead to slashing coal output and increasing renewable energy production.
Finally, in Table S2 (Supplementary 1) we summarize the findings of empirical tests of determinants of CO2 equivalent emissions. We find that on average, an increase of board independence by one percentage point is associated with a reduction of CO2 emissions by 0.036%. That translates into a very minor effect: an increase of board independence by 50% is likely to be associated with a reduction of emissions by ca. 1.5%. Overall, our findings suggest that board independence plays a negligible role in shaping firms’ movement towards sustainable [31] and emission-free energy generations.
5. Discussion: The Problem of Incentives in the Energy Sector
The findings ensuing from our empirical study strongly suggest that independent supervisory boards are unlikely to spur energy firms’ transition towards sustainable energy generation. Nevertheless, the discovered negligible impact of one of the core pillars of corporate stewardship on the pace of energy transition encouraged us to delve into its possible underlying causes.
The regulatory toolkit used for incentivizing energy transformation features two principal instruments: (1) coercion; (2) pecuniary penalties. While the former brings the externality-generating activity to a halt, the latter helps modify economic incentives by making environmentally irresponsible operations less profitable. Given the widespread adoption of the latter instrument across the majority of jurisdictions, we attempted to establish whether their use effectively modified the architecture of economic incentives. To that end, we assembled data on financial performance, executive compensation, and environmental footprint of sampled energy companies and analyzed co-dependencies between them.
To start with, an analysis of the interrelation between firms’ operational performance measured by return on assets (ROA) and CO2 emissions (Figure 3) clearly suggests that polluters report higher profitability than their less-polluting counterparts. Only in the case of state-owned companies does the relationship appear to be inverted. Thus, it seems that the prevalent cap-and-trade and penalties systems fail to render high-carbon-footprint activities less profitable. That, in turn, undermines incentives to implement environmentally responsible policies. Since the supervisory boards’ primary responsibility is to prioritize shareholders’ interests and aim at value maximization, pushing for implementation of energy transition appears to run against their core duties.
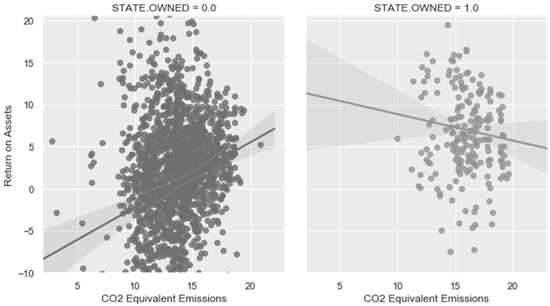
Figure 3.
The relationship between CO2 equivalent emissions and return on assets.
Further analysis of the link between executive compensation and CO2 emissions reveals similar results (Figure 4). Energy firms with a higher carbon footprint pay their executives more than their less-polluting counterparts. The existing system of economic incentives thus favors the status quo by not penalizing excess carbon footprint. Once again, supervisory boards’ possible decisions represent only a reaction to the existing system of incentives and institutional action. Any impending reforms aimed at fostering energy transition should, therefore, primarily target the existing set of economic incentives instead of imposing formal requirements on firms’ corporate governance structures.
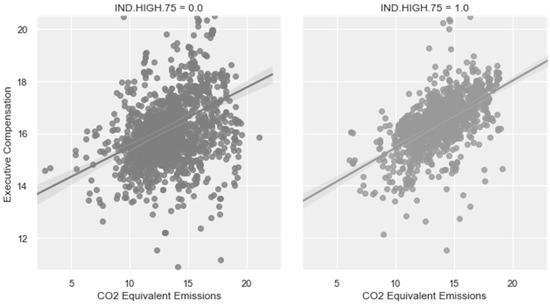
Figure 4.
The relationship between CO2 equivalent emissions and executive compensation.
The empirical results reported in the paper are in line with the extant literature, which suggests that independent supervisory boards tasked with protecting shareholder value are unlikely to advocate an overhaul of firms’ environmental policies whenever the existing incentive structure does not compensate for the explicit costs of such changes [17]. The observed lack of persistent link between supervisory board independence and energy transformations suggests that changes in the firms’ institutional and regulatory environments may be regarded as necessary prerequisites for launching sector-wide changes.
6. Conclusions
The purpose of the present study was to establish whether independent supervisory boards could accelerate transition of energy companies towards sustainable energy generation. The findings reported in the paper strongly suggest that board independence is not a sufficient precondition for radical changes in energy firms’ mode of operations. Instead, independent boards merely navigate firms through the changing regulatory environment by implementing changes in response to top-down legislative pressure. We also evidence that the reason behind the established weak link between corporate governance and firms’ environmental performance may stem from the prevailing system of economic incentives, which appears to insufficiently penalize environmentally irresponsible operational activities. The findings reported in the study could serve as a background for further regulatory modifications by offering relevant targets for further remedial action.
To our knowledge, the present study is the first to undertake an extensive comparative international analysis of environmental policies of energy companies while investigating the underlying system of economic incentives. Prior studies are geographically constrained and encompass very limited samples of firms. The present paper accomplishes two complementary tasks. First, it points to a lack of any significant link between board structure of energy firms and the pace of environmental policy transition. Secondly, it hints at the underlying reason of the discovered empirical relationships, i.e., a misalignment of economic incentives. Both have significant implications for further development of sector-specific regulations and long-term business planning.
While the paper relies on robust methodological toolkit and utilizes a number of complementary experimental variables, a few limitations impacting the interpretation of research results should be pointed out. To start with, the study is based on an international sample. While including country dummies into the regression models alleviates concerns related to a sample’s geographical heterogeneity, the latter may not allow for formulating policy recommendations carrying high jurisdiction specificity. Secondly, further empirical analysis is necessary to elucidate the exact transmission mechanisms by which supervisory boards may impact energy firms’ environmental policy transformations. Such studies would need to focus on exploring internal organizational dynamics and roles of decision-making centers (executives, supervisory boards, other stakeholders, etc.) in advocating policy transformations. In view of the highly complex nature of such decisions, a qualitative methodological toolkit may be better suited to tackling the enumerated tasks. Finally, further corroboratory studies should delve deeper into the problem of economic incentives in the energy sector. Further modifications of regulatory mechanisms aiming at fostering energy transition should assure that pecuniary compensation for undertaking costly energy transformations outweigh the upfront costs ensuing therefrom. Further empirical studies exploring incentive compatibility between different stakeholder groups in the energy sector are warranted.
Supplementary Materials
The following are available online at https://www.mdpi.com/article/10.3390/en14175293/s1, Supplementary 1, Table S1: CO2 equivalent emissions, Table S2: Coal output.
Author Contributions
Conceptualization, D.O.; methodology, D.O.; software, D.O.; validation, D.O., M.W. and S.Z.; formal analysis, S.Z.; investigation, M.W.; resources, S.Z.; data curation, S.Z.; writing—original draft preparation, S.Z.; writing—review and editing, D.O. and M.W.; visualization, D.O.; supervision, M.W.; project administration, M.W.; funding acquisition, M.W. and S.Z. All authors have read and agreed to the published version of the manuscript.
Funding
This research received no external funding.
Institutional Review Board Statement
Not applicable.
Informed Consent Statement
Not applicable.
Data Availability Statement
Data used in the study are available from the corresponding author upon request.
Conflicts of Interest
The authors declare no conflict of interest.
References
- Zhang, D.; Zhang, Z.; Ji, Q.; Lucey, B.; Liu, J. Board characteristics, external governance and the use of renewable energy: International evidence. J. Int. Financ. Mark. Inst. Money 2021, 72, 101317. [Google Scholar] [CrossRef]
- Sharfman, M.; Fernando, C. Environmental risk management and the cost of capital. Strateg. Manag. J. 2008, 29, 569–592. [Google Scholar] [CrossRef]
- Atif, M.; Hossain, M.; Alam, M.; Goergen, M. Does board gender diversity affect renewable energy consumption? J. Corp. Financ. 2021, 66, 101665. [Google Scholar] [CrossRef]
- Sarkodie, S.; Adams, S.; Leirvik, T. Foreign direct investment and renewable energy in climate change mitigation: Does governance matter? J. Clean. Prod. 2020, 263, 121262. [Google Scholar] [CrossRef]
- Shi, M. Overinvestment and corporate governance in energy listed companies: Evidence from China. Financ. Res. Lett. 2019, 30, 436–445. [Google Scholar] [CrossRef]
- Ortas, E.; Alvares, I.; Zubeltzu, E. Firms’ board independence and corporate social performance: A meta-analysis. Sustainability 2017, 9, 1006. [Google Scholar] [CrossRef]
- Fraile, I.; Fradejas, N. The effect of the monitoring function and advisory function on board structure. Rev. Esp. Financ. Contab. 2012, 41, 9–38. [Google Scholar] [CrossRef]
- Hazarika, S.; Karpoff, J.; Nahata, R. Internal corporate governance, CEO turnover, and earnings management. J. Financ. Econ. 2012, 104, 44–69. [Google Scholar] [CrossRef]
- Holmstrom, B. Pay without performance and the managerial power hypothesis: A comment. J. Corp. Law 2005, 30, 703. [Google Scholar] [CrossRef]
- Nguyen, B. Does the rolodex matter? Corporate elite’s small world and the effectiveness of boards of directors. Manag. Sci. 2012, 58, 236–252. [Google Scholar] [CrossRef]
- Masulis, R.; Wang, C.; Xie, F. Does the rolodex matter? Globalizing the boardroom—The effects of foreign directors on corporate governance and firm performance. J. Account. Econ. 2012, 53, 527–554. [Google Scholar] [CrossRef]
- Roe, M. Corporate short-termism—In the boardroom and in the courtroom. Bus. Lawyer 2013, 68, 977–1006. [Google Scholar] [CrossRef][Green Version]
- Hoang, T.; Przychodzen, W.; Przychodzen, J.; Segbotangni, E. Does the rolodex matter? Environmental transparency and performance: Does the corporate governance matter? Environ. Sustain. Indic. 2021, 10, 100123. [Google Scholar] [CrossRef]
- Haque, F. Does the rolodex matter? The effects of board characteristics and sustainable compensation policy on carbon performance of UK firms. Br. Account. Rev. 2017, 49, 347–364. [Google Scholar] [CrossRef]
- Prabhakant, T. Does the rolodex matter? Energy payback time and life-cycle conversion efficiency of solar energy park in Indian conditions. Int. J. Low-Carbon Technol. 2009, 4, 182–186. [Google Scholar] [CrossRef][Green Version]
- Costa-Campi, M.; Davi-Arderius, D.; Trujillo-Baute, E. Does the rolodex matter? Locational impact and network costs of energy transition: Introducing geographical price signals for new renewable capacity. Energy Policy 2020, 142, 111469. [Google Scholar] [CrossRef]
- Falato, A.; Kadyrzhanova, D.; Lel, U. Does the rolodex matter? Distracted directors: Does board busyness hurt shareholder value? J. Financ. Econ. 2014, 113, 404–426. [Google Scholar] [CrossRef]
- Zhang, Y.; Song, Y. Does the rolodex matter? Environmental regulations, energy and environment efficiency of China’s metal industries: A provincial panel data analysis. J. Clean. Prod. 2021, 280, 124437. [Google Scholar] [CrossRef]
- Chowdhury, R.; Doukas, J.; Park, J. Stakeholder orientation and the value of cash holdings: Evidence from a natural experiment. J. Corp. Financ. 2021, 69, 102029. [Google Scholar] [CrossRef]
- Steffen, S. Estimating the cost of capital for renewable energy projects. Energy Econ. 2020, 88, 104783. [Google Scholar] [CrossRef]
- Tolliver, C.; Keeley, A.; Managi, S. Policy targets behind green bonds for renewable energy: Do climate commitments matter. Technol. Forecast. Soc. Chang. 2020, 157, 120051. [Google Scholar] [CrossRef]
- Gillan, S.; Koch, A.; Starks, L. Firms and social responsibility: A review of ESG and CSR research in corporate finance. J. Corp. Financ. 2021, 66, 101889. [Google Scholar] [CrossRef]
- Campbell, K.; Johnston, D.; Sefcik, S.; Soderstrom, N. Executive compensation and nonfinancial risk: An empirical examination. J. Account. Public Policy 2007, 26, 436–462. [Google Scholar] [CrossRef]
- Heaps, T. Corporations Are Going Green by Linking Executive Pay to Energy and Emission Targets. Newsweek, 4 June 2015. Available online: https://www.newsweek.com/corporations-are-going-green-linking-executive-pay-energy-and-emissions-338708 (accessed on 10 April 2021).
- El Ghoul, S.; Guedhami, O.; Kwok, C.; Mishra, D. Does corporate social responsibility affect the cost of capital? J. Bank. Financ. 2011, 35, 2388–2406. [Google Scholar] [CrossRef]
- Cai, L.; He, C. Corporate Environmental responsibility and equity prices. J. Bus. Ethics 2014, 125, 617–635. [Google Scholar] [CrossRef]
- Gallego-Alvarez, I.; Segura, L.; Martinez-Ferrero, L. Carbon emission reduction: The impact on the financial and operational performance of international companies. J. Clean. Prod. 2015, 103, 149–159. [Google Scholar] [CrossRef]
- Arayssi, M.; Jizi, M.; Tabaja, H. The impact of board composition on the level of ESG disclosures in GCC countries. Sustain. Account. Manag. Policy J. 2020, 11, 137–161. [Google Scholar] [CrossRef]
- Kim, S.; Li, Z. Understanding the impact of ESG practices in corporate finance. Sustainability 2021, 13, 3746. [Google Scholar] [CrossRef]
- Khan, M. Corporate governance, ESG, and stock returns around the world. Financ. Anal. J. 2019, 75, 103–123. [Google Scholar] [CrossRef]
- Zabolotnyy, S.; Wasilewski, M. The concept of financial sustainability measurement: A case of food companies from Northern Europe. Sustainability 2019, 11, 5139. [Google Scholar] [CrossRef]
Publisher’s Note: MDPI stays neutral with regard to jurisdictional claims in published maps and institutional affiliations. |
© 2021 by the authors. Licensee MDPI, Basel, Switzerland. This article is an open access article distributed under the terms and conditions of the Creative Commons Attribution (CC BY) license (https://creativecommons.org/licenses/by/4.0/).