1. Introduction
Over the past few years, the Brazilian energy matrix has been expanding its capacity to generate electricity from renewable sources.
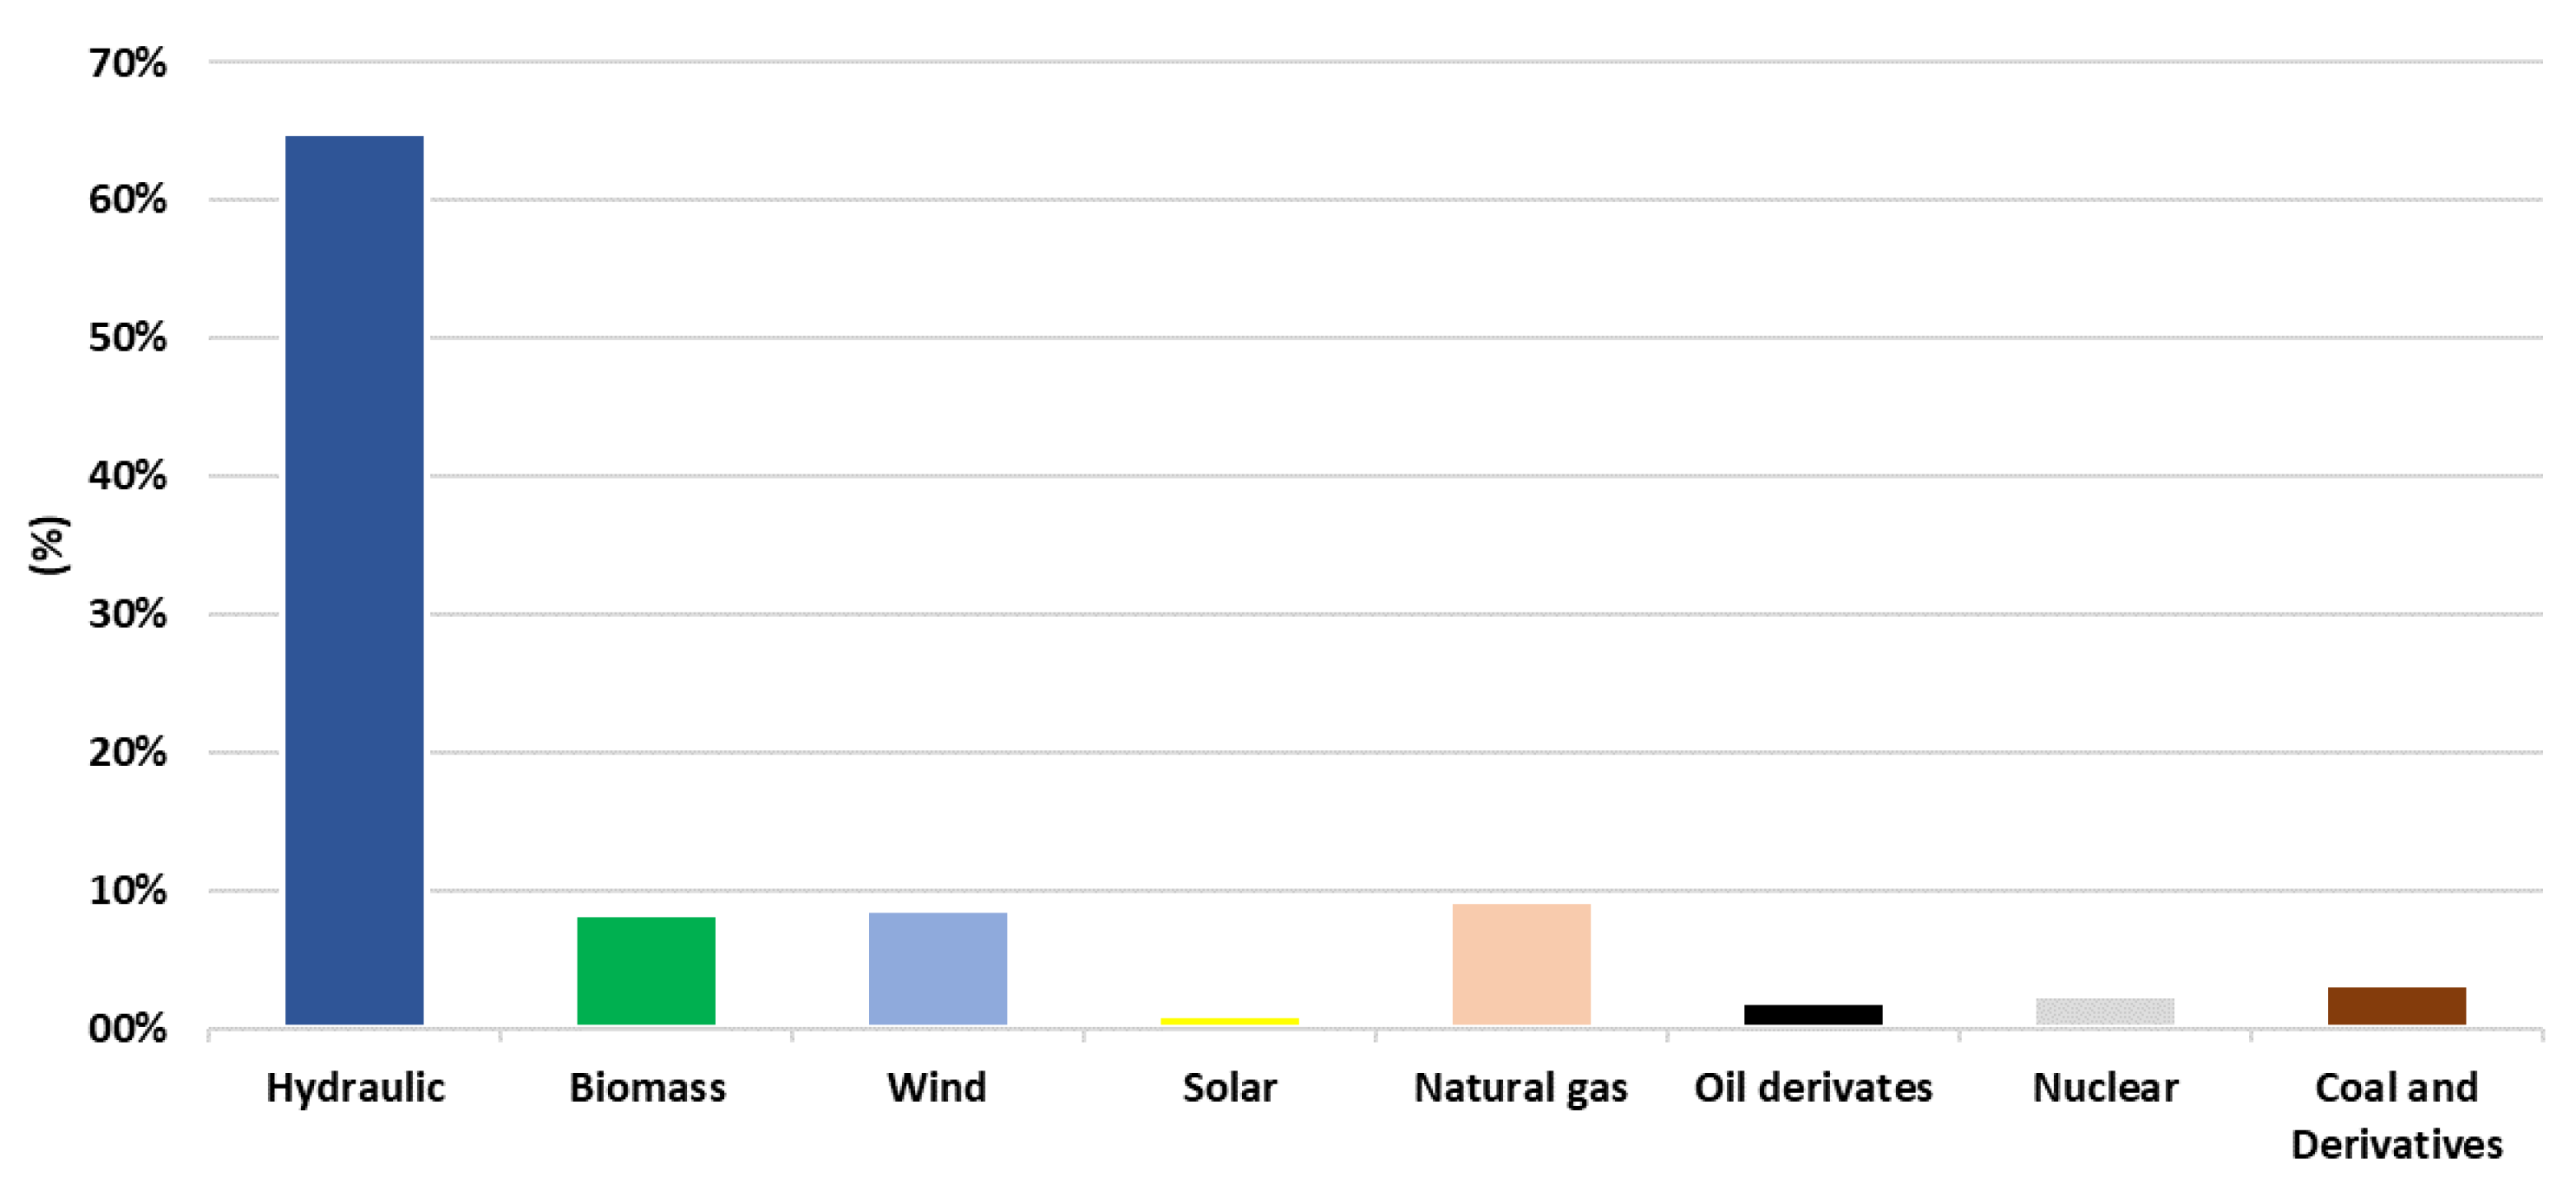
Figure 1 shows the percentage distribution of generation sources in 2020, based on 2019, which adds up to a total generation of 651.3 TWh, according to the National Energy Balance Synthesis Report [
1].
Given the vast territorial extension of Brazil, it is possible to identify regions of low and medium latitudes, with different patterns of precipitation and temperature. The Amazon region has very high average rainfall, especially between the months of November and March, when compared to regions in the northeastern semiarid region. In Brazil, the average annual temperature ranges from 18 °C to 29 °C in a large part of the territory, with higher average values observed in the North and Northeast regions, so that, in these regions, the maximum temperature averages reach values as high 33 °C in December [
2]. According to [
3,
4], it is possible to visualize the monthly variation of irradiation in different regions in Brazil, showing its large solar photovoltaic generation capacity at any time of the year, despite the variation in its intensity.
The ANEEL (National Electric Energy Agency) normative resolution 687/2015, has contributed to the growth of distributed generation sources in Brazil. In addition, a set of government incentives, high electricity costs, reduction in the cost of photovoltaic panels, as well as the availability and potential of the solar resource throughout the country, have allowed photovoltaic generation source to grow exponentially in the country, as can be seen in
Figure 2.
Despite the benefits that distributed solar generation brings in economic and ecological terms, due to its non-dispatched nature and the limited availability window of solar irradiation, its generation is limited to meeting demand at the same time it is being generated. Until now, the existing rules in Brazil do not allow the use of energy storage systems connected to the power grid, making some generation systems less efficient. However, this scenario is expected to change in the coming years, since, in 2016, the ANEEL created a strategic public notice for research and development (R&D) on battery energy storage technologies through public call N° 21/2016. The project aims to develop and test energy storage systems, operating in on-grid systems. Among its advantages, the implementation and approval of on-grid storage systems, will result in the possibility of altering the energy demand and generation curves, greater stability of the electricity grid, better use of intermittent renewable energy sources and, consequently, reductions in energy consumption and carbon emissions.
Countries such as the United States, Japan, Korea, China and Germany have implemented storage systems through policies and incentives for their use, and by 2018, there were approximately 9 GW/17 GWh of energy storage power capacity in operation globally [
6]. Although storage systems continue to be developed, a study by [
7] reports that the implementation of new materials resulted in a 87% reduction in the cost of lithium-ion batteries from 2010 (1183 US/kWh) to 2019 (156 US/kWh). Currently technologies such as lithium iron phosphate (LiFePO
4), lithium-nickel cobalt aluminum (NCA), lithium oxide cobalt (LCO), lithium-nickel-manganese-cobalt (NMC), lithium-manganese spinel (LMO) or lithium titanate (LTO) are used in storage systems with which longer life cycles, high power capability, high discharge rates, and constant voltage profiles can be obtained [
8,
9,
10].
There are still hundreds of locations in the world that have difficulty or no connection to their respective countries main electricity grid. In Brazil, ONS, the National Electric System Operator, reports that there are 212 isolated locations [
11]. Specifically in the Amazon region, public service utilities have difficulties in providing electricity services in forested regions, mainly due to the difficulties or total impossibility of reaching them due to the characteristics of the region. In these regions, when supplied, the electricity is mainly provided by community generators powered by fossil fuels or photovoltaic energy, normally installed with stationary lead acid batteries, which have a reduced useful lifespan. Experiments and studies show that hybrid systems are more efficient than diesel systems both in economic and environmental terms, especially in regions without a connection to the power grid, revealing themselves as a possible solution to these problems.
To improve the efficiency of distributed generation, whether operating with a hybrid system (HS) and storage system, it is also recommended to use technologies to implement smart grid features, to manage the variability of generation sources and the demand of users and the electric grid itself. The smart grid aims to make each process efficient (generation, storage and consumption), making the service continuous, reliable and economical.
Studies considering hybrid systems including photovoltaic-diesel-wind and storage systems have been presented in [
12,
13,
14,
15,
16,
17]. In this HS model, both batteries and generators perform backup functions for continuity of service. However, given the operational characteristics of batteries, such as better control of voltage and frequency, as well as less environmental impact, these are activated first than diesel generators. With this, the HS has more flexibility to manage the electric grid energy balance and the useful life of the equipment, increasing the reliability, continuity, and stability to the loads.
In some European communities, there has been discussion about the reduction of fossil fuels through the use of renewable generation sources and energy management with the help of storage systems, even if connected to the utility’s electricity grid, transforming themselves into self-sustainable communities, as shown in the works [
18,
19,
20]. In Brazil, due to local legislation, only large companies have implemented self-generation, in addition to managing energy generation and demand, using by-products from their production line as fuel for steam heating in boilers coupled to electric turbines (thermoelectric) [
21,
22].
Previous studies have separately discussed the use of renewable sources as a way to increase energy generation, as shown [
23,
24,
25]. The work elaborated by [
26,
27] shows the benefits of using the energy storage and management system to demand control as a financial attraction.
Reference [
28] highlights the importance of smart meters in electrical grids. References [
29,
30,
31] describe the computational development and the web module of an energy management system implemented in a university, as a way to mitigate possible problems in electrical energy quality, measure the efficiency of systems and reduce energy costs electric. To identify abnormalities in electricity consumption, references [
32,
33] used heuristic methods to detect unexpected consumption behaviors, aiming to reduce waste and, consequently, unnecessary energy costs. In [
34], a stochastic method was sought to explain the uncertainties of both consumption and energy generation.
Using different simulation methods, the integration of renewable sources, storage and diesel generation was present in other studies such as [
34,
35,
36,
37]. In [
38], the energy quality of a photovoltaic-diesel hybrid mini-grid (HMG) was analyzed using the simulation of input and output loads in the building. Thus, the main research and results found in the management of HMG are based on computer simulations, where few validate the results obtained experimentally.
A summary of the literature review related to HMGs and energy management, classified according to the approaches analyzed in this work, is presented in
Table 1.
The main contributions of this study is to provide real data on the operation and management of a HMG integrated with a utility’s electricity grid, as a strategy to reduce electricity costs, improve operational safety, increase the efficiency of using intermittent sources, in addition to discussing compensation at smaller scales, through the application of the HMG to small and medium-sized consumers in any region of the country, such as universities, residential and commercial condominiums, hospitals, shopping malls, among others. In addition, there is also the possibility of using hybrid systems in isolated communities that have difficulty in electrification via cables. As a way of exemplifying the contributions of this article for academic application and for future installations, the following are discussed:
Technical and operational analysis of real data from the HMG in off-grid and on-grid modes;
Statistical analysis of the management system behavior, according to stochastic variables such as load, photovoltaic generation, storage system and diesel generator;
The economic analysis of the financial benefits arising from energy management in small- and large-scale applications.
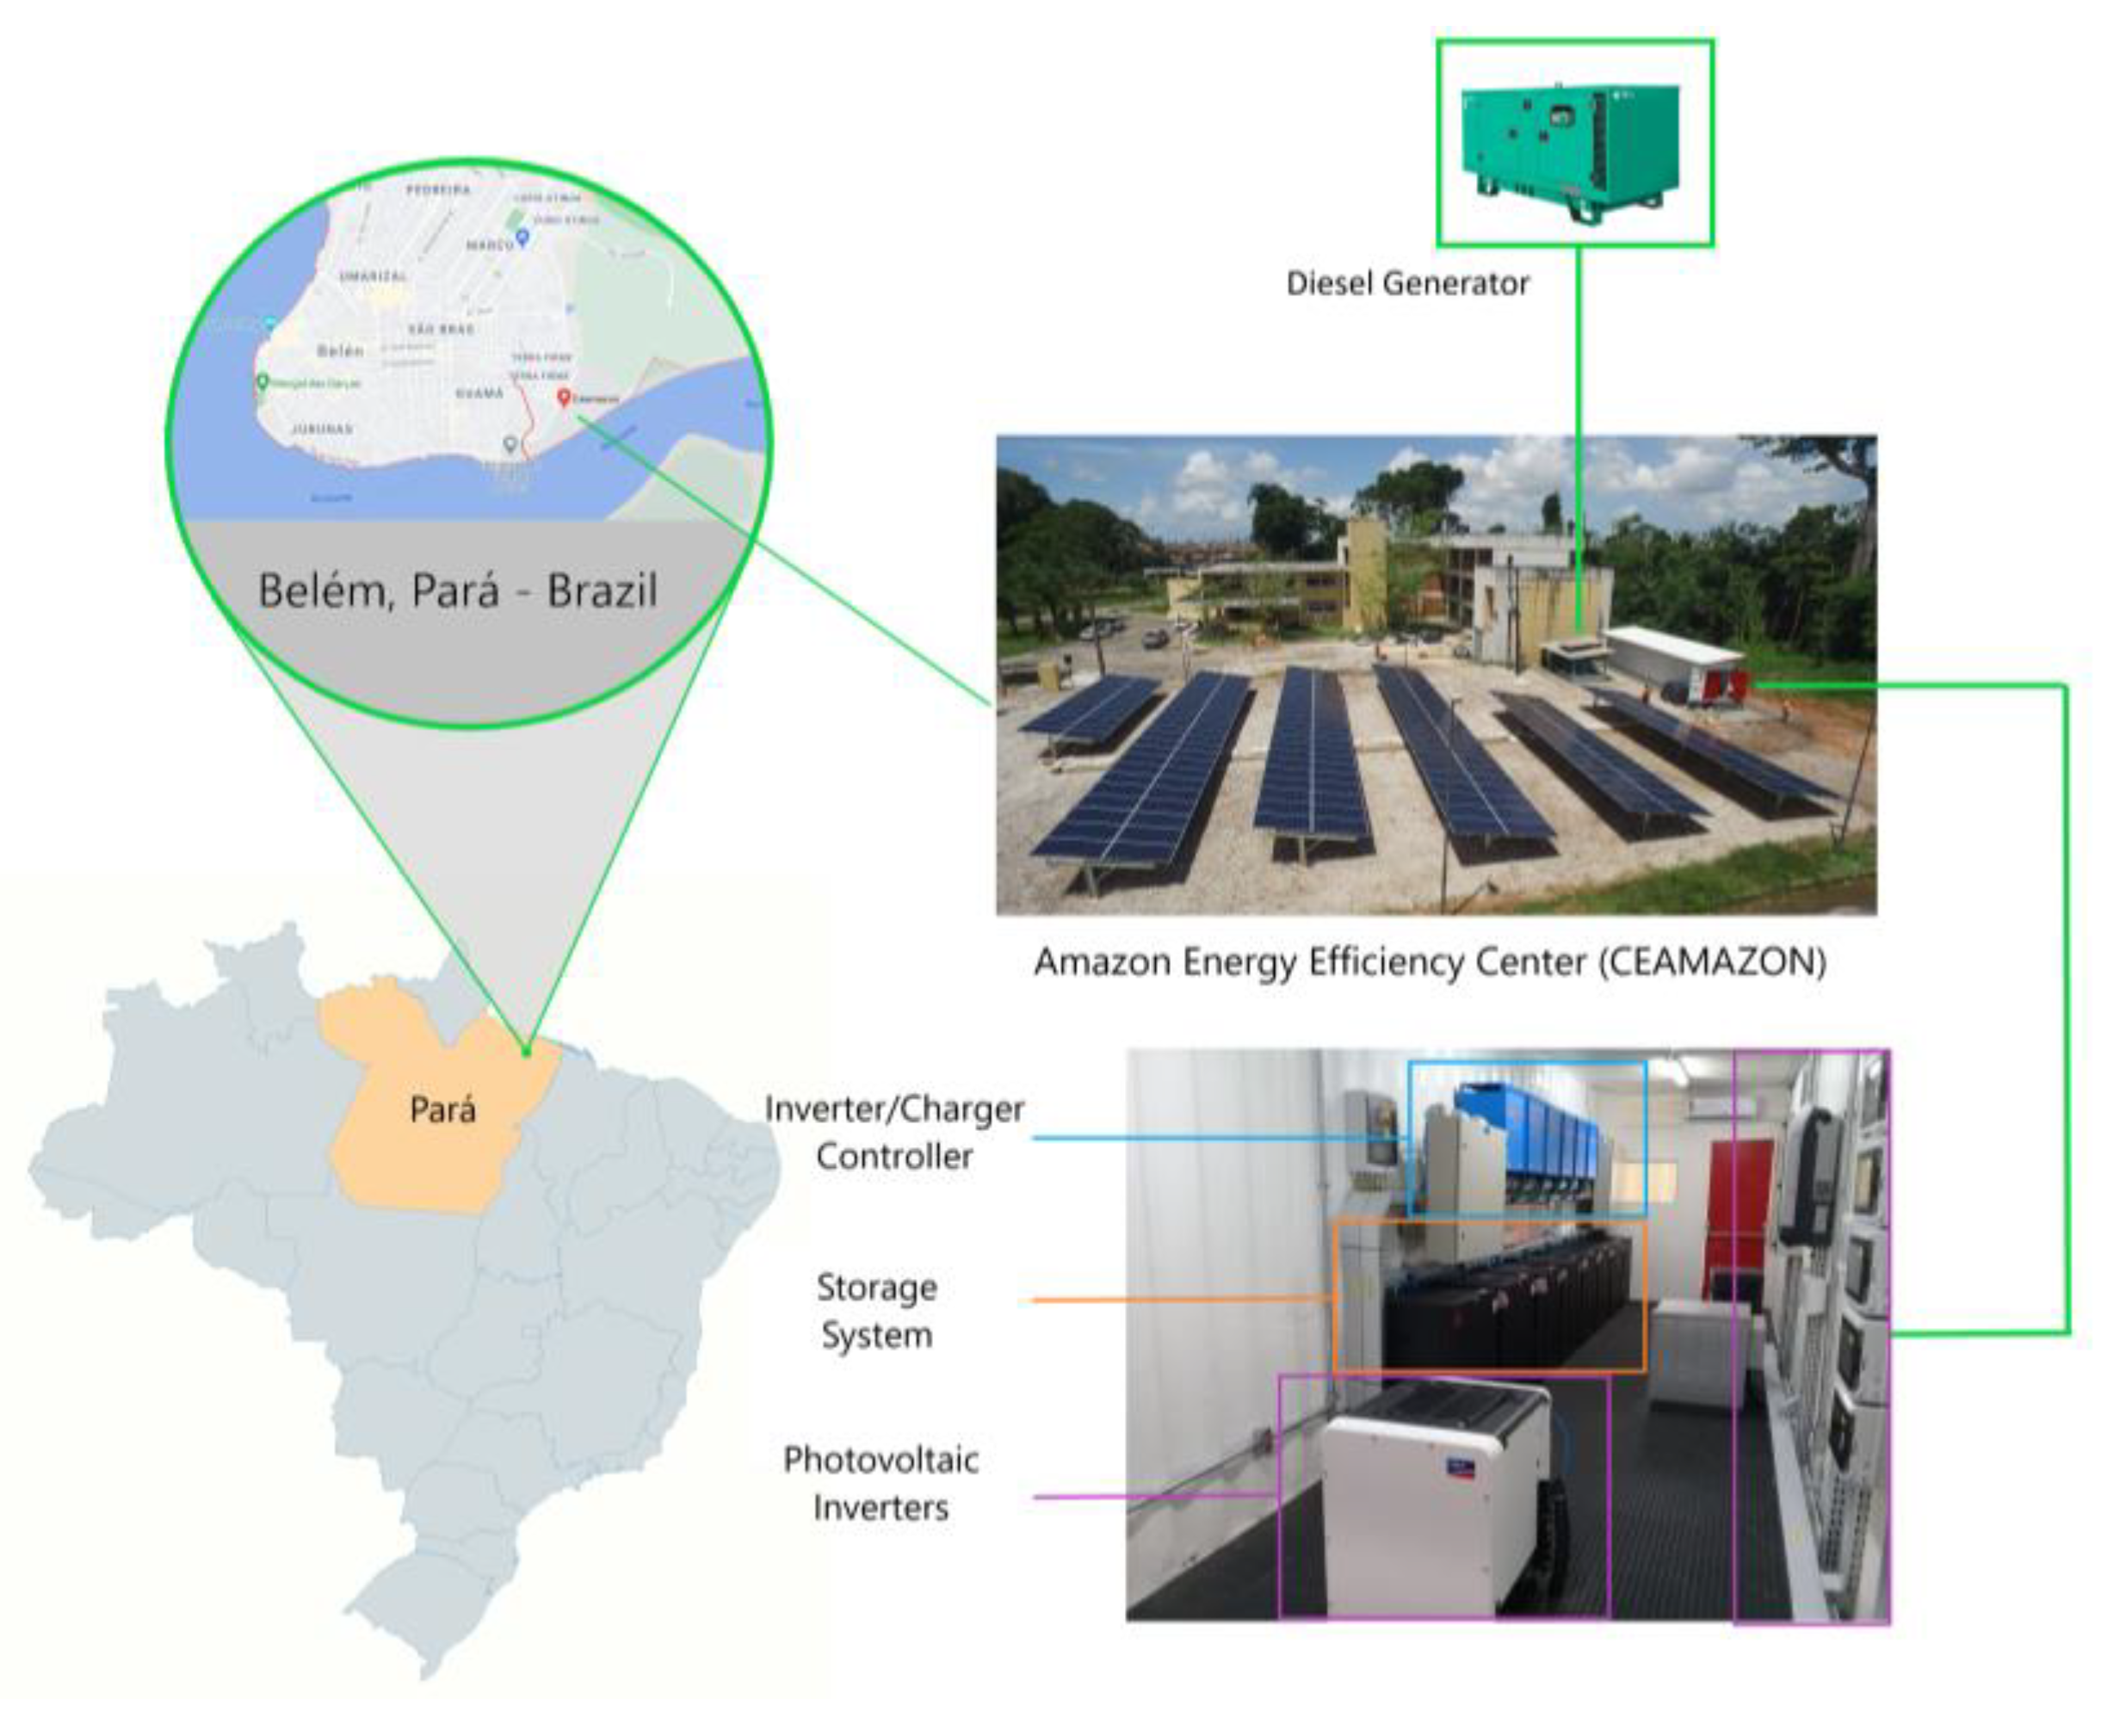
This work analyzes the functioning of a true hybrid system installed at the Center for Energy Efficiency in the Amazon (CEAMAZON) of the Federal University of Pará (UFPA), and composed of photovoltaic systems, electricity grid, diesel generator (DG) and a LiFePO
4 battery storage system. As a way to organize the article, it was divided as follows:
Section 2 provides a description of the HMG, composed of photovoltaic systems, storage system, diesel generator, CEAMAZON building loads and the energy management system.
Section 3 presents the management system methodology used to manage the energy generation and demand from the HMG operating in on-grid and off-grid modes.
Section 4 shows the technical analysis of three real scenarios of HMG operation, including results, technical solutions and possible applications in society through new business models for energy consumers and utilities.
Section 5 presents a financial analysis, given the implementation of the HMG with energy management. Finally,
Section 6 summarizes the main conclusions of the work.
3. Methodology for Hybrid Mini-Grid Operation Parameters Configuration
Despite the large solar irradiation in the region where the HMG is located, the seasonality of the rainy season, between November and March, affects PV generation. For the HMG operation, different configurations and parameters were defined for both on-grid and off-grid operation. Therefore, the proposed methodology for the management system aims to prioritize the use of renewable sources, predicting critical low solar availability scenarios, unavailability of energy supply by the utility, meeting the energy demand required by the building load, the cost of energy at times of largest consumption and also at times when energy is more expensive.
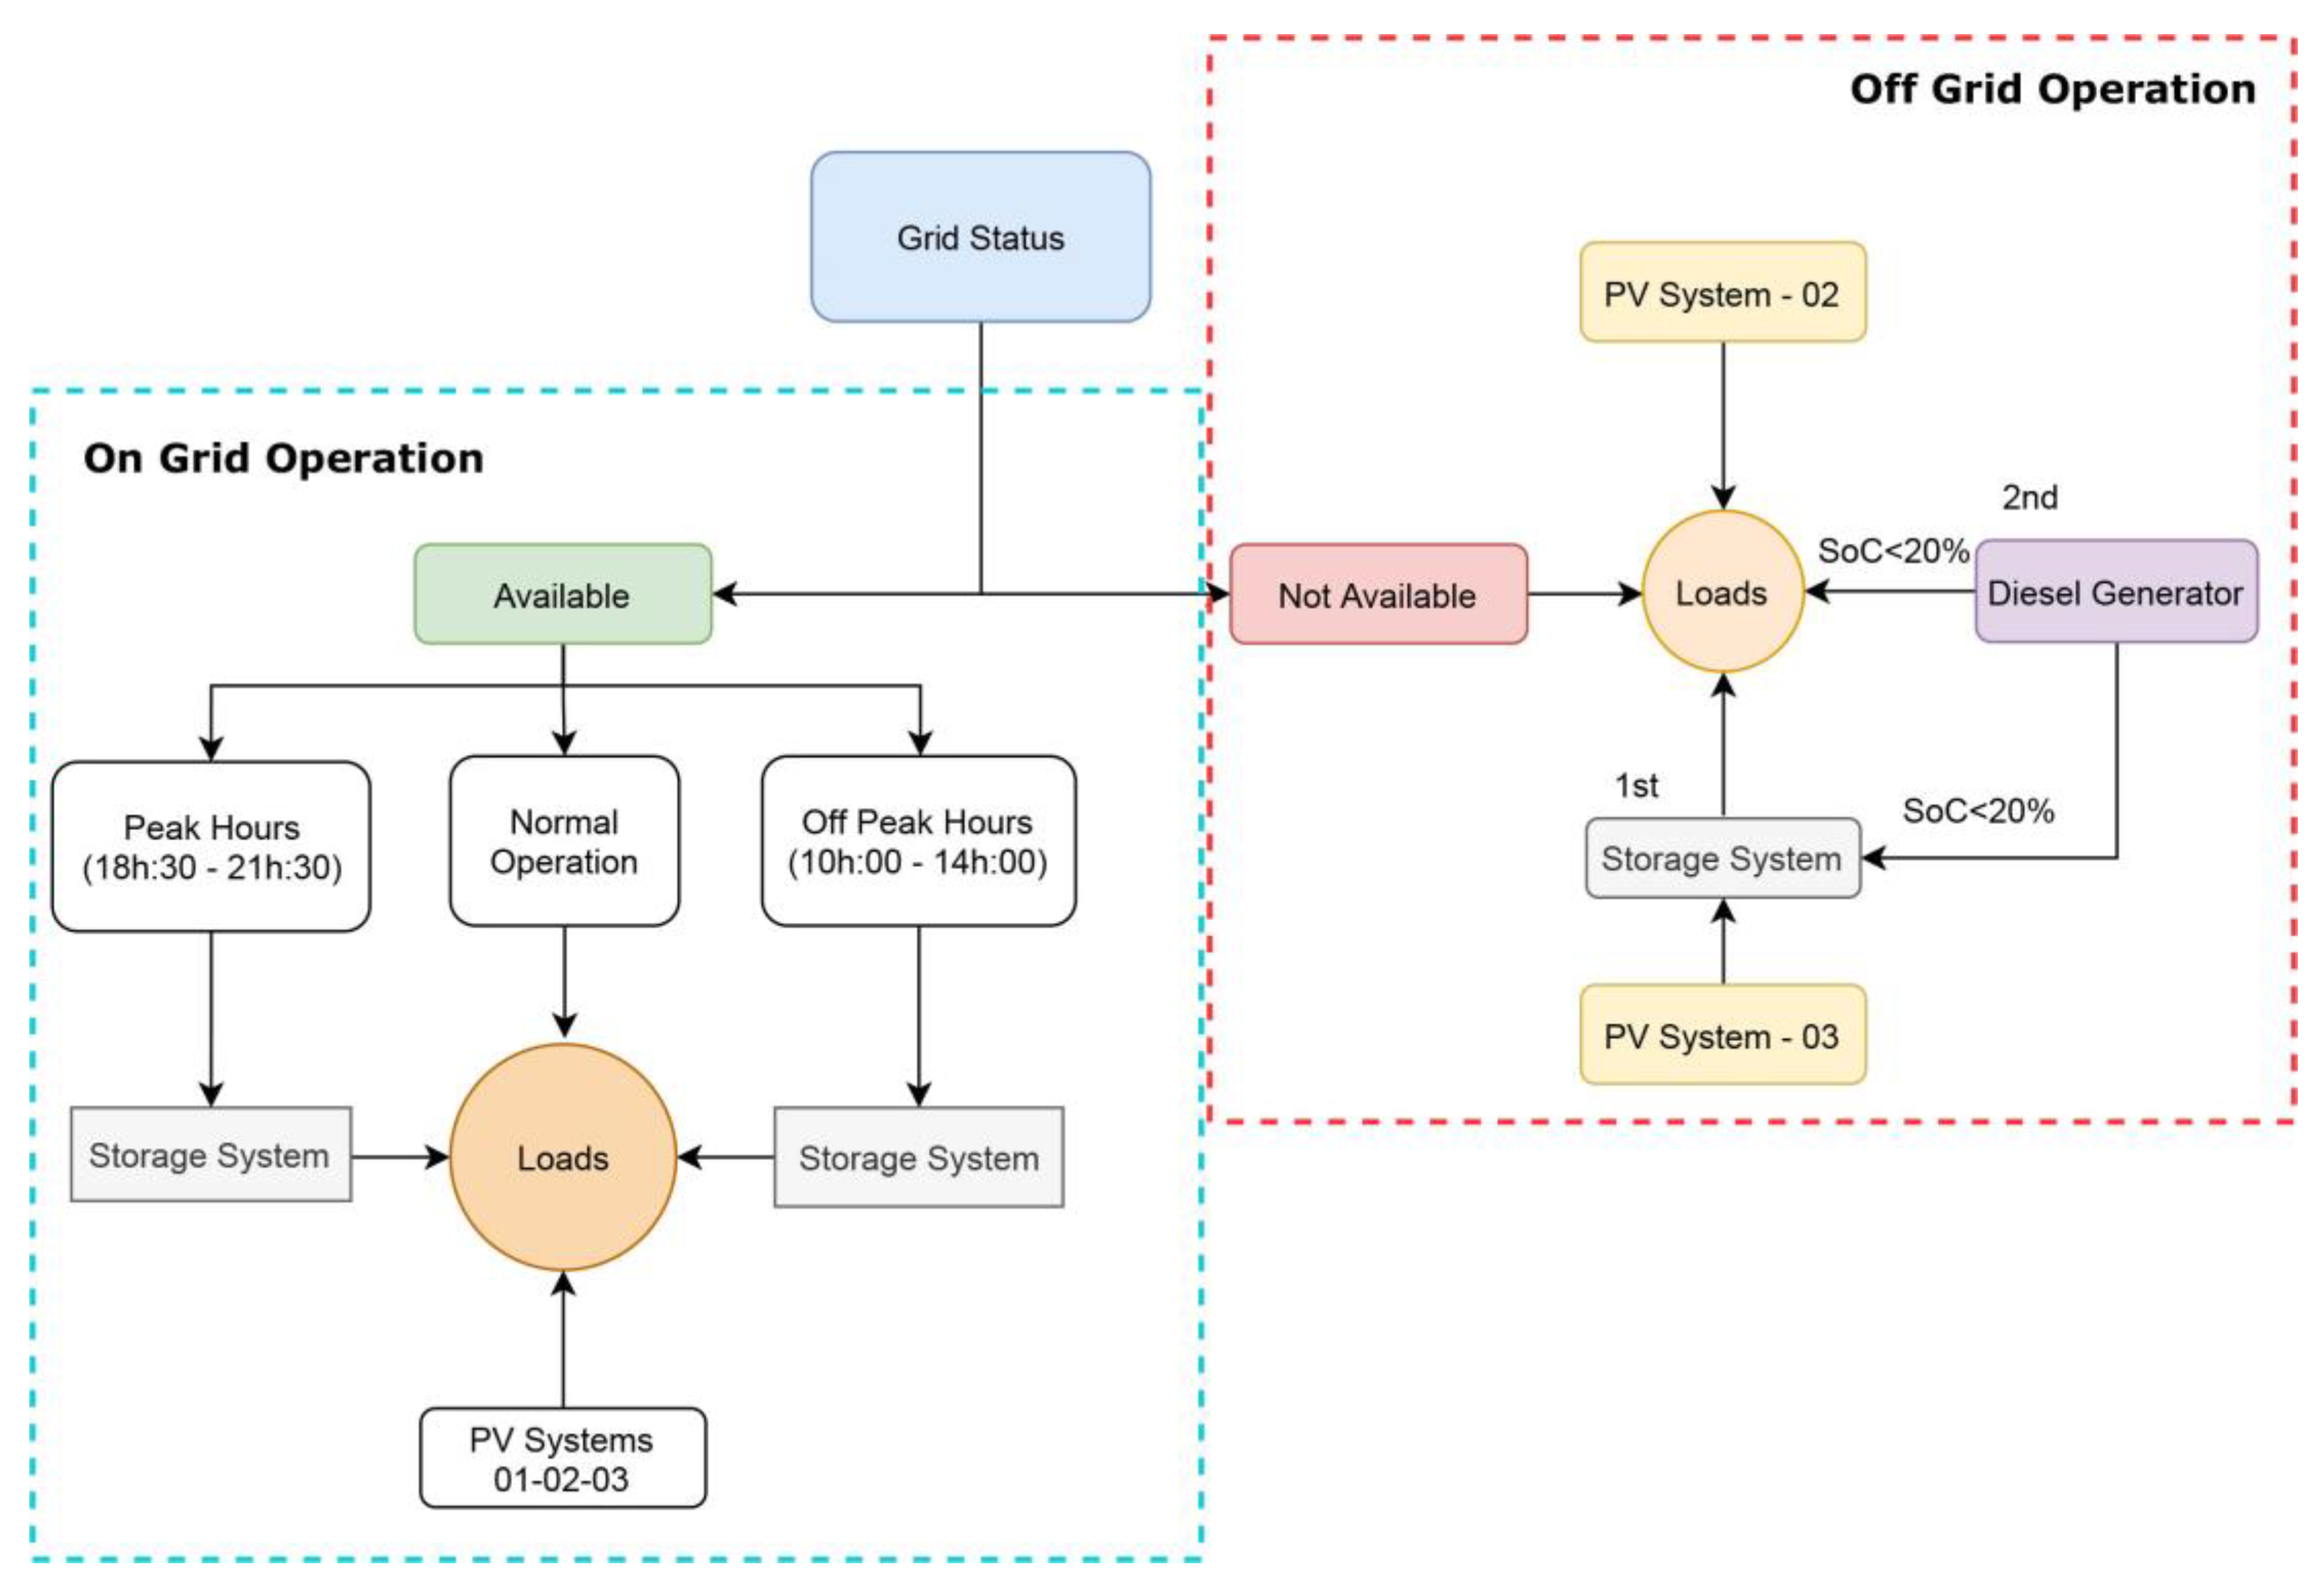
The on-grid and off-grid operation configurations are implemented as described in the flowchart of
Figure 6. These configurations generally aim to reduce electricity costs and increase the energy availability to the CEAMAZON building.
The off-grid management mode aims to maximize the use of photovoltaic generation and the batteries stored energy before using the diesel generator set. During off-grid operation the PV-CEAMAZON 01 system will be out of service, according to ABNT NBR IEC 62116: 2012 [
39], operational anti-island protection regulation in Brazil. However, the PV-CEAMAZON 02 and 03 systems will continue to generate energy to directly supply the loads and batteries, respectively.
At time a grid power failure occurs, the off-grid operation mode is activated, so the batteries assume the loads, maintaining the service continuity and reliability. The system controller will carry out the energy balance between the use of the PV generation systems, supplementing with the battery stored energy, if necessary. Even so, if the energy supply via the photovoltaic and battery sources is not enough, the system controller will start the DG set to service the loads in the CEAMAZON building. The mini grid management follows the instructions of the battery manufacturer, who recommends a maximum discharge of 80%, that is, its lower charging limit must not be less than 20%. In the case of an off-grid condition and a battery SoC less than 20%, the diesel generator will assume both the loads and the storage system charge until the utility grid energy is available.
The on-grid operation aims to carry out the mini-grid energy balance, in order to reduce the expenses with electricity, at peak times and in the hours of highest demand from the grid, in addition to guaranteeing the energy quality during temporary off-grid operation. While the external grid is available (on-grid operation), the three photovoltaic systems (PV-CEAMAZON 01, 02 and 03) will be operating normally, according to the availability of sunlight, and the batteries will start operating in the programmed periods, that is, peak times and times of highest demand from the grid, and temporarily operating in off-grid mode in case of grid fault conditions. In this condition, the DG will not start operating, even if the batteries reach the limit of equal or less than 20% of their capacities.
4. Technical Evaluation of the Hybrid Mini-Grid
For the on-grid and off-grid operating conditions technical and economic evaluation, three scenarios will be evaluated in this work and are presented in
Table 2.
The first scenario looks at the hybrid system operation in on-grid conditions, aiming at the operation in urban areas connected to the utility’s electric grid and disconnecting from the grid at scheduled periods. This scenario shows the benefits for consumers connected to the utility grid through HMG. The evaluation of the demand curve, in combination with renewable energy generation and the storage system can be useful to reduce peak demand and energy at higher cost from the utility grid. This scenario can be used by residential, commercial, public and industrial consumers, located in cities and who seek flexibility in demand management.
Then, the second scenario aims to simulate on-grid operation with the need for sudden off-grid operation, due to an interruption in the supply of the local utility’s electricity grid. This scenario aims to present the performance, system security and power quality in the energy supply, only with the use of photovoltaic and storage systems during the loss of the utility grid. Given the reliability, this scenario shows that HMG with batteries can be used in places that have an extreme need for continuity of operation, such as hospitals, airports, railways, ports, etc.
Finally, the third scenario also analyzes the off-grid operation after an energy interruption from the grid, however, the DG set operation was included, due to the batteries reaching their minimum limit (SoC < 20%) and the system being with little or no solar availability. This scenario can be replicated both in locations connected to the electrical grid, as in the second scenario, having even more security due to the redundancy of power supply; and in isolated locations, without the assistance of utility grid and which, for operational safety, can also activate the DG set until it has re-established the battery charge and/or energy through renewable sources, such as solar photovoltaic.
4.1. First Scenario: Normal Operation
4.1.1. Generation and Demand of Energy from the Hybrid Mini-Grid
The first scenario involves the production of electric energy from the three photovoltaic systems (PV-CEAMAZON 01, 02 and 03), to meet the loads of the mini-grid (CEAMAZON building and batteries) and the surplus is made available to UFPA’s internal electrical grid. However, during the off-grid operation, the loads in the CEAMAZON building will be served only by the PV-CEAMAZON 02 and 03 systems, inserted in the mini-grid, while the PV-CEAMAZON 01 system will be shut down.
Figure 7 shows the energy production curve of the three photovoltaic systems, over a week. In this period, the three photovoltaic systems achieve a production of up to 64 kWp.
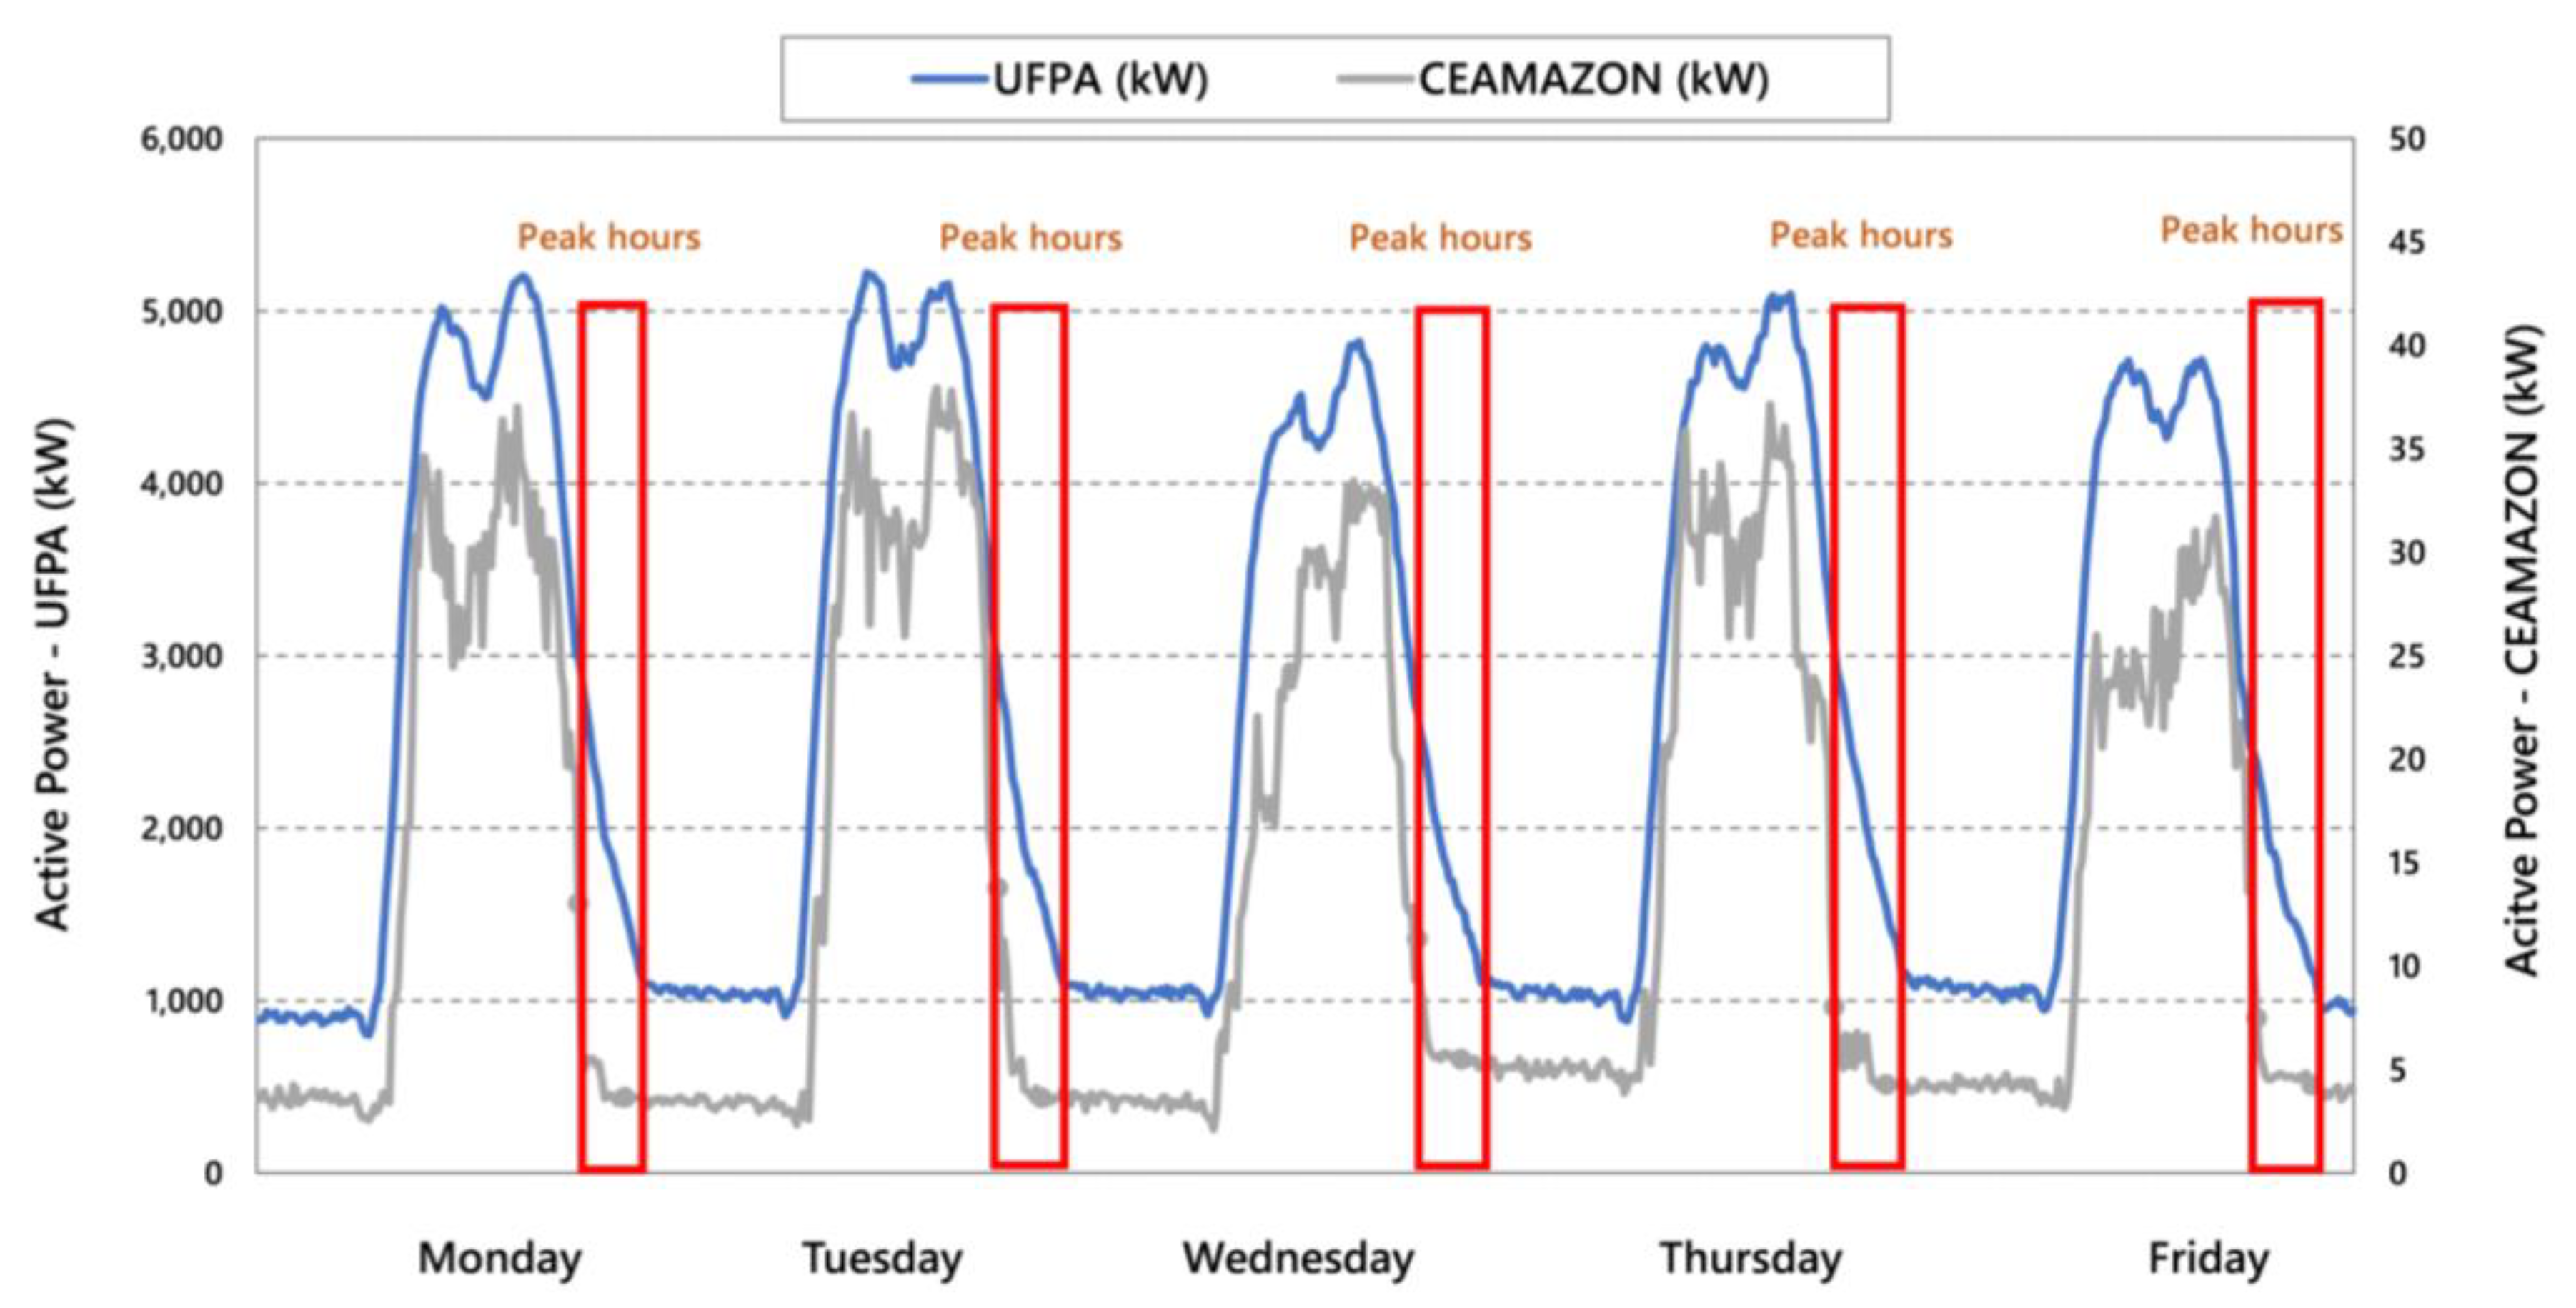
In the State of Pará, Brazil, for group A consumers, there are different tariff options that allow the customer to choose the contracted demand value (kW), according to their load profile. UFPA opted for the green tariff modality, which has a contracted demand (kW) for all weekdays and a difference in tariff for consumption (kWh) during off-peak hours (00:00 a.m. to 18:29 p.m. and 21:31 p.m. to 23:59 p.m.) and at peak hour (18:30 p.m. to 21:30 p.m.) [
40]. For the green hour-seasonal tariff modality, the tariff for energy consumption (kWh) during peak hours is almost 10 times higher than the value during off-peak hours. Unlike residential sectors and some commercial sectors, UFPA and CEAMAZON have peak demand during the day (off-peak hours), however, even if reduced, they maintain considerable consumption during peak hours.
Figure 8 shows the load curve characteristic at UFPA and the CEAMAZON building, considering the period of teaching classes from Monday to Friday and highlighting peak hours. Although the demand for the CEAMAZON building represents 0.7% of UFPA’s maximum demand, it is possible to verify that both have the same behavior.
Analyzing the HMG behavior, it was found that it is possible to carry out the energy balance between generation, storage, and demand of energy, providing better performance of generation sources and less use of the external electrical grid. In addition, the energy surplus generated by photovoltaic systems that was delivered to the utility, can be consumed in times of higher energy demand or less photovoltaic generation at other times of the year. Considering the building’s energy management, the energy balance allows to outline the CEAMAZON be defined as a zero-energy building (ZEB), since the energy supplied by the utility grid will be less than the generated renewable energy [
42].
4.1.2. Scheduled Operation of the Hybrid Mini-Grid to Demand Control
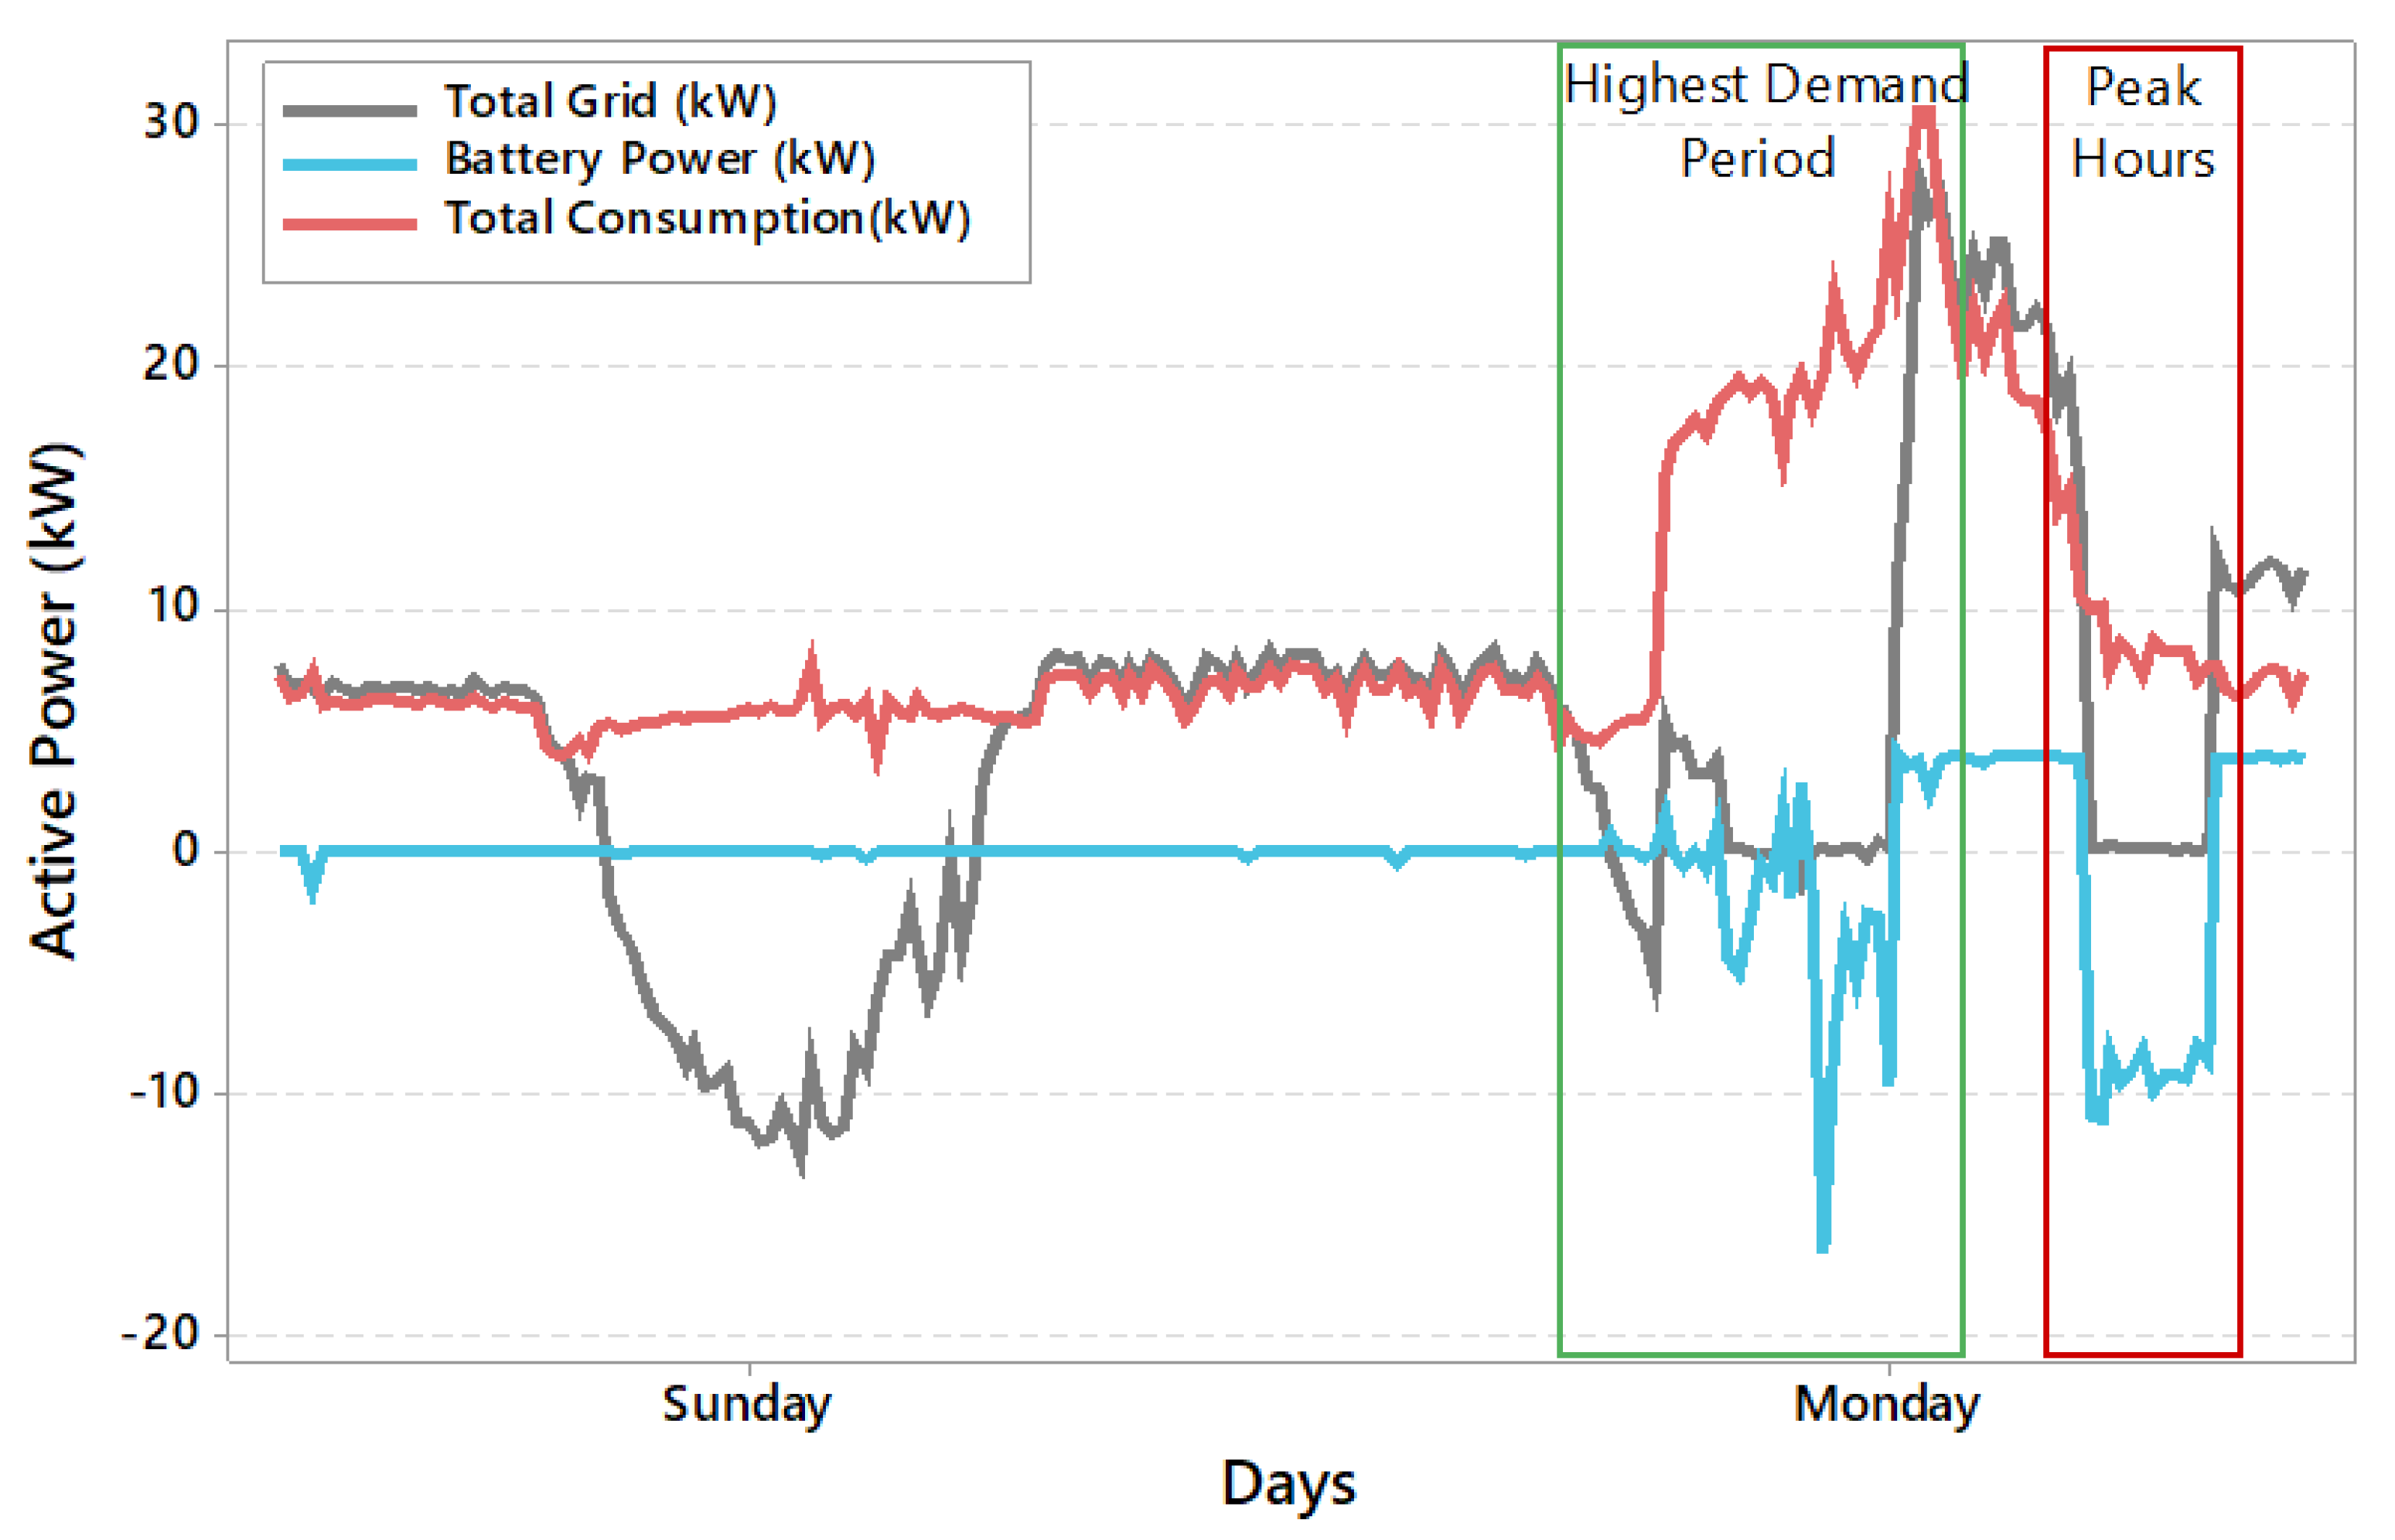
Given the batteries energy charge/discharge functionality and grid connectivity, an operation cycle was programmed in the CEAMAZON management system, in such a way that the HS was programmed to operate in off-grid condition between 10:00 a.m. and 14:00 p.m. (highest demand period) and from 18:30 p.m. to 21:30 p.m. (peak hours). The battery is recharged at the remaining periods, when exists solar potential and/or when the utility energy cost is cheaper. Thus, at these times, the power supply is interrupted by the external electrical grid, the HMG operates in off-grid mode and the load is fed by the storage system.
Figure 9 shows the HMG behavior on a typical weekend day and during the week (for the example, Sunday and Monday were used, respectively) considering the energy curves supplied by the external electrical grid, batteries and CEAMAZON building loads consumption. On weekends the storage system is in standby condition, due to the lack of peak hours on those days, in addition, due to low consumption and the incidence of photovoltaic generation, HMG supplies energy to the external grid. During the week, it is possible to check the times when the battery is supplying power to the building’s loads and when it is being charged. In reliability terms, according to the consumption curve (red color of
Figure 9), which represents the building loads, it is possible to verify that HMG is able to keep the loads supply continuity, without any loss in the supplied energy power, even in situations of sudden changes in the loads or solar power along the day.
As seen in
Figure 9, the batteries are in a discharging cycle period between 10:00 a.m. and 14:00 p.m. (highest demand period) and from 18:30 p.m. to 21:30 p.m. (peak hours) and recharging at other times. In the 06:00 a.m. to 18:00 p.m. time period, the storage system relies on the power supply of the PV-CEAMAZON 02 and 03 systems.
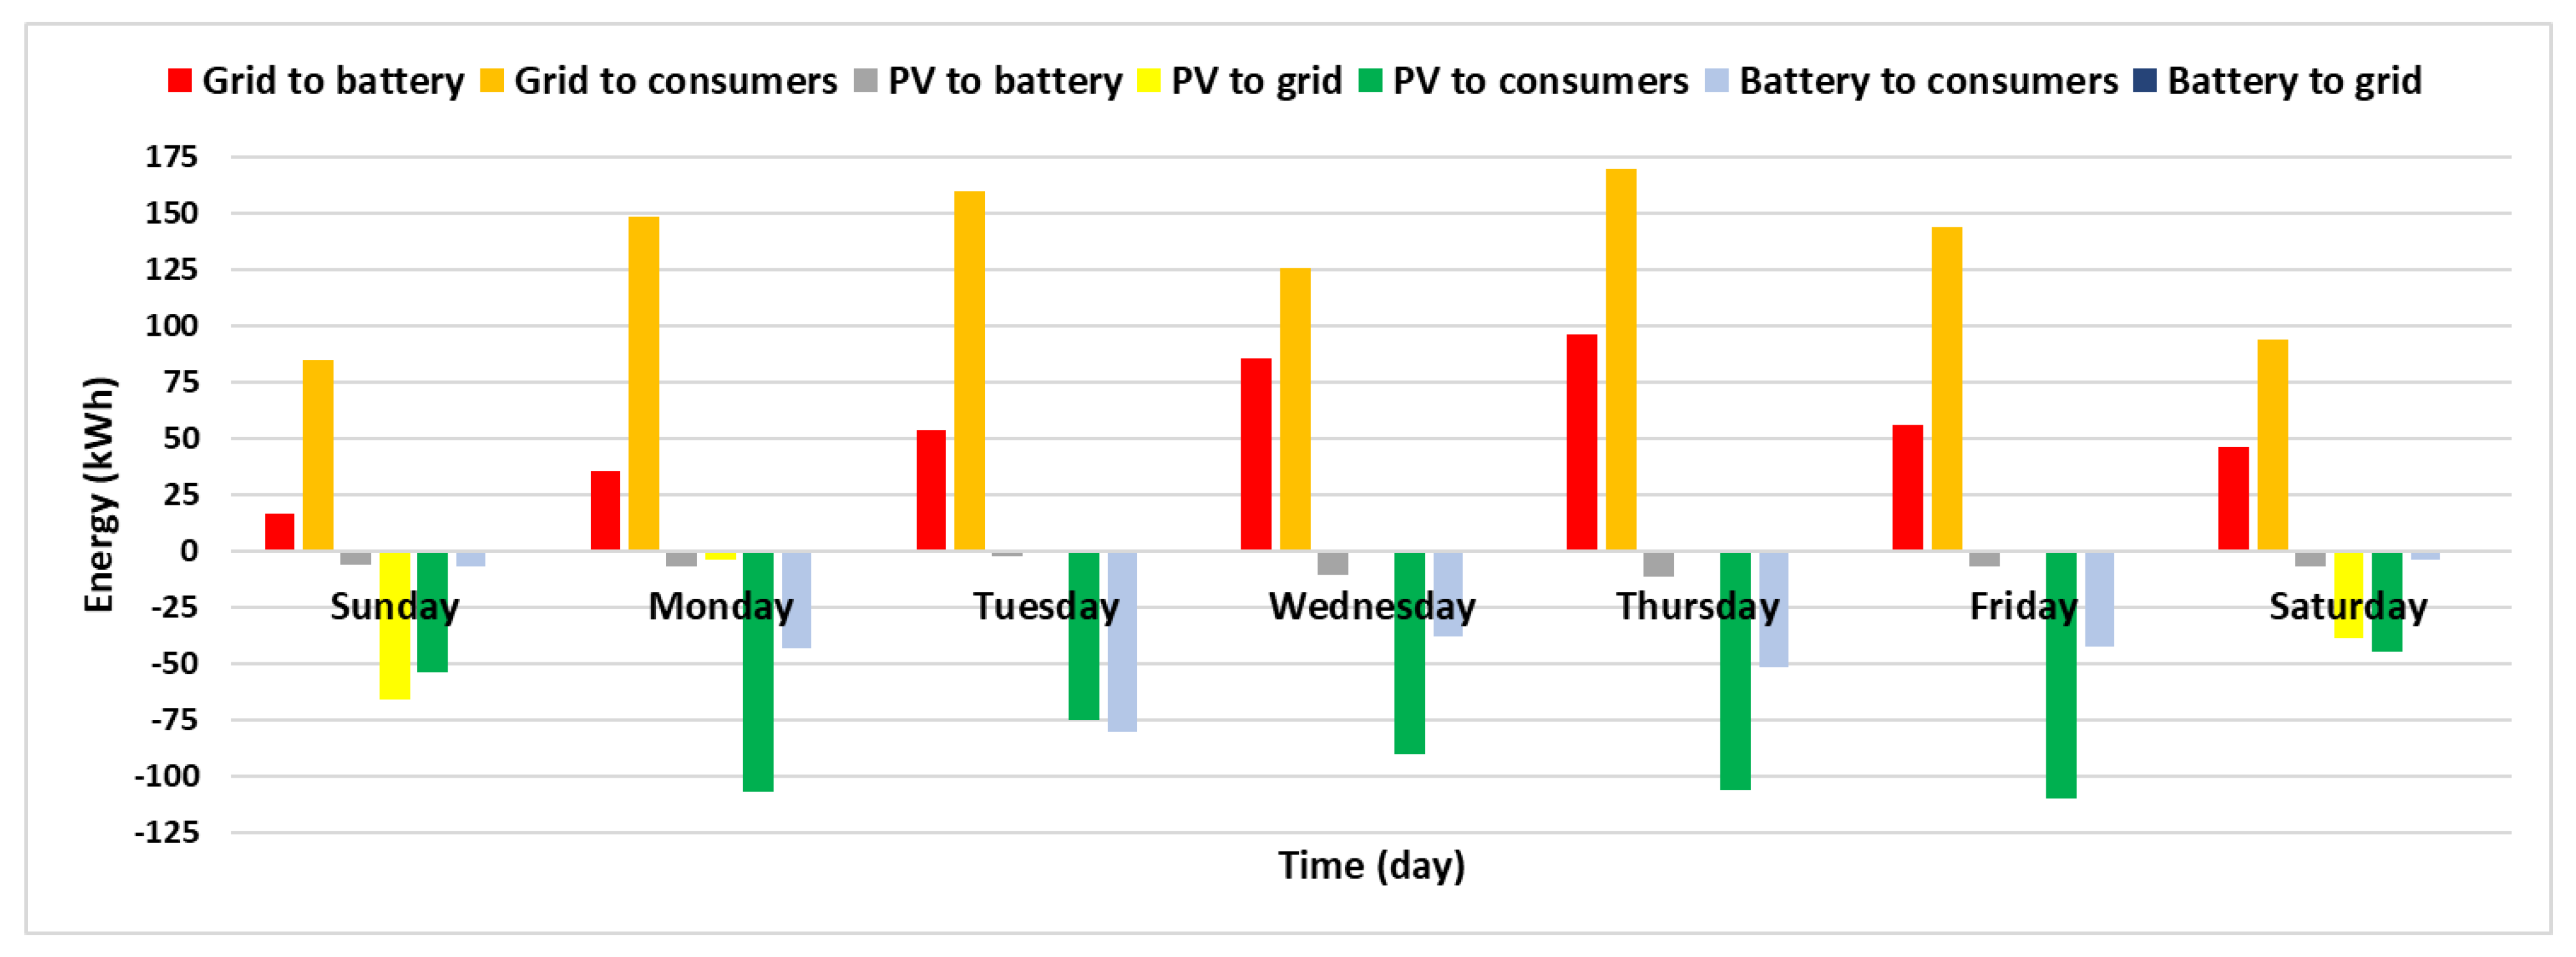
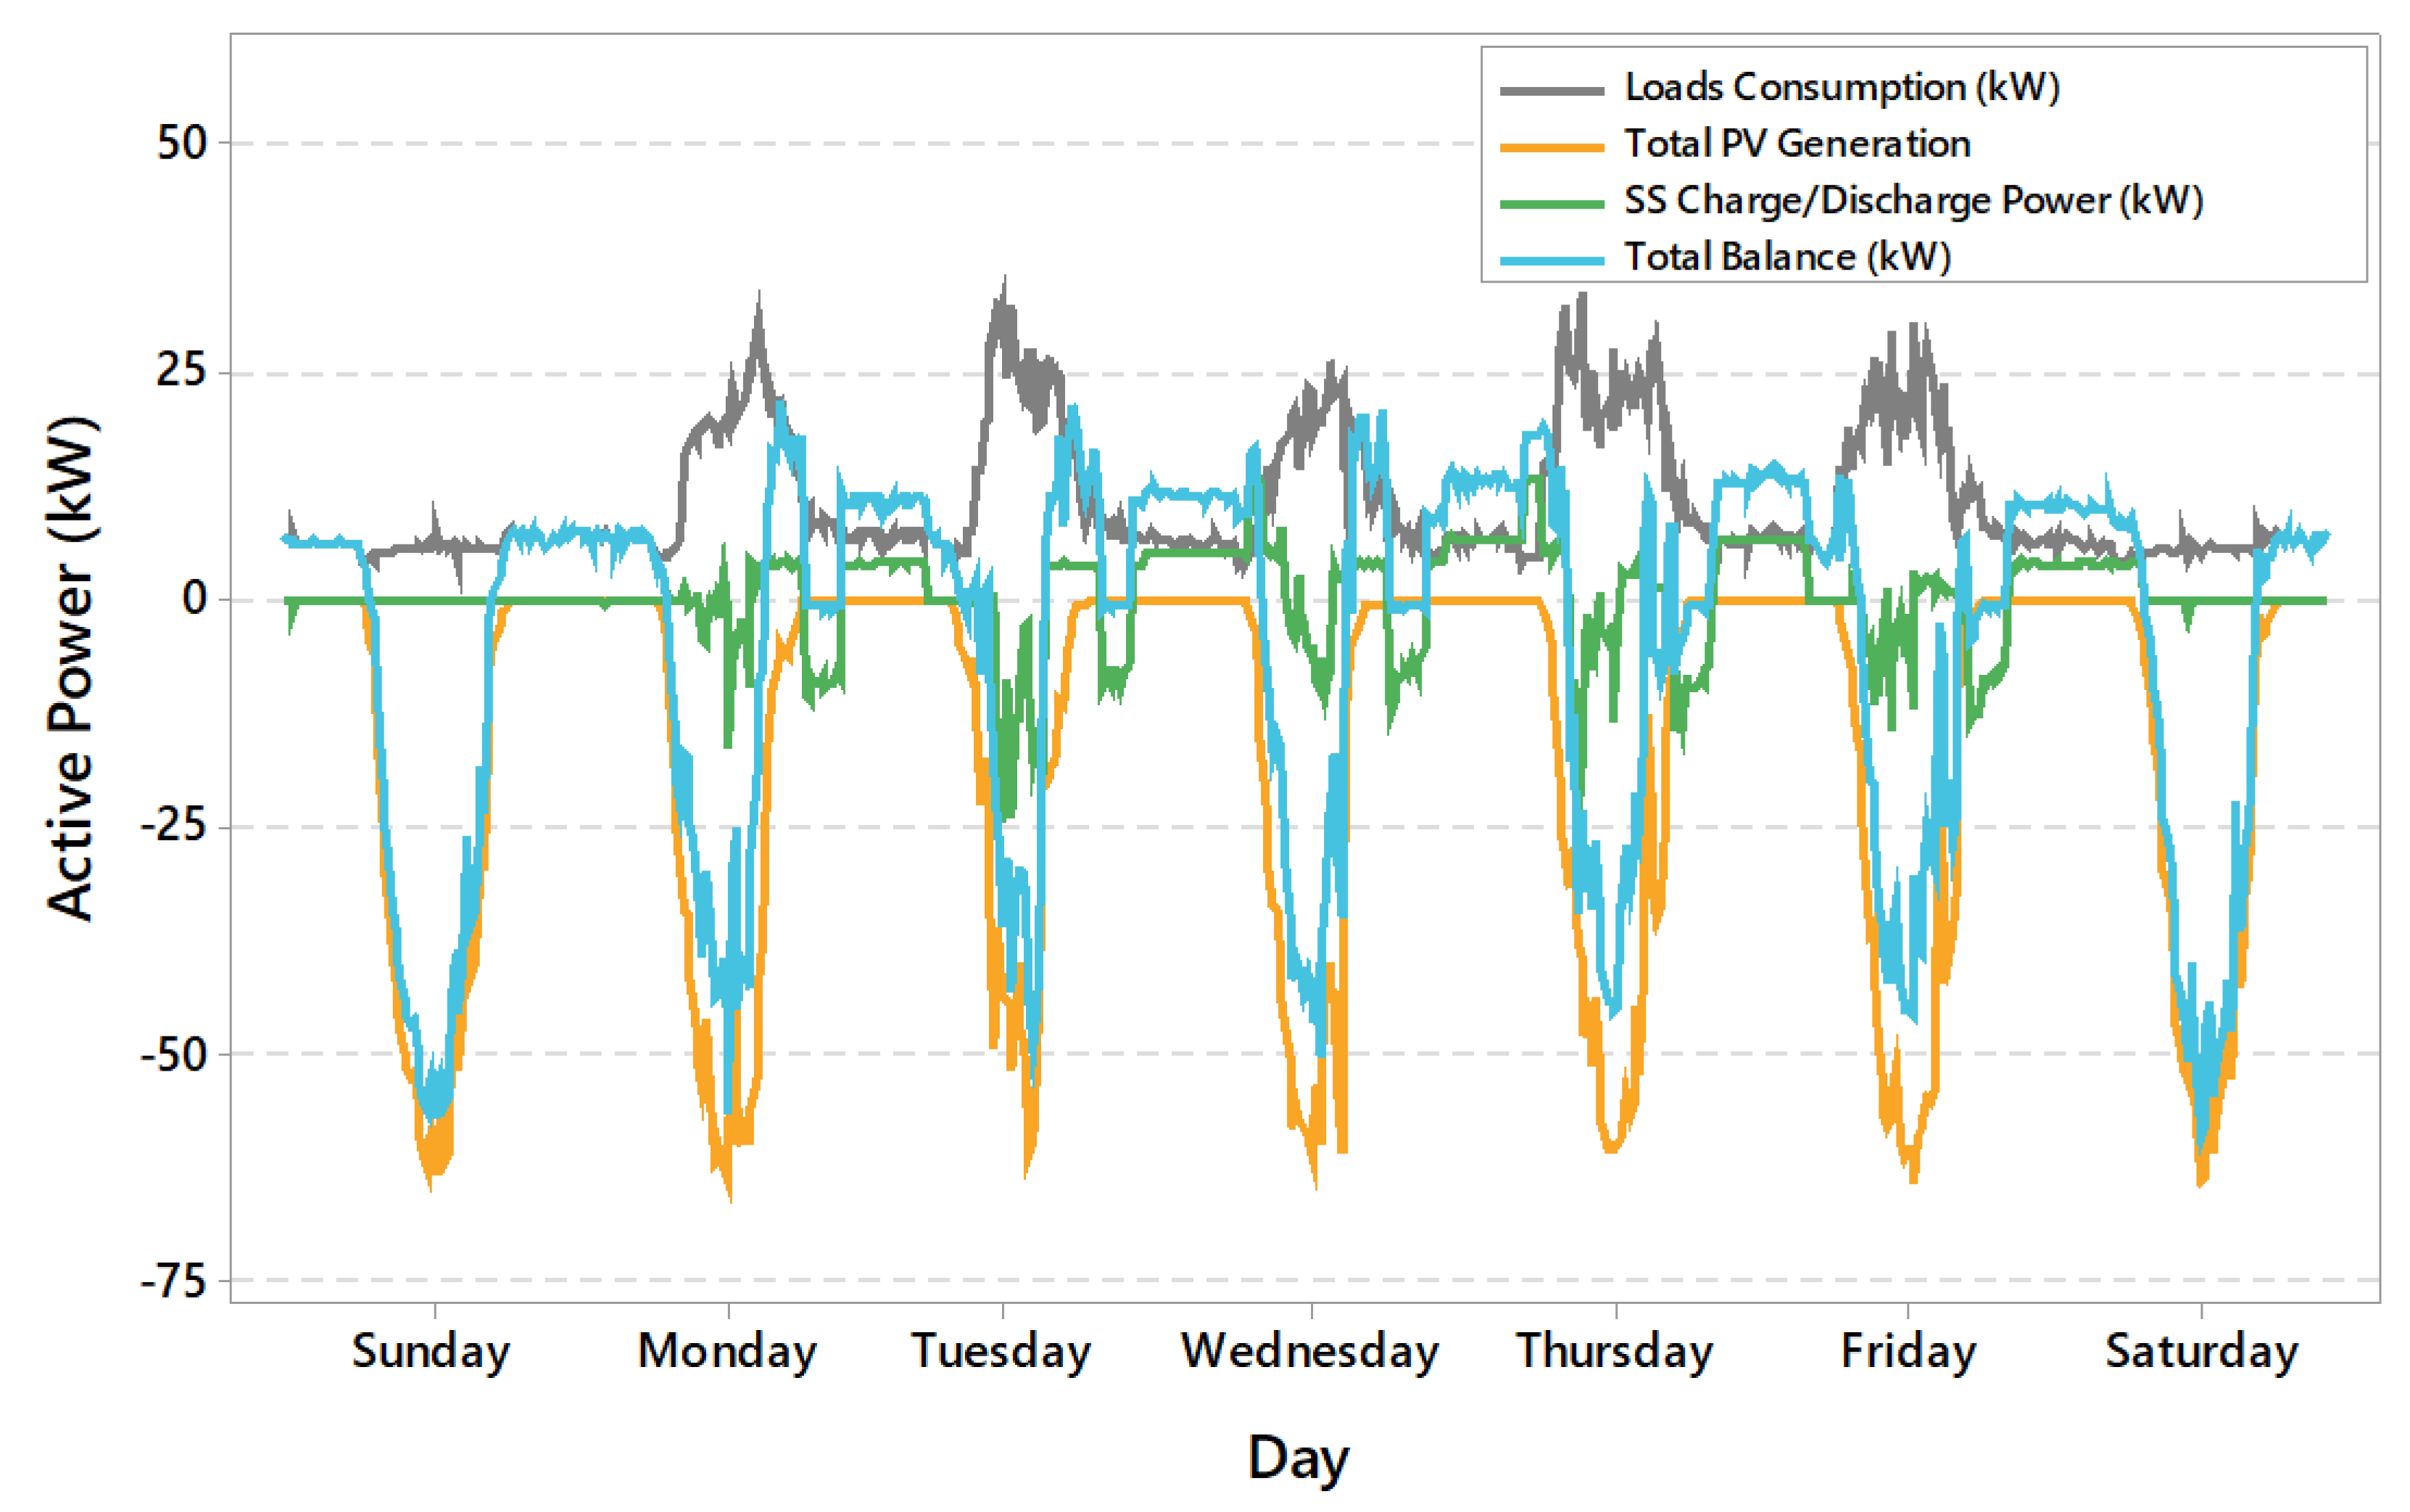
Figure 10 shows the mini-grid energy flow, over a week. During this period, the energy balance was carried out, so that the operation model of the batteries and photovoltaic systems would meet the building load. The external grid was also used as storage and energy supply source, according to the energy supply or need of the HMG. The operation allowed the mini-grid to end with a positive balance of 113.33 kWh at the end of a week, which represents 5.22% of the consumption of a week in the CEAMAZON building. In some countries, this amount of energy surplus could be sold on the market, however, in Brazil, this energy surplus can be offset at other times, but it cannot be sold, according to the actual regulation.
4.2. Second Scenario: Off-Grid Operation
For the second scenario, the system operating in off-grid conditions will be analyzed. For this case, a failure in the utility grid was simulated, and the batteries were placed to discharge until reaching 21%. Under these conditions, the system operation as well as the batteries charging/discharging cycles will be analyzed.
Figure 11 presents the power curves in off-grid conditions.
Initially, it is observed how the electrical grid is feeding both the loads and charging the storage system, when at 6:00 a.m., an interruption in the utility grid service was programmed in the management system, simulating an external fault. As initially commented, in grid absence conditions, the photovoltaic system 01 (59 kWp) is disconnected due to the anti-islanding protection, and in this way the system is operating in off-grid mode with the PV-CEAMAZON 02 and 03 photovoltaic systems only.
The off-grid operation period was determined by the consumption demanded according to building loads and lasted 9 h. The transition from the on-grid in to the off-grid condition and vice versa, occurs instantaneously without any impact on the connected loads, so that when the photovoltaic systems are switched on, the load delivered by the storage system turns out to be the difference between the demanded power and the photovoltaic solar generation. Finally, when the batteries SoC reaches 21%, the electrical grid is restored automatically, at approximately 15 h:00 p.m. As soon as the system is reestablished, the external grid starts to recharge the battery, however, at 18:30 p.m. (peak time) the battery will be used again, until reaching its minimum limit (20%) again. The battery is not recharged by the external grid during peak hours, being recharged after 21:30 p.m.
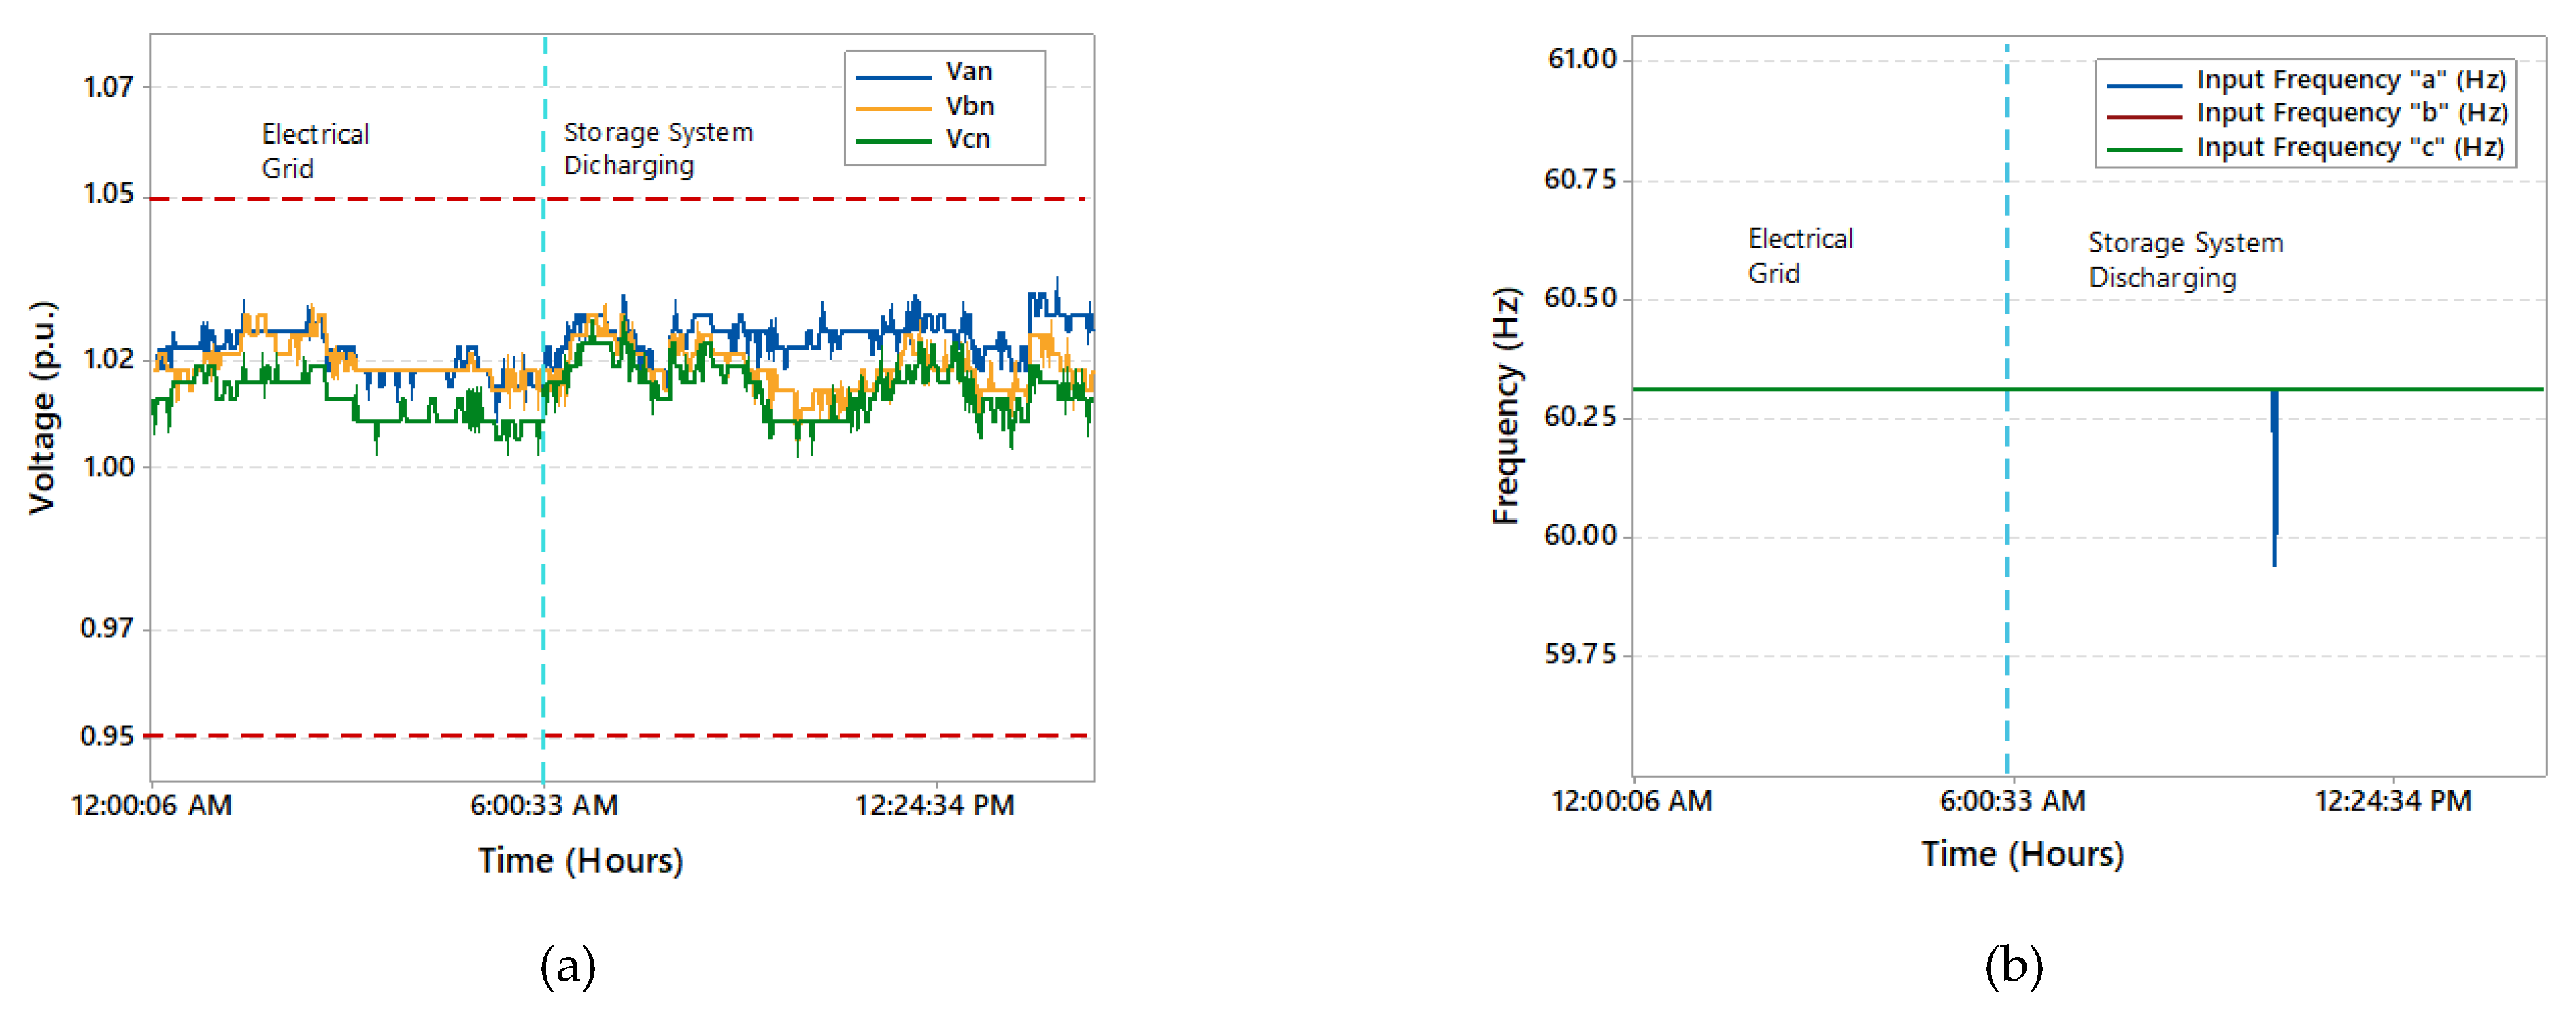
The off-grid condition does not represent any impact for the system voltages and frequency, and in
Figure 12a,b it can be seen how there is no difference between the on-grid and off-grid conditions when the load is powered by the batteries. A detail of the storage system operation in its charge/discharge cycle will be presented in the next section.
Storage System Assessment in Charge/Discharge Cycle
The storage system is composed by eight lithium iron phosphate (LiFePO
4) batteries, characterized by a two-phase transition during charging and discharging cycles with different open circuit voltages (OCV) [
41]. Each battery package consists of two 25.6 Volt, 270 Ah series batteries. In turn, each battery package is composed of eight cells in series with a nominal voltage of 3.2 Volts and an open circuit voltage of 3.8 Volts.
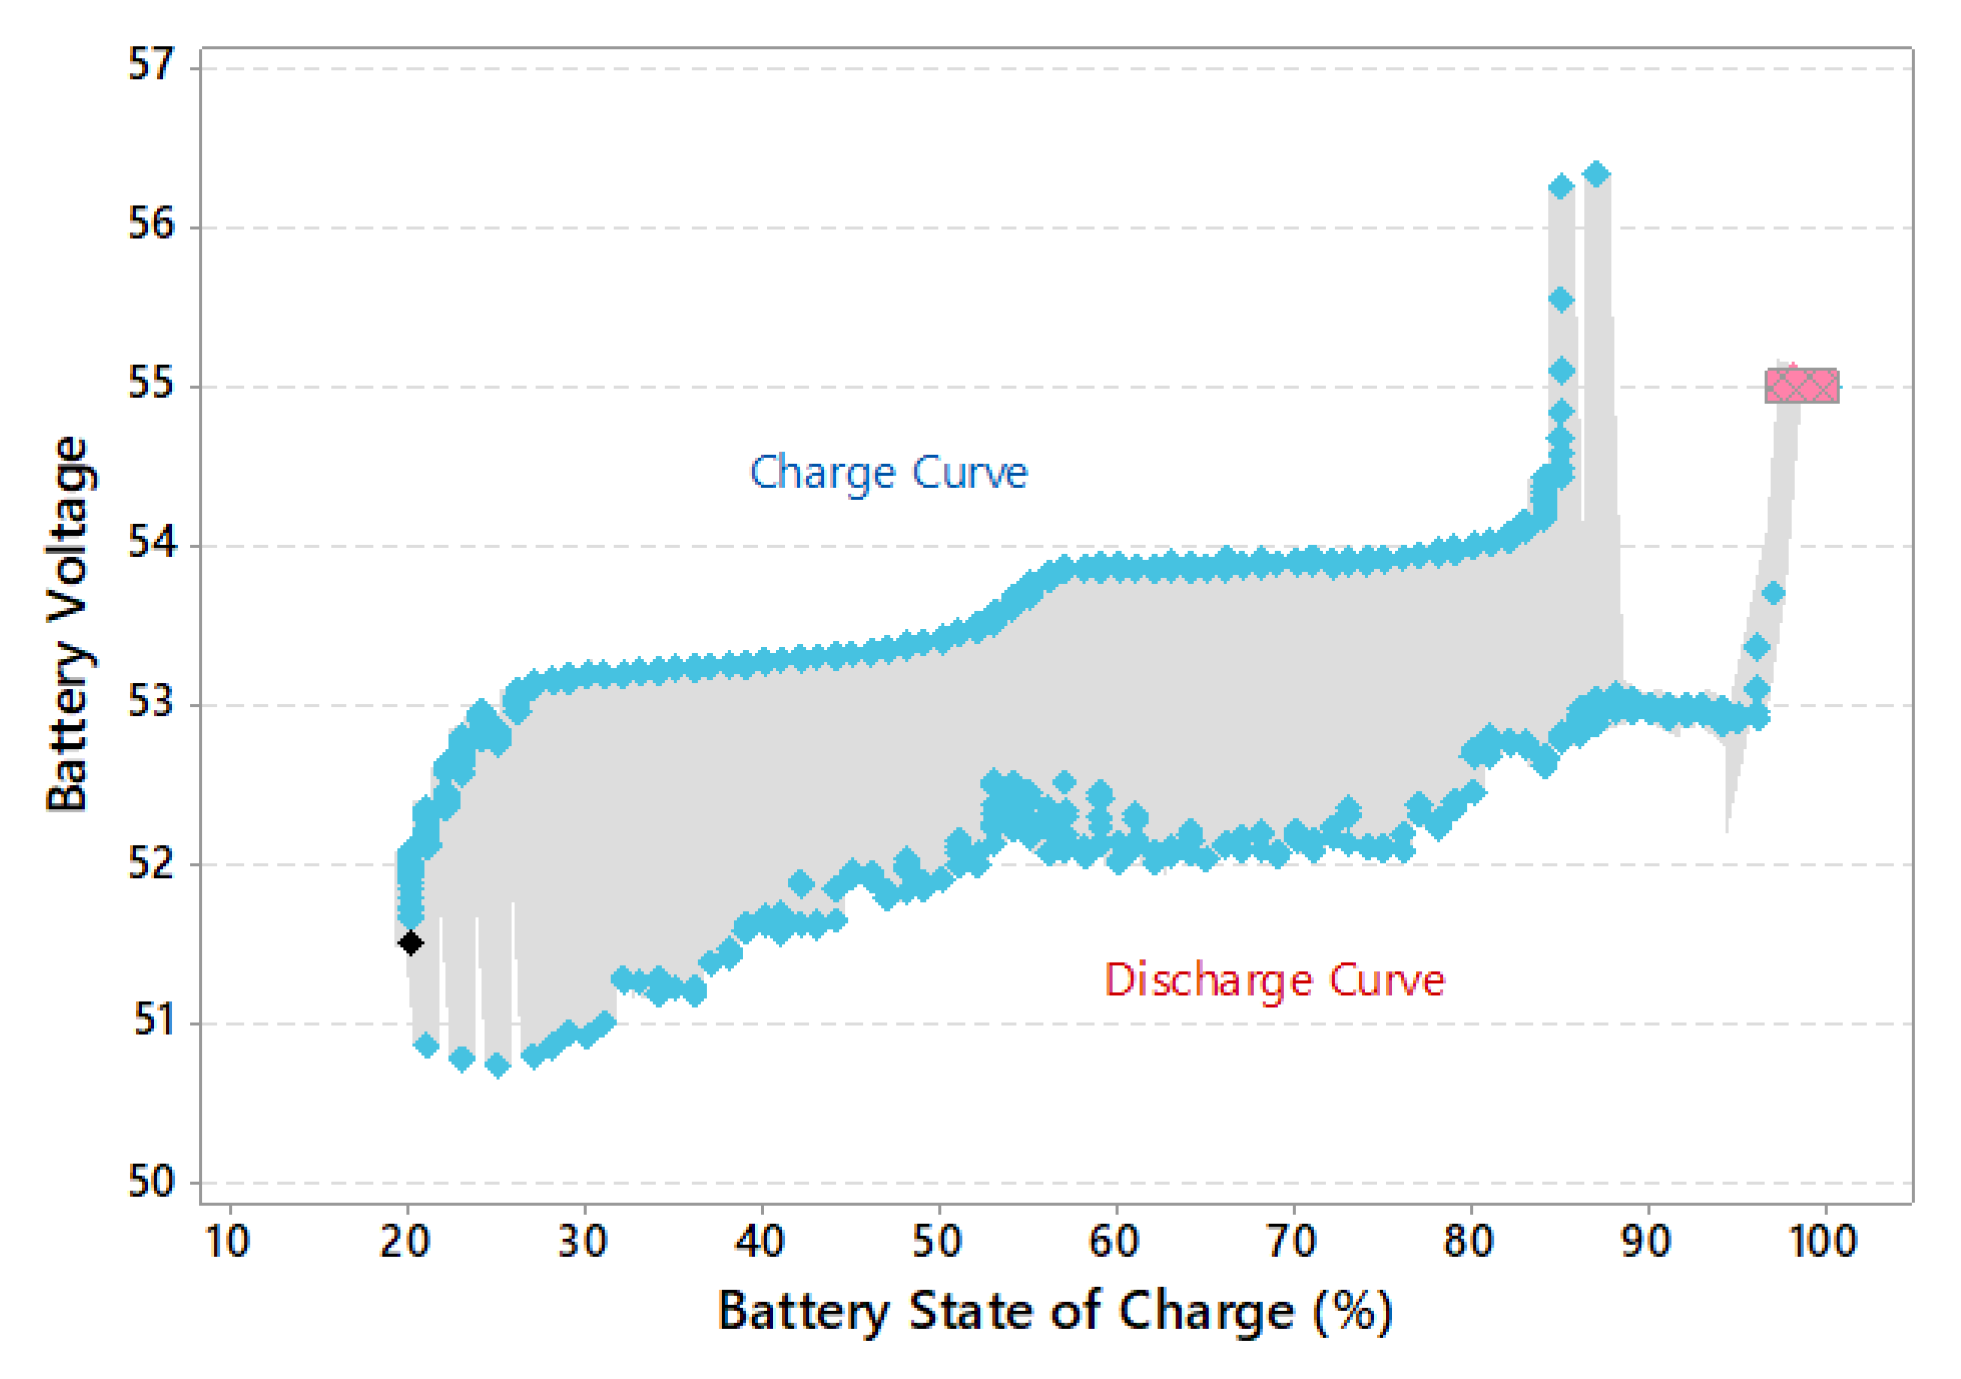
Figure 13 presents the hysteresis voltage curve during the storage system charging/discharging cycle, a C-rate of 0.035 was configured for the charging cycle, with an approximate recharge time of 28.8 h at 75 Amperes.
As can be seen in
Figure 13, the discharge and charge curves show some differences in voltage levels for the same battery SoC, within both charge and discharge curves, and the lowest voltage gap occurs at SoC = 27%, when the difference between charge and discharge voltage is 2.34 Volts. It also can be seen how the discharge cycle presents a random voltage variation, mainly due to the instability of photovoltaic generation and building loads demand variation. When a SoC = 21% is reached, the storage systems stop feeding the loads and the on-grid condition is restored. At this point the charging cycle starts with a 75 Amps charging current from the grid and PV systems until batteries are fully charged again, then the voltage decreases to the floating voltage value defined in 55 Volts (pink points), aiming to maintain the battery in fully charged state (trickle charging).
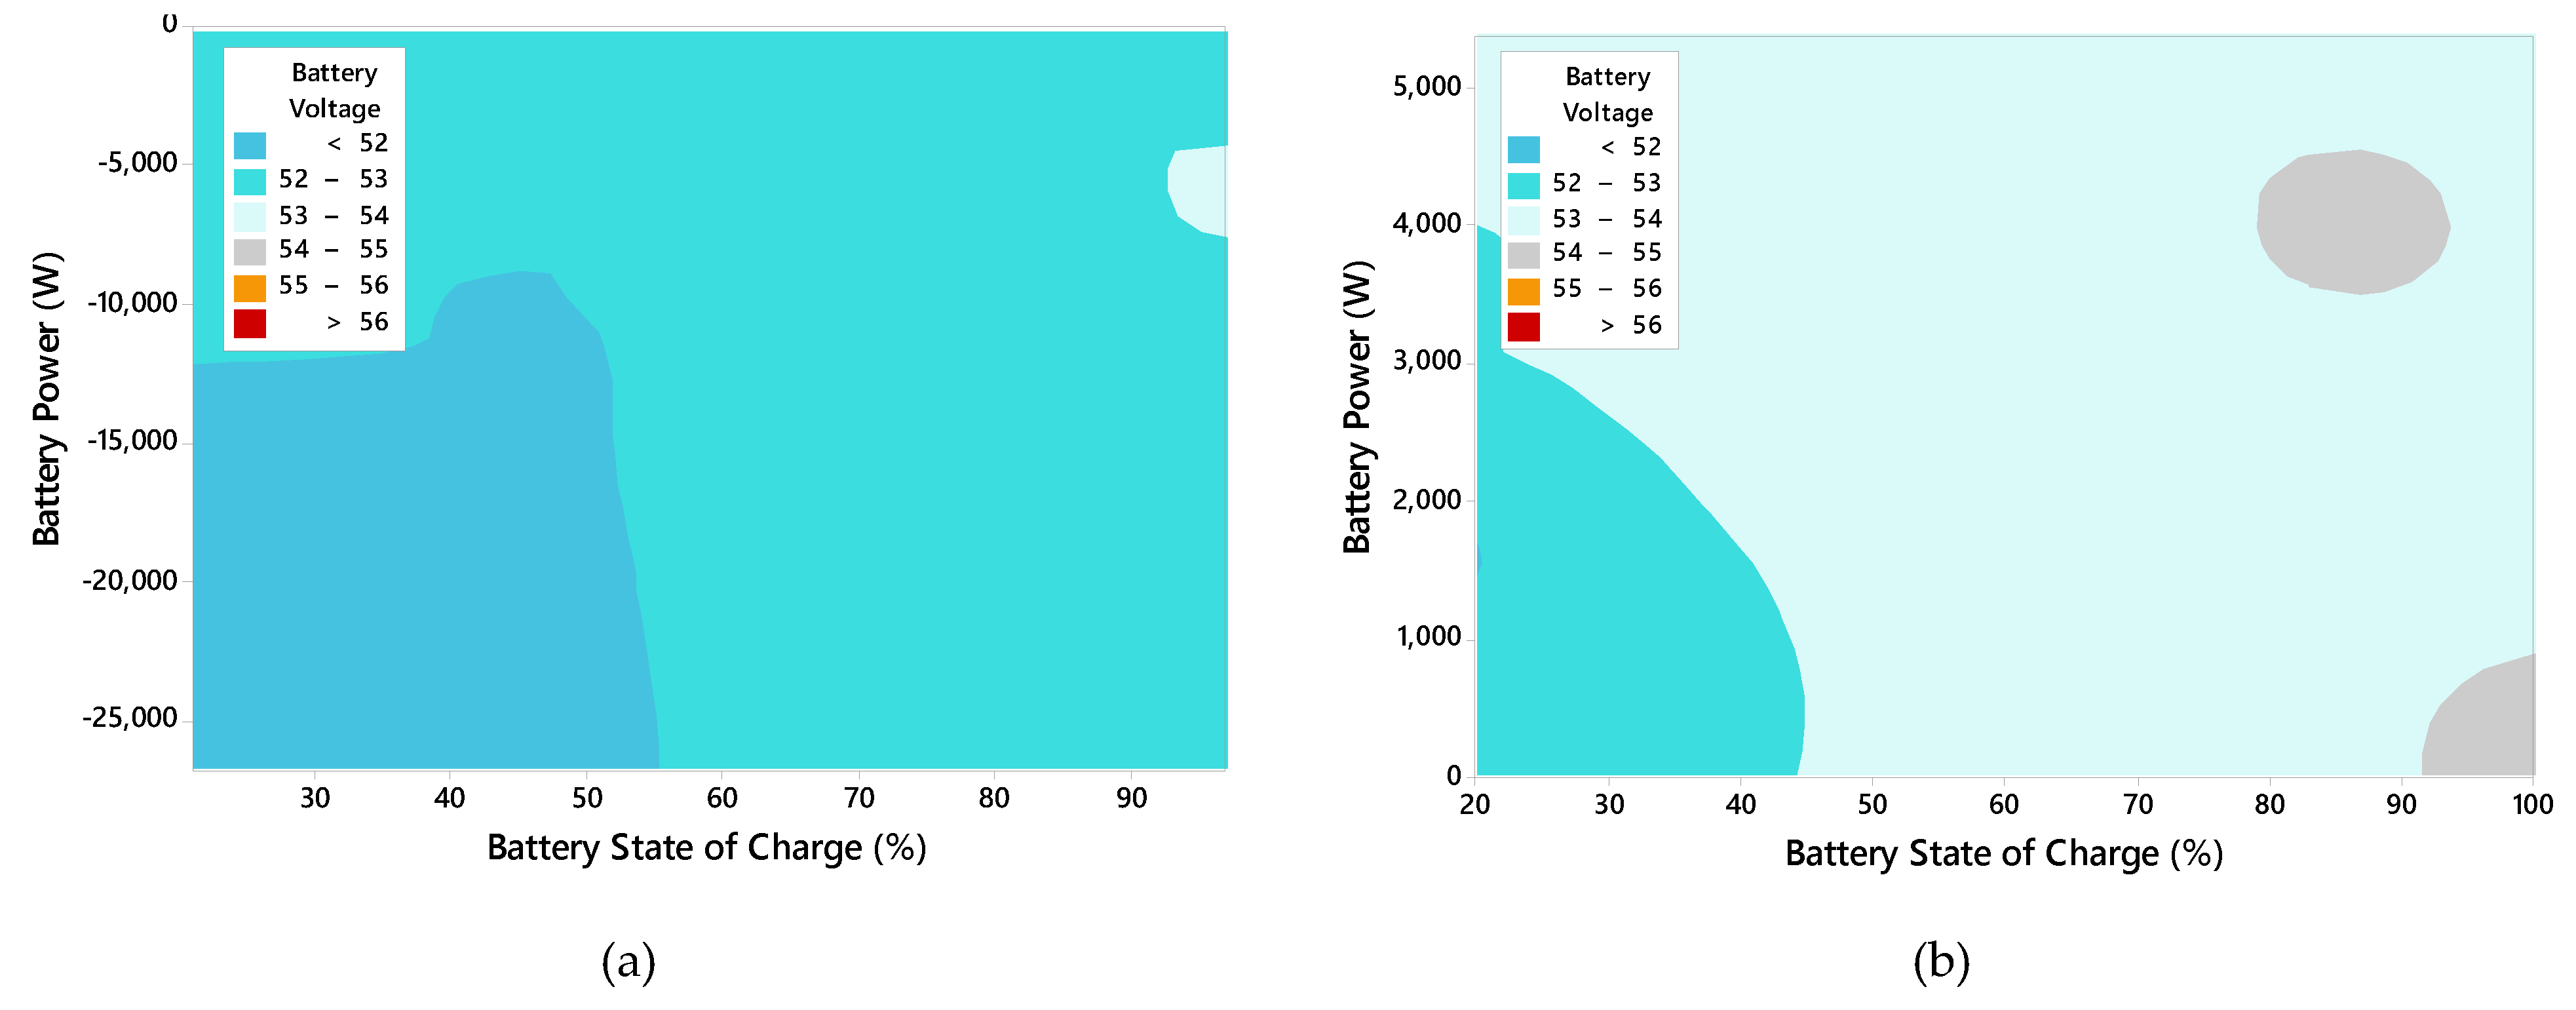
By making a correlation between the voltage, the charge status and the power delivered by the battery, through
Figure 14a,b, it can be verified that when SoC < 55% and the power > 12.5 kW, lower voltage levels in the discharge process are observed, as presented in
Figure 14a. However, during the charging process, a constant voltage is observed in
Figure 14b. The main difference between the charge and discharge diagrams for the storage system, observed in
Figure 14 and
Figure 15, is that the charge process is constant, at a C-rate of 0.035 (75 A), while the second depends on the demand of the building loads, varying throughout the day.
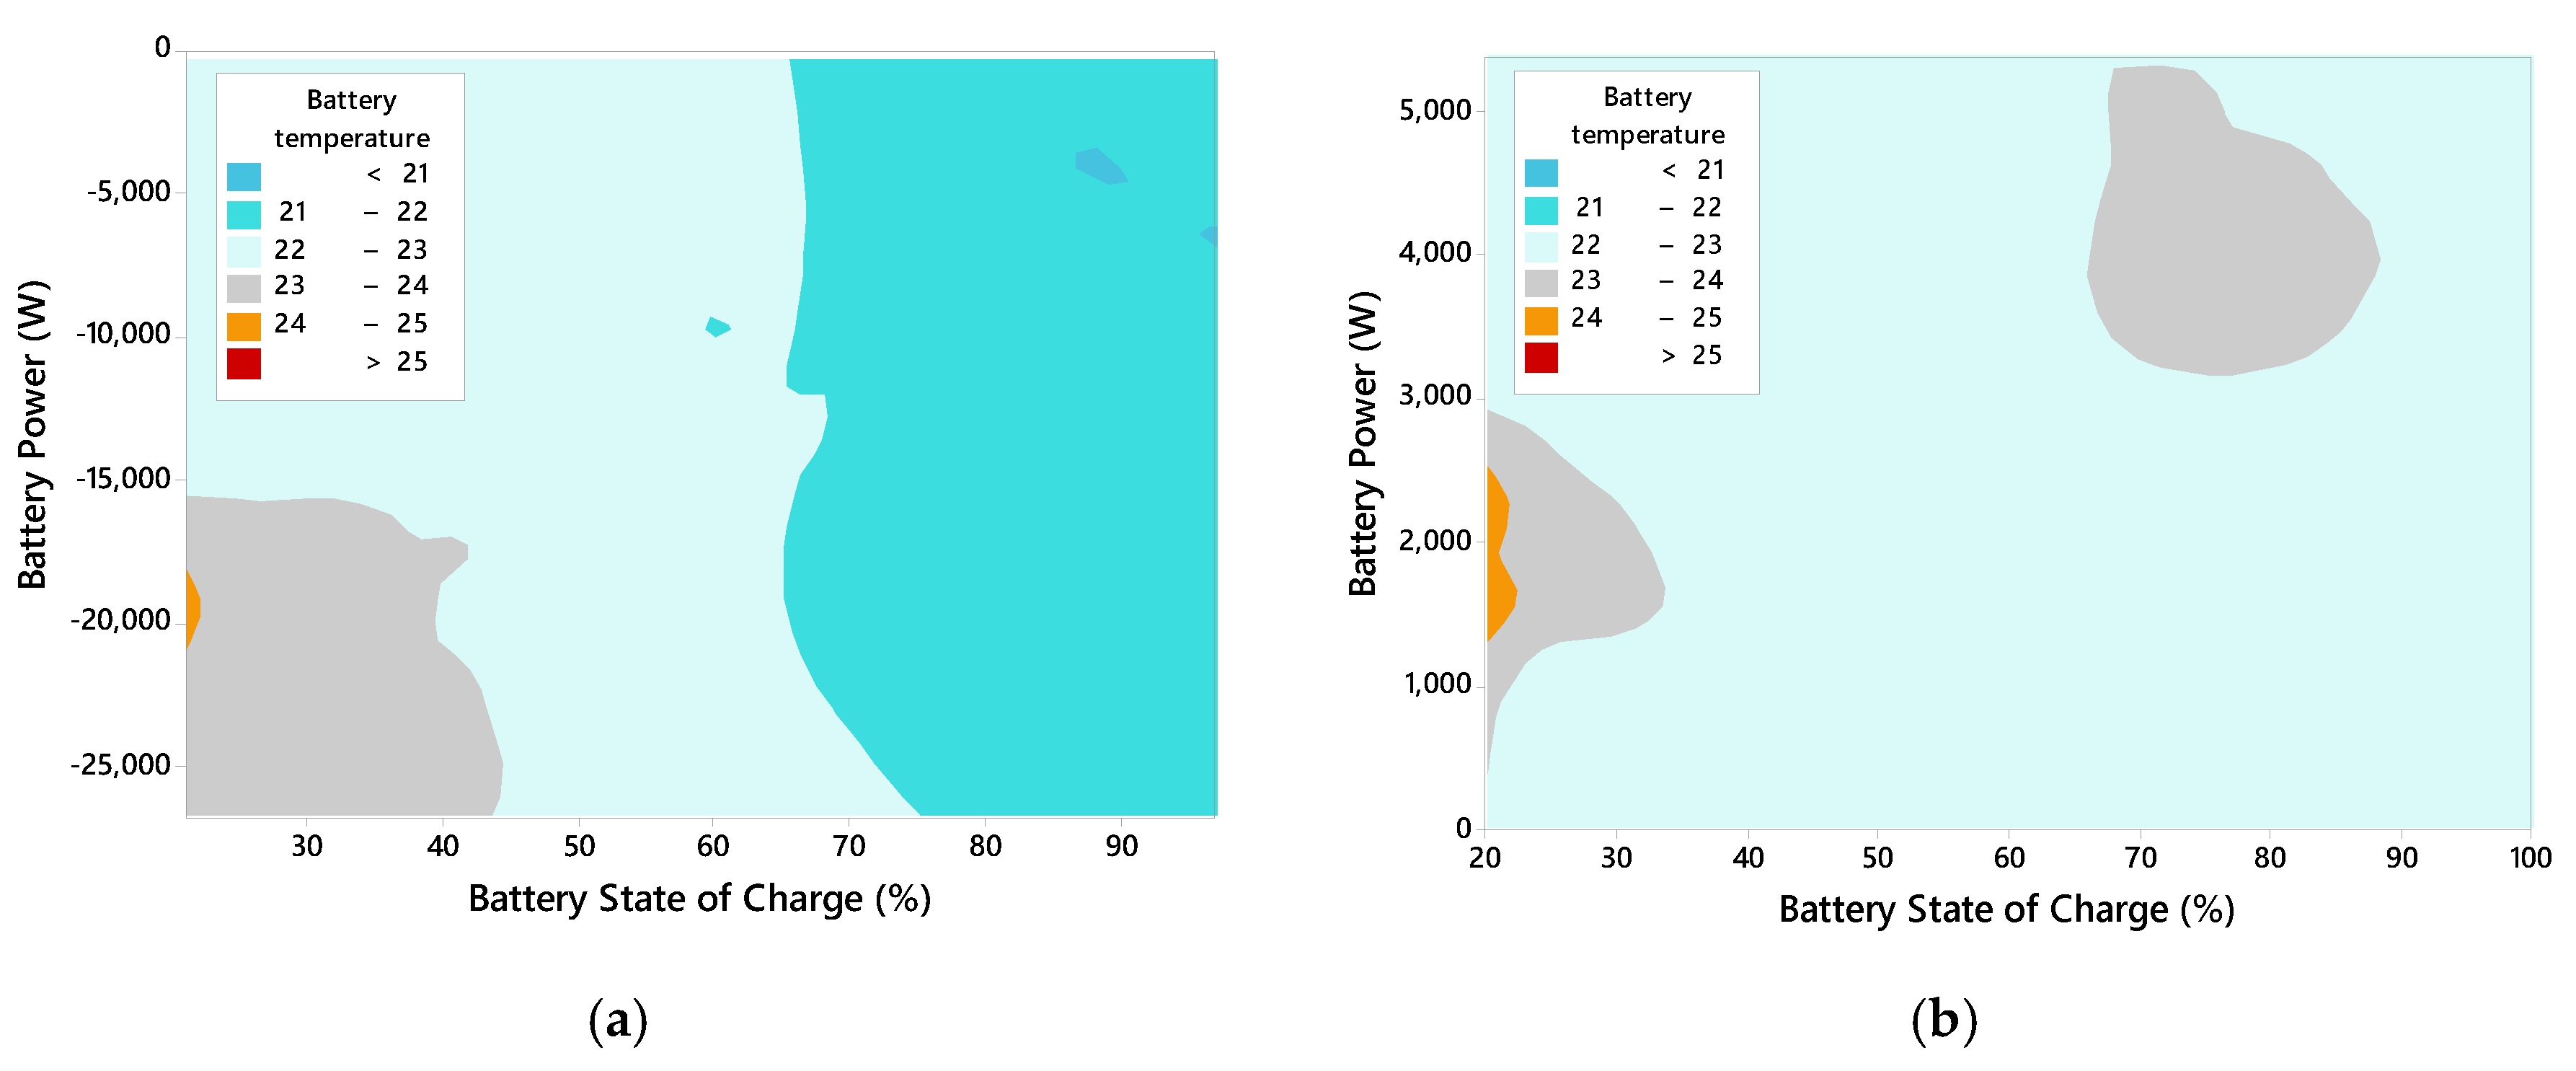
Temperature is another important parameter in the batteries’ operation, and to analyze it, correlation plots of its variation in function of the SoC and the power delivered in the charge/discharge cycle were created and are presented in
Figure 15. In discharging mode (
Figure 15a), it is observed how the temperature increases as the state of charge decreases, mainly for SoC < 45% and discharge powers > 15 kW. For the charging cycle, on the other hand, the temperature does not show considerable increases, with higher temperatures at the beginning of the recharge process and in the final phase, as shown in
Figure 15b.
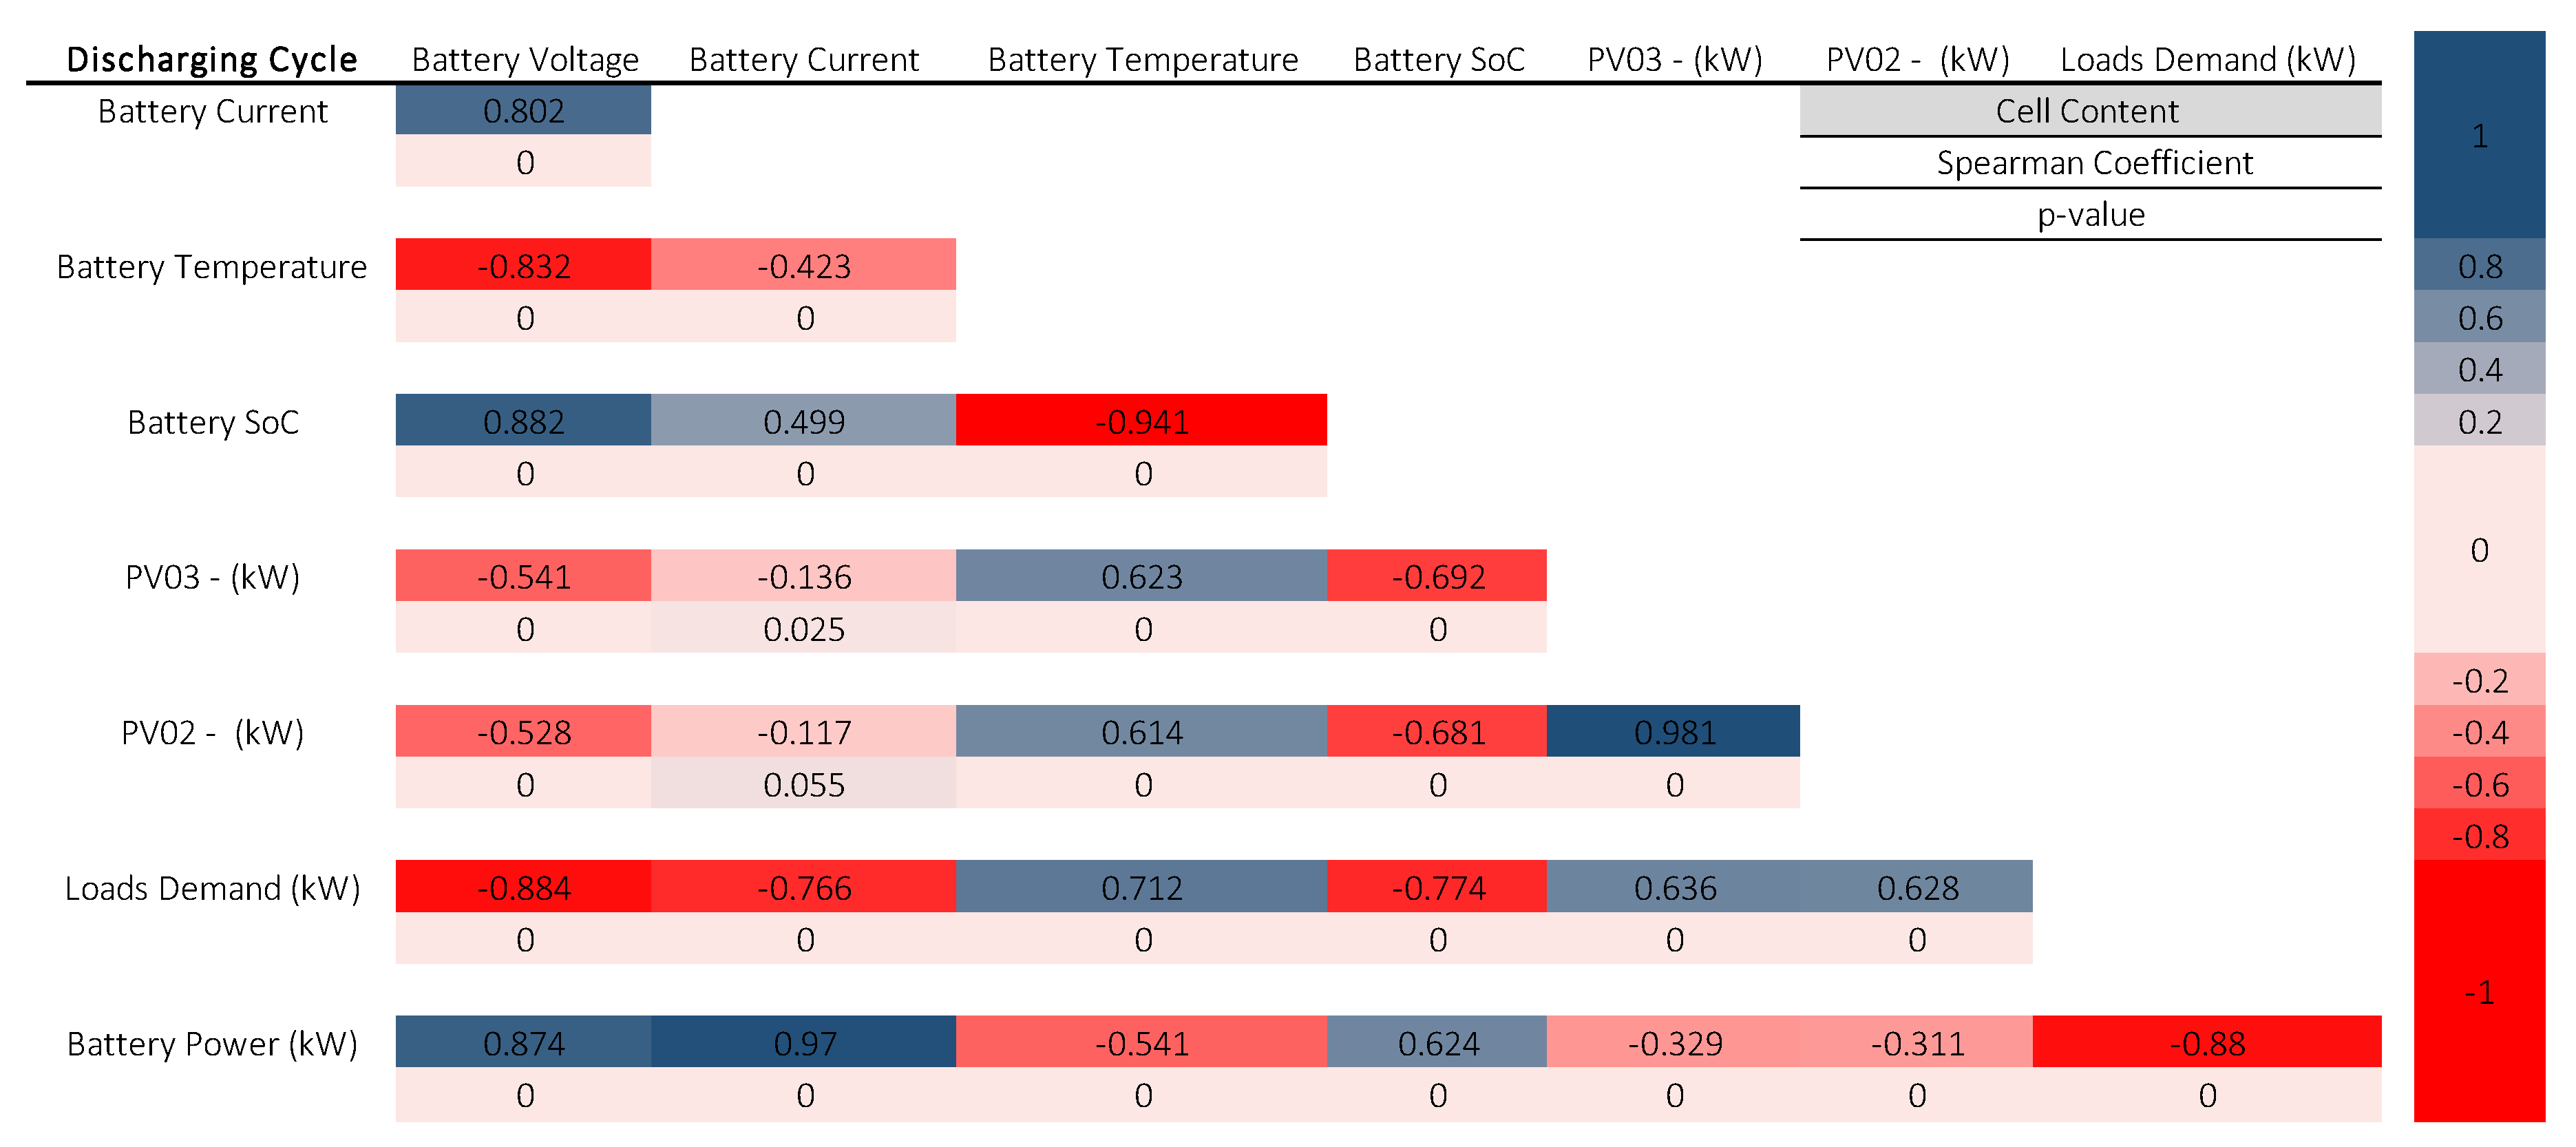
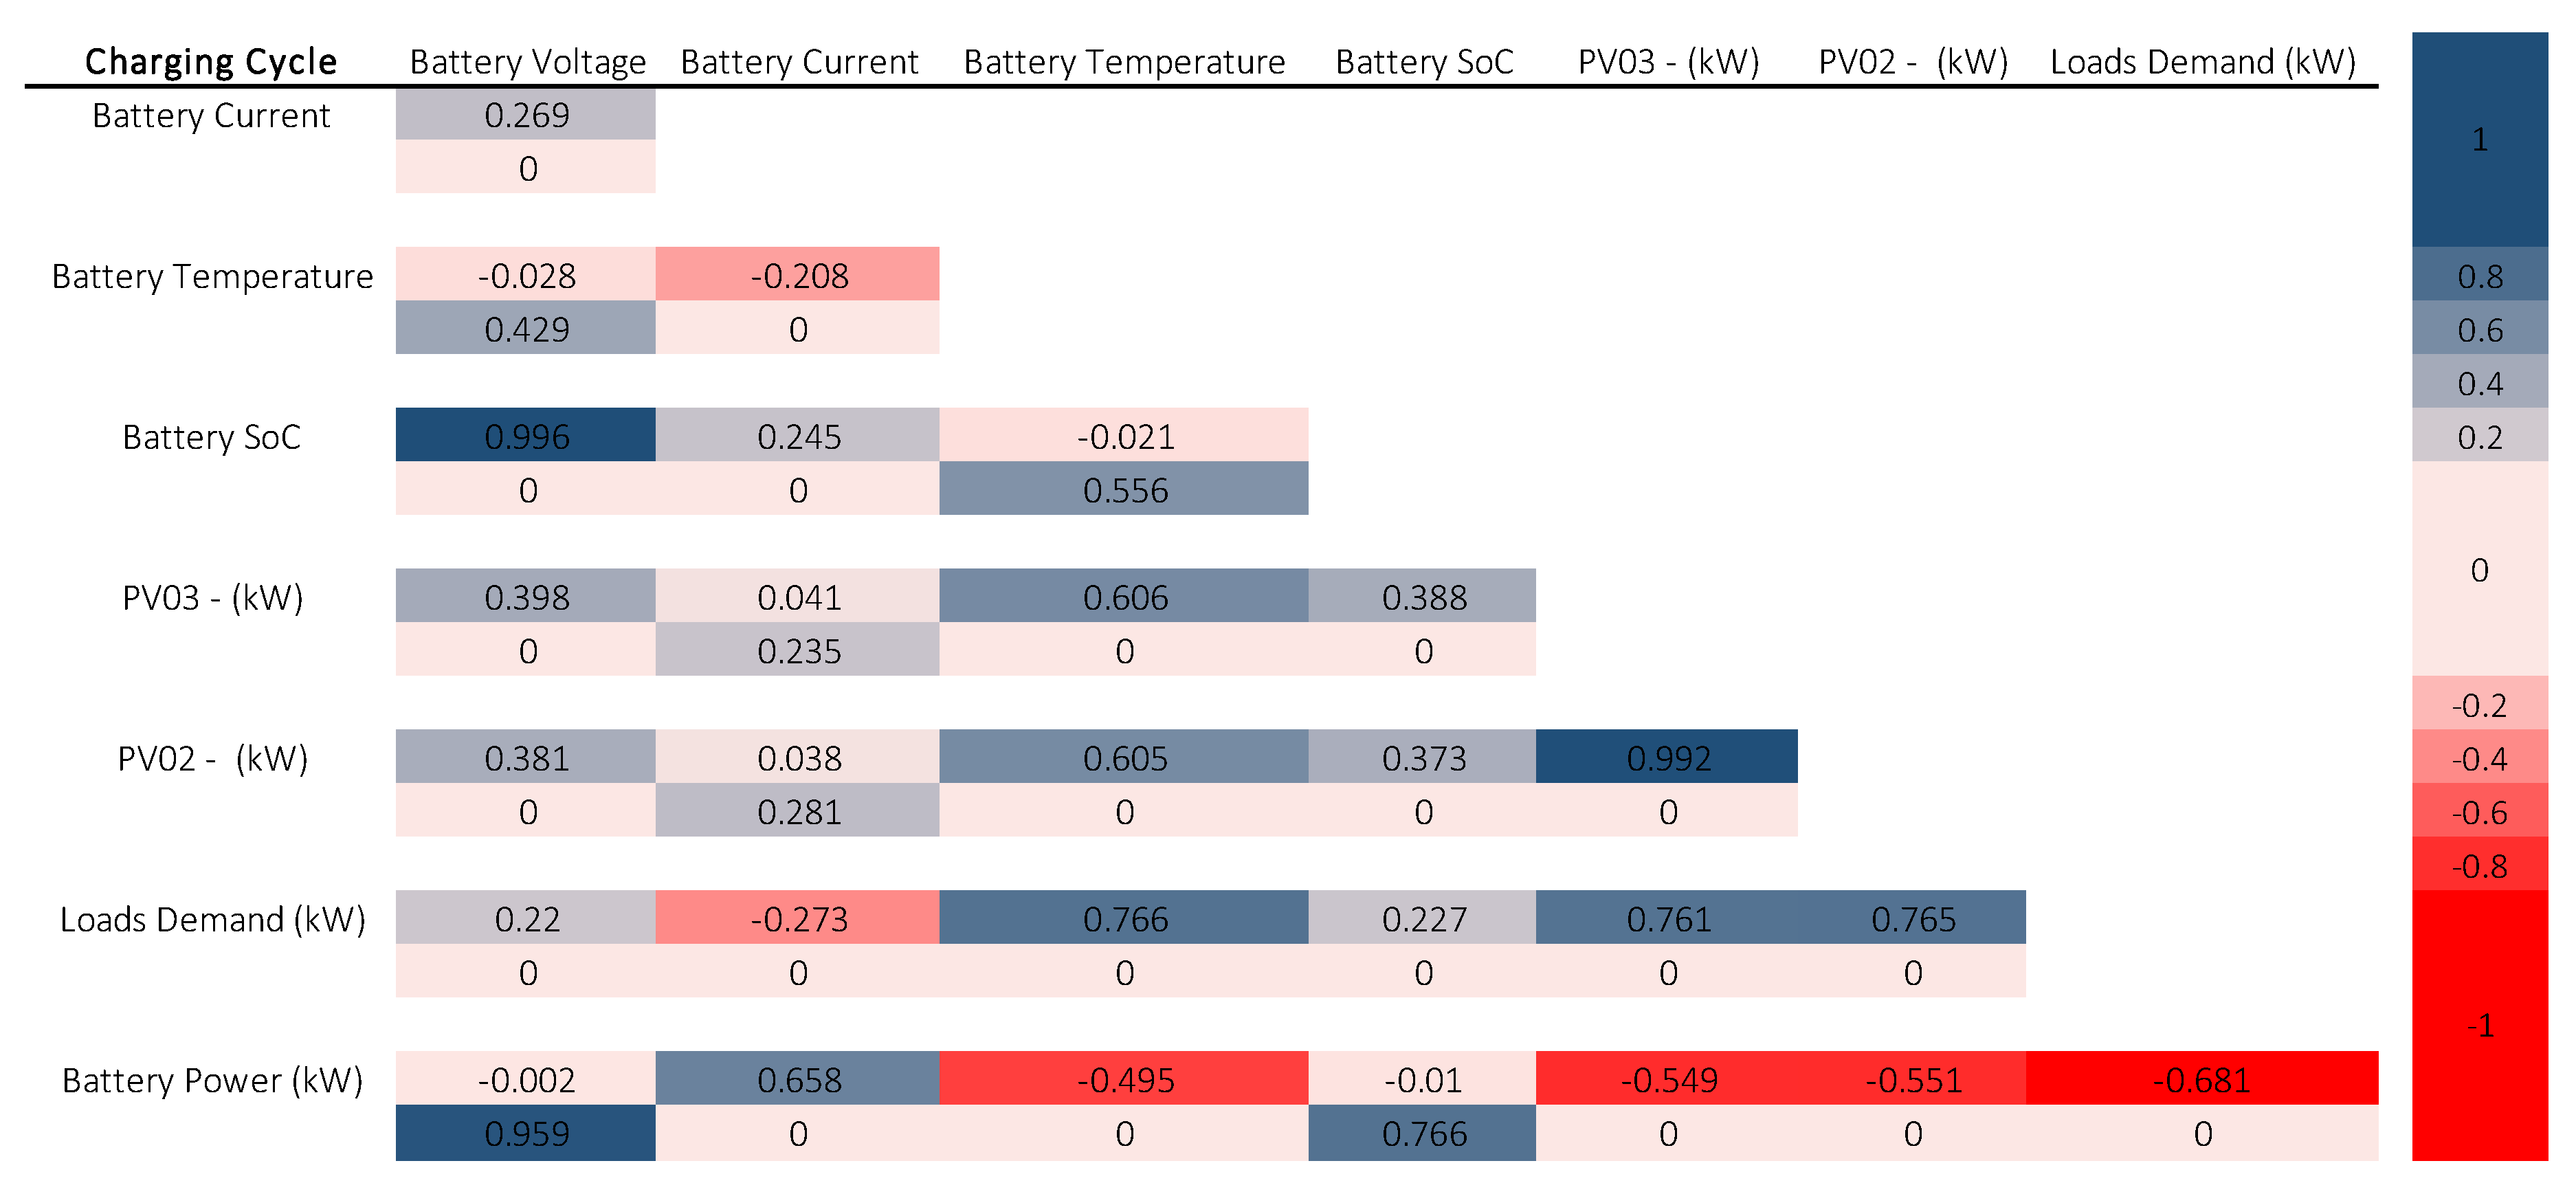
To better assess the relationship between the variables associated with the storage system, as well as their influences, a Spearman’s correlation analysis was developed in Minitab 18 [
43], between the storage system voltage, current, temperature, power and state of charge, as well as the demanded load power and the PV-CEAMAZON 02 and 03 systems.
Figure 16 and
Figure 17 present the correlation matrices between the analyzed variables.
The Spearman correlation coefficient assesses the monotonic relationship between two variables using their rank values and not the values themselves. The development of the Spearman’s rank correlation coefficient is presented in (1):
where
n is the number of pairs of values and
is the difference between each corresponding
and
value rank.
The correlation analysis results in a number between −1 and +1, called the correlation coefficient. The higher the coefficient, the closer the relationship between the variables. The analysis was performed for the storage system charging and discharging cycle.
In the correlation matrix, the upper cell shows the Spearman coefficient while the lower cell shows the p-value, useful for rejecting the null hypothesis when compared to the significance level (0.05 assumed).
In general, greater positive and negative correlations are observed for the batteries discharge cycle, in relation to the charge cycle. This is mainly due to the fact that the charging process occurs at a constant electric current independent of the load demand or available solar generation during the entire process, that is different from discharging cycle, in which solar availability, as well as load demand, condition the power delivered by the system. For this reason, the PV-CEAMAZON 02 and 03 as well as the load demanded by the building were also considered as they are variables that can influence the power delivered by the batteries. Regular correlations can be observed in relation to both photovoltaic systems in both charging and discharging cycle, as they are dependent on solar availability.
Regarding the discharge cycle (
Figure 16), it is observed that voltage not only depends on delivered power and the SoC, but also on the delivered current, while it varies inversely with the demanded load. Temperature also increases as the loads power demand increases, in this case with negative values, however, lower correlation values are observed in relation to the power delivered by the batteries, mainly due to photovoltaic generation. It can also be observed how the delivered current and power from the batteries have lower correlation with photovoltaic generation, as it depends on loads demand.
In this way, the batteries operation is not only influenced by the demanded load, but also by the available solar generation, which contributes to greater autonomy in off-grid operating conditions.
A different scenario is observed for the batteries charging cycle (
Figure 17), with low correlation coefficients, as well as with high
p-values, with which it is not possible to conclude on the relationship between some of the analyzed variables.
4.3. Third Scenario: Off-Grid Operation with Diesel Generator
For the last scenario, an existing DG was utilized to analyze its operation in the hybrid system to supply CEAMAZON building energy demand in off-grid conditions. The DG operation will be only in critical conditions and as a last option, aiming at the use of renewable energies, its operation will be in case of utility grid absence and a storage system SoC < 20%. For the test, a power grid interruption was conducted, and the DG was configured to assume the load with a SoC defined in 86%. Under these conditions, the building load was increased in order to analyze the generator operation at full load conditions (45 kW).
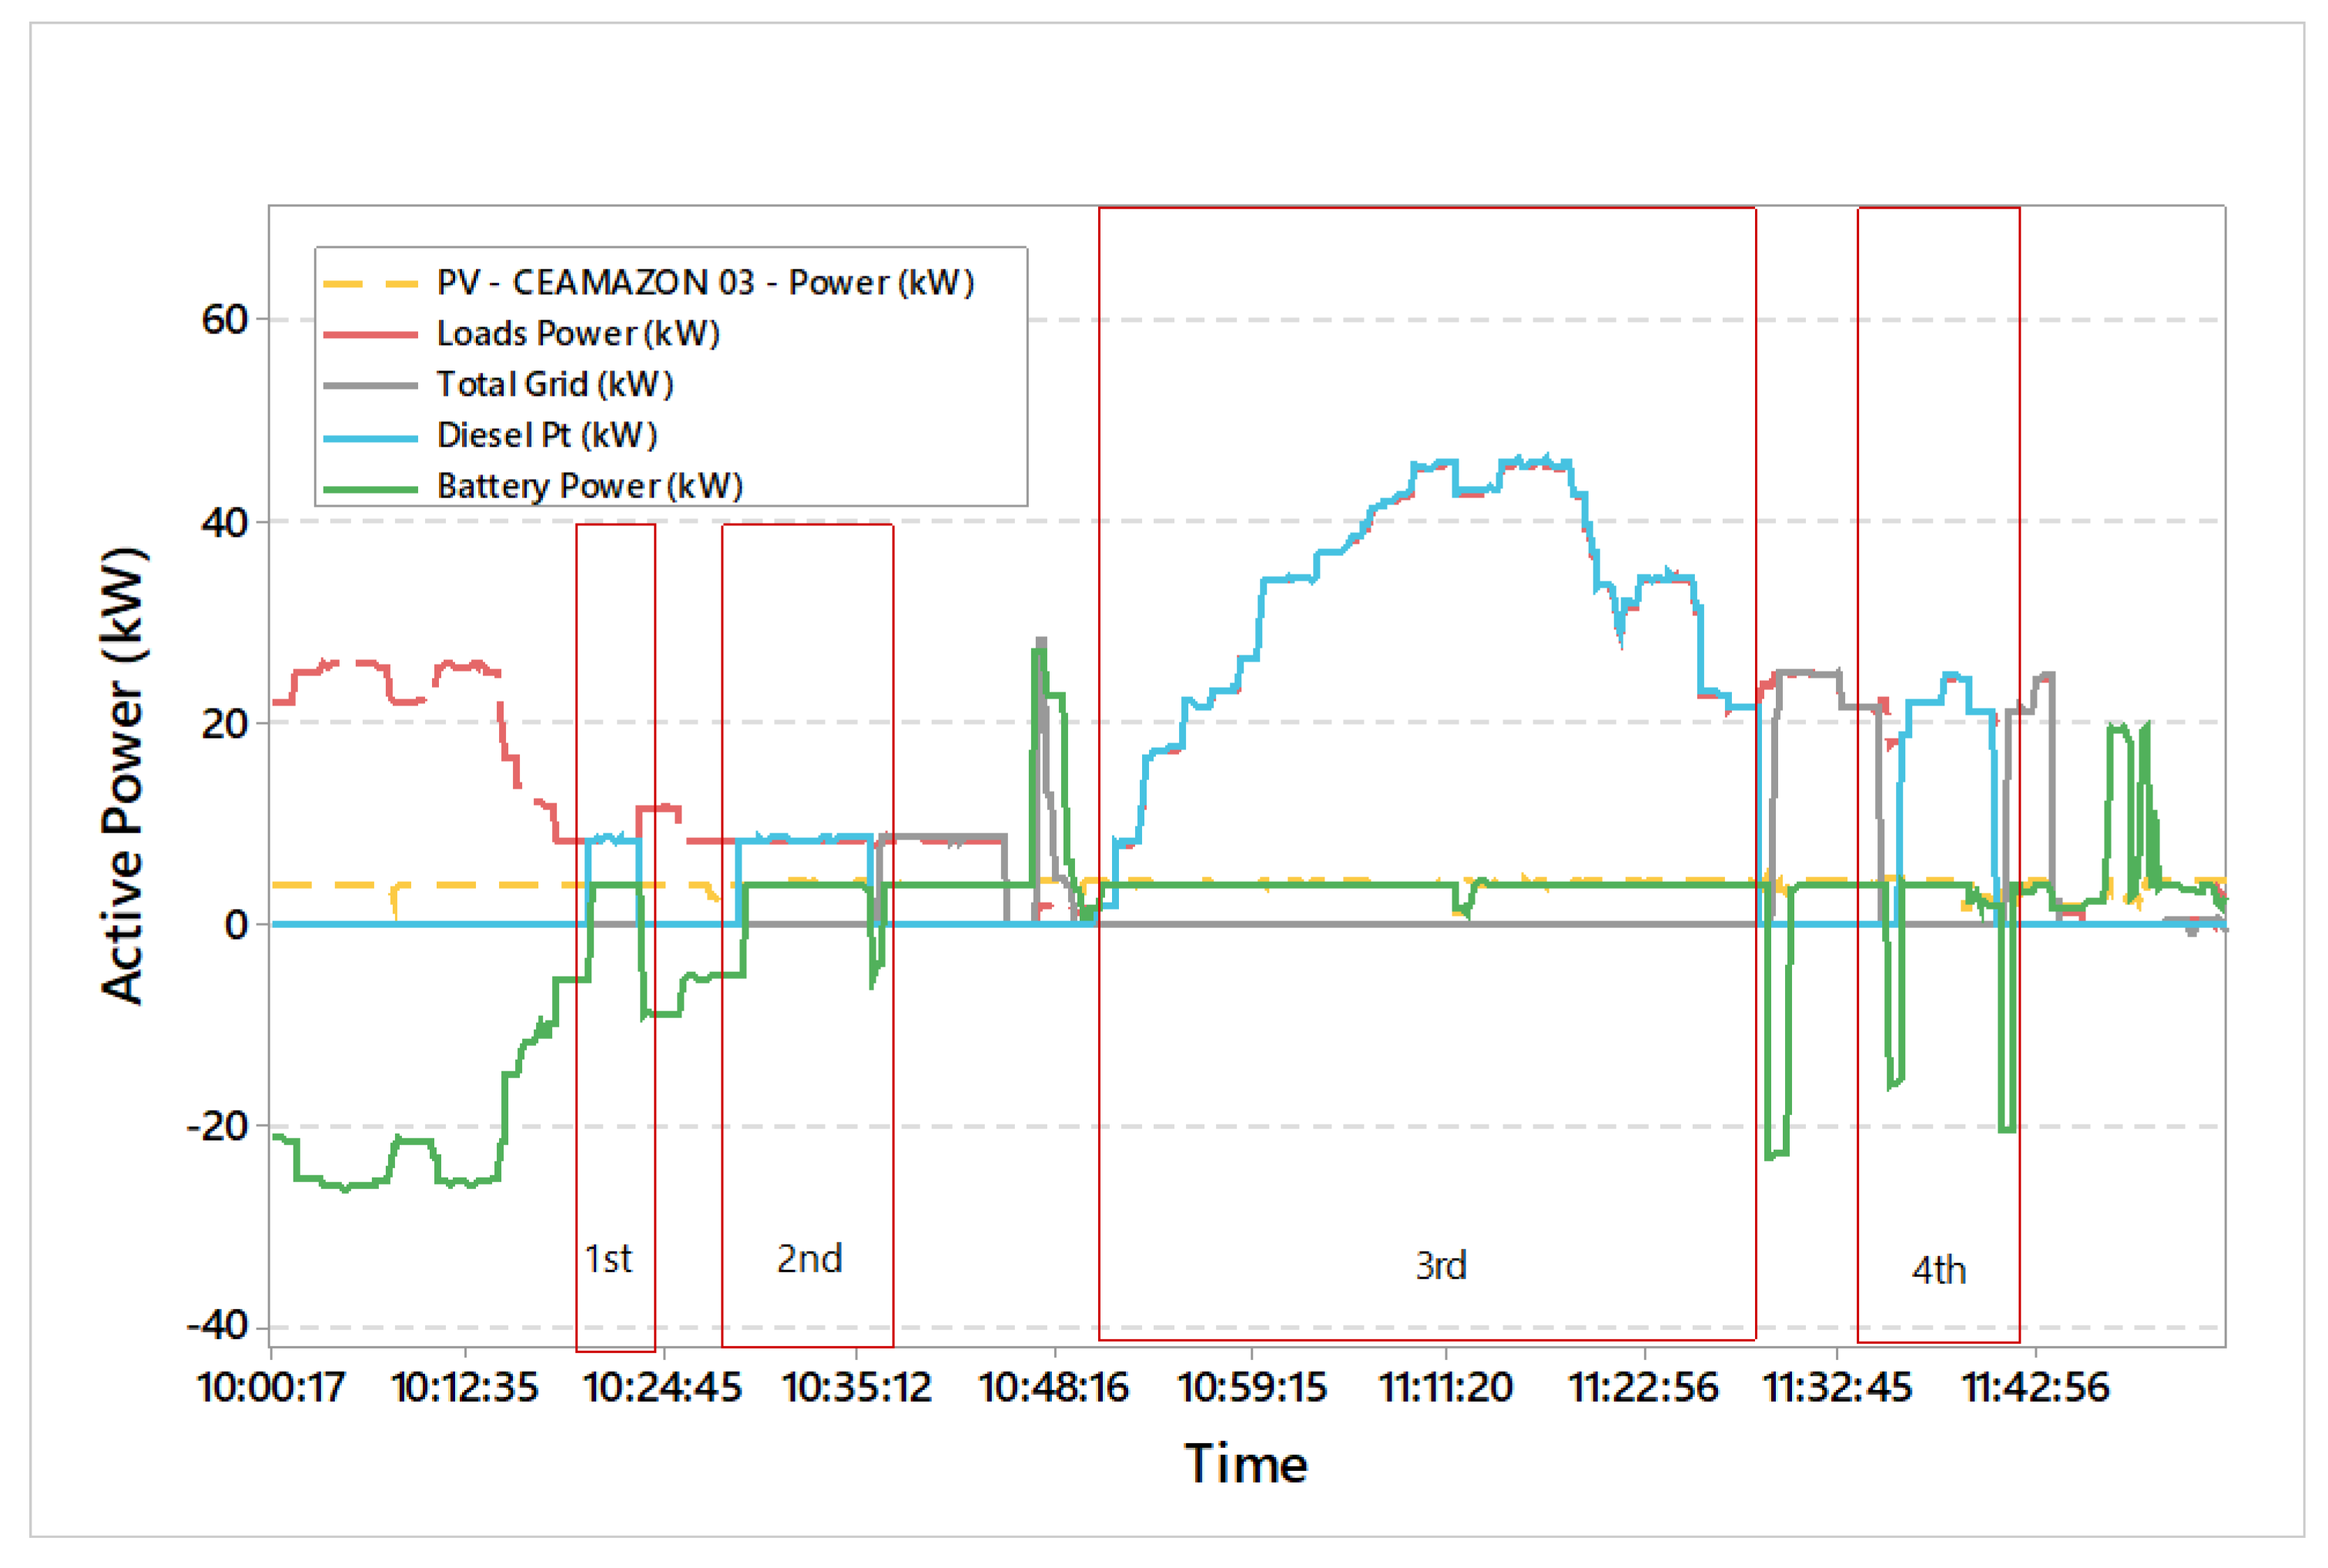
Figure 18 shows the events sequence in the DG set operation, divided into four events, which will be described below.
It can be seen that the batteries (green curve) assume the building’s loads after the power interruption. Considering the first event, once the defined 86% SoC is reached, the DG set goes into operation assuming the building loads, however, within a few seconds, the management system stops the DG operation and the batteries assume the building loads, aiming at the energy supply continuity.
In the second event, the management system makes a new attempt to put the DG set into operation, however, again without success. The observed difficulties on the diesel generator to stay on and its sudden exit, is mainly due to the operation of the loss of main (LOM) detection function of the management system, used to detect a loss of the electric utility grid and avoid power islanding, ensuring safety and quality of energy supplied. The manufacturer of the management system records a history of incompatibility with certain diesel generators, due to the update of its firmware. As a solution, LOM function in the management system was disabled, so that the generator was able to enter into operation and reach its nominal power, as recorded in the third event. In the fourth event, the LOM function was again deactivated, thus, DG makes a new attempt, with the same result as the first two attempts, thus confirming the impact of the LOM function on the operation of the generator used in the HMG.
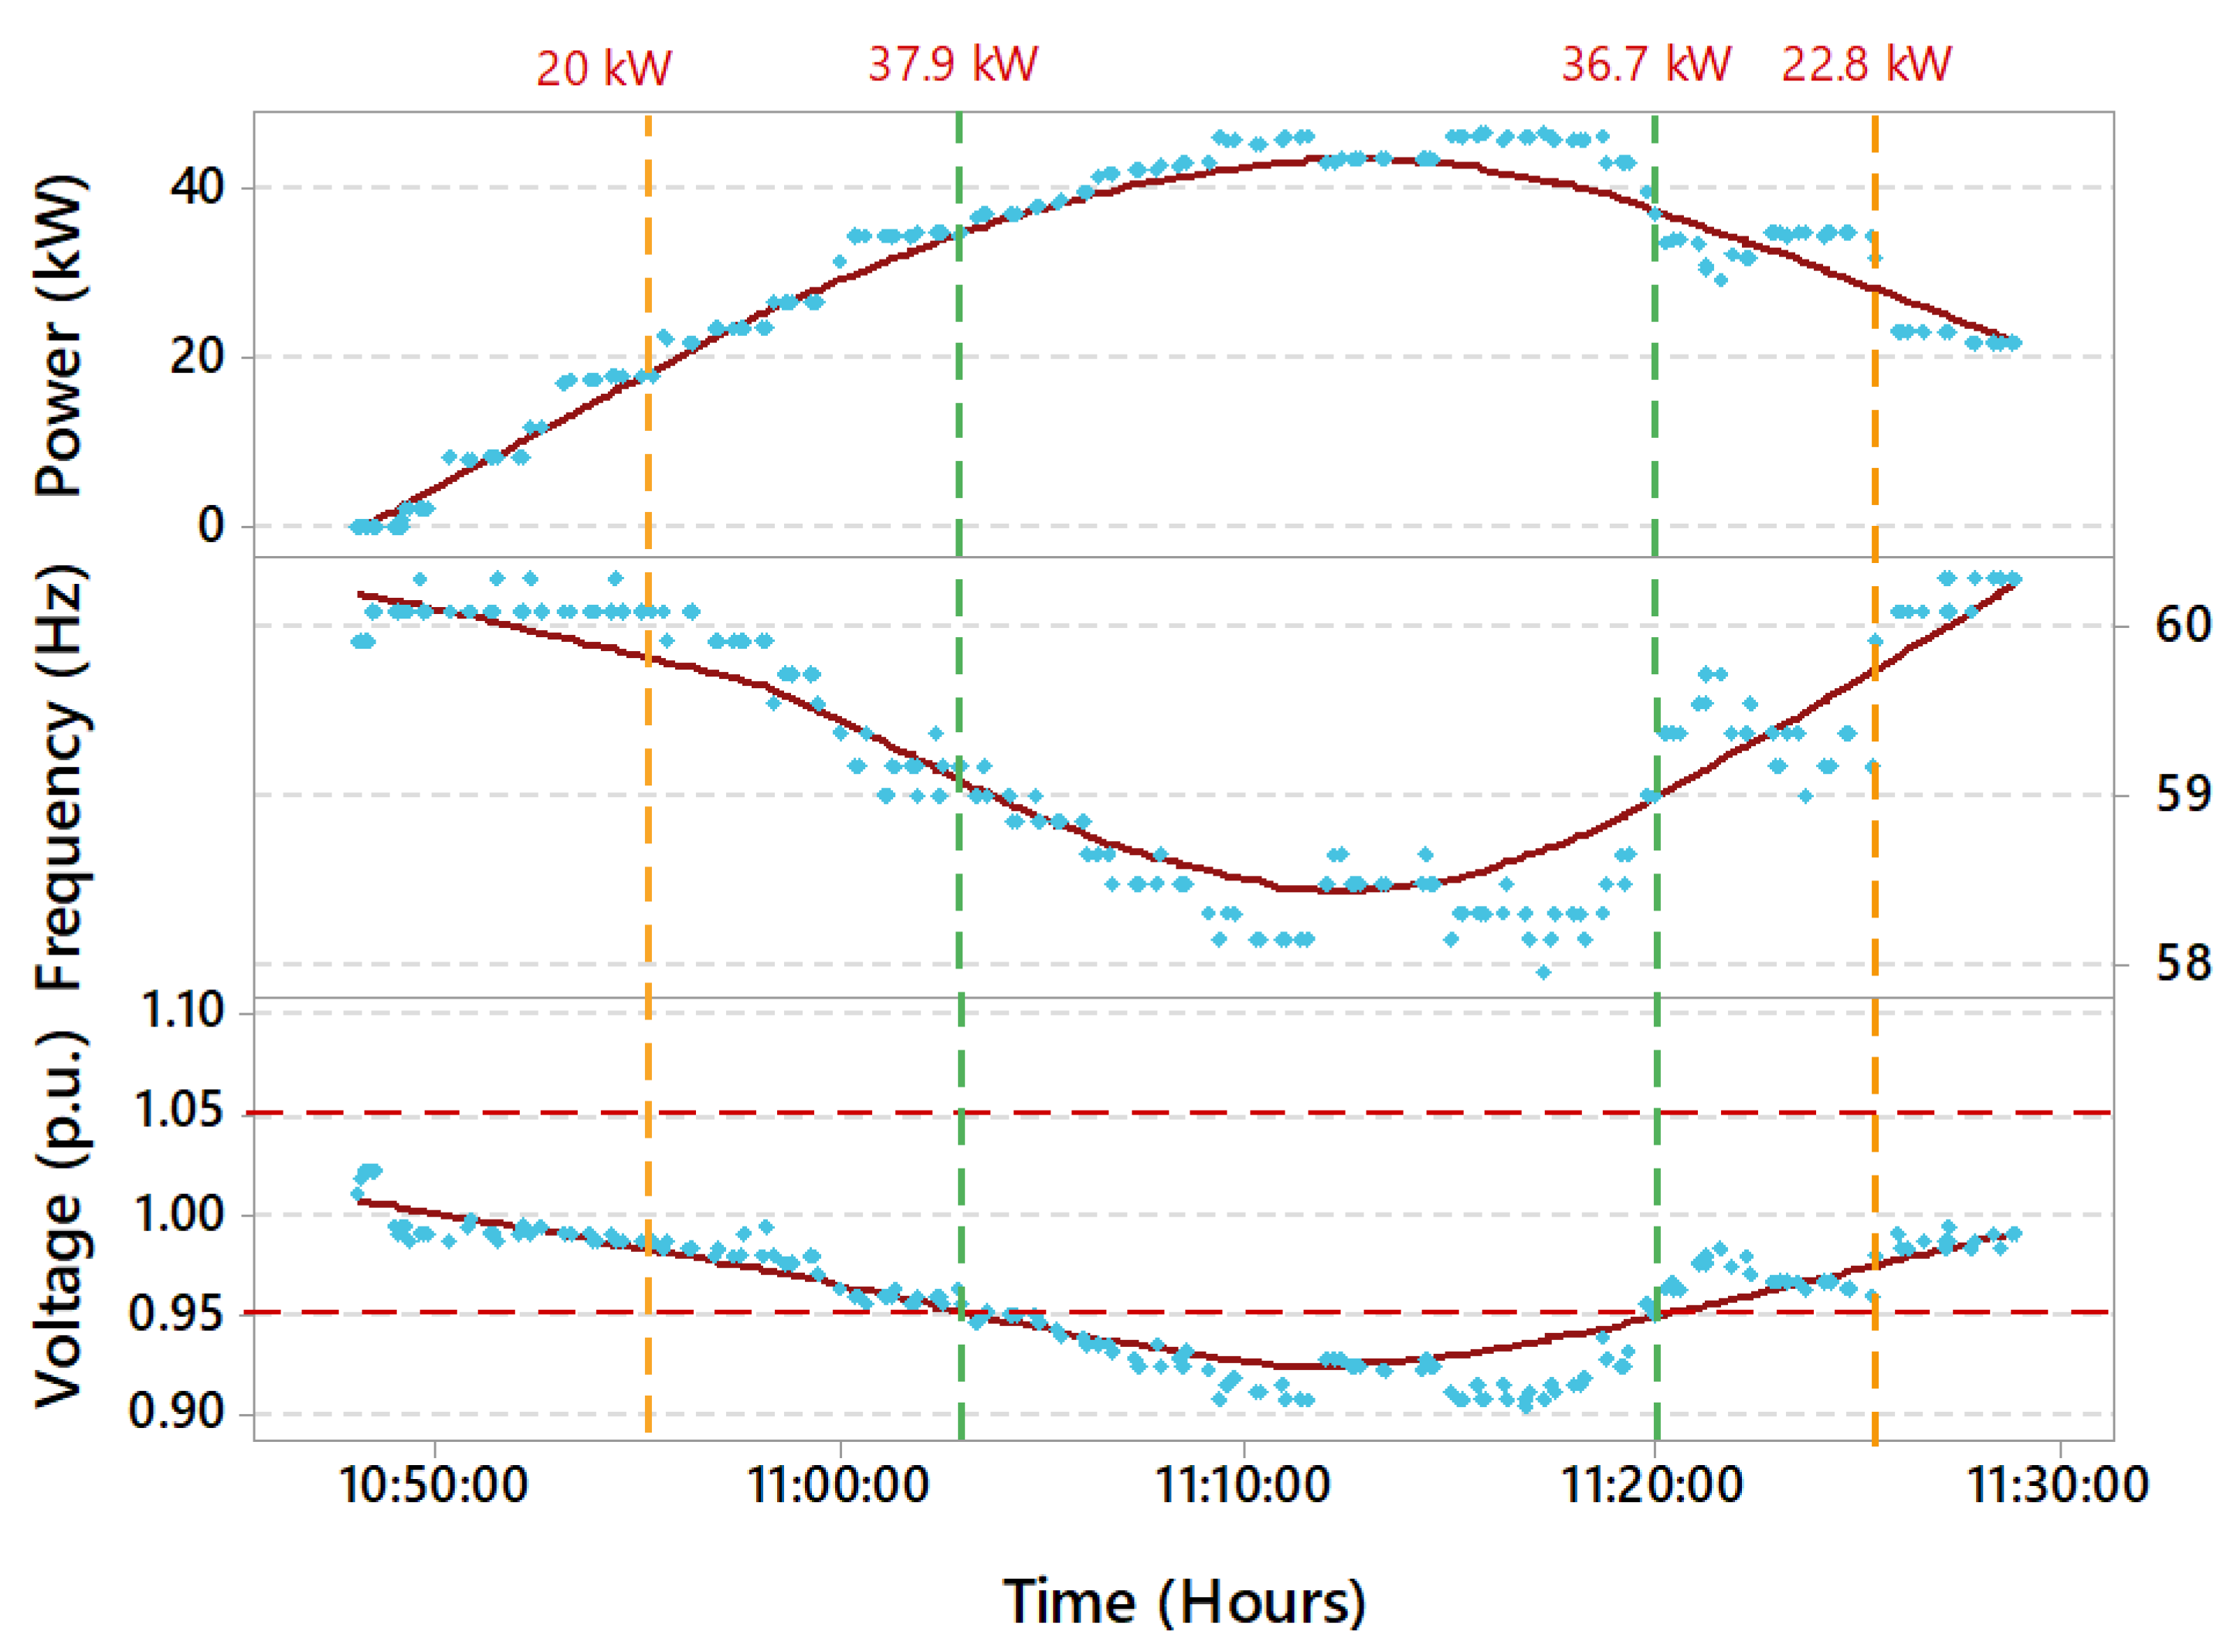
Analyzing the DG operation period with the LOM function disabled, it was found that both frequency and voltage decrease in the hybrid system as the power demanded increases.
Figure 19 details the magnitudes of voltage and frequency falls to values below those allowed in the national regulation, based on PRODIST module 8 [
44], which can result in damage and malfunction of the installed loads. The HMG frequency registers values below PRODIST standards at 20 kW < power (kW) < 22.8 kW. The voltage, on the other hand, presents unsatisfactory values, at 37.9 kW < power (kW) < 36.7 kW. The limits transgression can result in installed equipment malfunctioning in the building, so that it is important to maintain the LOM function enabled during the operation of the DG set.
5. Economic Evaluation of the Hybrid Mini-Grid
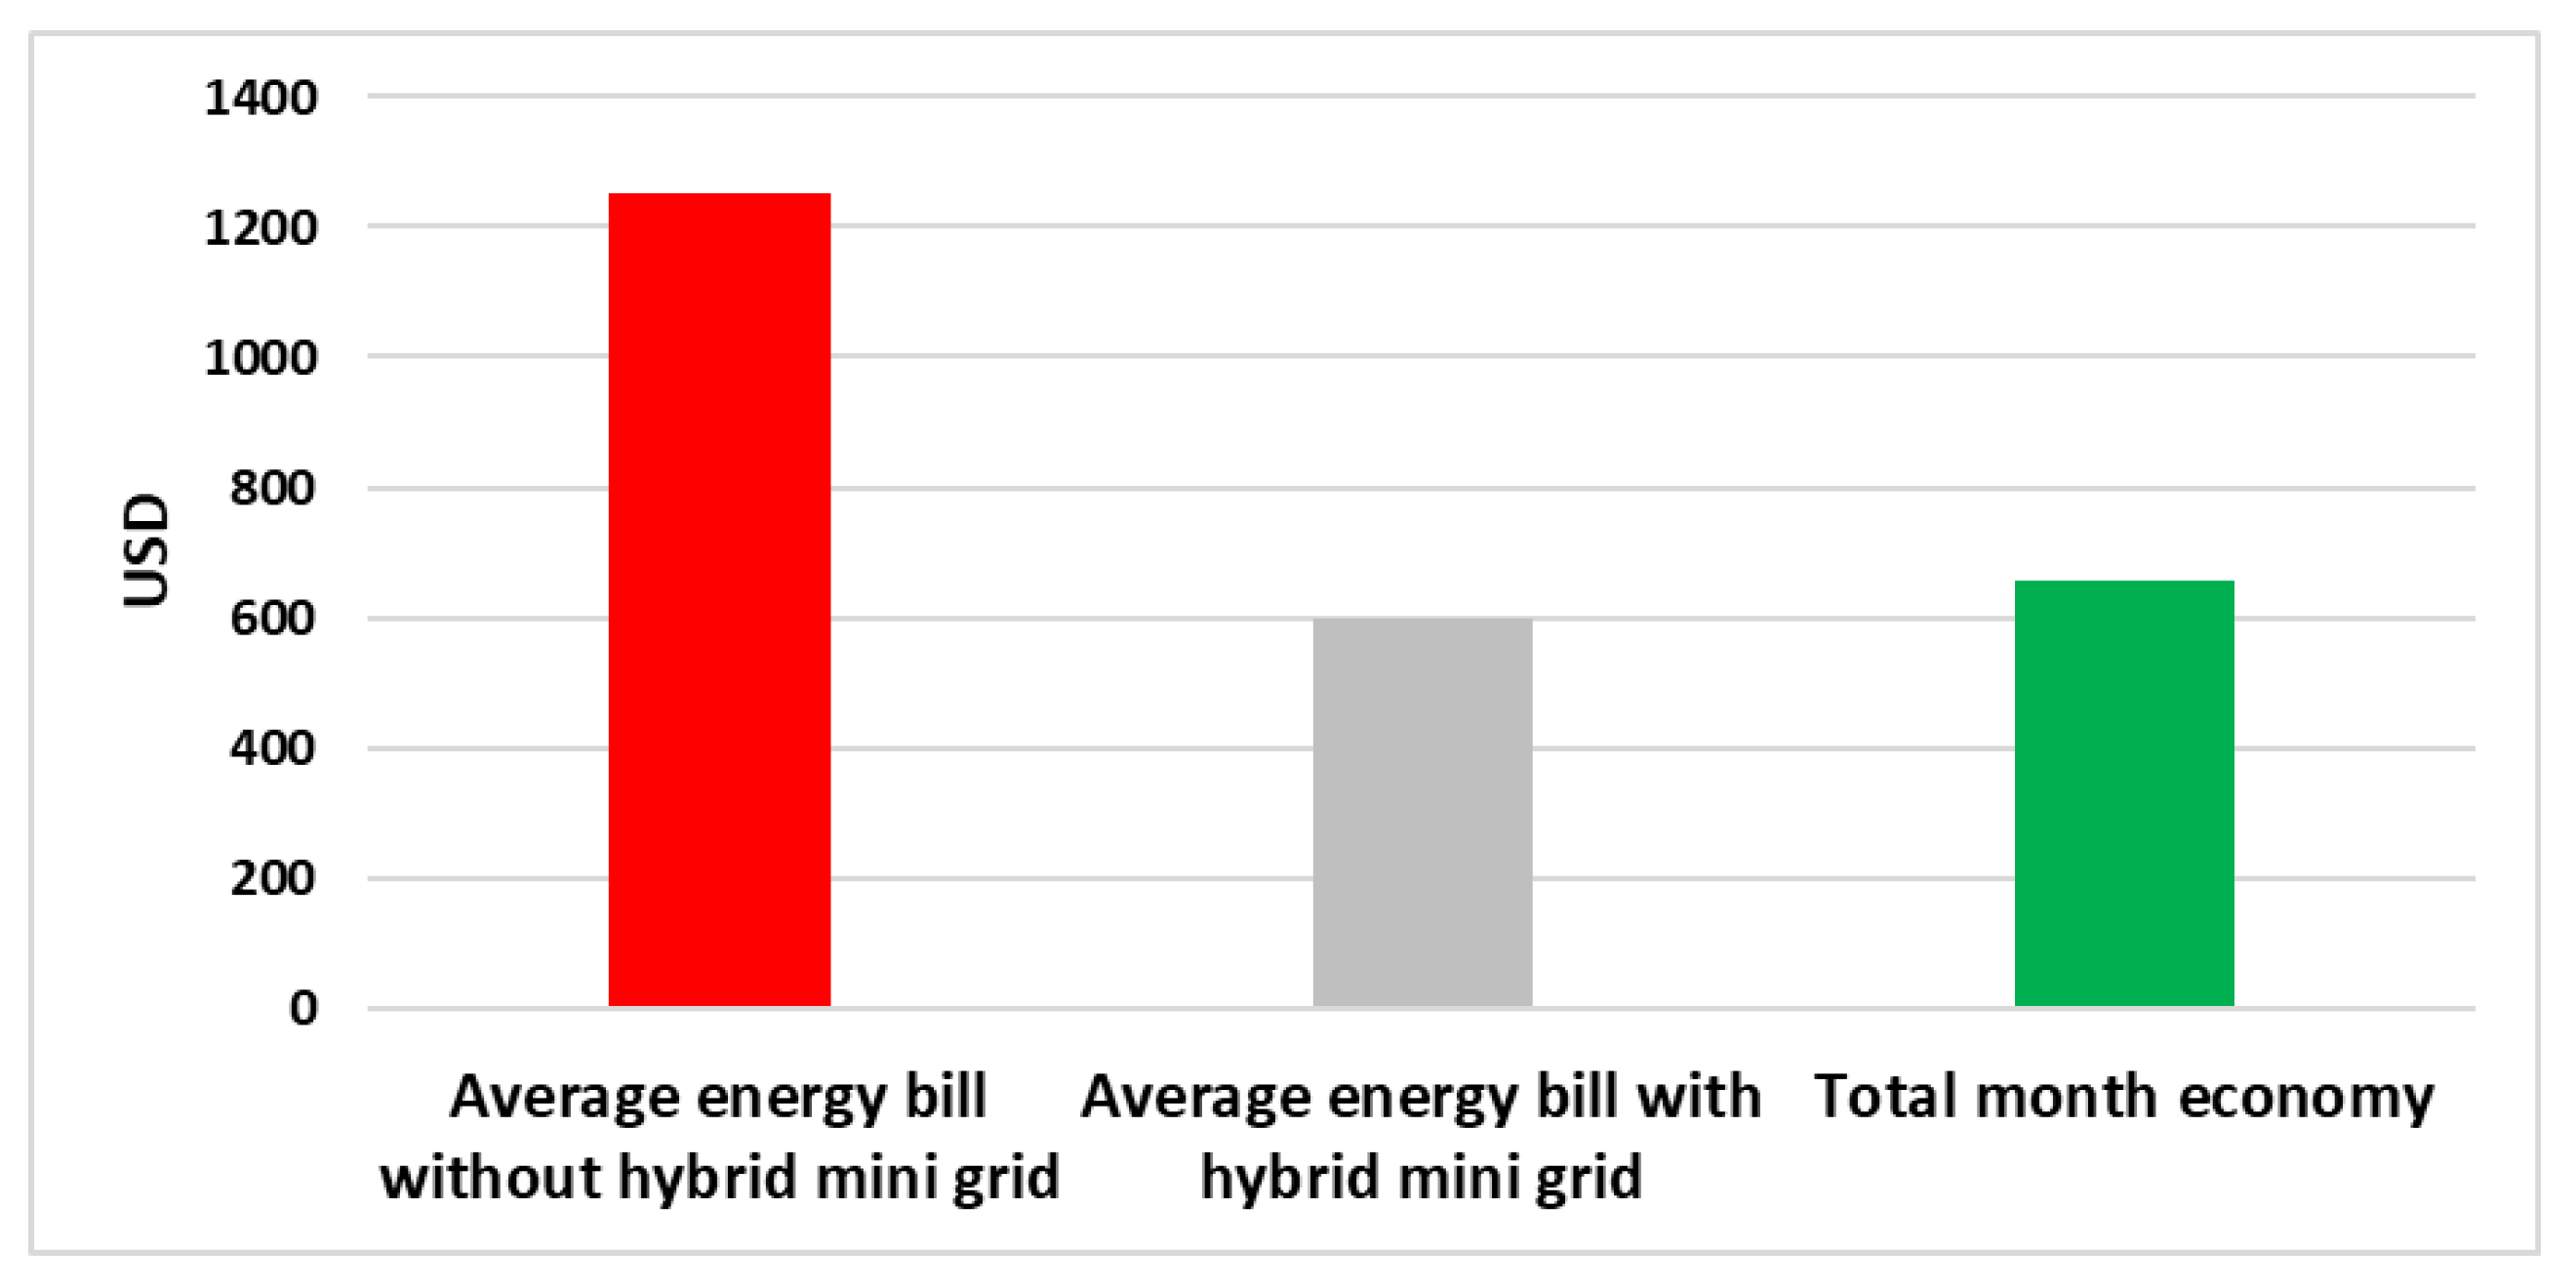
From a financial perspective, over a month, it appears that the joint operation of photovoltaic systems, storage and external grid, highlighted in
Section 4.1 using the on-grid and off-grid programmed operation, brings financial benefits to the consumer. The use of photovoltaic generation at the time of highest demand for energy in the CEAMAZON building and the storage of energy surplus in the set of batteries, make it possible to reduce the contracted demand during times of highest demand, reducing the energy consumption from the external grid for the building peak times demands, exactly when the utility´s energy is more expensive. In addition, the energy surplus generated by the photovoltaic systems can be delivered to the electric utility for consumption during times of higher consumption or lower photovoltaic generation at other times of the year, in accordance with Brazilian legislation.
In order to fully monetize the HMC consumption and generation, it was considered that the energy surplus will be sold to the local utility for the same tariff as it is purchased during off-peak hours.
Figure 20 shows a comparison of the CEAMAZON energy bill for the period of one month, with and without using the HMG. In the month in question, CEAMAZON saved USD 655.50.
In
Figure 21, an energy balance was made considering the complete system, using the three photovoltaic systems, the storage system, the loads in the CEAMAZON building and the utility grid energy. Together, the three photovoltaic systems indicate that the CEAMAZON mini-plant (PV-CEAMAZON 01, 02 and 03) has a larger generation than demanded. In this case, the surplus energy is distributed in UFPA’s internal grid to compensate, energetically and financially, the energy consumption of other university buildings.
Using the CEAMAZON HMG, it is noted that, mainly at the weekend, a large amount of energy is delivered to the university’s internal grid. According to the energy balance for the analyzed period, a projection of the grid behavior over a typical month was developed, the surplus of energy distributed in the campus would allow a reduction of 1.89% in contracted demand and 4.06% in energy consumption for the entire university. Despite the reduction appears to be small, given the magnitude of the UFPA loads, the results show the economic and energy benefits that HMG can bring for large-scale uses.
Based on the results presented in this section, it is possible to conclude on the economic benefits that the implementation of the hybrid systems brings to CEAMAZON and also to UFPA. The implementation of renewable energy generation and storage systems allow the reduction of contracted demand and energy consumption during peak hours, significantly reducing energy bill costs. In addition, analyzing the electricity grid from the point of view of distribution and generation utilities, when managing the energy mainly of large consumers, it is possible to reduce immediate costs with the construction/expansion of electricity grids, reduce energy theft, reduce energy demand at peak times, among other benefits.


 ,
, 


