Article

Forecast of the Demand for Electric Mobility for Rome–Fiumicino International Airport

1
Department of Astronautic, Electrical and Energy Engineering, Sapienza University of Rome, 00184 Rome, Italy
2
Aeroporti di Roma spa, Atlantia Group, 00161 Rome, Italy
*
Author to whom correspondence should be addressed.
Energies 2021, 14(17), 5251; https://doi.org/10.3390/en14175251
Submission received: 30 June 2021 / Revised: 19 August 2021 / Accepted: 20 August 2021 / Published: 25 August 2021
(This article belongs to the Special Issue Trends in the Development of Electric Vehicle)

Abstract

:
Following electrification of automotive transport, studies on the penetration of electric vehicles (EVs) are widespread, especially in defined contexts. As major transport hubs, airports fall within contexts worthy of interest. In this work, a forecast of the demand for electric mobility in an Italian international airport (Rome–Fiumicino) is presented. The main goal of the research is to build up a methodology that allows evaluating the penetration index of EVs that will access the airport parks in 2025 and 2030, to be able to have a preliminary assessment of the number of charging points necessary for serving them. In the paper, first, a wide review of proposed scenarios on the penetration of EVs at international and national level and available data on local automotive transport are presented, as a preliminary study for the definition of reference scenarios for the local context. Then, the proposed methodology is presented and applied to the specific case study. Finally, a preliminary sizing of the required charging infrastructure is reported. The results show that a significant impact on the airport electricity network can be foreseen, and it requires proper planning of adaptation/upgrading actions. The proposed approach can be considered as a reference for similar studies on electrical mobility in other airport areas around the world.

1. Introduction

Following energy, environmental, and health concerns in road transports [1,2,3,4,5], the automotive industry is quickly evolving in the direction of low-emission vehicles (LEVs) [6]. Electric vehicles (EVs) are regarded as a suitable option. They can be classified as reported in Table 1, as battery-powered electric drive alone, such as battery electric vehicles (BEVs) or full electric vehicles (FEVs), or combined with thermal traction, such as hybrid electric vehicles (HEVs), plug-in hybrid electric vehicles (PHEVs), BEV with range extender (REx), or extended range electric vehicles (ER-EV) Other low-emission technologies, such as fuel cell electric vehicles (FCEV), are in the minority.
The international literature dealing with the topic of electrification of transport, and in particular the spread of EVs, is wide-ranging, and approaches the subject from many different points of view.
Technologies for EVs are described, e.g., by Jorgensen [7]. Technologies and main challenges in the deployment of EVs are illustrated by Sanguesa et al. [8]. Advances in BEVs are discussed by Yuan et al. [6].
Advantages and disadvantages of EVs compared to combustion engine vehicles are discussed, e.g., by Herrmann and Rothfuss [9]. Advantages include greater efficiency, rechargeability of the storage device, outstanding power transfer, and absence of local emissions. Research on disadvantages and criticalities is limited. Disadvantages include the relatively heavy weight of electric propulsion (especially if combined with thermal propulsion in HEVs and PHEVs) and low energy density of batteries compared to fuels (resulting from battery science). Other disadvantages concern high costs, due to early level of industrialization, limited product ranges, and low sales. A relevant issue is the high cost of key components, especially batteries. It must be noted that acquisition cost is not the only economic criterion, as life-cycle costs and (lower) maintenance costs must be also considered. To exploit the full potential of EVs, key elements are the improvement of energy mix in power generation and the optimization of the environmental impact of the product’s life cycle [9]. The deployment of an adequate charging infrastructure is necessary, and the consequent impact on the power system must be considered [10]. The impact on the power system can be exacerbated in developing countries. EV charging can aggravate nighttime peak load in a less industrialized context, without support from solar power [11]. In this context, opportunities for EV development, e.g., in Southeast Asia, are discussed [12]. Another criticality in EV deployment is the decommissioning of exhaust batteries [13].
Advantages and disadvantages of EVs concerning technology, user experience, sustainability, and costs are summarized in Table 2.
Studies on the diffusion of EVs in the world are, e.g., by the Fraunhofer Institute [14] or the International Energy Agency [15]. As an example, EV registrations increased in major markets in 2020, notwithstanding the COVID-19 pandemic [15]. Drivers and strategies for the expansion of EV are investigated, e.g., by Wesseling et al. [16], by Gnamm et al. [17] for plug-in vehicles (PEVs), and by Osiecko et al. [18] in the European Union. A historical outline and a quantitative assessment of passenger EVs compared to other technologies are presented, e.g., by Gelmanova et al. [19]. EV technologies and data are presented, e.g., by Sanguesa et al. [8]. Examples of policies around the world supporting EVs are reported, e.g., by Kong et al. [20] or by Trencher et al. [21].
The massive deployment of EVs is expected to have a number of benefits. Potential energy saving and emission avoidance via electrification of road transports are investigated, e.g., by Gonzalez-Palencia et al. [2,3], Uherek et al. [1], Ortmeyer et al. [4], or Harvey et al. [5]. Models to estimate energy consumption of EVs are reviewed, e.g., by Villa and Montoya [22]. Franzò and Nasca [23] studied the environmental impact of EVs with a life-cycle approach. Other benefits concern the power system, as discussed, e.g., by Fan et al. [24], Manganelli et al. [25], Mwasilu et al. [26], Cochi et al. [27], or Richardson [28].
The diffusion of EVs is strongly conditioned by the development of charging infrastructure, mandatory for their expansion and deployment. The EV charging system has an unavoidable impact on the electrical grids. Studies on the implementation of charging stations and on the issues concerning the power system are available in literature [29,30,31].
The diffusion of electrical mobility in cities is an investigated topic in many papers, e.g., [8,32,33]. Airports, as major transport hubs, accommodate large parking facilities and are strongly affected by the massive deployment of electrical mobility, as discussed, e.g., by Triebke et al. [34]. Few studies on the electrification of road transports to airports and the allocation of EV charging in the airport premises are available [34,35,36]. Most research on airports focuses on energy saving and integration [37,38,39]. Airports are regarded as critical in the deployment of EV charging infrastructure [40]. Examples of airports with EV charging facilities to various extents are Stuttgart [41], London Luton [42], and Toronto Pearson [43] airports. Studies exist on approaches for the deployment of electrical mobility in urban areas [44].
The present paper takes its cue from the necessity to upgrade airports to accommodate EV charging infrastructure. While other studies use statistical approaches [34,35], in this work, a deterministic approach is used, to carry out a median, deterministic analysis, based on the large amount of detailed input data provided by the airport operator. The objectives of the work are:
  • The forecast of EV turnout at airport parking facilities at time horizon 2025–2030, for clusters of vehicles (chauffeurs, private cars, rental cars, and taxis).
  • The estimation of charging points potentially required accommodating the forecasted EV turnout.
For the purpose of a forecast at local level (airport area), it is necessary to elaborate forecasts at wider levels to extrapolate local results. In addition, given the specific context, analysis of other specific data (e.g., stop duration and vehicle age) is also necessary. It means that a specific methodology of forecast has to be formulated. The present paper shows the methodology formulated and the results obtained. The paper is organized as follows. Section 2 describes the case study. Section 3 deals with the analysis of EV development scenarios at the different levels and the definition of scenarios of the forecast at local level. In Section 4, the forecast of EV turnout for the case study is carried out. In Section 5, the preliminary sizing of charging infrastructure for the case study is performed. Section 6 concludes the paper.

2. The Case Study

The case study is the Rome–Fiumicino International Airport “Leonardo da Vinci”, the major airport in Italy and the 15th busiest airport in Europe by passenger traffic in 2020 (43,532,573 passengers in 2019 and 9,486,161 in January–December 2020) [45,46]. The landside mobility is organized in:
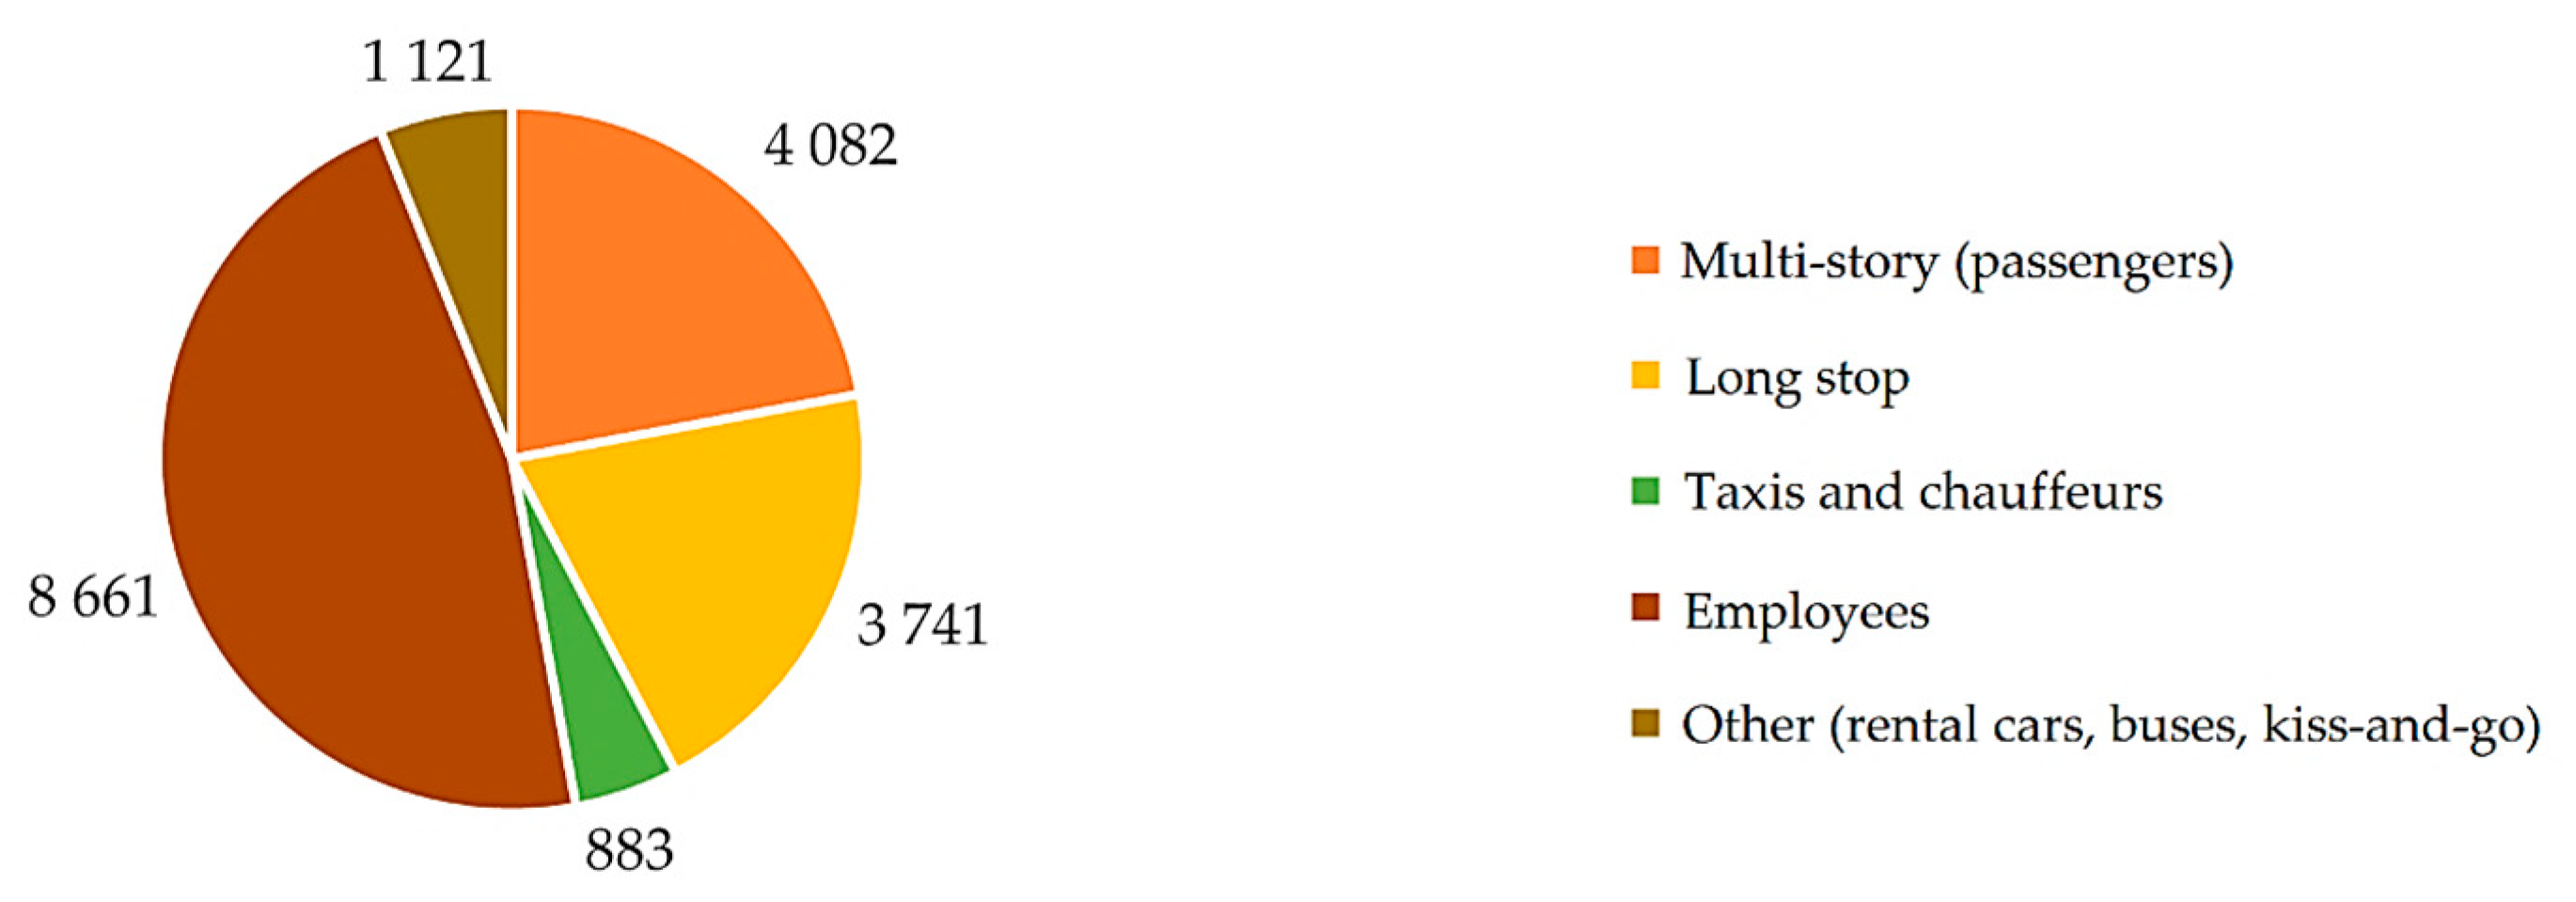
  • Parking areas for passengers and operators.
  • Sub-concession parking areas for car rentals, chauffeurs, and buses.
  • Non-sub-concession parking areas for taxis, chauffeurs, buses, and shuttles.
Transport to the airport is organized as follows [47]:
  • Public collective railway transport with the city of Rome: Ferrovia Laziale FL1 local train, Leonardo Express nonstop service.
  • Public collective railway transport to major Italian cities: Trenitalia Frecciargento high-speed trains.
  • Public and private collective road transport: shuttle buses by private companies.
  • Public personal road transport: taxis.
  • Private personal road transport: chauffeurs and car rentals.
The forecasting methodology aims to know the demand of electrical mobility in the airport area, split into the different categories of transport systems. For doing that, the first steps are related to the knowledge of the EV diffusion at national level and the analysis of EV development scenarios at international and national level.
In reference to data on EV fleet and market in Italy, the market is expanding, but it is still limited. In 2019, approximately 39,000 EVs were sold (less than 1% of two million cars sold) (Figure 1).
The analysis of EV development scenarios at international and national level has been referred to from different sources, and the results of the wide analysis and comparison is reported in the next section. From these scenarios, two reference scenarios have been defined at national level, as a starting point of the forecasting methodology proposed in Section 4. Estimated average BEV and PHEV penetration index on car sales, for 2025 and 2030, at world level, is reported in Figure 2.

3. Analysis of EV Development Scenarios at Different Levels
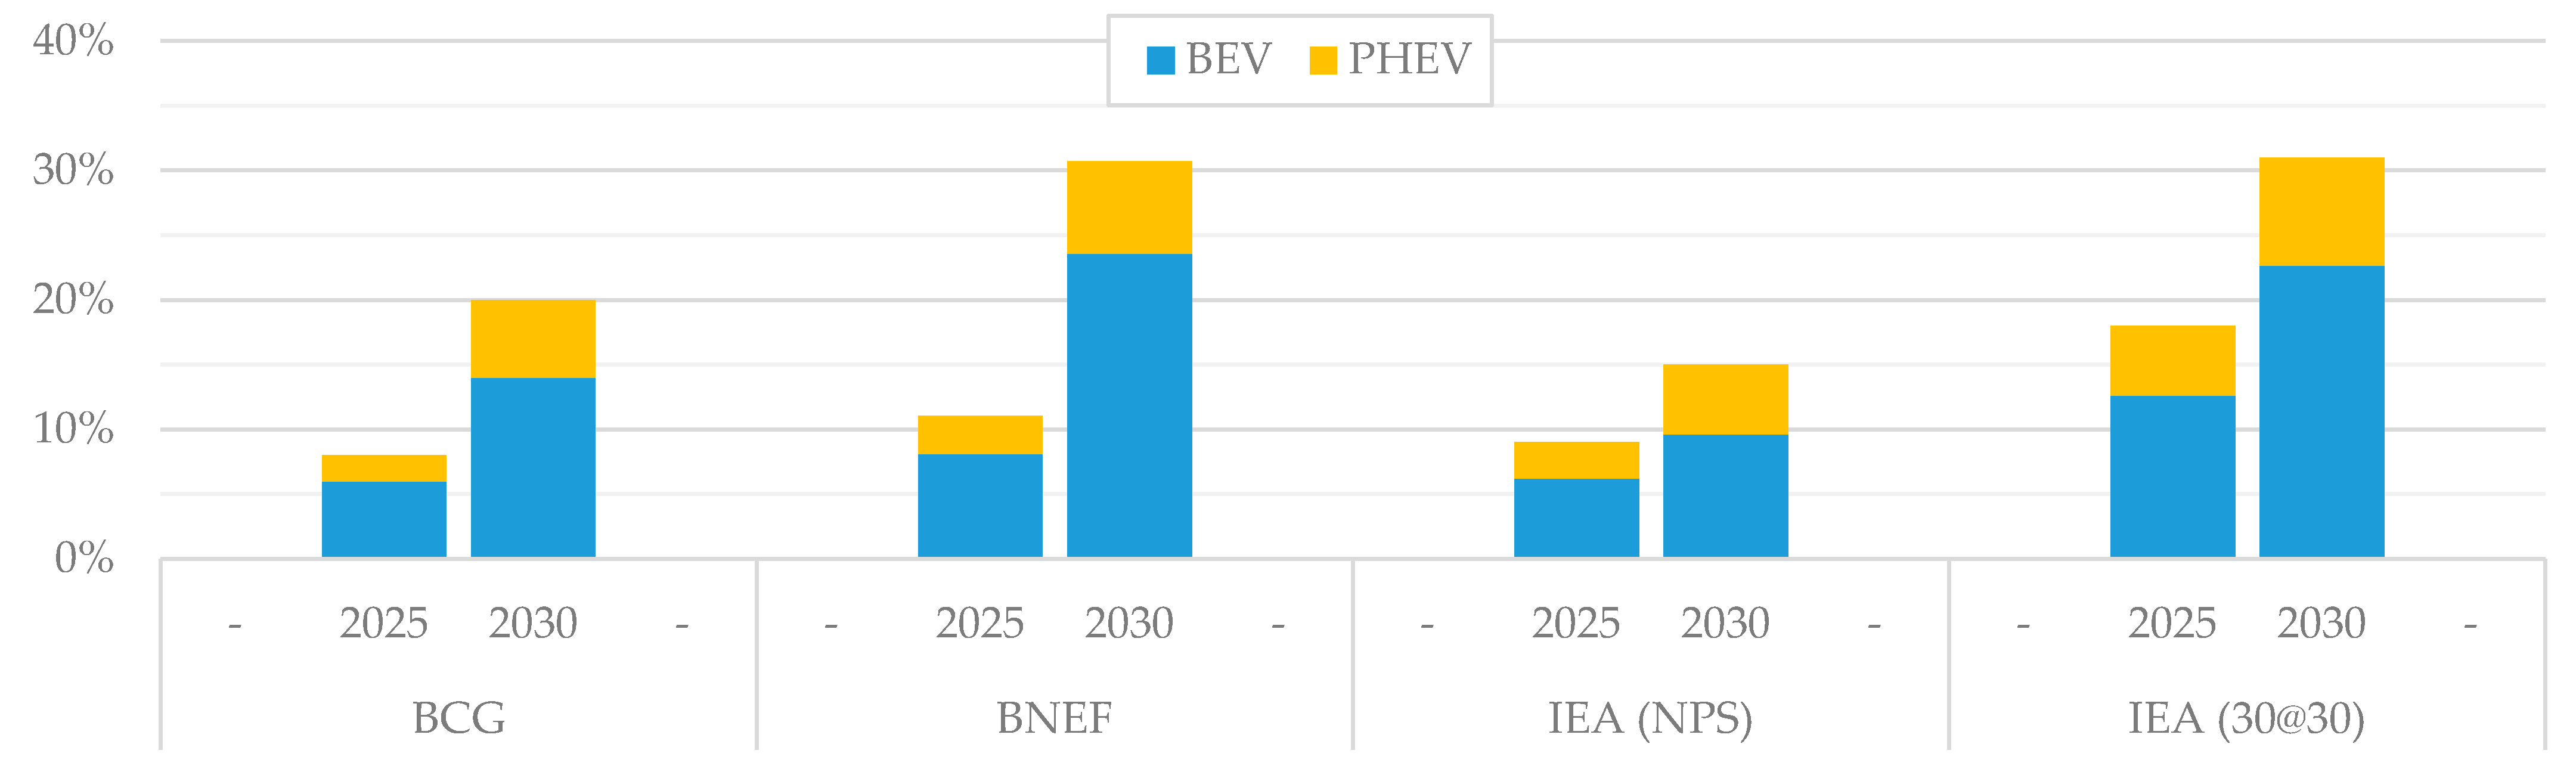
3.1. Global Level

The development scenarios on a global level are developed by international agencies operating in energy, mobility, and environmental sectors, such as:
  • Boston Consulting Group [48], where the analysis led to a single scenario, presented here as BCG.
  • Bloomberg NEF [49], under the assumption that in 2025, combustion engine cars and EVs will reach economic parity, presented here as BNEF.
  • IEA [50], which proposes two scenarios: IEA new policy scenario (NPS), this is the most conservative scenario and includes the impact of announced policy ambitions, and a more ambitious one, IEA 30@30, which accounts for the pledges of the EVs EV30@30 campaign to reach 30% market share for electric vehicles by 2030.
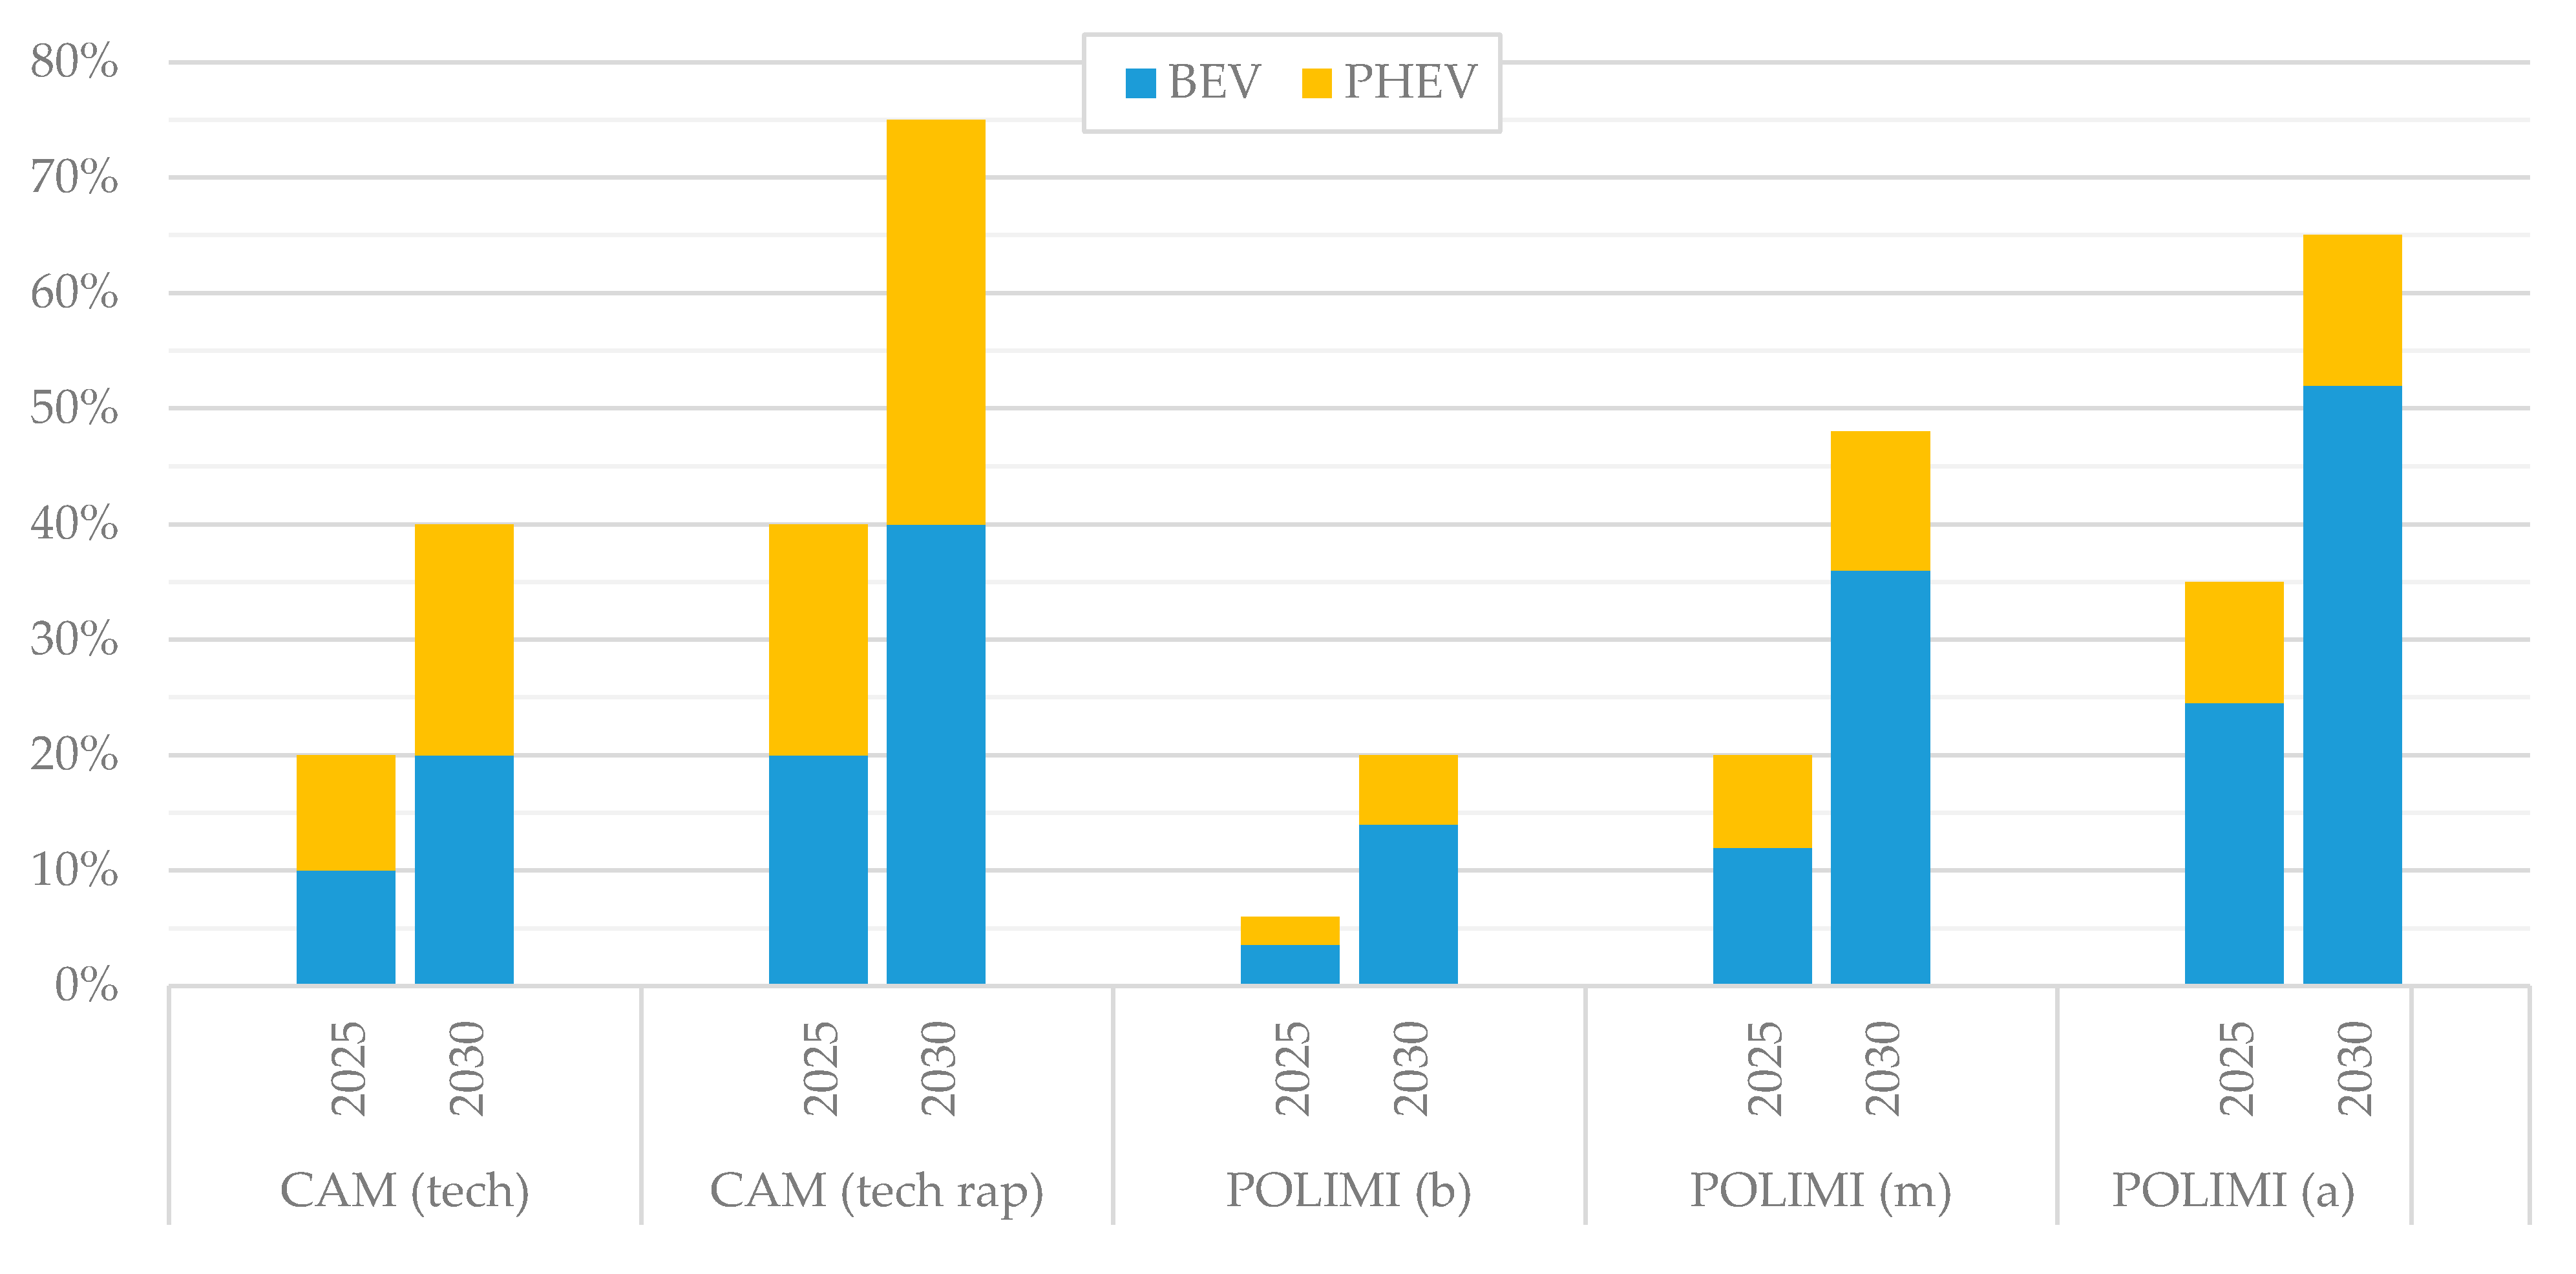
The mentioned reports are compared with reference to the penetration index of new EV registrations, where this index is defined as the ratio between the number of EVs and the total number of vehicles expressed in percentage. In particular, the EVs considered are only BEV or PHEV, while the timeframe examined includes the years 2020, 2025, and 2030. Figure 3 shows the results of the comparison among the scenarios listed above in terms of estimated average BEV and PHEV penetration index on car sales, for 2025 and 2030, at a world level.
With global sales of new electric cars having reached 2.1 million units in 2019, the actual global penetration index remains slightly more than 2%. According to the results showed, this value could rapidly increase up until 2030. Indeed, whilst the sales shares for BEV models vary between 10 to 24% by 2030, for PHEV ones, the forecasts indicate a value between 5% and 9%.

3.2. European Level

The projected scenarios at European level were developed by some international agencies operating in energy, mobility, and environmental sectors, such as:
  • Boston Consulting Group [48] (BCG).
  • Cambridge Econometrics [51], which develops a set of three scenarios, each assuming a different decarbonization pathway taken by most major car manufacturers to meet EU CO2 emissions reduction targets. The scenarios are presented as: CAM, CAM (Tech PHEV), and CAM (Tech OEM).
  • Transport and Environment [52], which defines five scenarios, based on the incremental fuel efficiency upgrade of future ICE car fleet. The scenarios are presented as: TRA&ENV (b), TRA&ENV (lICE), TRA&ENV (hICE), TRA&ENV (BEV), and TRA&ENV (PHEV).
  • IEA [50], which proposes only an NPS scenario to forecast new electric vehicles sales in Europe.
According to the CAM (Tech) scenario, ambitious deployment of fuel-efficiency technologies allowed new car sales mix to reach emissions target, with a predominance in BEV sales. A variant of this scenario, where PHEV emerges as the dominant segment, is represented by CAM (Tech PHEV); while in CAM (Tech OEM), there was supposed a more ambitious deployment for advanced powertrain, in line with recent OEM announcements.
Starting with the central scenario TRA&ENV (b), transport and environment supposes different strategies adopted by carmakers to improve the average fuel efficiency. In the TRA&ENV (lICE) (low ICE improvement) scenario, carmakers choose not to invest in the incremental efficiency gains of ICE engine, while in TRA&ENV (hICE) (high ICE improvement), more hybrid vehicle sales are assumed to improve average fuel efficiency of car fleets. Further scenarios are TRA&ENV (BEV), where carmakers focus on selling BEVs, and TRA&ENV (PHEV), with an equal distribution between BEV and PHEV up to 2030.
Additional hypotheses, such as future declining of battery cost, growing incentive policy announcements, and increasing of shared mobility, are just some of the bases of BCG and IEA NPS scenarios that led to the following predictions.
Figure 4 shows the results of the comparison among the scenarios listed above in terms of estimated average BEV and PHEV penetration index on car sales, for 2025 and 2030, at European level.
The results show an improvement on market sales at 2030 both for BEV and for PHEV segments, which account for a total share between 6 to 36%.

3.3. Italian Level

The forecasting scenarios at national level are developed by some national and international agencies operating in energy, mobility, and environmental sectors, such as:
  • Cambridge Econometrics [51], from which two main scenarios are extracted, presented as CAM (Tech) and CAM (Tech Rap).
  • Politecnico di Milano [53], with three scenarios, classified as POLIMI (b—base), POLIMI (m—moderate), and POLIMI (a—rapid).
The CAM (Tech) scenario allows to reach the average fuel emission target set by European directive (DAFI), while, with a faster deployment of advanced powertrain achieved in the CAM (Tech Rapid) scenario, new car registrations in 2030 meet 25 CO2/km emission.
The report by Politecnico di Milano presented an analysis based on vehicle stock gained for each forecasting year. POLIMI (b) assumes a total volume of 2 million cars in circulation in 2030, whereas the future fleet for the other scenarios increase up to 5 million and 7.5 million, respectively, for POLIMI (m) and POLIMI (a).
Figure 5 shows the results of the comparison among the scenarios listed earlier in terms of estimated average BEV and PHEV penetration index on car sales, for 2025 and 2030, at Italian level.
The sales shares for BEV models in Italy vary between 14 to 54% by 2030; for PHEV ones, the forecasts indicate a value among 6 to 34%.

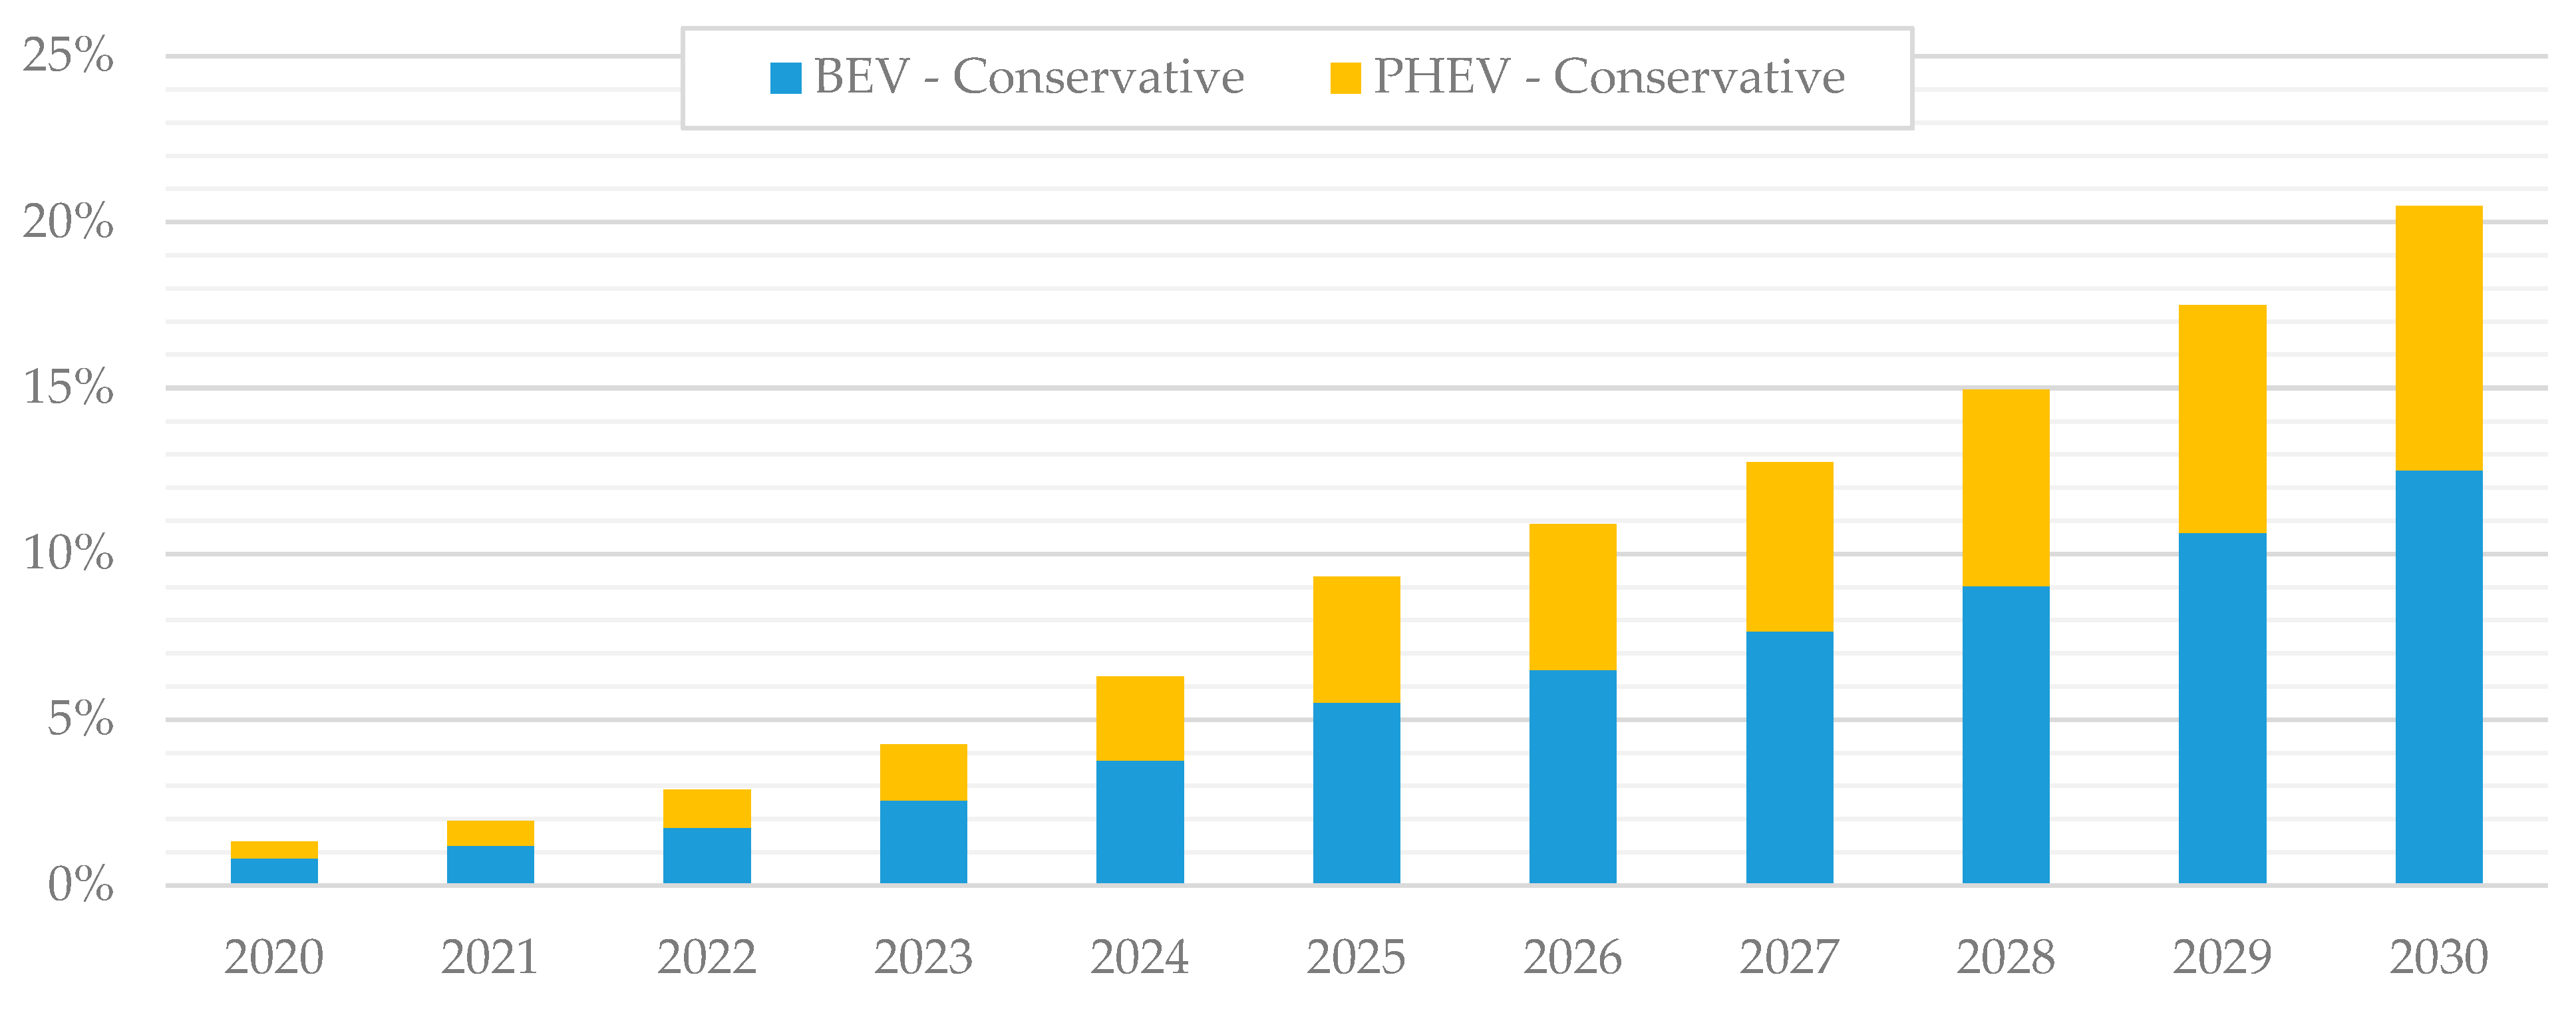
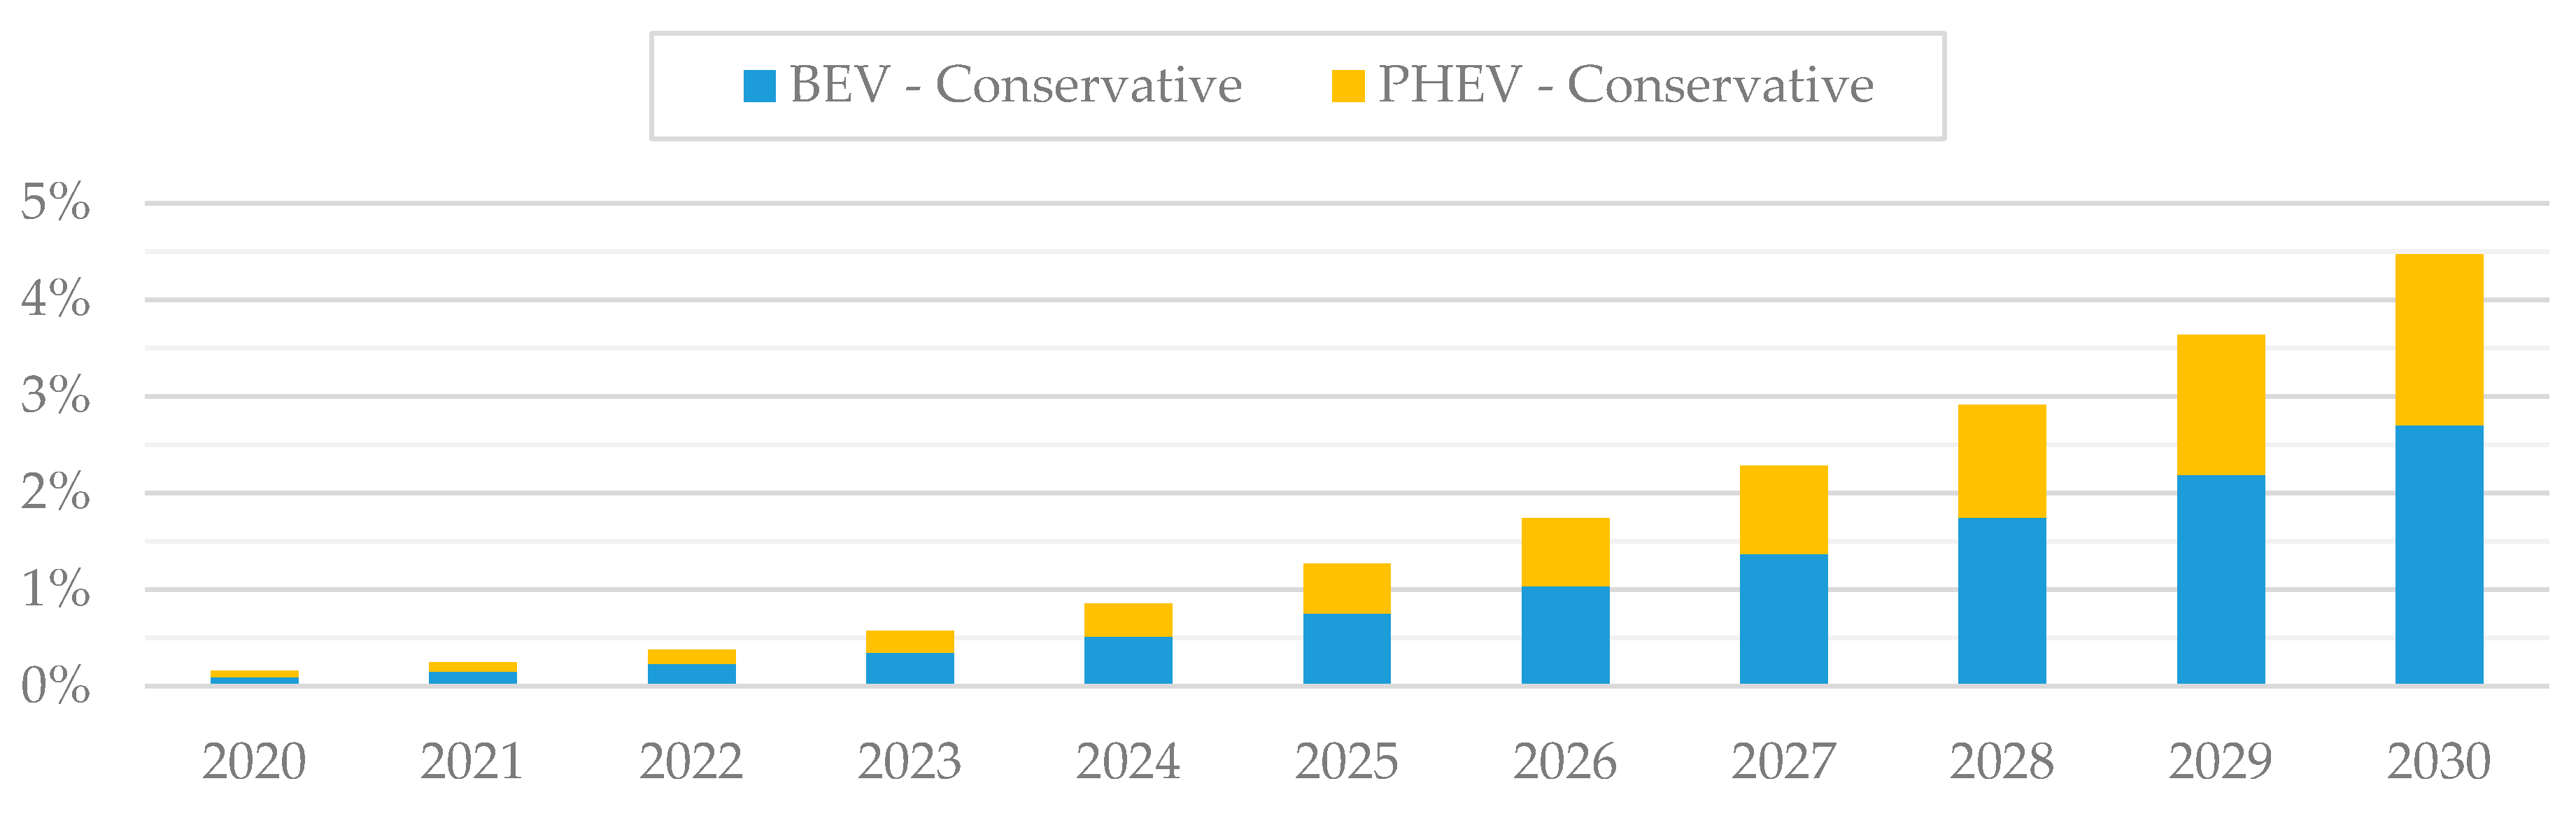
3.4. Definition of Reference Forecasting Scenarios for the Case Study

Two scenarios were identified as reference, taking into consideration the studies listed above. Given the number and variability of studies, it is necessary to condensate forecasts into a range in which the demand of local electric mobility is presumed to vary. The range is delimited by two scenarios constituting the envelope in which electric mobility is forecasted to vary in the 2030 horizon, defined as:
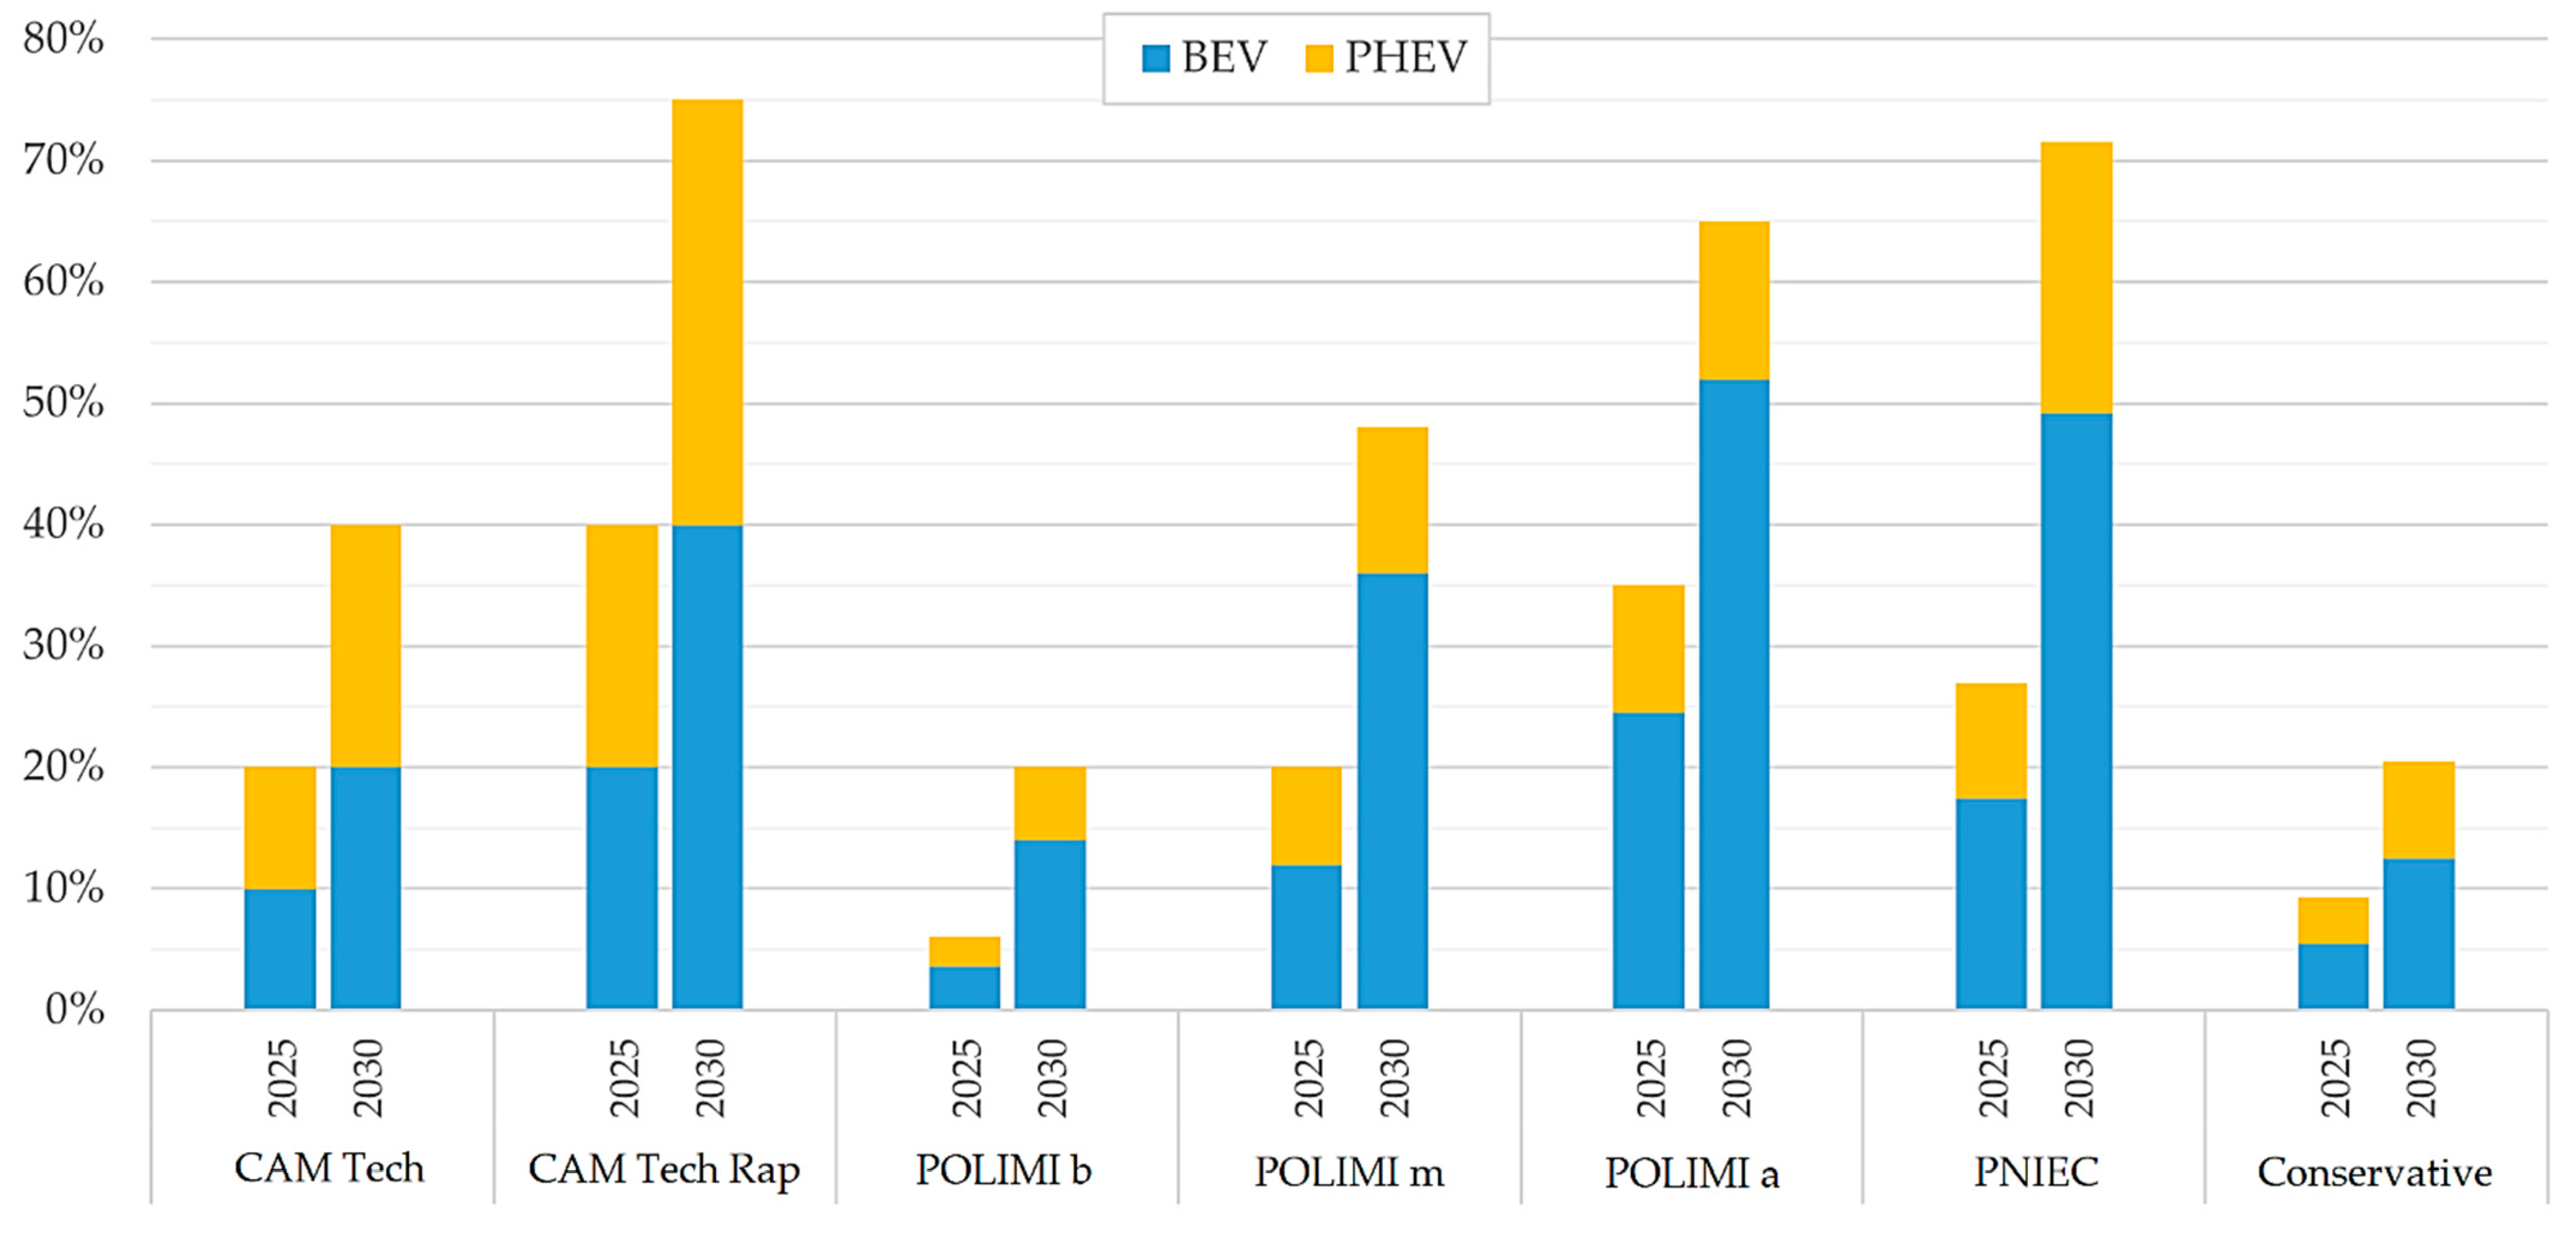
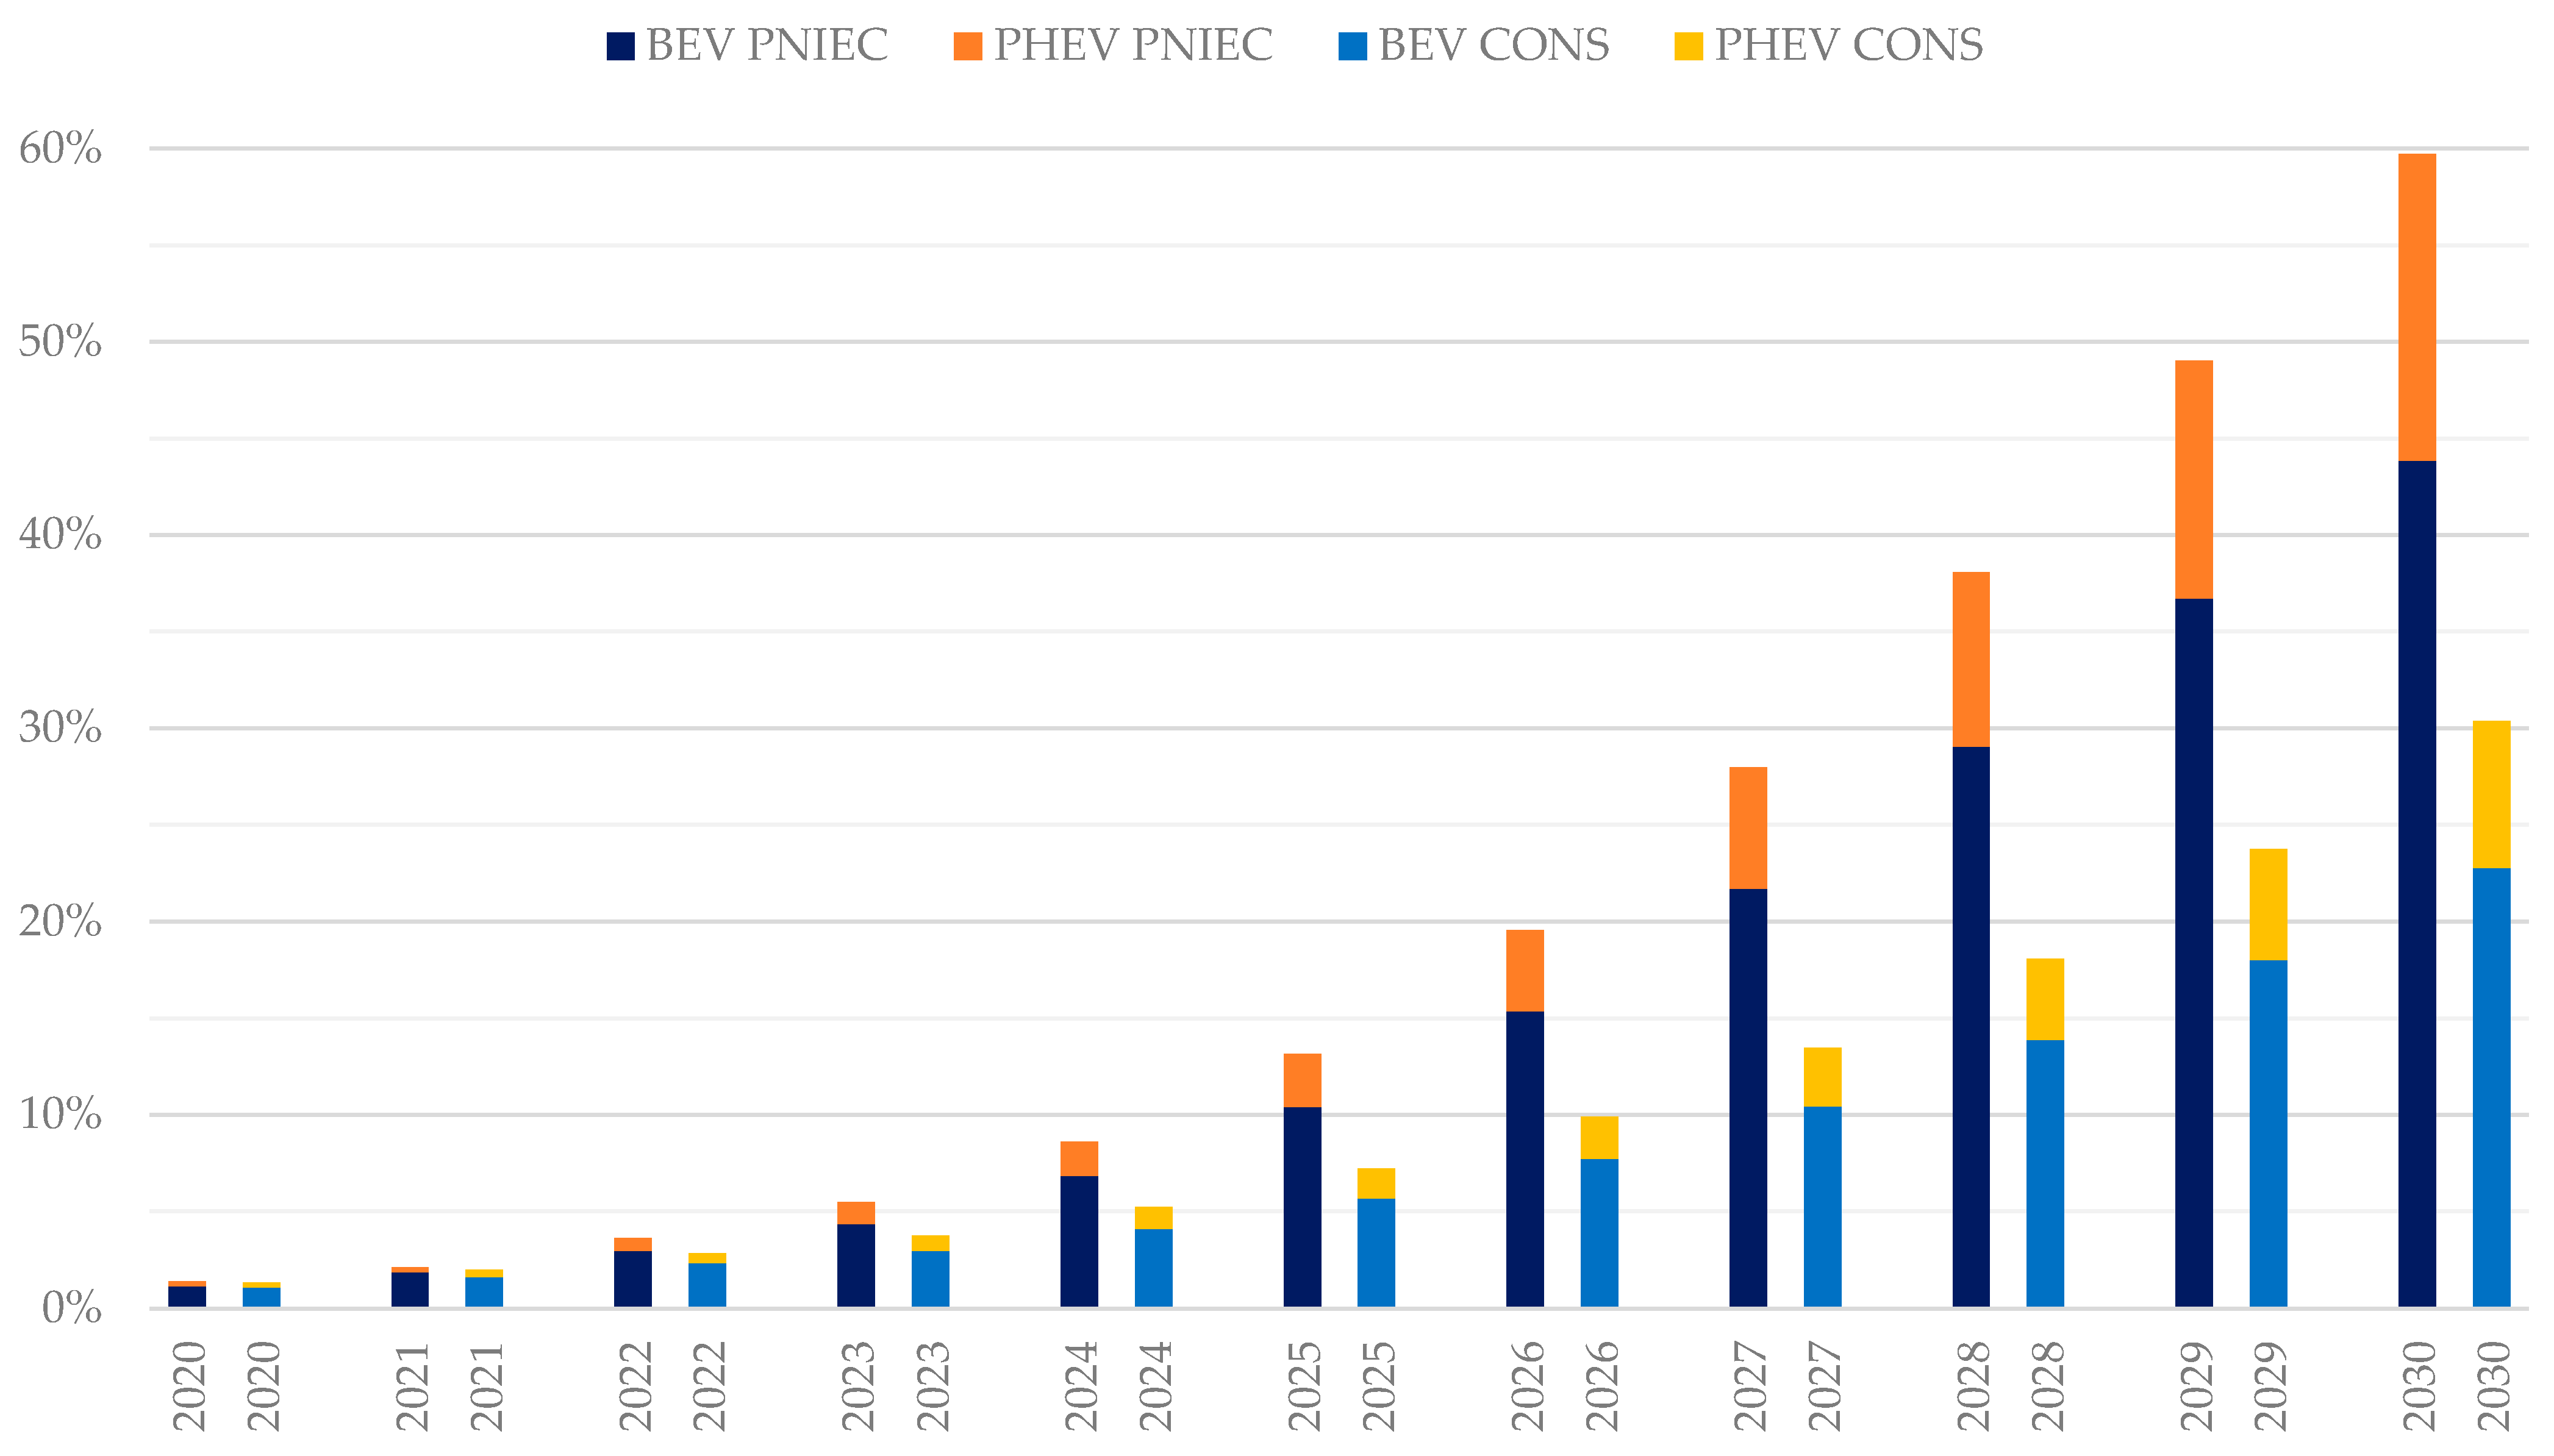
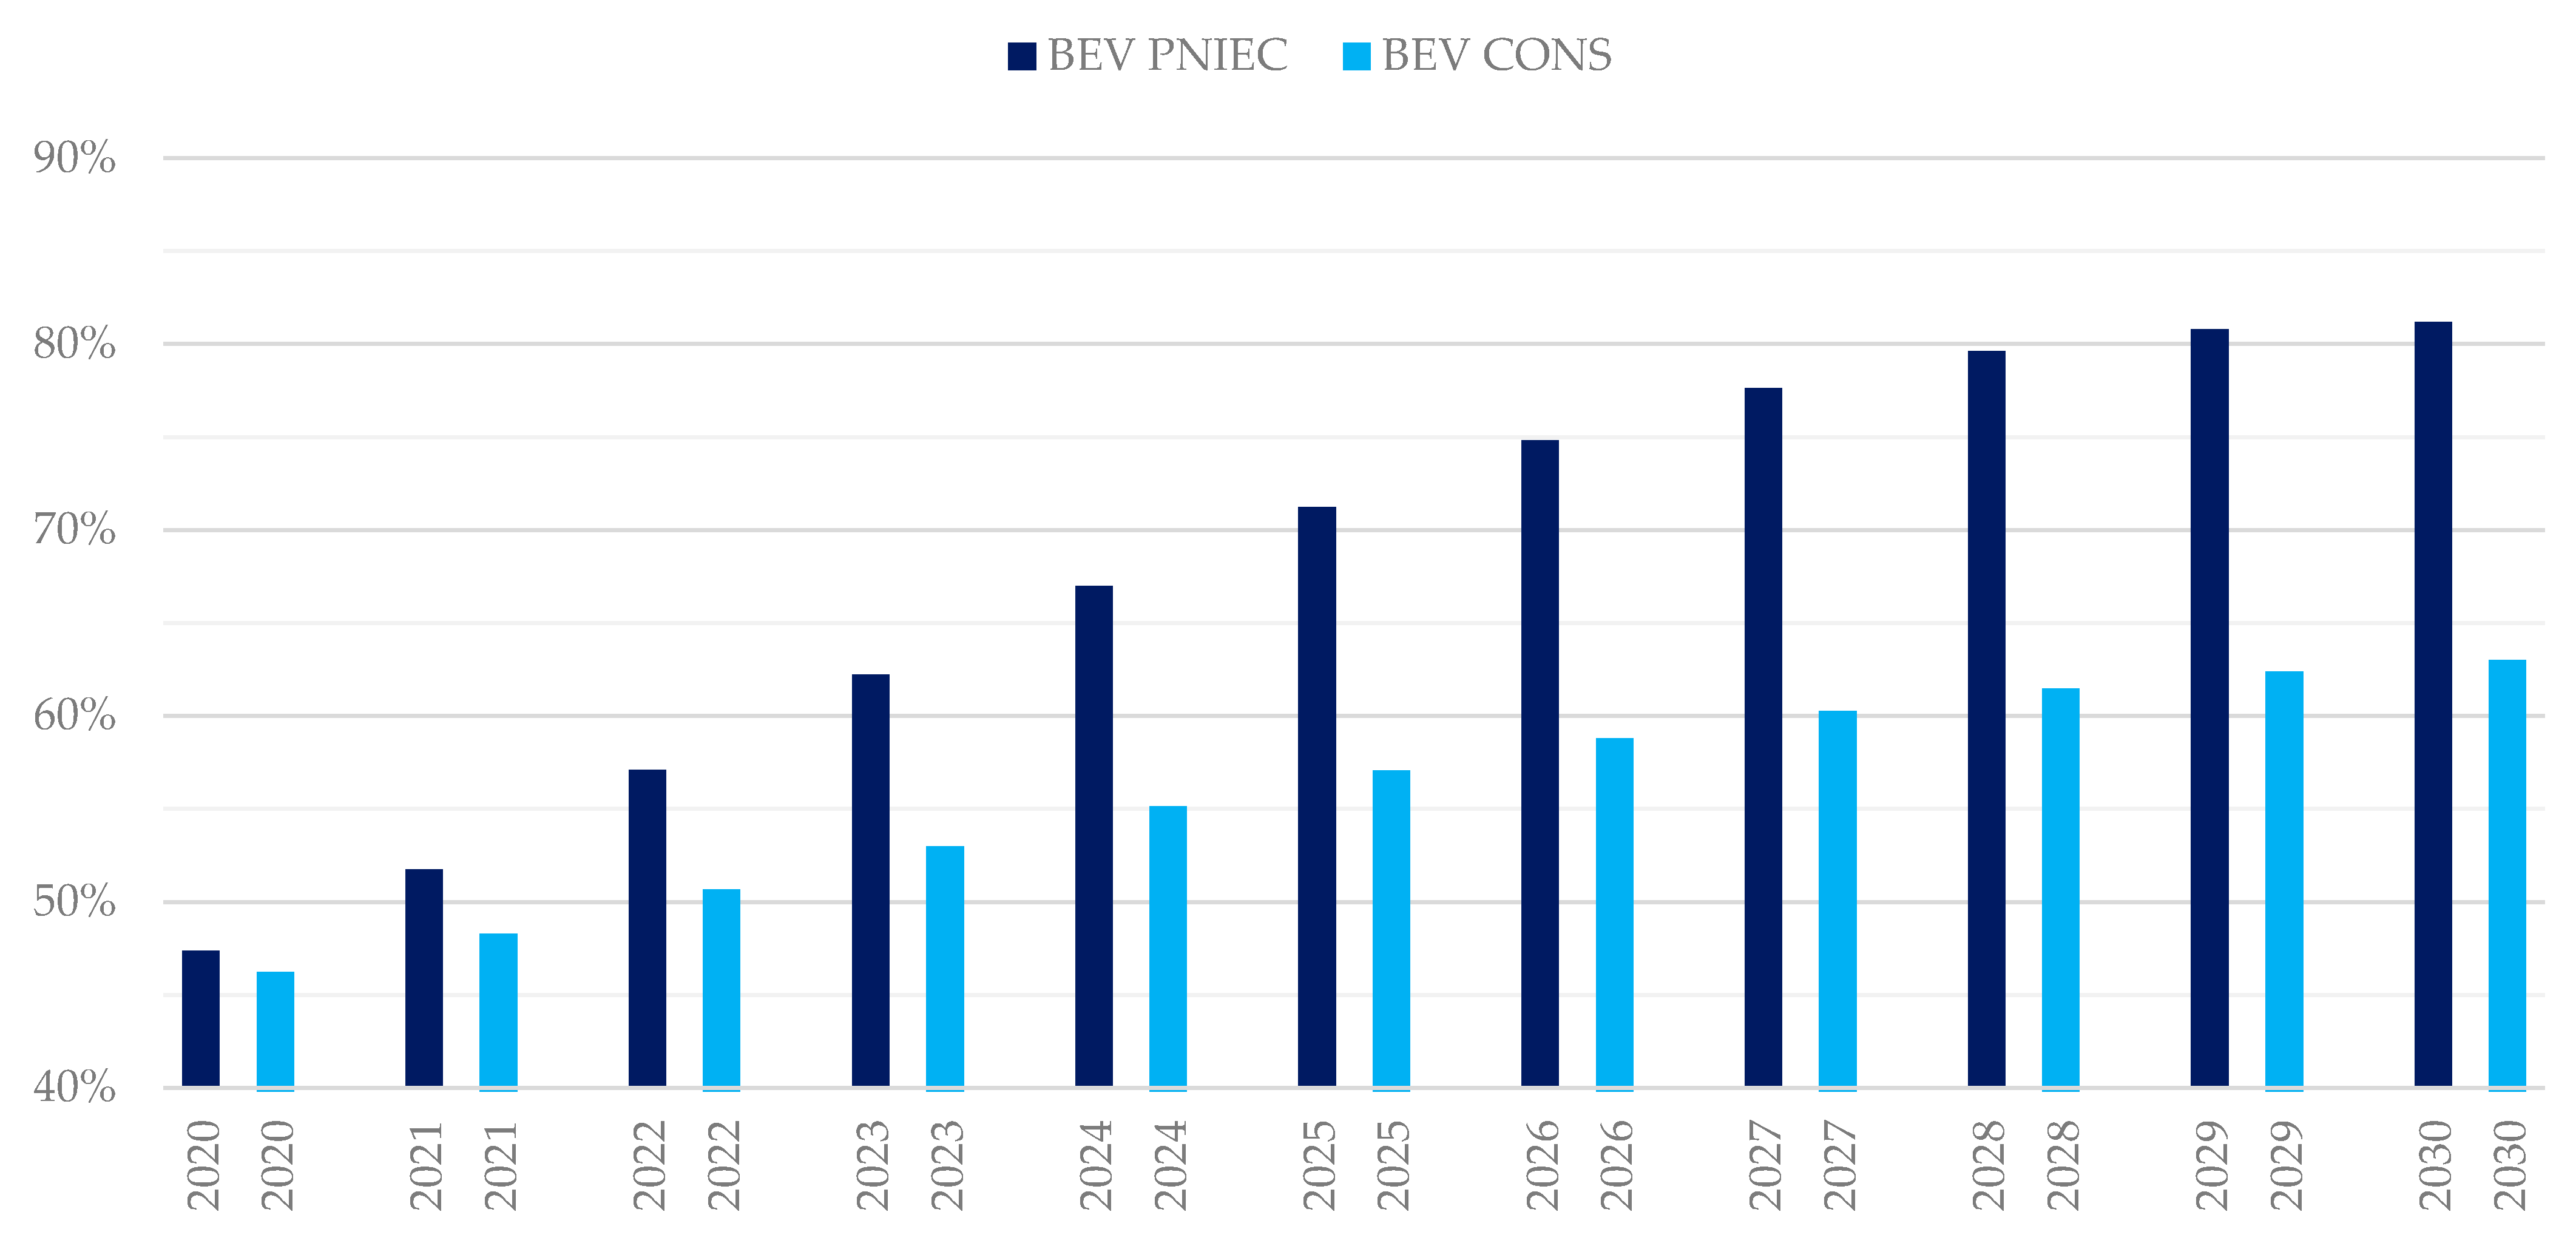
  • Conservative scenario: significant incentive policies are not considered, and it is in line with the basic one of the Politecnico di Milano study [53], which envisages the least expansion.
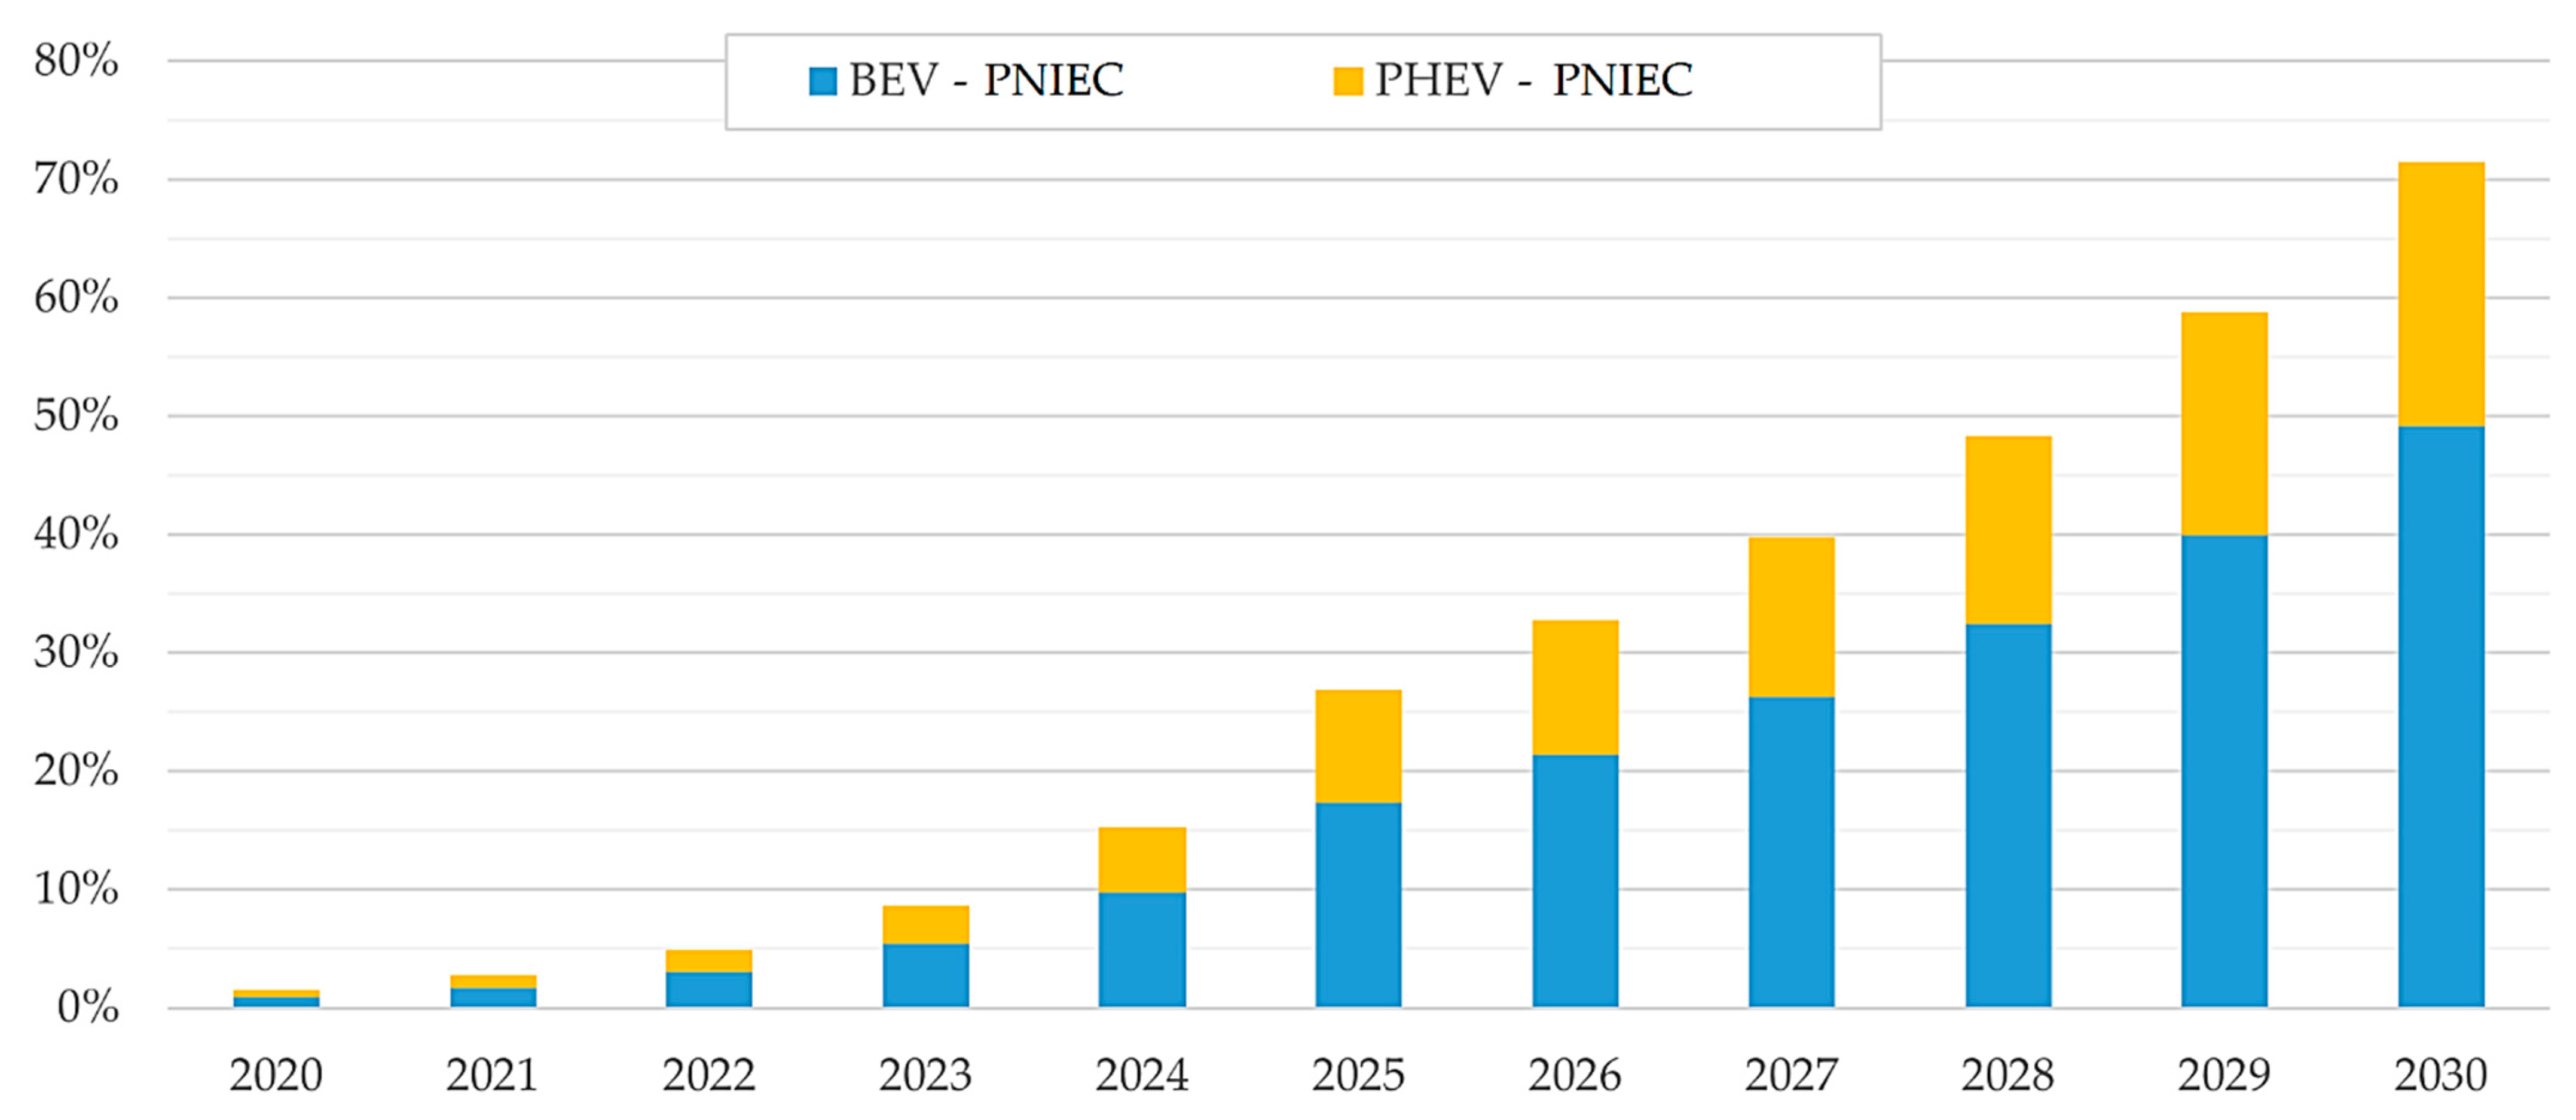
  • PNIEC scenario: it is in line with the objectives on electrical mobility included in the Italian Integrated National Plan for Energy and Climate (Piano Nazionale Integrato per l’Energia e il Clima 2030, PNIEC) [54] (to have 6,000,000 EVs circulating in 2030); consequently, it is the upper limit for the demand for Italian electric mobility in 2030.
The conservative scenario considers a total of 2,000,000 EVs circulating in 2030, of which 1,200,000 are BEVs and 800,000 are PHEVs. Figure 6 shows the estimated average BEV and PHEV penetration index on car sales from 2020 to 2030 at Italian level. Therefore, the conservative scenario envisages a market share on sales of approximately 15% for BEVs and 10% for PHEVs by 2030, having assumed constant annual sales equal to 1.95 million vehicles per year. Figure 7 shows the estimated average BEV and PHEV penetration index on car fleet from 2020 to 2030 at Italian level, with values equal to approximately 2.7% of BEV and 1.7% of PHEV.
The PNIEC foresees the effectiveness of investments in electric vehicles in 5–7 years, hence an overall diffusion of roughly 6 million EVs, of which 4 million are pure EVs (BEV) and 2 million are hybrid EVs, by 2030. Assuming this target is achieved, there will be 44 million vehicles circulating, with 14% made up of EVs (BEV or PHEV), in 2030. The trend for the intervening years was calculated by interpolating data with a logistic curve (sigmoidal), whose equation is:
f ( x ) = Y 1 + e x μ s
The assumptions used to uniquely determine the equation are as follows: the choice of the horizontal asymptote, represented by the constant Y, is carried out, imposing for every typology a saturation level in the new registration in line with the values presented in the analyzed reports, for which the phase-out year in the sale of conventional technology is set at 2040 with a ratio of BEV to PHEV equal to 2:1.
  • The number of cars sold in 2019, for every typology, is obtained from the historical analysis.
  • The number of cars sold in the horizon year 2030 is such to make the fleet in circulation reach the corresponding value for the scenario considered.
As shown in Figure 8, the PNIEC scenario envisages a penetration index of sales of about 50% of BEV and 25% of PHEV, having assumed the total annual sales as constant and approximately equal to 1.95 million of vehicles/year. The penetration index on the car fleet is shown in Figure 9 and it is about 9% of BEV and 4.5% of PHEV.
The market share of BEVs and PHEVs in the two developed scenarios is shown, for the years between 2020 and 2030, in Figure 10, where a comparison with the various literature scenarios is also reported.

4. Forecasting of Rome–Fiumicino Airport EV Development Scenarios

4.1. Data and Methodology

From the scenarios defined for the international and national level, a methodology is defined to deduce the evolution of landside mobility for the Rome–Fiumicino airport. The context is peculiar due to the different distribution of vehicle clusters (private vehicles, taxis, chauffeurs, buses), compared to national data.
Supplemental data are used to support the analysis, which are as follows:
  • Characterization of parking areas (via satellite imaging of public domain).
  • Identification of internal collective transport lines (shuttles).
  • Identification of public transport line.
  • Data on stops in 2019 (duration, number of vehicles, and registration plates).
  • Hourly detection of private traffic flows.
The main steps of the methodology are as follows:
  • Analysis of the consistency of parking areas (via identification of areas from satellite imaging and allocation to cluster of users) to allocate charging points.
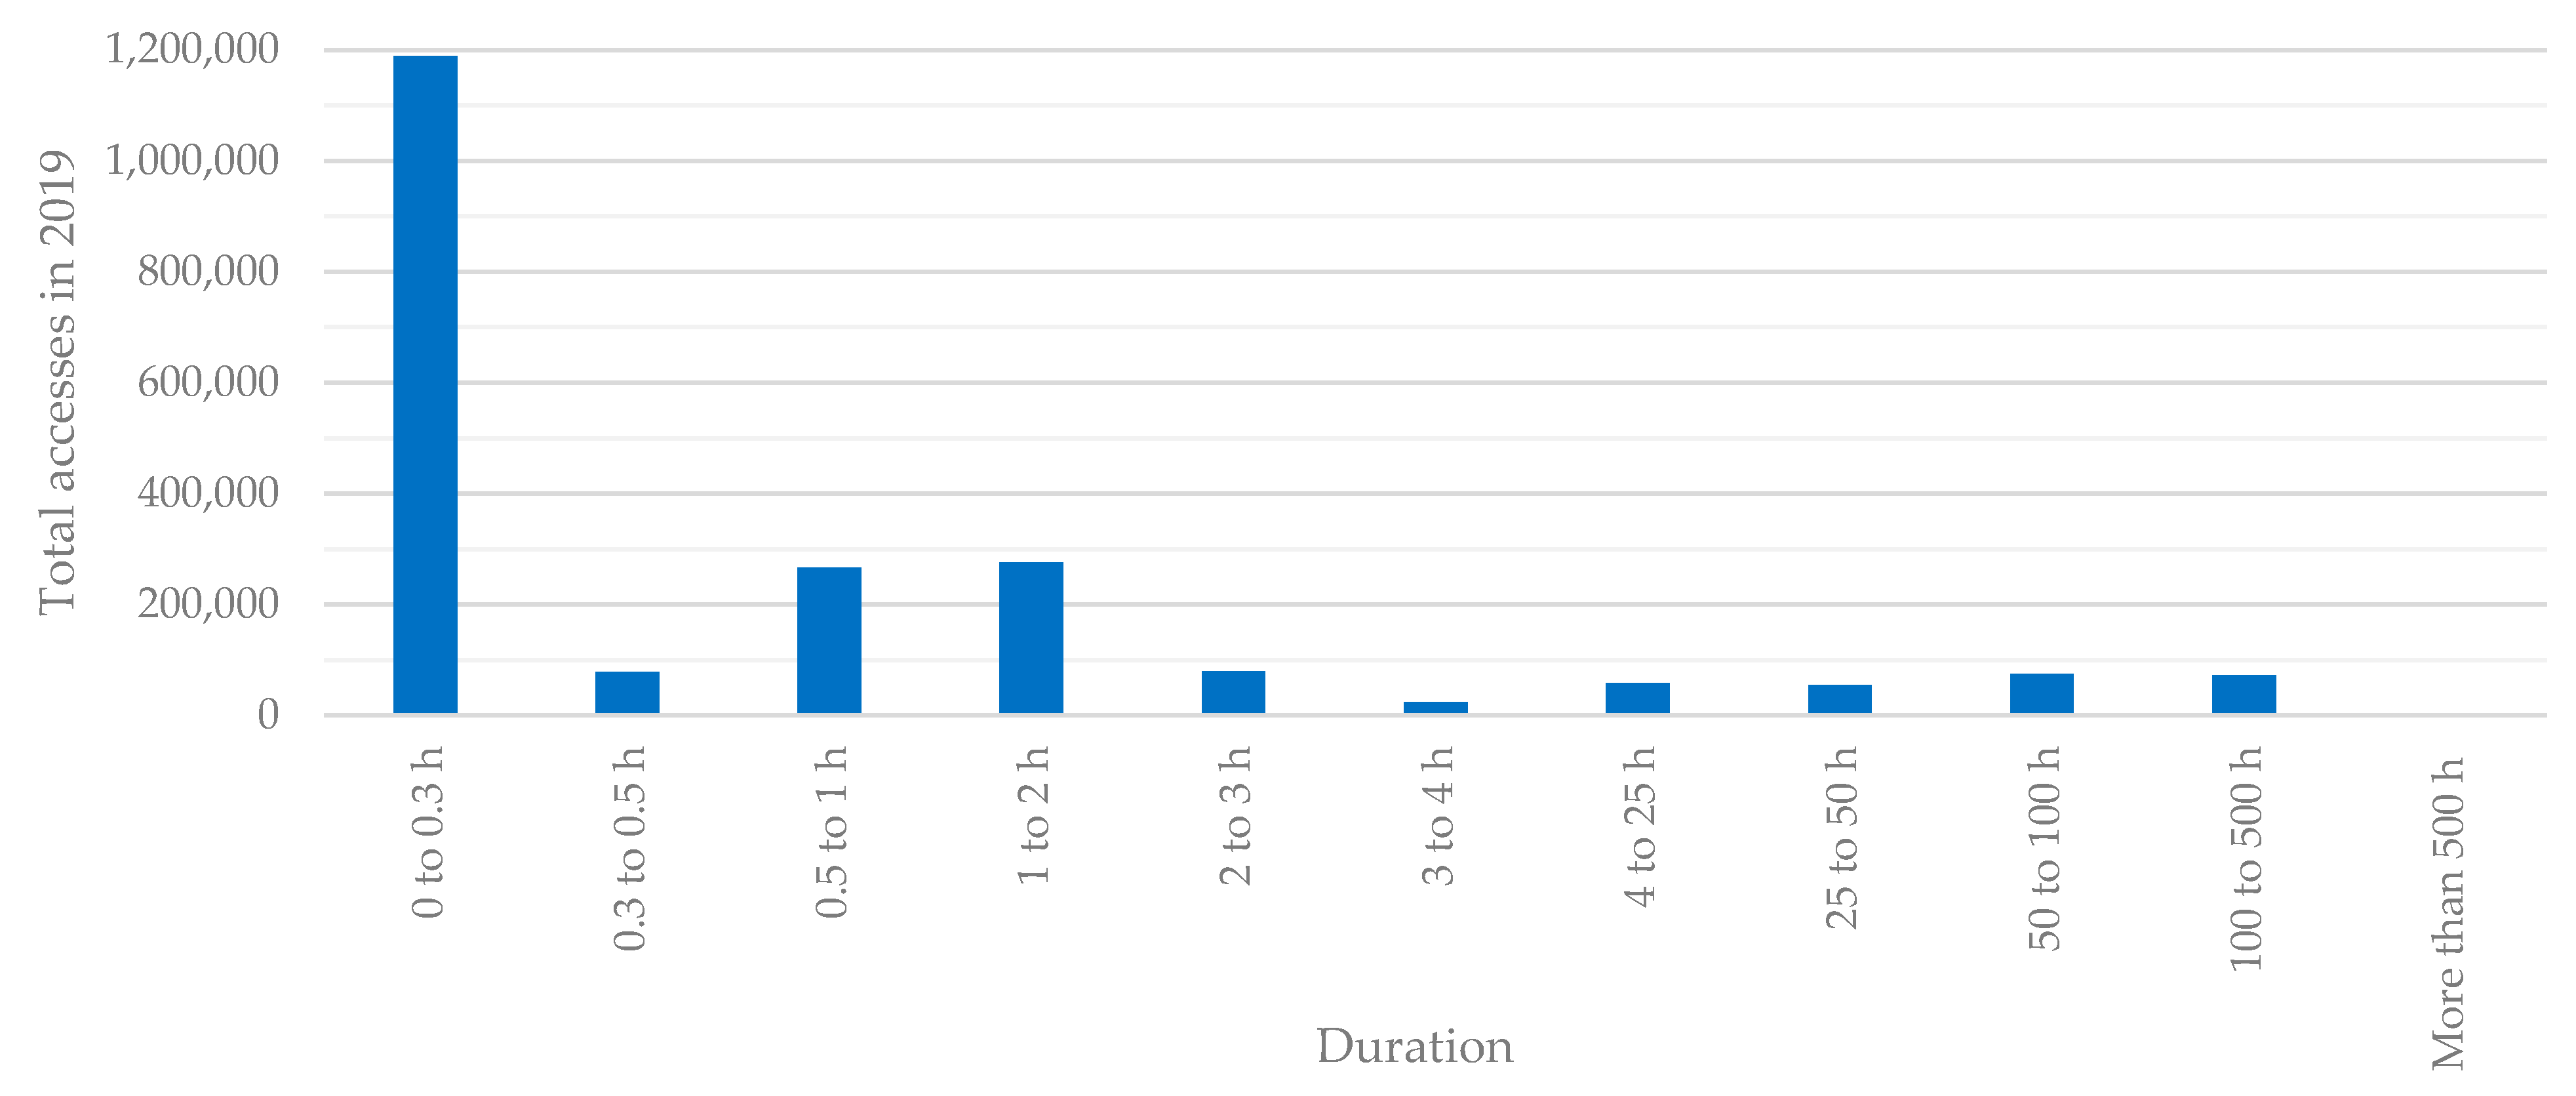
  • Analysis of the duration of stops (from data provided by ADR) to allocate type of charging points (slow/fast charging).
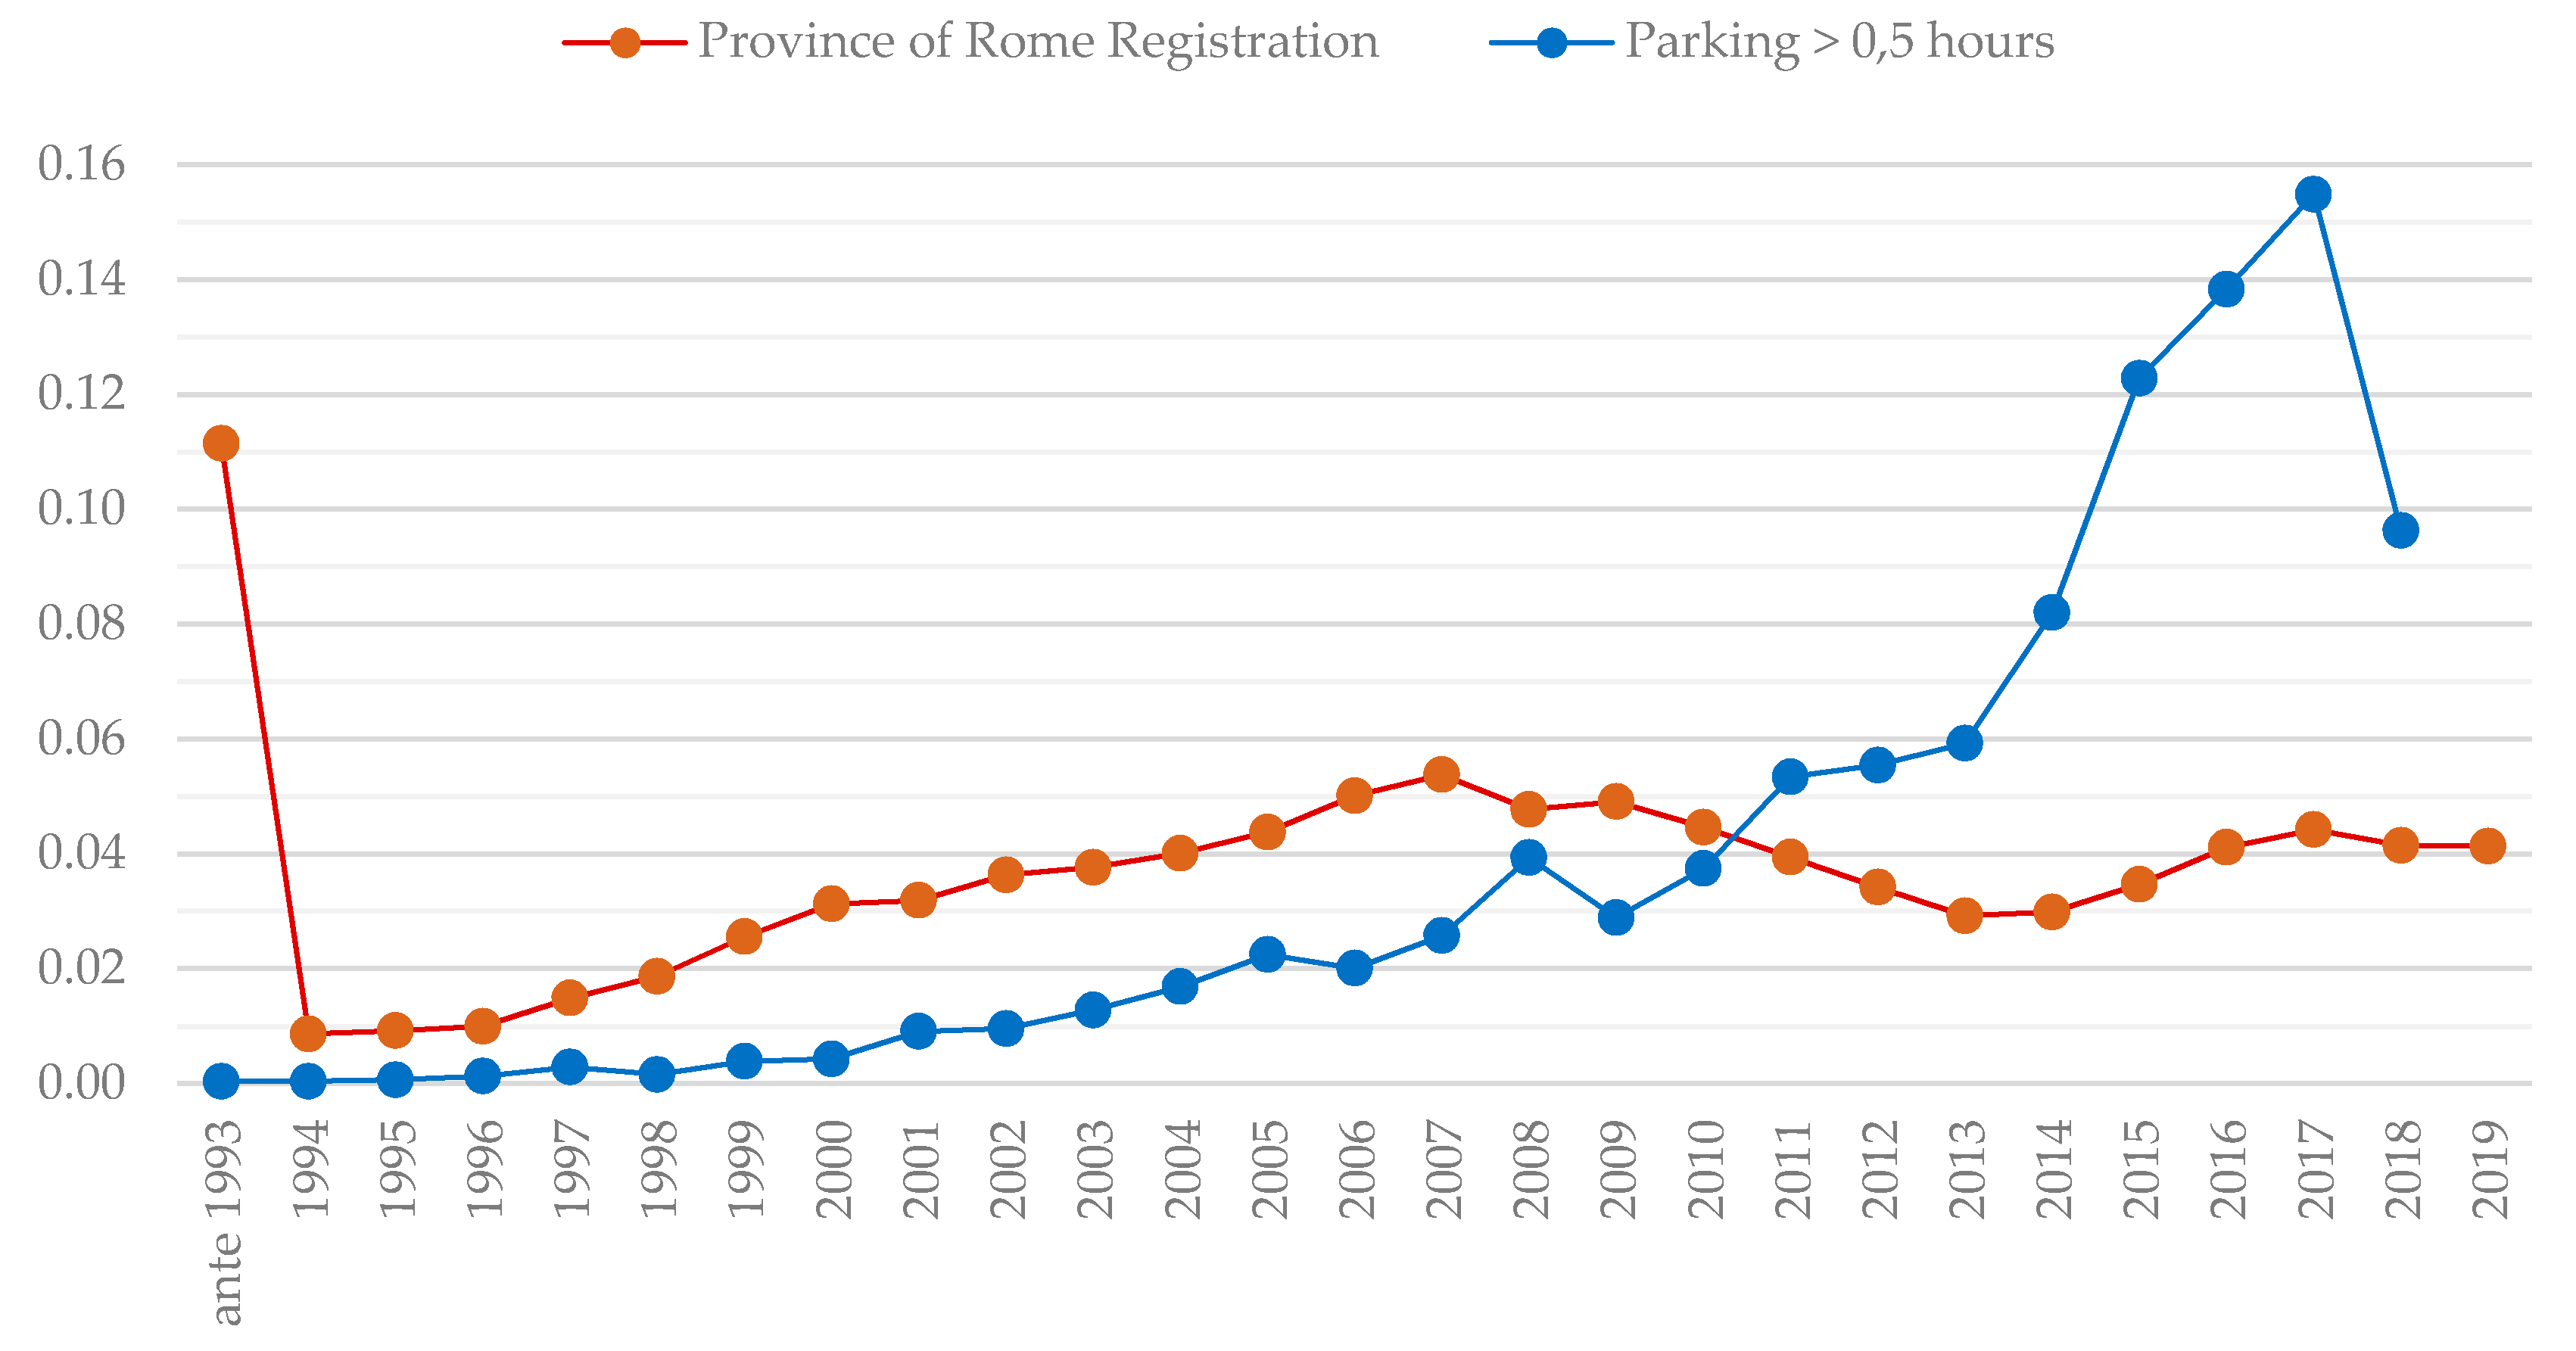
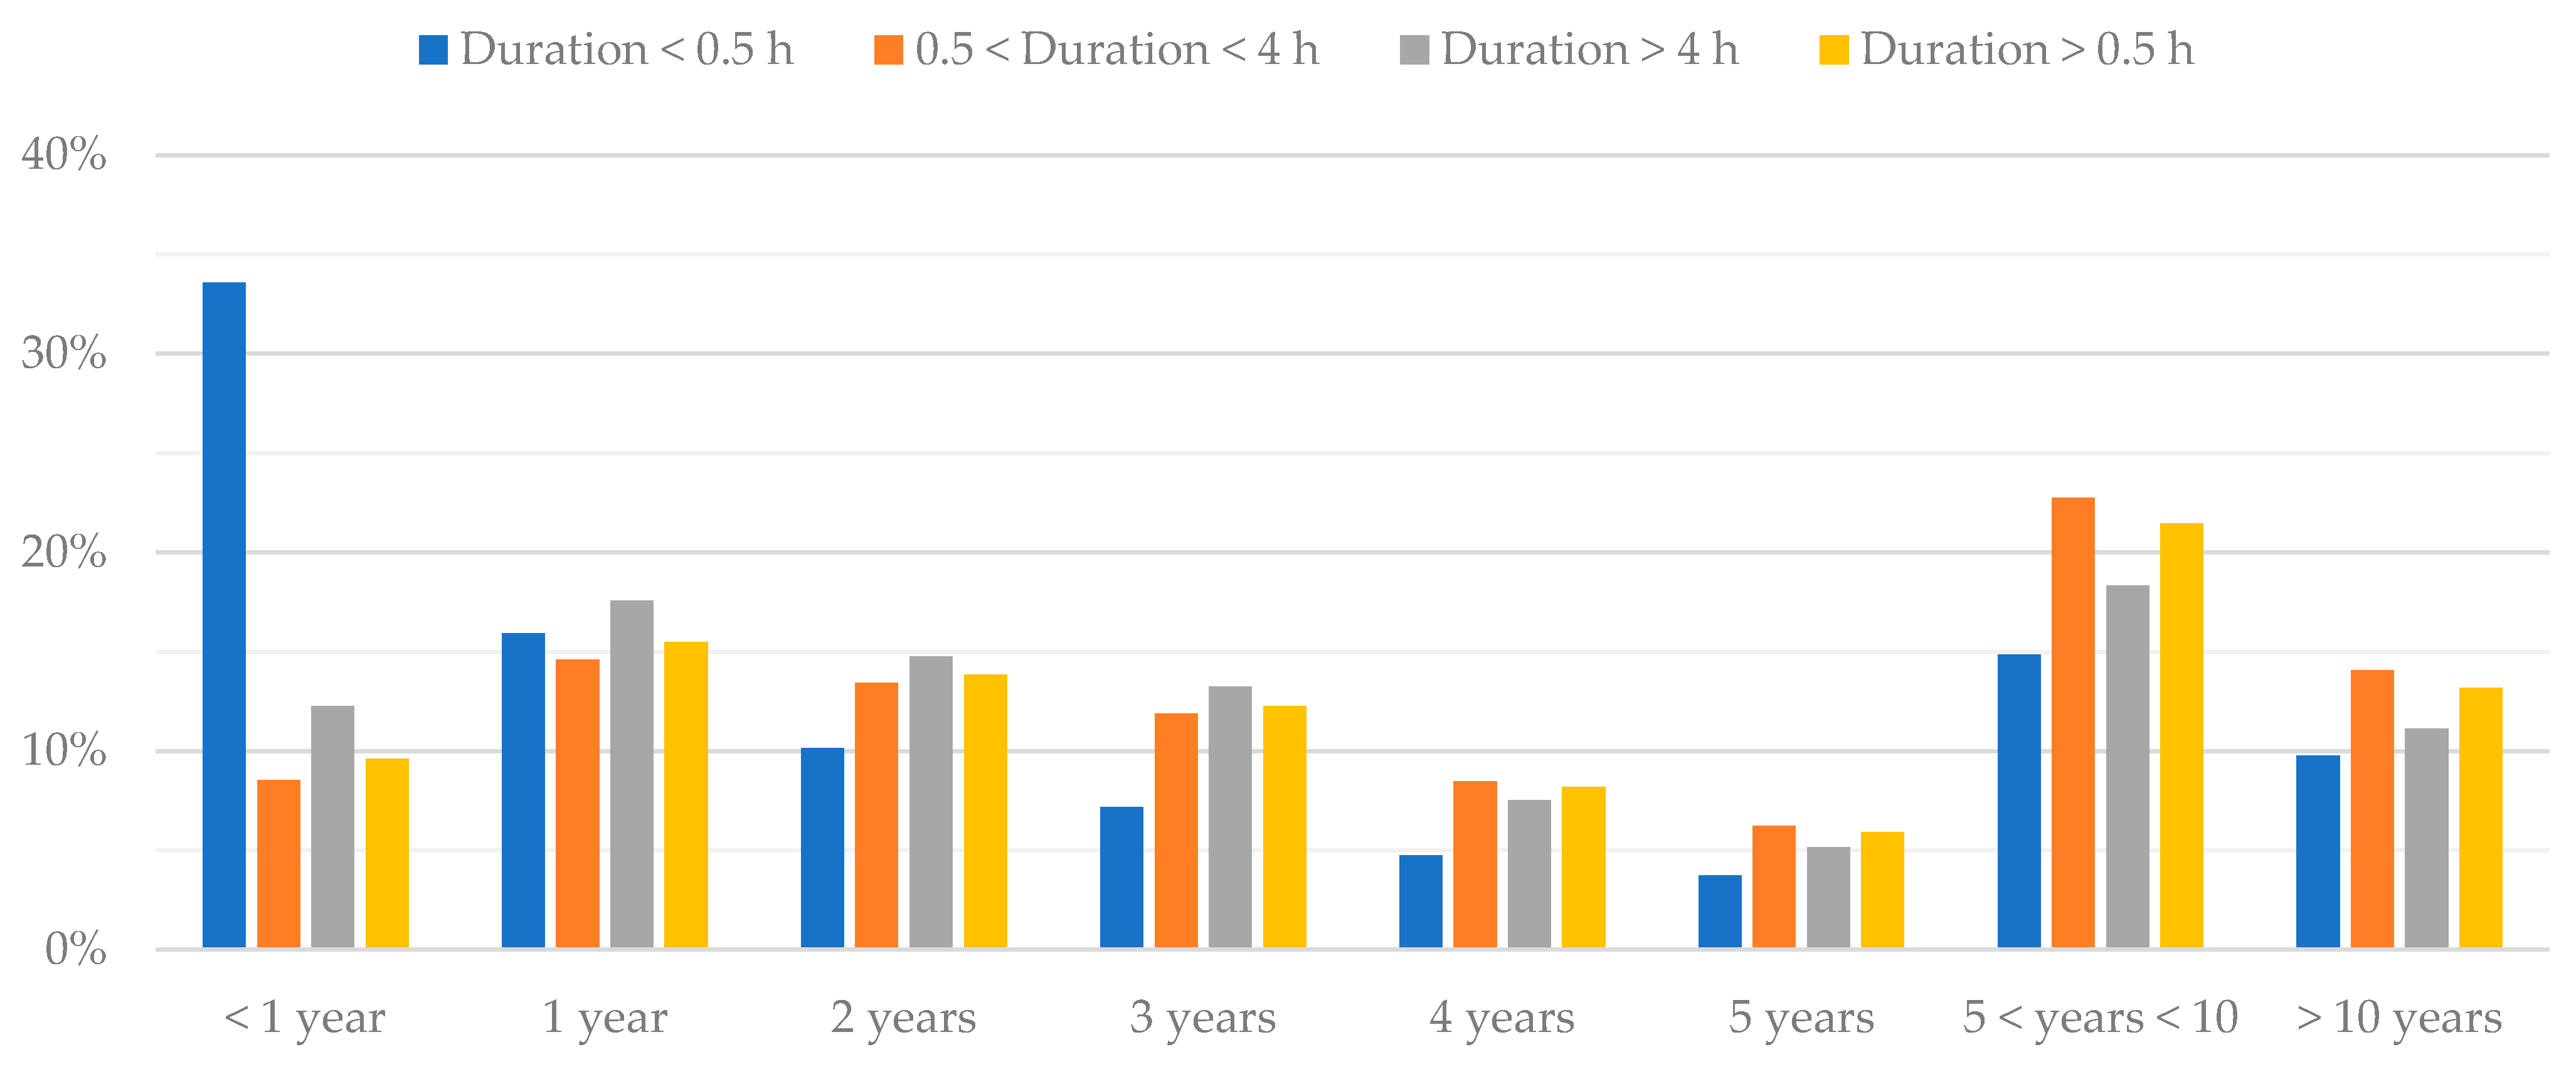
  • Analysis of vehicle age distribution (from license plate data provided by ADR) to estimate the renewal rate by cluster and the consequent EV penetration.
  • Estimation of EV access number by cluster; obtained by combining the age distribution profiles with the sales forecasts derived from the analysis of the scenarios.
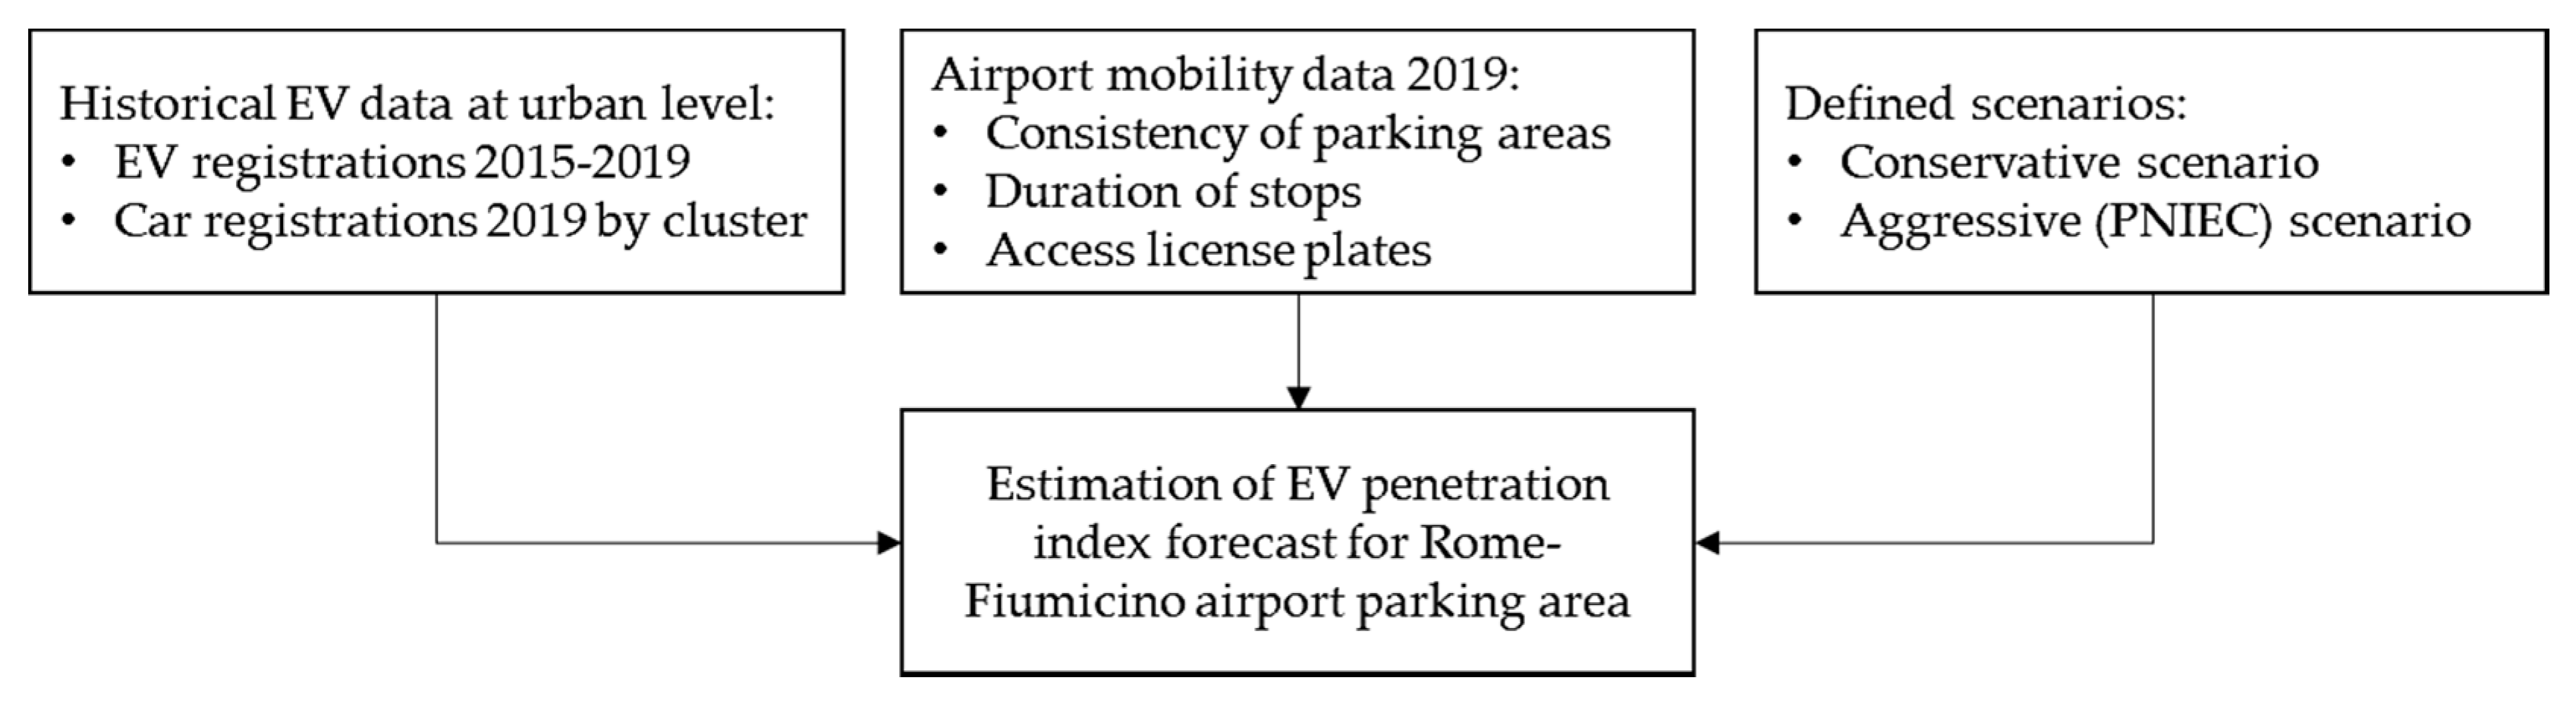
  • A block diagram summarizing the main steps of the methodology is shown in Figure 10.
Access data on license plates and duration of stops are provided by AdR Mobility [55] for multistory and long-stop car parks, while data on car parks for employees are not available. Data include license plate, duration of stop, and date and time of entry and exit.
Only the first two letters of license plates (in the Italian format AA 000 AA) were acquired for the sake of privacy. Registration date was then estimated via linear interpolation on registration of license plates. Results show a concentration of stops shorter than 30 min for cars newer than one year, which is ascribed to rental cars crossing the multistory parking: to filter data, only stops longer than 30 min are considered.
Combining the age distribution profiles and EV sales forecast for the two reference scenarios, the percent of EV accessing airport car parks in the time horizon can be estimated, as follows:
P = i = 1 n p i   q i
where pi is the number of EVs registered in the year I, qi is the number of vehicles, registered in the year i, in the car parks; and n is the time horizon, chosen as 10 years. A similar forecast is performed for other clusters (chauffeurs, taxis, and rental cars), assuming:
  • An expected life of 5 years for taxi cars.
  • An expected life of 2.5 years for a rental car.
  • The same age profile for airport operators’ vehicles as those of passengers.
  • Saturation of the logistic curve 5 years forward for taxis and chauffeurs compared to private cars.

4.2. Results

Parking areas can be divided by type of users (employees or passengers) or by duration (long or short stop). Passenger parking areas are the multistory car parks (A to D), the long-stay car park, and the kiss-and-go car park. Other parking areas are the chauffeur buffer, the taxi buffer, the bus buffer, the car park for employees, and the car park for rental cars. The distribution of parking areas by type is reported in Figure 11.
Figure 12 reports the distribution of stop durations. The data show about 2.2 million stops in 2019, resulting in a total duration of about 23 million hours. The number of very short stops is due to rental cars and kiss-and-go stops.
Vehicle age distributions for the airport and the province of Rome are compared in Figure 13. The difference is due to two causes:
  • Vehicles accessing airport car parks (particularly the multistory car park) are often company cars, which are usually replaced more frequently than private cars.
  • Old cars travel fewer kilometers per year, while users travelling more are forced to replace cars frequently due to wear, thus newer cars are likely to be a significant part of airport car park use.
The comparison shows that the age profile of car stock differs from that of vehicles accessing the airport. Thus, a preliminary sizing of charging infrastructure cannot be carried out simply based on car fleet data, but the specific context must be considered.
Figure 14 reports the distribution of stop durations by vehicle age.
The EV penetration forecast is reported for private cars (Figure 15), taxis and chauffeurs (Figure 16), and rental cars (Figure 17).

5. Preliminary Sizing of Charging Infrastructure

The total number of charging stations can be calculated according to the following Equation:
N C S = N P S p × f E V × f U T   P a r k × f U t C h S t
where N P S p is the total vehicle capacity of the parking area, f E V is the percentage of BEV and PHEV vehicles out of the total number of vehicles, f U T   P a r k . is the ratio between the recorded or estimated maximum occupancy of the parking and its total vehicle capacity (in a preliminary analysis this can be considered 1), and f U t C h S t . is the share of EVs that actually use the charging infrastructure. Evaluating the last is more complex, since there are no data on typical EV owner charging behavior in airport parking yet. The best approach, in this case, is to start with a conservative value of 1 and perform periodic evaluations of the parameter once the infrastructure deployment starts and real data become available. Given the predicted steep rise in the number of EVs, even a significant oversizing of the initial deployment can be easily compensated by slightly delaying the following phases of infrastructure deployment.
For passenger vehicles, it is also possible to differentiate between fast and slow charging station. The proposed method is to use the data of parking area usage by class of park duration; for this purpose, only two clusters are relevant, that of parking lasting less than two hours and that of parking lasting more. The analysis of data allows obtaining the share of total parking spot usage by duration, reported in Table 3.
Combining this data with the prospected share of BEVs and PHEVs, the total share of fast charging stations can be calculated as:
S F a s t C h a r g e = B E V % × S P %
where B E V % is the share of BEVs, and S P % is the share of total parking spot usage by vehicles parking less than 2 h. The main assumptions are that no PHEV uses fast charging stations and that only BEVs parking for less than 2 h are potential users of fast charging stations (P > 22 kW). It is also assumed that parking spaces reserved for long stays will only have slow charging stations. The results in terms of EV charging stations number forecasting are summarized in Table 4.
Evaluating the impact on the airport power systems and the need for upgrading of the present electrical infrastructure are the subjects of ongoing research.
Concerning free shuttles for passengers and employees, the present electrification plan already envisages the implementation of 10 charging stations, 88 kW each, with total power of 880 kW, assuming unitary simultaneity factor.
Finally, some considerations can also be made regarding the airside mobility. The starting hypothesis is that a complete conversion of the existing fleet from combustion engines to EVs is scheduled in the airport mobility plan. The airside fleet includes the vehicles whose features are summarized in Table 5.
Obviously, the contemporaneity in charging of all the airside vehicles cannot be high, and it will be contained with suitable planning of the recharging times. Assuming a contemporaneity of 50%, the expected committed power is approximately 20 MW.

6. Conclusions

The electrification of the automotive industry is ongoing, as a means to reduce environmental impact of transports. With airports serving as major transportation hubs, operators are interested in forecasting the demand for electrical mobility associated with airport operation, to be prepared for the adaptation of the infrastructure.
In this work, the authors propose a methodology for estimating the evolution of the demand for electric mobility in an international airport (Rome–Fiumicino, Italy) in the near future, and discuss the consequent demand for charging infrastructure. First, a wide review of proposed scenarios on the penetration of EVs at international and national level and available data on local automotive transport was presented as a preliminary study for the definition of reference scenarios for the local context. Then, the methodology proposed was presented and applied to the specific case study. Finally, a preliminary sizing of the required charging infrastructure was reported.
The main results obtained can be so summarized:
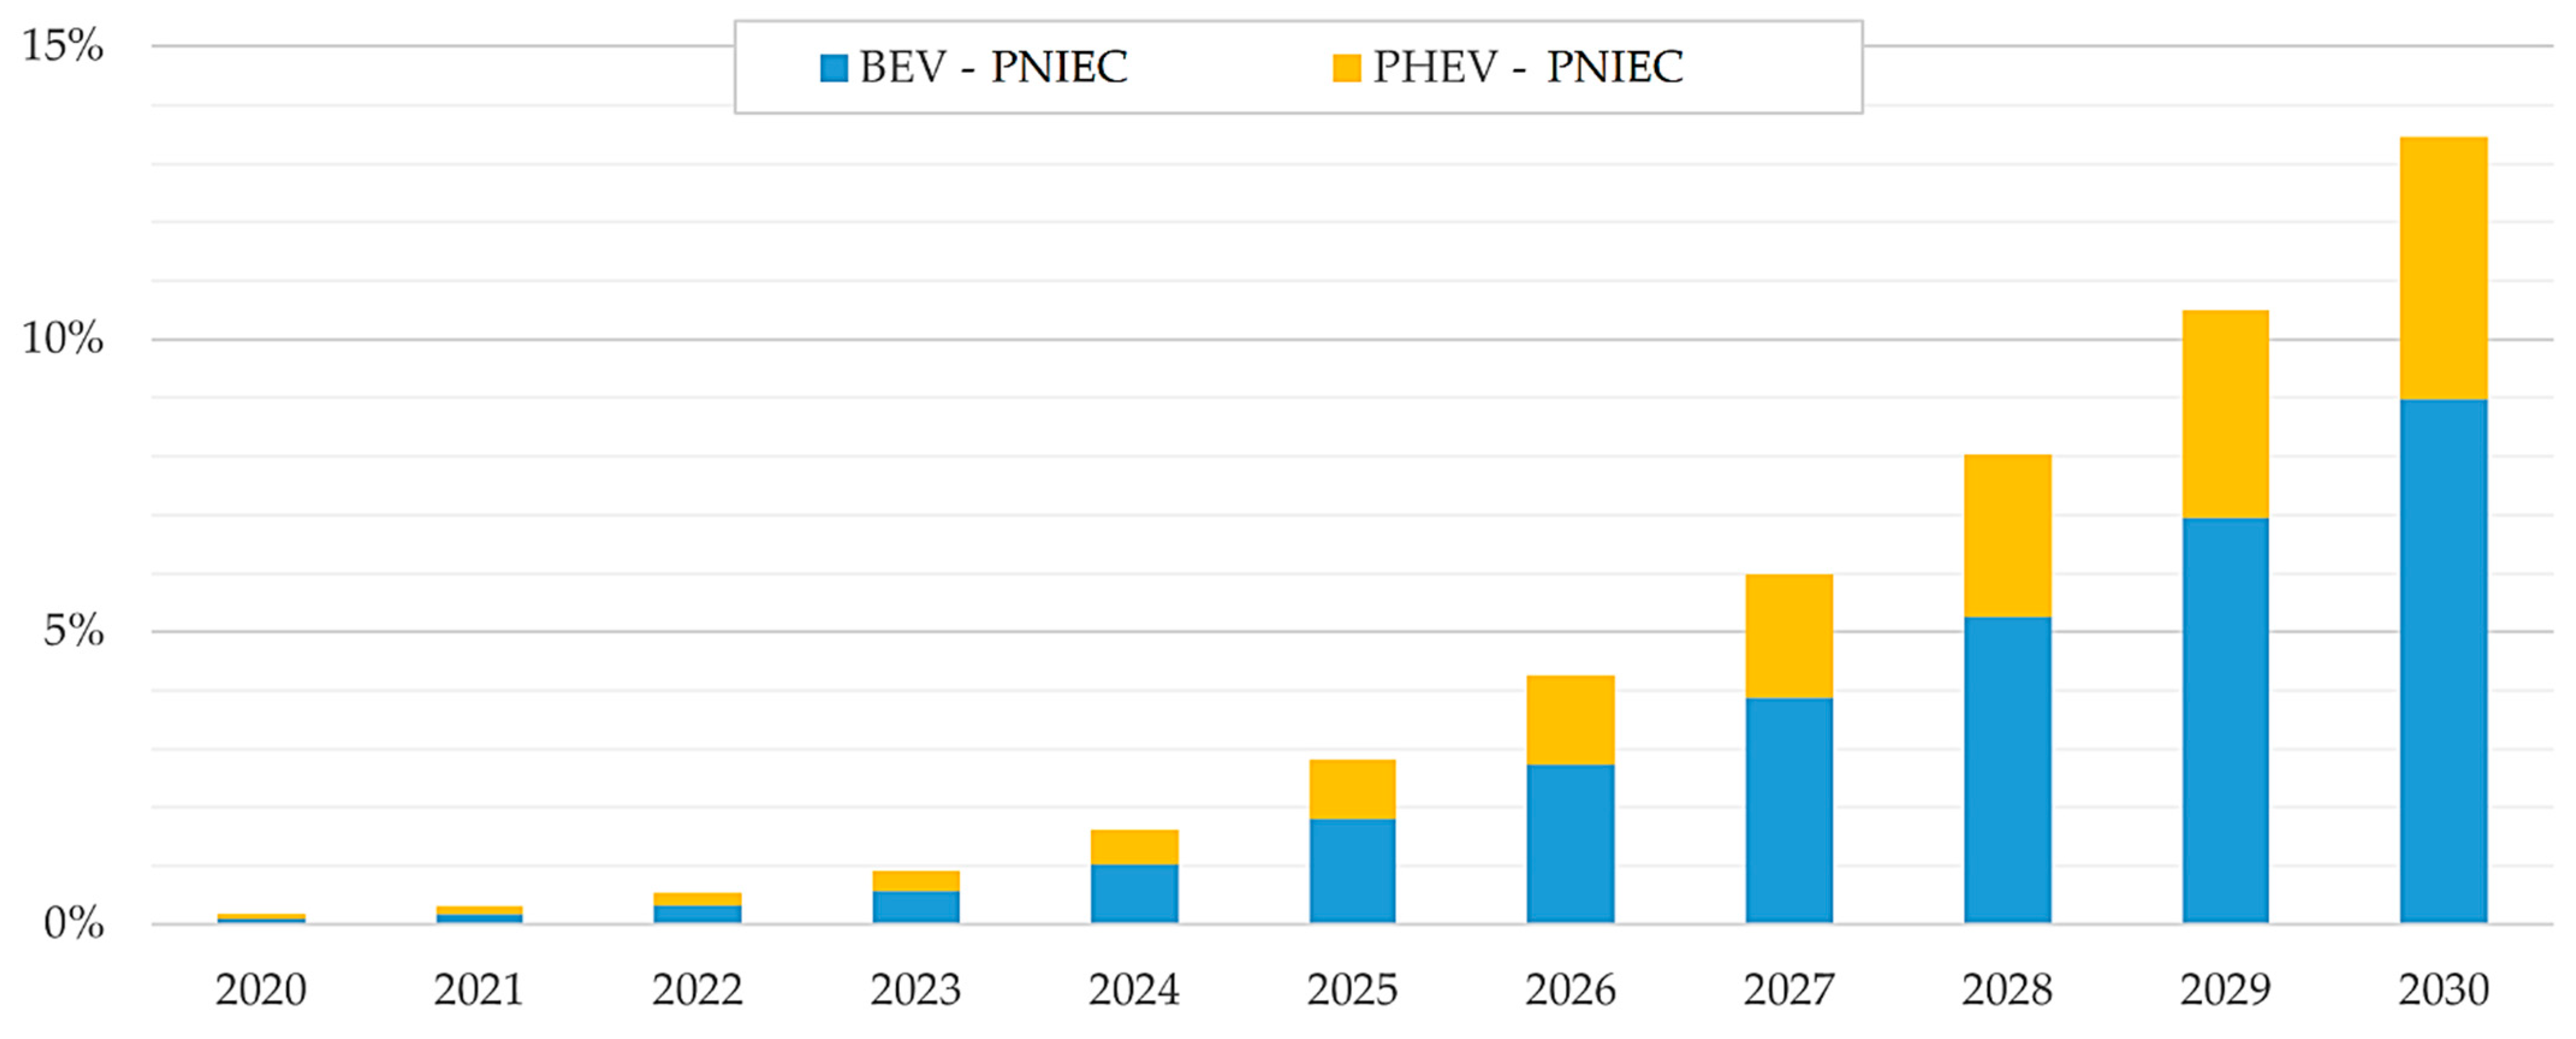
  • The estimated share of EVs accessing Fiumicino airport parks in 2025 is between 3% and 7%.
  • The estimated share of EVs accessing Fiumicino airport car parks in 2030 is between 10% and 35%.
  • The charging points potentially necessary to serve the share of EVs (private cars, taxis, NCC) affluent to the Fiumicino airport parks are 550–1100 in 2025 and 2300–7000 in 2030.
  • The total power of recharging points relating to shuttles, buses, and TPL is estimated to be equal to 4.5 MW.
  • The total power for airside vehicle recharging is estimated to be equal to 20 MW with contemporaneity assumed at 50%.
The study was based on data prior to the COVID-19 pandemic; a delay in the actual achievement of the identified scenarios is possible.
The main qualitative conclusion is that a significant impact on the airport electricity network can be foreseen, and it requires proper planning of adaptation/upgrading actions. In addition, a smart charging system can be suggested for optimizing the management of the charging and reducing the impact on the electrical infrastructure.
The proposed approach can be considered as a reference for similar studies on electrical mobility in other airport areas around the world.

Author Contributions

Conceptualization, P.C., V.C., M.C.F. and F.S.; methodology, R.A.A. and M.M.; validation, P.C., V.C., M.C.F. and F.S.; formal analysis, R.A.A., M.C.F., M.M. and F.S.; investigation, R.A.A., S.B., J.L. and M.M.; resources, R.A.A., M.M., P.C. and V.C.; data curation, R.A.A., S.B., J.L. and M.M.; writing—original draft preparation, R.A.A., S.B., J.L. and M.M.; writing—review and editing, M.C.F. and F.S.; visualization, J.L.; supervision, P.C., V.C., M.C.F. and F.S.; project administration, P.C., V.C., M.C.F. and F.S. All authors have read and agreed to the published version of the manuscript.

Funding

This research received no external funding.

Institutional Review Board Statement

Not applicable.

Informed Consent Statement

Not applicable.

Conflicts of Interest

The authors declare no conflict of interest.

References

  1. Uherek, E.; Halenka, T.; Borken-Kleefeld, J.; Balkanski, Y.; Berntsen, T.; Borrego, C.; Gauss, M.; Hoor, P.; Juda-Rezler, K.; Lelieveld, J.; et al. Transport impacts on atmosphere and climate: Land transport. Atmos. Environ. 2010, 44, 4772–4816. [Google Scholar] [CrossRef]
  2. González Palencia, J.C.; Nguyen, V.T.; Araki, M.; Shiga, S. The Role of Powertrain Electrification in Achieving Deep Decarbonization in Road Freight Transport. Energies 2020, 13, 2459. [Google Scholar] [CrossRef]
  3. González Palencia, J.C.; Araki, M.; Shiga, S. Energy consumption and CO2 emissions reduction potential of electric-drive vehicle diffusion in a road freight vehicle fleet. Energy Procedia 2017, 142, 2936–2941. [Google Scholar] [CrossRef]
  4. Ortmeyer, T.H.; Pillay, P. Trends in transportation sector technology energy use and greenhouse gas emissions. Proc. IEEE 2001, 89, 1837–1847. [Google Scholar] [CrossRef]
  5. Harvey, L. Global climate-oriented transportation scenarios. Energy Policy 2013, 54, 87–103. [Google Scholar] [CrossRef]
  6. Yuan, X.; Li, X. Mapping the technology diffusion of battery electric vehicle based on patent analysis: A perspective of global innovation systems. Energy 2021, 222, 119897. [Google Scholar] [CrossRef]
  7. Jorgensen, K. Technologies for electric, hybrid and hydrogen vehicles: Electricity from renewable energy sources in transport. Util. Policy 2008, 16, 72–79. [Google Scholar] [CrossRef]
  8. Sanguesa, J.A.; Torres-Sanz, V.; Garrido, P.; Martinez, F.J.; Marquez-Barja, J.M. A Review on Electric Vehicles: Technologies and Challenges. Smart Cities 2021, 4, 372–404. [Google Scholar] [CrossRef]
  9. Herrmann, F.; Rothfuss, F. 1—Introduction to hybrid electric vehicles, battery electric vehicles, and off-road electric vehicles. In Advances in Battery Technologies for Electric Vehicles; Scrosati, B., Garche, J., Tillmetz, W., Eds.; Woodhead Publishing: Sawston, UK, 2015; pp. 3–16. [Google Scholar] [CrossRef]
  10. Dulău, L.I.; Bică, D. Effects of Electric Vehicles on Power Networks. Procedia Manuf. 2020, 46, 370–377. [Google Scholar] [CrossRef]
  11. Richard; Yurnaidi, Z. Potential Impacts of EV on Developing Countries’ Electricity Systems. Available online: https://accept.aseanenergy.org/potential-impacts-of-ev-on-developing-countries-electricity-systems-and-how-to-mitigate-them/ (accessed on 17 August 2021).
  12. Sitohang, J.; Zulfikar, Y. A New Beginning for Electric Vehicle, and How Southeast Asia Could Jump in and Ride the Wave of Electric Vehicle. Available online: https://accept.aseanenergy.org/a-new-beginning-for-electric-vehicle/ (accessed on 17 August 2021).
  13. Chen, Y.; Dou, A.; Zhang, Y. A Review of Recycling Status of Decommissioned Lithium Batteries. Front. Mater. 2021, 8, 12. [Google Scholar] [CrossRef]
  14. Plötz, P.; Gnann, T.; Wietschel, M. Modelling market diffusion of electric vehicles with real world driving data—Part I: Model structure and validation. Ecol. Econ. 2014, 107, 411–421. [Google Scholar] [CrossRef] [Green Version]
  15. IEA. Global EV Outlook 2021; IEA, 2021; Available online: https://www.iea.org/reports/global-ev-outlook-2020 (accessed on 17 August 2021).
  16. Wesseling, J.H.; Faber, J.; Hekkert, M.P. How competitive forces sustain electric vehicle development. Technol. Forecast. Soc. Chang. 2014, 81, 154–164. [Google Scholar] [CrossRef] [Green Version]
  17. Gnann, T.; Stephens, T.S.; Lin, Z.; Plötz, P.; Liu, C.; Brokate, J. What drives the market for plug-in electric vehicles?—A review of international PEV market diffusion models. Renew. Sustain. Energy Rev. 2018, 93, 158–164. [Google Scholar] [CrossRef]
  18. Osieczko, K.; Zimon, D.; Płaczek, E.; Prokopiuk, I. Factors that influence the expansion of electric delivery vehicles and trucks in EU countries. J. Environ. Manag. 2021, 296, 113177. [Google Scholar] [CrossRef]
  19. Gelmanova, Z.S.; Zhabalova, G.G.; Sivyakova, G.A.; Lelikova, O.N.; Onishchenko, O.N.; Smailova, A.A.; Kamarova, S.N. Electric cars. Advantages and disadvantages. J. Phys. Conf. Ser. 2018, 1015, 052029. [Google Scholar] [CrossRef] [Green Version]
  20. Kong, D.; Xia, Q.; Xue, Y.; Zhao, X. Effects of multi policies on electric vehicle diffusion under subsidy policy abolishment in China: A multi-actor perspective. Appl. Energy 2020, 266, 114887. [Google Scholar] [CrossRef]
  21. Trencher, G. Strategies to accelerate the production and diffusion of fuel cell electric vehicles: Experiences from California. Energy Rep. 2020, 6, 2503–2519. [Google Scholar] [CrossRef]
  22. Villa, D.; Montoya, A. A taxonomy of energy consumption models for electric vehicles. In Proceedings of the MOVICI-MOYCOT 2018: Joint Conference for Urban Mobility in the Smart City, Medellin, Colombia, 18–20 April 2018; pp. 1–7. [Google Scholar]
  23. Franzò, S.; Nasca, A. The environmental impact of electric vehicles: A novel life cycle-based evaluation framework and its applications to multi-country scenarios. J. Clean. Prod. 2021, 315, 128005. [Google Scholar] [CrossRef]
  24. Fan, V.H.; Meng, K.; Dong, Z. Integration of Electric Vehicle Load and Charging Infrastructure in Distribution Network. In Proceedings of the 2021 IEEE Transportation Electrification Conference & Expo (ITEC), Chicago, IL, USA, 21–25 June 2021; pp. 1–6. [Google Scholar]
  25. Manganelli, M.; Undre, V.; Soldati, A. Optimal Control of Domestic Storage via MPC: The Impact of the Prediction of User Habits, including Power Market and Battery Degradation. In Proceedings of the 2020 2nd IEEE International Conference on Industrial Electronics for Sustainable Energy Systems (IESES), Cagliari, Italy, 1–3 September 2020; pp. 67–72. [Google Scholar]
  26. Mwasilu, F.; Justo, J.J.; Kim, E.-K.; Do, T.D.; Jung, J.-W. Electric vehicles and smart grid interaction: A review on vehicle to grid and renewable energy sources integration. Renew. Sustain. Energy Rev. 2014, 34, 501–516. [Google Scholar] [CrossRef]
  27. Cochi, S.; Falvo, M.C.; Manganelli, M.; Caneponi, G.; Cazzato, F.; Clerico, M.D. Active distribution grids and EV charging stations: A centralized approach for their integration. In Proceedings of the 2018 7th International Conference on Renewable Energy Research and Applications (ICRERA), Paris, France, 14–17 October 2018; pp. 1466–1471. [Google Scholar]
  28. Richardson, D.B. Electric vehicles and the electric grid: A review of modeling approaches, Impacts, and renewable energy integration. Renew. Sustain. Energy Rev. 2013, 19, 247–254. [Google Scholar] [CrossRef]
  29. Liu, X.; Bie, Z. Optimal Allocation Planning for Public EV Charging Station Considering AC and DC Integrated Chargers. Energy Procedia 2019, 159, 382–387. [Google Scholar] [CrossRef]
  30. Liu, J.-P.; Zhang, T.-X.; Zhu, J.; Ma, T.-N. Allocation optimization of electric vehicle charging station (EVCS) considering with charging satisfaction and distributed renewables integration. Energy 2018, 164, 560–574. [Google Scholar] [CrossRef]
  31. Pal, A.; Bhattacharya, A.; Chakraborty, A.K. Allocation of electric vehicle charging station considering uncertainties. Sustain. Energy Grids Netw. 2021, 25, 100422. [Google Scholar] [CrossRef]
  32. Ajanovic, A.; Siebenhofer, M.; Haas, R. Electric Mobility in Cities: The Case of Vienna. Energies 2021, 14, 217. [Google Scholar] [CrossRef]
  33. Ruggieri, R.; Ruggeri, M.; Vinci, G.; Poponi, S. Electric Mobility in a Smart City: European Overview. Energies 2021, 14, 315. [Google Scholar] [CrossRef]
  34. Triebke, H.; Siehler, E.; Staebler, E. Forecast Model for Electromobile Loads at Stuttgart Airport and Fair. Available online: http://publica.fraunhofer.de/eprints/urn_nbn_de_0011-n-4802121.pdf (accessed on 17 August 2021).
  35. Xiang, Y.; Cai, H.; Liu, J.; Zhang, X. Techno-economic design of energy systems for airport electrification: A hydrogen-solar-storage integrated microgrid solution. Appl. Energy 2021, 283, 116374. [Google Scholar] [CrossRef]
  36. Silvester, S.; Beella, S.K.; van Timmeren, A.; Bauer, P.; Quist, J.; van Dijk, S. Exploring design scenarios for large-scale implementation of electric vehicles; the Amsterdam Airport Schiphol case. J. Clean. Prod. 2013, 48, 211–219. [Google Scholar] [CrossRef]
  37. Cardona, E.; Sannino, P.; Piacentino, A.; Cardona, F. Energy saving in airports by trigeneration. Part II: Short and long term planning for the Malpensa 2000 CHCP plant. Appl. Therm. Eng. 2006, 26, 1437–1447. [Google Scholar] [CrossRef]
  38. Cardona, E.; Piacentino, A.; Cardona, F. Energy saving in airports by trigeneration. Part I: Assessing economic and technical potential. Appl. Therm. Eng. 2006, 26, 1427–1436. [Google Scholar] [CrossRef]
  39. Zhang, Y.; Si, P.; Feng, Y.; Rong, X.; Wang, X.; Zhang, Y. Operation strategy optimization of BCHP system with thermal energy storage: A case study for airport terminal in Qingdao, China. Energy Build. 2017, 154, 465–478. [Google Scholar] [CrossRef]
  40. Vosper, P. Airports to be the Next Wave of EV Charging Stations. Available online: https://www.green-technology.org/wp-content/uploads/2020/11/Juicebar-ReprintParkingTodayOctober2020-1.pdf (accessed on 17 August 2021).
  41. Stuttgart Airport. EV Charging Stations. Available online: https://www.stuttgart-airport.com/getting-here/ev-charging-stations/ (accessed on 17 August 2021).
  42. Airport, L.L. Electric Vehicle Charging Points at London Luton Aiport. Available online: https://www.london-luton.co.uk/parking/electric-vehicle-charging (accessed on 17 August 2021).
  43. Toronto Pearson. Electric Vehicle Charging Stations. Available online: https://www.torontopearson.com/en/transportation-and-parking/ev-charging-stations (accessed on 17 August 2021).
  44. Nigro, M.; Ferrara, M.; De Vincentis, R.; Liberto, C.; Valenti, G. Data Driven Approaches for Sustainable Development of E-Mobility in Urban Areas. Energies 2021, 14, 3949. [Google Scholar] [CrossRef]
  45. Wikipedia—List of the Busiest Airports in Europe. Available online: https://en.wikipedia.org/wiki/List_of_the_busiest_airports_in_Europe (accessed on 4 January 2021).
  46. Assaeroporti. Statistiche Dati di Traffico Aeroportuale Italiano. Available online: https://assaeroporti.com/statistiche/ (accessed on 4 January 2021).
  47. Italian Civil Aviation Authority. Rome-Fiumicino Master Plan; ENAC: Toulouse France, 2016. [Google Scholar]
  48. Mosquet, X.; Dinger, A.; Xu, G.; Andersen, M.; Tominaga, K.; Zablit, H. The Electric Car Tipping Point; Boston Consulting Group: Boston, MA, USA, 2018. [Google Scholar]
  49. BloombergNef. BNEF EVO Report 2020; BloombergNEF: London, UK, 2021. [Google Scholar]
  50. IEA. Global EV Outlook 2019; IEA, 2019; Available online: https://www.iea.org/reports/global-ev-outlook-2019 (accessed on 17 August 2021).
  51. Cambridge Econometrics. Low-Carbon Cars in Europe: A Socio-Economic Assessment; Cambridge Econometrics: Cambridge, UK, 2018. [Google Scholar]
  52. Bannon, E. Electric Surge: Carmakers’ Electric Car Plans across Europe 2019–2025; Transport & Environment: Brussels, Belgium, 2019. [Google Scholar]
  53. Politecnico di Milano. E-MOBILITY REPORT 2018—Le Opportunità e le Sfide per lo Sviluppo della Mobilità Elettrica in Italia; Politecnico di Milano: Milan, Italy, 2018. [Google Scholar]
  54. Italian Ministry of Economic Development; Italian Ministry of the Environment and Protection of Natural Resources and the Sea; Italian Ministry of Infrastructure and Transport. Piano Nazionale Integrato per l’Energia e il Clima 2030; Ministero dello Sviluppo Economico: Rome, Italy, 2019.
  55. AdR Mobility. Available online: https://www.adr.it/adr-mobility (accessed on 1 March 2020).
Figure 1. Share of EVs in car fleet (a) and car sales (b) in Italy 2015–2019. 1 Range extender.
Energies 14 05251 g001
Figure 2. Estimated average BEV and PHEV penetration index on car sales, for 2025 and 2030, at world level, based on different forecasting scenarios.
Energies 14 05251 g002
Figure 3. Estimated average BEV and PHEV penetration index on car sales, for 2025 and 2030, at European level, based on different forecasting scenarios.
Energies 14 05251 g003
Figure 4. Estimated average BEV and PHEV penetration index on car sales, for 2025 and 2030, at Italian level, based on different forecasting scenarios.
Energies 14 05251 g004
Figure 5. Estimated average BEV and PHEV penetration index on car sales from 2020 to 2030 at Italian level (conservative scenario).
Energies 14 05251 g005
Figure 6. Estimated average BEV and PHEV penetration index on car stocks from 2020 to 2030 at Italian level (conservative scenario).
Energies 14 05251 g006
Figure 7. Estimated average BEV and PHEV penetration index on car sales from 2020 to 2030 at Italian level (PNIEC scenario).
Energies 14 05251 g007
Figure 8. Estimated average BEV and PHEV penetration index on car stocks from 2020 to 2030 at Italian level (PNIEC scenario).
Energies 14 05251 g008
Figure 9. Comparison of estimated average penetration index on Italian car sales in 2025 and 2030, for the different scenarios.
Energies 14 05251 g009
Figure 10. Summary of forecast methodology.
Energies 14 05251 g010
Figure 11. Allocation of car park spaces.
Energies 14 05251 g011
Figure 12. Stop duration distribution.
Energies 14 05251 g012
Figure 13. Comparison of vehicle registration distribution (Rome–Fiumicino airport vs. province of Rome).
Energies 14 05251 g013
Figure 14. Distribution of stop duration by vehicle age.
Energies 14 05251 g014
Figure 15. EV penetration index forecast for Rome–Fiumicino airport for private cars.
Energies 14 05251 g015
Figure 16. EVs penetration index forecast for Rome–Fiumicino airport for taxis and chauffeurs.
Energies 14 05251 g016
Figure 17. EV penetration index forecast for Rome–Fiumicino airport for rental cars.
Energies 14 05251 g017
Table 1. Taxonomy of low-emission vehicles (LEVs).
Field of ActionHEVPHEVBEV + RExBEVFCEV
TractionThermal and
electric
Thermal and
electric
ElectricElectricElectric
(battery/fuel cell)
Energy storageBattery and
fuel tank
Battery and
fuel tank
Battery and
small fuel tank
BatteryBattery and
hydrogen tank
Battery chargingBy heat engine
(no plug)
From grid
via plug
By small heat engine
(for charging only)
From grid
via plug
By fuel cell
Table 2. EV advantages and disadvantages in terms of technology, user experience, sustainability, and costs, elaborated from [9].
Field of ActionAdvantageDisadvantage
Powertrain, storageHigh efficiency of powertrain
(~90% vs. ~30% of combustion engines)
Heavy propulsion system
(due to sizable battery, hybrid propulsion)
Battery technologyRechargeabilityLimited life cycle, complex cell technology
Comfort, drivingExcellent acceleration, power transfer
(due to torque characteristic)
Limited range
(due to current low energy density)
Vehicle conceptNew vehicle conceptsHigh design effort
CostsDecreasing life-cycle costs
(due to lower maintenance costs)
High component costs
(due to current battery price)
Ecology, sustainabilityNo local emissionCurrent overall carbon footprint
(due to current energy mix)
Energy storage, chargingIntegration of EVs into smart gridsCurrent limited infrastructure
Table 3. Share of total parking spot usage by duration.
Parking DurationShare of Total Parking Spot Usage *
<2 h2.8%
>2 h97.2%
* Parking spot usage is the product of the number of parking spots and their duration of usage.
Table 4. EV charging stations number forecasting.
ScenarioHorizonParking CategorySlow Charging StationsFast Charging Stations
Conservative Scenario2025Multistorey park35414
Long-stay park2700
2030Multistorey park1.49456
Long-stay park1.1370
PNIEC Scenario2025Multistorey park64526
Long-stay park4920
2030Multistorey park2.939108
Long-stay park2.2350
Table 5. Airside vehicles in Fiumicino airport: main features.
VehiclePower (kW)QuantityCapacity (kWh)Consumption (MWh)
Passenger boarding lift10161528
Drinking water tank truck10131523
Lavatory truck10131523
Shuttle bus1601191203998
Lift truck1071512
Catering10221538
Forklift10131523
Loader755996654
Onboard cleaning10101517
Minibus2529120974
Conveyor belt3310636641
Towable passenger stair1318635990
Transporter334936296
Large tractor103536397
Small tractor68652042785
Total37,44674251,48110,899
Publisher’s Note: MDPI stays neutral with regard to jurisdictional claims in published maps and institutional affiliations.

