Article

Flame Spray Pyrolysis Engineering of Nanosized Mullite-Bi2Fe4O9 and Perovskite-BiFeO3 as Highly Efficient Photocatalysts for O2 Production from H2O Splitting

by
Pavlos Psathas
1,
Maria Solakidou
1,
Asterios Mantzanis
1 and
Yiannis Deligiannakis
1,2,*
1
Laboratory of Physical Chemistry of Materials and Environment, Department of Physics, University of Ioannina, GR45110 Ioannina, Greece
2
Institute of Environment & Sustainable Development, University Research Center of Ioannina (URCI), GR45110 Ioannina, Greece
*
Author to whom correspondence should be addressed.
Energies 2021, 14(17), 5235; https://doi.org/10.3390/en14175235
Submission received: 16 July 2021 / Revised: 9 August 2021 / Accepted: 17 August 2021 / Published: 24 August 2021
(This article belongs to the Special Issue Nanomaterials Catalysis for Hydrogen Production and Water Splitting)

Abstract

:
Bi-Fe oxides are stable materials with potential photocatalytic activity under solar light photons. So far, however the photocatalytic potential of pure-phase nanosized mullite-Bi2Fe4O9 has not been studied. Usually, synthesis of pure-phase nanosized mullite-Bi2Fe4O9 is hampered by co-formation with perovskite BiFeO3. Herein we demonstrate that pure-phase mullite-Bi2Fe4O9 nanoparticles prepared by Flame Spray Pyrolysis (FSP) technology are highly efficient O2 production photocatalysts, achieving >1500 μmol g−1h−1. This outperforms all -so far reported- O2 production Bi-Fe-O photocatalysts. We present an FSP-based process for production of a versatile Bi-Fe-O platform, that can be easily optimized to obtain 100% mullite-Bi2Fe4O9 or 100% perovskite-BiFeO3 or their heterojunctions. The phase-evolution of the Bi-Fe-O materials has been studied by XPS, Raman, and EPR spectroscopies. Short post-FSP annealing process impacts the photoactivity of the BiFeO3 and Bi2Fe4O9 in distinct ways. Fe2+ centers in BiFeO3 can improve dramatically its O2 production efficiency, while solid-melt formation in Bi2Fe4O9 is a limiting factor.

1. Introduction

Exploitation of solar photons via photocatalysis is an established green technology approach [1]. Achievement of efficient photocatalytic oxygen evolution reaction (OER) using H2O as substrate is a challenging task [2,3]. In this context, bismuth-based nano photocatalysts, such as BiVO4 [4,5] and Bi2WO6 [6] have emerged as promising Bi-based materials for OER. Recently, BiFeO3 has been demonstrated as a potent O2 evolving photocatalyst [7,8]. More generally, the perovskite-BiFeO3 phase is renowned for its multiferroic attributes, which possess simultaneously ferroelectric and magnetic order properties [9]. Its small band-gap in the range of 2.1–2.8 eV [10] renders BiFeO3 visible-light active [7,8]. Interestingly, the mullite-phase Bi2Fe4O9 has also a bandgap in the visible photons range of 2.1–2.3 eV [11]. In general, Bi-Fe oxides are stable materials, as exemplified for BiFeO3 under photocatalytic conditions [12]. However, the efficiency of mullite-Bi2Fe4O9 for photocatalytic O2 production from H2O has not been assessed so far.
On the other hand, both BiFeO3 and Bi2Fe4O9 materials have been reported to achieve satisfactory photocatalytic degradation of organic pollutants, such as methylene blue (MB), Rhodamine Blue (RhB) [13,14], and Bisphenol-A [15]. Yang et al. [16] have reported [BiFeO3/Bi2Fe4O9] heterostructures with enhanced RhB photodegradation, which was attributed to the alignment of their conduction and valence bands. Recently, Zhang et al. [17] reported photocatalytic water-splitting by BiFeO3, while Humayun et al. [18] have reported a porous BiFeO3/TiO2 nanohybrid with enhanced H2 production performance.
Recently, we have developed a Flame Spray Pyrolysis (FSP) process for the synthesis of BiFeO3 and Bi2Fe4O9 nanomaterials [19] which could be adjusted to consist of 100% BiFeO3 nanophase or 100% Bi2Fe4O9 as well as the mixed-phase heterojunction BiFeO3: Bi2Fe4O9.
In the present work, the FSP-made Bismuth Iron Oxide (BFO) nanophases were optimized for enhanced photocatalytic O2-evolution from H2O. Our research revealed that post-FSP annealing has a profound impact on the optimal OER-efficiency of the FSP-made BFO nanophases. To understand the underlying mechanisms we have used a combination of XRD, XPS, Raman, and EPR spectroscopies for a comprehensive study of the OER efficiency vs. the lattice and electronic configuration of BFO materials. Our strategy was based on two steps: first, the use of FSP for controllable synthesis of the pure BFO nanophases i.e., 100% BiFeO3 or 100% Bi2Fe4O9 as reported in our recent work [19]. For completeness, a mixed-phase 50/50 BiFeO3/Bi2Fe4O9 was also prepared. Second, each BFO nanophase was annealed under O2-atmosphere for various short-periods and temperatures. As we show herein, these post-FSP annealing protocols, even for a very short time such as 30-min, impact the photoactivity of the BiFeO3 and Bi2Fe4O9 in distinct ways. Fe2+-centers formed in BiFeO3 can improve dramatically its O2 production efficiency. On the other hand, Bi2Fe4O9 was sensitive to solid-melt formation, which was a limiting factor in its photoactivity. Technology-wise, the present work shows that by diligent control of the FSP parameters combined with short post-FSP annealing, can take advantage of the versatility of FSP for scalable production of nanomaterials with controlled phase/size and defects [20,21] to achieve highly efficient O2 evolving photocatalyst. Moreover, the present research data reveal -for the first time in literature- that the optimized mullite-Bi2Fe4O9 phase is a highly efficient O2 evolving photocatalyst over performing BiFeO3. Together with quantum chemical calculations, we use EPR and XPS data to analyze the underlying mechanism which relates the energy level profile of the BFO phases with the h+ efficiency in O2 production from H2O.

2. Materials and Methods

2.1. Flame Spray Pyrolysis (FSP) Synthesis of Nanocatalysts

The BFO nanomaterials were produced in a single-nozzle FSP reactor [19]. In brief, the stock solutions contained Fe(III) acetylacetonate (97% Aldrich, St. Louis, MO, USA) dissolved in xylene, and Bismuth(III) acetate (99.99% Aldrich) dissolved in 2-Ethylhexanoic acid (EHA). The precursor solution for production of BiFeO3 phase had a molar ratio of [Fe] = 0.1 M, and [Bi] = 0.1 M, while for production of Bi2Fe4O9 phase we have used [Fe] = 0.134 M, [Bi] =0.066 M. In all cases, the total metal concentration was set to [Fe] + [Bi] = 0.2 M and the solvents [xylene:EHA] volume ratio was (1:1). The parameters of the FSP process consisted of a precursor flow rate of 3 mLmin−1 and a dispersion oxygen flow rate of 7 Lmin−1 (Linde 99.999%). The flame was enclosed with two metallic tubes of a total 44 cm height. With the assistance of a vacuum pump (Busch, Maulburg, Germany), the produced particles were deposited on a glass microfiber filter with a binder (Albet Labscience, Hahnemuehle, Dasen, Germany, GF 6 257) and collected by scraping the powder from the filter. The produced nano photocatalysts were stored in glass vials under an inert Argon atmosphere, until use.
Post-FSP annealing: Post-FSP annealing was performed in a Thermawatt furnace, (Thermawatt, Athens, Greece) where a standard mass of 100 mg of nanomaterial was inserted in the tubular compartment under atmospheric O2. We found that nano-BFO [19] phase-transitions occur at temperatures ~130 °C lower than in bulk BFO [22]. Herein after several screening experiments, we have found that post-FSP periods of tanneal = 5 to 120 min and Tanneal = 550–700 °C values allowed us to span the appropriate phase-transitions in conjunction with the photocatalytic performance. Based on this, we discuss in detail tanneal = 5, 30, 60, 120 min since these provide the full O2 performance variation, i.e., tanneal = 5 min was best for photocatalytic performance of BiFeO3 while tanneal = 60 min was best for photocatalytic performance of Bi2Fe4O9.

2.2. Characterization of the Nanomaterials

2.2.1. Material Morphology

Powder X-ray Diffraction (pXRD) was carried out on a D8 Advance Bruker diffractometer with a Cu source (Kα, λ = 1.5418 Å), with operation parameters to be 40 mA current and 40 KV generator voltage. All structural parameters obtained from the pXRD data were calculated via Rietveld analysis using the Profex software, to determine the percentage of the BiFeO3/Bi2Fe4O9 crystal-phases for each BFO material.
Transmission Electron Microscopy (TEM) images were taken with a JEOL JEM-2100 electron microscope equipped with a LaB6 filament, operating at 200 kV accelerating voltage.
N2-Adsorption-desorption Brunauer–Emmett–Teller (BET) adsorption-desorption isotherms were recorded at 77 K using a Quantachrome NOVA touch LX2. Outgassing was performed at 150 °C for 16 h under vacuum. The absorption points in the relative pressure P/Po range of 0.1–0.3 were used to calculate the specific surface area (SSA). The absorption data points in the P/Po range = 0.35–0.99 were used for the pore radius analysis by the BJH method, while the total pore volume was obtained at the P/Po = 0.99 data point. The complete adsorption-desorption isotherm data are in Figure S1.

2.2.2. Optical Spectroscopy

Diffuse-Reflectance UV-Vis spectra (DRS-UV/Vis) were recorded with a Perkin Elmer Lambda-35 spectrometer, operating at room temperature, using BaSO4 powder as a background standard.
Fourier Transformed Infrared (FTIR) spectra were collected using an-IR Nicolet IS5 system equipped with the OMNIC software package, in the wavenumber range 400–4000 cm−1, for materials dispersed in KBr pellets.
Raman HORIBA-Xplora Plus spectrometer, equipped with an Olympus BX41 microscope was used to record Raman spectra. A 785 nm diode laser was used as an excitation source, and the laser beam was focused on the sample with the microscope. Before measurement, each powder material was softly pressed between two glass plates to form a pellet. A laser intensity of 15 mW was used, we found after trial-and-error that at this low-intensity, the crystal phase remained unchanged. Typically, good signal-to-noise Raman spectra were recorded for 15 accumulations at 30 s.
X-ray photoelectron spectroscopy (XPS) spectra were collected using a SPECS spectrometer equipped with a twin Al-Mg anode X-ray source and a multi-channel hemispherical sector electron analyzer (HSA-Phoibos 100). The base-pressure at the measurement was 2–5 × 10⁻⁹ mbar. In all experiments, the monochromatized Mg Kα line was set at 1253.6 eV, and the analyzer pass-energy at 20 eV. The binding energies were calculated vs. the energy of C1s carbon peak at 284.5 eV. The peak deconvolution for the Shirley background and peak deconvolution was performed employing mixed Gaussian–Lorentzian functions in the least-squares curve-fitting, using WinSpec software, developed at the Laboratoire Interdisciplinaire de Spectroscopie Electronique, University of Namur, Belgium.

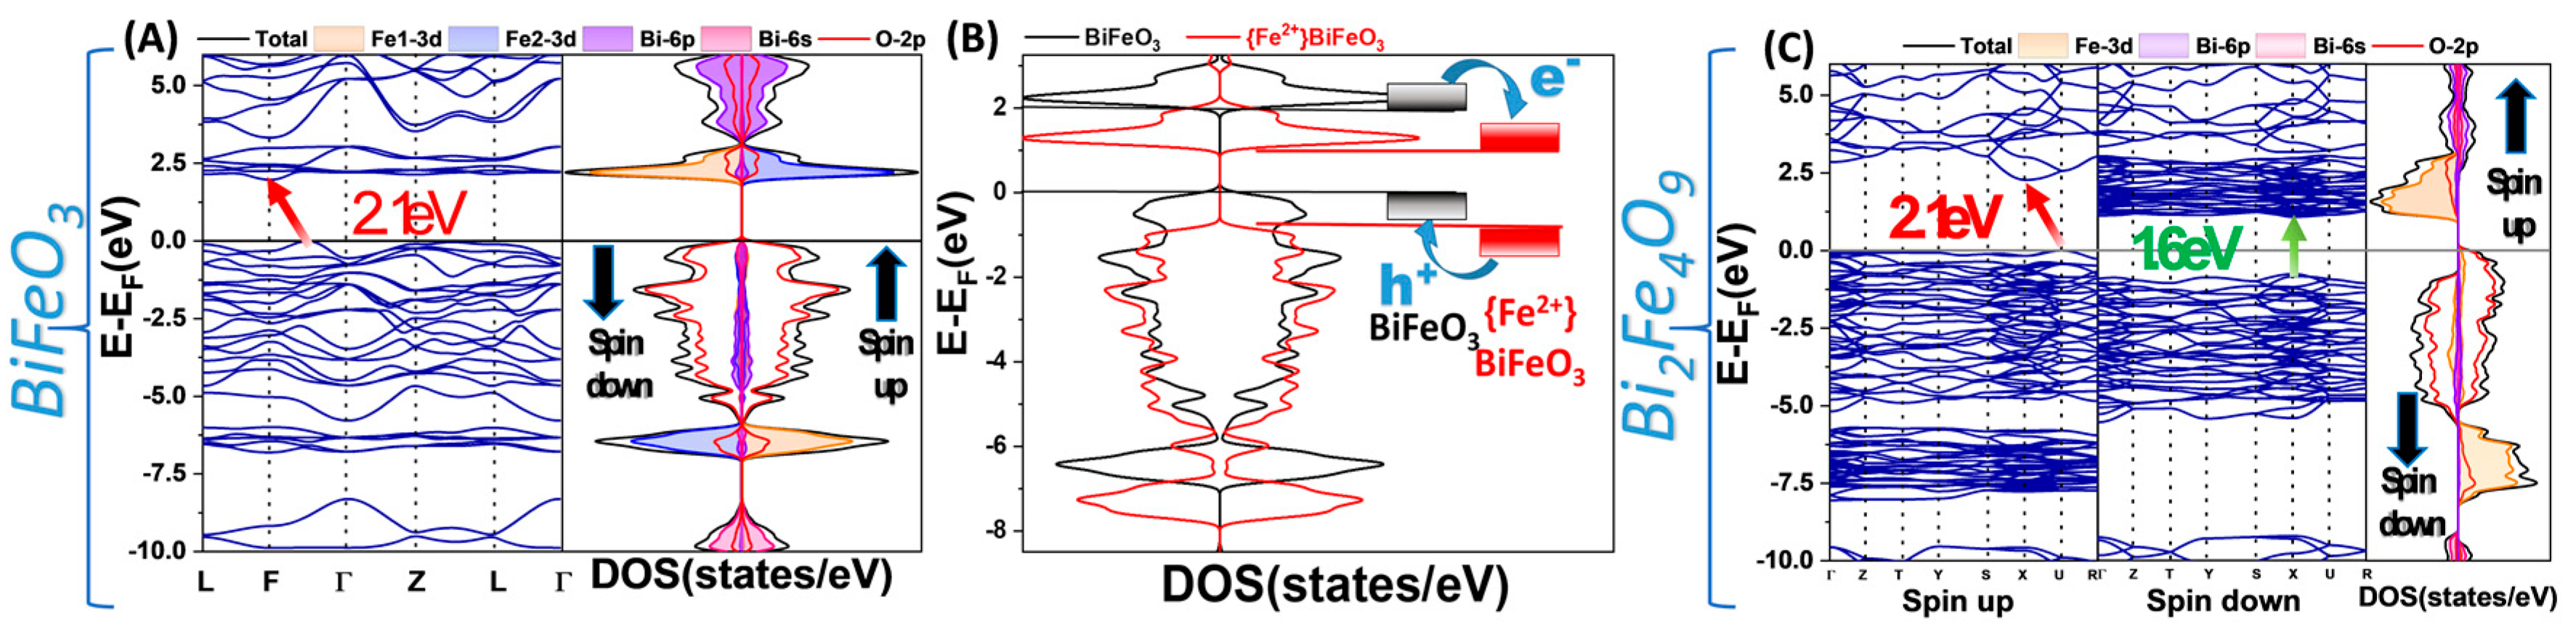
2.2.3. Theoretical Modeling (DFT) Calculations

Theoretical calculations were conducted for the BiFeO3-R3C [23] and Bi2Fe4O9-Pbam structures [24], using DFT as implemented in the Quantum Espresso software [25]. The projector augmented-wave (PAW) method was used to describe the core pseudopotential and the generalized gradient approximation (GGA) as simplified by Perdew, Burke, and Ernzerhof (PBE) and it was used for exchange-correlation effects. Pseudopotentials containing 15 valence electrons were used for Bi (5d10,6s2,6p3), 16 valence electrons for Fe (3s2,3p6,3d6,4s2) and 6 valence electrons for O (2s2,2p4). A plane-wave energy cutoff of 70.8 Ry was used for the BiFeO3-R3C structure and the Bi2Fe4O9-Pbam structure. Both structures were relaxed until the forces acting on each atom were <10−3 eV/Å. For geometry optimization and electronic structure calculations, (3 × 3 × 3) and (9 × 9 × 9) Monkhorst-Pack k-point grids were used respectively. Considering the strong correlations in transition metal oxides, we used the DFT+U approximation in the approach of Cococcioni and de Gironcoli [26] with a U-value of 4 eV applied on both structures.

2.3. Photocatalytic O2 and OH Generation

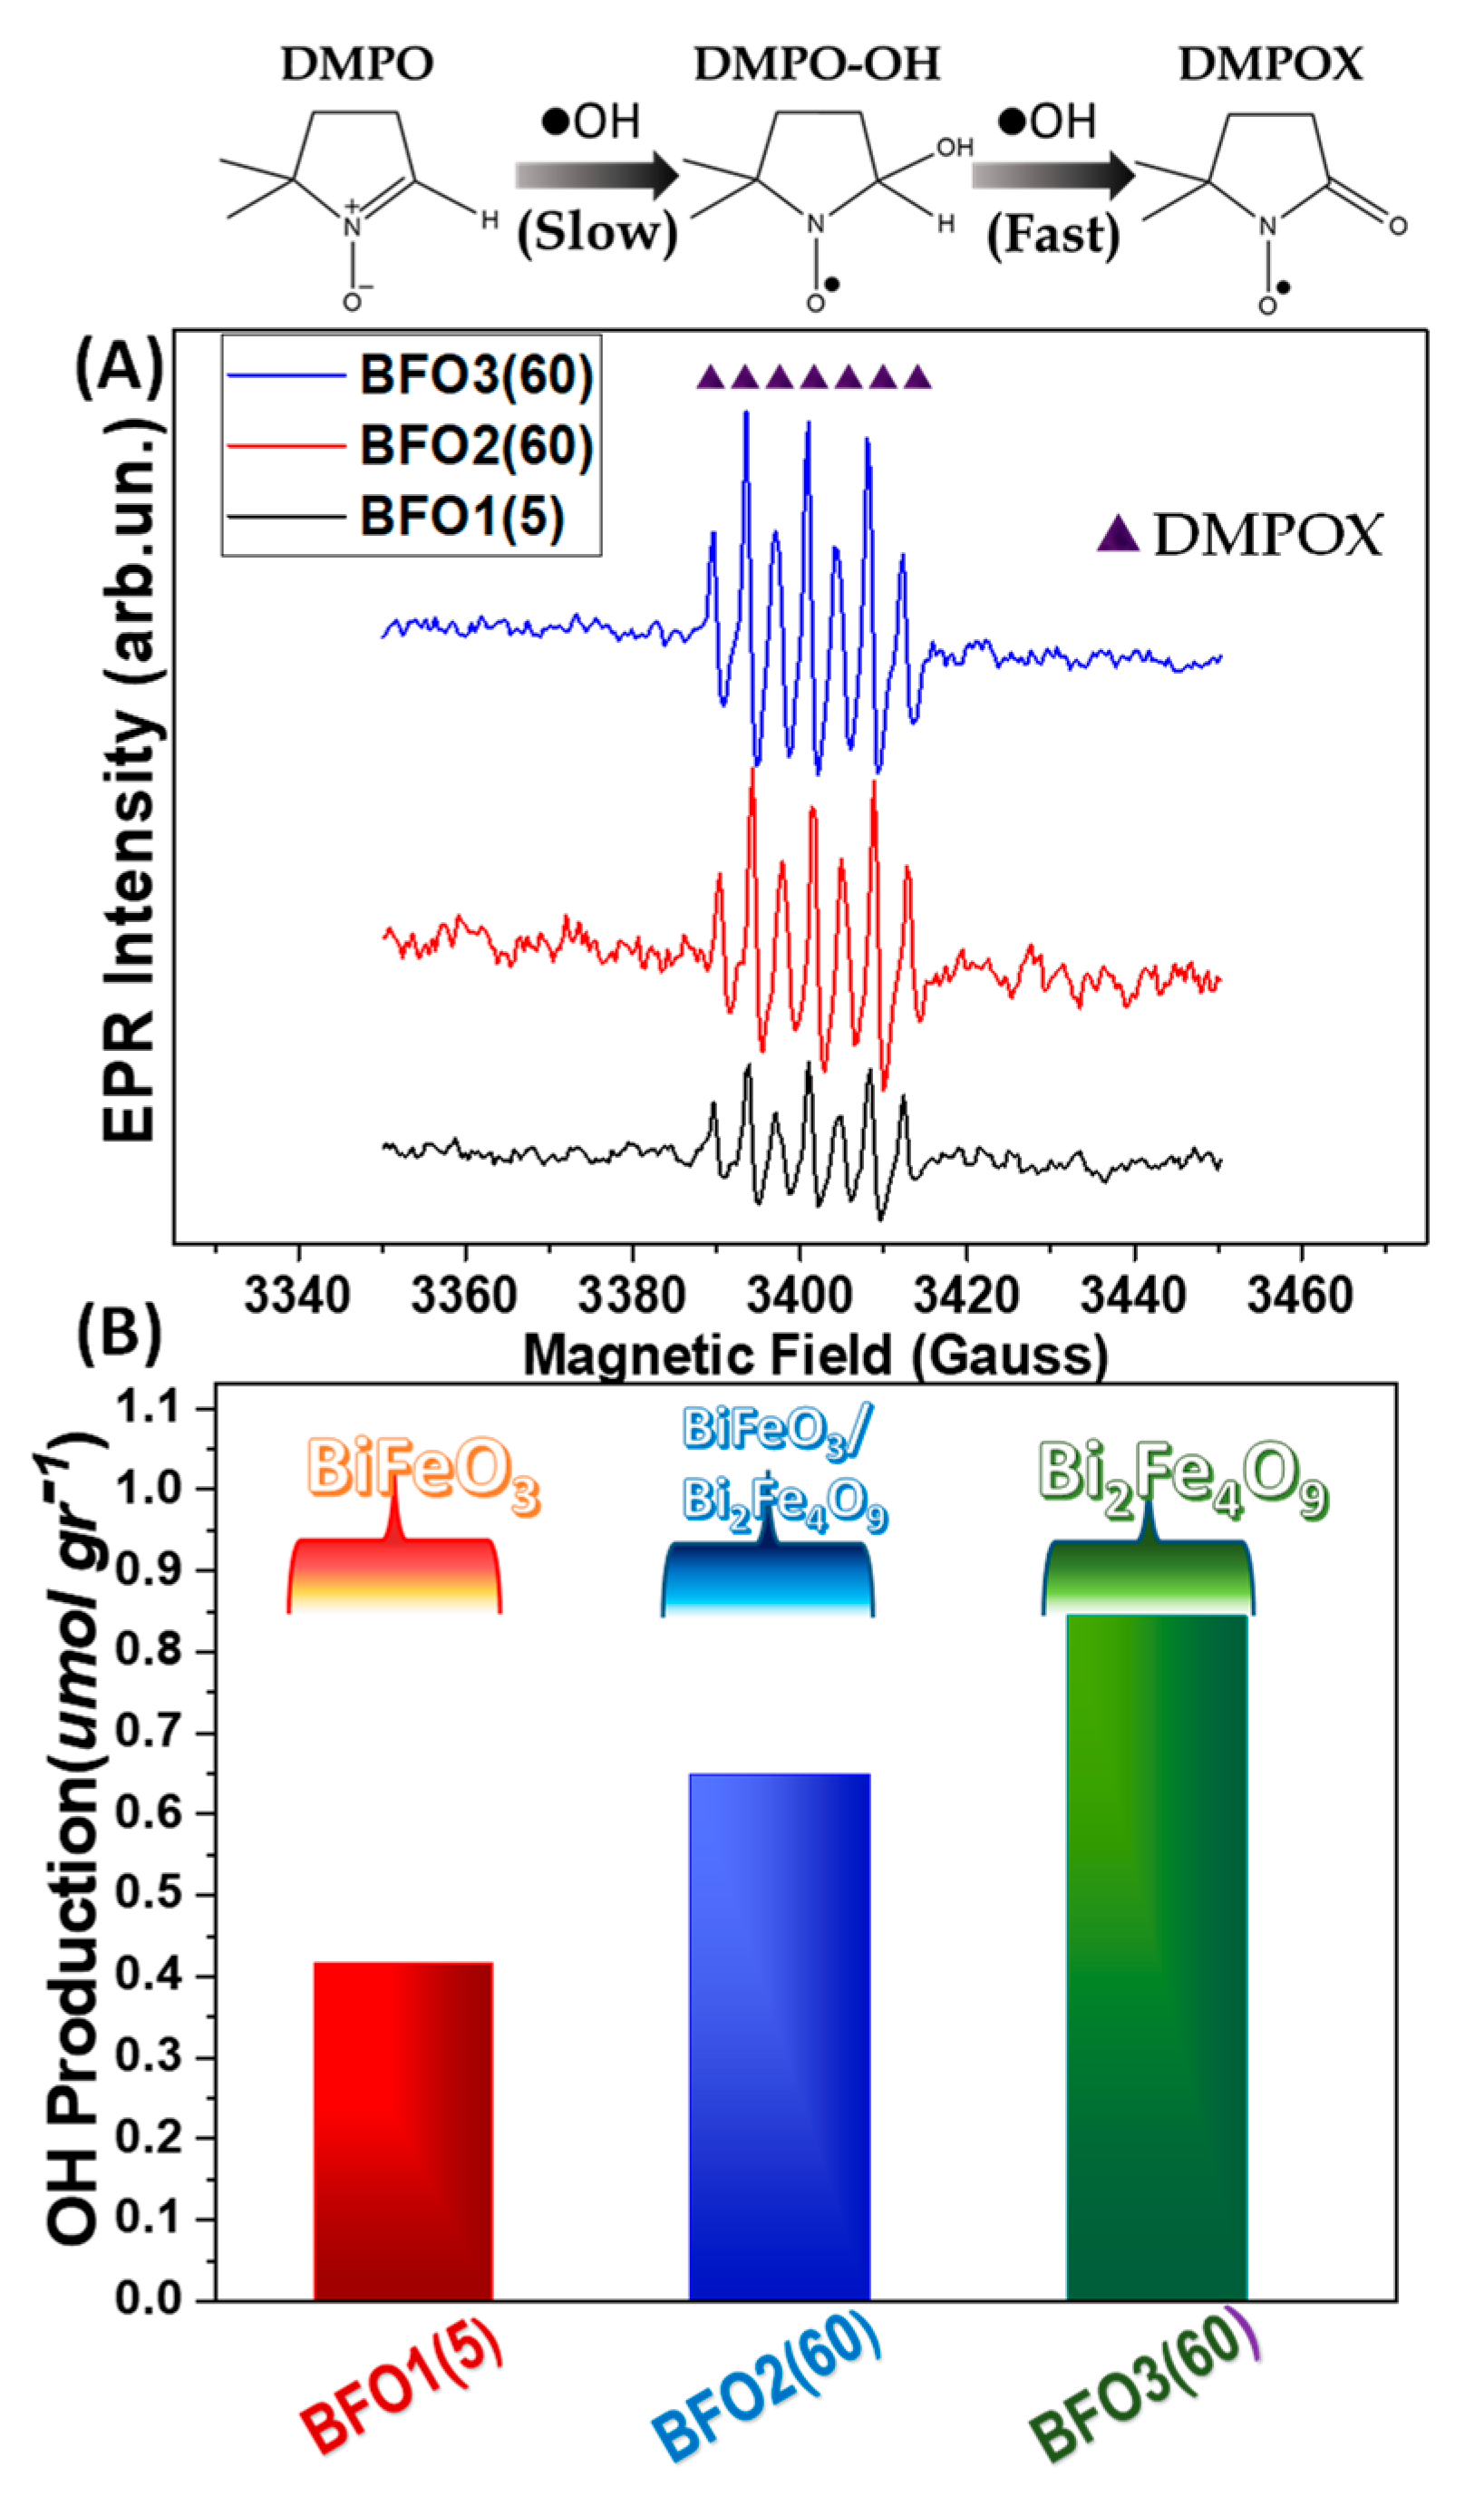
2.3.1. Electron Paramagnetic Resonance (EPR) Spectroscopy (OH Generation)

A Bruker ER200D spectrometer equipped with an Agilent 5310A frequency counter was used, operating at X-band (9.61 GHz). The spectrometer was running under homemade software based on LabView. In situ illumination of the samples inside the EPR cavity was performed using a 450 W Xe light lamp (Oriel model 66929), equipped with a 400 nm cut-off filter. For determination of OH, the reaction mixture was prepared using 1 mL of ultrapure Milli-Q water (Millipore, Burlington, MA, USA) contained 0.4 mg of each BFO material and 0.12 mg of HAuCl4•3H2O, or 0.14 mg of H2Pt4Cl6•H2O, which mixed with 2 mM of spin trap DMPO (5,5-dimethylpyrroline-(2)-oxyl, Aldrich). From this stock suspension, 20 μL were inserted into glass capillaries. To avoid the interference of sulfate-hydroxyl radicals, we have recorded EPR spectra without the presence of Na2S2O8. Irradiation was carried out in-situ at the EPR cavity, for periods from 30 s up to 5 min. Quantitative analysis of the OH was done using DPPH (1,1-Diphenyl-2-Picrylhydrazyl, Alfa Aesar, Haverhill, MA, USA) as a spin standard [27], and the double integral of the EPR signals.

2.3.2. Photocatalytic O2 Evolution Measurements

Experiments were performed into an immersion-well reactor (Photochemical Reactors Ltd., Reading, UK, Model 3210), a total reaction volume of 300 mL, at temperature 25 ± 3 °C being controlled by tap-water cooling. The light source was a medium-pressure mercury lamp (Model Oriel 3010, 125 W, total light flux 7 × 10¹⁸ photons/s), inserted into the glass-reactor. This irradiation set-up allowed only radiation with λ > 380 nm photons to excite the photocatalysts. In each experiment, 50 mg of the catalyst was suspended into 150 mL Milli-Q water which contained 0.1M NaOH (pH~12.8) and 0.02 M Na2S2O8 as an electron acceptor (final concentration of catalyst 0.33 g/L). Experiments with Pt0, Au0, or Ag0 were realized using hydrogen hexachloroplatinate (IV) hydrate, (H2Pt4Cl6•H2O, 99.9 %, Alfa Aesar), hydrogen tetrachloro-aurate (III) trihydrate (HAuCl4•3H2O, 99.9 %, Alfa Aesar), and Silver nitrate (I) (AgNO3, 99.9 %, Sigma Aldrich). In all experiments, the cocatalytic noble-metal particles were photo deposited in-situ: after the addition of all compounds in the reactor, an irradiation period of 15 min was necessary to achieve the in-situ reduction of the Pt, Au, or Ag cations [28].
Before each catalytic run, the suspension was purged with Ar gas (99.9997%) for at least 1 h so as to remove atmospheric gases. Quantitative monitoring of produced O2 was done via a continuous on-line Gas Chromatography System combined with a Thermo-conductive Detector (TCD- Shimadzu GC-2014, Carboxen 1000 column, Ar carrier gas).

3. Results

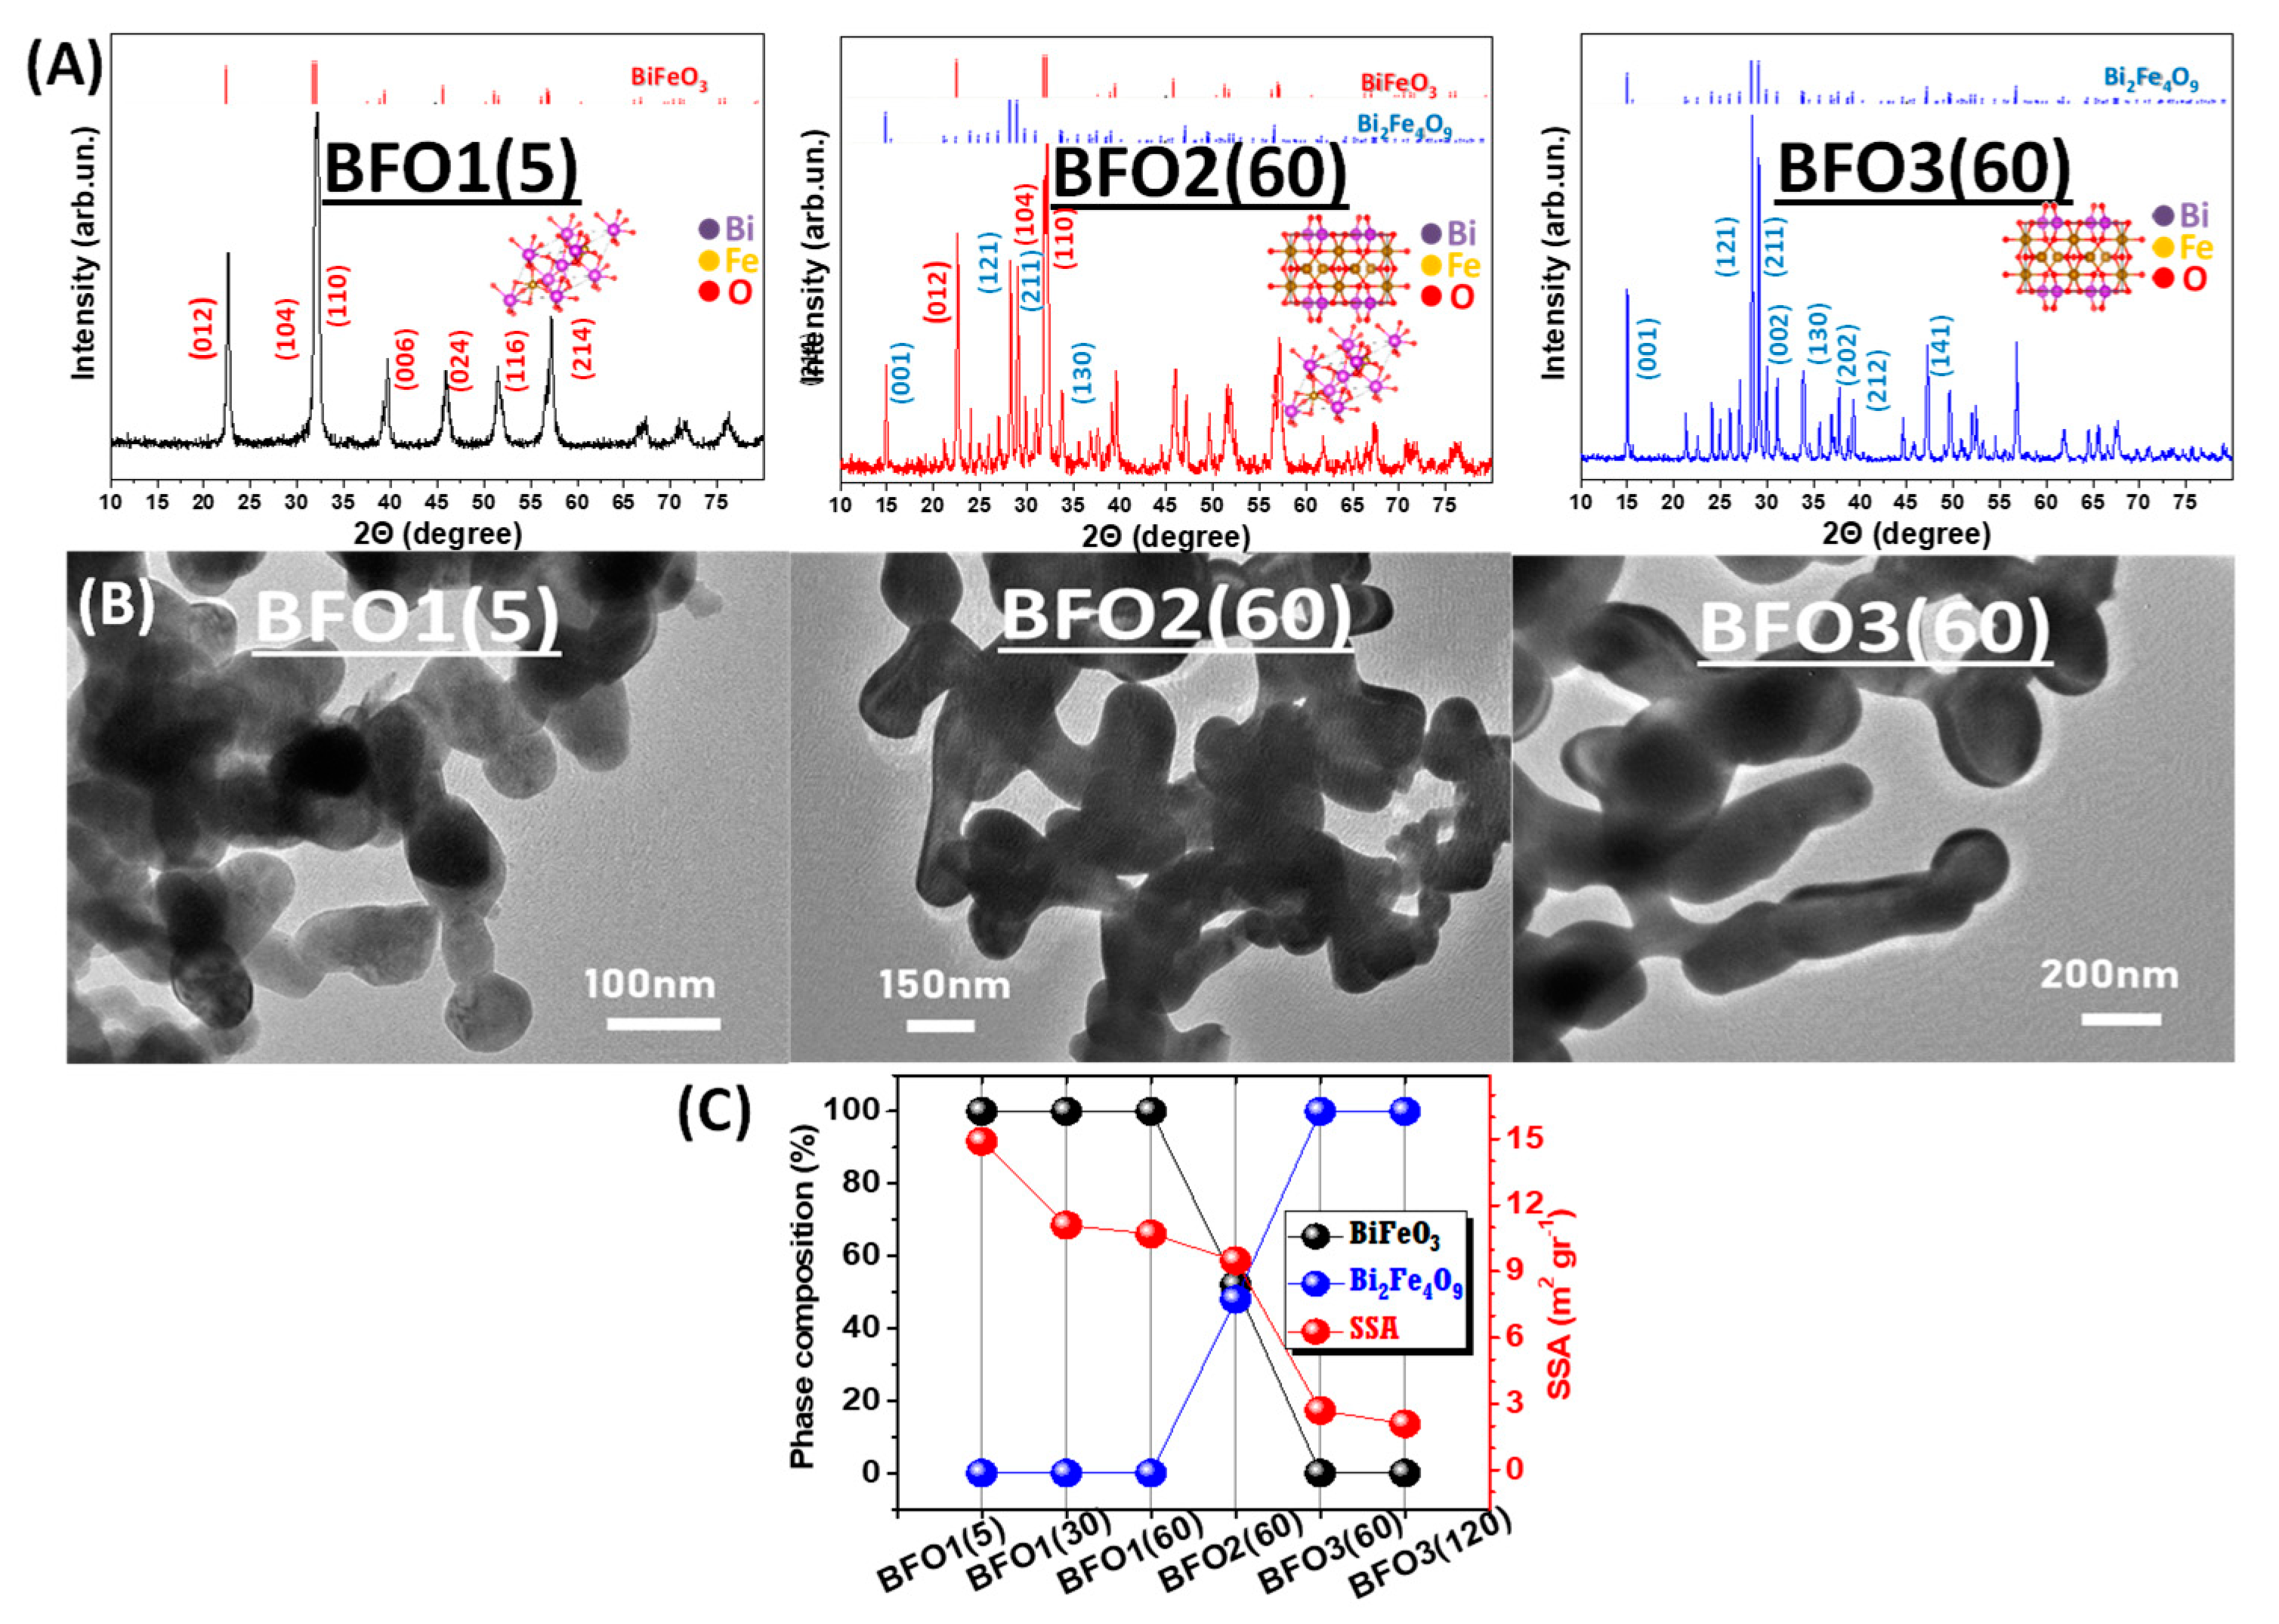
3.1. Structure and Morphology

3.1.1. XRD and TEM Structures

According to XRD, Figure 1A, the material BFO1(5) obtained for Tanneal = 550 °C/tanneal = 5 min material possesses the characteristic XRD peaks of the perovskite structure of the BiFeO3 with an R3c space group [29], and the most distinct Miller planes {012}, {104}, {110}, discerned at the XRD figure. Longer tanneal resulted in sharper XRD diffraction peaks, indicating improved crystallinity of the BiFeO3 phase [30]. The as-prepared BFO material, i.e., not-annealed, showed poor crystallinity (Figure S2). The short residence time of the particles in our FSP reactor i.e., milliseconds [20,21], does not allow full-growth of the BFO crystal structure. Thus, for the Bi-based materials, a post-FSP annealing step is necessary to obtain the fully crystalline particles [19]. The BFO3(60) material obtained at Tanneal = 700 °C/tanneal = 60 min exhibits high-quality diffraction peaks of the orthorhombic-Bi2Fe4O9 Pbam structure [31] with prominent peaks from the crystal planes{001}, {121}, {211}, {130}. The annealing period of 60 min was the minimal required to achieve 100% pure Bi2Fe4O9 phase i.e., shorter annealing times at Tanneal = 700 °C, resulted in mixed-phase Bi2Fe4O9/BiFeO3 with increasing BiFeO3 at shorter tanneal. At prolonged tanneal = 120 min, a rapid decline of crystal quality was observed due to the formation of solid melts [19]. Exemplifying this case, BFO3(120) has less sharp XRD peaks (Figure S3).
Overall, the XRD data for BFO reveal that the FSP-made BFO undergoes phase-evolutions from amorphous to BiFeO3, then to Bi2Fe4O9, and finally to solid-melt, increasing Tanneal = 550→700 °C and tanneal. These trends can be better visualized in Figure 1C. In order to gain insight into the relation of the BFO structures vs. the photocatalytic performance, we focus on pure phase BiFeO3 & Bi2Fe4O9 with varying degrees of crystallinity, quality, and defects. In this context, a ~1:1 mixed-phase material BFO2(60) that is BiFeO3/Bi2Fe4O9 heterostructure, has been obtained by Tanneal = 625 °C/tanneal = 60 min post-FSP annealing. Table 1 and Figure S3, provide the full set of all pertinent structures produced by the controlled [Tanneal, tanneal] protocols. In BFO1 or BFO2, at a given Tanneal, upon prolonged tanneal, the particle crystallinity was increased. In contrast, the pure-Bi2Fe4O9 nanophases, showed a striking degradation in crystallinity at prolonged tanneal = 120 min, due to solid-melt formation. It is underlined that, based on the Rietveld analysis of the XRD data, the particles were found to have only the pure phases, i.e., without characteristic peaks from impurities or secondary phases, such as Bismuth-oxides and the more troubling Bi25FeO40 or Fe2O3 that are usually difficult to eliminate in solid-state or wet synthesis methods [32]. The Rietveld-XRD analysis of mixed-phase BFO2(60) (Figure S4), shows that it consists of 52% BiFeO3/48% Bi2Fe4O9 phases. Thus, BFO2(60) represents a ~1:1 heterojunction BiFeO3: Bi2Fe4O9.
The TEM images of the catalysts, (Figure 1B), confirm the increase in particle size, upon increase of Tanneal and tanneal. The annealed materials appear to retain rod-like morphology with neck-sintering between neighboring particles, as observed originally for the FSP-BFO particles [19]. FSP-made Bi-based perovskites such as BiVO4 nanoparticles [33] present the same elongated morphology. The TEM size distribution, (Figure S5), reveals that all materials had a size distribution with a 30% span of the mean dTEM value. The SSA analysis and total pore volume (Figure S1), allow the dBET size calculation using the empirical Equation (1):
d BET = 6000 / SSA × density
All materials had relatively low SSA ~14.1 m2 g−1 for BFO1(5), which dropped under longer annealing time at 10.7 m2 g−1 for BFO1(60), and more severely at higher Tanneal i.e., 2.7 m2 g−1 for BFO3(60).

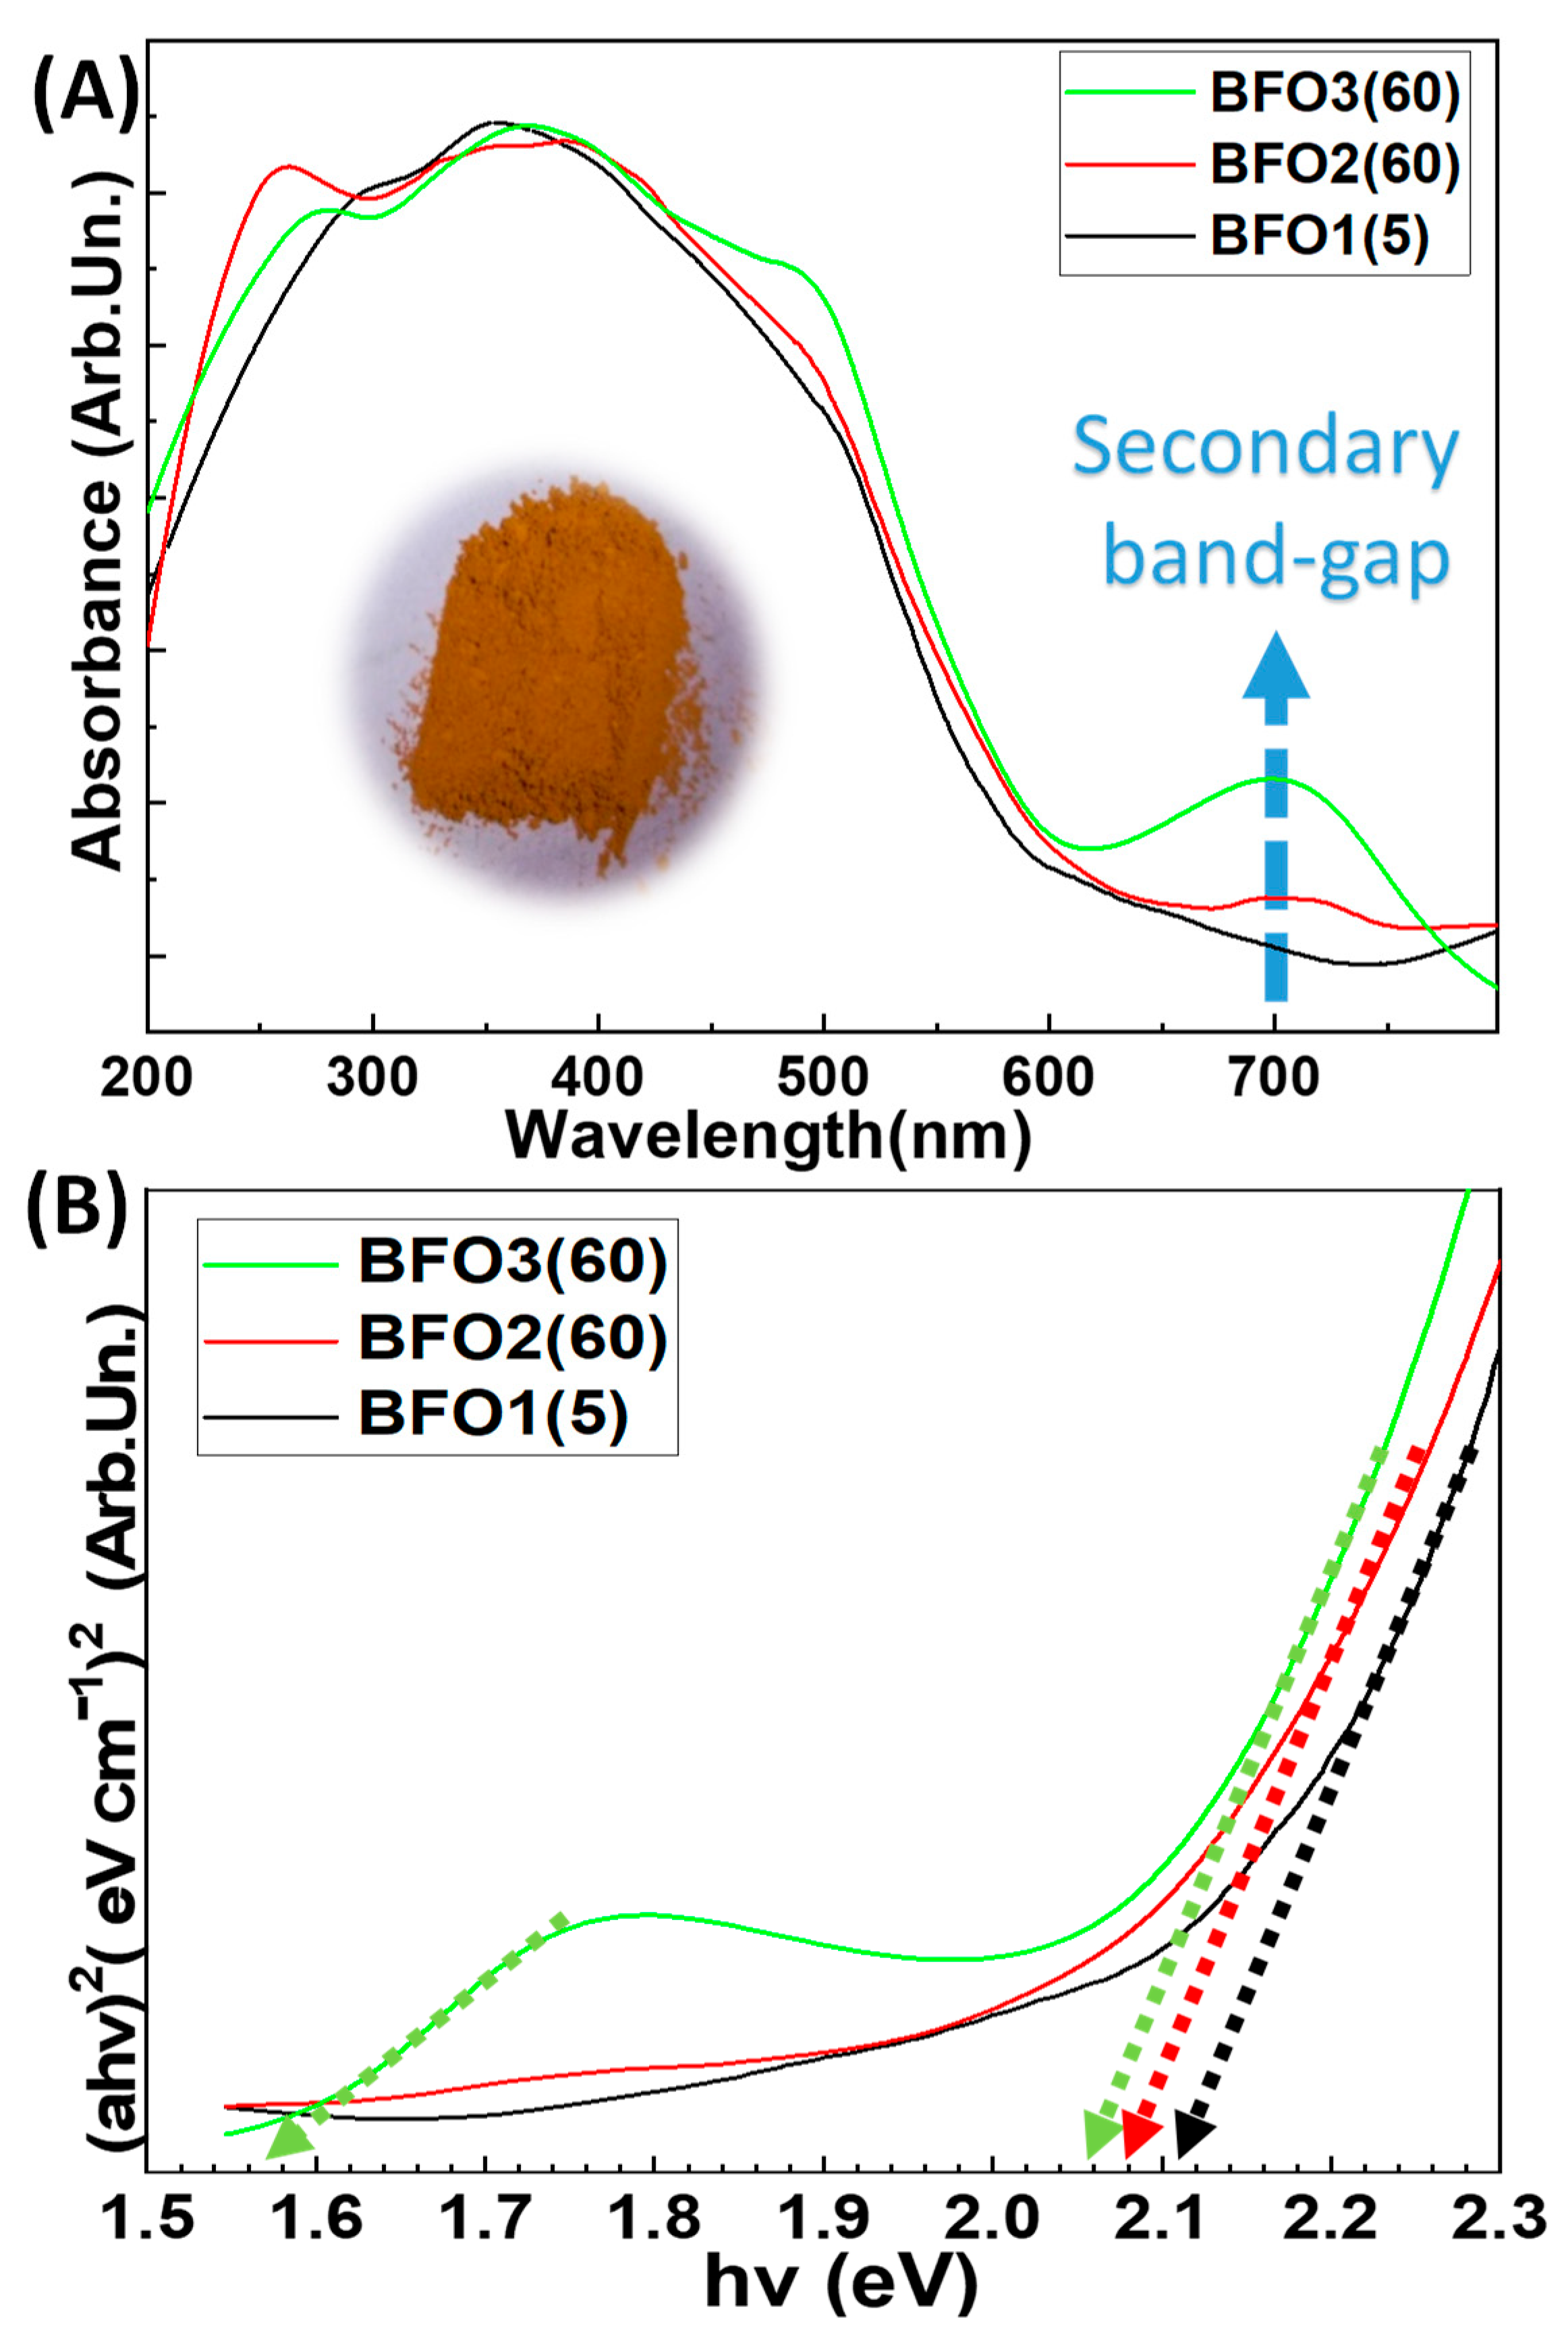
3.1.2. Diffuse Reflectance Uv-Vis Spectroscopy: Band-Gap Estimates

All our BFO materials showed characteristic broad absorption from 200 nm to 600 nm, with a maximum in visible wavelengths 400–480 nm, corresponding to their dark-brown colors (inset photo in Figure 2A). The bandgap energy Eg calculated from the Tauc plot [34], was derived using the Kübelka-Münk transformation (2):
α h v = K ( h v E g ) p
The value of the p-index signifies the direct or indirect band transitions in a semiconductor [35]. i.e., p = 1/2 for a direct-band transition, p = 2 for indirect-band transition. So far, there is not a clear agreement in the literature whether the optical transitions in BiFeO3 and Bi2Fe4O9 phases are direct or indirect [10].
Thus, herein the direct transitions are assumed (p = 1/2) for the main DRS-UV/Vis absorbance peaks of BiFeO3 and Bi2Fe4O9 phases. In addition, a secondary transition was consistently observed for Bi2Fe4O9, which is usually identified as an indirect transition, marked by the dashed arrow in Figure 2A. The direct bandgap of the perovskite phase BiFeO3 has been reported to be in the range of 2.1–2.8 eV [10]. For the mullite-type Bi2Fe4O9, Eg is expected in the range of 2.1 to 2.3 eV [11]. Also, for the Bi2Fe4O9, a secondary smaller bandgap 1.6 eV [36] is usually evident by the absorbance peak at ~700 nm, suggested to originate from the d-d transition of Fe atoms [37]. Our data agree with the literature, with Eg = 2.1 eV for BFO1(5), Eg = 2.08 eV for BFO2(60), while the BFO3(60) has Eg = 2.05 eV. All other FSP-made catalysts prepared for various tanneal have Eg in the range 2.0–2.1 eV, (Figure S6). The secondary bandgap of 1.6 eV is evidenced in the spectrum of BFO3(60) with 100% Bi2Fe4O9. In the BFO2(60) this absorbance-hump at 700 nm, is lower in accordance with the lower 48% content in Bi2Fe4O9. The indirect-transitions have typically lower absorbance cross-sections [2,35] since they require a transition of the photoactivated electron between energy states with different lattice-vector k [35] between different Brillouin zones. In the context of photocatalysis, an indirect transition can inhibit the recombination of the photoexcited e/h+ pairs [2,35], improving photocatalytic performance.

3.1.3. FT-IR, Raman Spectroscopy

In all cases, the BiFeO3 phase can be discerned from two characteristic peaks at 445 cm−1 and 557 cm−1, due to the Fe-O bond stretching and bending vibrations from octahedral FeO6 groups of BiFeO3 [38,39]. The Bi2Fe4O9 phase has a more complex structure and it contains both octahedral FeO6 and tetrahedral FeO4 units [40], thus its FT-IR spectrum is characterized by several bands of lower intensity than BiFeO3 [41]. We can identify the Bi2Fe4O9 phase by focusing on the bands at 441 cm−1, 609 cm−1, and the more prevalent 814 cm−1. Noticeably, the FTIR spectrum for BFO1(5) shows weak peaks around 1250–1500 cm−1, (inset zoom of Figure 3A), which are indicative of traces of hydrocarbons in BFO1(5). These peaks were also observed in the as-prepared materials (not shown). These traces are eliminated upon longer tanneal and higher Tanneal (Figure S7). Such traces of hydrocarbons are known to be potential leftovers from the FSP combustion process [42]. The short tanneal of 5 min in BFO1(5) is not enough to fully combust them. As we show hereafter, these hydrocarbon traces cause reduction of some Fe-centers forming Fe2+ in BFO1(5). The mixed-phase material BFO2(60) contains the characteristic peaks of both BiFeO3 and Bi2Fe4O9 phases, in accordance with XRD results. The characteristic Raman peaks are marked with the corresponding dotted lines. The BFO1(5) i.e., 100% BiFeO3 has two characteristic Raman peaks at 136 cm−1 and 170 cm−1, accompanied by seven weaker peaks in the range of 260 cm−1 to 520 cm−1 [43,44], while the BFO3(60) i.e., Bi2Fe4O9, exhibits multiple bands at 87, 207, 283, 331, 365, 430, and 552 cm−1 [45] (Figure S8).
Thus, from the present FT-IR and Raman data, it is confirmed that BFO1(5) is a 100% BiFeO3, BFO3(60) is a 100% Βi2Fe4O9, while the BFO2(60) is a mixed phase. Our XRD, FTIR, Raman data provide clear evidence that the BFO materials are devoid of any secondary phase.

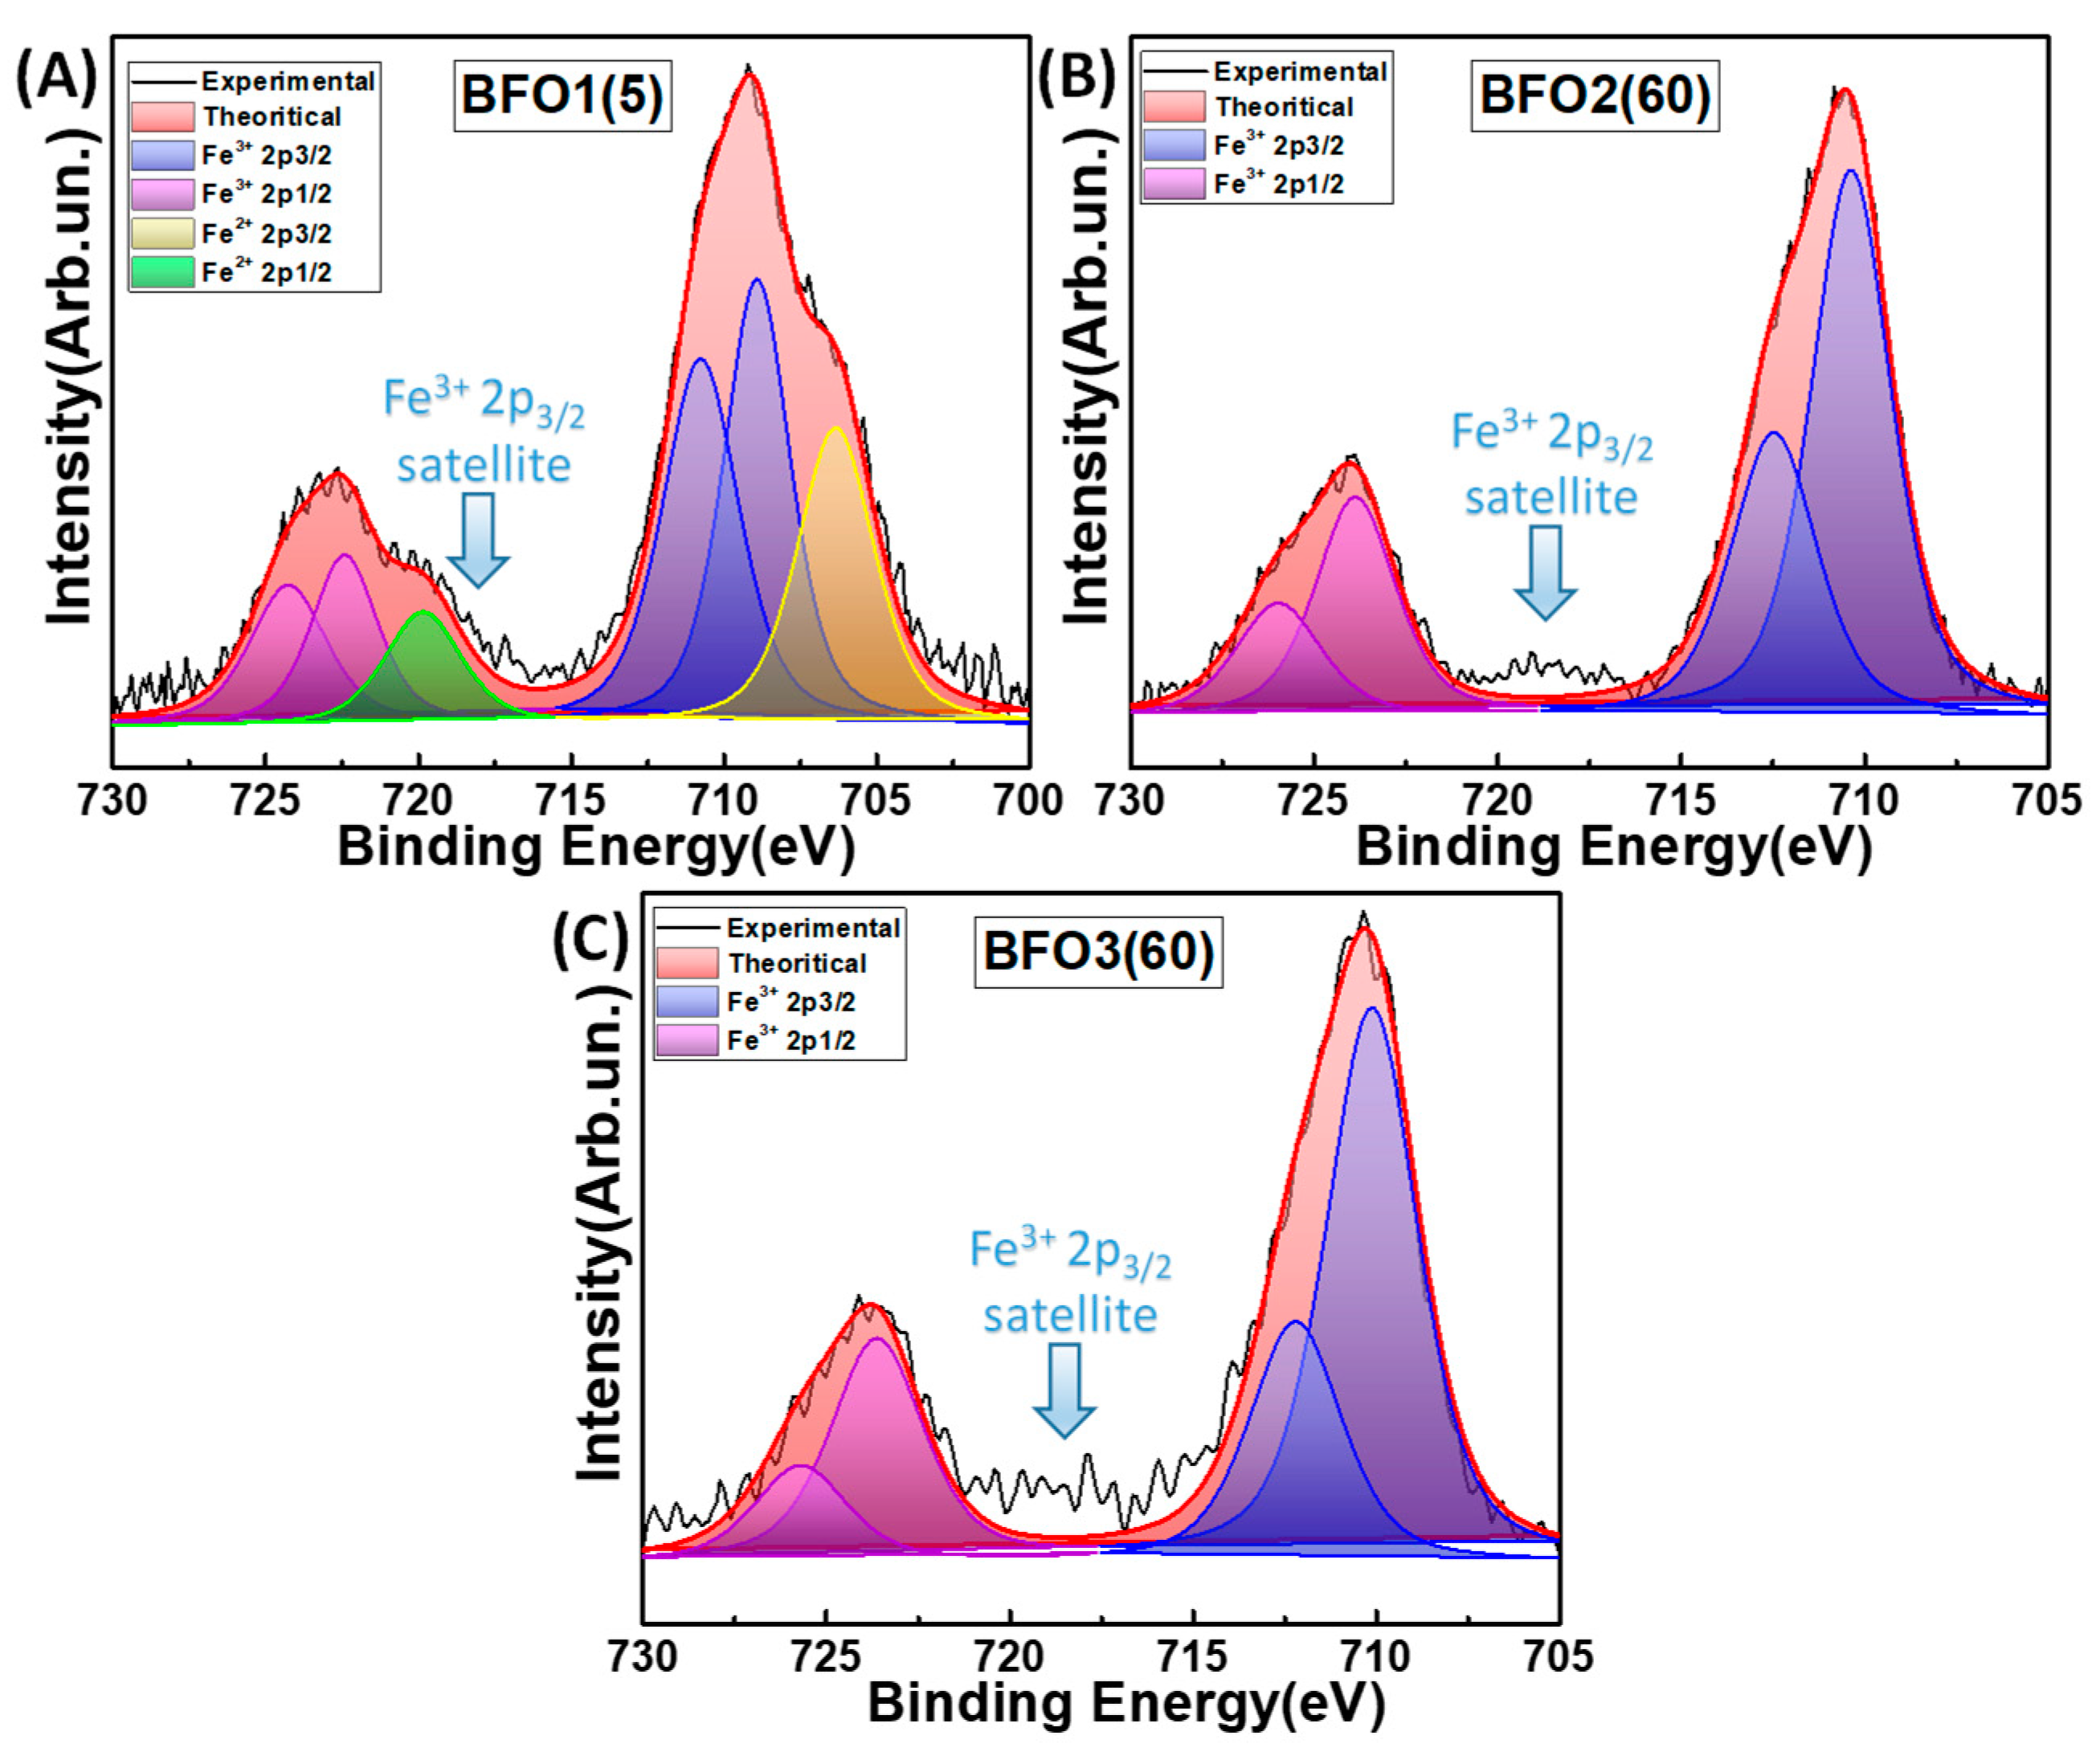
3.1.4. X-ray Photoelectron Spectroscopy

The XPS spectra for the Fe2p energy range, Figure 4, present two sets of doublets corresponding to Fe3+: the doublet at 710 and 712 eV is assigned to Fe3+2p3/2, while the 723.5 and 725.5 eV are assigned to Fe3+2p1/2 [46]. The characteristic ΔΕ = 13.5 eV splitting is typical for the spin-orbit coupling of the Fe3+2p [47]. The weak-peak at ~718 eV is the satellite of the Fe3+2p3/2 at approximately 6 to 8 eV from the binding energies of the Fe3+2p1/2 [46]. In addition, the Fe-XPS spectrum of BFO1(5), Figure 4A, contains peaks at 706.2 eV that correspond to the Fe2+2p3/2 and the 719.7 eV at Fe2+2p1/2 [48], confirming that BFO1(5) contains Fe2+ atoms (approximately 10–15%). This can be attributed to the reduction of Fe3+ centers, by traces of small hydrocarbons, leftover during the FSP process [42] i.e., as evidenced by the FT-IR data (Figure 3A). Noticeably, Fe2+ atoms were not detected in the XPS spectra in the as-prepared BFO material, [19], nor in the other BFO materials prepared at longer tanneal or higher Tanneal. The population of the Fe2+ centers was maximum in the shortly-annealed BFO1(5) and declined rapidly upon longer tanneal = 30 or 60 min (Figure S9). Thus, the XPS data together with the FT-IR data, show that 5 min at 550 °C allowed the optimal formation of Fe2+ centers in BFO1(5) as a consequence of the interaction with the hydrocarbon’s traces. Theoretical DFT calculations, discussed hereafter, reveal that these Fe2+ atoms have a significant impact on the energy level positioning of the CB and VB edge of BiFeO3, and this has a beneficial effect on photocatalytic O2 production.
A complete set XPS data for all BFO materials Fe (Figure S9), Bi(Figure S10) and O (Figure S11) show the characteristic peaks at 164.4 eV and 159 eV, with a spin-orbit splitting value ~5.4 eV of the two states Bi 4f5/2 and Bi 4f7/2 in accordance with the literature [49]. The O-XPS spectra exhibit the characteristic peak at 532 eV due to oxygen adsorbed on the surface of and hydroxyl groups, while the peak at 530.1 eV is due to O-Fe units of the crystals structure [50,51].

3.2. Photocatalysis

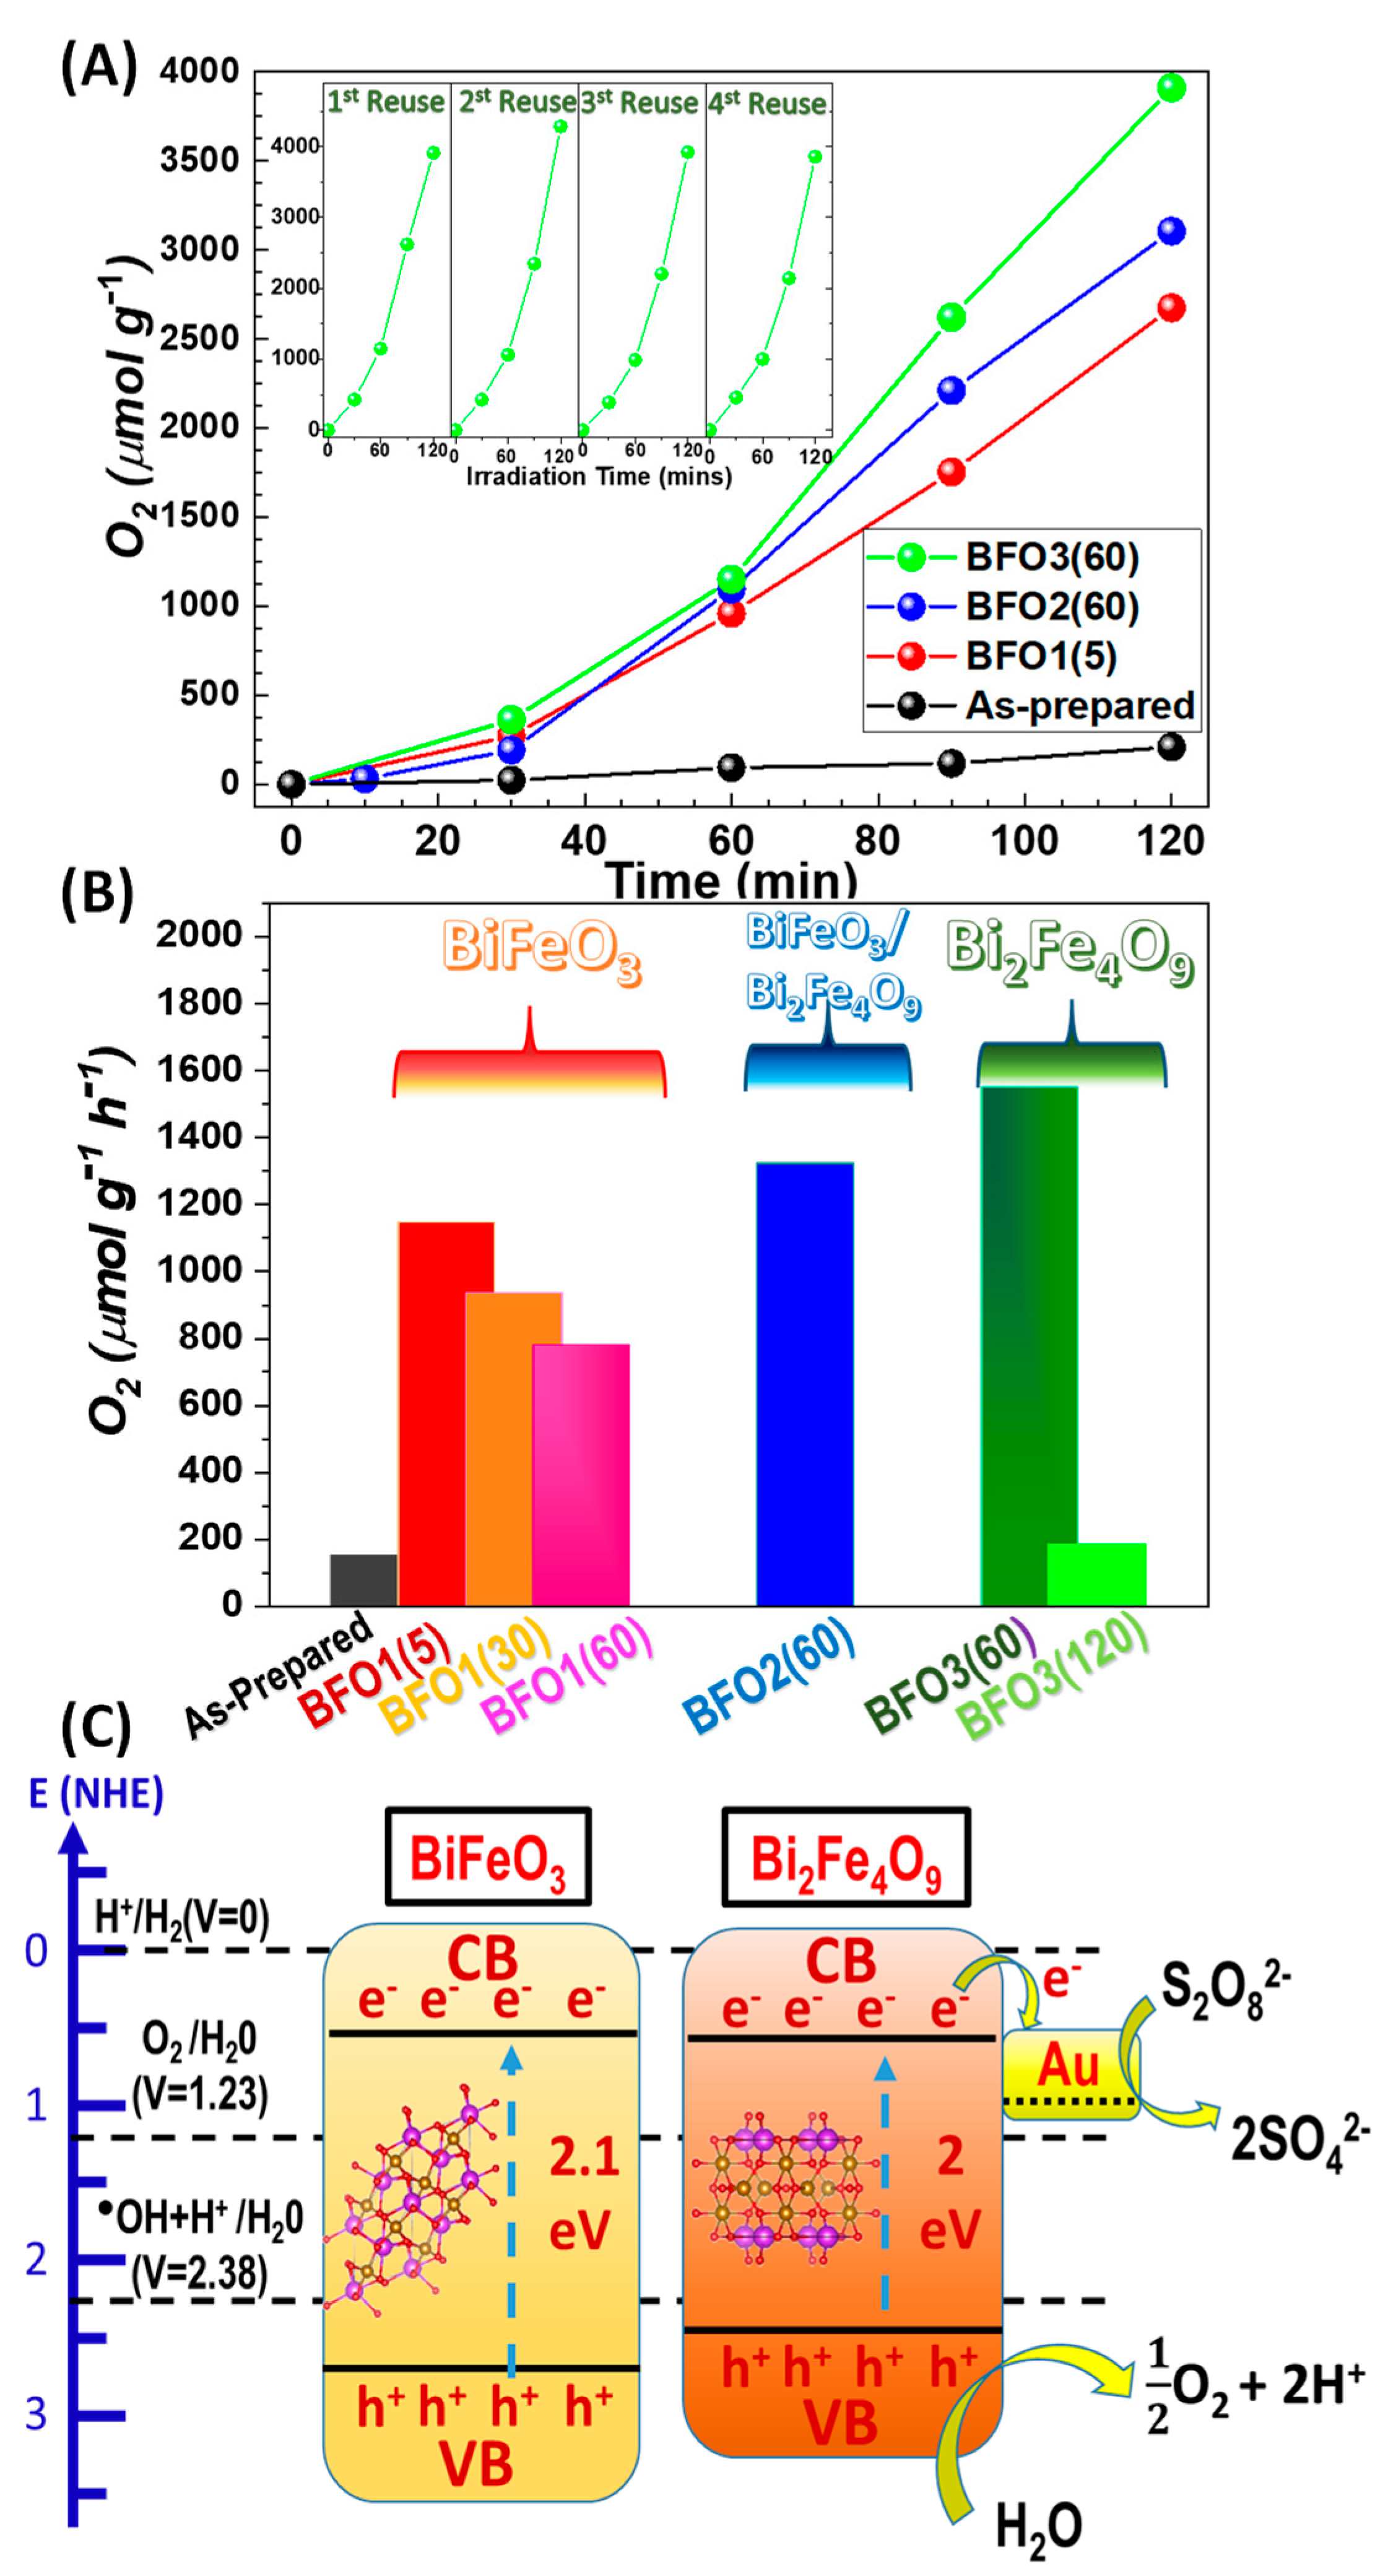
3.2.1. Photocatalytic O2 Production from H2O

The Conduction Band (CB) energy position of BiFeO3 was found to be at +0.34 eV vs. NHE, and the Valence Band (VB) position at 2.44 eV. Similarly, Bi2Fe4O9 has a CB-edge at +0.36 eV and VB-edge at 2.41 eV (Table S1). These are in agreement with literature values of CB-edge +0.51 eV for BiFeO3 and CB-edge +0.5 eV for Bi2Fe4O9 [52,53]. As the energy level of O2/H2O is at +1.23 eV vs. NHE, both materials are suitable for oxidation of water. Using NaS2O8 as electron scavenger [7], the overall photocatalytic reaction proceeds according to the reactions scheme Figure 5C, and reaction (3):
{ BFO + hv } + H 2 O + S 2 O 8 2 > { BFO } + 1 / 2 O 2 + 2 H + + 2 SO 4 2
The photocatalytic O2 production data (Figure 5) show that the as-prepared BFO material achieved very low O2 evolution i.e., <151 μmol g−1 h−1. Annealing at short-time Tanneal = 550 °C, tanneal = 5 min, had a dramatic effect on the O2 generation efficiency i.e., 1150 μmol g−1 h−1 for BFO1(5). Prolongation of tanneal causes a drop in O2-production rates i.e., to 900 μmol g−1 h−1 for tanneal = 30 min, and 780 μmol g−1 h−1 for tanneal = 60 min. The trend in BiFeO3 shown in Figure 5B, implies a key-optimization step occurring at short tanneal = 5 min.
We have performed a screening of the optimal noble metal loading for the O2 evolution of the BFO materials. By testing loadings of 0.1, 0.5, 1.0, 2.0, 5.0 % w/w (data not shown), we concluded the 1.0% to be the best ratio. Lower noble metal loadings were not-adequate, while higher loadings (2% w/w or 5% w/w) inhibited the O2 production due to coverage of the BFO surface. For example, the 2% w/w Au0 or 5% w/w Au0 produced by 30% and 60% less O2 as it is compared with the 1% Au0.
The mixed-phase BFO2(60), ~1:1 BiFeO3:Bi2Fe4O9, shows an improved O2 evolution rate 1300 μmol g−1 h−1. This is higher than the performance of the best BiFeO3. Remarkably, the pure Bi2Fe4O9 phase, achieved a significant O2 evolution rate of 1550 μmol g−1 h−1, which is 35% higher than BiFeO3. In addition, the Bi2Fe4O9 catalyst is stable for 4 catalytic cycles with a minor loss of 5% of its efficiency (inset of Figure 5A), while for all the materials the XRD, Tauc plot and XPS after the photocatalysis are present in (Figure S12).
Overall, we can conclude that:
  • Photocatalytic O2-evolution is improved significantly on going from BiFeO3 towards Bi2Fe4O9
  • For materials of the same phase, the annealing protocol parameters, Tanneal, tanneal, allow modulation of the O2 evolution trend. In all cases, longer tanneal is detrimental
  • Bi2Fe4O9 is sensitive to prolonged tanneal, i.e., severe crystal quality deterioration occurs in BFO3(120) and this causes severe deterioration of its photocatalytic activity. In contrast, BiFeO3 shows less-pronounced effects upon prolonged annealing.
  • The XPS data reveal a correlation trend between the Fe2+ centers in BiFeO3 and O2 production.
A comparison with literature data for photocatalytic OER vs. pertinent Fe, Bi catalysts, is presented in Table S2 [7,8,54,55,56]. Our FSP-made BiFeO3 i.e., BFO1(5), supersede the performance of Papadas et al. [7] which is comparable to our BFO1(60) catalyst. Among all BFO photocatalysts in Table S2, the FSP made Bi2Fe4O9 (BFO3(60)) is a superior photocatalyst for O2 production from H2O, over performing all so far known BFO materials.

3.2.2. Photogenerated Holes of the Photocatalytic Mechanism

In O2 evolution photocatalysis, oxidation of H2O by the photogenerated holes is a key-step [2] via the formation of OH. Herein we have used EPR spectroscopy to monitor in-situ the photogeneration of OH by the best performing BFO (BFO1(5), BFO2(60), BFO3(60)).
The EPR data show that all the studied BFO catalysts are very efficient in the photogeneration of OH (Figure 6A). Interestingly, the EPR spectral patterns, have a characteristic 7 line pattern with intensity ratio [1:2:1:2:1:2:1] which is the fingerprint of two OH trapped/per/DMPO [57]. The so formed structure is known as DMPOX [58]. The reaction path is shown on top of Figure 6. The formation of DMPOX reveals that a high local concentration of OH occurs [57] during the photoexcitation of the BFO particles. Indeed, quantification of the OH proves that the BFO creates very high concentrations of OH up to ~850 μmol/g for BFO3(60). For comparison, a reference P25-TiO2 irradiated under the same conditions generated 300 μmol/g. Comparison between Figure 5B and Figure 6B show a clear trend BFO3(60) > BFO2(60) > BFO1(5), in both OH generation as well as in O2 photogeneration efficiency. Accordingly, we conclude that the superior photocatalytic efficiency of BFO3(60) and pure Bi2Fe4O9, originates from the highly efficient photogeneration of the holes in the valence band. To further peer into the band-positioning of our BFO3(60) we have compared the effect of Au0, Pt0, Ag0 as electron acceptors on the O2 generating efficiency. Interestingly, BFO3(60)/Au0 and BFO3(60)/Pt0 have almost the same performance, while BFO3(60)/Ag0 shows a lower by 25% of the original efficiency (Figure S13). According to the energy-level scheme in Figure 5C, the photocatalytic efficiency can be correlated with the favorable positioning of the conduction-band edge of Bi2Fe4O9 +5 eV vs. vacuum (+0.5 eV vs. NHE) [53] vs. the work function of Pt0 (φ = 5.6 eV) and the work function of Au0 (φ = 5.1 eV vs. vacuum) [59]. Ag0 has a less favorable positioning work function (φ = 4.2 eV) [60] vs. the CB of Bi2Fe4O9 and this results in lower O2 photogeneration.

3.2.3. Insight into the Role of Fe2+ Centers in BiFeO3

The photocatalytic and XPS data indicate that the presence of Fe2+ atoms in BiFeO3, i.e., BFO1(5) plays a key role in the photocatalytic activity. Intriguingly, no difference was observed in the UV-Vis absorbance profile neither in the Eg value for the Fe2+ containing BFO1(5) vs. Fe2+-free BFO(30, 60) materials. To better understand this phenomenon, we have analyzed the energy levels of BiFeO3 including Fe2+ atoms.
For Fe2+ free BiFeO3 the calculated bandgap values are 2.0 eV (indirect, F/Γ→F) and 2.1 eV (indirect, F/Γ→Z, and F/Γ→L). In accordance with previous reports regarding BiFeO3 [61], the spin-up and spin-down populations are symmetric, due to the antiferromagnetic arrangement of Fe3+ magnetic moments. As shown in the DOS plot in Figure 7A, the maximum energy of the Valence-band VBmax of BiFeO3 is dominated by O-2p states, while the CBmin by Fe-3d states. The VBmax of BiFeO3 is located between the F(0.5,0.5,0) and Γ(0,0,0) points, and the CBmin at the F(0.5,0.5,0) point, in agreement with the previous reports [62]. In Figure 7B one atom of Fe2+ has been introduced per unit cell i.e., for the sake of the discussion we codename it {Fe2+}BiFeO3, comparing with the DOS for BiFeO3 (red vs. black lines) reveals that the introduction of Fe2+ atoms into the BiFeO3 lattice causes a downshift of both CD and VB by 0.9 eV, without a change in the band-gap value.
The theoretical result is in accordance with the experimental data, EPR, and photocatalysis, which show that {Fe2+}BiFeO3 and BiFeO3 i.e., materials BFO1(5) and BFO1(30, 60), have similar Eg values. [ii] the downshift of CB by +0.9 eV, towards more positive potentials, enhances the oxidative capacity of the holes in {Fe2+}BiFeO3 vs. BiFeO3, which shows the BFO1(5) being more photoactive than BFO1(30, 60). Thus, the present theoretical analysis indicates the superior photocatalytic efficiency of BFO1(5) can be attributed to the more positive potential of the CB induced by the presence of Fe2+ atoms in the BiFeO3 lattice.
For completeness, we present the energy-bands and DOS for Bi2Fe4O9 (Figure 7C). In Bi2Fe4O9 the CBmin is mainly populated by Fe-3d states and the VBmax by O-2p states, as is the case for BiFeO3. However, in Bi2Fe4O9 the DOS profile is fundamentally more complex than BiFeO3 i.e., due to the ferromagnetic character Bi2Fe4O9 [45]. More specifically, various transitions are allowed for combination of spin-up/spin-down configurations: a transition with energy 2.1 eV (indirect, Uup → Xup), one with 1.1 eV (indirect, Uup → Xdown) and 1.6 eV (direct, Xdown → Xdown). These are in agreement with the DRS-UV/Vis data where the bands at Eg~2.1 eV and ~1.6 eV are evidenced in the experimental spectra.

4. Conclusions

The present study shows that FSP-made BFO nanocatalysts can be optimized dramatically for highly efficient photocatalytic O2 evolution from H2O, by easy-to-apply short-time post-FSP annealing protocols. In this way, mullite-Bi2Fe4O9 is exemplified, for the first time, to be a highly promising O2-evolving photocatalyst, outperforming all so far reported BFO nanocatalysts. Spectroscopic and theoretical data show that the post-FSP annealing allows detailed control of the structural and electronic features of Bismuth-Iron-Oxide nanomaterials, however in a distinct manner for BiFeO3 vs. Bi2Fe4O9. The introduction of Fe2+ centers in BiFeO3 can enhance dramatically the O2 production efficiency via a downshift of the CB and VB edges. For Bi2Fe4O9, short annealing improves O2 evolution, while prolonged annealing is detrimental, via deterioration of its crystallinity.

Supplementary Materials

The following are available online at https://www.mdpi.com/article/10.3390/en14175235/s1, Figure S1: N2 adsorption-desorption isotherms for the materials BFO1(5)-BFO3(120). Figure S2: XRD, Tauc plot, and XPS spectra of the As-Prepared BFO material. Figure S3: Powder XRD patterns for the annealing effect on BFO1 and BFO3 materials. Figure S4: Rietveld analysis of the BFO2 material. Figure S5: TEM size distribution of the materials. Figure S6: Tauc plot for the annealing effect on BFO1 and BFO3 materials. Figure S7: FT-IR for the annealing effect on BFO1 and BFO3 materials. Figure S8: Raman for the annealing effect on BFO1 and BFO3 materials. Figure S9: Fe XPS plots for all the materials. Figure S10: Bi XPS plots for all the materials. Figure S11: O XPS plots for all the materials. Figure S12: XRD and Raman for the photo catalytically reused BFO3(60). Figure S13: O2-photoproduction for Au0, Pt0, Ag0 as electron acceptors for the BFO3(60). Table S1 electronegativity of the materials. Table S2 Literature comparison for the photocatalytic abilities of the materials.

Author Contributions

P.P.: Validation, Investigation, Writing—original draft. M.S.: Validation, Investigation. A.M.: Software, Investigation, Validation. Y.D.: Conceptualization, Writing—review & editing, Supervision. All authors have read and agreed to the published version of the manuscript.

Funding

This research received no external funding.

Institutional Review Board Statement

Not applicable.

Informed Consent Statement

Not applicable.

Data Availability Statement

Not applicable.

Conflicts of Interest

The authors declare that they have no known competing financial interests or personal relationships that could have appeared to influence the work reported in this paper.

References

  1. Zou, Z.; Ye, J.; Sayama, K.; Arakawa, H. Direct splitting of water under visible light irradiation with an oxide semiconductor photocatalyst. Nature 2001, 414, 625–627. [Google Scholar] [CrossRef]
  2. Kubacka, A.; Fernández-García, M.; Colón, G. Advanced Nanoarchitectures for Solar Photocatalytic Applications. Chem. Rev. 2012, 112, 1555–1614. [Google Scholar] [CrossRef]
  3. Di, J.; Chen, C.; Yang, S.-Z.; Ji, M.; Yan, C.; Gu, K.; Xia, J.; Li, H.; Li, S.; Liu, Z. Defect Engineering in Atomically-Thin Bismuth Oxychloride Towards Photocatalytic Oxygen Evolution. J. Mater. Chem. A 2017, 5, 14144–14151. [Google Scholar] [CrossRef]
  4. Kim, T.W.; Choi, K.-S. Nanoporous BiVO4 Photoanodes with Dual-Layer Oxygen Evolution Catalysts for Solar Water Splitting. Science 2014, 343, 990–994. [Google Scholar] [CrossRef]
  5. Yang, J.; Wang, D.; Zhou, X.; Li, C. A Theoretical Study on the Mechanism of Photocatalytic Oxygen Evolution on BiVO4in Aqueous Solution. Chem. Eur. J. 2013, 19, 1320–1326. [Google Scholar] [CrossRef]
  6. Di, J.; Chen, C.; Zhu, C.; Ji, M.; Xia, J.; Yan, C.; Hao, W.; Li, S.; Li, H.; Liu, Z. Bismuth Vacancy Mediated Single Unit Cell Bi2WO6 Nanosheets for Boosting Photocatalytic Oxygen Evolution. Appl. Catal. B Environ. 2018, 238, 119–125. [Google Scholar] [CrossRef]
  7. Papadas, I.; Christodoulides, J.A.; Kioseoglou, G.; Armatas, G.S. A High Surface Area Ordered Mesoporous Bifeo3 Semiconductor with Efficient Water Oxidation Activity. J. Mater. Chem. A 2015, 3, 1587–1593. [Google Scholar] [CrossRef]
  8. Li, S.; Zhang, J.; Kibria, M.G.; Mi, Z.; Chaker, M.; Ma, D.; Nechache, R.; Rosei, F. Remarkably Enhanced Photocatalytic Activity ff Laser Ablated au Nanoparticle Decorated Bifeo3 Nanowires Under Visible-Light. Chem. Commun. 2013, 49, 5856–5858. [Google Scholar] [CrossRef] [PubMed]
  9. Wang, J.; Neaton, J.B.; Zheng, H.; Nagarajan, V.; Ogale, S.B.; Liu, B.; Viehland, D.; Vaithyanathan, V.; Schlom, D.G.; Waghmare, U.V. Epitaxial BiFeO3 Multiferroic Thin Film Heterostructures. Science 2003, 299, 1719–1722. [Google Scholar] [CrossRef] [PubMed]
  10. Ortiz-Quiñonez, J.L.; Díaz, D.; Zumeta-Dubé, I.; Arriola-Santamaría, H.; Betancourt, I.; Santiago-Jacinto, P.; Nava-Etzana, N. Easy Synthesis of High-Purity BiFeO3 Nanoparticles: New Insights Derived from the Structural, Optical, and Magnetic Characterization. Inorg. Chem. 2013, 52, 10306–10317. [Google Scholar] [CrossRef]
  11. Kirsch, A.; Murshed, M.M.; Schowalter, M.; Rosenauer, A.; Gesing, T.M. Nanoparticle Precursor into Polycrystalline Bi2Fe4O9: An Evolutionary Investigation of Structural, Morphological, Optical, and Vibrational Properties. J. Phys. Chem. C 2016, 120, 18831–18840. [Google Scholar] [CrossRef]
  12. Gao, F.; Chen, X.Y.; Yin, K.B.; Dong, S.; Ren, Z.F.; Yuan, F.; Yu, T.; Zou, Z.G.; Liu, J.-M. Visible-Light Photocatalytic Properties of Weak Magnetic BiFeO3 Nanoparticles. Adv. Mater. 2007, 19, 2889–2892. [Google Scholar] [CrossRef]
  13. Lam, S.M.; Sin, J.-C.; Mohamed, A.R. A Newly Emerging Visible Light-Responsive BiFeO3 Perovskite for Photocatalytic Applications: A Mini Review. Mater. Res. Bull. 2017, 90, 15–30. [Google Scholar] [CrossRef]
  14. Zhang, H.; Tong, T.; Chen, J.; Cheng, J. Synthesis and Visible Light Photocatalytic Properties of Bi2Fe4O9 Particles via EDTA-Assisted Sol–Gel Route. J. Sol-Gel Sci. Technol. 2016, 78, 135–143. [Google Scholar] [CrossRef]
  15. Wang, N.; Zhu, L.; Lei, M.; She, Y.; Cao, M.; Tang, H. Ligand-Induced Drastic Enhancement of Catalytic Activity of Nano-BiFeO3 for Oxidative Degradation of Bisphenol A. ACS Catal. 2011, 1, 1193–1202. [Google Scholar] [CrossRef]
  16. Yang, X.; Zhang, Y.; Xu, G.; Wei, X.; Ren, Z.; Shen, G.; Han, G. Phase and Morphology Evolution of Bismuth Ferrites via Hydrothermal Reaction Route. Mater. Res. Bull. 2013, 48, 1694–1699. [Google Scholar] [CrossRef]
  17. Zhang, T.; Shen, Y.; Qiu, Y.; Liu, Y.; Xiong, R.; Shi, J.; Wei, J. Facial Synthesis and Photoreaction Mechanism of BiFeO3/Bi2Fe4O9 Heterojunction Nanofibers. ACS Sustain. Chem. Eng. 2017, 5, 4630–4636. [Google Scholar] [CrossRef]
  18. Humayun, M.; Zada, A.; Li, Z.; Xie, M.; Zhang, X.; Qu, Y.; Raziq, F.; Jing, L. Enhanced Visible-Light Activities of Porous Bifeo3 by Coupling with Nanocrystalline Tio2 and Mechanism. Appl. Catal. B Environ. 2016, 180, 219–226. [Google Scholar] [CrossRef]
  19. Psathas, P.; Georgiou, Y.; Moularas, C.; Armatas, G.S.; Deligiannakis, Y. Controlled-Phase Synthesis of Bi2Fe4O9 & BiFeO3 by Flame Spray Pyrolysis and Their Evaluation as Non-Noble Metal Catalysts for Efficient Reduction of 4-Nitrophenol. Powder Technol. 2020, 368, 268–277. [Google Scholar] [CrossRef]
  20. Madler, L.; Kammler, H.K.; Mueller, R.; Pratsinis, S.E. Controlled Synthesis of Nanostructured Particles by Ame Spray Pyrolysis. J. Aerosol Sci. 2002, 33, 369–389. [Google Scholar] [CrossRef]
  21. Teoh, W.Y.; Amal, R.; Mädler, L. Flame Spray Pyrolysis: An Enabling Technology for Nanoparticles Design and Fabrication. Nanoscale 2010, 2, 1324–1347. [Google Scholar] [CrossRef]
  22. Palai, R.; Katiyar, R.S.; Schmid, H.; Tissot, P.; Clark, S.J.; Robertson, J.; Redfern, S.A.T.; Catalan, G.; Scott, J.F. βphase Andγ−Βmetal-Insulator Transition in Multiferroicbifeo3. Phys. Rev. B 2008, 77. [Google Scholar] [CrossRef] [Green Version]
  23. Palewicz, A.; Przenioslo, R.; Sosnowska, I.; Hewat, A.W. Atomic Displacements in Bifeo3 as a Function of Temperature: Neutron Diffraction Study. Acta Crystallogr. Sect. B Struct. Sci. 2007, 63, 537–544. [Google Scholar] [CrossRef]
  24. Jain, A.; Ong, S.P.; Hautier, G.; Chen, W.; Richards, W.D.; Dacek, S.; Cholia, S.; Gunter, D.; Skinner, D.; Ceder, G.; et al. Commentary: The Materials Project: A Materials Genome Approach to Accelerating Materials Innovation. APL Mater. 2013, 1. [Google Scholar] [CrossRef] [Green Version]
  25. Giannozzi, P.; Baroni, S.; Bonini, N.; Calandra, M.; Car, R.; Cavazzoni, C.; Ceresoli, D.; Chiarotti, G.L.; Cococcioni, M.; Dabo, I.; et al. QUANTUM ESPRESSO: A Modular and Open-Source Software Project for Quantum Simulations of Materials. J. Phys. Condens. Matter 2009, 21. [Google Scholar] [CrossRef] [PubMed]
  26. Cococcioni, M.; de Gironcoli, S. Linear Response Approach to the Calculation of the Effective Interaction Parameters in Thelda+Umethod. Phys. Rev. B Condens. Matter Mater. Phys. 2005, 71. [Google Scholar] [CrossRef] [Green Version]
  27. Kanigaridou, Y.; Petala, A.; Frontistis, Z.; Antonopoulou, M.; Solakidou, M.; Konstantinou, I.; Deligiannakis, Y.; Mantzavinos, D.; Kondarides, D.I. Solar Photocatalytic Degradation of Bisphenol a with CuOx/BiVO4: Insights into the Unexpectedly Favorable Effect of Bicarbonates. Chem. Eng. J. 2017, 318, 39–49. [Google Scholar] [CrossRef]
  28. Solakidou, M.; Georgiou, Y.; Deligiannakis, Y. Double-Nozzle Flame Spray Pyrolysis as a Potent Technology to Engineer Noble Metal-TiO2 Nanophotocatalysts for Efficient H2 Production. Energies 2021, 14, 817. [Google Scholar] [CrossRef]
  29. Moreau, J.M.; Michel, C.; Gerson, R.; James, W.J. Ferroelectric BiFeO3 X-ray and Neutron Diffraction Study. J. Phys. Chem. Solids 1971, 32, 1315–1320. [Google Scholar] [CrossRef]
  30. Moularas, C.; Georgiou, Y.; Adamska, K.; Deligiannakis, Y. Thermoplasmonic Heat Generation Efficiency by Nonmonodisperse Core–Shell Ag0@SiO2 Nanoparticle Ensemble. J. Phys. Chem. C 2019, 123, 22499–22510. [Google Scholar] [CrossRef]
  31. Shamir, N.; Gurewitz, E.; Shaked, H. The magnetic structure of Bi2Fe4O9– analysis of neutron diffraction measurements. Acta Crystallogr. Sect. 1978, 34, 662–666. [Google Scholar] [CrossRef] [Green Version]
  32. Sowmya, N.S.; Srinivas, A.; Suresh, P.; Shukla, A.; Kamat, S.V. Synthesis and Study of Structural, Magnetic and Microwave Absorption Properties in Multiferroic Bifeo3 Electroceramic. J. Mater. Sci. Mater. Electron. 2015, 26, 5368–5372. [Google Scholar] [CrossRef]
  33. Kho, Y.K.; Teoh, W.Y.; Iwase, A.; Mädler, L.; Kudo, A.; Amal, R. Flame Preparation of Visible-Light-Responsive BiVO4 Oxygen Evolution Photocatalysts with Subsequent Activation via Aqueous Route. ACS Appl. Mater. Interfaces 2011, 3, 1997–2004. [Google Scholar] [CrossRef] [PubMed]
  34. Tauc, J.; Grigorovici, R.; Vancu, A. Optical Properties and Electronic Structure of Amorphous Germanium. Phys. Status Solidi 1966, 15, 627–637. [Google Scholar] [CrossRef]
  35. Deligiannakis, Y. Nanomaterials for Environmental Solar Energy Technologies: Applications & Limitations. KONA Powder Part. J. 2018, 35, 14–31. [Google Scholar] [CrossRef] [Green Version]
  36. Zhang, Q.; Gong, W.; Wang, J.; Ning, X.; Wang, Z.; Zhao, X.; Ren, W.; Zhang, Z. Size-Dependent Magnetic, Photoabsorbing, and Photocatalytic Properties of Single-Crystalline Bi2Fe4O9 Semiconductor Nanocrystals. J. Phys. Chem. C 2011, 115, 25241–25246. [Google Scholar] [CrossRef]
  37. Sun, S.; Wang, W.; Zhang, L.; Shang, M. Visible Light-Induced Photocatalytic Oxidation of Phenol and Aqueous Ammonia in Flowerlike Bi2Fe4O9 Suspensions. J. Phys. Chem. C 2009, 113, 12826–12831. [Google Scholar] [CrossRef]
  38. Srivastav, S.K.; Gajbhiye, N.S. Low Temperature Synthesis, Structural, Optical and Magnetic Properties of Bismuth Ferrite Nanoparticles. J. Am. Ceram. Soc. 2012, 95, 3678–3682. [Google Scholar] [CrossRef]
  39. Kaczmarek, W.; Graja, A. Lattice Dynamics Study of the Solid Solution (Bi1−xLax) FeO3 by i.r. Spectroscopy. Solid State Commun. 1975, 17, 851–853. [Google Scholar] [CrossRef]
  40. Voll, D.; Beran, A.; Schneider, H. Variation of Infrared Absorption Spectra in the System Bi2Al4−xFexO9 (x = 0–4), Structurally Related to Mullite. Phys. Chem. Miner. 2006, 33, 623–628. [Google Scholar] [CrossRef]
  41. Zhao, J.; Liu, T.; Xu, Y.; He, Y.; Chen, W. Synthesis and Characterization of Bi2Fe4O9 Powders. Mater. Chem. Phys. 2011, 128, 388–391. [Google Scholar] [CrossRef]
  42. Fujiwara, K.; Deligiannakis, Y.; Skoutelis, C.G.; Pratsinis, S.E. Visible-Light Active Black TiO2-Ag/TiOx Particles. Appl. Catal. B Environ. 2014, 154–155, 9–15. [Google Scholar] [CrossRef]
  43. Arora, M.; Sati, P.C.; Chauhan, S.; Chhoker, S.; Panwar, A.K.; Kumar, M. Structural, Optical and Multiferroic Properties of BiFeO3 Nanoparticles Synthesized by Soft Chemical Route. J. Supercond. Nov. Magn. 2013, 26, 443–448. [Google Scholar] [CrossRef]
  44. Yang, Y.; Sun, J.Y.; Zhu, K.; Liu, Y.L.; Chen, J.; Xing, X.R. Raman Study of BiFeO3 with Different Excitation Wavelengths. Phys. B Condens. Matter 2009, 404, 171–174. [Google Scholar] [CrossRef]
  45. Iliev, M.N.; Litvinchuk, A.P.; Hadjiev, V.G.; Gospodinov, M.M.; Skumryev, V.; Ressouche, E. Phonon and Magnon Scattering of Antiferromagnetic Bi2Fe4O9. Phys. Rev. B 2010, 81. [Google Scholar] [CrossRef] [Green Version]
  46. Grosvenor, A.P.; Kobe, B.A.; Biesinger, M.C.; McIntyre, N.S. Investigation of Multiplet Splitting of Fe 2p XPS Spectra and Bonding in Iron Compounds. Surf. Interface Anal. 2004, 36, 1564–1574. [Google Scholar] [CrossRef]
  47. Yamashita, T.; Hayes, P. Analysis of XPS Spectra of Fe2+ and Fe3+ Ions in Oxide Materials. Appl. Surf. Sci. 2008, 254, 2441–2449. [Google Scholar] [CrossRef]
  48. Biesinger, M.C.; Payne, B.P.; Grosvenor, A.P.; Lau, L.W.M.; Gerson, A.R.; Smart, R.S.C. Resolving Surface Chemical States in XPS Analysis of First Row Transition Metals, Oxides and Hydroxides: Cr, Mn, Fe, Co and Ni. Appl. Surf. Sci. 2011, 257, 2717–2730. [Google Scholar] [CrossRef]
  49. Dharmadhikari, V.S.; Sainkar, S.R.; Badrinarayan, S.; Goswami, A. Characterisation of Thin Films of Bismuth Oxide by X-ray Photoelectron Spectroscopy. J. Electron Spectrosc. Relat. Phenom. 1982, 25, 181–189. [Google Scholar] [CrossRef]
  50. Wang, P.W.; Guttag, M.; Tu, C.-S. Surface Modification of Multiferroic BiFeO3 Ceramic by Argon Sputtering. J. Surf. Eng. Mater. Adv. Technol. 2014, 04, 295–308. [Google Scholar] [CrossRef] [Green Version]
  51. Baraneedharan, P.; Hussain, S.I.; Dinesh, V.P.; Siva, C.; Biji, P.; Sivakumar, M. Lattice Soped Zn–SnO2 Nanospheres: A Systematic Exploration of Dopant Ion Effects on Structural, Optical, and Enhanced Gas Sensing Properties. Appl. Surf. Sci. 2015, 357, 1511–1521. [Google Scholar] [CrossRef]
  52. He, J.; Guo, R.; Fang, L.; Dong, W.; Zheng, F.; Shen, M. Characterization and Visible Light Photocatalytic Mechanism of Size-Controlled BiFeO3 Nanoparticles. Mater. Res. Bull. 2013, 48, 3017–3024. [Google Scholar] [CrossRef]
  53. Wang, X.; Zhang, M.; Tian, P.; Chin, W.S.; Zhang, C.M. A Facile Approach to Pure-Phase Bi2Fe4O9 Nanoparticles Sensitive to Visible Light. Appl. Surf. Sci. 2014, 321, 144–149. [Google Scholar] [CrossRef]
  54. Primo, A.; Marino, T.; Corma, A.; Molinari, R.; García, H. Efficient Visible-Light Photocatalytic Water Splitting by Minute Amounts of Gold Supported on Nanoparticulate CeO2Obtained by a Biopolymer Templating Method. J. Am. Chem. Soc. 2011, 133, 6930–6933. [Google Scholar] [CrossRef]
  55. Konta, R.; Ishii, T.; Kato, H.; Kudo, A. Photocatalytic Activities of Noble Metal Ion Doped SrTiO3 under Visible Light Irradiation. J. Phys. Chem. B 2004, 108, 8992–8995. [Google Scholar] [CrossRef]
  56. Li, R.; Zhang, F.; Wang, D.; Yang, J.; Li, M.; Zhu, J.; Zhou, X.; Han, H.; Li, C. Spatial Separation of Photogenerated Electrons and Holes Among {010} And {110} Crystal Facets of BiVO4. Nat. Commun. 2013, 4. [Google Scholar] [CrossRef] [PubMed] [Green Version]
  57. Brezova, V.; Dvoranova, D.; Stasko, A. Characterization of Titanium Dioxide Photoactivity Following the Formation of Radicals by EPR Spectroscopy. Res. Chem. Intermed. 2007, 33, 251–268. [Google Scholar] [CrossRef]
  58. Rosen, G.M.; Rauckman, E.J. Spin Trapping of the Primary Radical Involved in the Activation of the Carcinogen N-Hydroxy-2-Acetylaminofluorene by Cumene Hydroperoxide-Hematin. Mol. Pharmacol. 1980, 17, 233–238. [Google Scholar] [PubMed]
  59. Hölzl, J.; Schulte, F.K. Work Function of Metals. In Solid Surface Physics; Hölzl, J., Schulte, F.K., Wagner, H., Eds.; Springer: Berlin/Heidelberg, Germany, 1979; pp. 1–150. [Google Scholar] [CrossRef]
  60. Kaur, J.; Singh, R.; Pal, B. Influence of Coinage and Platinum Group Metal Co-Catalysis for the Photocatalytic Reduction of M-Dinitrobenzene by P25 and Rutile TiO2. J. Mol. Catal. A: Chem. 2015, 397, 99–105. [Google Scholar] [CrossRef]
  61. H’mŏk, H.L.; Aguilar, E.M.; García, J.A.; Ariño, J.R.; Mestres, L.; Alemany, P.; Galván, D.H.; Beltrones, J.M.S.; Herrera, O.R. Theoretical Justification of Stable Ferromagnetism in Ferroelectric BiFeO3 by First-Principles. Comput. Mater. Sci. 2019, 164, 66–73. [Google Scholar] [CrossRef]
  62. Clark, S.J.; Robertson, J. Energy Levels of Oxygen Vacancies in BiFeO3 by Screened Exchange. Appl. Phys. Lett. 2009, 94. [Google Scholar] [CrossRef] [Green Version]
Figure 1. (A) XRD patterns for the BFO1(5), BFO2(60), BFO3(60) materials. The reference Miller-planes’ reflections for BiFeO3 and Bi2Fe4O9 phases are shown in the graph’s top. (B) TEM images, (C) Percentage of crystalline phases, and SSA for the various annealing protocols (see details in Table 1).
Energies 14 05235 g001
Figure 2. (A) DRS-UV/Vis spectra of the BFO materials. Inset: the BFO3(60) powder color. (B) The Tauc plot for each material, with the tangential dashed lines marking the estimated band-gap.
Energies 14 05235 g002
Figure 3. (A) FT-IR spectra for BFO materials in the range 400 to 4000 cm−1. Inset: zoom into the hydrocarbon’s region. (B) Raman spectra for BFO materials. In both graphs, characteristic peaks that differentiate the two phases BiFeO3 and Bi2Fe4O9 are marked with dashed lines.
Energies 14 05235 g003
Figure 4. Fe-XPS spectra of (A) the BFO1(5), (B) BFO2(60), and (C) BFO3(60) materials, with the corresponding fitted Fe3+2p3/2, Fe3+2p1/2, and the Fe2+2p3/2, Fe2+2p1/2 peaks.
Energies 14 05235 g004
Figure 5. (A) Kinetics of photocatalytic O2 production by the BFO photocatalysts. Inset, Reuse study of the BFO3(60) photocatalyst. (B) The photocatalytic O2-production per h, for all the studied BFO. (C) a reaction scheme of the photocatalytic reaction process.
Energies 14 05235 g005
Figure 6. (A) EPR spectra of photogenerated OH-radicals for the three best-performing BFO materials. The detected EPR signals correspond to DMPOX states which is a result of two OH trapped per DMPO molecule. (B) Quantitative OH-production per gram of photocatalyst.
Energies 14 05235 g006
Figure 7. (A) Theoretical energy band-structure and DOS of BiFeO3. (B) DOS for {Fe2+}BiFeO3 (red lines) vs. BiFeO3 (black lines). (C) Theoretical energy band-structure and DOS of ferromagnetic Bi2Fe4O9.
Energies 14 05235 g007
Table 1. Structural Characteristics of the present FSP-made BFO materials.
PhotocatalystAnnealing T/Time (℃)/(Min)%Crystalline Phase FractionCrystallite Size (nm)SSA (m2 g−1)Total Pore Volume (cm3 g−1)Band Gap Eg (eV)
BiFeO3Bi2Fe4O9dBETdTEM
BFO1(5)550/51000485514.14.01 × 10−22.1
BFO1(30)550/30100064-12.12.83 × 10−22.1
BFO1(60)550/60100067-10.72.81 × 10−22.1
BFO2(60)625/605248751309.52.11 × 10−22.08
BFO3(60)700/6001002682402.70.56 × 10−22.05/1.55
BFO3(120)700/1200100336-2.10.46 × 10−22.05/1.55
Publisher’s Note: MDPI stays neutral with regard to jurisdictional claims in published maps and institutional affiliations.

