
Quantitative Evaluation Methods of Cluster Wind Power Output Volatility and Source-Load Timing Matching in Regional Power Grid

Abstract
:1. Introduction
- (1)
- The smoothing coefficient based on standard deviation ignores the volatility continuity of the wind power output time series, and the smoothing coefficient based on the volatility confidence interval is not suitable for small sample data scenarios of wind power output, which cannot accurately reflect the smoothing effect of cluster wind power output in some cases.
- (2)
- The load tracking coefficient ignores the influence of wind power permeability on the timing matching degree of wind power output and load, which cannot accurately characterize the difference in timing matching degree between wind power output and grid load under different wind power permeability and the influence degree on grid load.
- (1)
- The volatility-based smoothing coefficient of wind farm cluster power output is defined. The proposed volatility-based smoothing coefficient can accurately represent the smoothing effect of wind farm cluster power output, which not only can maintain the volatility continuity of wind power output time series, but is also unaffected by the data sample size.
- (2)
- The timing matching degree evaluation indicator and its formula of regional wind power output and load considering permeability are proposed. The proposed source-load timing matching coefficient can accurately characterize the difference in the timing matching degree between wind power output and grid load under different wind power permeability and the influence degree on grid load.
- (3)
- The exponential function model of volatility-based smoothing coefficient and source-load timing matching coefficient is established. The exponential function model depicts the quantitative relationship between the volatility smoothing effect of wind farm cluster power output and source-load timing matching degree, which makes up for the deficiency of simple qualitative analysis in previous studies.
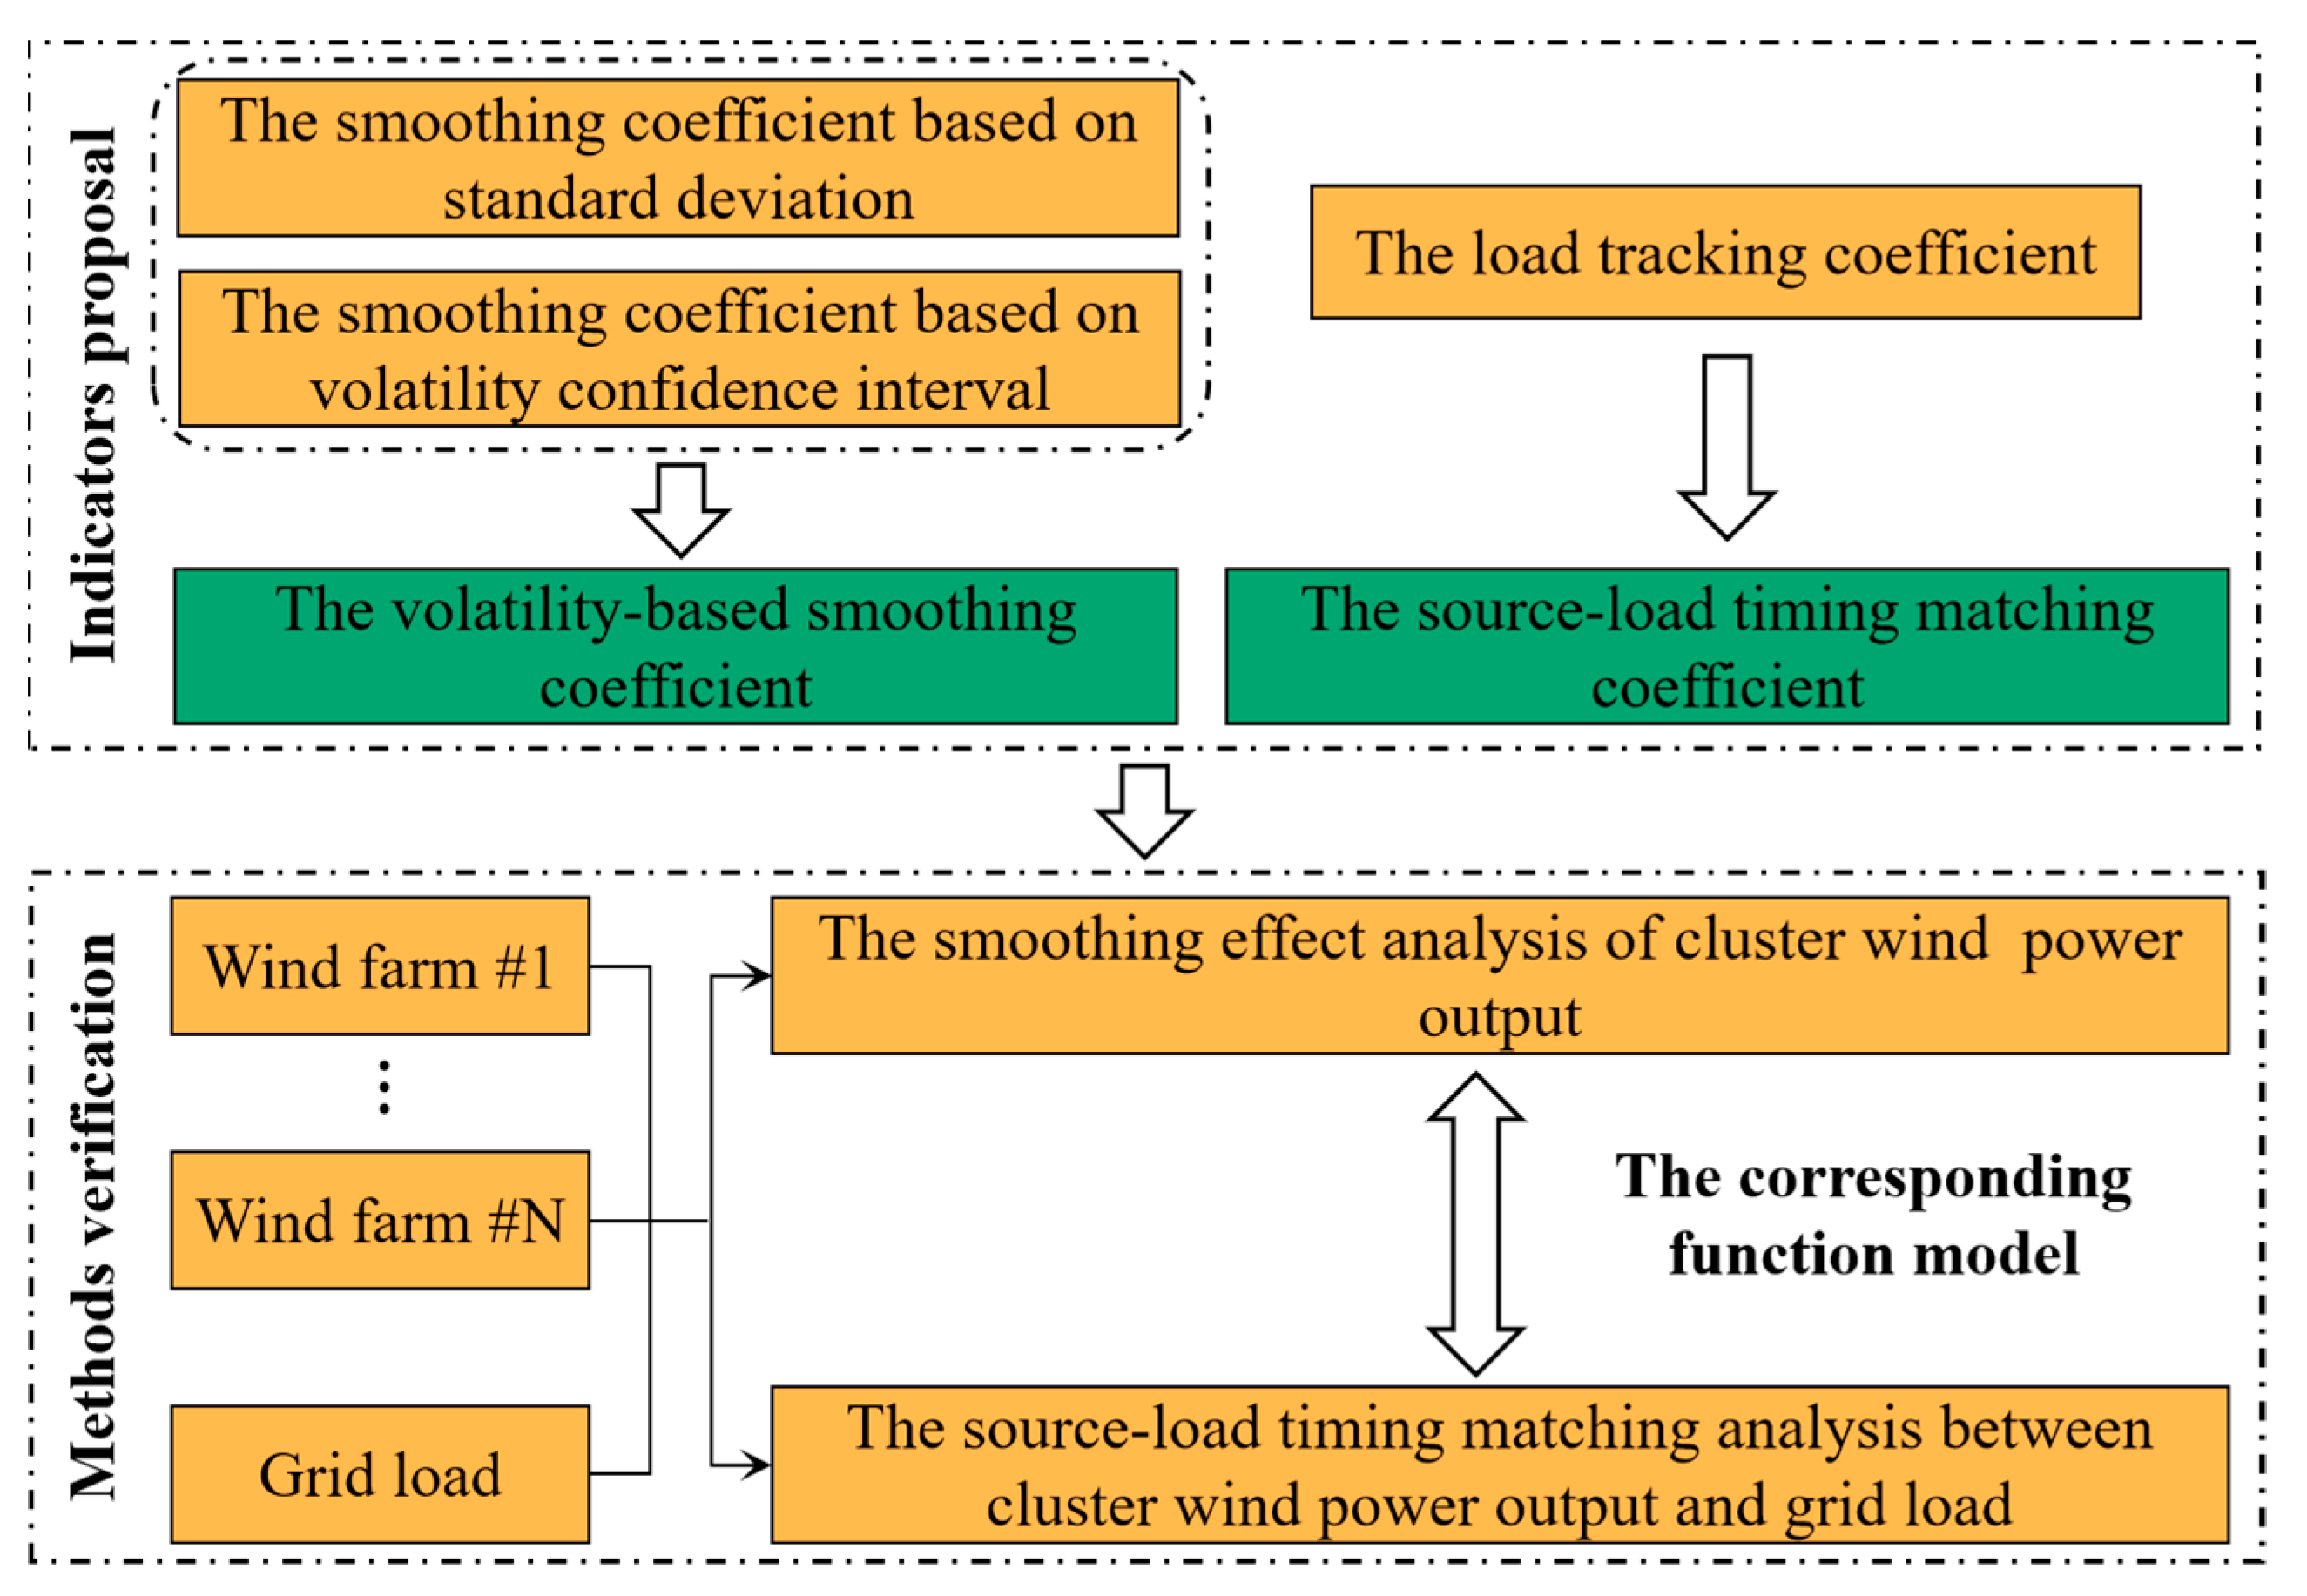
2. The Basic Idea
3. The Smoothing Effect of Cluster Wind Power Output and Its Evaluation Indicator
3.1. The Smoothing Effect of Cluster Wind Power Output
3.2. The Existing Smoothing Effect Evaluation Indicators and Their Deficiencies
- (1)
- The smoothing coefficient based on standard deviation
- (2)
- The smoothing coefficient based on volatility confidence interval
3.3. The Volatility-Based Smoothing Coefficient
4. The Timing Matching Degree Evaluation Indicator of Wind Power Output and Grid Load
4.1. The Existing Source-Load Timing Matching Degree Evaluation Indicator and Its Deficiencies
4.2. The Source-Load Timing Matching Coefficient
5. Case Study
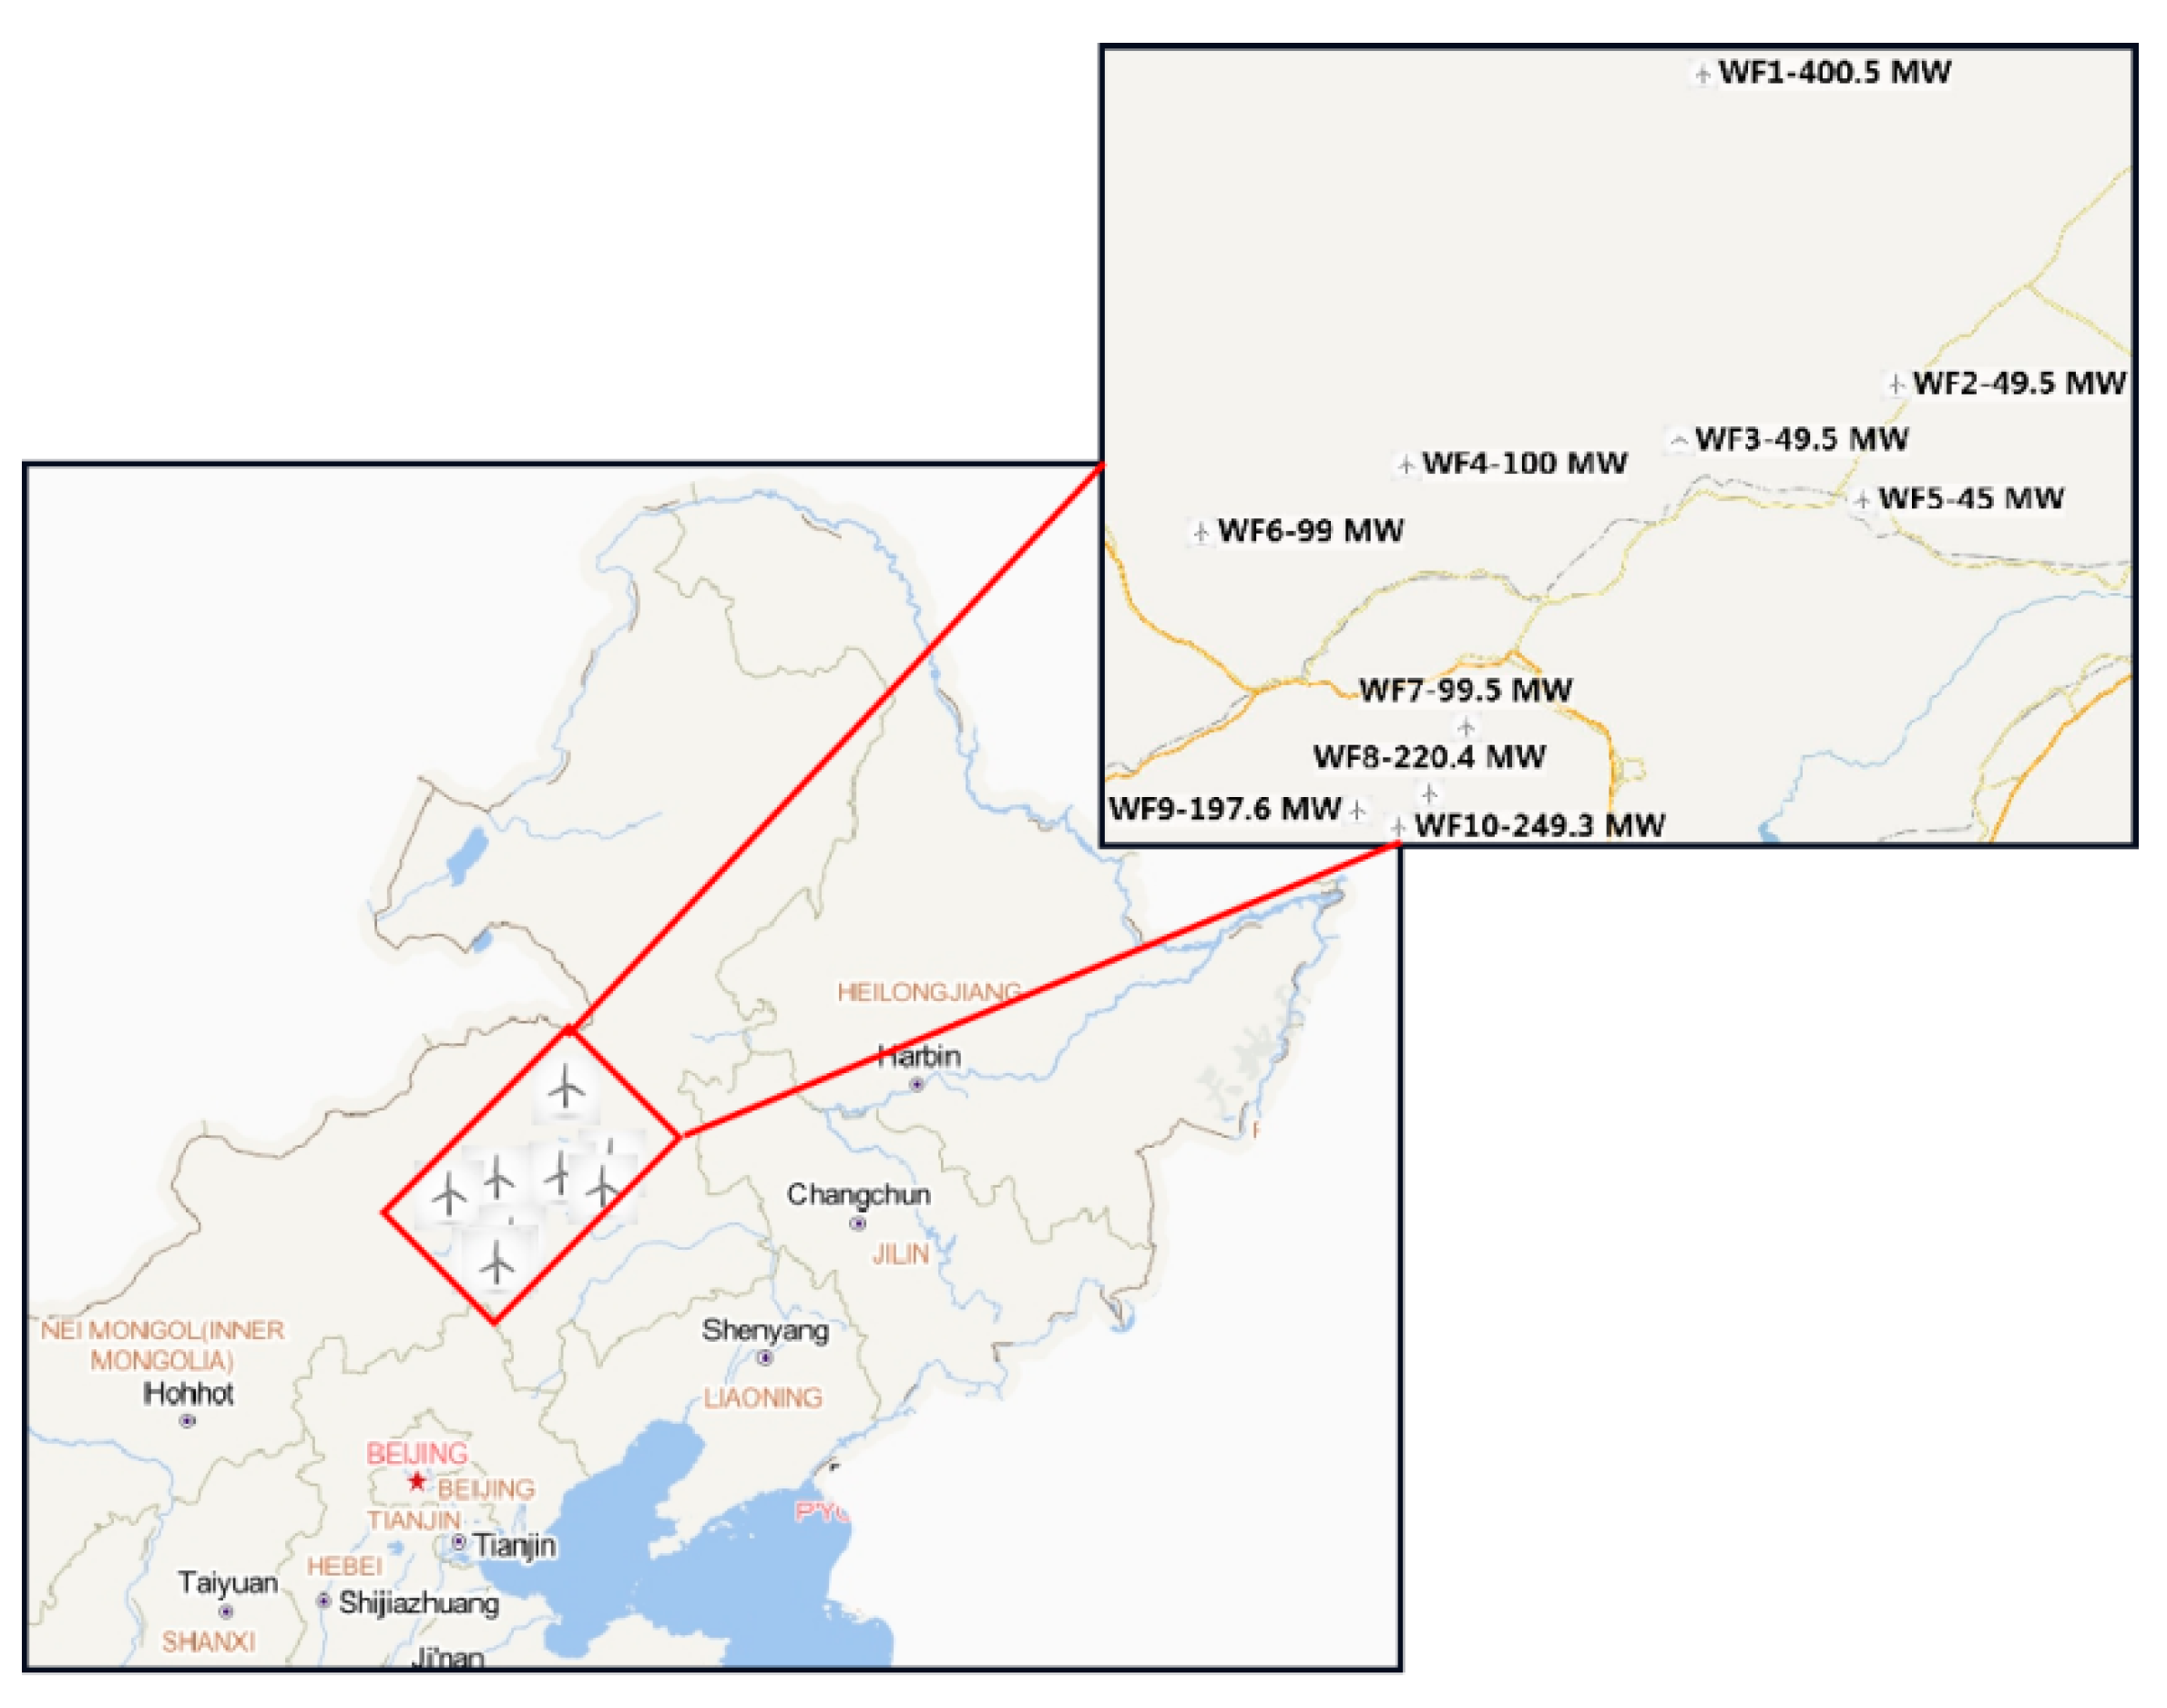
5.1. Data
5.2. Results
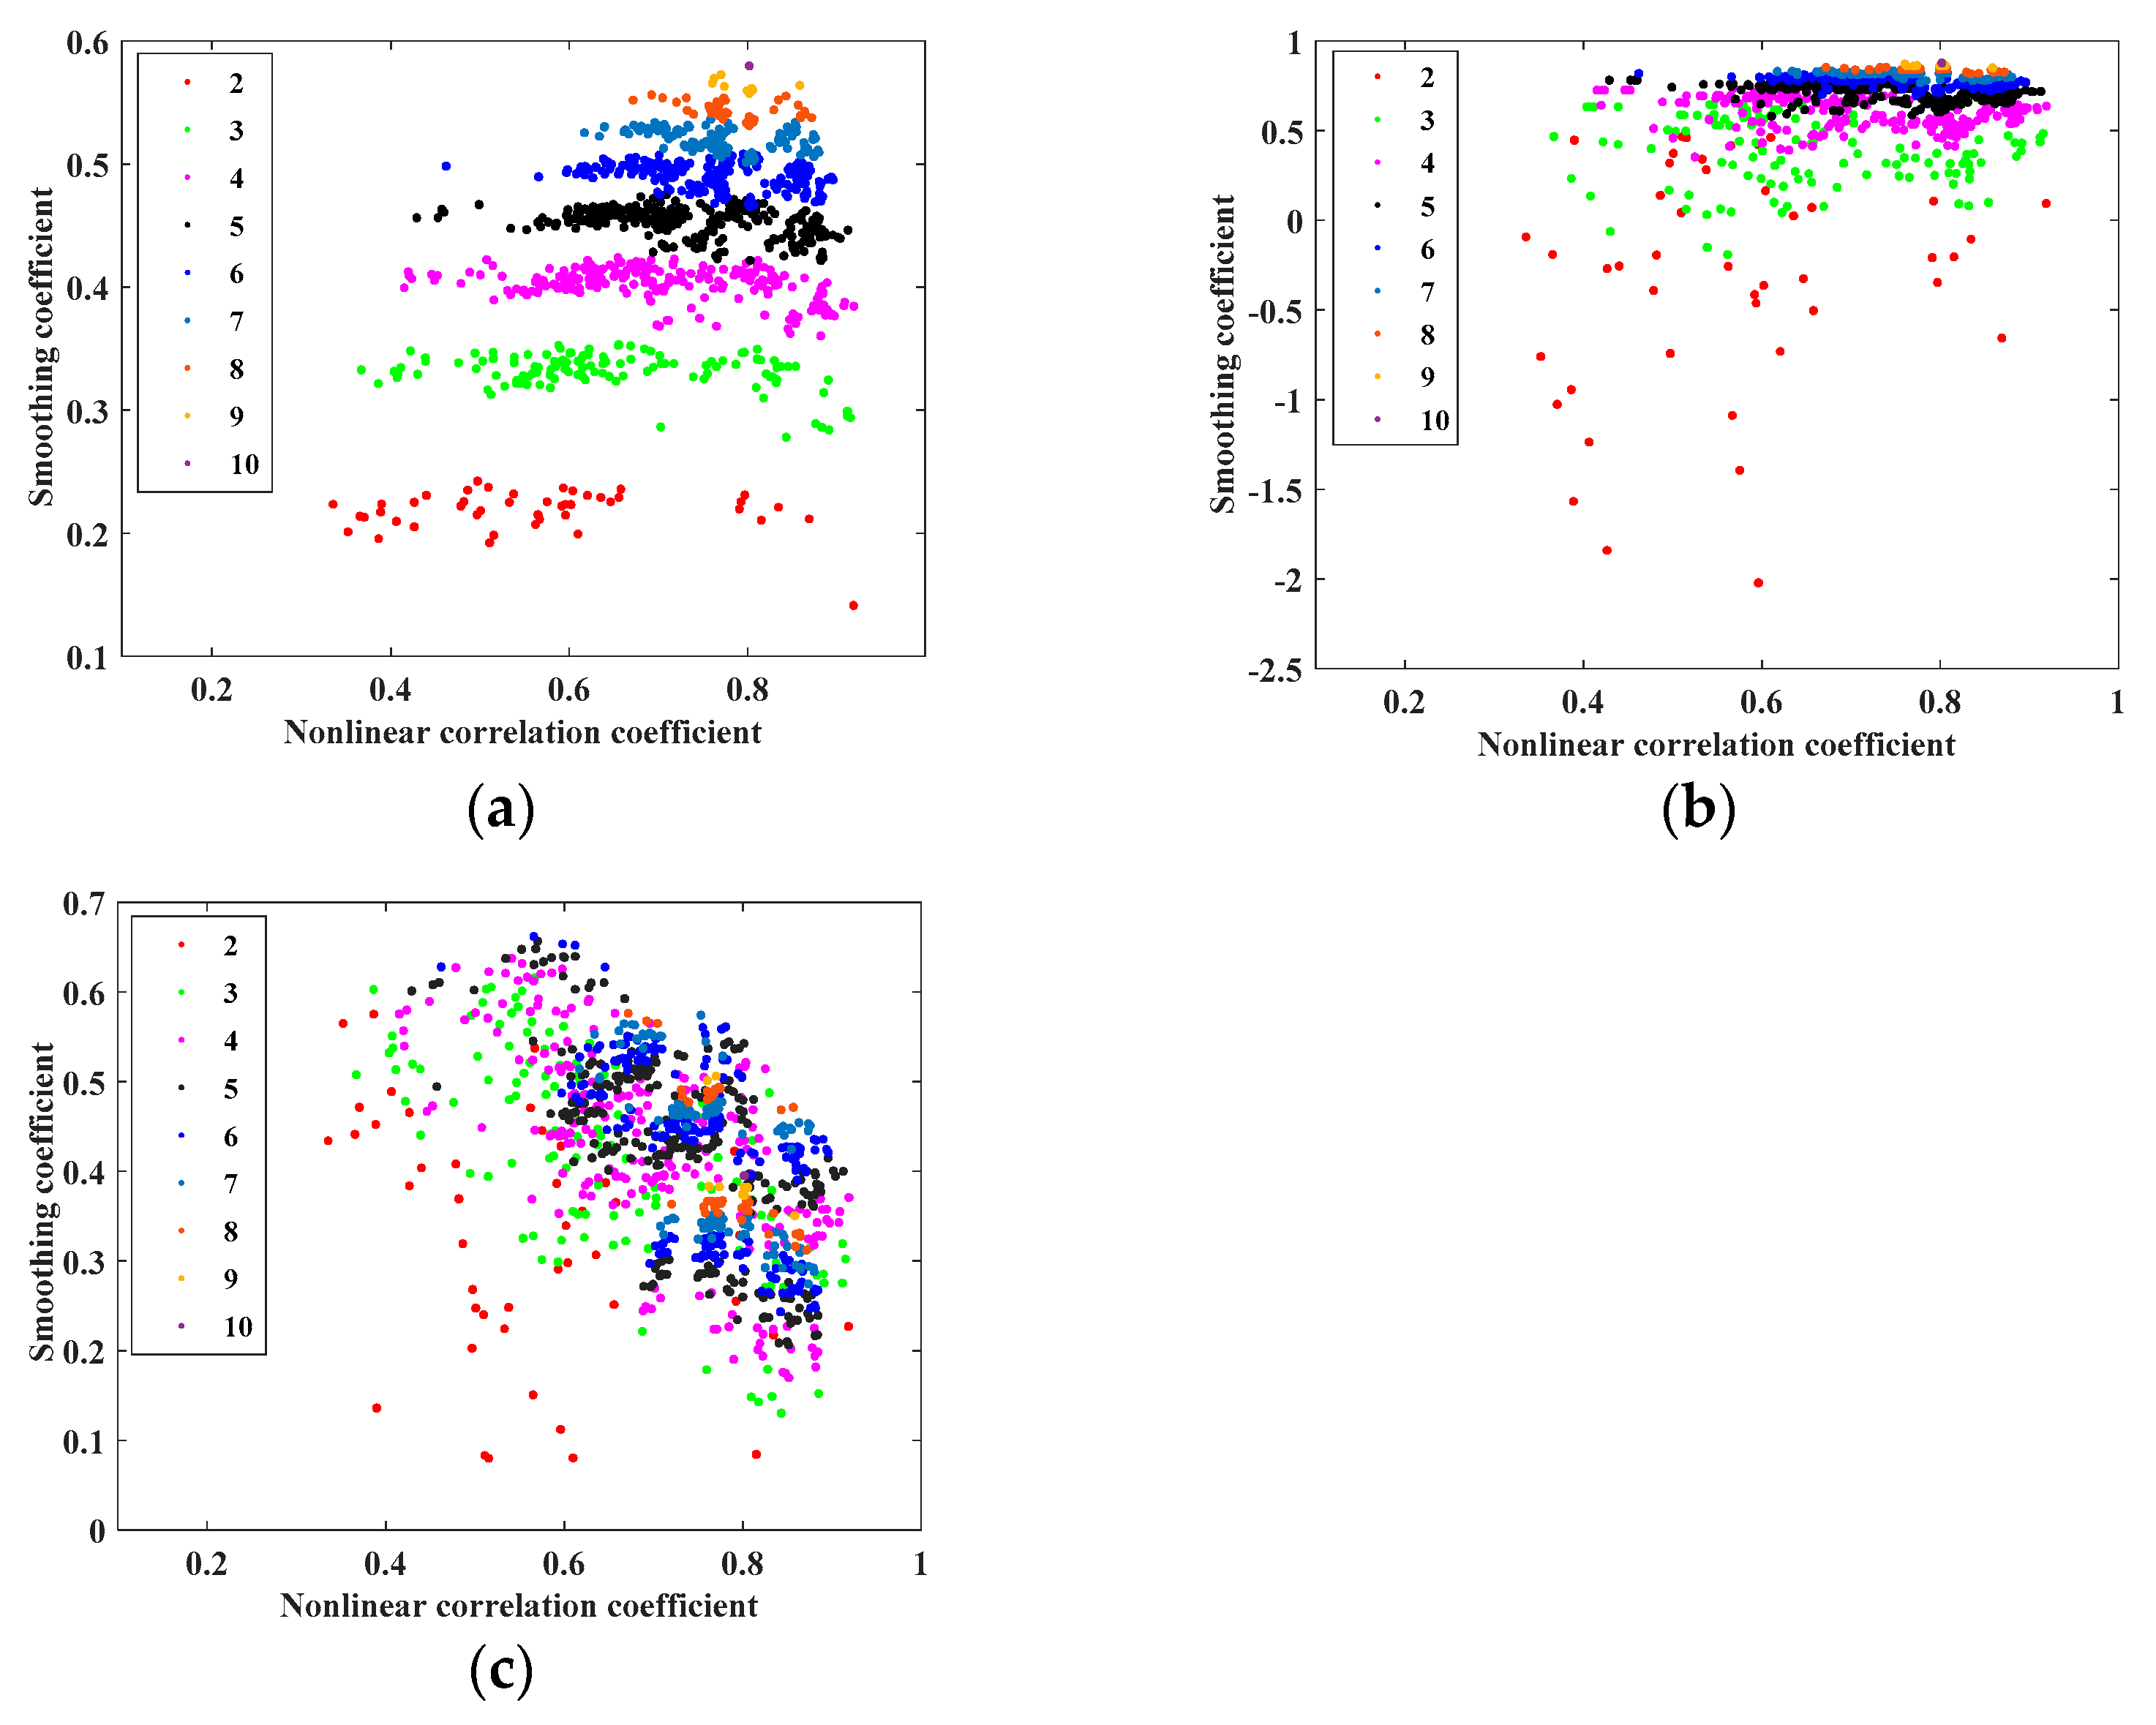
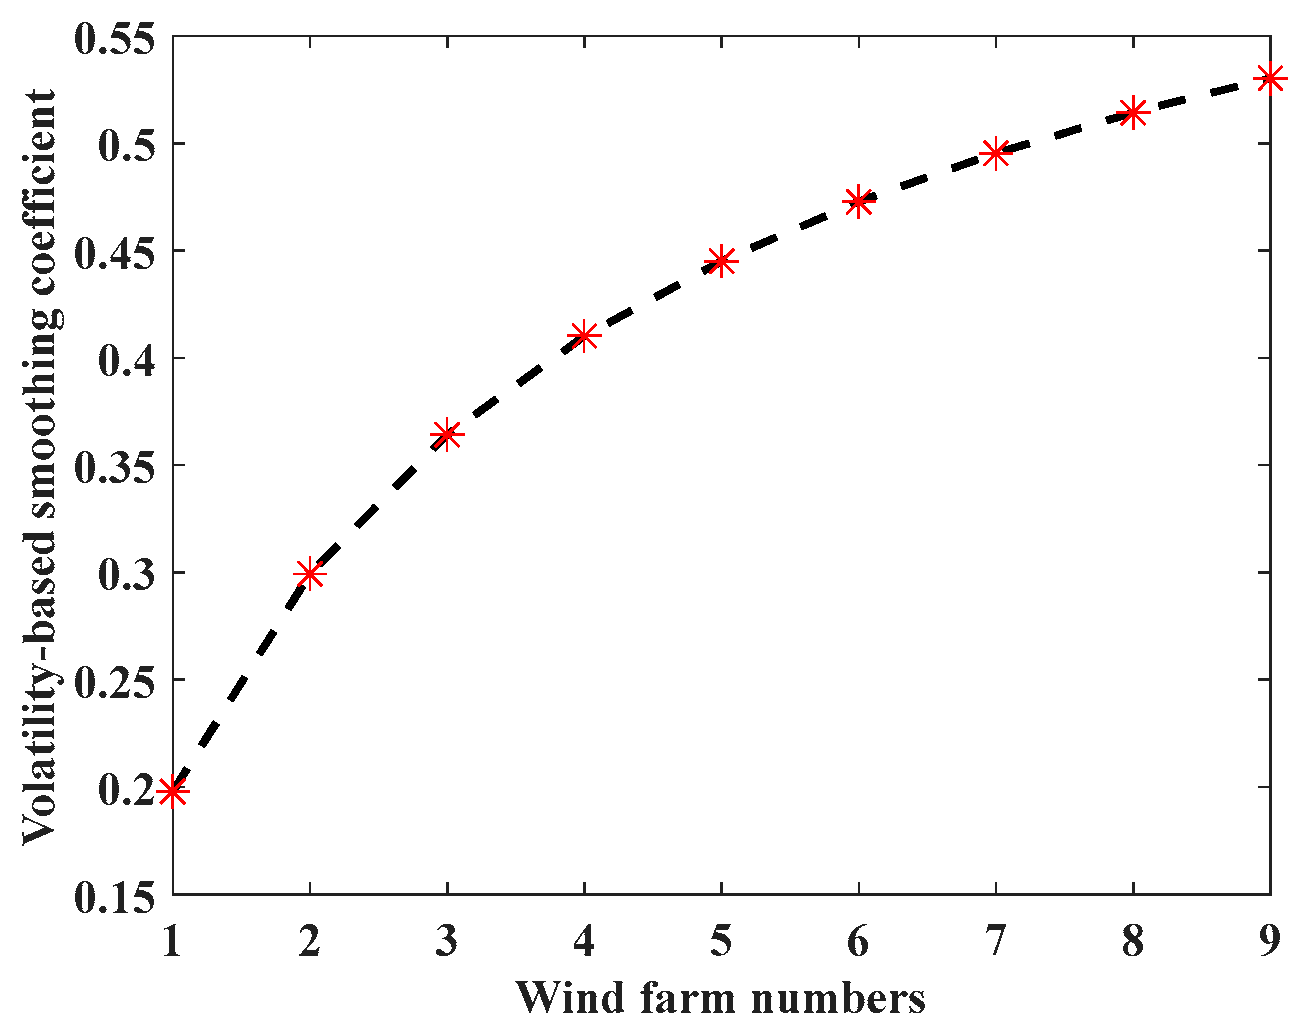
5.2.1. The Smoothing Effect Analysis of Wind Farm Cluster Power Output
5.2.2. The Source-Load Timing Matching Degree Analysis
6. Conclusions
- (1)
- The volatility-based smoothing coefficient can accurately represent the smoothing effect of wind farm cluster power output, which not only can maintain the volatility continuity of wind power output time series, but also is not affected by the data sample size. The volatility-based smoothing coefficient presents a double exponential growth feature with the increase of wind farm numbers, and the specific coefficients are determined by locations and wind conditions of wind farms.
- (2)
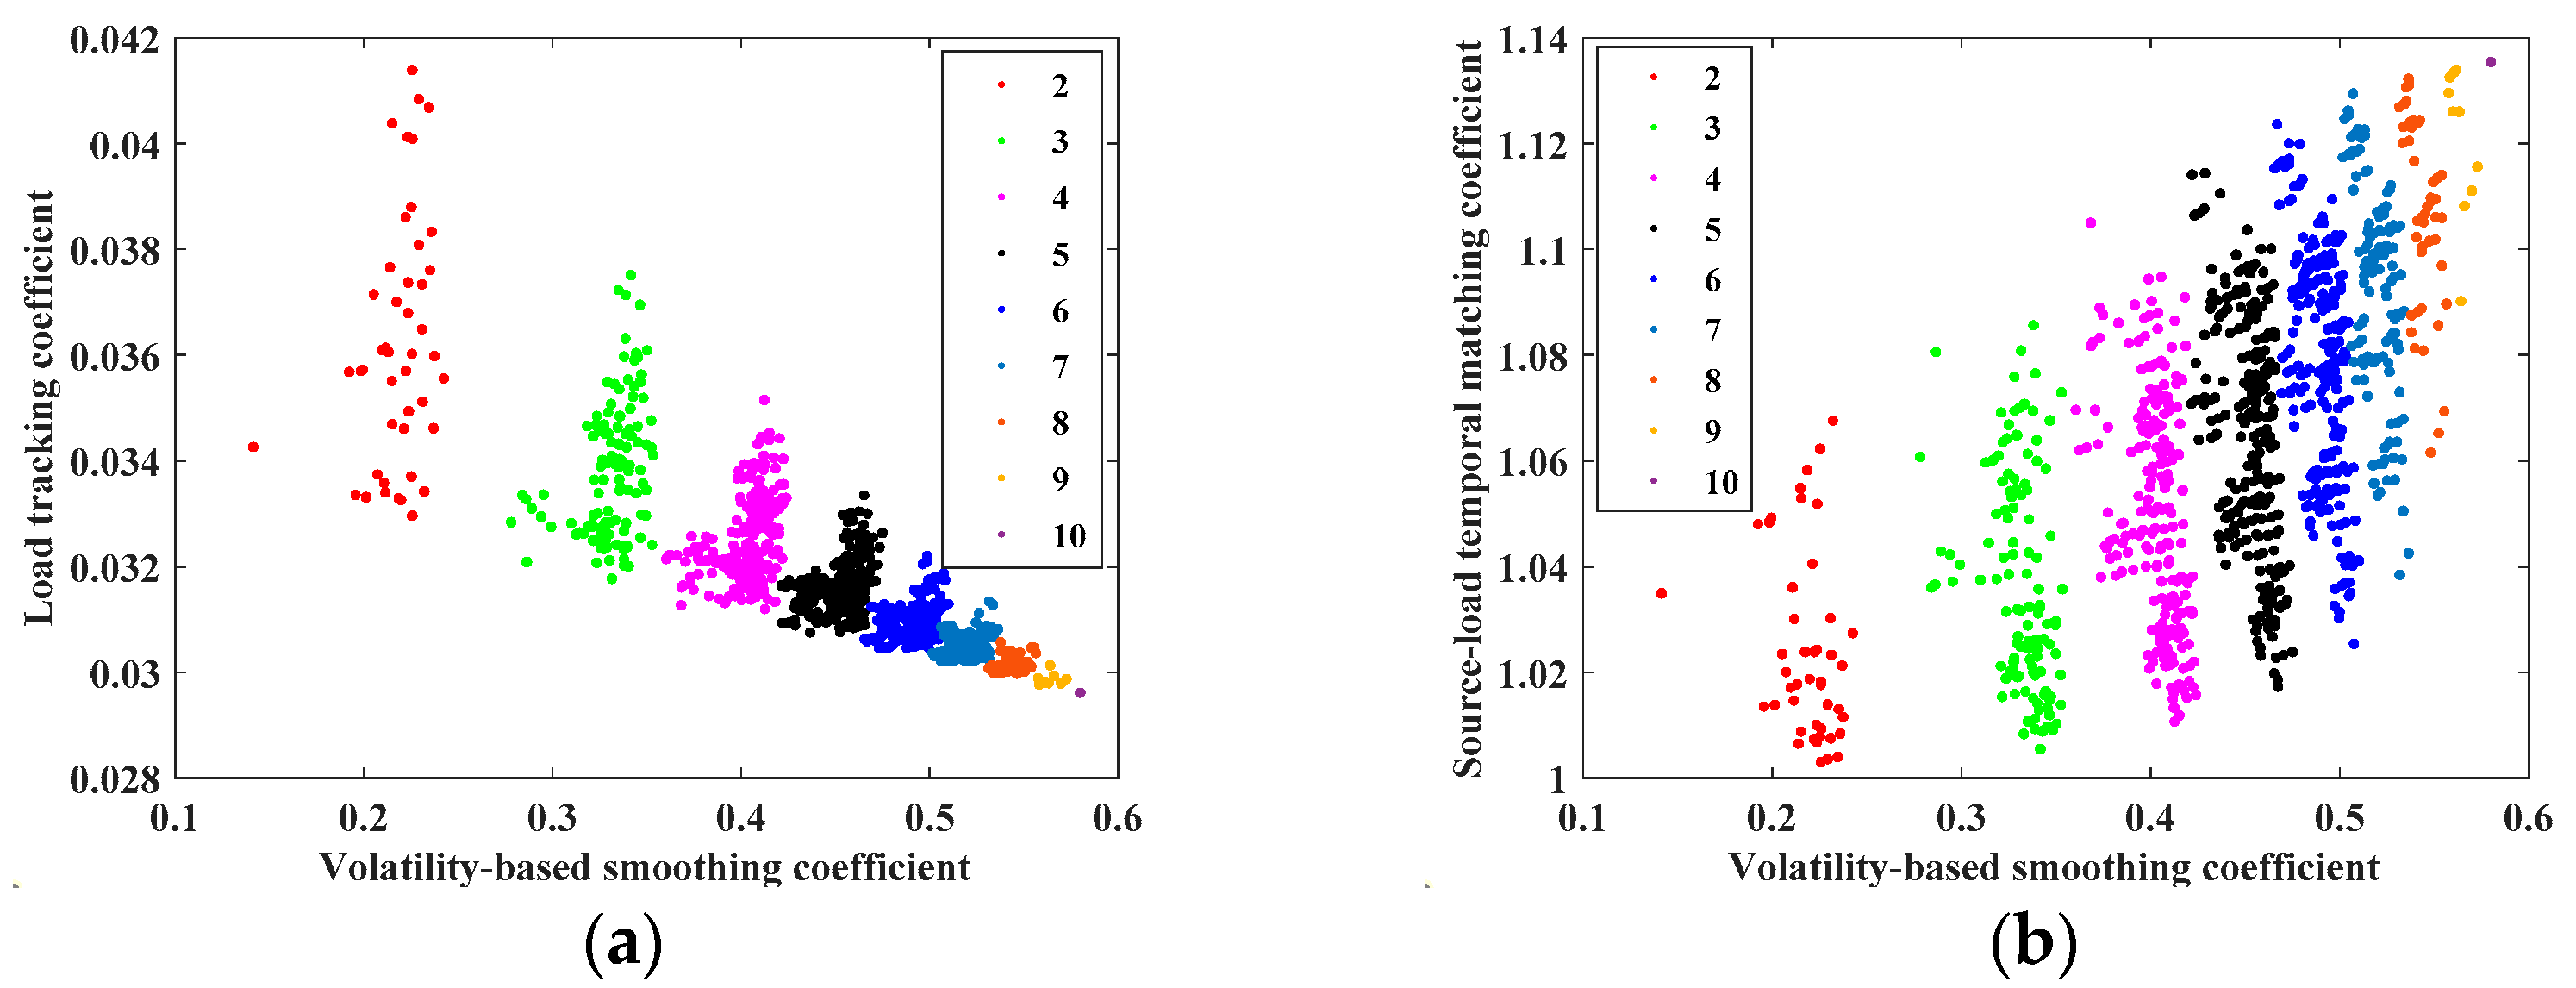
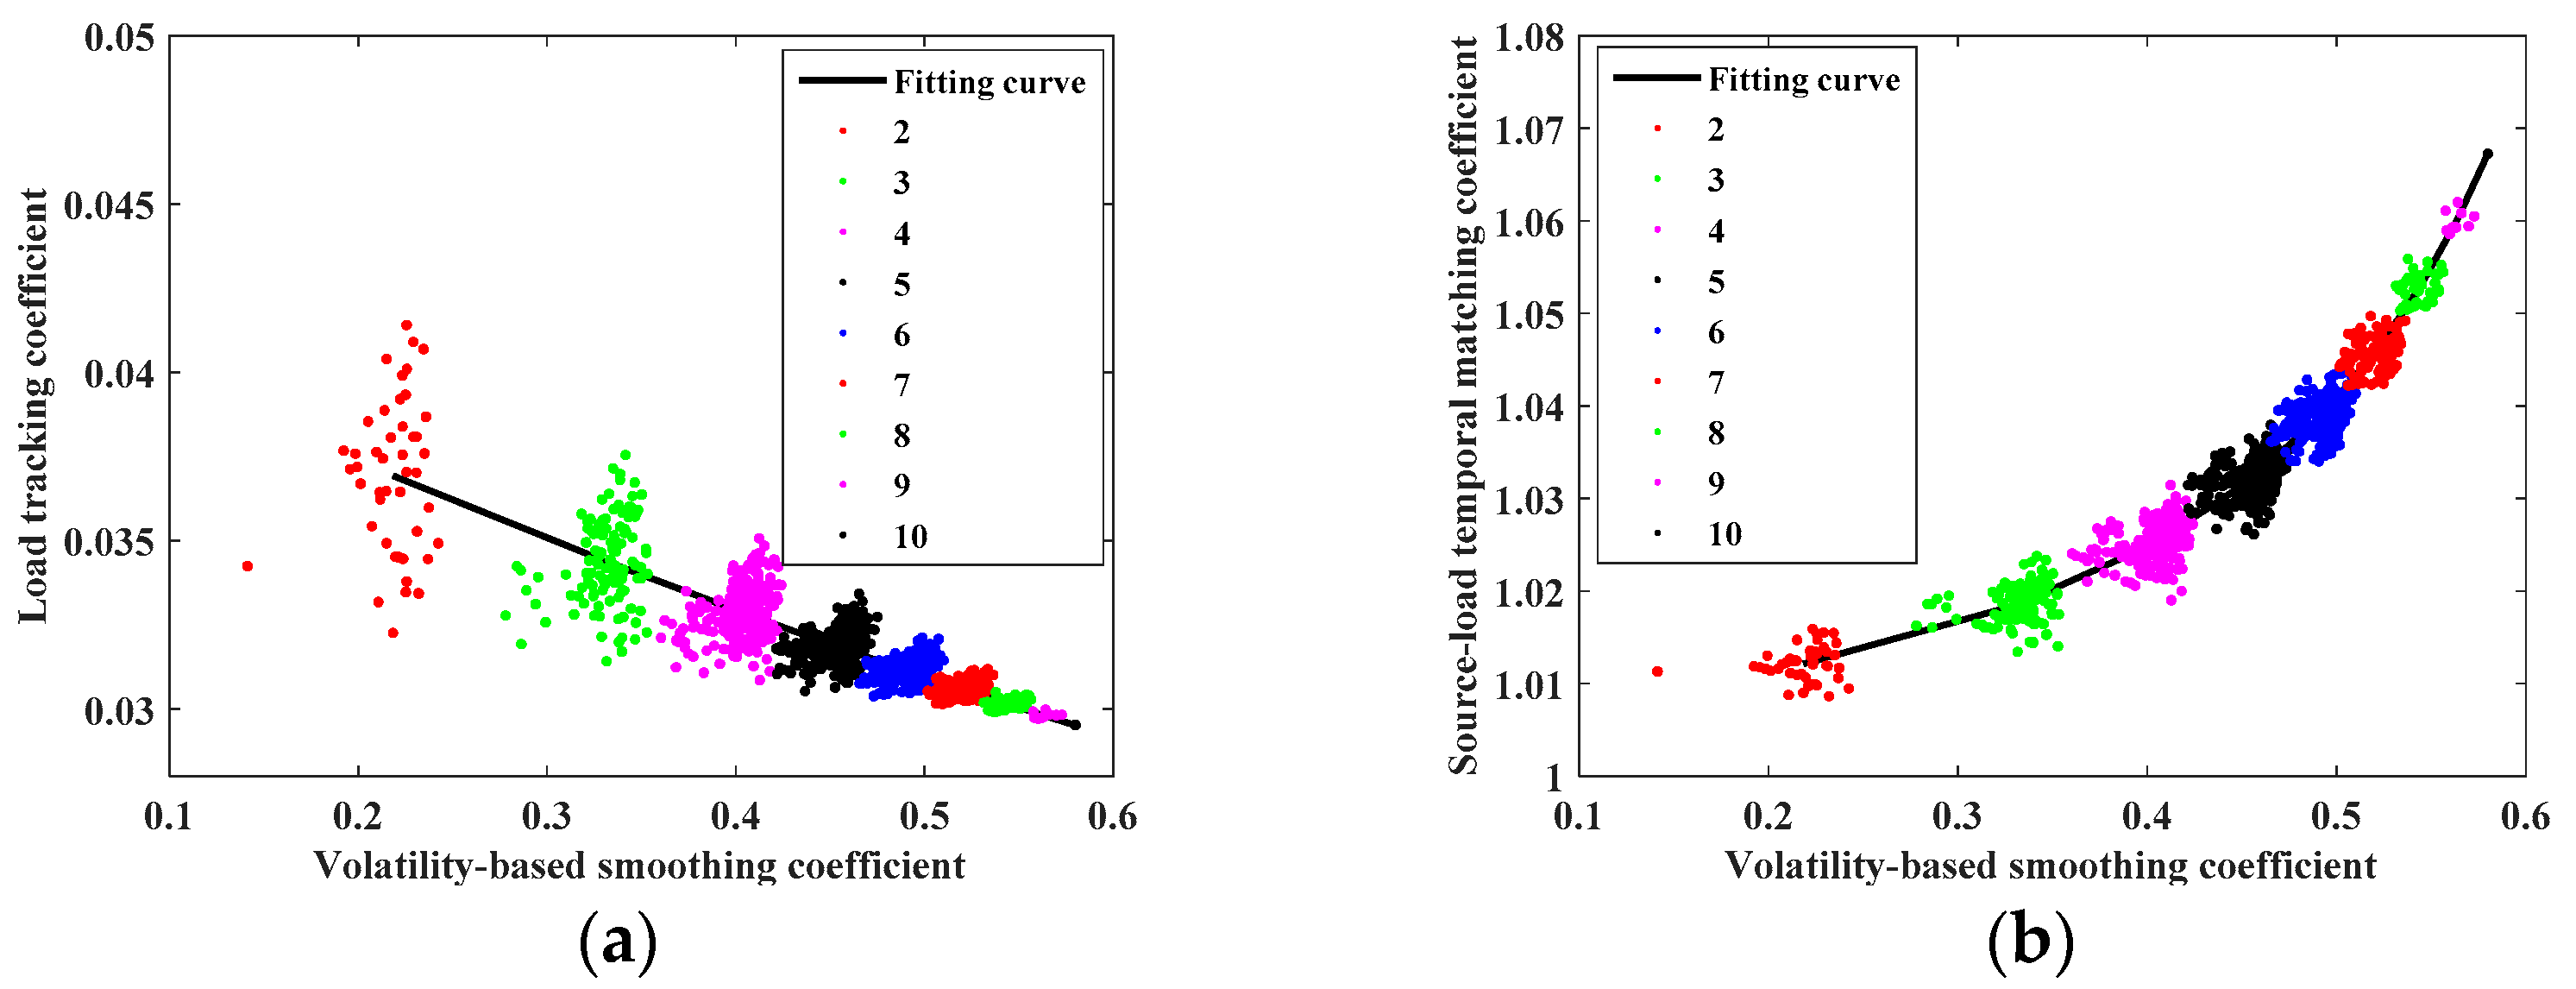
- The ssource-load timing matching coefficient can accurately characterize the difference in timing matching degree between wind power output and grid load under different wind power permeability and the influence degree on grid load. The source-load timing matching coefficient decreases linearly with the increase of the volatility-based smoothing coefficient under the same wind power permeability, indicating that the source-load timing matching degree can be improved by the smoothing effect of wind farm cluster power output. The source-load timing matching coefficient and the volatility-based smoothing coefficient show an approximate exponential function relationship under different wind power permeability, indicating that the source-load timing matching degree becomes worse with the increase of wind power permeability, and the influence of wind power permeability is greater than the smoothing effect of wind farm cluster power output.
- (3)
- The exponential function model depicts the quantitative relationship between the volatility smoothing effect of wind farm cluster power output and the source-load timing matching degree, which makes up for the deficiency of simple qualitative analysis in previous studies.
- (4)
- The proposed indicators can be applied to cluster wind farms’ capacity planning and operation scheduling. In the capacity planning stage, the volatility-based smoothing coefficient can help to determine the installed capacity proportion in wind farm cluster joint planning to reduce the volatility of wind power combined output. In the operation scheduling stage, the proposed source-load timing matching coefficient can improve the timing matching degree between wind power output and grid load to reduce the adverse impact of wind power grid connection on the power system.
Author Contributions
Funding
Acknowledgments
Conflicts of Interest
References
- Mehdiabadi, M.H.; Zhang, J.; Hedman, K.W. Wind power dispatch margin for flexible energy and reserve scheduling with increased wind generation. IEEE Trans. Sustain. Energy 2017, 6, 1543–1552. [Google Scholar] [CrossRef]
- Bucksteeg, M.; Niesen, L.; Weber, C. Impacts of dynamic probabilistic reserve sizing techniques on reserve requirements and system costs. IEEE Trans. Sustain. Energy 2016, 7, 1408–1420. [Google Scholar] [CrossRef]
- Hasan, K.N.; Preece, R.; Milanovic, J.V. Existing approaches and trends in uncertainty modelling and probabilistic stability analysis of power systems with renewable generation. Renew. Sustain. Energy Rev. 2019, 101, 168–180. [Google Scholar] [CrossRef]
- Jiang, P.; Chen, Q. An optimal source-load coordinated restoration method considering double uncertainty. Energies 2018, 11, 558. [Google Scholar] [CrossRef] [Green Version]
- Commin, A.N.; Davidson, M.W.H.; Largey, N.; Gaffney, P.P.J.; Braidwood, D.W.; Gibb, S.W.; McClatchey, J. Spatial smoothing of onshore wind: Implications for strategic development in Scotland. Energy Policy 2017, 109, 36–48. [Google Scholar] [CrossRef]
- Huang, J.; Lu, X.; Mcelroy, M.B. Meteorologically defined limits to reduction in the variability of outputs from a coupled wind farm system in the Central US. Renew. Energy 2014, 62, 331–340. [Google Scholar] [CrossRef]
- Shen, Y.; Zhao, Q.; Li, M. Analysis on wind power smoothing effect in multiple temporal and spatial scales. Power Syst. Technol. 2015, 39, 400–405. [Google Scholar] [CrossRef]
- Liu, Y.; Tian, R.; Zhang, D.; Zhang, X.; Zhou, J. Analysis and application of wind farm output smoothing effect. Power Syst. Technol. 2013, 37, 987–991. [Google Scholar] [CrossRef]
- Li, J.; Qiao, Y.; Lu, Z.; Li, J. An evaluation index system for wind power statistical characteristics in multiple spatial and temporal scales and its application. Proc. Chin. Soc. Electr. Eng. 2013, 33, 53–61. [Google Scholar] [CrossRef]
- Yang, M.; Zhang, L.; Cui, Y.; Zhou, Y.; Chen, Y.; Yan, G. Investigating the wind power smoothing effect using set pair analysis. IEEE Trans. Sustain. Energy 2020, 3, 1161–1172. [Google Scholar] [CrossRef]
- Nanahara, T.; Asari, M.; Maejima, T.; Sato, T.; Yamaguchi, T.; Shibata, M. Smoothing effects of distributed wind turbines. Part 2. Coherence among power output of distant wind turbines. Wind Energy 2004, 7, 75–85. [Google Scholar] [CrossRef]
- Ye, Y.; Qiao, Y.; Lu, Z.; Zhang, J.; Li, Y.; Guo, F.; Huang, J. Offshore wind power outputs in multiple temporal and spatial scales. In Proceedings of the 2014 International Conference on Power System Technology, Chengdu, China, 20–22 October 2014. [Google Scholar] [CrossRef]
- Shahriari, M.; Blumsack, S. Scaling of wind energy variability over space and time. Appl. Energy 2017, 195, 572–585. [Google Scholar] [CrossRef] [Green Version]
- Ye, L.; Qu, X.; Yao, Y.; Zhang, J.; Wang, Y.; Huang, Y.; Wang, W. Analysis on intraday operation characteristics of hybrid wind-solar-hydro power generation system. Automat. Electron Power Syst. 2018, 42, 158–164. [Google Scholar]
- Wen, Z.; Liu, J. A optimal scheduling method for hybrid wind-solar-hydro power generation system with data center in demand side. Power Syst. Technol. 2019, 43, 2449–2459. [Google Scholar]
- Qu, Z.; Li, H.; Liu, J.; Luo, J.; Yu, J. Wind power optimal regulation strategies for fluctuation smoothing, load following and power balancing. Proc. Chin. Soc. Electrical Eng. 2013, 33, 47–55. [Google Scholar]
- Yang, H.; Yu, Q.; Liu, J.; Jia, Y.; Yang, G.; Ackom, E.; Dong, Z.Y. Optimal wind-solar capacity allocation with coordination of dynamic regulation of hydropower and energy intensive controllable load. IEEE Access 2020, 8, 110129–110139. [Google Scholar] [CrossRef]
- Yang, G.; Zhou, M.; Lin, B.; Du, W. Optimal scheduling the wind-solar-storage hybrid generation system considering wind-solar correlation. In Proceedings of the 2013 IEEE PES Asia-Pacific Power and Energy Engineering Conference (APPEEC), Hong Kong, China, 8–11 December 2013. [Google Scholar] [CrossRef]
- Li, P.; Banakar, H.; Keung, P.K.; Far, H.G.; Ooi, B.T. Macromodel of spatial smoothing in wind farms. IEEE Trans. Energy Convers. 2007, 22, 119–128. [Google Scholar] [CrossRef]
- Tarroja, B.; Mueller, F.; Eichman, J.D.; Brouwer, J.; Samuelsen, S. Spatial and temporal analysis of electric wind generation intermittency and dynamics. Renew. Energy 2011, 36, 3424–3432. [Google Scholar] [CrossRef] [Green Version]
- Han, S.; Qiao, Y.; Yan, J.; Liu, Y.; Li, L.; Wang, Z. Mid-to-long term wind and photovoltaic power generation prediction based on copula function and long short term memory network. Appl. Energy 2019, 239, 181–191. [Google Scholar] [CrossRef]


Publisher’s Note: MDPI stays neutral with regard to jurisdictional claims in published maps and institutional affiliations. |
© 2021 by the authors. Licensee MDPI, Basel, Switzerland. This article is an open access article distributed under the terms and conditions of the Creative Commons Attribution (CC BY) license (https://creativecommons.org/licenses/by/4.0/).
Share and Cite
Liu, Y.; Qiao, Y.; Han, S.; Xu, Y.; Geng, T.; Ma, T. Quantitative Evaluation Methods of Cluster Wind Power Output Volatility and Source-Load Timing Matching in Regional Power Grid. Energies 2021, 14, 5214. https://doi.org/10.3390/en14165214
Liu Y, Qiao Y, Han S, Xu Y, Geng T, Ma T. Quantitative Evaluation Methods of Cluster Wind Power Output Volatility and Source-Load Timing Matching in Regional Power Grid. Energies. 2021; 14(16):5214. https://doi.org/10.3390/en14165214
Chicago/Turabian StyleLiu, Yongqian, Yanhui Qiao, Shuang Han, Yanping Xu, Tianxiang Geng, and Tiandong Ma. 2021. "Quantitative Evaluation Methods of Cluster Wind Power Output Volatility and Source-Load Timing Matching in Regional Power Grid" Energies 14, no. 16: 5214. https://doi.org/10.3390/en14165214
APA StyleLiu, Y., Qiao, Y., Han, S., Xu, Y., Geng, T., & Ma, T. (2021). Quantitative Evaluation Methods of Cluster Wind Power Output Volatility and Source-Load Timing Matching in Regional Power Grid. Energies, 14(16), 5214. https://doi.org/10.3390/en14165214