Abstract
In this paper, the effect of heat injection on productivity of Fuyu oil shale during in-situ pyrolysis was studied by using heat flow coupling analysis method. It is found that fluid conducts heat transmission to the oil shale stratum mainly along the fissure formed by hydraulic fracturing. With the increase of heating time, the oil shale on both sides of fissures were effectively pyrolyzed, and the porosity of the formation increases and the diffusion range of the nitrogen to the oil shale stratum is also improved. After 200 days, the oil shale around the fractures first reaches the pyrolysis temperature, and 700 days later, the average temperature of the oil shale stratum reaches 500 °C; therefore, the whole oil shale can be effectively pyrolyzed. Productivity analysis shows that the best exploitation temperature is 500 °C. When the gas injection rate is in the range of 1.0~11.0 m3/min, different degrees of heat loss will occur, and the output is also different. The pyrolysis time reaches 100~150 days, showing the peak value of daily production, which is between 0.5~3.2 m3/day. The pressure of displacement fluid affects oil shale product recovery in in-situ pyrolysis. High pressure helps to improve the displacement efficiency of oil and gas products and increase the productivity of oil shale in-situ pyrolysis. The best acting pressure is 9.5 MPa.
1. Introduction
The primary reservoir of oil shale is compact and has low porosity and low permeability. Even though kerogen can be pyrolyzed after heating, the macromolecular organic matter in shale oil produced by the pyrolysis of kerogen cannot be extracted effectively because of the poor conductivity of the stratum, which leads to low effective recovery of oil shale with low oil content under the normal in-situ pyrolysis process [1,2,3]. For the time being, the most effective way to reconstruct unconventional petroleum resources is hydraulic fracturing technology [4]. The technology is also applied in the in-situ pyrolysis of oil shale. It involves using the measure of hydraulic fracturing to create fractures in the oil shale stratum between the heated well and the mining well and pump the fracturing fluid into the fractures with ceramsites to improve the conductivity of the oil shale, increase the effective contact area of the heat transfer medium with oil shale, and increase the heat conduction rate of the oil shale [5,6,7].
At present, researchers have perfected the development models and productivity prediction of conventional oil and gas resources. Several researchers, such as Wei et al. used clustering ways analyzed the Kerrobert Toe-to-Heel Air Injection (THAI) project, found the inter-relationships of production variables. It guided the optimal control method and maximized the yield [8]. Sun et al. Proposed a new model for calculating heating radius and analyzing production performance of cyclic superheated steam huff and puff (CSHSS) wells. After verified the model, the parameters of CSHSS production process were analyzed dynamically. The results showed that the changes of pressure drop, and oil saturation drop lead to the inhibition of waste heat on cycle capacity [9]. Zhou et al. further studies the effect of heterogeneity on well grouping in sequential multi-well cyclic steam stimulation (CSS). They believed that the channeling wells should be injected simultaneously. Since by this, the heating area could be expanded, increased moveable oil and replenished reservoir energy [10]. Zhang et al., established a three-dimensional model of coalbed methane two phase fracturing and analyzed the influence of constant permeability, original volume density and porosity on production [11]. Ma et al. simulated hydraulic fracturing for coal bed methane (CBM) reservoirs, showing that reservoir reconstruction can improve production efficiency [4]. Tang et al. used a fixed mesh model to simulate the fracture expansion of multi-stage hydraulic fracturing in unconventional reservoirs and predict well productivity [12]. Cheng Chen et al. simulated reservoir exploitation under the condition of carbon dioxide flooding in mudstone reservoirs and noted that the length of the pumping period will affect the final recovery efficiency [13].
However, in contrast with conventional oil, oil shale is one of unconventional oil and gas resources. The kerogen is an immature hydrocarbon generating substance [14]. Only through high temperature pyrolysis will it form oil and gas products [15]. Therefore, the prediction of its capacity is influenced by many factors. Based on the micro seismic monitoring data of hydraulic fracturing, a three-dimensional model of in-situ pyrolysis of oil shale was established. Multi-physical field coupled finite element analysis software COMSOL Multiphysics was used to simulate the bottom hole injection of high temperature and high-pressure nitrogen. From the perspective of heat transfer, this paper analyses the effect of injection flow rate and heating time on the effective range of oil shale reservoir after hydraulic fracturing. In addition, the effects of injection pressure and injection flow rate on in-situ pyrolysis productivity of oil shale were studied, and the form of heat dissipation was analyzed. The influencing factors of oil and gas production are analyzed, which can provide guidance for improving production capacity and oil and gas recovery of on-site pyrolysis oil shale.
2. Materials and Methods
2.1. Process Principle and Site Selection of Fuyu Oil Shale In-Situ Pyrolysis
The in-situ pyrolysis of oil shale was carried out in Songyuan City, Jilin Province, China. As shown in Figure 1, three wells were drilled. In order to effectively connect FK-1 well and FK-2 well, hydraulic fracturing technology was implemented. In the process of hydraulic fracturing, microseismic monitoring technology was used to monitor the fracture development trend in real time, and the connectivity test between the two wells was carried out [16]. As an injection well, FK-1 well is equipped with downhole heater. When high pressure nitrogen is injected, the nitrogen can be heated to 400 °C and injected into the fractures. FK-2 is a production well, and the oil and gas displaced by high pressure nitrogen are all discharged to the surface storage equipment through FK-2 well. M-1 and M-2 are two monitoring wells. Temperature sensors are installed in different strata in the well, which can monitor the diffusion range of strata temperature in real time, master the dynamic of pyrolysis zone and adjust injection parameters in time. FK-3 is a water level monitoring well for real-time monitoring of water level change in gas seepage control Area.

Figure 1.
Wells location of oil shale in-situ pyrolysis and geophone deployment for monitoring hydraulic fracturing. (The yellow marks are representing the geophone).
In these wells of the field, only FK-1 and FK-3 are coring drilling, while M-1 and M-2 are non-coring drilling. Through the core obtained from FK-3 well, we know that the buried depth of oil shale reservoir is 477 to 486 m underground. Two oil shale cores at this depth of FK-3 well were randomly selected for proximate analysis, element analysis and Fisher analysis. The samples were ground before the test. To avoid the influence of different particle sizes on the test results, the grinded oil shale samples were sieved into uniform particle sizes. The results are shown in Table 1, Table 2 and Table 3.

Table 1.
Proximate analysis of Fuyu oil shale.

Table 2.
Fisher analysis of Fuyu oil shale.

Table 3.
Element analysis of Fuyu oil shale.
2.2. Modelling of Fuyu Oil Shale In-Situ Pyrolysis
In order to improve the reservoir connectivity, six hydraulic fracturing operations were carried out in the oil shale formation between FK-1 and FK-2 wells. According to the micro seismic monitoring results, as shown in the Figure 2, Different dot colors represent different times of occurrence. Different dot sizes represent different earthquake intensities. The number of dots represents the number of earthquakes that are effectively monitored. The position of the dot represents the location of the earthquake. The fracture propagation between FK-1 and FK-2 wells is consistent with the direction of in-situ stress.
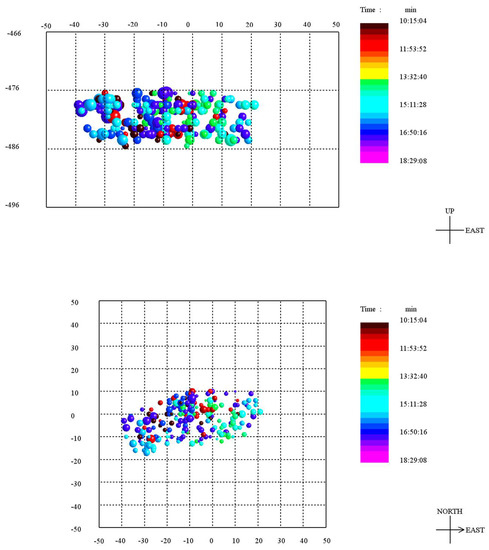
Figure 2.
The Front view Schematic diagram of micro seismic monitoring results.
According to the well location of oil shale in-situ pyrolysis process and the micro seismic monitoring data of hydraulic fracturing, we establish a three-dimensional model. From the front view, the effective range of hydraulic fracturing is shoe shaped. There are two main fractures near 479 m and 484 m in hydraulic fracturing. The extension distance of the two main fractures is 70 m in the direction of oil shale bedding and 10 m in the direction of vertical oil shale bedding. The vertical fractures run through the whole oil shale. In addition, more micro seismic events have been detected between the two main fractures, which shows that the rocks between the two fractures have also been fully fractured in the fracturing process, so that the two main fractures are fully connected.
2.3. The Parameters of Fuyu Oil Shale In-Situ Pyrolysis
During the pyrolysis of oil shale, the porosity changes with the change of temperature, which is an important factor affecting the effect of high temperature and high-pressure nitrogen seepage. The pore characteristics, thermal conductivity and specific heat capacity of Fuyu oil shale after pyrolysis at different temperatures were tested. The thermal conductivity of Fuyu oil shale at different temperatures was measured by Shortherm QTM produced by Zhaohe Electric Industrial Co., Ltd. of Tokyo Japan. The specific heat capacity was measured by BRR specific heat capacity tester produced by China Xiangtan Instruments and Instruments Co., Ltd. In addition, the porosity and permeability of oil shale pyrolysis residue at 25~550 °C were measured by mercury intrusion method and nitrogen adsorption method. The results are shown in Table 4. Oil shale is a sedimentary rock, having different thermal conductivities in bedding and foliation directions. However, due to the low organic matter content and dense structure of Fuyu oil shale, this trend is not obvious. Anisotropy means that all or part of the chemical and physical properties of a substance change with direction, showing different properties in different directions. Since the oil shale deposit is developed in bedding, there are different heat transfer characteristics in the direction perpendicular to and parallel to the bedding. With the increase in temperature, the porosity and anisotropy constant of oil shale increases, but the thermal conductivity and specific heat capacity tend to decrease.

Table 4.
Thermophysical properties of Fuyu oil shale.
In-situ pyrolysis of oil shale is the injection of high temperature and high-pressure nitrogen from the heating well through the fissure to the oil shale. The nitrogen passes heat to the oil shale, causing the pyrolysis of kerogen in the oil shale to produce oil and gas, while the nitrogen drives oil and gas from the pyrolysis of the kerogen and enters the fissure through the pore channel of the oil shale. Finally, kerogen is collected by the surface device [17]. The specific input parameters of high temperature and high-pressure nitrogen are listed in Table 5.

Table 5.
Calculation parameters of nitrogen.
3. Heat Injection Simulation of Oil Shale In-Situ Pyrolysis
3.1. Heat Transfer Simulation
According to the Darcy seepage mode extended by Brinkman-Forchheimer [18,19], nitrogen is conserved in mass, momentum and energy through the heat conduction process of fractures to oil shale. The calculation parameters of related oil shale reservoirs and fractures are listed in Table 6.

Table 6.
Calculation tables of oil shale.
Considering the pyrolysis temperature range of organic matter obtained from thermogravimetric experiments in Fuyu oil shale and the thermophysical parameters under different temperature conditions, when the temperature is 500 °C, the pyrolysis rate of organic matter tends to peak, and the porosity of oil shale is 10.89%. Therefore, set 500 °C as the injection temperature for oil shale in-situ pyrolysis simulation. The temperature control equation of the fluid in the formation fissure is,
where T0 is the initial temperature of oil shale formation, °C; T is the gas temperature in the well, °C; ke is the reservoir equivalent permeability, mD; Q is the gas flow rate, m3/min; f(t) is the loss of heat in time when the heat capacity is considered in the process of steady state heat transfer.
where rh is the outer radius of cement ring in gas injection well, i.e., 385 mm, ae is the thermal diffusivity of the oil shale reservoir, ω is the ratio of the formation to the heat capacity of the wellbore, i.e., 1, and τ is the micro pore average diameter, i.e., 1000 nm.
When the nitrogen temperature is 500 °C and the pressure is up to 9.5 MPa, the output pressure of the well increases gradually with the increase in injection time, as shown in Figure 3. In the microscopic pore and fissure of oil shale, the transport of nitrogen satisfies Hagen–Poiseuille equation of porous media [20].
where u is the nitrogen flow velocity, m/s; ε is the porosity of oil shale; C is the oil page rock layer ratio heat capacity, J/(kg·K); CP is the nitrogen constant pressure specific heat capacity, J/(kg∙K); λ is the coefficient of oil shale thermal conductivity, W/(m·K); and F is the force of the porous medium on the nitrogen.
where β is the average thermal expansion coefficient, T0 is the oil shale initial temperature, i.e., 288 K, and dp is the particle mean diameter, mm.
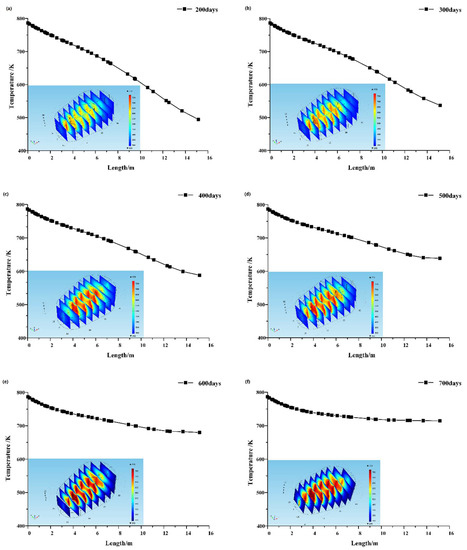
Figure 3.
Oil shale reservoir temperature distribution under a gas injection rate of 11 m3/min. (a) Heating for 200 days; (b) Heating for 300 days; (c) Heating for 400 days; (d) Heating for 500 days; (e) Heating for 600 days; (f) Heating for 700 days.
When the injection flow rate is 11 m3/min, during the pyrolysis of oil shale, the heat is transferred from the wellbore along the fissure to the stratum and the temperature of the oil shale reservoir increases with the heating time. As shown in Figure 3, with the extension of heating time, it can be seen from the temperature cloud chart that the temperature of the oil shale reservoir around the fracture first increased. After heating for 200 days, the temperature of the whole surrounding fracture reaches the temperature of oil shale pyrolysis. With the extension of the heating time and the progress of the pyrolysis process, the extent of pyrolysis gradually expanded from fractures to oil shale formations on both sides.
In the late heating stage, the formation temperature increased obviously with the prolongation of the injection heat time, but the temperature influence range did not increase further. This is because the oil shale formation near the fissure is first heated, the kerogen is pyrolyzed and the oil and gas products are released. The high temperature oil and gas products are displaced by high pressure gas to FK-2 well and then to surface equipment. Therefore, part of the heat is carried out, which affects the diffusion of heat to oil shale and the effective heat transfer distance. In addition, the injected heat fluid also enters the porous medium under the action of Darcy flow. As the temperature of the formation rises, an increasing number of oil and gas products are generated, and the resistance of thermal fluid into the porous medium is increased; therefore, the range of heat conduction is limited. After 700 days of heating, the oil shale in the fracture extension is basically pyrolyzed.
In addition, as shown in Figure 4, with the extension of heating time, the pyrolysis zone of the oil shale gradually expanded. The heat transfer of hot nitrogen to oil shale formation gradually reached equilibrium. This is because when the injected heat stays the same, the hot nitrogen gas conducts heat to oil shale formation while maintaining the temperature needed for pyrolysis of kerogen in the pyrolysis zone. Moreover, the oil and gas products produced by pyrolysis of kerogen will be replaced by high-temperature gas to produce wells and take part of the heat. Therefore, with the increase in heat transfer area, the heat loss also increases, which leads to the gradual balance of heat transfer.

Figure 4.
Schematic diagram of the heat transfer process.
3.2. Influence Range of Pressure
Based on the X and Y directions in the oil shale layer, a pressure loss model of gas in a single fracture is proposed based on Beskok and Karniadakis [21].
where μ is the injection gas viscosity, Pa∙s; L0 is the fracture length of FK1 well, mm; b is the slip coefficient; α is the equivalent width of fracture, mm; L1 is the fracture length of FK2 well, mm; δ is the equivalent thickness of fracture, mm; R is the gas constant, J/(mol∙K); T is the temperature, K; P is the pressure, MPa; M is the Mole mass of gas, g/mol; f(ε) is a factor related to the shape, because the effective width of the fracture is only 5 mm, the length of the fracture is 15 m–25 m, the length and width ratio is more than 3000, the value of the fracture is more than 3000, the value of f(ε) is 0.994 and b = 0 in the state without slip.
The relationship between displacement flow and differential pressure in main fractures is given by,
where Pw is the flow pressure, MPa; α is the main fracture width, mm; xf is the main fracture half length, i.e., 7.5 m, and h is the reservoir thickness, m.
In the early stage of heating, under the action of high-pressure displacement, the fluid mainly flows out from the direction of the oil shale bedding. At this time, the oil shale formation is not completely heated, and the porosity of the primary strata is low. The fluid flows through the mining well along the fracture. Only a few fluids flow out from the primary pores of the oil shale under Darcy seepage, the resistance is high along the way and the outlet pressure is small. As shown in Figure 5, with the increase in oil shale formation temperature, especially the fissure temperature, the porosity increases and the resistance decreases. However, porosity from the fracture to the boundary decreases. Therefore, the seepage field becomes more and more complicated owing to the seepage behavior from fractures in the oil shale. The seepage behavior proceeds from the center of the fracture to the boundary and the outlet of the well. When the oil shale formation is completely thermally pyrolyzed, the porosity of the whole oil shale reservoir increases to 10.89%. The pressure gradient of the seepage field in the whole area becomes uniform, the flow direction is stable and the resistance along the flow further decreases. The pressure field between the high-pressure heat injection well to the low-pressure mining well decreases, and the output pressure of the well is increased; therefore, the displacement effect is enhanced. The pressure gradient between the high-pressure water injection well and low-pressure production well becomes smaller, the pressure field becomes uniform and the output pressure of the well increases, which improves the displacement effect.
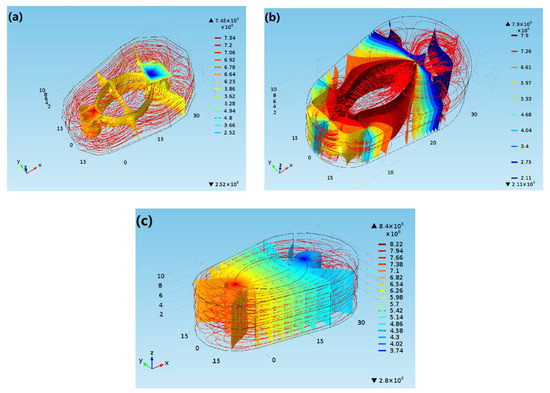
Figure 5.
Cloud distribution of pressure distribution in the oil shale reservoir during heating process. (a) the initial stage of pyrolysis (b) the middle stage of pyrolysis (c) the later stage of pyrolysis.
4. Result and Discussion of Shale Oil and Gas Production
Temperature is an important factor in determining the pyrolysis of kerogen and an important factor affecting the change of porosity in the formation. Considering the thermogravimetric experiment and thermo-physical properties of Fuyu oil shale, when the temperature of the injection nitrogen is 773 K, the main factor affecting productivity is the flow of displacement fluid and the pressure of mining. The cleavage region between the FK-1 and FK-2 wells is listed in Table 7.

Table 7.
Calculation parameters of the pyrolysis region.
4.1. Effect of Gas Injection Flow on Productivity
The effect of gas injection on productivity is mainly reflected in the two aspects of displacement and heat transfer. With the increase in the flow of gas injection, more heat is carried per unit time, the temperature of formation increases, the porosity increases and heat can easily enter the formation.
As shown in Figure 6, with the increase in the gas injection rate, the daily production of the mining well can increase significantly, and the time for the peak productivity of the production well is delayed. This is because when the gas injection volume is relatively small, the heat-carrying nitrogen at high temperature and high pressure is less and the heat loss is larger, as given in Equations (1)–(5). Therefore, only the formation near the fracture of the oil shale reservoir can be pyrolyzed. The flow rate of gas injection wells increases, and the heat of high pressure and high-temperature nitrogen increases per unit time, which causes the temperature of the oil shale reservoir to increase effectively, and the temperature difference between high temperature gas and oil shale reservoir is reduced. In addition, the porosity increases after the oil shale temperature rises, and the oil and gas products produced by kerogen pyrolysis can be discharged in time, and the displacement efficiency is higher, as shown in Figure 7. Therefore, the daily yield can be improved significantly. When the injection heat time reaches 200 days, the oil shale around the fracture is completely pyrolyzed and high temperature nitrogen needs to overcome the seepage resistance of the oil shale reservoir. In heating the oil shale reservoir, with the increase in distance, the seepage resistance increases; therefore, the productivity decreases. Lee et al. Obtained the same production capacity trend during the research on a comprehensive simulation model of kerogen pyrolysis for the in-situ upgrading of oil shale [22].
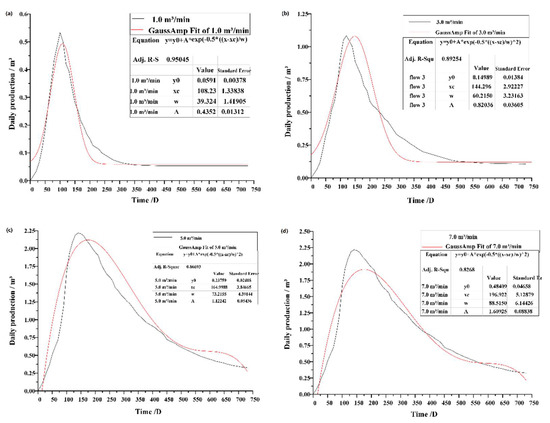
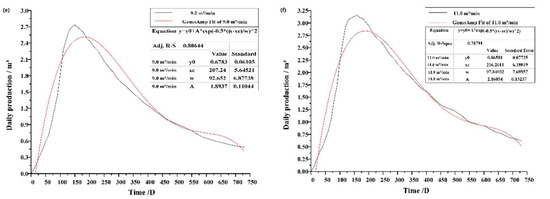
Figure 6.
Variation curve of daily output of the mining well under different flow rates. (a) 1.0 m3/min (b) 3.0 m3/min (c) 5.0 m3/min (d) 7.0 m3/min (e) 9.0 m3/min (f) 11.0 m3/min.
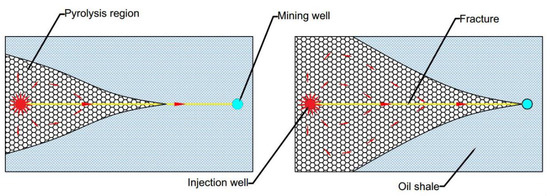
Figure 7.
Schematic diagram of the influence of displacement flow on oil and gas recovery.
4.2. Effect of Mining Flow Pressure on Productivity
This is consistent with the description of vertical well production in the Dupuit formula [23].
where q is the oil well output, m3/d; μ is the oil product viscosity, mPa·s; rw is the oil well radius, mm; re is the discharge radius, m; pe is the supply boundary pressure, MPa; pf is the bottom hole flow pressure, MPa; and Sf is the dimensionless fracture skin coefficient.
ys is the interlayer fracture spacing, m; xf is the fractures’ effective support half-length, m.
is the voidage of fractures.
is the sand ratio, which is 7–14%,
The structure of the oil shale is dense and porous, and acid fracturing will affect the oil and gas reservoir transportation. Under the condition of the skin factor, as shown in Figure 8, with the increase in injected fluid pressure, the production capacity of oil and gas wells gradually decreases, which is consistent with the research by Ding Fuchen et al. When the injection fluid pressure is 9.5 MPa, the output of Fuyu oil shale in-situ pyrolysis can reach 3.37 m3/d, but when the fluid pressure reaches 12.0 MPa, the highest output is only 2.35 m3/d.
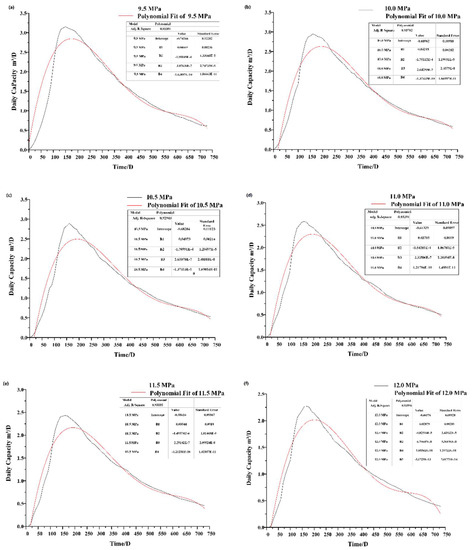
Figure 8.
Influence of mining flow pressure on daily productivity. (a) 9.5 MPa (b) 10.0 MPa (c) 10.5 MPa (d) 11.0 MPa (e) 11.5 MPa (f) 12.0 MPa.
This is because, with the increase in mining fluid pressure, the pressure difference of oil and gas generated by oil shale pyrolysis in the confined space and the pressure of mining flow decrease. The pore compression of oil shale is more uniform, and it is not easy to cause stress concentration, which leads to the pressure difference between the oil and gas occurrence space and the outside being less than the minimum fracturing pressure in the pores of the oil shale, as shown in Figure 9. Pei et al. Obtained the same influence mechanism in the study of a new nitrogen injection in-situ transformation process mechanism and reservoir simulation of oil shale [24].
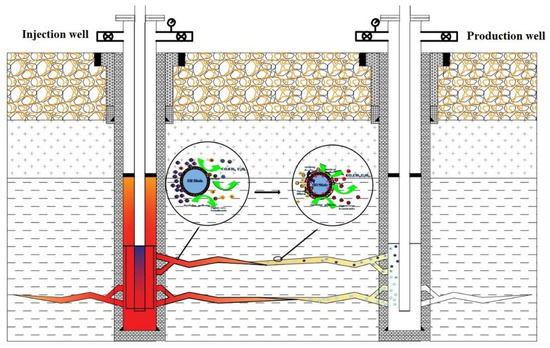
Figure 9.
A schematic diagram of oil and gas migration from oil shale pyrolysis.
Therefore, the possibility is reduced that primary pores where oil and gas products are produced by pyrolysis of oil shale are ruptured, which leads to the oil and gas products produced by in-situ pyrolysis of oil shale escaping the primary pore where its storage is hindered. Therefore, oil and gas products cannot be effectively displaced, and oil shale collection efficiency is low.
Considering the influence of mining flow pressure and gas injection rate on the productivity of mining wells, as shown in Figure 10 above, with the increase in mining flow pressure, the productivity of the mining well is reduced. When the mining flow pressure is 9.5 MPa, the optimal mining condition is reached. The daily production capacity is up to 3.37 m3/d, and the cumulative production capacity is as high as 1200 m3. With the increase in gas injection volume, the productivity of the mining well is increased. When the gas injection volume is 11 m3 /min, the best daily production can reach 3.2 m3/d and the total production capacity is as high as 1200 m3. The two calculation results are consistent, which verifies the accuracy of the calculation. Combined with the TG and DTG curve 1 and the thermophysical properties of Fuyu oil shale in Table 2, the optimal exploitation of Fuyu oil shale reservoir flow pressure is 9.5 MPa, the best extraction temperature is 500 °C and the optimal gas flow is 11 m3 /min.
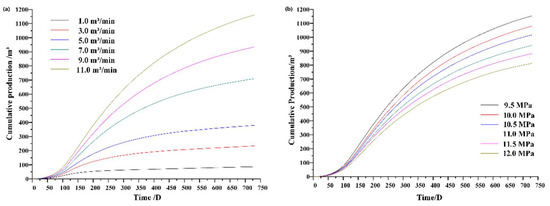
Figure 10.
Influence of mining flow rates and pressure on cumulative productivity. (a) Different injection flow (b) Different injection pressure.
5. Conclusions
The fracture of oil shale is expanded by hydraulic fracturing, the diversion capacity of oil shale is improved, and the heat transfer area of high temperature nitrogen and the oil shale reservoir is increased, so that the heat can be transferred to oil shale in a short time and efficiently. Owing to the loss of heat transfer and the crevice slowly rising in the early stage of heat injection, it is difficult to reach the pyrolysis temperature, the porosity is low, and the conductivity is poor, which leads to the temperature of the formation rising slowly. Therefore, we can try to increase the nitrogen flow rate, enhance heat transfer and thus raise the heating rate of the formation. After heating 700 days, the whole oil shale reservoir basically averages 500 °C. As the pressure of the injected fluid increases, the production capacity of the oil and gas well decreases, because the possibility of primary pore being ruptured is reduced, which leads to the oil and gas products escaping the primary pore hindered. The oil and gas products cannot be effectively displaced, and shale oil collection efficiency is low. Therefore, the products cannot be effectively displaced, resulting in a low shale oil recovery efficiency. Thus, a displacement fluid pressure of 9.5 MPa is the best mining pressure, and the optimal gas flow is 11 m3 /min.
Author Contributions
Conceptualization, Y.S.; methodology, X.L.; software, S.Z.; data curation, S.Z.; writing—original draft preparation, S.Z.; writing—review and editing, Q.L. All authors have read and agreed to the published version of the manuscript.
Funding
This research was funded by “the Fundamental Research Funds for the Central Universities, grant number 2021QN1002” and “China Postdoctoral Science Foundation, grant number 2021M693421” and the National Natural Science Foundation of China (Grant No. 41972324).
Acknowledgments
In the course of this experiment, it was supported by the pilot experimental base for in-situ pyrolysis of Fuyu oil shale, Jilin University. The authors also express their appreciation to technical reviewers for their constructive comments.
Conflicts of Interest
The authors declare no conflict of interest. The funders had no role in the design of the study; in the collection, analyses or interpretation of data; in the writing of the manuscript or in the decision to publish the results.
References
- Martins, M.F.; Salvador, S.; Thovert, J.F.; Debenest, G. Co-current combustion of oil shale—Part 1: Characterization of the solid and gaseous products. Fuel 2010, 89, 144–151. [Google Scholar] [CrossRef]
- Na, J.-G.; Im, C.H.; Chung, S.H.; Lee, K.B. Effect of oil shale retorting temperature on shale oil yield and properties. Fuel 2012, 95, 131–135. [Google Scholar] [CrossRef]
- Guo, H.; Peng, S.; Lin, J.; Chang, J.; Lei, S.; Fan, T.; Liu, Y. Retorting Oil Shale by a Self-Heating Route. Energy Fuels 2013, 27, 2445–2451. [Google Scholar] [CrossRef]
- Ma, C.; Jiang, Y.; Xing, H.; Li, T. Numerical modelling of fracturing effect stimulated by pulsating hydraulic fracturing in coal seam gas reservoir. J. Nat. Gas Sci. Eng. 2017, 46, 651–663. [Google Scholar] [CrossRef]
- Davletbaev, A.; Kovaleva, L.; Babadagli, T. Heavy Oil Production by Electromagnetic Heating in Hydraulically Fractured Wells. Energy Fuels 2014, 28, 5737–5744. [Google Scholar] [CrossRef]
- Abbasi, J.; Raji, B.; Riazi, M.; Kalantariasl, A. A simulation investigation of performance of polymer injection in hydraulically fractured heterogeneous reservoirs. J. Pet. Explor. Prod. Technol. 2017, 7, 813–820. [Google Scholar] [CrossRef][Green Version]
- Friesen, O.J.; Dashtgard, S.E.; Miller, J.; Schmitt, L.; Baldwin, C. Permeability heterogeneity in bioturbated sediments and implications for waterflooding of tight-oil reservoirs, Cardium Formation, Pembina Field, Alberta, Canada. Mar. Pet. Geol. 2017, 82, 371–387. [Google Scholar] [CrossRef]
- Wei, W.; Rezazadeh, A.; Wang, J.; Gates, I.D. An analysis of toe-to-heel air injection for heavy oil production using machine learning. J. Pet. Sci. Eng. 2021, 197, 108109. [Google Scholar] [CrossRef]
- Sun, F.; Li, C.; Cheng, L.; Huang, S.; Zou, M.; Sun, Q.; Wu, X. Production performance analysis of heavy oil recovery by cyclic superheated steam stimulation. Energy 2017, 121, 356–371. [Google Scholar] [CrossRef]
- Zhou, K.; Hou, J.; Yu, B.; Du, Q.; Liu, Y. Production analysis of sequential multi-well cyclic steam stimulation in heterogeneous heavy oil reservoir. Int. J. Oil Gas Coal Technol. 2017, 16, 311–328. [Google Scholar] [CrossRef]
- Zhang, J.; Bian, X. Numerical simulation of hydraulic fracturing coalbed methane reservoir with independent fracture grid. Fuel 2015, 143, 543–554. [Google Scholar] [CrossRef]
- Tang, H.; Winterfeld, P.H.; Wu, Y.S.; Huang, Z.Q.; Di, Y.; Pan, Z.; Zhang, J. Integrated simulation of multi-stage hydraulic fracturing in unconventional reservoirs. J. Nat. Gas Sci. Eng. 2016, 36, 875–892. [Google Scholar] [CrossRef]
- Chen, C.; Gu, M. Investigation of cyclic CO2 huff-and-puff recovery in shale oil reservoirs using reservoir simulation and sensitivity analysis. Fuel 2017, 188, 102–111. [Google Scholar] [CrossRef]
- Zhao, S.; Sun, Y.; Wang, H.; Li, Q.; Guo, W. Modeling and field-testing of fracturing fluid back-flow after acid fracturing in unconventional reservoirs. J. Pet. Sci. Eng. 2019, 176, 494–501. [Google Scholar] [CrossRef]
- Shuai, Z.; Xiaoshu, L.; Qiang, L.; Youhong, S. Thermal-fluid coupling analysis of oil shale pyrolysis and displacement by heat-carrying supercritical carbon dioxide. Chem. Eng. J. 2020, 394, 125037. [Google Scholar] [CrossRef]
- Zhao, S.; Lü, X.; Sun, Y.; Huang, J. Thermodynamic mechanism evaluate the feasibility of oil shale pyrolysis by topochemical heat. Sci. Rep. 2021, 11, 1–15. [Google Scholar]
- Jiang, P.F.; Sun, Y.H.; Guo, W.; Li, Q. Heating Technology and Heat Transfer Simulation for Oil Shale of In-situ Pyrolysis by Fracturing and Nitrogen Injection. J. Northeast. Univ. 2015, 36, 1353–1357. [Google Scholar]
- Wang, B. Convective Heat and Mass Transfer in Porous Media. J. Xi’an Jiaotong Univ. 1994, 28, 51–59. [Google Scholar]
- Wang, B. On the Modelling of Fluid Flow in Porous Media. J. Shanghai Jiaotong Univ. 1999, 8, 966–969. [Google Scholar]
- Ding, F.; Wang, J.; Ruan, Z. Study on Pyrolysis of oil shale under pressure. Acta Pet. Sin. 1991, 7, 75–82. [Google Scholar]
- Beskok, A.; Karniadakis, C.A.E. Report: A model for flows in channels, pipes, and ducts at micro and nano scales. Microscale Thermophys. Eng. 1999, 3, 43–77. [Google Scholar]
- Lee, K.; Moridis, G.J.; Ehlig-Economides, C.A. A Comprehensive Simulation Model of Kerogen Pyrolysis for the In-Situ Upgrading of Oil Shales. SPE J. 2016, 21, 1612–1630. [Google Scholar] [CrossRef]
- Cheng, W.-L.; Li, T.-T.; Nian, Y.-L.; Wang, C.-L. Studies on geothermal power generation using abandoned oil wells. Energy 2013, 59, 248–254. [Google Scholar] [CrossRef]
- Pei, S.; Wang, Y.; Zhang, L.; Huang, L.; Cui, G.; Zhang, P.; Ren, S. An innovative nitrogen injection assisted in-situ conversion process for oil shale recovery: Mechanism and reservoir simulation study. J. Pet. Sci. Eng. 2018, 171, 507–515. [Google Scholar] [CrossRef]
Publisher’s Note: MDPI stays neutral with regard to jurisdictional claims in published maps and institutional affiliations. |
© 2021 by the authors. Licensee MDPI, Basel, Switzerland. This article is an open access article distributed under the terms and conditions of the Creative Commons Attribution (CC BY) license (https://creativecommons.org/licenses/by/4.0/).