Article

A Voltage Sag Severity Evaluation Method for the System Side Which Considers the Influence of the Voltage Tolerance Curve and Sag Type

State Key Laboratory of Alternate Electrical Power System with Renewable Energy Sources, School of Electrical and Electronic Engineering (SEEE), North China Electric Power University (NCEPU), Beijing 102206, China
*
Author to whom correspondence should be addressed.
Energies 2021, 14(16), 5065; https://doi.org/10.3390/en14165065
Submission received: 2 July 2021 / Revised: 14 August 2021 / Accepted: 15 August 2021 / Published: 17 August 2021

Abstract

:
Considering the influence of user equipment voltage tolerance characteristics and sag types on the evaluation results, this paper proposes a voltage sag severity evaluation method for the system side which considers the influence of the voltage tolerance curve and sag type. As such, a quantitative evaluation of the severity of voltage sag events can be achieved. Firstly, the user’s voltage tolerance curve is used to construct the comparison reference value of the energy index, in order to realize the rapid analysis of the severity of the sag event in the normal area and the abnormal area. Secondly, aiming at the problem of insufficient descriptions of the severity difference of sag events in uncertain areas, an improved energy index evaluation model combined with user tolerance characteristics is established through an interval division and interval weight calculation, so as to divide and evaluate the severity of sag events in uncertain areas. Considering the influence of the sag type on the voltage tolerance curve and user equipment, the energy index correction factor is then constructed, and the measurement function is used for an interval evaluation to obtain the ranking result of the voltage sag severity, which is more in line with the actual situation. Finally, the rationality and effectiveness of the proposed method are verified by analyzing 24 voltage sag events at a monitoring node.

1. Introduction

In recent years, the large-scale integration of renewable energy, based on power electronics and automatic control technology into the grid, has caused many power quality problems. Among them, voltage sag is the most important problem [1,2,3]. At the same time, high-end manufacturing processes, such as semiconductor manufacturing and automobile manufacturing, utilize many sensitive devices, which are very sensitive to voltage sag. A short-term voltage sag may lead to abnormal operation of the equipment, and in severe cases, may cause equipment outage. Moreover, these types of equipment play a pivotal role in the operation of enterprises. In the event of an abnormal situation, an enterprise may suffer huge economic losses [4,5]. The design of the user economic loss evaluation and sag control scheme is based on the accurate evaluation of the severity of voltage sag events. Thus, it is necessary to study how voltage sag severity is evaluated.
To date, a large number of studies have been carried out in academia and industry around the severity evaluation of voltage sags, and a relatively complete voltage sag evaluation index system has been formed based on the characteristics of grid-side sags or the load perceptual characteristics of user-side sags. Reference [6] proposes a multi-level index architecture of a single event-node-system, in which the node voltage sag index is the core basis for quantitatively evaluating the voltage sag level. This index architecture mainly includes the sag amplitude index ESM and the sag frequency index SARFI [7], with the sag severity index Se [8,9] and the sag energy index Evs. The sag amplitude index ESM or the sag frequency index SARFI only quantitatively describes the severity of voltage sag events from the perspective of the sag amplitude or frequency, causing a one-sided characterization of the voltage sag level. Although the sag severity index Se considers both the equipment sensitivity and the sag feature, it is difficult to obtain user information and the index ignores the difference between the voltage tolerance capabilities of different types of sensitive equipment, which may lead to misjudgment of the consequence status of the equipment. At the same time, because the sag severity index Se selects the lowest effective value of the three-phase voltage during the sag process as the sag amplitude, it may cause an over-evaluation of the non-rectangular sag.
The sag energy index Evs considers the characteristics of the sag amplitude, duration, and sag waveform, and quantitatively analyzes the voltage sag. Due to the compatibility and universality of Evs, it has attracted widespread attention [10,11,12]. In reference [13], the graphical method is used to determine the voltage energy loss under an asymmetric sag, which can both present the evaluation results intuitively and quickly and evaluate the magnitude of comparison more easily. The ultimate purpose of the voltage sag event evaluation is to reflect degree that user equipment is influenced by sag events; that is, whether the consequence state of the user equipment has changed. In reference [14], the authors make a statistical analysis based on the multi-amplitude duration function and combine it with the voltage tolerance curve, thus revealing the dynamic characteristics of the voltage sag on the voltage tolerance curve and realizing the high accuracy of the severity evaluation of the voltage sag. Reference [15] proposes a novel classification of the severity level through using the reference values to more intuitively describe the severity degree. Reference [16] proposes an improved energy index to calculate the severity of the voltage sag under the influence of the voltage tolerance curve of ASD with different sag types, however the practicability of user-side evaluation is poor and the influence of non-sensitive equipment on the evaluation results is not considered. The sag energy index only evaluates sag events according to its own sag characteristics, although the magnitude and duration of the sag are closely related to the affected status of the user equipment, the functional expression of the sag energy index cannot fully reflect the affected status of the user equipment. If the influence of the user equipment can be considered comprehensively in the sag energy index—that is, if the voltage tolerance characteristics of the user equipment can be considered—the sag severity can be evaluated more reasonably.
The evaluation methods of the severity of the voltage sag are mainly divided into probability evaluations and fuzzy evaluations. In reference [17], a system method based on the vulnerable region of fault-induced voltage sag is introduced, which can effectively evaluate the performance of the system, although its numerical method is complicated to calculate. Reference [18] proposes a new method for transforming rigorously performed statistical data into a fuzzy possibility distribution function. Here, the concept of fuzzy probability is used to calculate the fuzzy trip probability or equipment failure probability, but its computational complexity is large, and it is not suitable for large-scale evaluations. Reference [19] proposes a probabilistic methodology that takes into account the voltage-tolerance ranges for each type of equipment in order to quantify the annual equipment trips due to voltage sags and momentary interruptions for each customer in the distribution network. However, this method requires the voltage tolerance curve of sensitive equipment [20,21,22], which is difficult to apply in practice.
Reference [23] proposes a method in which the tolerance curve of sensitive equipment considers the sag type, and reference [24] proposes a method in which the tolerance characteristic curve of the frequency converter is different under different sag types. However, the key factor of the influence of the sag type on user equipment has not been considered in the study of the sag energy index. At the same time, because the power supply phase of the user equipment is different when it is connected to the grid node, the equipment consequence status and failure probability are different even when caused by the same sag event. Existing studies have ignored the important influence of the equipment power supply relative to the results of sag evaluation. Thus, the sag type should be reasonably included in evaluations of the sag energy index.
In order to solve the above problems, this paper proposes a voltage sag severity evaluation method for the system side which considers the influence of the voltage tolerance curve and sag type, as this can reflect the influence of different types of sag events on different types of equipment and achieve hierarchical evaluations in uncertain areas. By constructing comparison benchmark values and weight coefficients, an improved energy index evaluation model is established in order to achieve the classification of the severity of sag events. Comprehensively considering the influence of the sag type on the user equipment to construct an energy index correction factor, and according to the measurement function, the improved energy interval index considering the influence of sag type is sorted by the severity of multiple sag events, so as to achieve reasonable and accurate quantification of the severity of sag events. The overall organizational framework of the article is shown in Figure 1.
The rest part of this paper is organized as follows. Section 2 describes the improved energy index combined with the voltage tolerance curve. Section 3 presents the energy index correction factor considering the sag type. Section 4 shows the node voltage sag evaluation based on an improved energy index. A case study in Section 5 proves the correctness of the theoretical analysis. Finally, the conclusions are drawn in Section 6.

2. Improved Energy Index of Voltage Sag Combined with Voltage Tolerance Curve

In this section, the comparison reference value of the energy index is obtained based on the voltage tolerance curve, and the two-dimensional space formed by the sag amplitude and duration is divided into 6 sub-regions. The distance from the upper and lower limits of the tolerance curve to the voltage sag event is then used as the weight coefficient, so as to establish an improved energy index model and quantify the severity of each sub-region. On this basis, the severity of voltage sag events is graded. This can effectively guide users to manage voltage sag events and has practical engineering significance.

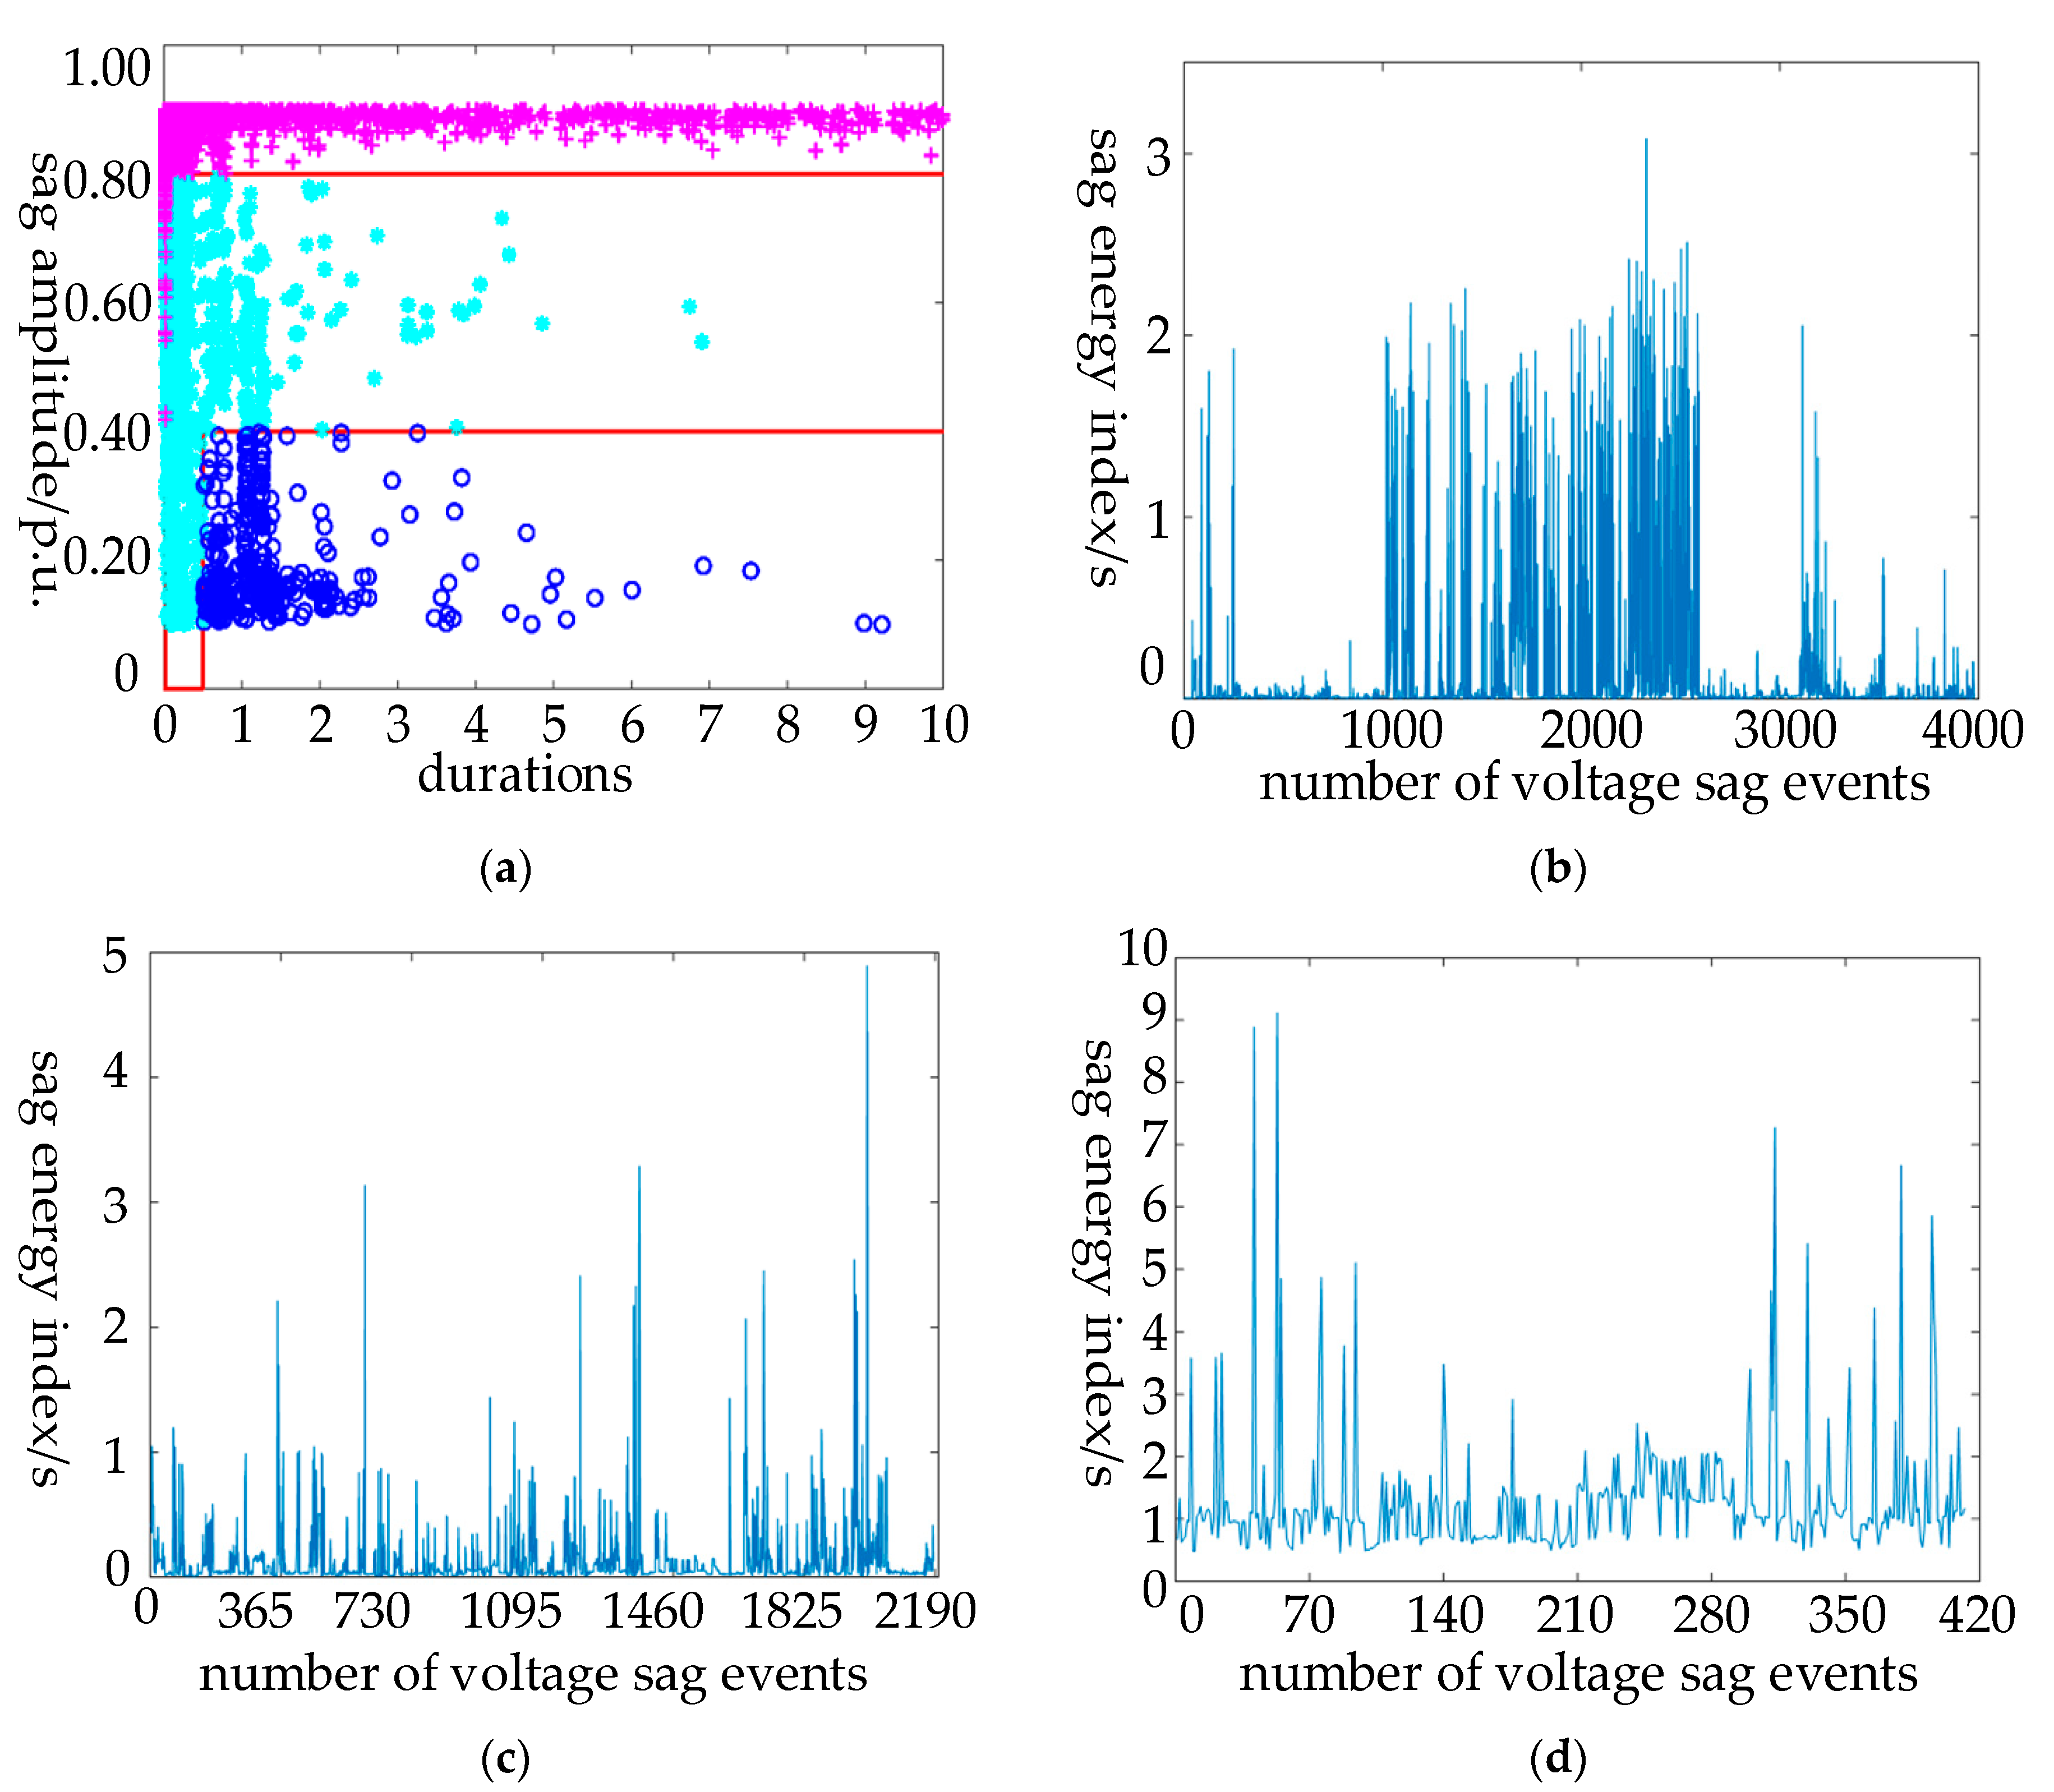
2.1. Voltage Sag Energy Index

The energy index is derived from the distribution characteristics of CBEMA curve, which can essentially reflect the tolerance level of sensitive equipment to voltage sags; it can also indirectly reflect the severity of the voltage sag event from the point of view of the reduced value of the energy transferred from the system to the load, which is reasonable and universal. According to the power quality monitoring equipment, the characteristic quantities, such as the sag amplitude and duration, can be obtained, and the voltage sag energy index Evs [6] can then be calculated, as shown in Equation (1):
E v s = 0 T 1 U U N 2 d t
where, U is the voltage sag magnitude; UN is the rated voltage; T is the voltage sag duration.

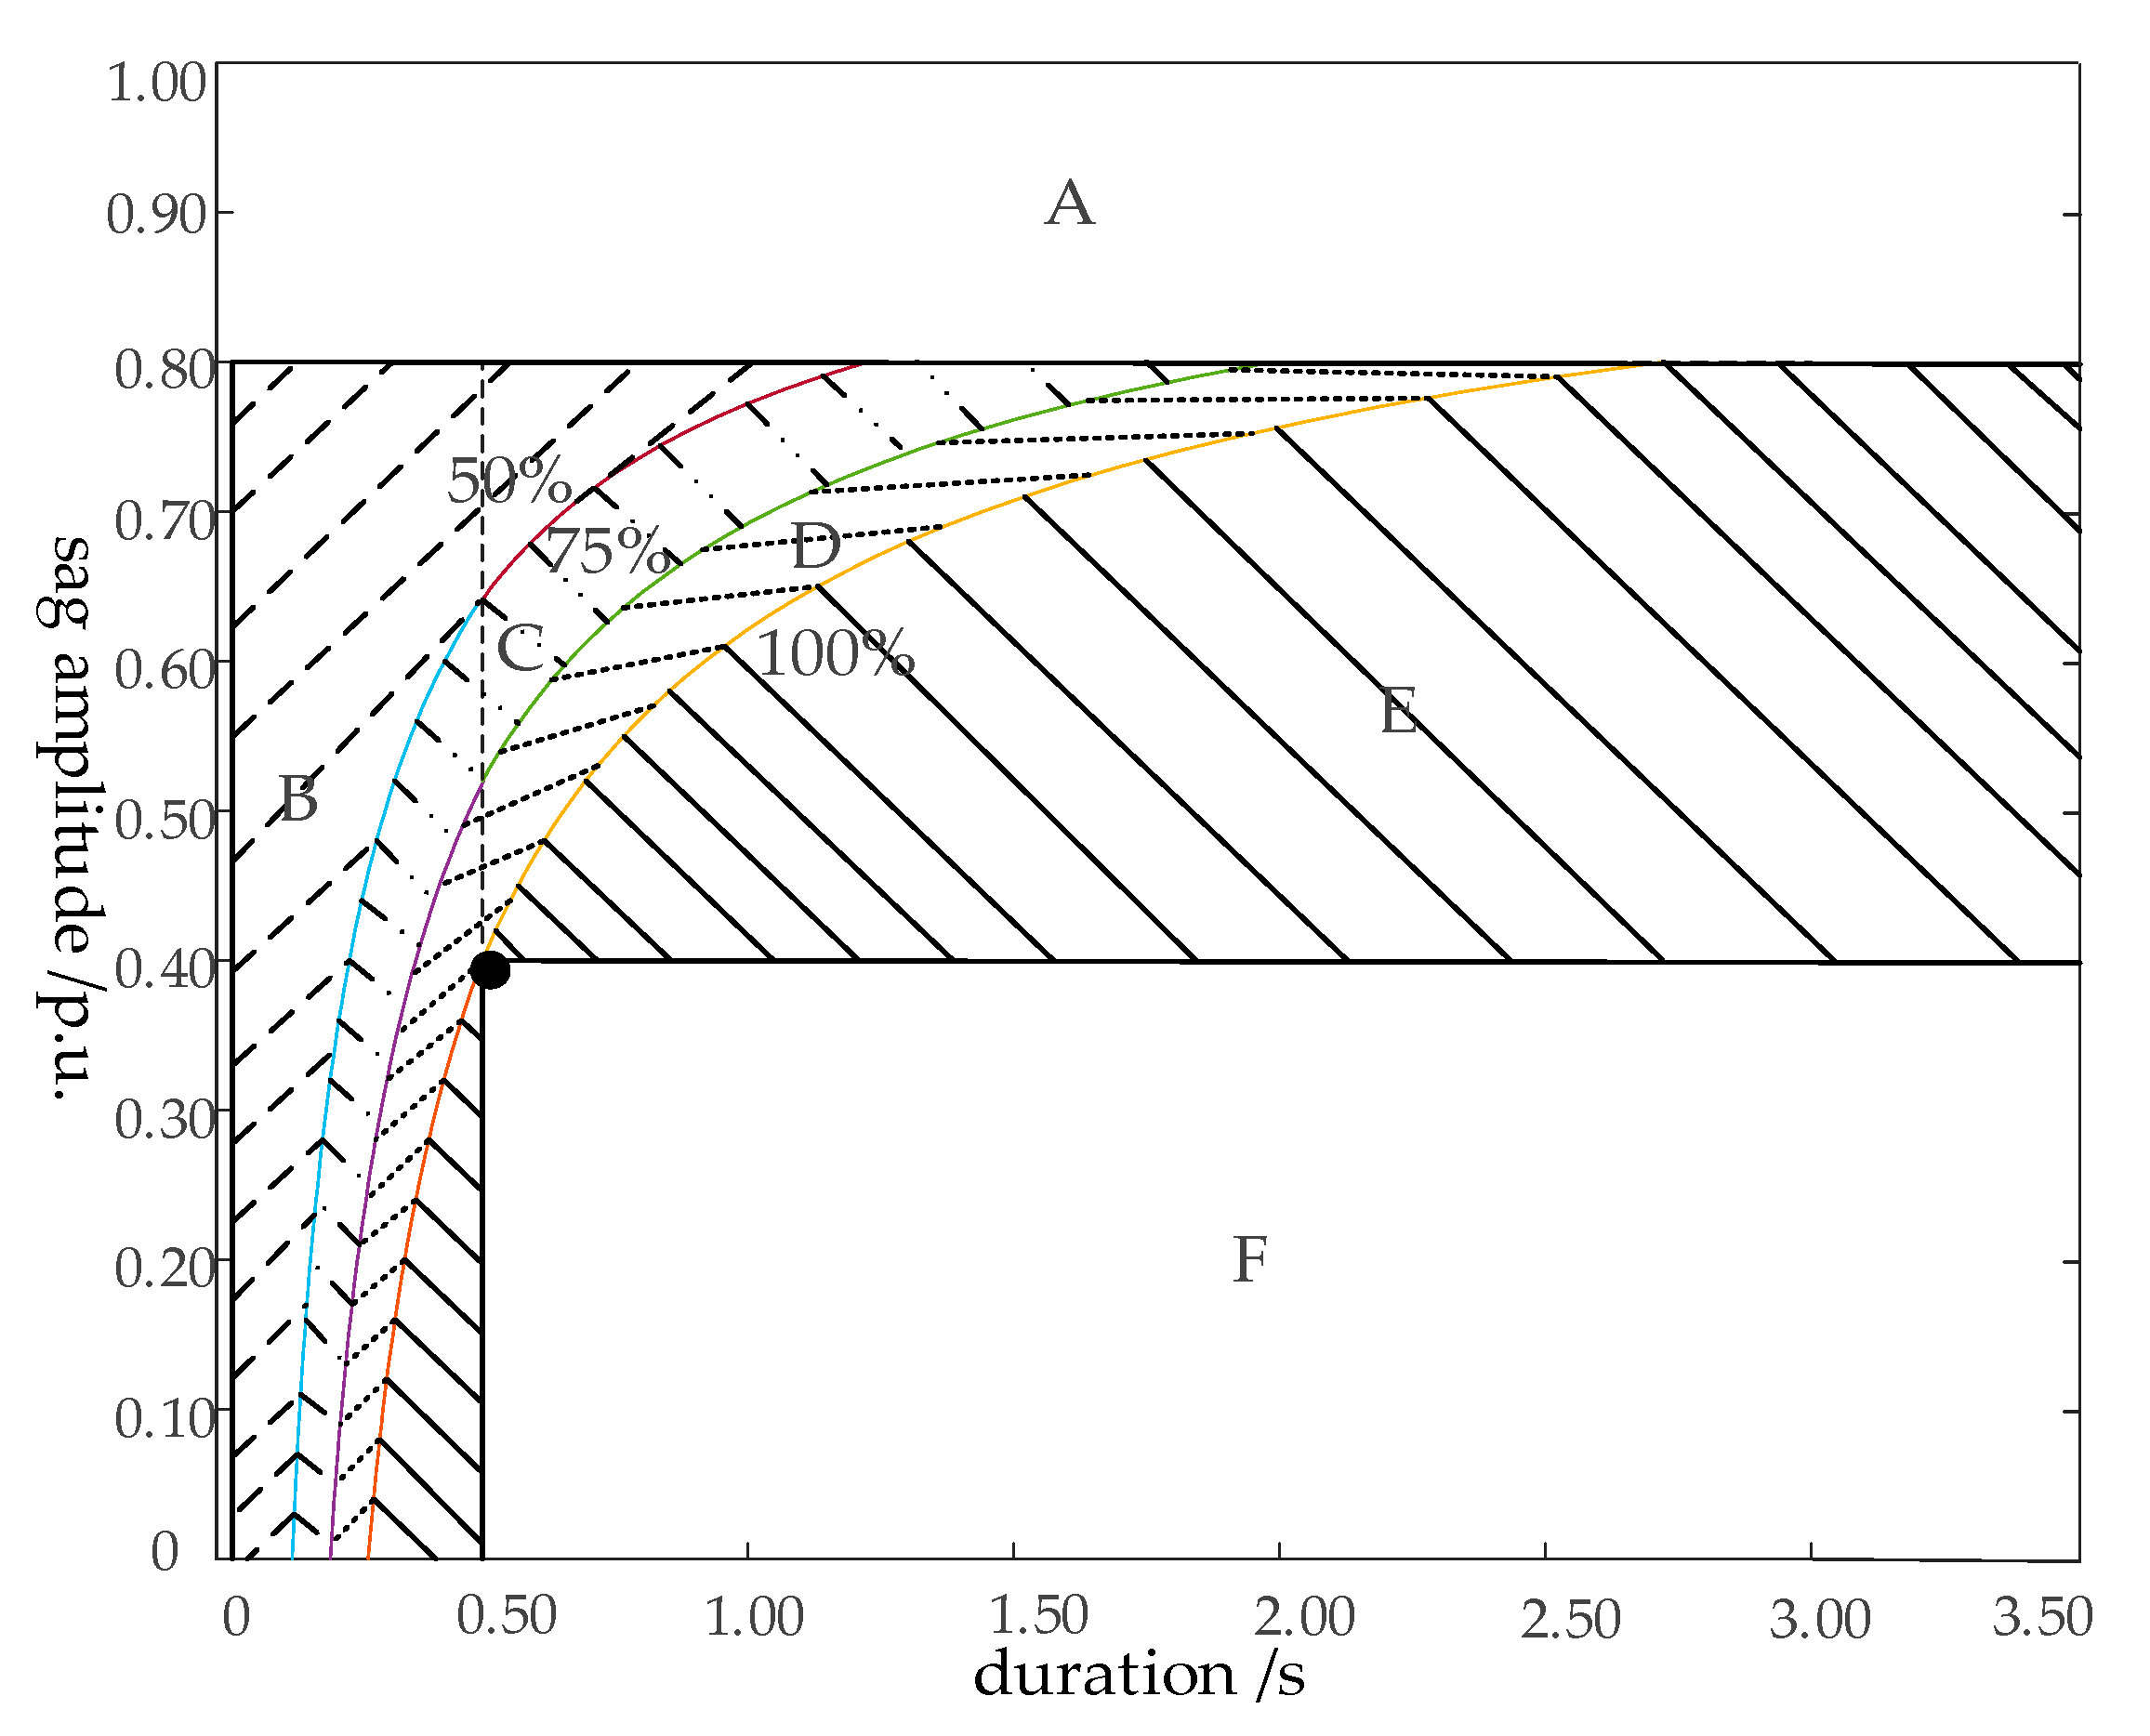
2.2. Voltage Tolerance Curve

The Voltage Tolerance Curve (VTC) can be roughly divided into two categories. The first category is related to the user-side-oriented sensitive equipment, in which the VTC is obtained through a large number of repetitive experimental tests. However, due to the wide variety of the actual equipment utilized by users, there are differences in sag tolerance characteristics, which makes it difficult to collect user information and limits the engineering practicability. The second category is related to system side node users, in which, in accordance with the requirements and regulations of industry equipment manufacturers, VTC is given in a single curve form so that it is easy to execute. At present, the single curves that are widely used at home and abroad are mainly ITIC curves which are suitable for computers and SEMI F47 curves which are suitable for use in semiconductor manufacturing equipment. However, there are regions of uncertainty in essence [25,26,27]. Therefore, this paper is oriented to the research and analysis of the grid system side. Starting from the perspective of a user composed of multiple pieces of equipment, the specific voltage sag tolerance characteristics of the user’s internal equipment are no longer be considered, and the SEMI F47 curve, ITIC curve and the sensitive equipment tolerance curve proposed by the C4.110 working group are summarized and aggregated into the upper and lower limits of the user voltage tolerance curve, as shown in Figure 2. In this way, the user’s overall sag tolerance characteristics are represented. The severity of the amount that equipment is affected by the sag is then indirectly reflected, solving problem around the difficulty in collecting equipment information. In Figure 2, when U > 0.80 p.u. or T < 0.02 s, the equipment is in the normal operation region; when U < 0.40 p.u. and T > 0.50 s, the equipment is in the fault abnormal region; and other regions are regarded to be uncertain regions. In the following studies, the user voltage tolerance curve is used as the voltage tolerance curve.

2.3. Problems with Energy Index and Voltage Tolerance Curve

The distribution of 6576 voltage sag events that occurred in a city from January 2019 to July 2020 is shown in Figure 3a. Among them, the number of voltage sag events in the normal operation region is 3979, the number of voltage sag events in the uncertain region is 2185, and the number of voltage sag events in the abnormal region is 412. The value of the energy index in Figure 3b–d also reflects the severity of the voltage sag to a certain extent.
By comparing Figure 3b with Figure 3d, it is found that the energy index value of some voltage sag events occurring in the normal operation region is greater than that of some voltage sag events occurring in the fault anomaly region, because the distribution characteristics of the energy index are determined by the energy index function itself. However, the user equipment has certain tolerance characteristics, and within the tolerance range, the response of the user equipment to the sag event is not affected. It can be seen that the energy index can only reflect the severity of the sag event, which may lead to over-evaluation according to the results. Only when the sag event is considered in terms of the user equipment—that is, when the equipment tolerance characteristics are considered—can the influence of the voltage sag on the actual equipment be understood. Therefore, the voltage tolerance characteristics and sag event characteristics of user equipment should be comprehensively considered in order to evaluate the severity of sag events.
It can be seen from the voltage tolerance curve that when T > 0.50 s, the severity of the sag event is only related to the sag amplitude. If it is at the same sag amplitude, the voltage tolerance curve will reflect the same severity as the voltage sag. However, from Figure 3c, it can be seen that with the change of T, the severity of the sag event in the uncertainty region also changes. Therefore, the impact of sag events on user equipment in the uncertain region of voltage tolerance curve needs further quantitative analysis.

2.4. Sag Energy Index Based on Voltage Tolerance Curve

2.4.1. Construction of Comparison Benchmark Values

The voltage tolerance curve is composed of the upper limit curve oabc and the lower limit curve odef, as shown by the thick solid line in Figure 2, which can judge the distribution of the consequence state of the user equipment under the sag event. When the sag event is above the upper limit curve, the user equipment is not affected by the sag event in the normal operation region; when the sag event is below the lower limit curve, the user equipment must fall in the abnormal fault region; and when the sag event is between the upper limit curve and the lower limit curve, the consequence state of user equipment is difficult to be determined in the uncertain region. At the same time, due to the lack of a comparative benchmark value of the sag energy index, the severity of a single sag event cannot be reflected by the calculation results. Based on this, this paper selects the upper limit curve and the lower limit curve of the voltage tolerance curve in order to construct the comparison reference value of the energy index. According to the physical meaning of the energy index, in this paper, the comparison reference value based on the upper limit curve is defined as the energy reduction value during the energy transmission from the system side to the user side, from the start time to the time when the load is just affected by the voltage sag, as shown in Equation (2). The comparison reference value based on the lower limit curve is defined as the energy reduction value during the energy transmission from the system side to the user side, from the beginning to the time when the load just exceeds the ability to tolerance voltage sag, as shown in Equation (3):
E v s c 1 = 1 ( U U L C U N ) 2 T
E v s c 2 = 1 ( U L L C U N ) 2 T
where, UULC and ULLC are the reference voltage values in the upper limit curve oabc and the lower limit curve odef in Figure 2. When T is different, the two should take the voltage values on the curve in the corresponding time period, respectively, where UULC is 0 or 0.80, ULLC is 0 or 0.40; Evsc1 and Evsc2 are the comparison reference values of energy index based on the upper limit curve oabc and the lower limit curve odef.
After obtaining the comparison reference value of the energy index, the multiple relationship between the actual reduction value of the user’s energy transmission during the sag time and the energy reduction value during the sag time when the load starts to be affected by the voltage sag, as shown in Equation (4), should first be calculated. Subsequently, the multiple relationship between the actual reduction value of the user’s energy transmission during the sag time and the reduction value of the energy during the sag time that just exceeds the load capacity to tolerance the voltage sag, as shown in Equation (5), should then be calculated.
E ¯ v s = E v s / E v s c 1
E v s = E v s / E v s c 2
where, Ēvs and Evs are the energy index values based on the comparison reference values of the upper limit curve oabc and the lower limit curve odef, respectively.
It is clear that when Ēvs < 1, Evs < 1, it indicates that the user equipment is in the normal operation region. When Ēvs > 1, Evs > 1, it indicates that the user equipment is in the abnormal region. Therefore, based on the energy index of the baseline value, not only can the problem of the unreasonable distribution of the energy index function in the normal operation region as a result of the long duration be solved, but also the quantitative evaluation of the severity of a single sag event can be realized. However, when Ēvs > 1 and Evs < 1, the sag event is in an uncertain region and its severity cannot be judged, so further quantitative analysis is needed.

2.4.2. Determination of Improved Energy Index

When the severity of the sag event in the uncertain region is evaluated, the severity of sag events in the normal operation region and the abnormal fault region should also be considered in order to achieve the unification of the evaluation results. At the same time, since the critical tolerance level of the user equipment to the voltage sag event is described by the voltage sag curve, the consequence state of the user equipment affected by the voltage sag is presented by the distribution of the voltage sag event in the voltage tolerance curve. Therefore, according to the distribution of voltage sag events in the voltage tolerance curve and the relative position of voltage sag events with the upper limit curve and the lower limit curve, the two-dimensional space composed of the sag amplitude and duration is divided into six sub-regions: I, II, III, IV, V and VI for evaluation, as shown in Figure 2.
Since the upper limit curve and the lower limit curve in each sub-region are not the same, the influence of the two on the energy index, based on the comparison reference value, is also different. When the sag event is close to the upper limit curve, the severity of the sag event should, in theory, be smaller; when the sag event is close to the lower limit curve, the severity of the sag event should, in theory, be greater. Therefore, the distance between the upper limit curve and the lower limit curve to the sag event can be used as the weight coefficients of their respective sub-regions, as shown in Equations (6) and (7). On this basis, the energy index based on the comparison reference value is combined with the weight coefficient, and the influence of sag time is considered in order to obtain the energy index in the sub-region corresponding to the sag event, which is defined as the improved energy index in this paper, as shown in Equation (8):
α = α Ι α Ι Ι α Ι Ι Ι α Ι V α V α V Ι = 1 / 2 ( U max U ) / U max ( U U max ) / ( 2 U U max ) ( U min U ) / ( U min + U max 2 U ) ( U max U ) / ( U max U min ) ( U U max ) / ( 2 U U min U max )
β = β Ι β Ι Ι β Ι Ι Ι β Ι V β V β V Ι = 1 / 2 U / U max U / ( 2 U U max ) ( U max U ) / ( U min + U max 2 U ) ( U U min ) / ( U max U min ) ( U U min ) / ( 2 U U min U max )
E v s = α ,   β E v s E v s T
where, α and β are the weight coefficients of the energy index based on the upper limit curve and the lower limit curve, respectively; αi and βi are the weight coefficients of the energy index based on the upper limit curve and the lower limit curve in the sub-region i (i = I, II, III, IV, V, VI), respectively, where, since region IV is located below the upper limit curve and the lower limit curve, other regions are located above the upper limit curve or the lower limit curve and thus the change trend of the weight coefficient of region IV should be mirror-symmetrical with other regions; Umax and Umin are the maximum and minimum voltage of the voltage tolerance curve, respectively, where Umax is 0.80 and Umin is 0.40. E v s is the improved energy index value of voltage sag events. The E v s values of all regions shows a positive trend from small to large, and the minimum value of region IV is the maximum value of region V. Therefore, the E v s value of region IV should start to increase from the maximum value of region V.

2.4.3. Severity Classification of Sag Events

Based on the above analysis, the E v s values of voltage sag events in different sub-regions can be obtained by sorting out Equations (1)–(8), as shown in Equation (9):
E v s = T ( 1 U 2 ) T ( 1 U 2 ) ( 25 20 U ) / 9 T ( 1 U 2 ) ( 34 U 20 ) / ( 18 U 7.2 ) T ( 1 U 2 ) ( 910 1750 U ) / ( 226.8 378 U ) T ( 1 U 2 ) ( 275 250 U ) / 63 T ( 1 U 2 ) ( 250 U 170 ) / ( 126 U 75.6 )
In region I, E v s - max = T, which indicates that no matter how the sag amplitude changes, the severity of the sag is very small due to the small value of T. In region III and region VI, with the decrease of sag amplitude and the increase of sag duration, the value of E v s also increases, and after calculation, E v s - max = 0.43T. When the value of T is large, the value of E v s - max is also large, but considering that user equipment is basically unaffected by the sag event when the voltage value is high, it is considered that the severity of the sag in region III and region VI is also small. In summary, when the sag event is located in region I, region III and region VI—that is, in the normal operation region—the severity of the sag event is very small and is defined as region A. When the voltage sag event is located in region IV—that is, in the fault abnormal region— E v s - min = 2.33T. Since Tmin = 0.50 s, the value of E’vs is large, and the severity of the sag is very large at this time and is defined as region F.
When the voltage sag event is located in region II and region V it is considered to be in the uncertain region. At this point, in region II, E v s ∈ [0.36T, 2.78T]; and in region V, E v s ∈ [0.43T, 2.33T]. Since the severity of sag events are different in uncertain regions, and users only care about the sag events that may affect them, evaluating the severity of all sag events in the uncertain regions will result in a waste of human and financial resources. At this time, only the sag events with larger severity are selected. Therefore, the severity level of sag events in the uncertain region can be classified into grades in order to realize the rapid selection and reasonable evaluation of sag events with different severity levels.
First of all, a reasonable threshold should be selected as the judgment basis for the qualitative analysis of severity. When T > 0.50 s or U < 0.40 p.u., the equipment may fail due to the sag event. At this time, the coordinate point (0.50 s, 0.40 p.u.) can be considered as the critical failure point. According to the E v s expressions of region II and region V, the critical fault function relationship between U and T in the uncertain region can be obtained, as shown in Equations (10) and (11):
T 1 = 7.137 20 U 1 3 25 U 1 2 20 U 1 + 25
T 2 = 73.5 250 U 2 3 275 U 2 2 250 U 2 + 275
where, the value range of U1 is [0, 0.40]; the value range of T1 is [0.29, 0.50]; the value range of U2 is [0.40, 0.80]; and the value range of T2 is [0.50, 2.72].
According to the critical fault function, the critical fault curve can be drawn in the uncertain region. At the same time, the 75% probability value and 50% probability value of the critical fault value are selected as the classification standard. Three determined curves can then be obtained for U and T in the uncertain region. The severity of the voltage sag events in the uncertain region is divided into four regions: B, C, D and E. The normal operation region and fault anomaly region are then considered, so as to obtain the severity classification region of voltage sag events, as shown in Figure 4.
When voltage sag events are in different regions, their severity levels are different, as shown in Table 1. When the voltage sag event is located in area A, it means that the sag event is located in the normal operation area. This means that the voltage sag event basically has no impact on the user and the severity of the sag event is extremely low; therefore, its severity level is defined to be extremely low. When the sag event is located in area B, it can be seen from Figure 4 that the probability of equipment failure caused by these sag events is less than 50%. Thus they have little impact on users and the severity of the sag event is small; therefore, the severity level is defined as low. When the sag event is located in area C, it can be seen from Figure 4 that the probability of equipment failure caused by these sag events is greater than 50% but less than 75%. As such, they have little impact on users and the severity of the sag event is slightly small; therefore, the severity level is defined as slightly low. When the sag event is located in area D, it can be seen from Figure 4 that the probability of equipment failure caused by these sag events is greater than 75% but less than 100%. Thus, they have a great impact on users and the severity of the sag event is slightly large; therefore, its severity level is defined as slightly high. When the sag events are located in area E, it can be seen from Figure 4 that the probability of equipment failure caused by these sag events is 100%, but since they are still in the uncertain area, the severity of the sag events is slightly lower than that in the abnormal area. They have a great impact on users and the severity of the sag events is large and, for this purpose, its severity level is defined as high. When the voltage sag event is located in area F, it means that the sag event is located in the abnormal operation area; the event will cause user failure and the severity of the sag event is extremely high, therefore, its severity level is defined as extremely high.

3. Energy Index Correction Factor Considering Sag Type

3.1. The Necessity of Revising the Energy Index Based on the Sag Type

The vast majority of voltage sag events in the power system are caused by short-circuit faults. Due to the different types of faults, the sag types are also different. Thus, the international joint working group CIGRE/CIRED/UIE C4.110 divides voltage sags into three categories: one is the single-phase sag (Type I) caused by the single-phase ground fault, which is mainly characterized by a one-phase sag while the other two phases are normal; the second is the two-phase sag (Type II) caused by the two-phase short circuit fault or two-phase ground fault, which is mainly characterized by a two-phase sag while the remaining one-phase is normal; the third is the three-phase Sag (type III) caused by three-phase ground short circuit fault, which is mainly characterized by the sag occurring in all three phases. For the above three types of voltage sags [23], the working group also gave their corresponding equipment voltage tolerance curves, as shown in Figure 5.
In fact, user equipment is not only affected by the sag amplitude and duration, but also by the sag type. When two sag events with the same sag amplitude and duration but with different sag types occur, although the Evs are the same, the influence on the user equipment may be completely different, which cannot reflect the actual situation. For example, in the case of two sag events with a sag amplitude of 60% and a duration of 0.10s, if one sag event is sag type I, the user equipment will be in a normal operation state, and if the other sag event is sag Type III, the user equipment will be in an abnormal operation area. In addition, a lot of user equipment is usually connected to the bus node, which is divided into a single-phase load and a three-phase load, according to the number of power supply phases connected to the power grid. These loads are affected differently by the voltage sag under the same sag type. For example, when the A-phase grounding fault occurs, there is basically no effect on the single-phase load (whose power supply phase is B-phase or C-phase), and only the single-phase load or three-phase load (whose power supply phase is A-phase) can cause equipment failure. Thus, when using a sag energy index to evaluate voltage sag events, the influence of sag type should be considered, so that the evaluation result is more in line with objective reality.

3.2. Energy Index Correction Factor Considering Sag Type

In this section, we first consider the differences in probability distribution of voltage sag events in the equipment tolerance curve caused by different sag types, and then obtain the probability value of the user affected by sag events under different sag types based on the different wiring modes of equipment, and, finally, the correction factor of energy index is obtained by considering the above relationship between them.

3.2.1. Correction Factor of the Influence of Sag Type on Voltage Tolerance Curve

It can be seen from Figure 5 that the voltage tolerance curves of the user equipment under different sag types are different, and the difference between the voltage tolerance curves can be used to quantitatively describe the influence of the sag type on the user equipment. Thus, this paper proposes that the probability value of the voltage sag event in the abnormal operation area under each sag type is equal to the ratio of the area under the curve to the area of the whole sag amplitude-duration plane, as shown in Equation (12):
p i = S i S
where, Si is the area below the voltage tolerance curve under three types of sags, i = I, II, III; S is the area of the whole plane; and pi is the probability value of user equipment failure under three sag types, which is calculated as shown in Table 2.

3.2.2. Correction Factor for the Influence of Sag Type on Load

Whether the single-phase load is affected by the sag event depends mainly on whether the sag phase is the power supply phase. When the sag type is Type I, the single-phase equipment is only affected by the sag event when the power supply phase is the sag phase, and the probability of this occurring at this time is 1/3; when the sag type is Type II, the probability that the power supply phase of the single-phase equipment is connected to the two-phase line of sag is 2/3; and when the sag type is Type III, the single-phase equipment must be affected by the sag—that is, the probability value is 1. Since the three-phase loads are connected to the power supply line of the power grid, regardless of the type of sag, the three-phase equipment will be affected by the occurrence of the sag event, and the probability value of the occurrence is always 1. According to the above analysis, it can be seen that the probability values of the user equipment being affected by the sag event under single-phase sag, two-phase sag and three-phase sag are shown in Equation (13):
k I =   1 / 3 ,   l = 1   1   ,   l = 2
k I I =   2 / 3   ,   l = 1   1   ,   l = 2
k I I I = 1 , l = 1 ,   2
where, kI, kII, and kIII are the probability values of the user equipment being affected by the sag event under single-phase sag, two-phase sag and three-phase sag, respectively; l = 1, 2 represent single-phase equipment and three-phase sag equipment respectively.

3.2.3. Determination of Energy Index Correction Factor

According to the probability value of the influence of the sag type on the user equipment, the severity of the voltage sag event can be indicated. The purpose of the correction coefficient is also to accurately reflect the consequence state of the user equipment, so that a one-to-one corresponding functional relationship can be established between the correction coefficient and probability value. On this basis, the probability value obtained by comprehensively considering the influence of the sag type on the equipment voltage tolerance curve and load (in order to make the correction factor have a certain compatibility) and the value range boundary of the energy index correction factor can be selected as the minimum value and the maximum value, as shown in Equation (14):
min μ i = min ( p i , k i ) max μ i = max ( p i , k i )
where, pi is the probability value obtained based on the influence of three sag types on voltage tolerance curve; ki is the probability value obtained based on the influence of three sag types on different equipment wiring modes; and μi is the correction factor of energy index based on sag type. In this case, it is clear that μI = 0.33~1, μII = 0.67~1, μIII = 0.79~1.

4. Evaluation of Voltage Sag Based on Improved Energy Index

4.1. Improved Energy Index Considering Sag Type for Single Sag Event

In Section 2, the improved energy index of the sag event is formed after comprehensively considering the voltage sag characteristics and the equipment tolerance curve. In Section 3, the energy index correction factor is formed after analyzing the influence of the sag type on the user equipment. Thus, the improved energy index after considering the type of sag for a single sag event can be obtained, as shown in Equation (15):
E v s = μ i E v s
where E v s is the improved energy index considering the type of sag.

4.2. Severity Ranking of Multiple Voltage Sag Events Based on Measurement Function

When multiple voltage sag events occur at a node, the improved energy index considering the type of sag can be calculated separately for each sag event. In order to make a quantitative comparison and ranking of the severity of each sag event, in this paper the measurement function ζ is used to measure the order relationship between the interval numbers [28]. Assuming that [x] and [y] are interval numbers, then the measurement function ζ([x], [y]) is defined as shown in Equation (16):
ζ ( [ x ] , [ y ] ) = m [ y ] m [ x ] + 2 sgn ( m [ y ] m [ x ] ) ( r [ y ] + r [ x ] = 0 ) m [ y ] m [ x ] r [ y ] + r [ x ] + sgn ( m [ y ] m [ x ] ) ( m [ y ] m [ x ] , r [ y ] + r [ x ] 0 ) r [ y ] r [ x ] max ( r [ x ] , r [ y ] ) ( m [ y ] = m [ x ] , r [ y ] + r [ x ] 0 )
sgn ( x ) = 1 ,   x < 0 0 ,   x = 0 1 ,   x > 0
where, m [ x ] and m [ y ] are the midpoint of interval numbers [ x ] and [ y ] , respectively. That is, m [ x ] = ( x ¯ + x _ ) / 2 , m [ y ] = ( y ¯ + y _ ) / 2   r [ x ] and r [ y ] are the radius of interval number [ x ] and [ y ] , respectively, that is, r [ x ] = ( x ¯ x _ ) / 2 , r [ y ] = ( y ¯ y _ ) / 2 . Based on Equations (16) and (17), the order relationship between interval numbers [ x ] and [ y ] can be determined, as shown in Equation (18), and thus the severity of multiple voltage sag events can be sorted.
ζ ( [ x ] ,   [ y ] ) = 0 [ y ] = [ x ] ζ ( [ x ] ,   [ y ] ) > 0 [ y ] > [ x ] ζ ( [ x ] ,   [ y ] ) < 0 [ y ] < [ x ]
In addition, if there is a voltage sag event with multiple nodes in the power grid, when the overall situation and average situation of the severity of the sag at the node are considered, the improved energy index (after considering the type of sag) can be calculated based on the monitoring data of each node in the system. The average improved energy index value and the total improved energy index value at each node can then be calculated, as shown in Equations (19) and (20).
E v s a v = 1 n b f = 1 n b μ i E v s
E v s s u m = f = 1 n b μ i E v s
where, E v s a v is the average improved energy index value; E v s s u m is the total improved energy index value; and nb is the number of voltage sag events at node b. On this basis, the above node indexes are calculated according to Formulas (16) and (17), and the sag severity ranking results between the multiple nodes are obtained.

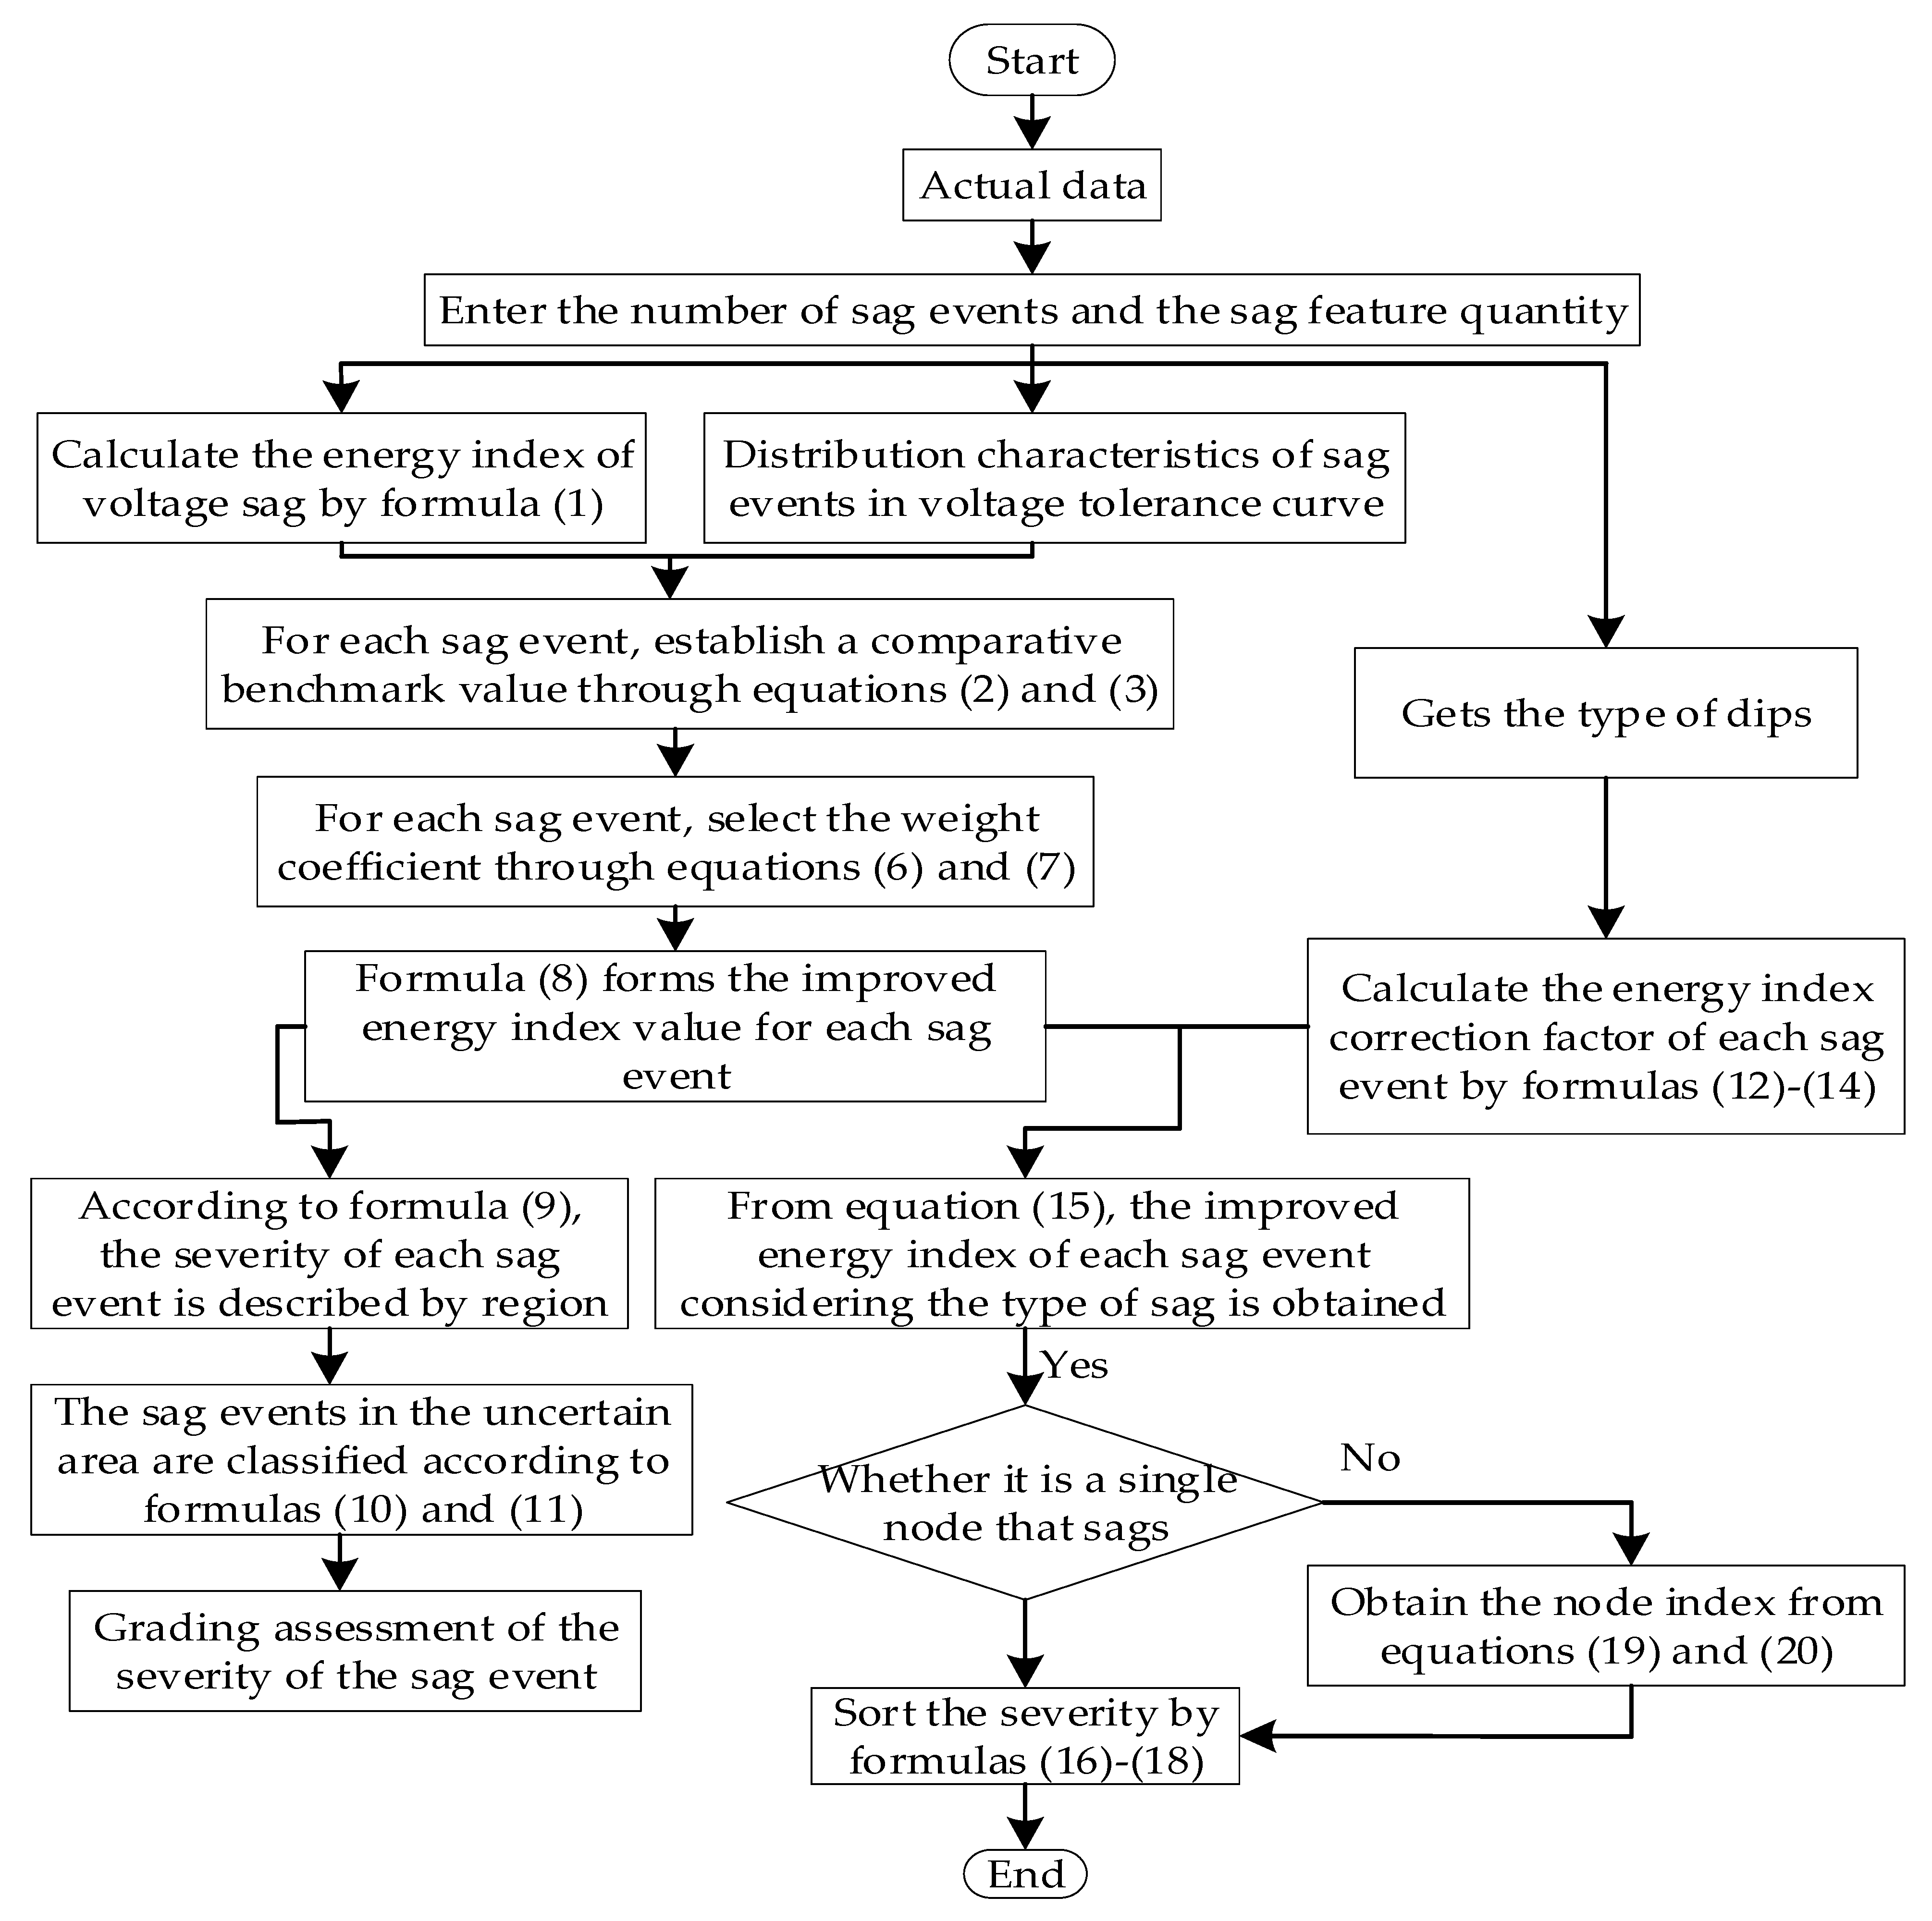
4.3. Voltage Sag Evaluation Process Based on Improved Energy Index

Based on the above analysis, the steps required to evaluate the severity of voltage sag events based on the improved energy index proposed in this paper mainly include:
  • The sag events and sag characteristic quantities, according to the measured data, are input;
  • According to the characteristic quantities of each sag event, the corresponding energy index is calculated and the distribution in the comprehensive load tolerance curve is obtained;
  • According to the distribution characteristics of each sag event, the corresponding comparison benchmark value and weight coefficient are selected to form an improved energy index, and, on this basis, the zoning and grading evaluation of the severity of the sag event is carried out;
  • The correction factor of energy index is formed based on the type of each sag event, and the improved energy index considering the type of sag is obtained by combining the improved energy index;
  • The sorting result of the severity of multiple sag events of a single node and the sorting result of the average improved energy index of multiple nodes are output. The specific process is shown in Figure 6.

5. Case Studies

5.1. Monitoring Data Acquisition

In this paper, 24 voltage sag data at a monitoring node are taken as an example for analysis. The sag amplitude, duration, and sag type of each sag event are shown in Table 3.

5.2. Evaluation Results and Analysis

The monitoring node is connected with a lot of user equipment because the user information is difficult to obtain. In this paper, the comprehensive load tolerance curve is taken as the voltage tolerance curve of each user to simplify the analysis. Based on the comprehensive load tolerance curve, the comparison reference value of each sag event is calculated according to Formulas (2) and (3), and the energy index based on the comparison reference value is then obtained through Formulas (4) and (5), as shown in Figure 7.
As shown in Figure 7, the energy index values obtained from the upper limit curve and the lower limit curve are compared with the value 1 respectively, it can be seen that the sag events 2, 5, 13, 17, 18 and 23 are in the normal operation region; the sag events 9, 10, 11 and 12 are in the abnormal region of the fault; and the other sag events are in the uncertain region. Therefore, the problem of single sag events not being able to be quantified due to the lack of comparative reference value of energy index is solved, indicating the feasibility of the comparison reference value based on the construction of voltage tolerance curve.
According to the sag amplitude and duration in Table 3, the voltage sag energy index before improvement can be calculated through Formula (1). Based on the comprehensive load tolerance curve, the weight coefficient of each sag event is calculated according to the voltage sag event distribution characteristics and combined with the energy index based on the comparison reference value, from which the improved energy index can be obtained. From this, the severity level of the voltage sag event can be obtained, as shown in Figure 8. Meanwhile, the energy index is compared before and after improvement, as shown in Figure 9.
From Figure 8, the distribution of voltage sag events located in the uncertainty region in each severity level region can be seen: sag events 4, 6, 7, 8, 15, 20, 22 and 24 are located in region B and the severity level is excellent; sag events 1 and 14 are located in region C, and the severity level is good; sag events 3, 16 and 21 are located in region D, and the severity level is medium; and sag event 19 is located in region E, and the severity level is poor. As such, the graded evaluation of the severity of the sag event in the uncertain region is realized, which is considered to be advanced. In addition, it also can be seen from Figure 7 that sag events 2, 5, 13, 17, 18 and 23 are located in region A, and that the severity level is particularly excellent; and sag events 9, 10, 11 and 12 are located in region F, and the severity level is particularly poor. Thus, the unification of the grading evaluation of the sag event in the whole plane is realized.
It can be seen from Figure 9 that the change trend of the voltage sag energy index before and after the improvement is the same, but the change range is different, because the spatial distribution of the sag event and the upper and lower limits of the voltage tolerance curve are considered in the improved energy index, and the severity of sag event can be distinguished. That is, for the sag event with small change range, its severity is small; and for the sag event with large variation range, its severity is large. Sag events 1, 3, 9, 10, 11, 12, 14, 16, 19, 21 and 22 have a large range of changes before and after improvement. The severity of these sag events is greater than the 50% probability value of the critical fault value, and the severity increases with the increase of the energy index value, which also verifies the rationality and feasibility of the method proposed in this paper.
Based on the above research, the energy index correction factors of the user equipment are obtained after considering the influence of single-phase sag, two-phase sag and three-phase sag on the user equipment, and the improved energy index value after considering the sag type can then be obtained through Equation (15), as shown in Table 4.
It can be seen from Table 4 that the improved energy index value after considering the type of sag is an interval number, where the maximum value of the interval number is the improved energy index when the correction factor is equal to 1, which is the same as the improved energy index without considering the type of sag. In fact, the severity of the sag event is affected by the type of sag to varying degrees, so it is reasonable to describe the severity of the sag event with interval numbers.
Based on the results obtained in Table 4, the 24 voltage sag events at the monitoring node are calculated according to the determination method of the order relationship of the measurement function established in Section 4.2. The severity ranking results of the sag events which consider the influence of user equipment tolerance characteristics and sag types are also obtained through this process. According to the energy index value calculated by Equation (1), the severity of the sag events before improvement is then sorted. Thus, a comparative analysis of the ranking results of the sag event severity before and after the improvement of the energy index can be obtained, as shown in Figure 10.
Figure 10 shows that the severity ranking curves of the sag events before and after the improvement of the energy index are basically the same, which indicates that the improved energy index, considering the equipment tolerance characteristics and the type of sag, is reasonable for evaluating the sag event. Among them, sag events 9, 10, 11, 12 and 19 are always in the front of the ranking, before and after the improvement of the energy index, and have a great impact on users and are equivalent to the fault abnormal region; sag events 2, 4, 6, 13, 15, 17, 18 and 23 are always at the back of the ranking, before and after the improvement of the energy index, and have little impact on users and are equivalent to the normal operation region. In addition, there are situations in which the severity ranking results of sag events change before and after the improvement of energy index: the ranking results of the severity of the sag event 16 and the sag event 21, before and after improvement, are opposite. This is because when the sag types of the two sags are the same, the influence factor of the sag amplitude is larger than that of the duration. That is, it is more realistic to consider the equipment tolerance characteristics. Similarly, the ranking results of the severity of the sag event 3 and the sag event 14, before and after improvement, are also opposite. This is because sag event 14 is a two-phase sag event occurring in region D, while sag event 3 is a single-phase respite event occurring in region C. In the same way, the change in the severity ranking results of sag event 7 and sag events 8, 22, and the change in severity ranking results of sag event 5 and sag event 20, can be analyzed, although this will not be repeated here.

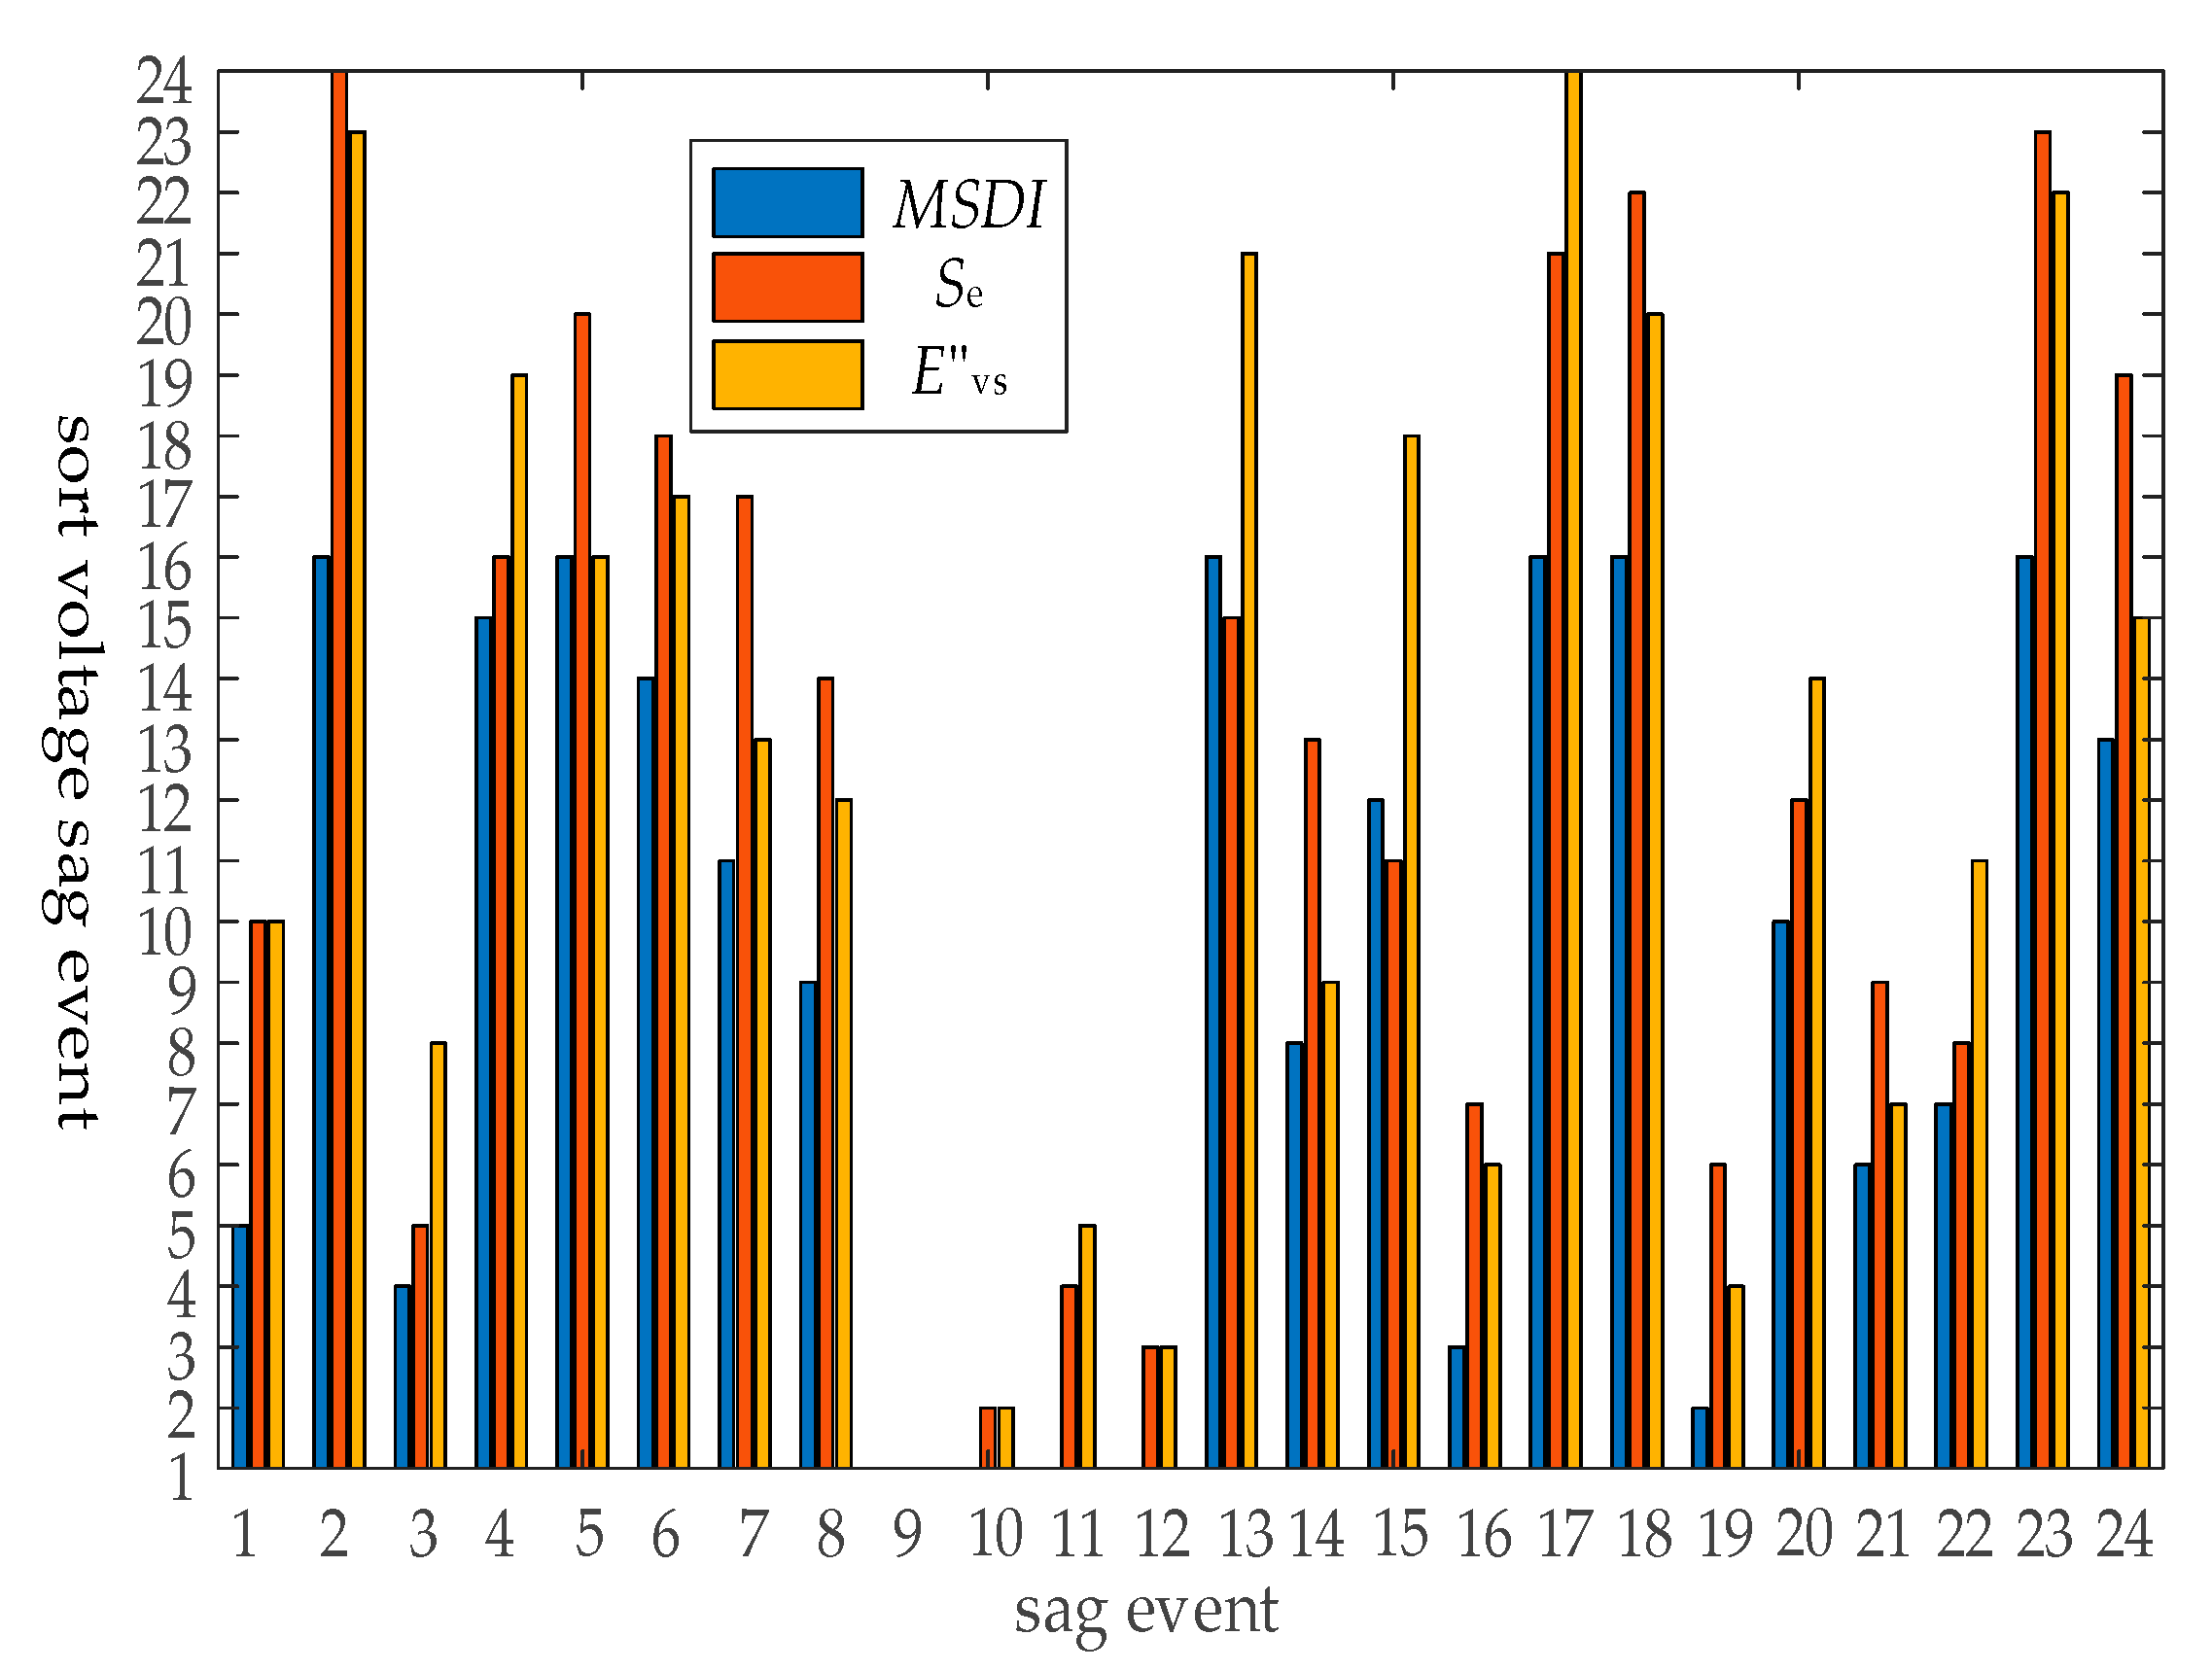
5.3. Comparison of Different Evaluation Indicators

In order to further illustrate the superiority of the improved energy index evaluation method proposed in this paper, the index is compared with the comprehensive severity index MSDI and the severity index Se. Since the severity indexes are usually characterized by a single tolerance curve, the average curve in the tolerance curve can be used to represent the voltage tolerance curve with uncertain regions. Based on the sag event information and voltage tolerance curve, the evaluation results of MSDI and Se of each sag event can be obtained, as shown in Table 5.
The severity of MSDI and Se is sorted and compared with the improved energy index E v s after considering the type of sag, as shown in Figure 11.
It can be seen from Figure 11 that the ranking results of the severity of the sag events obtained by the three evaluation indicators have similar trends, which indicates the feasibility of the indicators proposed in this paper. However, when comparing E v s with MSDI, since the impact of sag type is considered in E v s , over-evaluation of sag events 1, 3, 4, 6, 7, 8, 14, 15, 16, 19, 20, 21, 22 and 24 in the uncertain region is avoided by MSDI and is more in line with the actual situation. At the same time, the severity of the sag events in the normal operation region and the abnormal fault region can be quantified by E v s , and the problem around the severity of MSDI sag events 2, 5, 13, 17, 18 and 23 in the normal operation region being 0 and the severity of MSDI sag events 9, 10, 11 and 12 in the abnormal fault region being 1, leading to the same severity ranking in these two regions, is solved. This is because only the characteristic quantity of the sag amplitude is dependent on Se, which leads to the under-evaluation of the sag events 5, 7, 14 and 24 with a long duration and high sag amplitude and the over-evaluation of the sag events 3, 13, 15 and 22 with a short duration and low sag amplitude. This problem can be overcome by E v s with a comprehensive consideration of the characteristics of the sag amplitude, duration and type of sag.

6. Conclusions

Considering the influence of the user equipment voltage tolerance characteristics and sag types on the evaluation results, this paper proposes a voltage sag severity evaluation method for the system side which considers the influence of the voltage tolerance curve and sag type. The conclusions are as follows:
  • From the perspective of the evaluation of the grid system, the user’s comprehensive voltage tolerance curve is constructed, which avoids the problem of difficult access to user-side information, and indirectly reflects the severity of user equipment affected by the sag.
  • Based on the voltage tolerance curve’s ability to reasonably select the comparison reference value of the energy index, the severity of the sag event located in the normal area and the abnormal area can be quickly evaluated and the problem of the energy index not being able to evaluate the severity of a single sag event is solved, although it remains impossible to assess the severity of the sag event in the uncertain area.
  • Combining the voltage tolerance curve and energy index, through interval division, interval weight calculation and other operations, and considering the requirements of user governance expectations, the establishment of the severity level of voltage sag events in the uncertain area has achieved the purpose of grading evaluation. This can guide the control of the sag and has practical engineering significance.
  • By comprehensively considering the influence of the type of sag type on the voltage tolerance curve and user equipment, the energy index correction factor is constructed, and the measurement function is used to calculate the voltage sag severity ranking in order to achieve the purpose of interval evaluation and to make the evaluation result more in line with the actual situation.
  • Based on the measurement function, the severity results of the multiple sag events of a single node or multiple nodes can be sorted, and the weak nodes of the power grid can be obtained, which can provide a guiding plan for the access of sensitive equipment to the power grid nodes in the future.
  • In future research, it is possible to further analyze issues, such as the tolerance curve of the general equipment on the system side and the mixed load in the user equipment in order to make the evaluation results more realistic.

Author Contributions

Conceptualization, Y.X. and X.F.; methodology, Y.X. and X.F.; software, X.F. and S.D.; validation, Y.X., C.N. and X.F.; formal analysis, C.N. and X.F.; investigation, Y.X. and X.F.; resources, Y.X. and S.D.; data curation, Y.X. and S.D.; writing—original draft preparation, Y.X. and X.F.; writing—review and editing, Y.X. and X.F. All authors have read and agreed to the published version of the manuscript.

Funding

This research received no external funding.

Institutional Review Board Statement

Not applicable.

Informed Consent Statement

Not applicable.

Data Availability Statement

Not applicable.

Acknowledgments

This work is supported in part by the Natural Science Foundation of Beijing (3172036), and in part by the State Grid Tianjin Electric Power Company Science and Technology Project (KJ20-1-11).

Conflicts of Interest

The authors declare no conflict of interest.

References

  1. He, H.; Zhang, W.; Wang, Y.; Xiao, X. A Sensitive Industrial Process Model for Financial Losses Assessment Due to Voltage Sag and Short Interruptions. IEEE Trans. Power Deliv. 2020, 36, 1293–1301. [Google Scholar] [CrossRef]
  2. Yang, D.; Gao, X.; Ma, Z.; Cui, E.; Zhang, H. Novel Voltage Sag Protection Topology of Contactors for Uninterrupted Switching Capability. IEEE Trans. Ind. Appl. 2018, 54, 3170–3178. [Google Scholar] [CrossRef]
  3. Liu, Y.; Xiao, X.; Zhang, X.; Wang, Y. Multi-Objective Optimal STATCOM Allocation for Voltage Sag Mitigation. IEEE Trans. Power Deliv. 2020, 35, 1410–1422. [Google Scholar] [CrossRef]
  4. Wang, Y.; Yang, Y.; Xiao, X. Configuration strategy of shared mitigation equipment for voltage sag considering the demands of users. IET Gener. Transm. Distrib. 2020, 14, 6338–6347. [Google Scholar] [CrossRef]
  5. Motoki, E.; Filho, J.; da Silveira, P.; Pereira, N.; de Souza, P. Cost of Industrial Process Shutdowns Due to Voltage Sag and Short Interruption. Energies 2021, 14, 2874. [Google Scholar] [CrossRef]
  6. IEEE Guide for Voltage Sag Indices; IEEE Std. 1564-2014; IEEE: Piscataway, NJ, USA, 2014; pp. 1–59.
  7. Prajjwal, G.; Prasanna, P.; Rajesh, K. Development and Integration of Momentary Event Models in Active Distribution System Reliability Assessment. IEEE Trans. Power Syst. 2020, 35, 3236–3246. [Google Scholar]
  8. Liao, H.; Abdelrahman, S.; Guo, Y.; Milanovic, J. Identification of Weak Areas of Power Network Based on Exposure to Voltage Sags—Part I: Development of Sag Severity Index for Single-Event Characterization. IEEE Trans. Power Deliv. 2015, 30, 2392–2400. [Google Scholar] [CrossRef]
  9. Rajender, K.; Manish, K.; Anand, N.; Basit, Q.; Akanksha, A. A Critical Analysis of Methodologies for Detection and Classification of Power Quality Events in Smart Grid. IEEE Access 2021, 9, 83507–83534. [Google Scholar]
  10. Amir, S.; Mahmud, F.; Matti, L. A General Framework for Voltage Sag Performance Analysis of Distribution Networks. Energies 2019, 12, 2824. [Google Scholar]
  11. Wu, G.; Zhong, Q.; He, Q.; Xu, Z. Evaluation Method and Probabilistic Index of Voltage Sag Severity Considering Point-on-wave. J. Mod. Power Syst. Clean Energy 2021, 9, 633–638. [Google Scholar] [CrossRef]
  12. Jiang, H.; Xu, Y.; Liu, Z.; Ma, N.; Lu, W. A BPSO-Based Method for Optimal Voltage Sag Monitor Placement Considering Uncertainties of Transition Resistance. IEEE Access 2020, 8, 80382–80394. [Google Scholar] [CrossRef]
  13. Vijaya, H.; Nita, P.; Junghare, A. Computation of Energy Loss in an Induction Motor during Unsymmetrical Voltage Sags—A Graphical Method. IEEE Trans. Ind. Inf. 2018, 14, 2023–2030. [Google Scholar]
  14. Rodney, H.G.T.; Vigna, K.R. Voltage Sag Acceptability Assessment Using Multiple Magnitude-Duration Function. IEEE Trans. Power Deliv. 2012, 27, 1984–1990. [Google Scholar]
  15. Mo, W.; Xu, Z.; Ma, Z.; Li, C.; Lu, W. Estimation of single-event voltage sags using a novel classification method. In Proceedings of the Industrial Electronics Society IECON 2017-43rd Annual Conference of the IEEE, Beijing, China, 29 October–1 November 2017; pp. 233–238. [Google Scholar]
  16. Lv, J.; Liu, Y.; Fan, X.; Deng, S.; Wu, Y.; Ye, X. Node Voltage Sag Severity Evaluation Based on Improved Energy Index. In Proceedings of the 2020 10th International Conference on Power and Energy Systems (ICPES), Chengdu, China, 25–27 December 2020; pp. 38–43. [Google Scholar]
  17. Chang, H.Y.P.; Gilsoo, J. Systematic Method to Identify an Area of Vulnerability to Voltage Sags. IEEE Trans. Power Deliv. 2017, 32, 1583–1591. [Google Scholar]
  18. Behera, C.; Reddy, G.; Chakrapani, P.; Goswami, A.; Gupta, C.; Singh, G. Assessment of Equipment Trip Probability Due to Voltage Sags Based on Fuzzy Possibility Distribution Function. IEEE Access 2018, 6, 76889–76899. [Google Scholar] [CrossRef]
  19. Cebrian, J.; Kagan, N.; Milanović, J. Probabilistic Estimation of Distribution Network Performance with Respect to Voltage Sags and Interruptions Considering Network Protection Setting—Part I: The Methodology. IEEE Trans. Power Deliv. 2018, 33, 42–51. [Google Scholar] [CrossRef]
  20. Xiao, X.; He, H.; Wang, Y. Analytical model of AC contactors for studying response mechanism to multi-dimensional voltage sag characteristics and its novel applications. IET Gener. Transm. Distrib. 2019, 13, 3910–3920. [Google Scholar] [CrossRef]
  21. Xu, Y.; Wu, Y.; Zhang, M.; Xu, S. Sensitivity of Programmable Logic Controllers to Voltage Sags. IEEE Trans. Power Deliv. 2019, 34, 2–10. [Google Scholar] [CrossRef]
  22. Anthony, J.; Christe, S.; Philip, M. Design Implementation and Evaluation of Open Power Quality. Energies 2020, 13, 4032. [Google Scholar]
  23. Cigre/Cired/Uie Joint Working Group C4.110 Voltage Dip Immunity of Equipment and Installations; Cigre Technical Brochure 412; CIGRE: Paris, France, 2010.
  24. Xu, Y.; Li, C.; Wang, K. Compatibility between low voltage variable-frequency drives and voltage sags in distribution systems. Trans. China Electrotech. Soc. 2019, 34, 2216–2229. [Google Scholar]
  25. Mallek, M.; Rodney, H. Evaluation of power quality experience in UCSI University North Wing Campus. In Proceedings of the 2017 2nd International Conference Sustainable and Renewable Energy Engineering (ICSREE), Hiroshima, Japan, 10–12 May 2017; pp. 129–133. [Google Scholar]
  26. Alan, C. A Cement Plant’s Experience in Investigating Power Sags Leads to a Reduction in Kiln Outages by Utilizing Power Hardening Methods. IEEE Trans. Ind. Appl. 2016, 52, 4435–4441. [Google Scholar]
  27. Somrak, T.; Tayjasanant, T. Minimized Financial Losses Due to Interruptions and Voltage Sags with Consideration of Investment Cost. In Proceedings of the 2019 IEEE PES GTD Grand International Conference and Exposition Asia (GTD Asia), Bangkok, Thailand, 19–23 March 2019; pp. 29–34. [Google Scholar]
  28. Li, Y.; Wei, G.; Li, G. Research on optimization of power supply route of active distribution network considering DG. Proc. CSEE 2018, 38, 1971–1979. [Google Scholar]
Figure 1. The overall organizational framework of the article.
Energies 14 05065 g001
Figure 2. User voltage tolerance curve.
Energies 14 05065 g002
Figure 3. Distribution characteristics of voltage sag events and energy index values: (a) Scatter plot of sag event distribution; (b) Energy index value of the sag event in the normal area; (c) Energy index value of the sag event in the uncertainty area; (d) Energy index value of the sag event in the abnormal area.
Energies 14 05065 g003
Figure 4. Graded regions of the severity of voltage sag events.
Energies 14 05065 g004
Figure 5. Voltage sag tolerance curve of equipment to sag type I/II/III: (a) sag type I/II; (b) sag type III.
Energies 14 05065 g005
Figure 6. Evaluation process of voltage sag based on improved energy index.
Energies 14 05065 g006
Figure 7. Energy index based on comparison benchmark value.
Energies 14 05065 g007
Figure 8. Distribution and severity levels of voltage sag events.
Energies 14 05065 g008
Figure 9. Comparison of voltage sag energy index before and after improvement.
Energies 14 05065 g009
Figure 11. Comparison of severity ranking results under different evaluation indicators.
Energies 14 05065 g010
Figure 10. Severity ranking comparison before and after improvement based on energy index.
Energies 14 05065 g011
Table 1. Grading of the severity of voltage sag events.
Event RegionABCDEF
Severity evaluation levelextremely lowlowslightly lowslightly highhighextremely high
Table 2. Probability value of equipment failure under each sag type.
Sag TypeType IType IIType III
Equipment failure rate pi/%76.3376.3379.33
Table 3. Sag feature information for sag event.
Event NumberSag Amplitude U/p.u.Duration T/msSag Type
10.46352Single-phase
20.8919Single-phase
30.18310Two-phase
40.7038Single-phase
50.83400Single-phase
60.75182Single-phase
70.70361Single-phase
80.56203Two-phase
90.281047Three-phase
100.291050Single-phase
110.38672Single-phase
120.37954Single-phase
130.4113Single-phase
140.70740Single-phase
150.5156Two-phase
160.53560Two-phase
170.809Single-phase
180.8855Single-phase
190.501021Three-phase
200.54147Two-phase
210.59671Two-phase
220.35194Single-phase
230.8320Single-phase
240.76254Two-phase
Table 4. Improved energy index after considering sag type.
Event Number E v s / s Event Number E v s / s
1[0.164,0.493]13[0.004,0.011]
2[0.001,0.004]14[0.198,0.594]
3[0.475,0.713]15[0.045,0.068]
4[0.008,0.024]16[0.609,0.913]
5[0.044,0.131]17[0.001,0.003]
6[0.030,0.090]18[0.005,0.014]
7[0.073,0.220]19[1.457,1.836]
8[0.142,0.213]20[0.111,0.166]
9[2.639,3.327]21[0.599,0.899]
10[1.094,3.282]22[0.114,0.343]
11[0.560,1.679]23[0.002,0.006]
12[0.825,2.473]24[0.077,0.116]
Table 5. Evaluation results based on MSDI and Se.
Event NumberMSDISeEvent NumberMSDISe
159.570.91130.000.59
20.000.111424.630.75
360.421.37155.420.82
40.920.501667.681.18
50.000.28170.000.20
64.450.42180.000.20
716.910.491975.601.26
822.760.732017.440.77
9100.001.792153.501.04
10100.001.772236.251.09
11100.001.54230.000.17
12100.001.57244.670.39
Publisher’s Note: MDPI stays neutral with regard to jurisdictional claims in published maps and institutional affiliations.

