1. Introduction
In European synchronized power systems, investment plans are prepared by the European Network of Transmission System Operators for Electricity (ENTSO-E). Among planned or realized investments in the power systems are those connected with the installation of phase-shifting transformers (PST) [
1,
2,
3]. Excluding units planned or under construction, PSTs have been used for many years. The fact that these devices are common in power systems necessitates an analysis of PST efficiency. This could lead to efforts to improve PST construction, making the units more efficient and flexible.
A PST device is designed to regulate the voltage angle in transmission lines. This allows transmitted power to be appropriately increased or decreased according to the actual requirements of the power system.
PSTs are used as power-flow control units [
4] to avoid circular power flows. They are especially used to minimize circular power flows occurring in different power systems connected as part of the Union for the Coordination of Transmission of Electricity (UCTE) [
5,
6,
7,
8,
9]. The authors of [
5] present the mechanism of the circular power flows in Central and Eastern Europe. Circular power, which plays a key role in the system, flows via Germany → Poland → Czech Republic → Austria → Germany and Germany → Czech Republic → Germany. These flows depend on the real power flow between Germany and Austria. The more power is transmitted from Germany to Austria, the more circular power flows through Poland, Czech Republic and Slovakia. Based on the 2019 annual report prepared by the Polish Energy Regulatory Office, one can see that real power flows from Germany to Poland were almost four times greater than trade flows [
6]. A similar problem occurs in Western Europe in the Benelux region [
7,
8,
9]. When circular power flows appear in some systems, the power losses due to the current flow rise and the power line congestion risk are higher [
10,
11,
12]. Therefore, PSTs are widely used to improve power system flows and allow better control to minimize power losses [
13]. The literature confirms that PST installation is the main mechanism to control power flows.
In the literature, many manuscripts document the influence of a given PST type on power flows in interconnection lines [
14,
15] and in some power system regions as well. Different PST types have been analyzed during simulations on the power flows [
16,
17]. Each simulation confirms the positive influence of PST installation in the power system. The papers we have cited clearly show the advantages of PSTs during exploitation, but there is much less information about PST efficiency. Of course, PSTs as devices use transformers for single or double construction units and can be considered in similar ways to conventional transformers, because their principles of operation are the same. However, an analysis of different PST construction possibilities should be prepared, including the properties resulting from them. Therefore, this study provides an efficiency analysis of different PST constructions with respect to their electrical properties and features. The author considers a single-core asymmetrical phase-shifting transformer (APST), a single-core symmetrical phase-shifting transformer (SPST), and a unique dual-core construction with adjustable longitudinal voltage called an asymmetrical controllable phase-shifting transformer (ACPST) [
18]. In some literature, an ACPST is also called an in-phase PST. The analysis is based on laboratory measurement of the ACPST’s operation. Then, using the nominal parameters of the laboratory transformers, simulation models of each PST type were prepared. The results obtained were analyzed and compared with respect to efficiency, PST output voltage value, and transferred active power. The main goals of this study are:
Section 2 presents PST types, and
Section 3 shows laboratory testing of the PST set and measurement equipment.
Section 4 describes simulation and measurement results, the next one contains discussion and in the last part of the study, conclusions are included.
2. Phase-Shifting Transformer Types
Phase-shifting transformers have been known about for many years. During this time, several different types of construction have been employed. Consecutive PST types are enumerated in the literature [
4,
19,
20,
21]:
- -
symmetrical or asymmetrical,
- -
direct or indirect.
Besides the aforementioned PST types, hexagonal PSTs can also be installed in power systems.
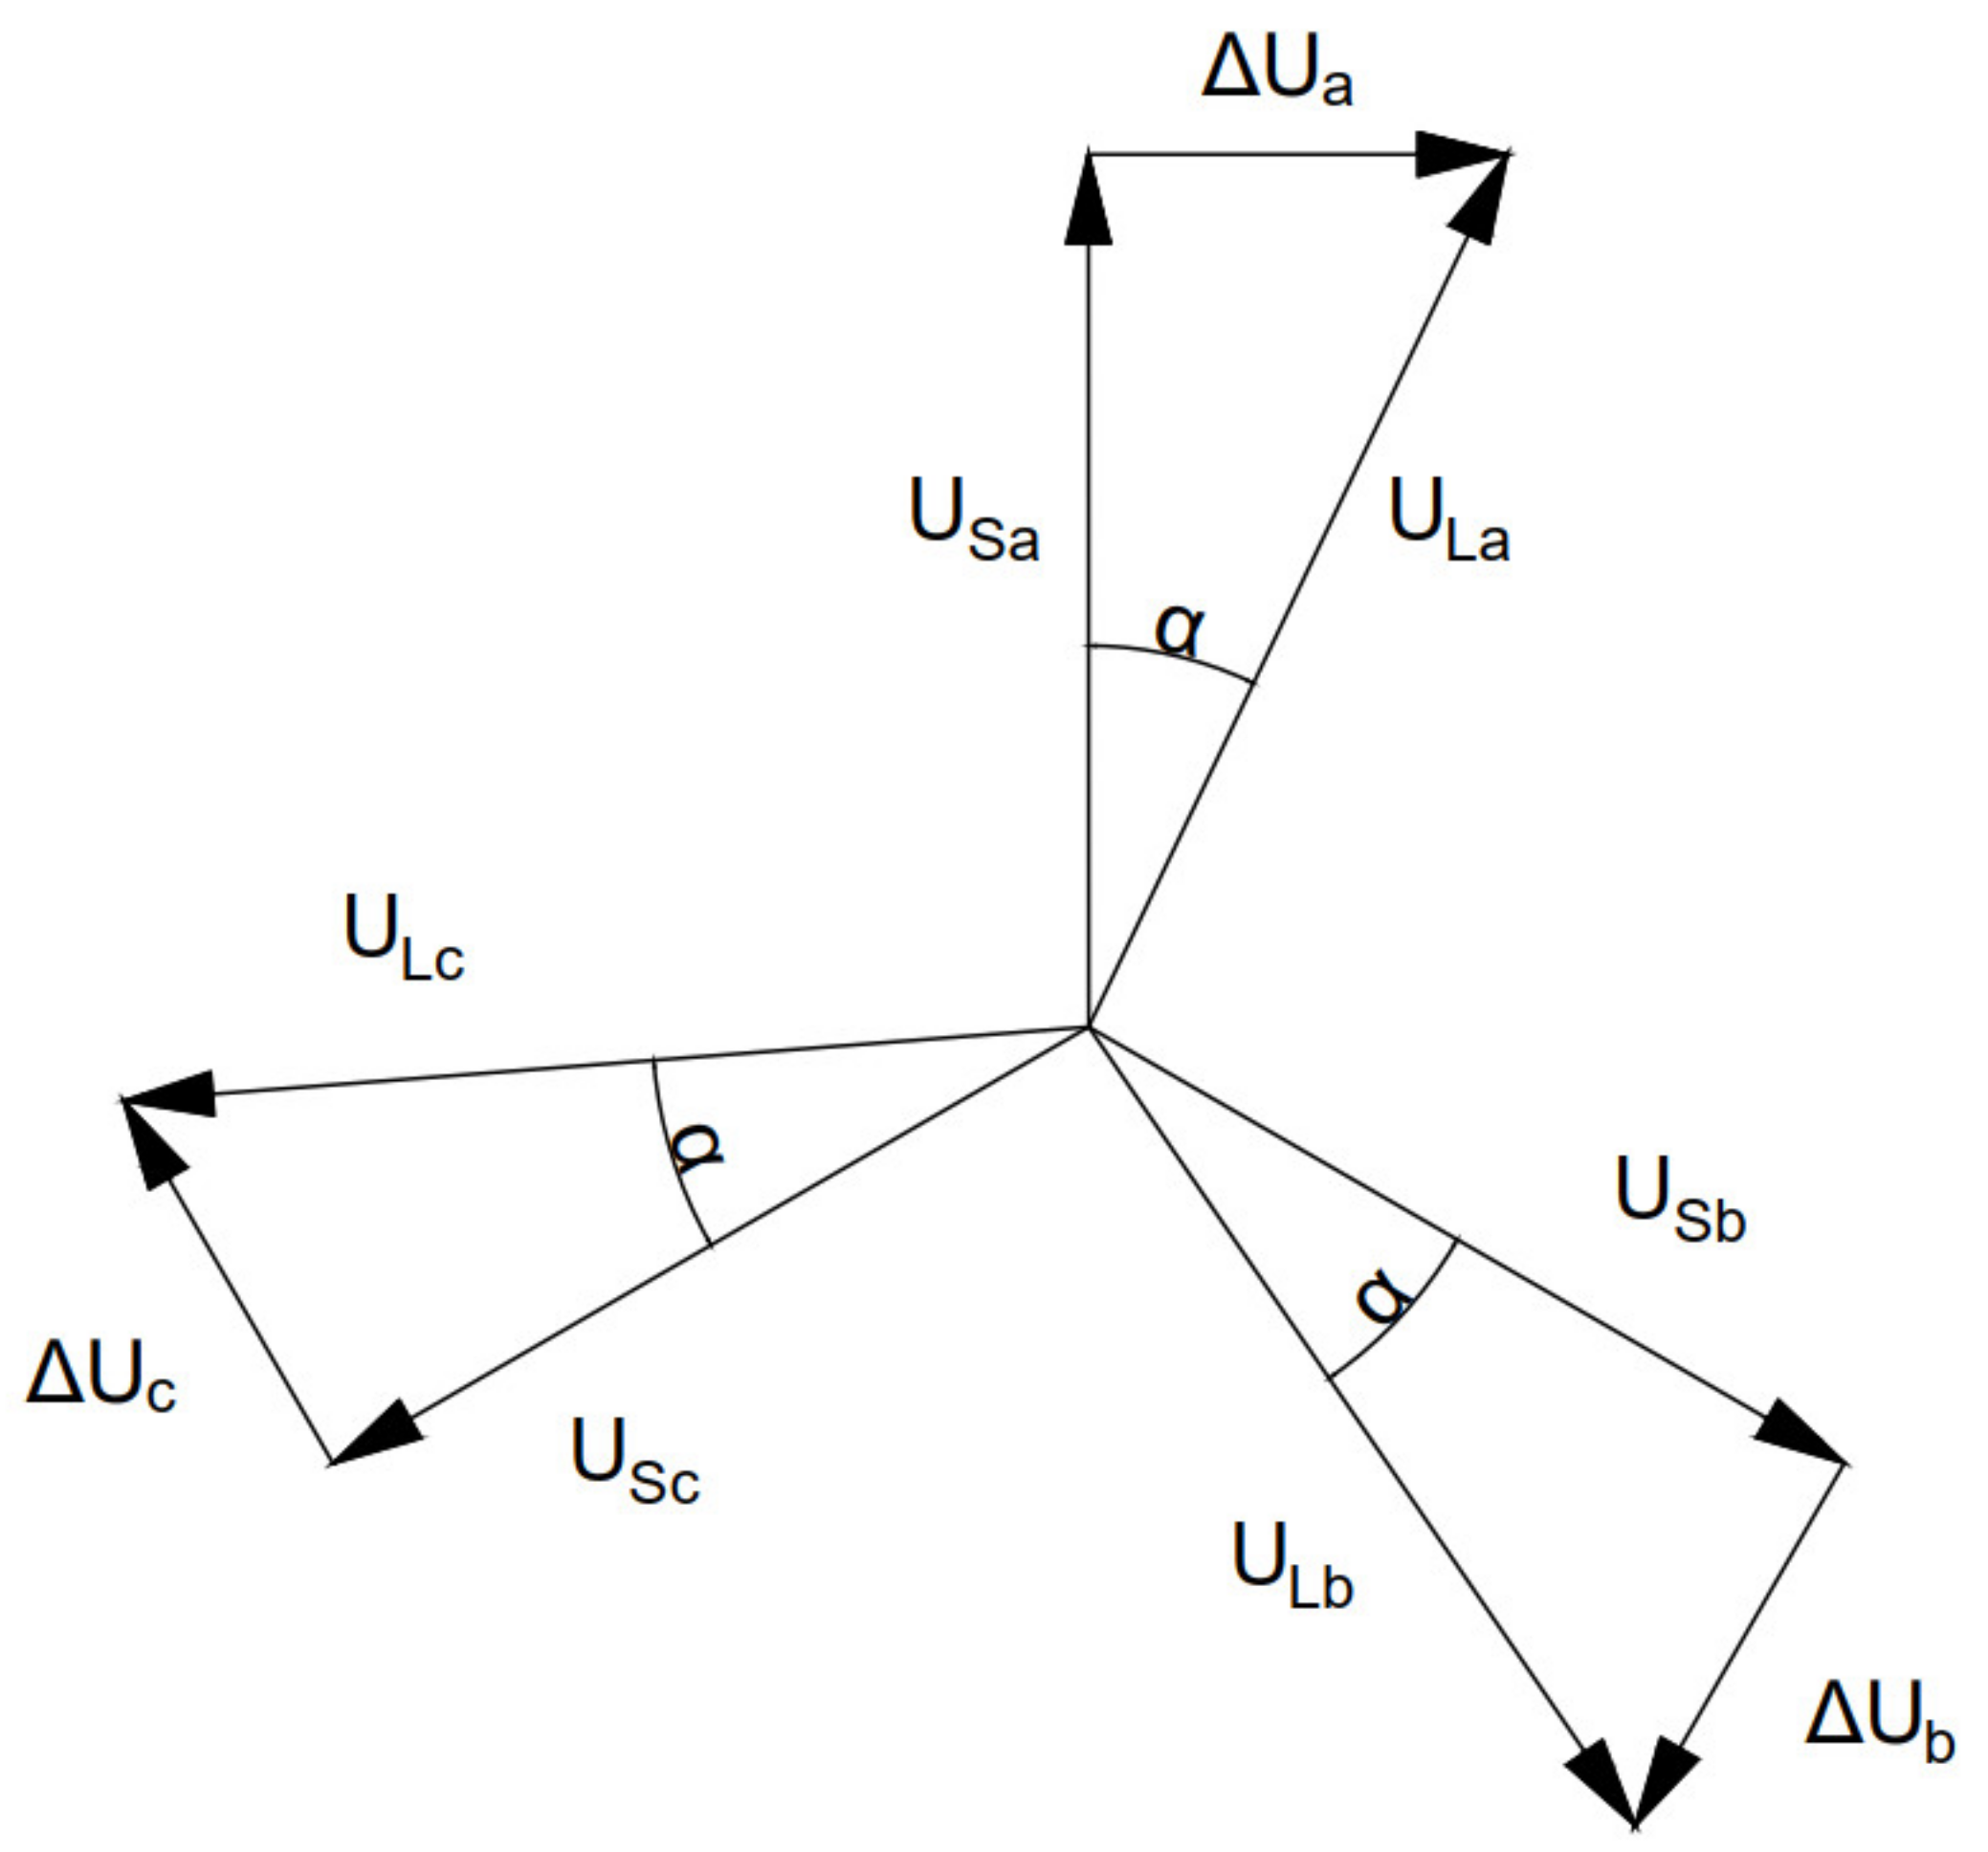
2.1. Asymmetrical Phase-Shifting Transformers
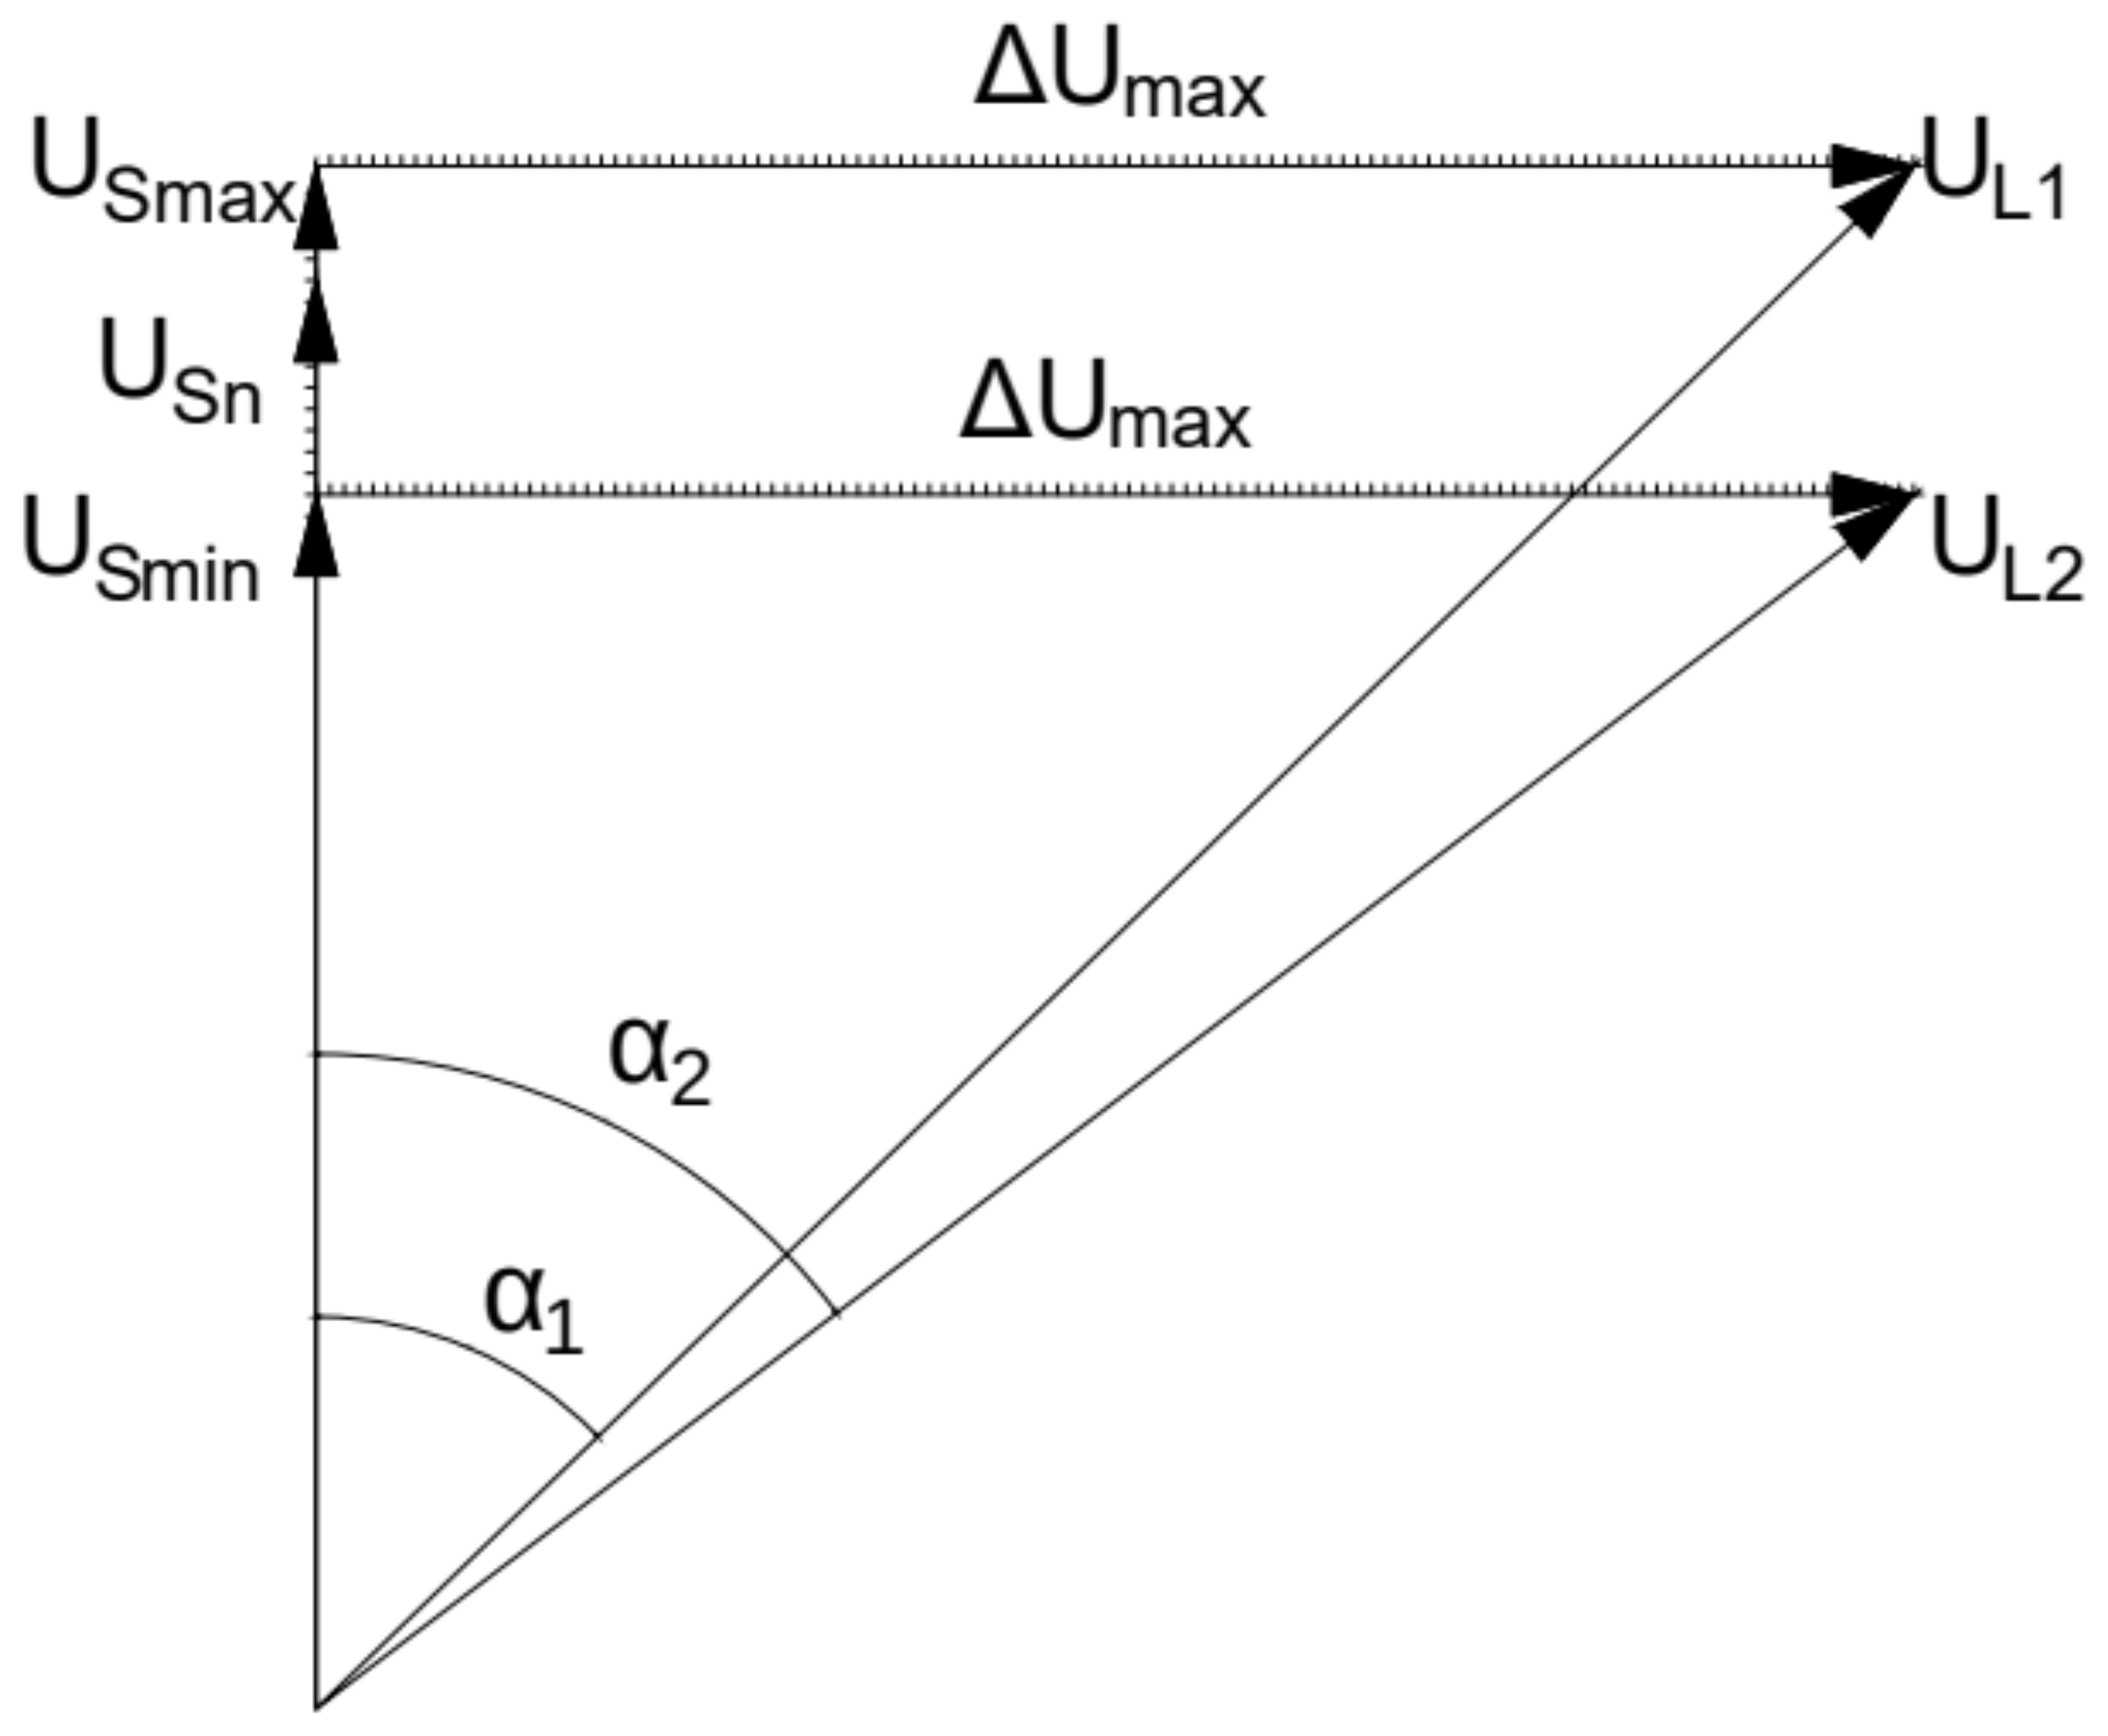
This kind of PST can be made direct or indirect. For both possible cases, the phasor diagram is the same and is shown in
Figure 1. Output voltage U
L is achieved by adding quadrature voltage ΔU to the input voltage U
S. Relations between voltages and angle α can be expressed as:
The most important feature for this PST type is a change in the output voltage in relation to the input voltage. The value of U
L is always greater than the input U
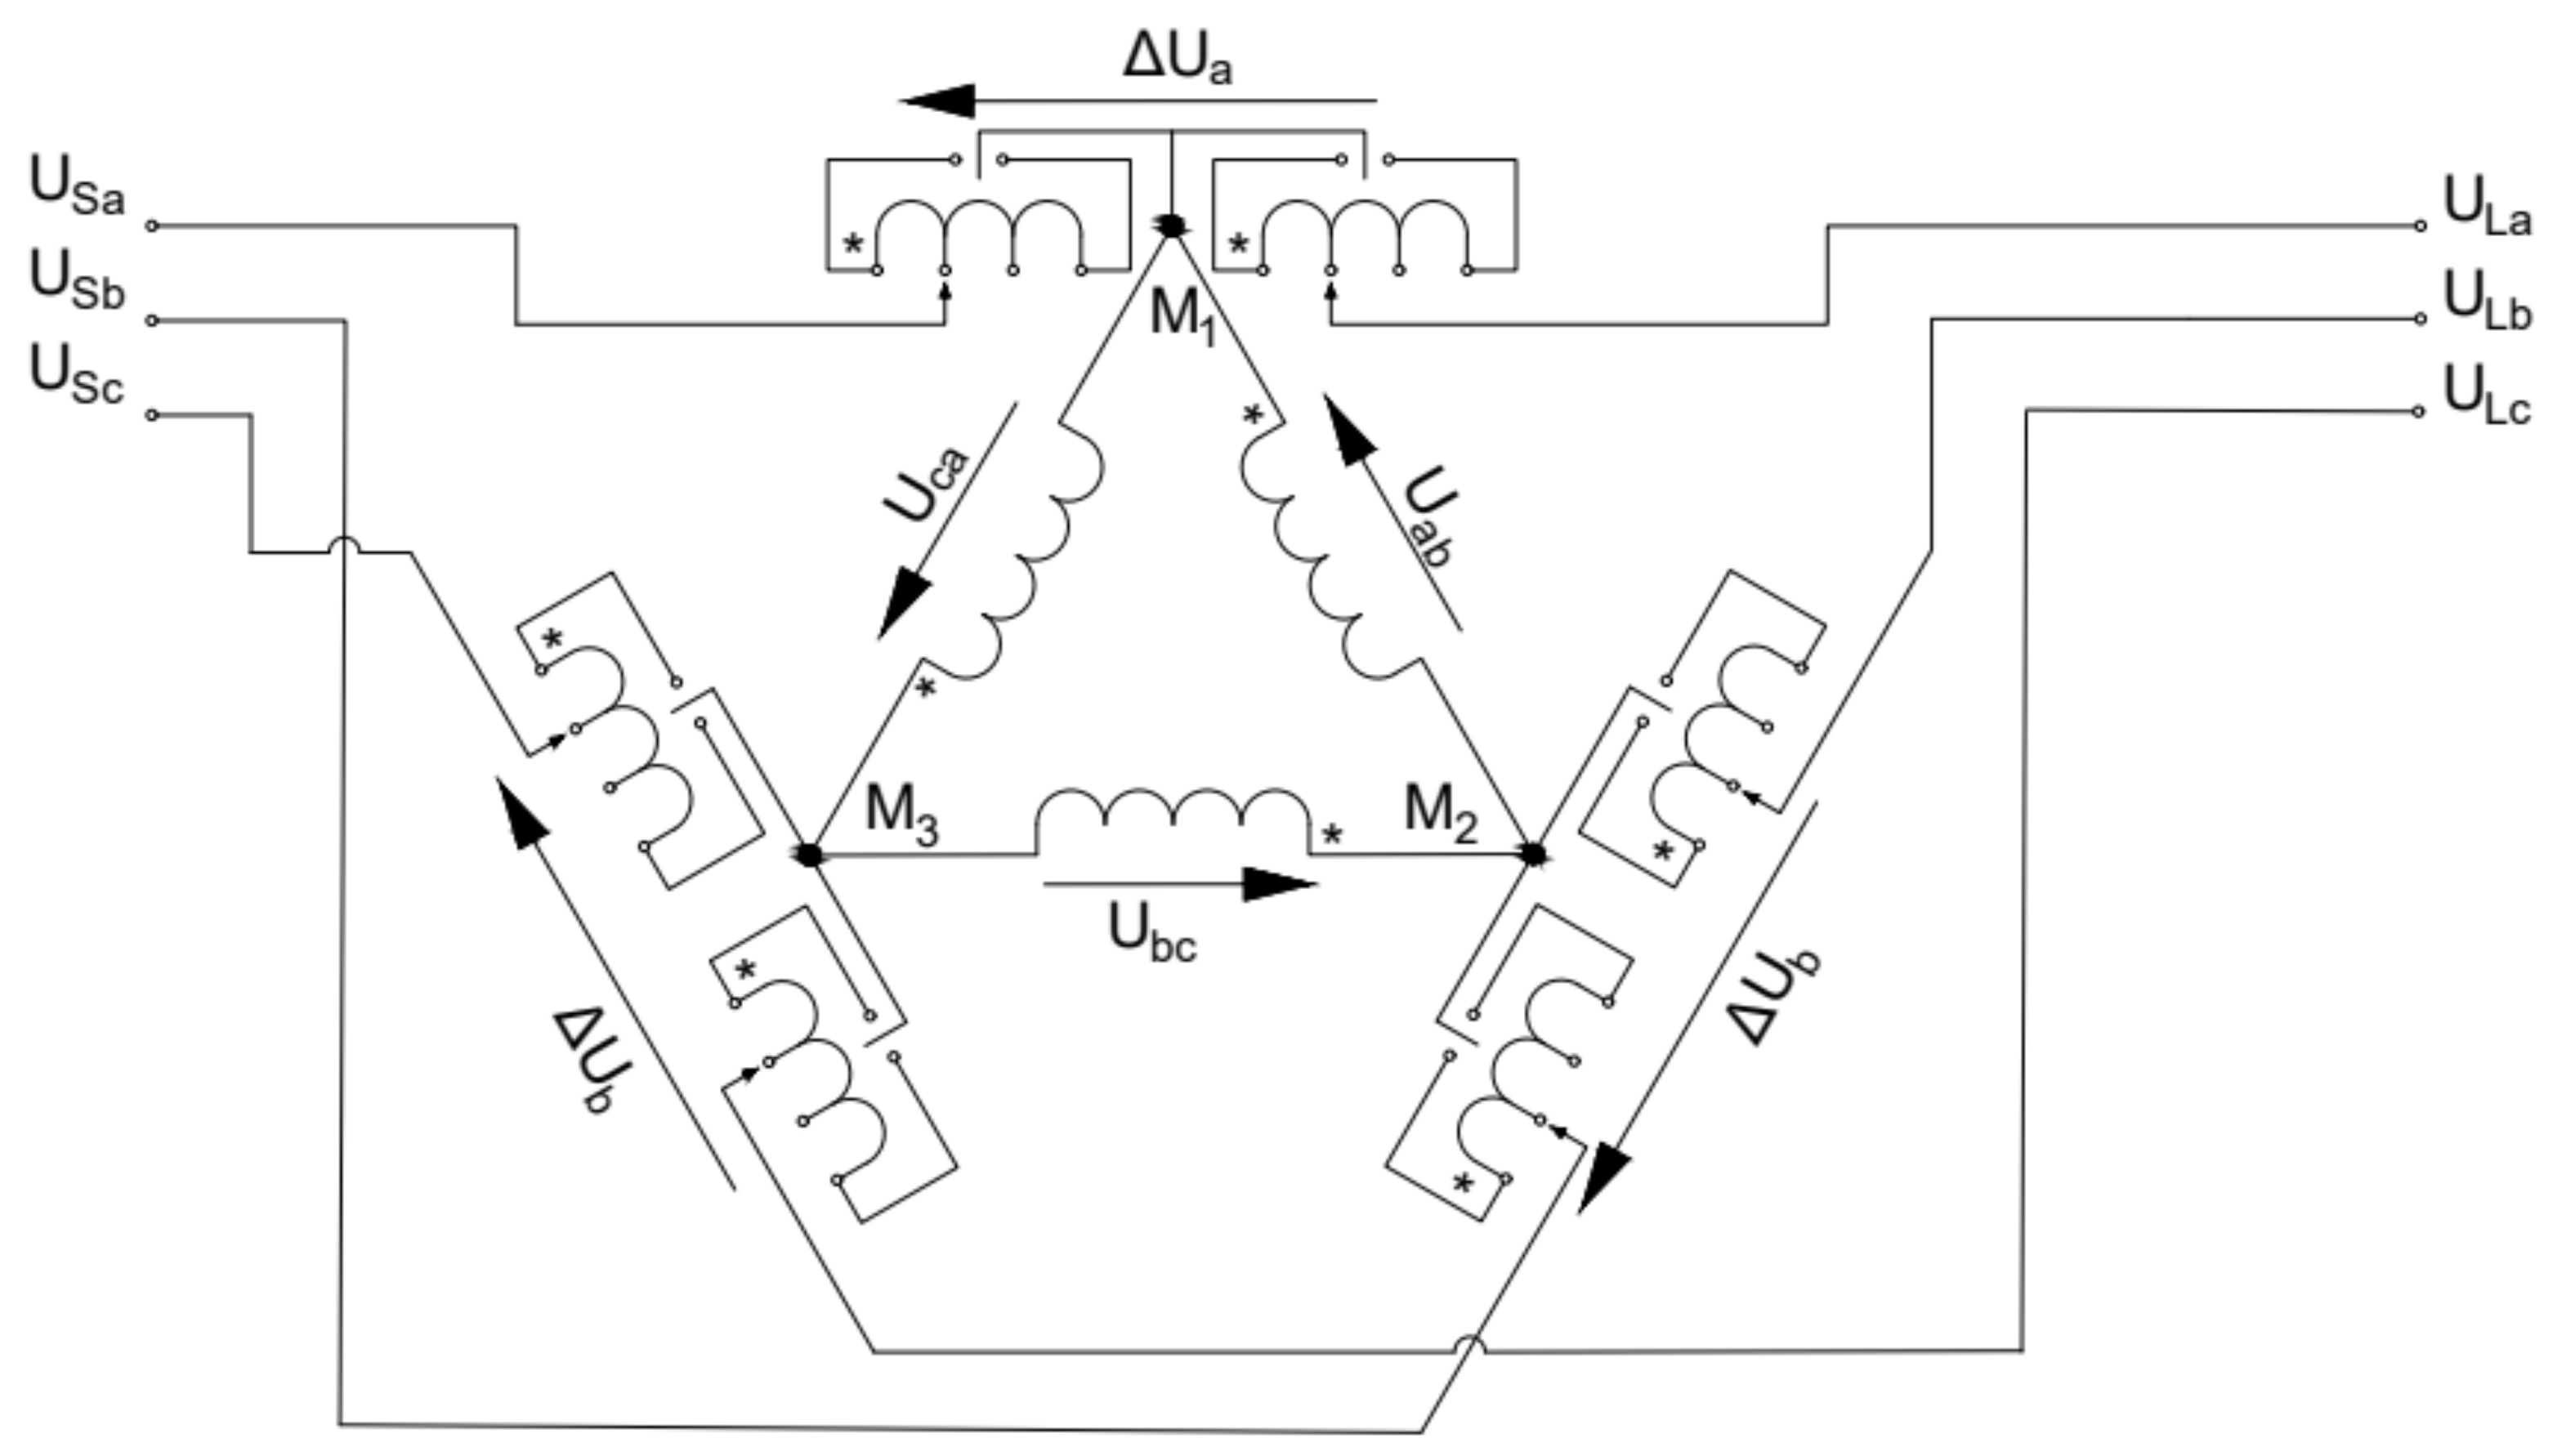
S. This fact influences the active and reactive power flow as a consequence. An example of the PST connection is visible in
Figure 2.
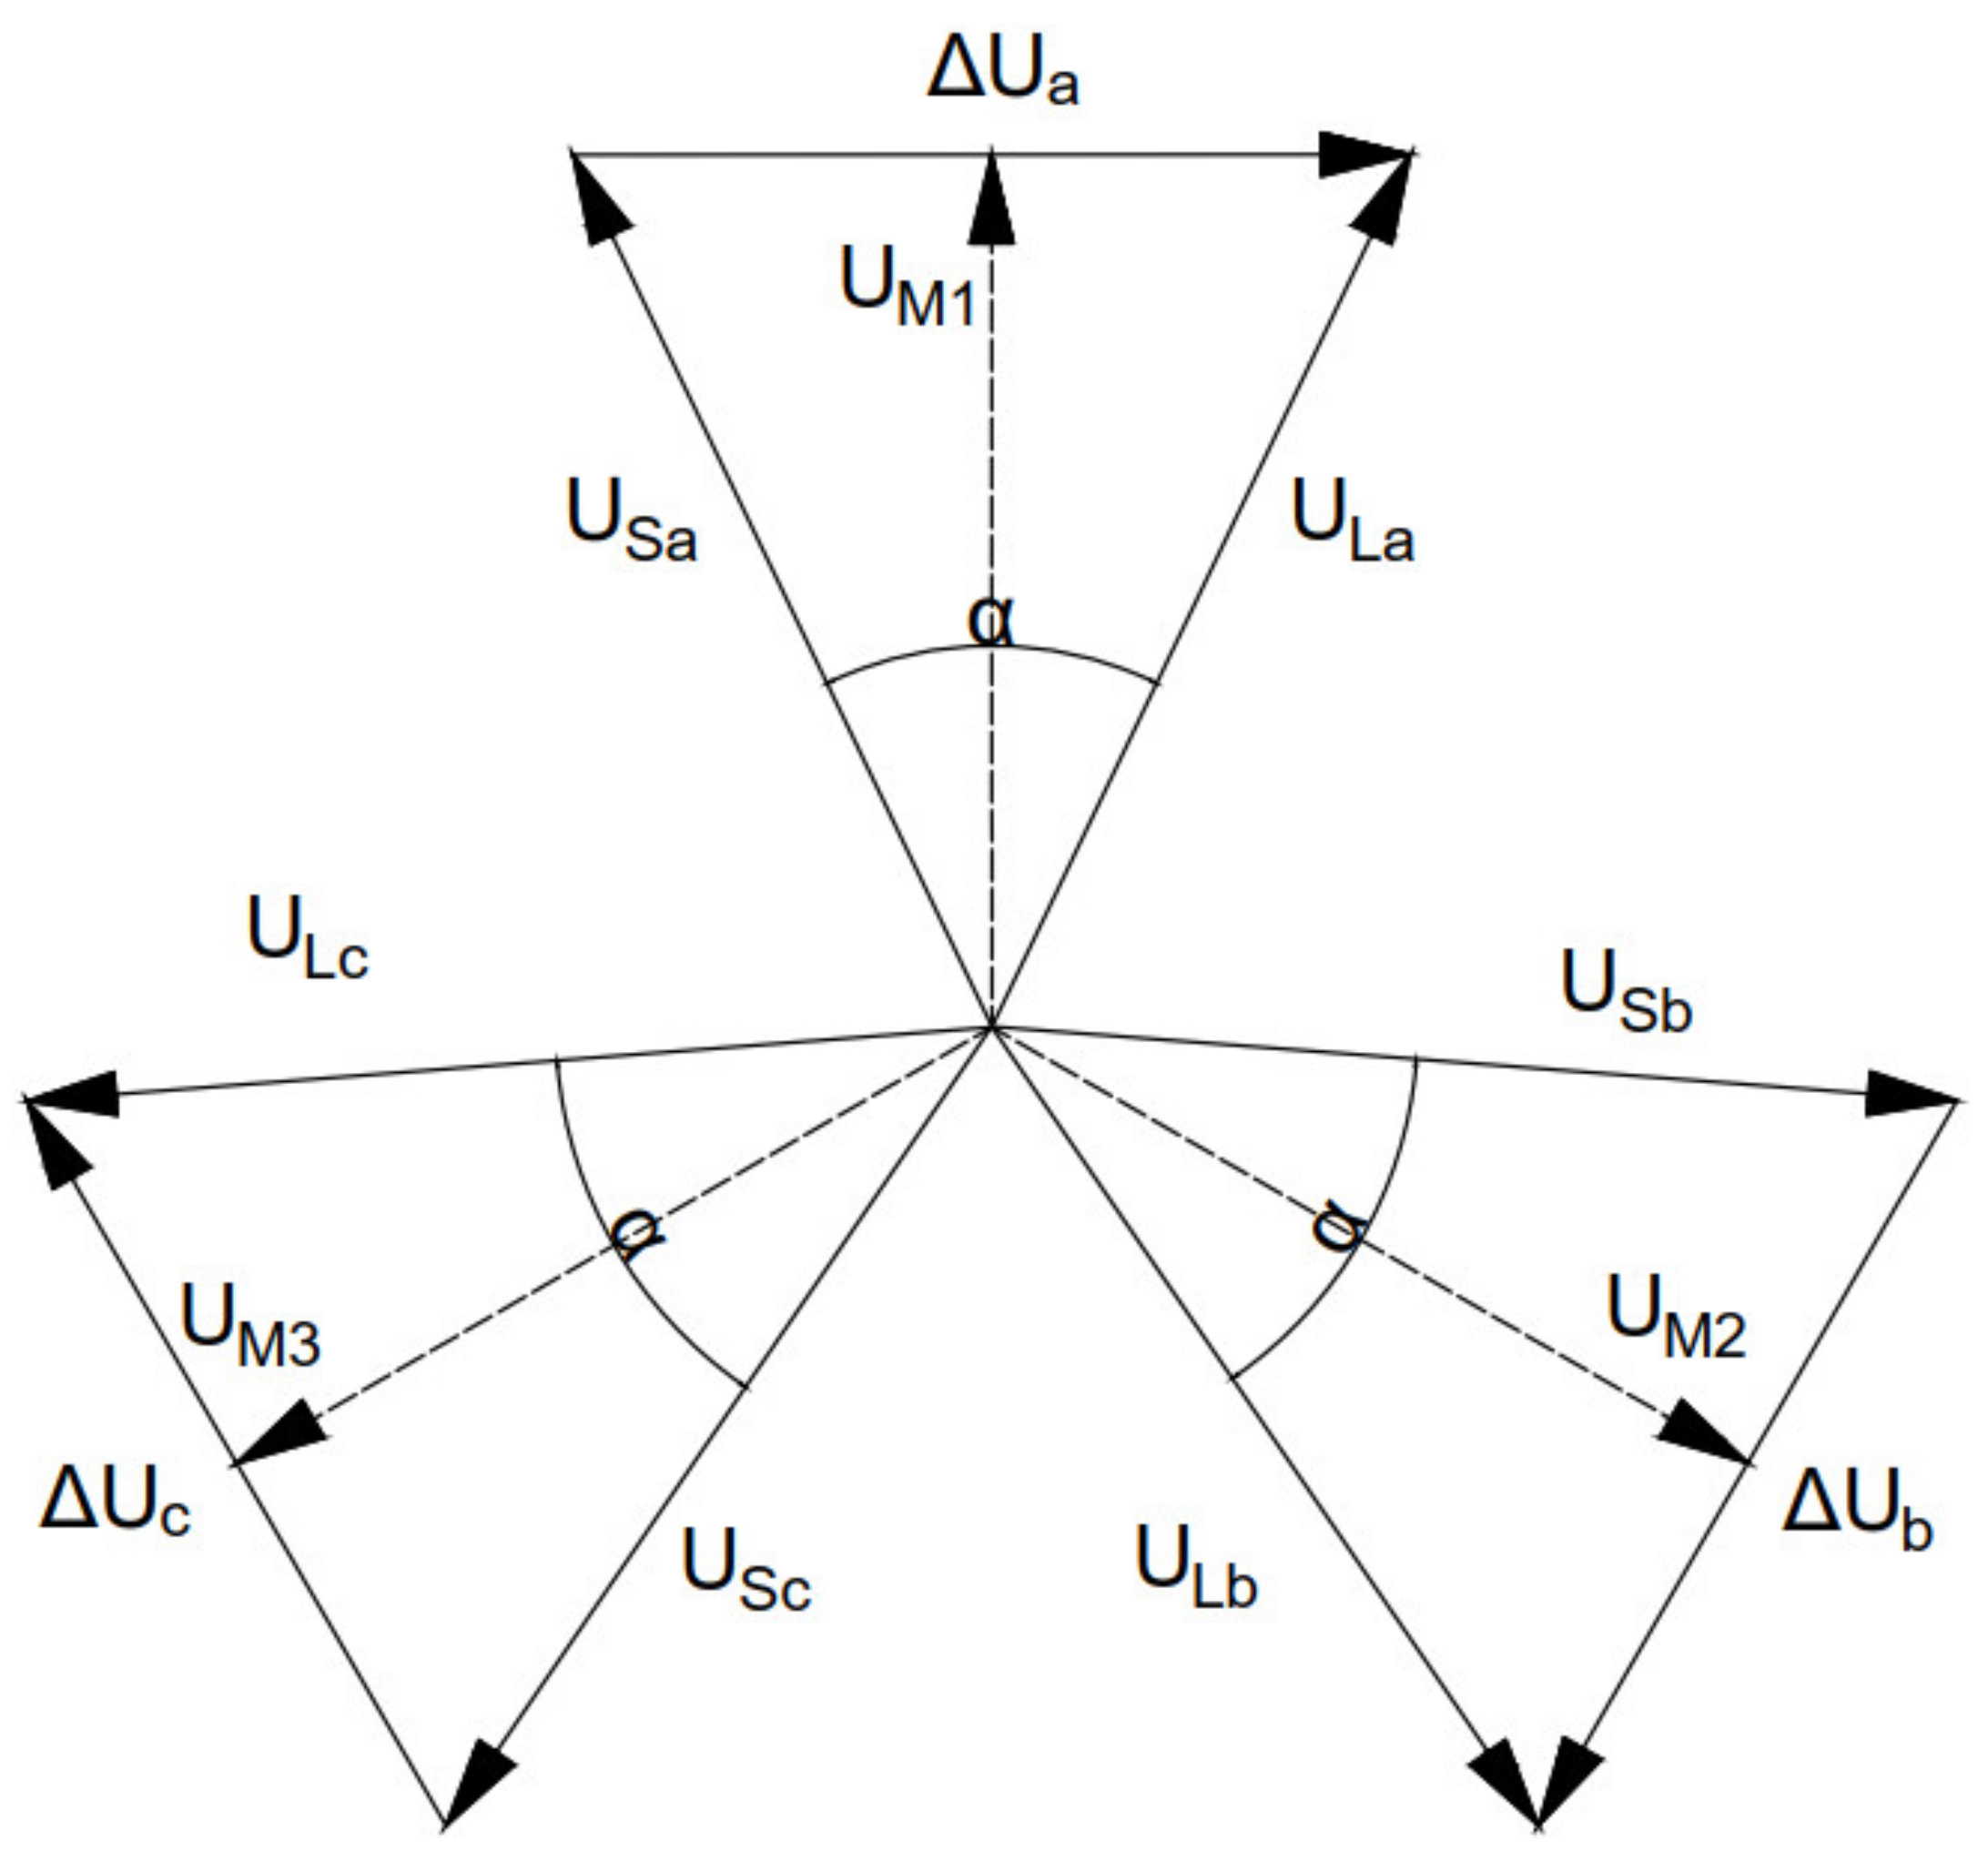
2.2. Symmetrical Phase-Shifting Transformers
These units, due to their series windings construction and the energization of the excitation windings (direct type) or excitation transformer (indirect type) provides constant voltage values for input and output voltages. This only involves a change in angles, so only active power flows can be controlled in this way [
22]. The phasor diagram and the connection scheme of the symmetrical direct PST are presented in
Figure 3 and
Figure 4, respectively.
In the symmetrical phase-shifting transformer (SPST) type, the voltage carried to the excitation winding/transformer is taken from the mid-point of the series winding. As a consequence, the input and output voltages are symmetrical regarding this type of PST (
Figure 3).
An added angle α can be formulated as:
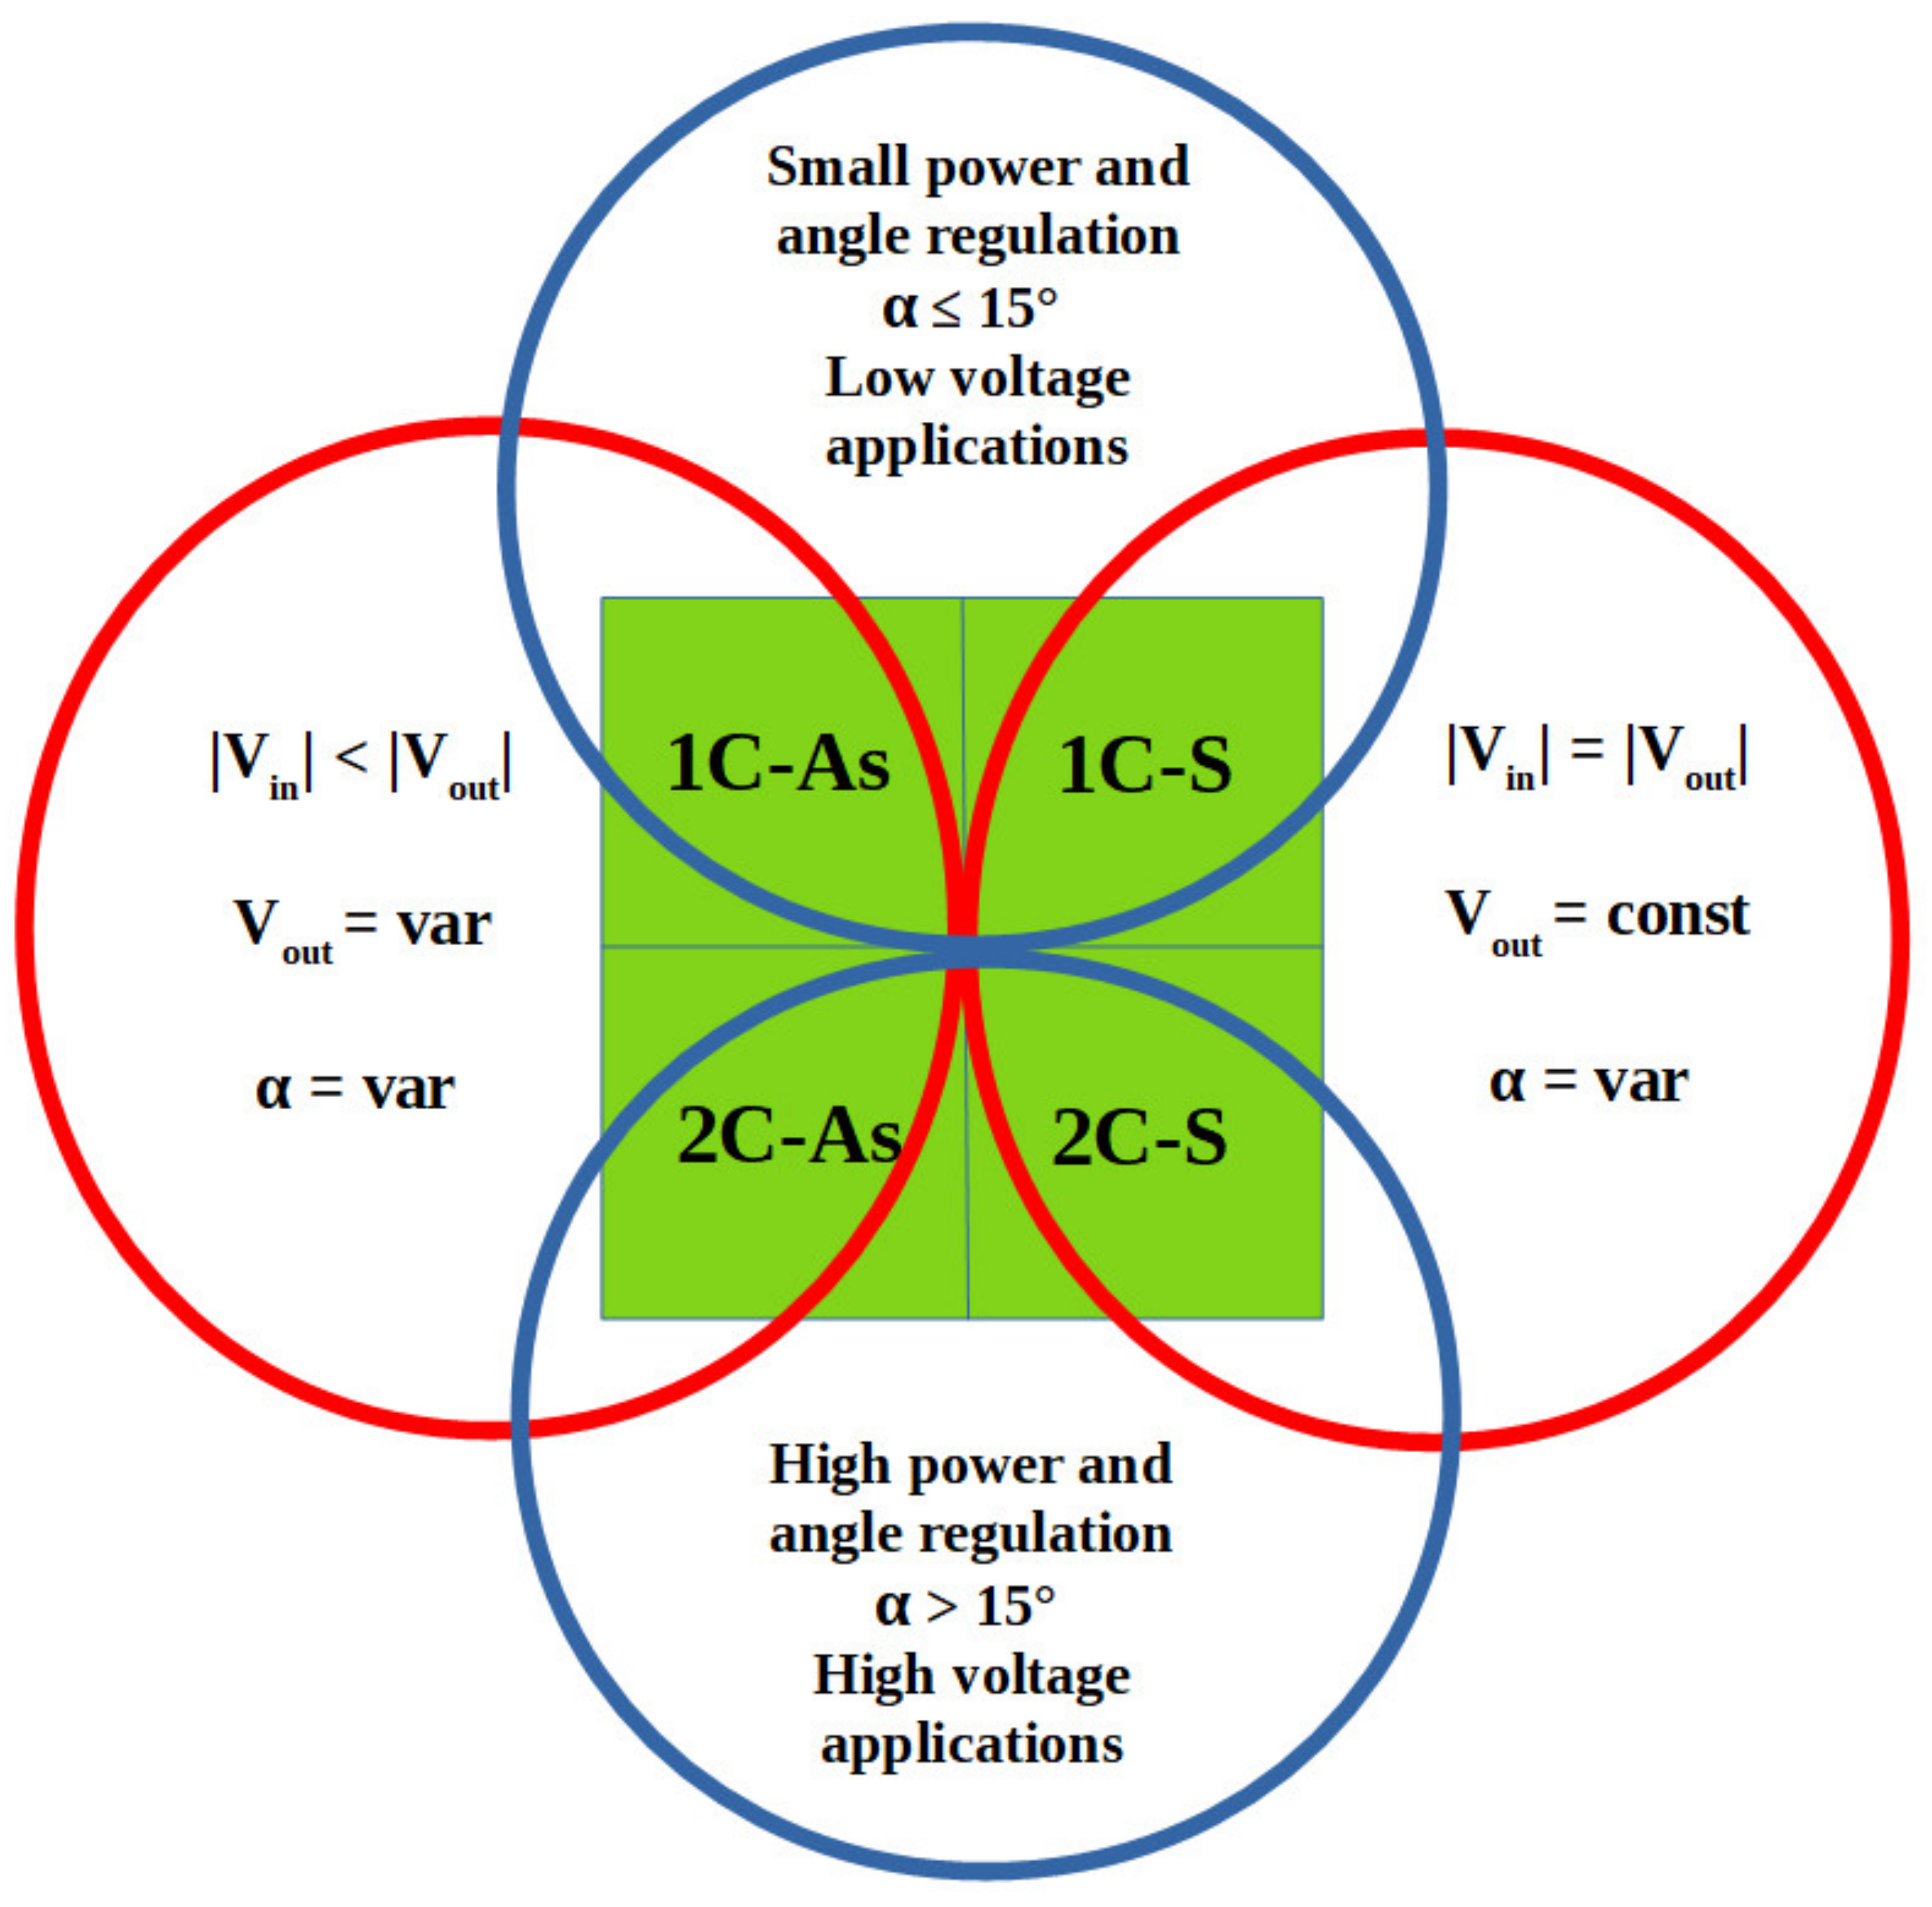
2.3. PST Features and Applications
Depending on the construction type, different properties are present. These features are collected and presented in
Figure 5.
According to the features presented in
Figure 5, we can conclude that symmetrical solutions allow for the control of active power only, while asymmetrical ones influence both active and reactive power transferred in the line with the PST [
22,
23].
Some PST applications and their parameters are collected in
Table 1.
3. Laboratory PST Construction
For the tests, a PST unit was prepared with possible input and quadrature voltage regulation. In this way, an in-phase phase-shifting transformer was prepared, which can be changed very easily into an asymmetrical phase-shifting transformer (APST) [
24]. Due to the possibility of both longitudinal and quadrature voltage control, this type of PST is called an asymmetrical controllable PST (ACPST) [
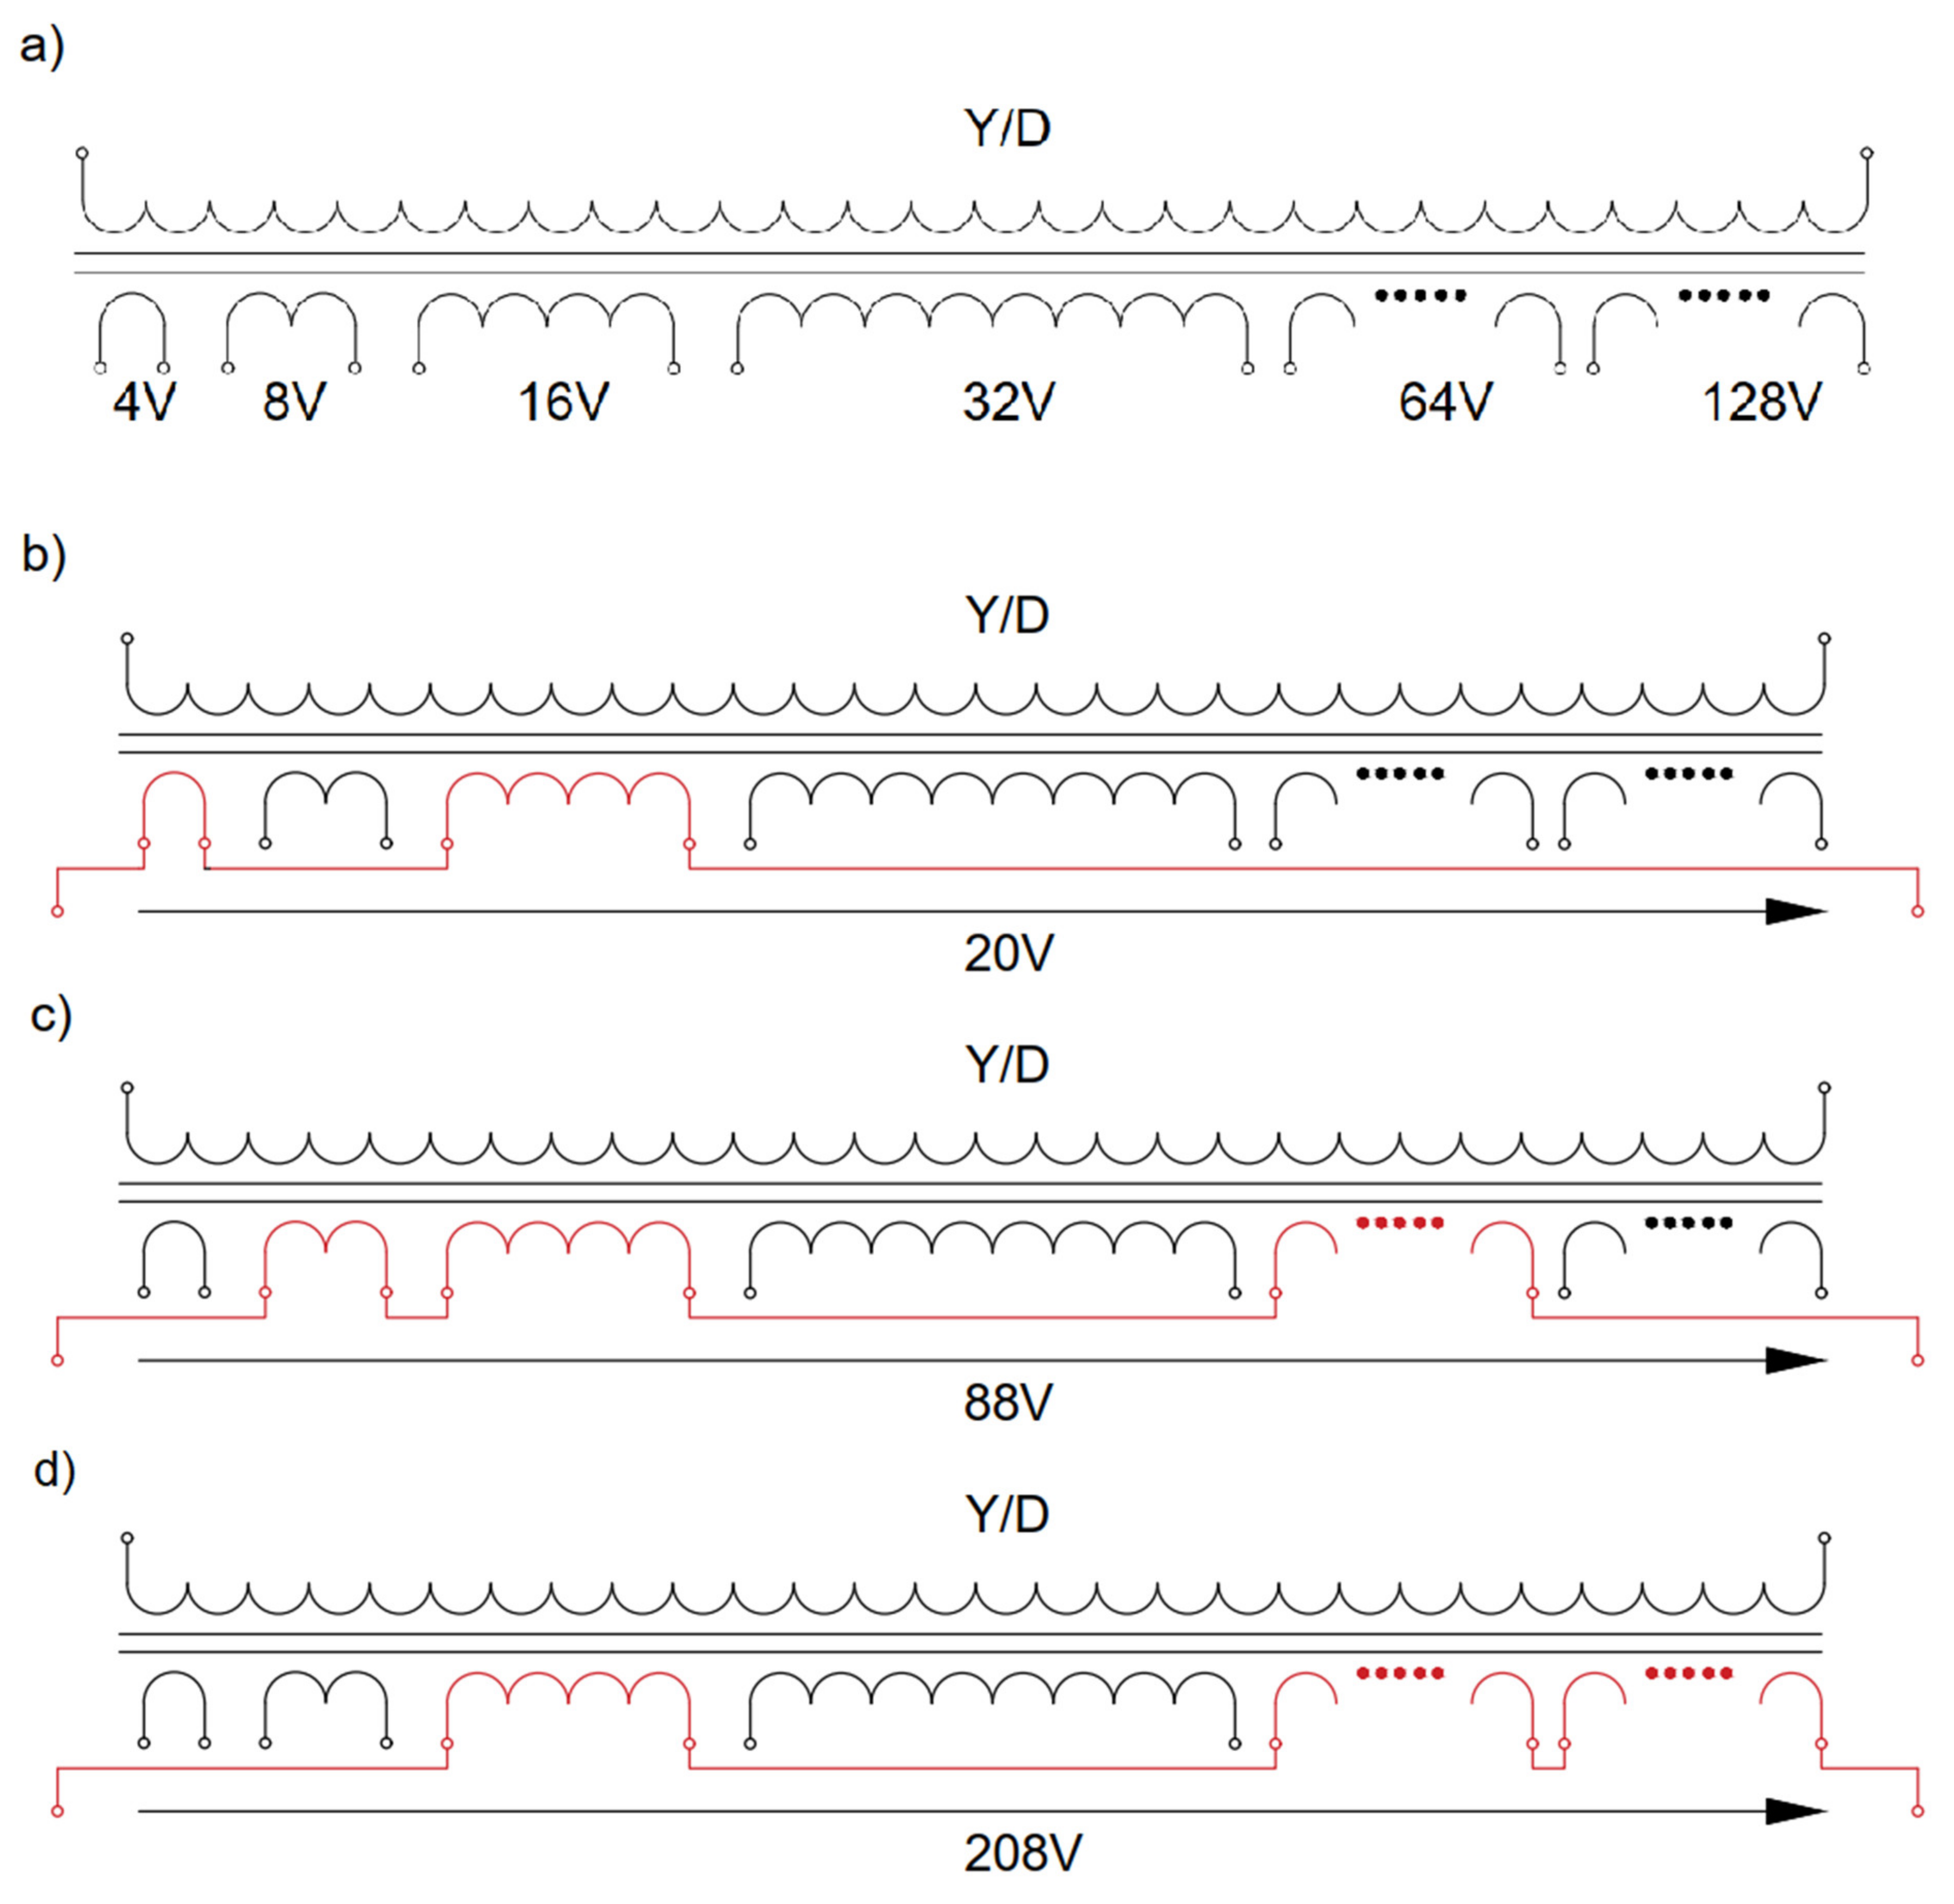
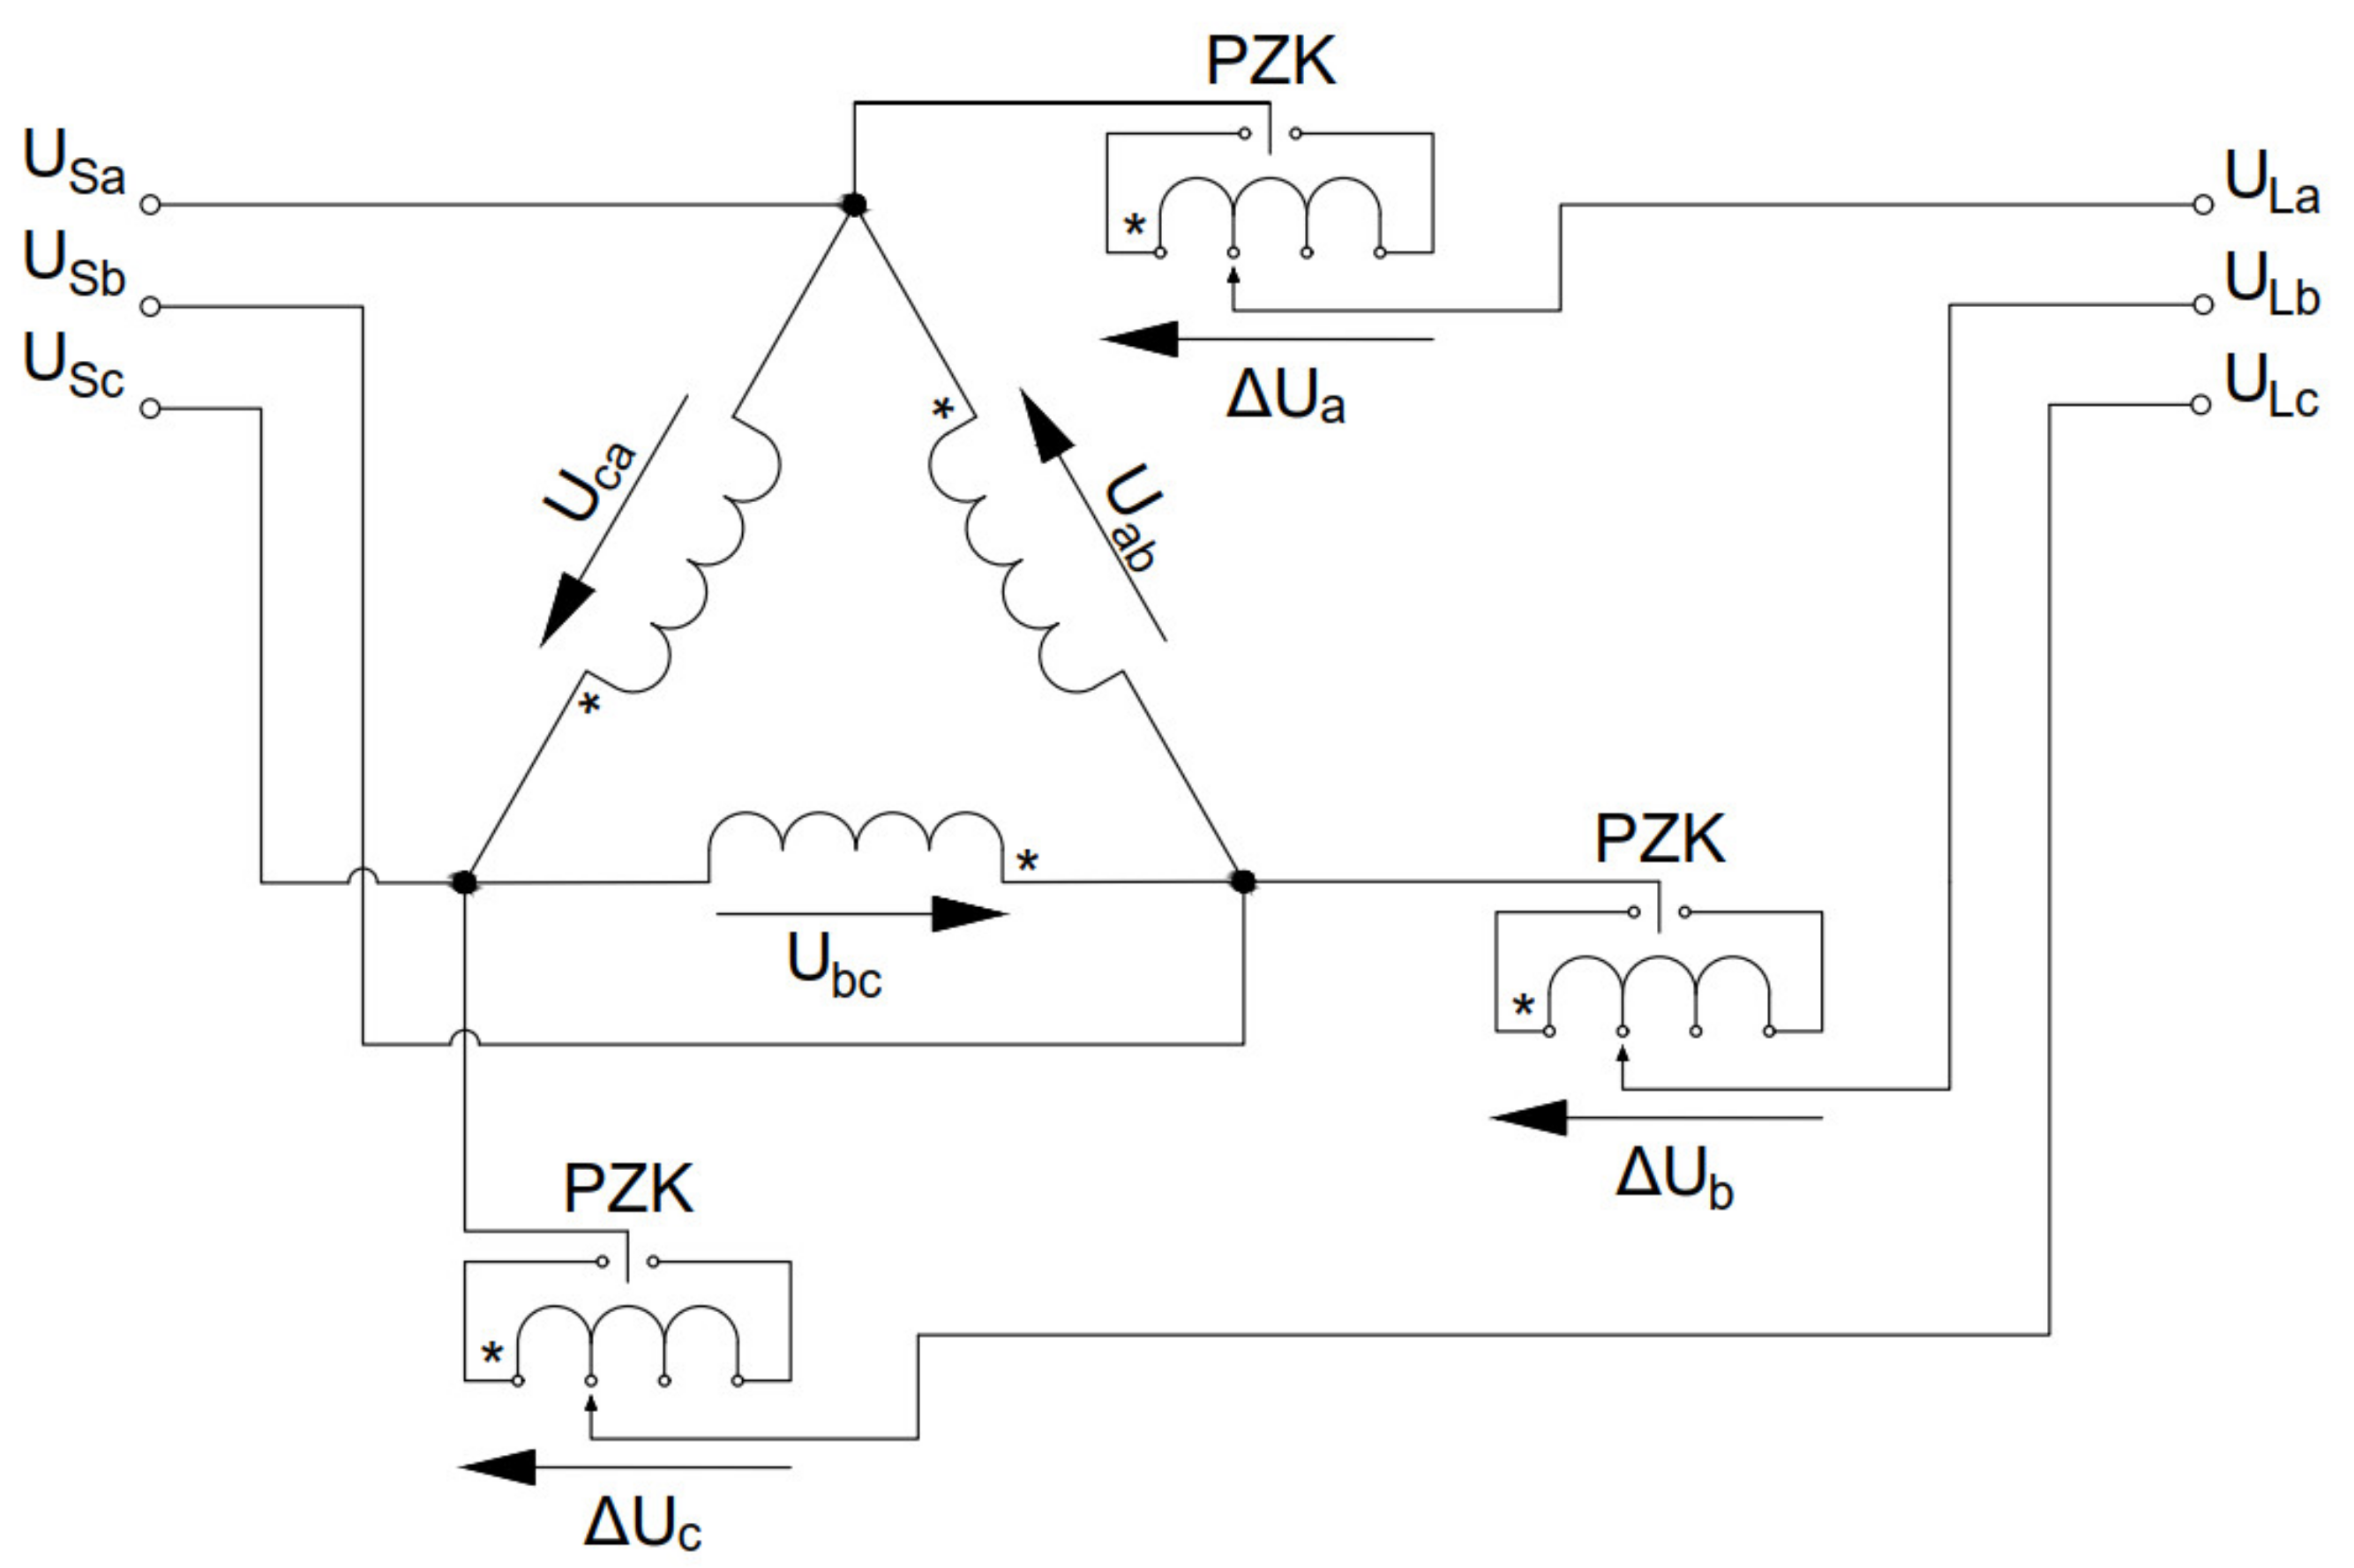
18]. The laboratory ACPST unit has a special construction for the series winding, allowing for the increase in quadrature voltages from 0 to 256 V with 4 V steps. A diagram of the series windings of the transformer is presented in
Figure 6. Six windings, each with a different voltage value, can be connected in series in any way, and as a result additional quadrature voltage is implemented into the transmission line.
The series transformer (ST) also has the ability to change the primary winding connection from a star (Y) into a delta (D), so besides added quadrature voltage (with angle ±90°), voltages with angles ±60° and ±120° can also be added by proper combination of phases energizing each series winding. In this study, the only connection used is one allowing a ±90° quadrature voltage into the line, to compare obtained values of the transferred power, output voltages, and angles.
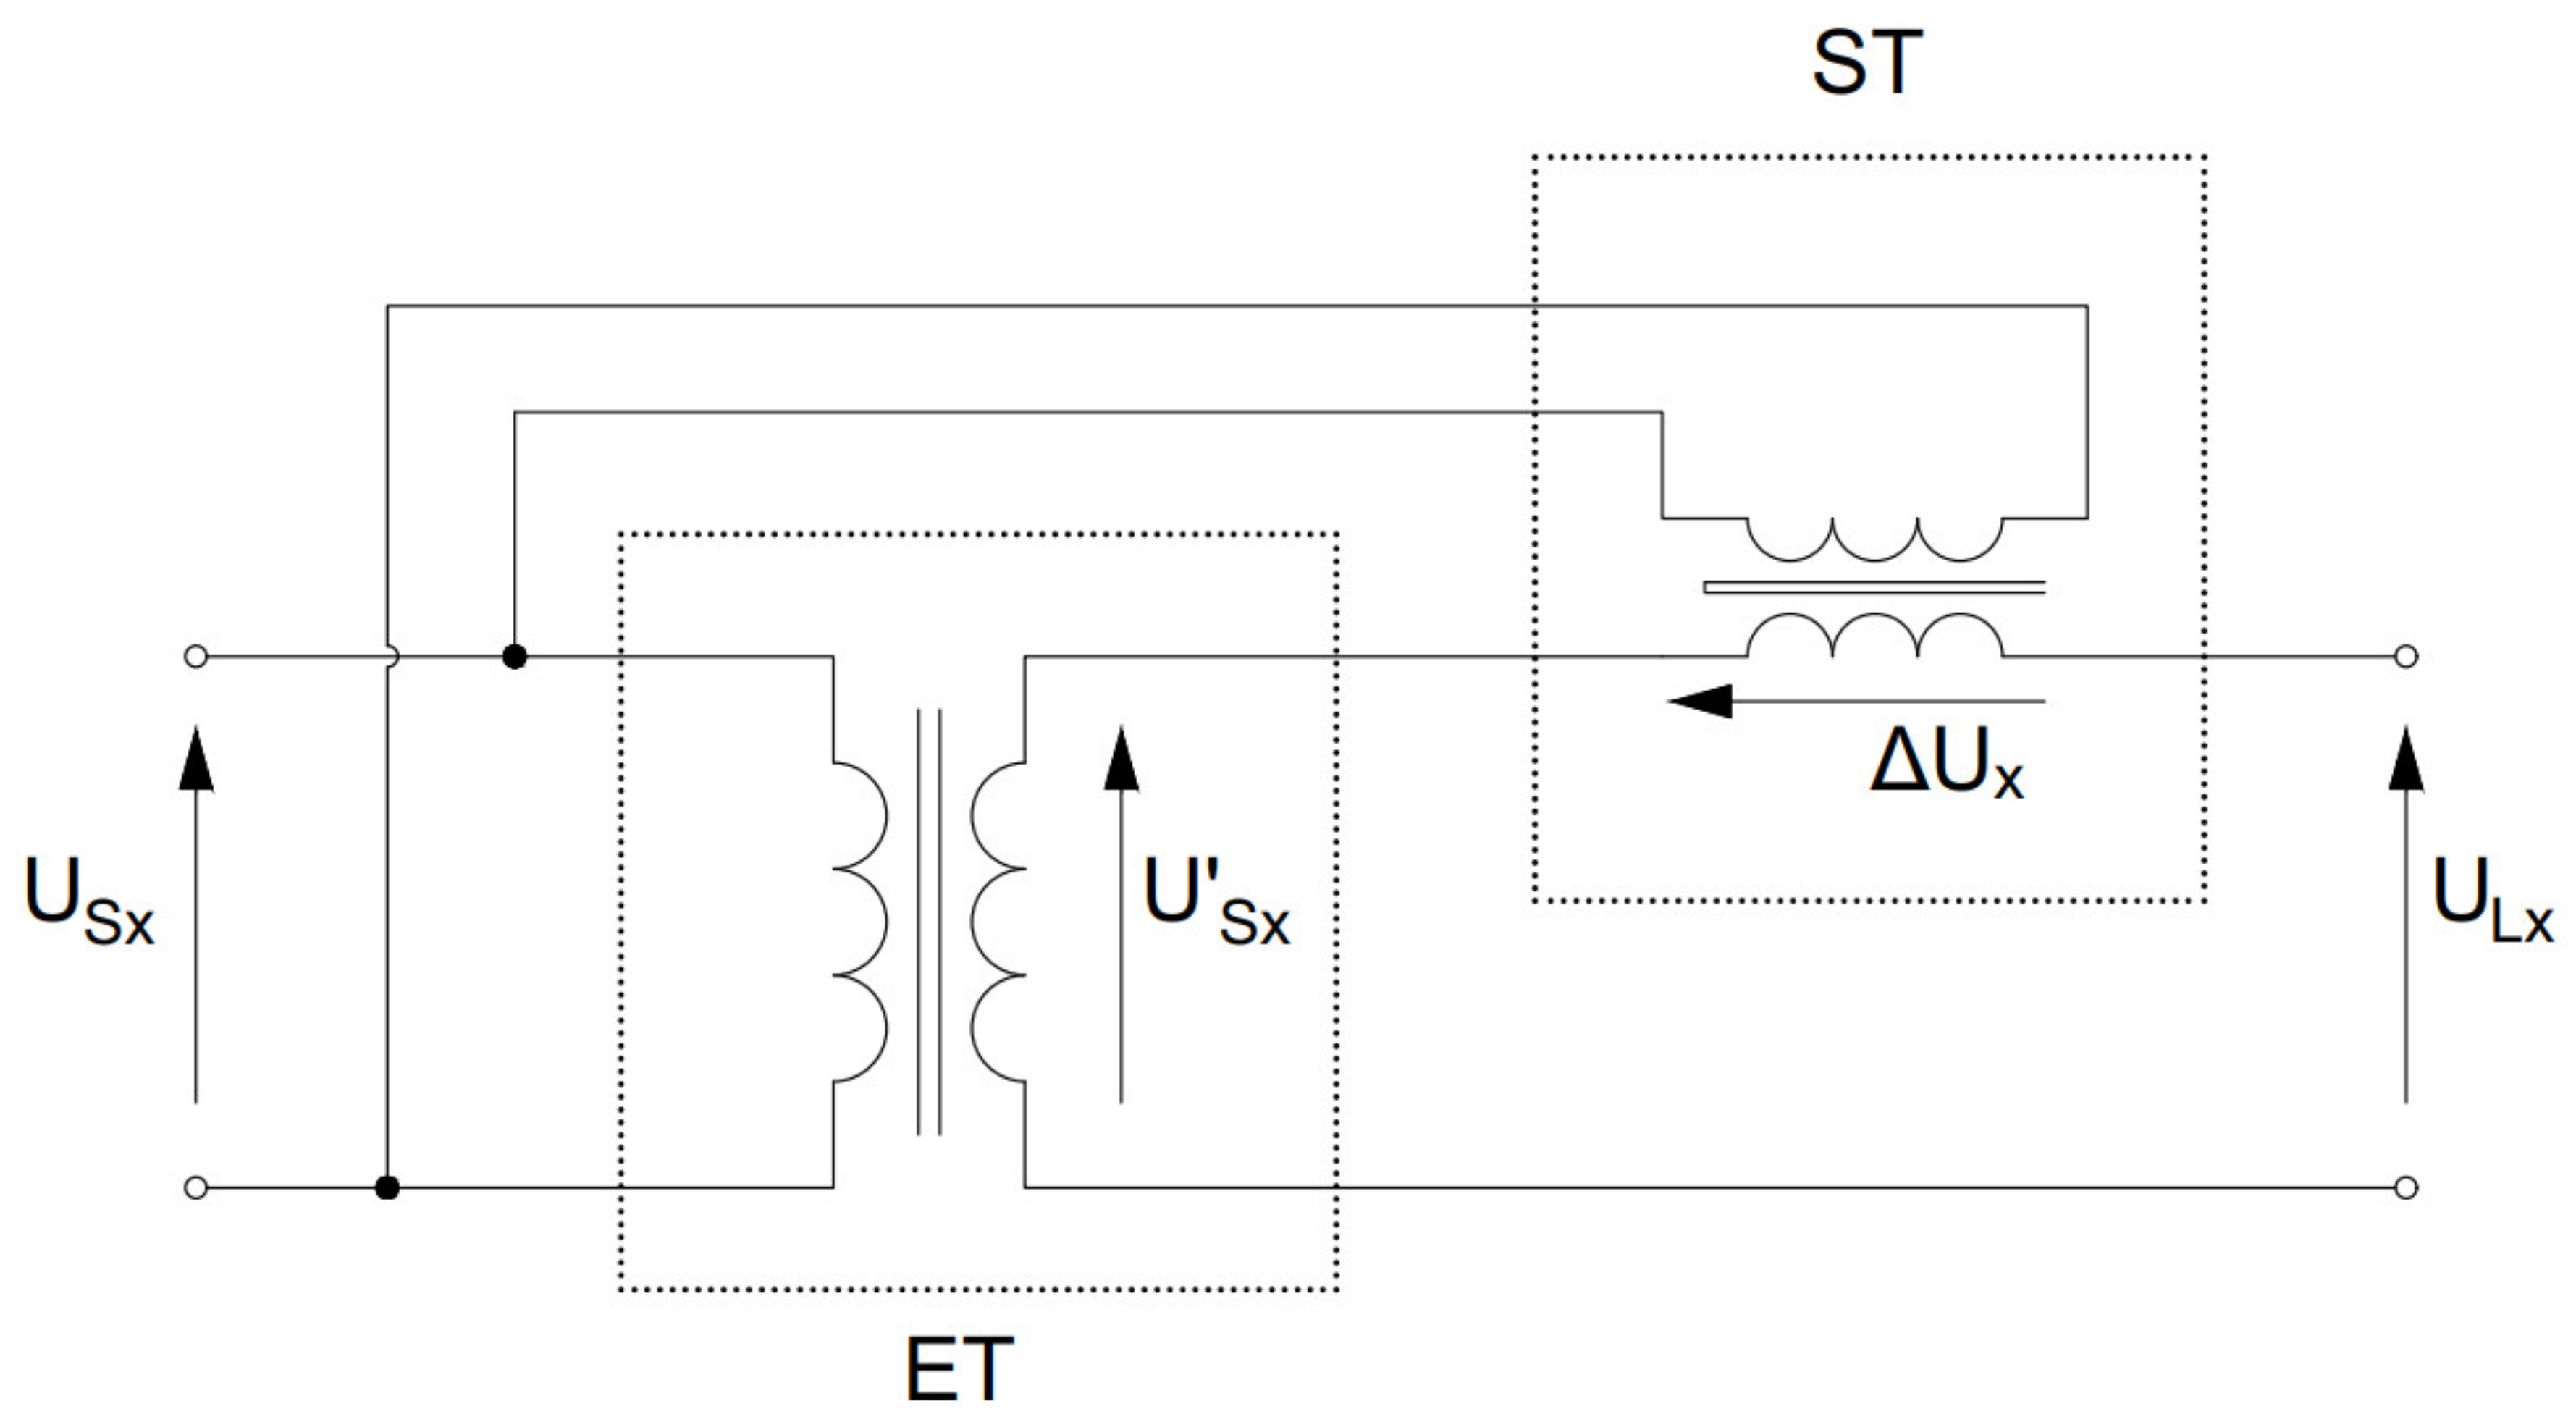
The relation between voltages of both ET (
Figure 7) sides is described by the voltage transformer ratio
(
= U
Sx/U’
Sx) and controlled by the ACPST operator.
The output voltage U
L can be expressed according to Equation (5):
One can see that when comparing ACPST and APST output voltage UL formulas, an additional ET ratio appears in the ACPST type. This value describes the longitudinal voltage regulation.
Figure 8 presents a possible regulation range for one-way quadrature voltage. In some cases, it can work as a classical transformer (no angle regulation) in the range (U
Smin = 196 V to U
Smax = 249 V). Injecting maximal series voltage (256 V) into the line gives us the possibility of obtaining U
L1 = 357 V for the maximal longitudinal voltage value and U
L2 = 322 V for the minimal. Due to these high output voltage values, in practical applications the maximal series voltage is impossible to inject. However, due to the secondary windings construction, the possibility of such voltage implementation is available and is accordingly presented above [
25].
The PST efficiency is calculated according to the Equation (6):
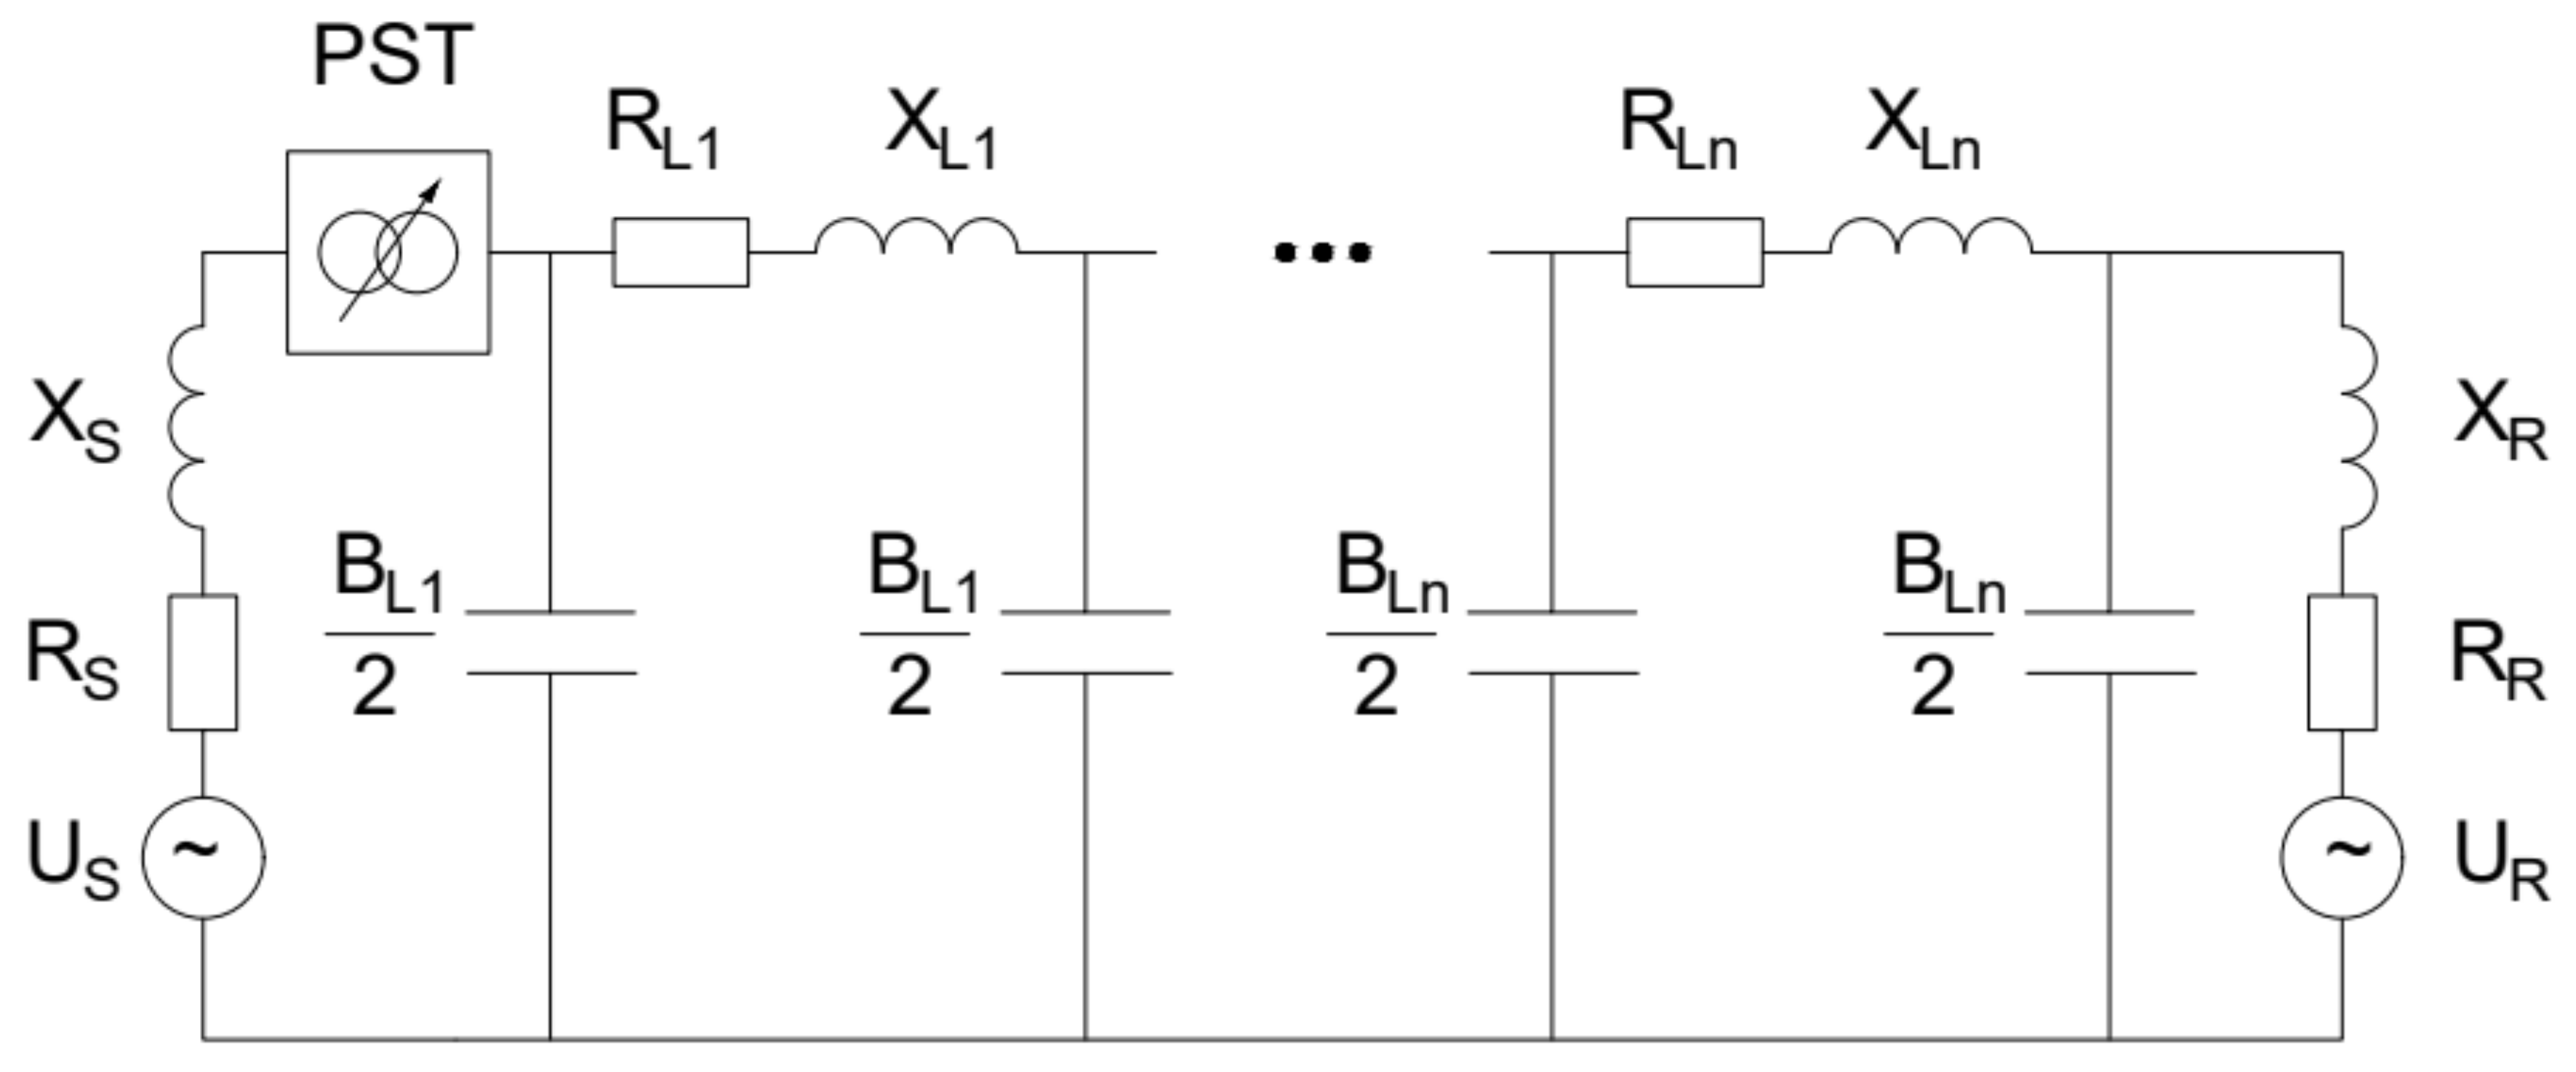
The laboratory system consisted of a single transmission line with variable length (
Figure 9). The line was prepared as a distributed π-line model [
25]. Single-section parameters are given below:
- -
RL1 = 0.04 Ω,
- -
XL1 = 0.23 Ω,
- -
BL1 = 2.5 µS.
The line connected two supply systems—system S1 had lower internal impedance and a higher voltage (ZS = 0.31 + j0.34 Ω, US = 420 V), and system S2 had higher internal impedance and a lower voltage (ZR = 1.05 + j0.66 Ω, UR = 395 V). Both systems’ voltage values resulted from their power sources, and they were not regulated artificially (e.g., via autotransformer) to avoid internal impedance growth.
It should be noted that this laboratory setup does not model EHV power systems. In a real EHV PSN, the internal reactance to the internal resistance ratio is greater than ten, and in low-voltage conditions the resistance value is comparable to reactance, or even greater. Although this fact does not have any impact on PST efficiency, it can certainly affect power flow.
To measure voltage and current signals, voltage probes were used (Pintek DP-200pro, measurement range 100:1, accuracy ≤ ± 2%) along with current probes (Fluke ac i1000s—measurement range 100 A, 10 mV/A, accuracy 2% of reading ± 5 mV). The signals were collected via an NI measurement card and then analyzed in SignalExpress and Matlab [
26,
27].
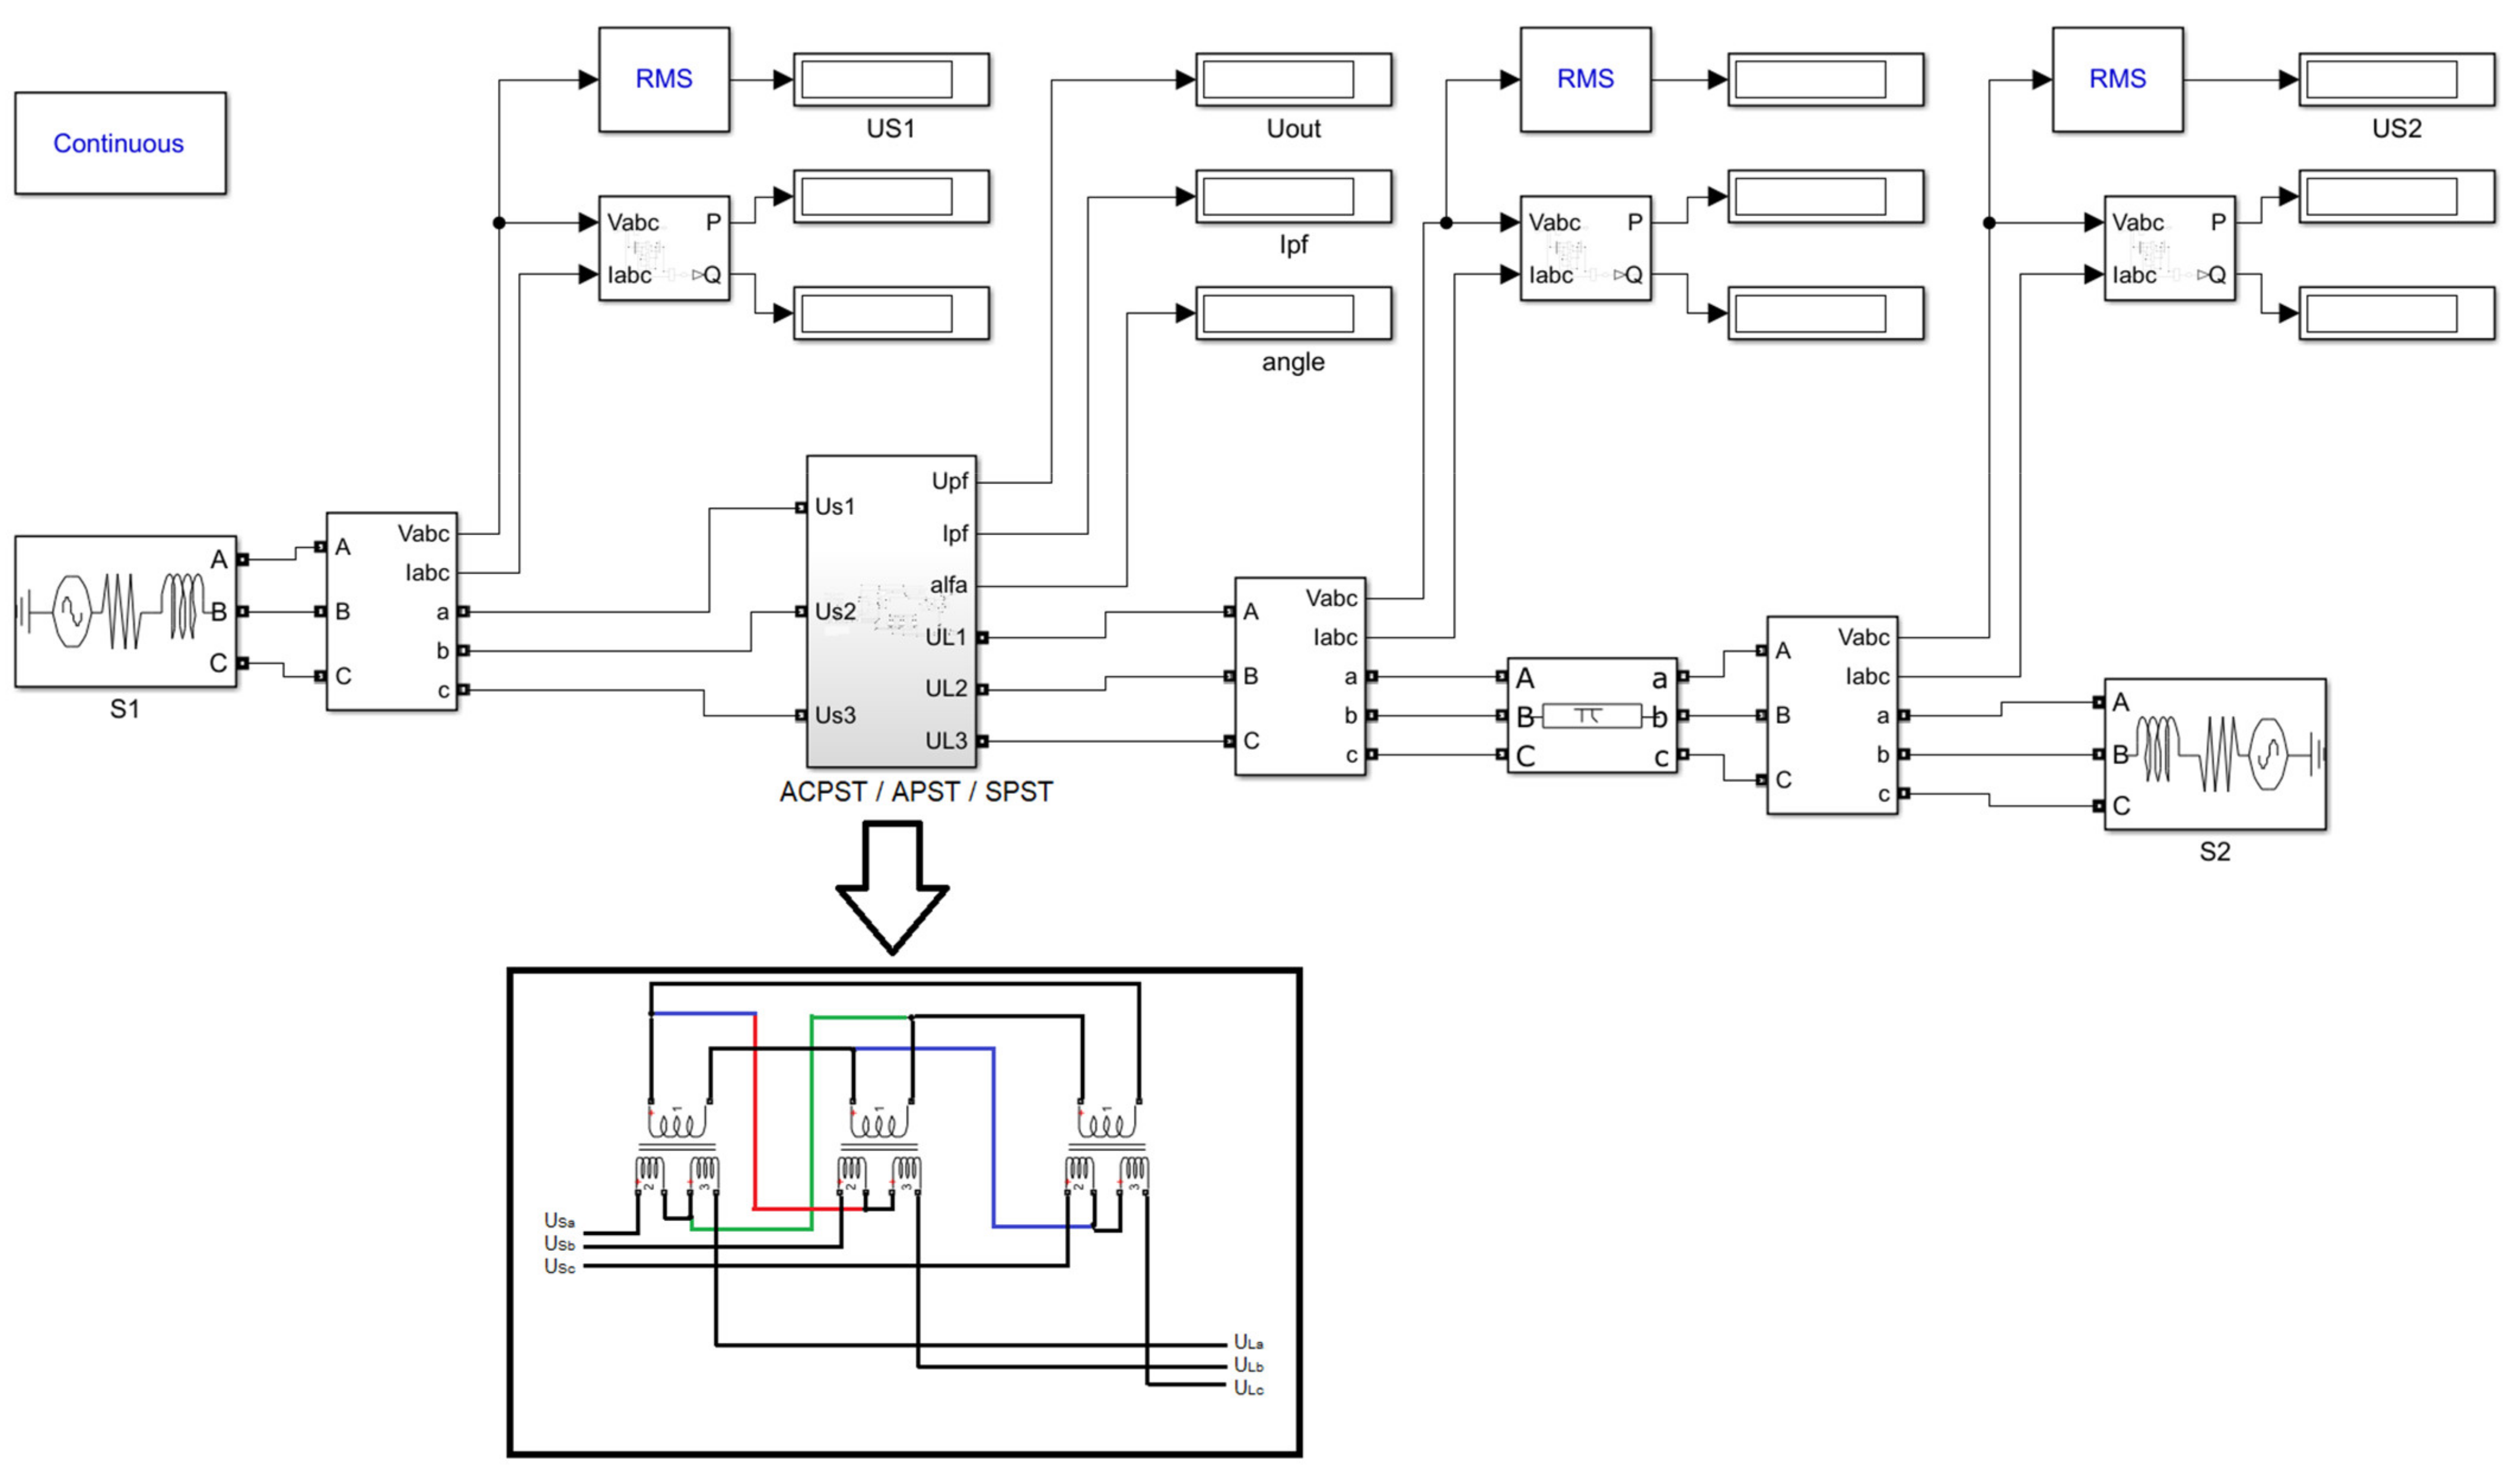
Subsequently, an equivalent of the laboratory setup with PST was built in the Matlab/Simulink software (
Figure 10), and then the model was verified by comparing it to the real measured values. Based on this simulation, APST and SPST models were also prepared so that their operation could be analyzed, including their efficiency and output parameters. It should be noted that the APST and SPST models were based on the parameters of the ST transformer (
Table 2).
4. Research Results
For the SPST, APST, ACPST, and laboratory ACPST set, tests were performed with measured signals, allowing the preparation of the PST’s efficiency analysis. The SPST and APST were analyzed as single-core types. For ACPST, two transformers were used (the first one using longitudinal regulation, and the second one using series voltage regulation and injection). Laboratory ACPST measurements are represented in each figure by green markers. Additionally, the simulation results of ACPST
400V were obtained for the same conditions as the laboratory test, so these two cases can be used as Simulink model verification.
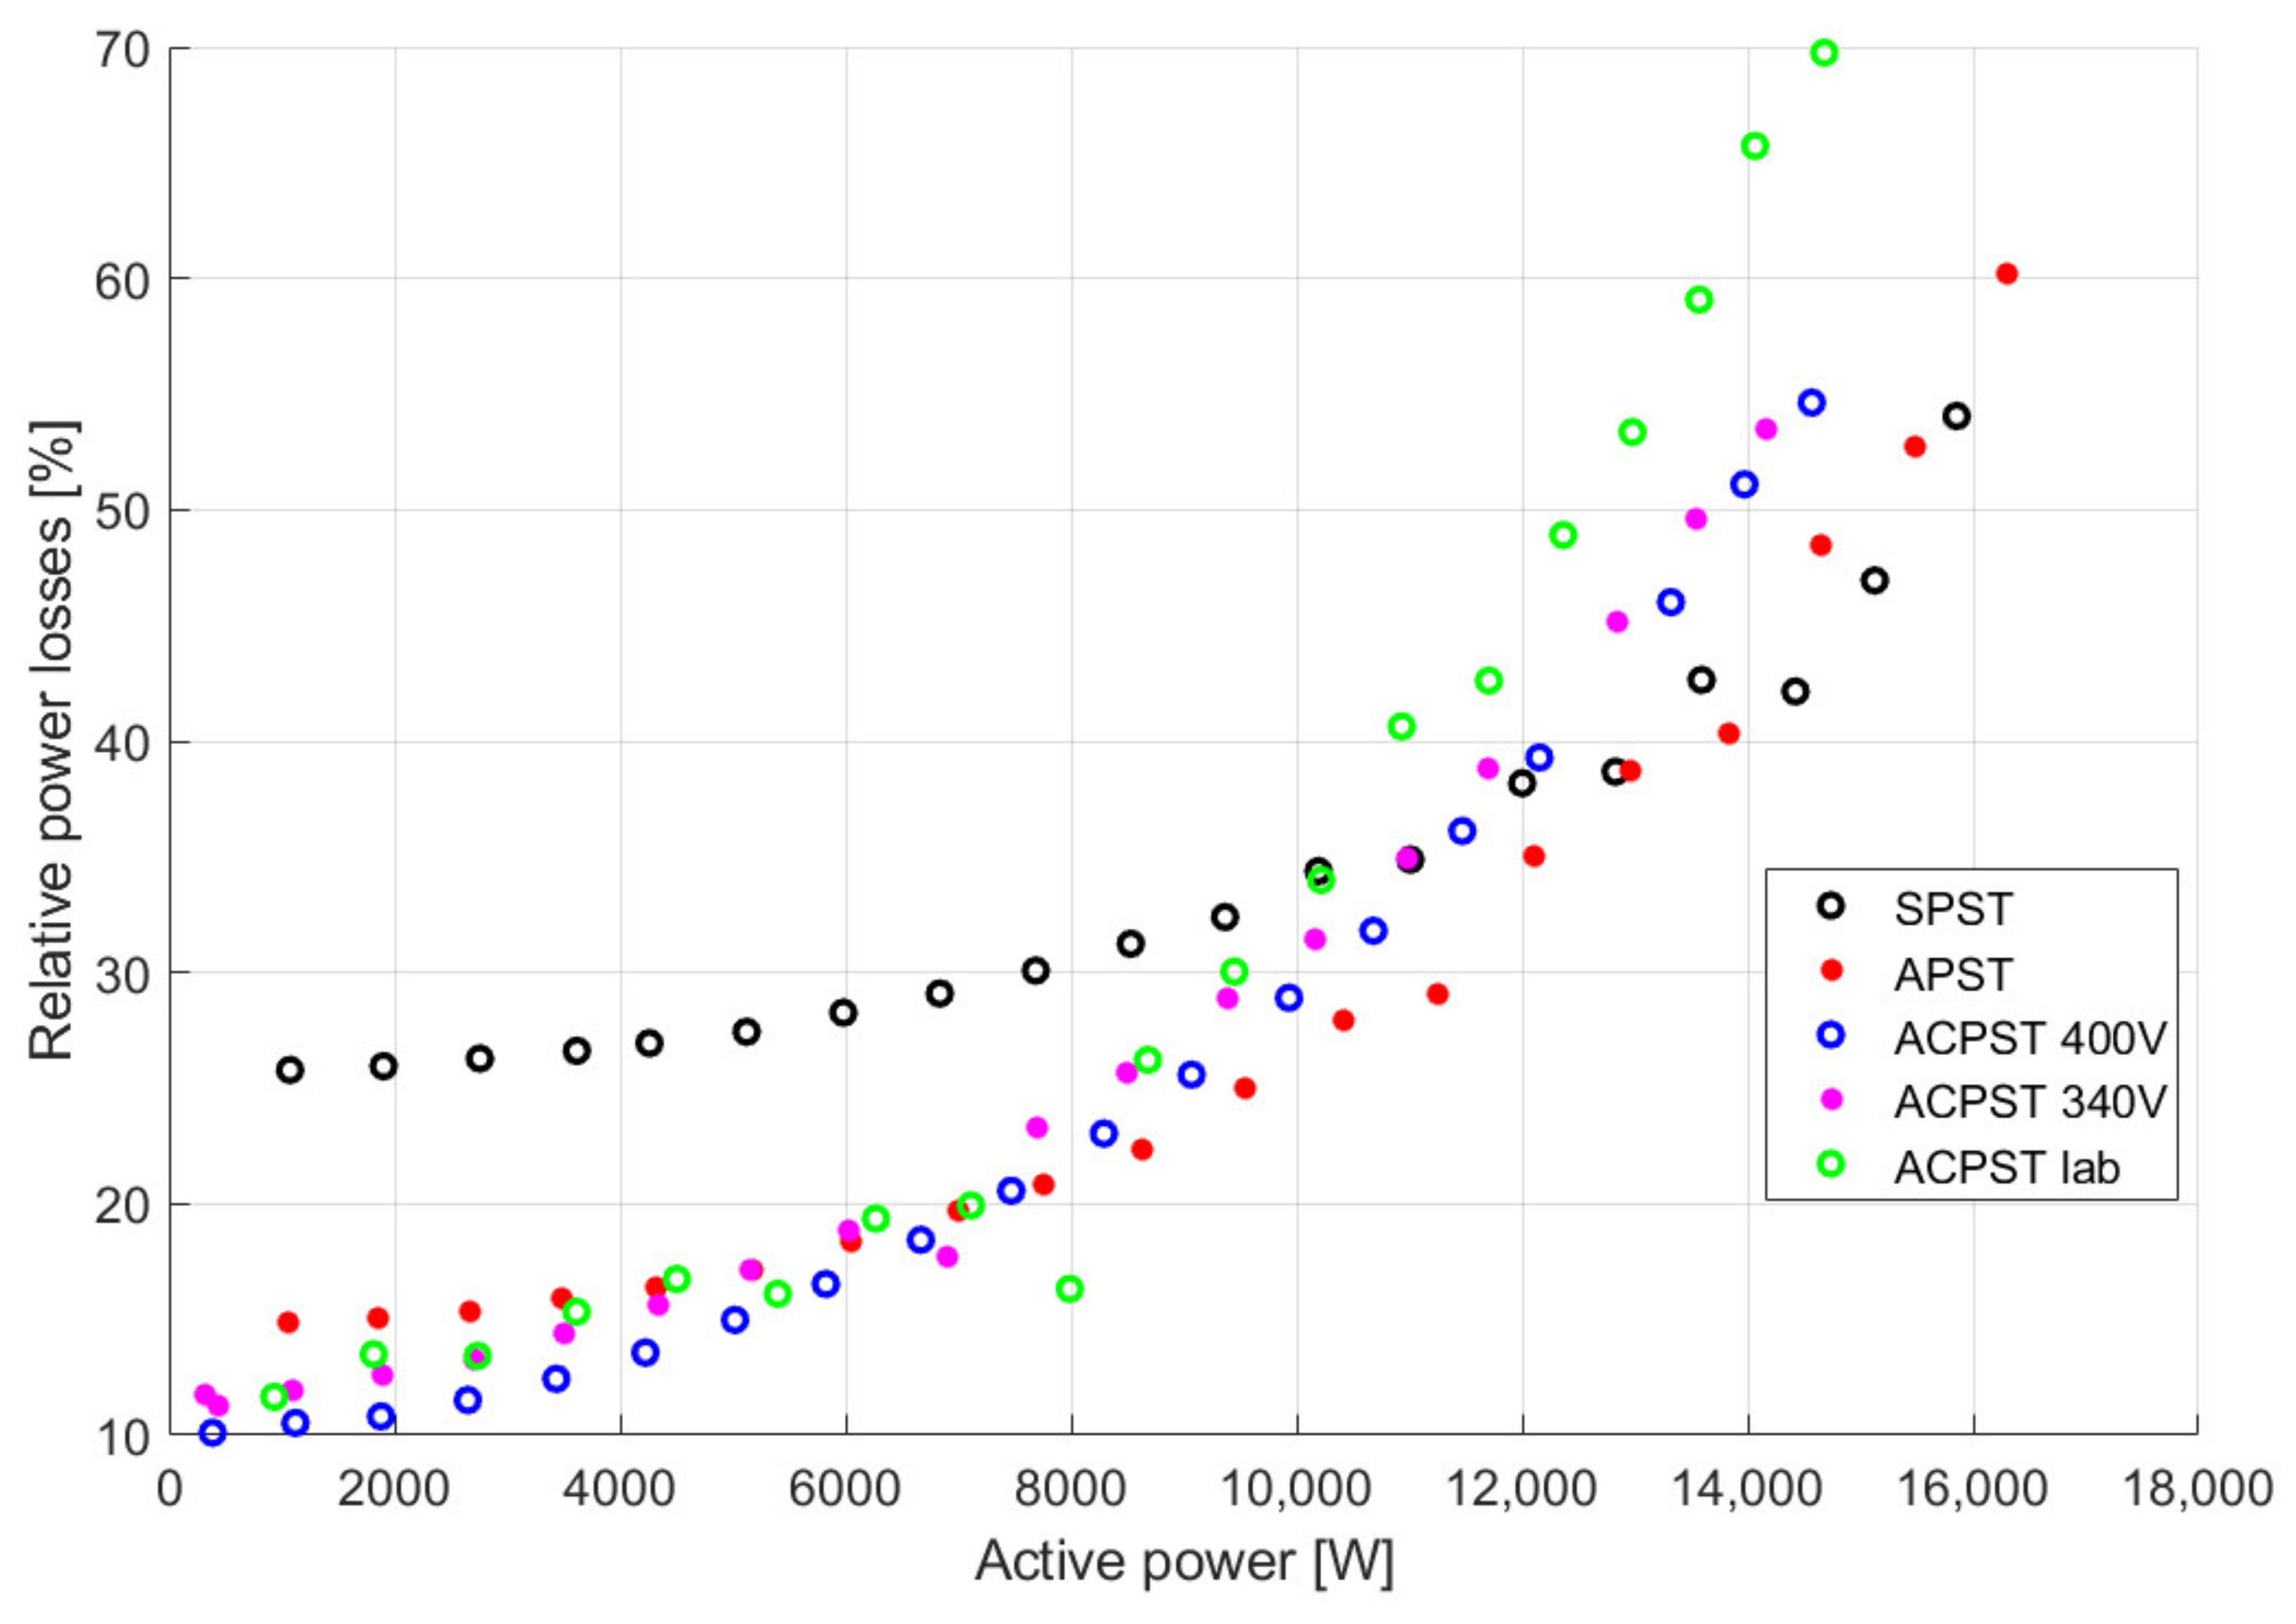
Figure 11 presents results for the relative power losses (RPL), considering the transmitted active power through each PST type as reference. For APST and SPST types, base power loss was equal to 605 W (single transformer PSTs) and ACPST 1415 W (double transformer PST type). The RPL factor is calculated as:
where P
in and P
out are PST input and output active power, respectively, and P
base is rated active power loss.
For the relatively low transmitted active power, the highest RPL is visible for SPST, but this type has better results for the highest powers. Comparing the APST with ACPSTs (both with U’S equal in 340 V and 400 V cases), when the active power was lower than 6000 W, the APST gave more RPL, and for the higher active powers, the APST had a lower RPL factor. The ACPST simulation of the two cases showed similar RPL results, but the 400 V case (blue circles) had better RPL factor values. The PST laboratory set during real tests for low transmitted power had convergent values. The higher the active power flow (greater than 10,000 W), the higher the RPL.
Comparing all PST types, for a transmitted active power higher than 60% of the transformer’s rated power, SPST had the best RPL factors, and the APST had a slightly greater values (from 2 to 5%).
In the range of 35–60% of the rated PST powers, APST and all ACPSTs had similar RPL values. However, it is worth noting that the SPST had the worst results, especially when the active power decreased.
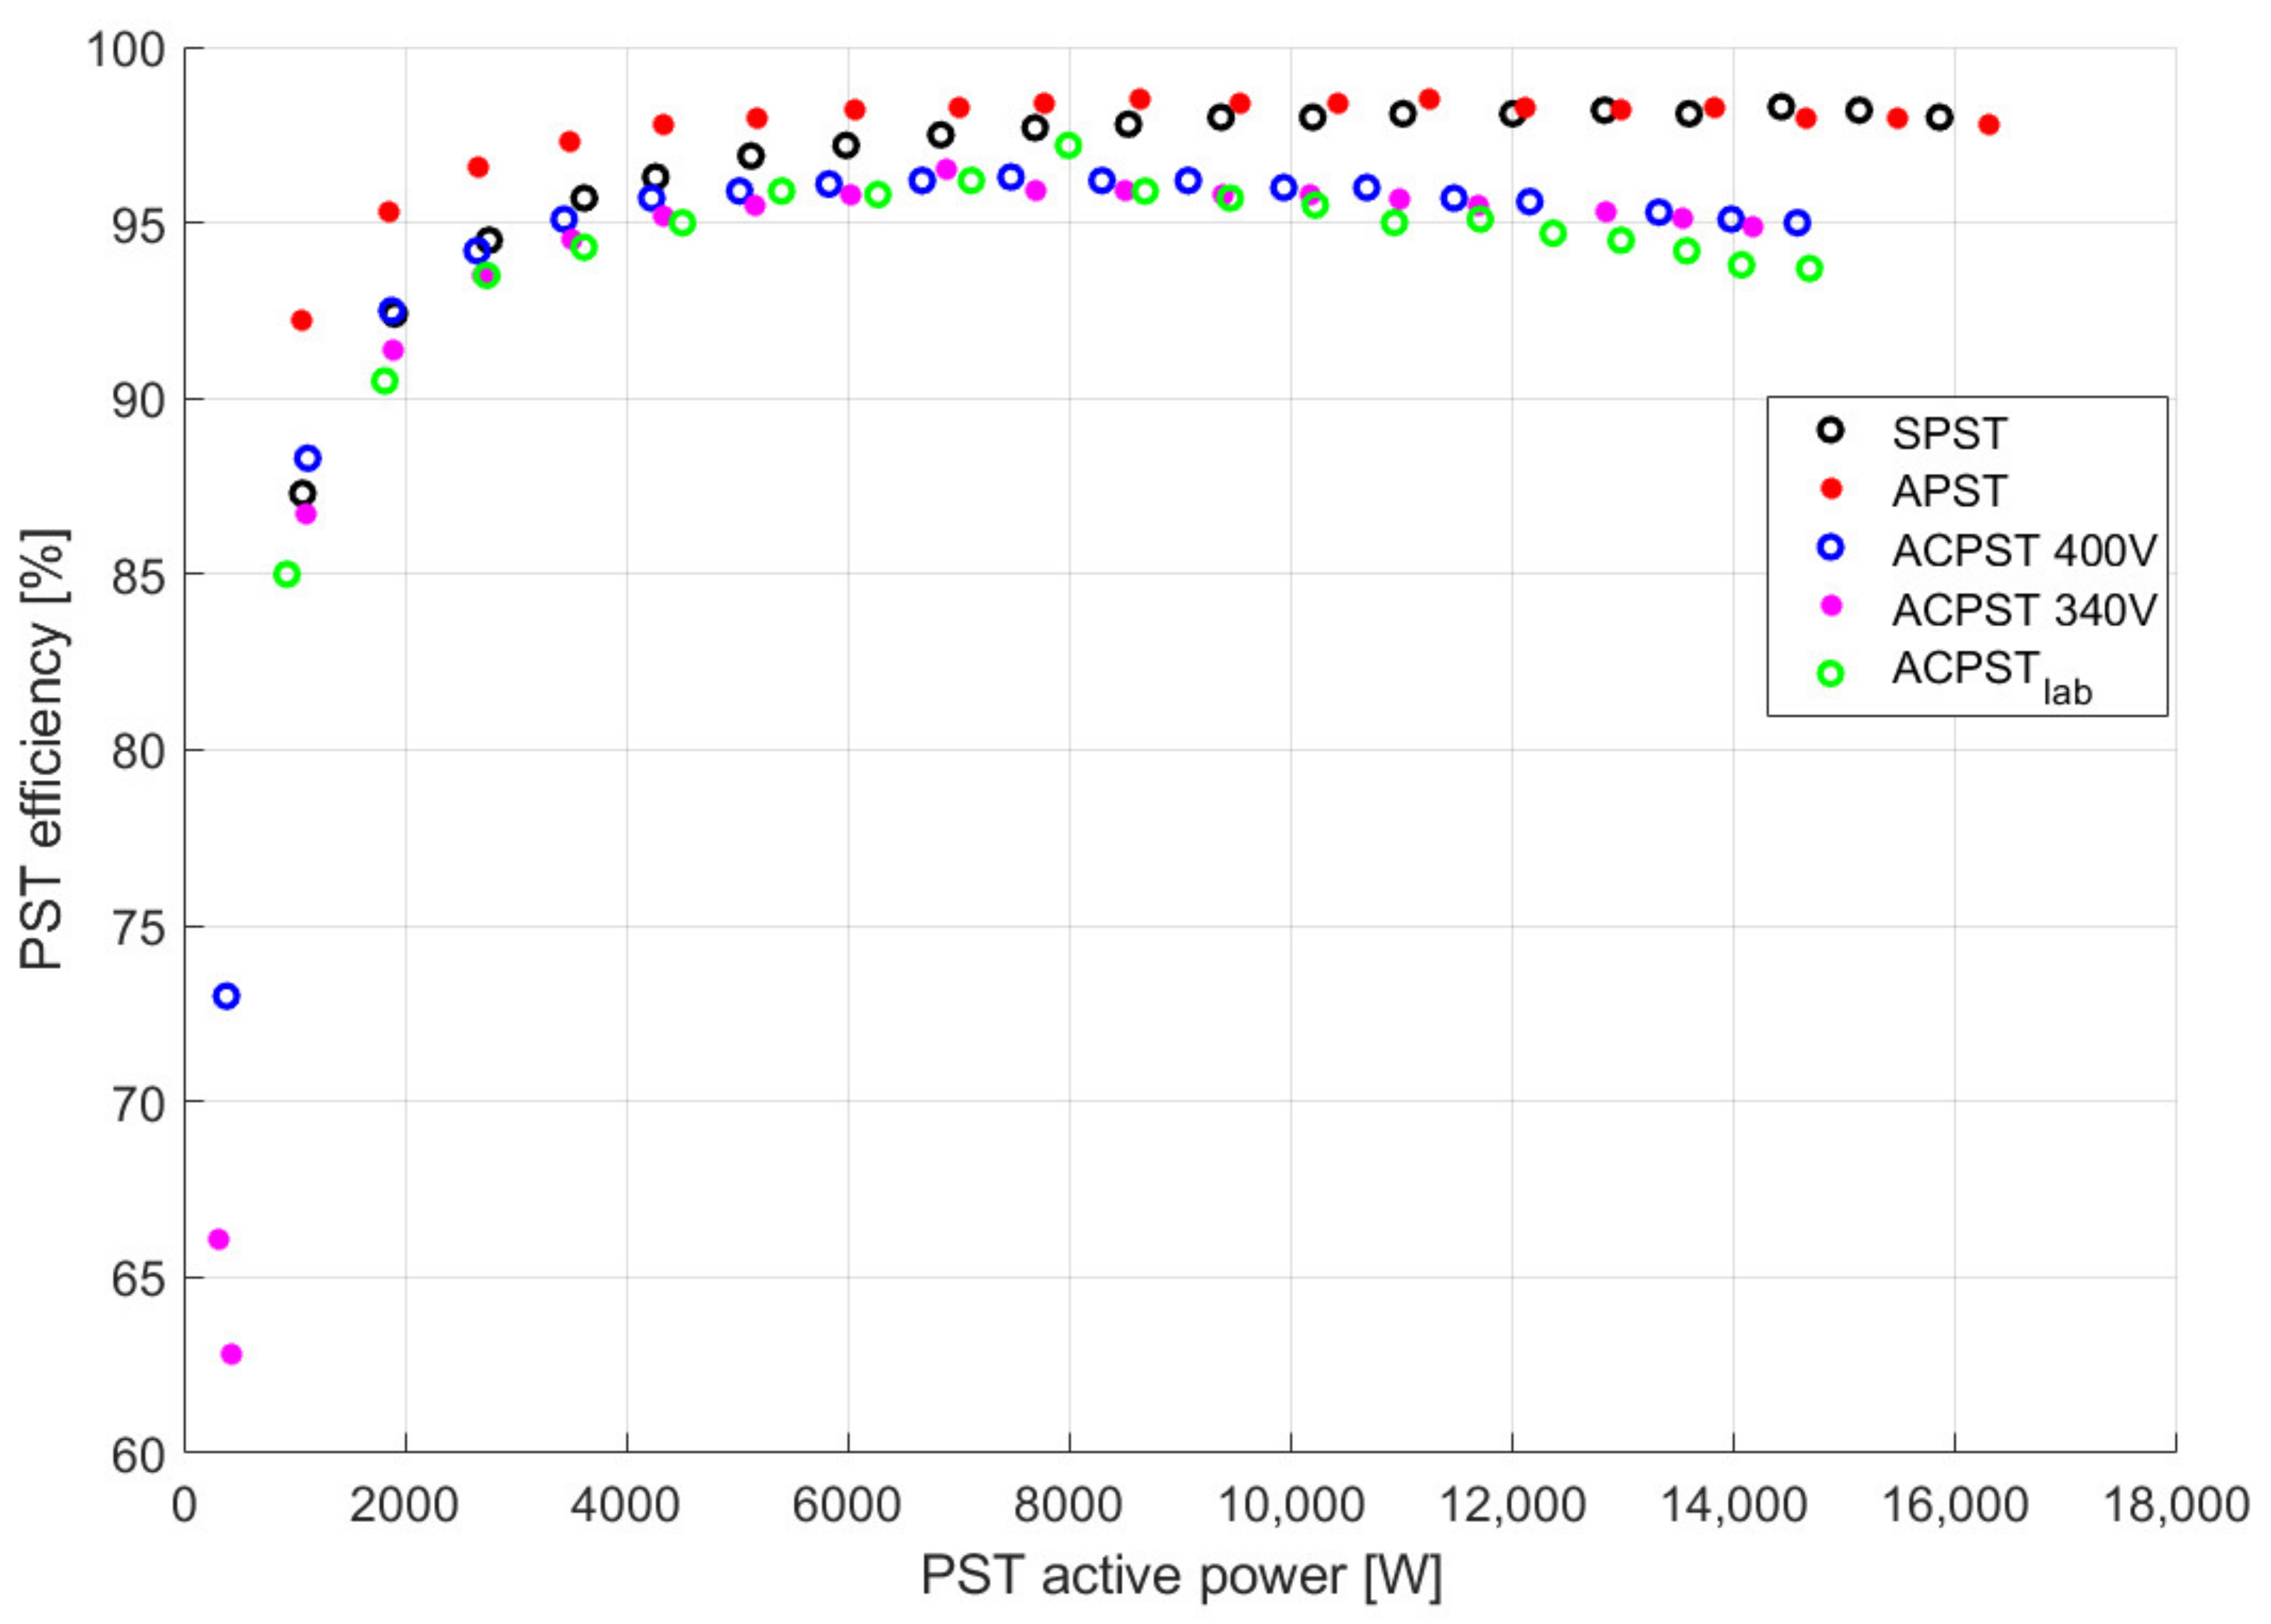
Comparing PSTs’ efficiency (
Figure 12), one can notice that the APST obtains the best efficiency rate over the whole transmitted power range. For the highest powers, the SPST achieves better efficiency, which confirms the results presented in
Figure 11. All ACPST types had similar values in terms of efficiency, which for the highest active powers were smaller than APST and SPST types by about 2–5%, taking ACPST laboratory tests as the worst case.
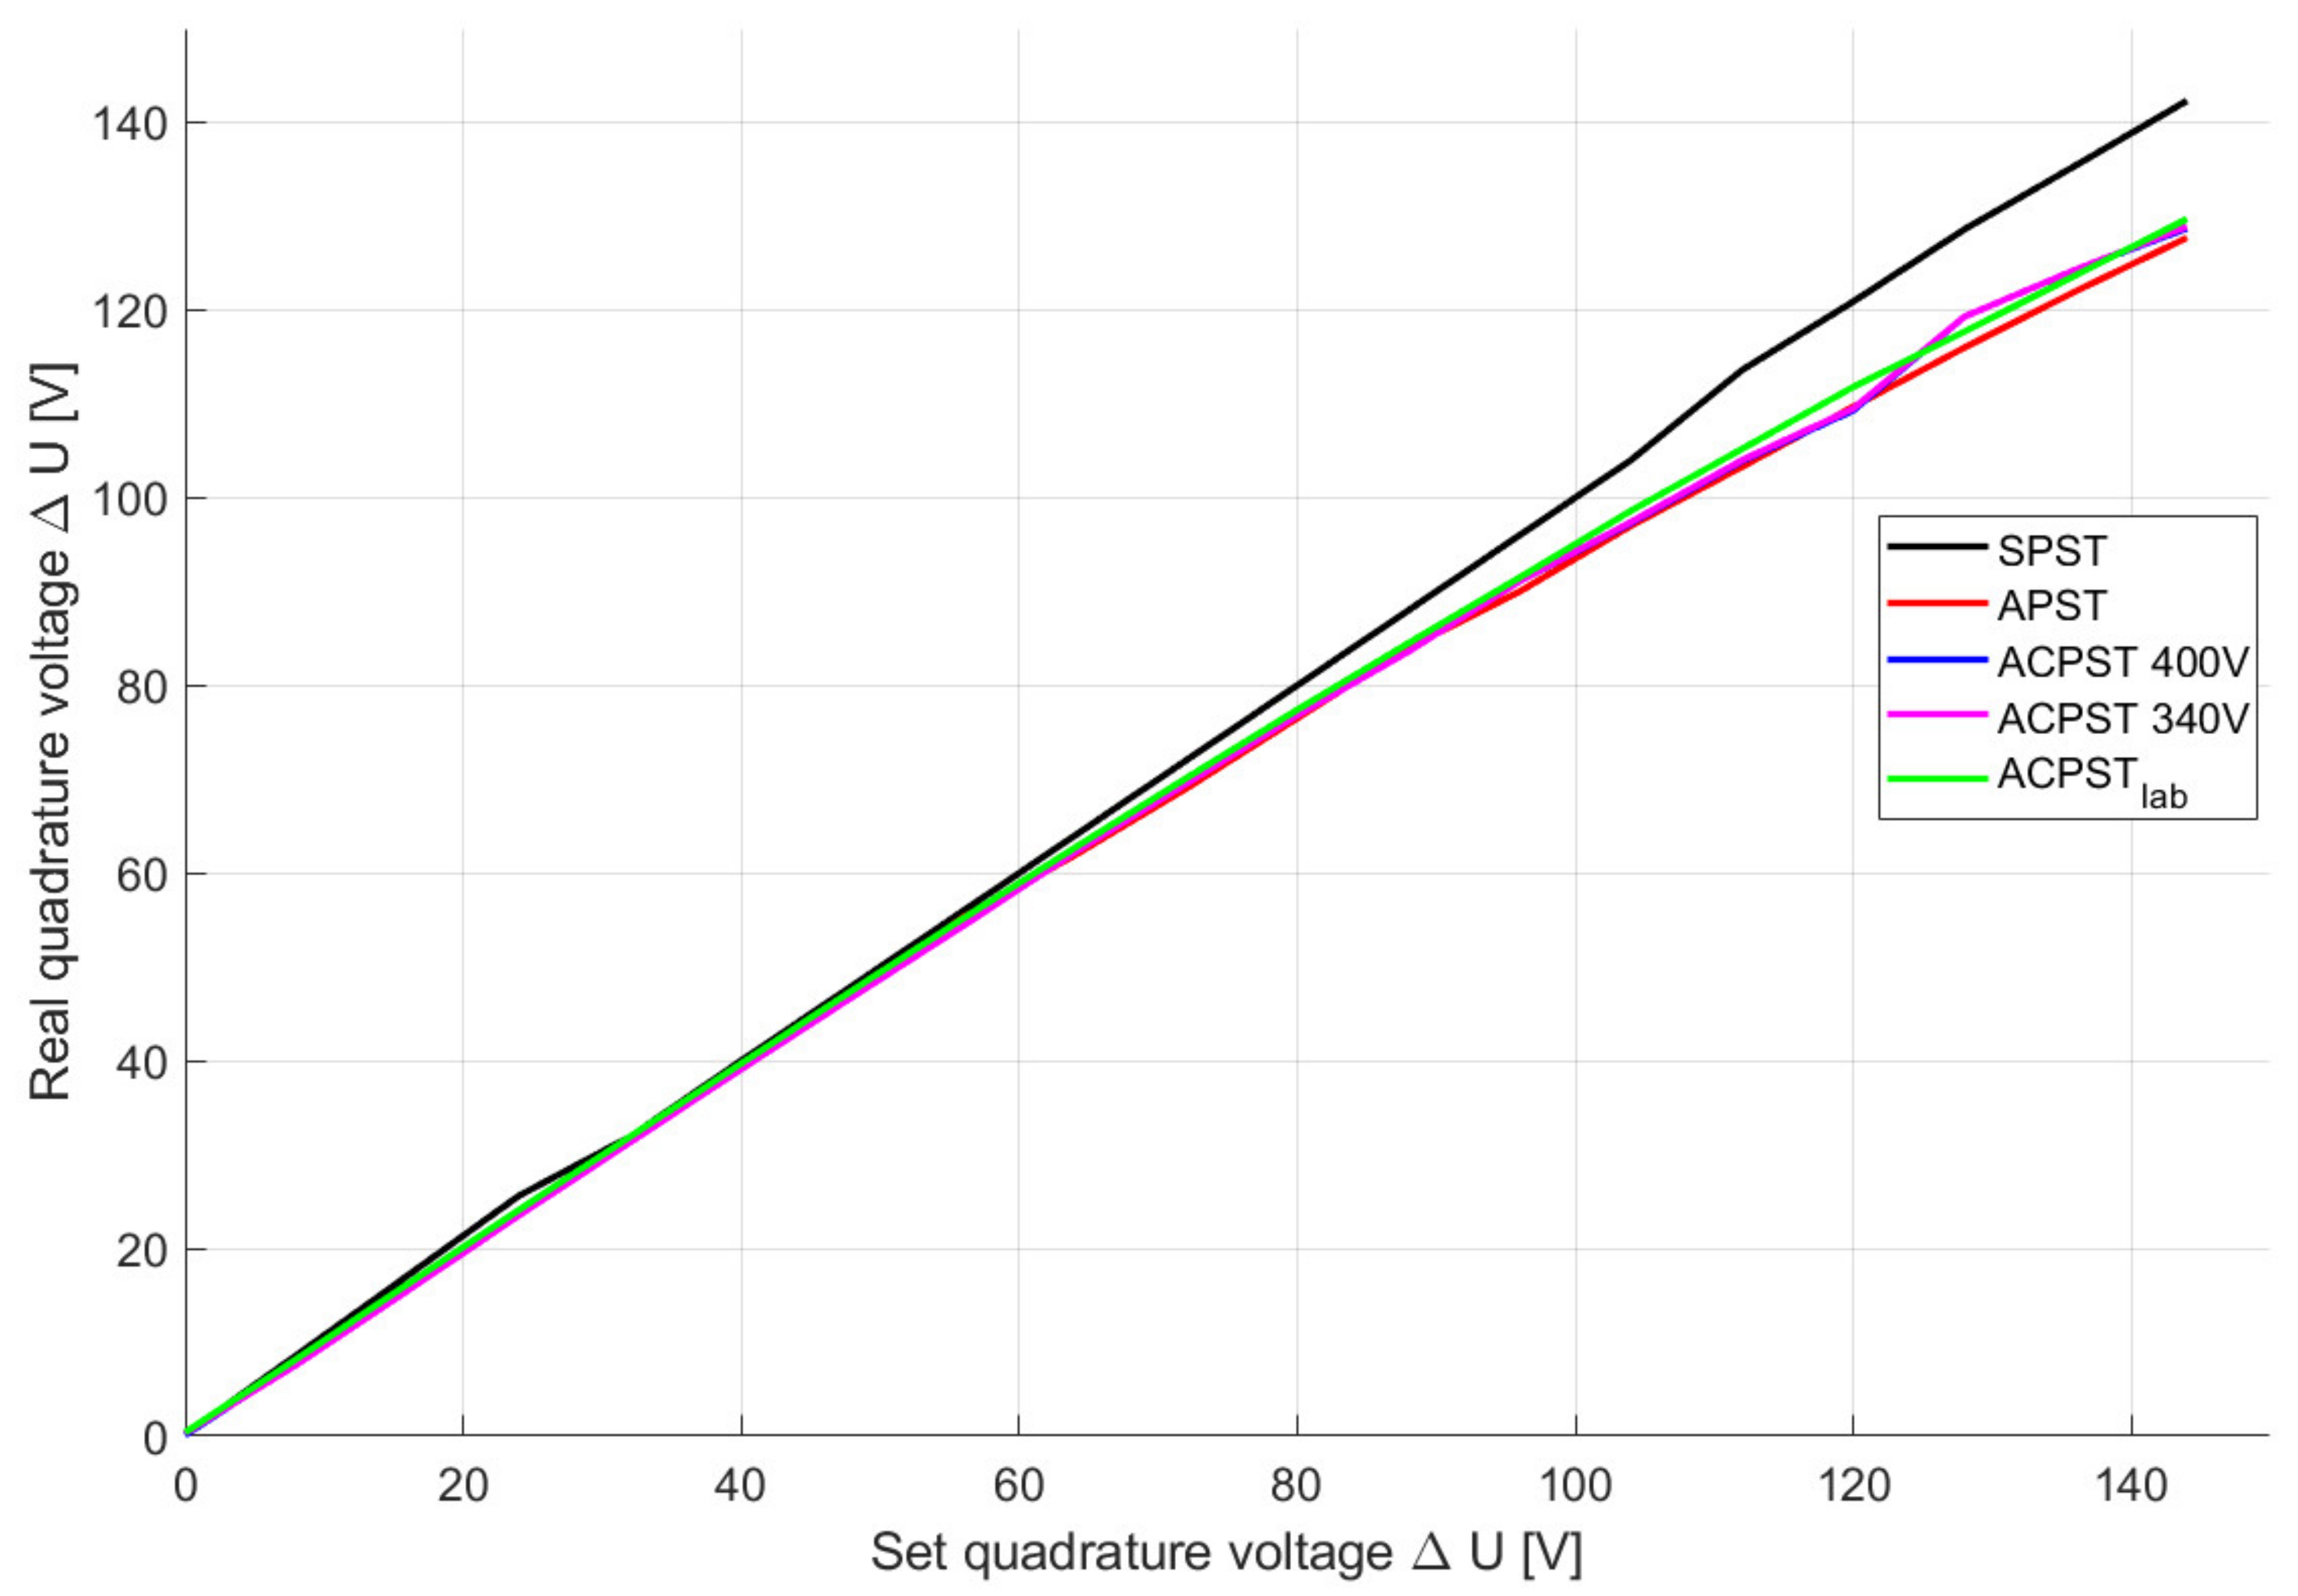
Figure 13 shows that the SPST could keep set quadrature voltage values and add them to the transmission line. For the highest set voltage (144 V), there occurred only a 2 V drop, and the real quadrature voltage was equal to 142 V. All asymmetrical PST types had convergent results, but the voltage drop on the internal PST impedance was much higher than in the SPST case. A set value of 144 V yielded values of 128 V for the APST and 130 V for the laboratory ACPST.
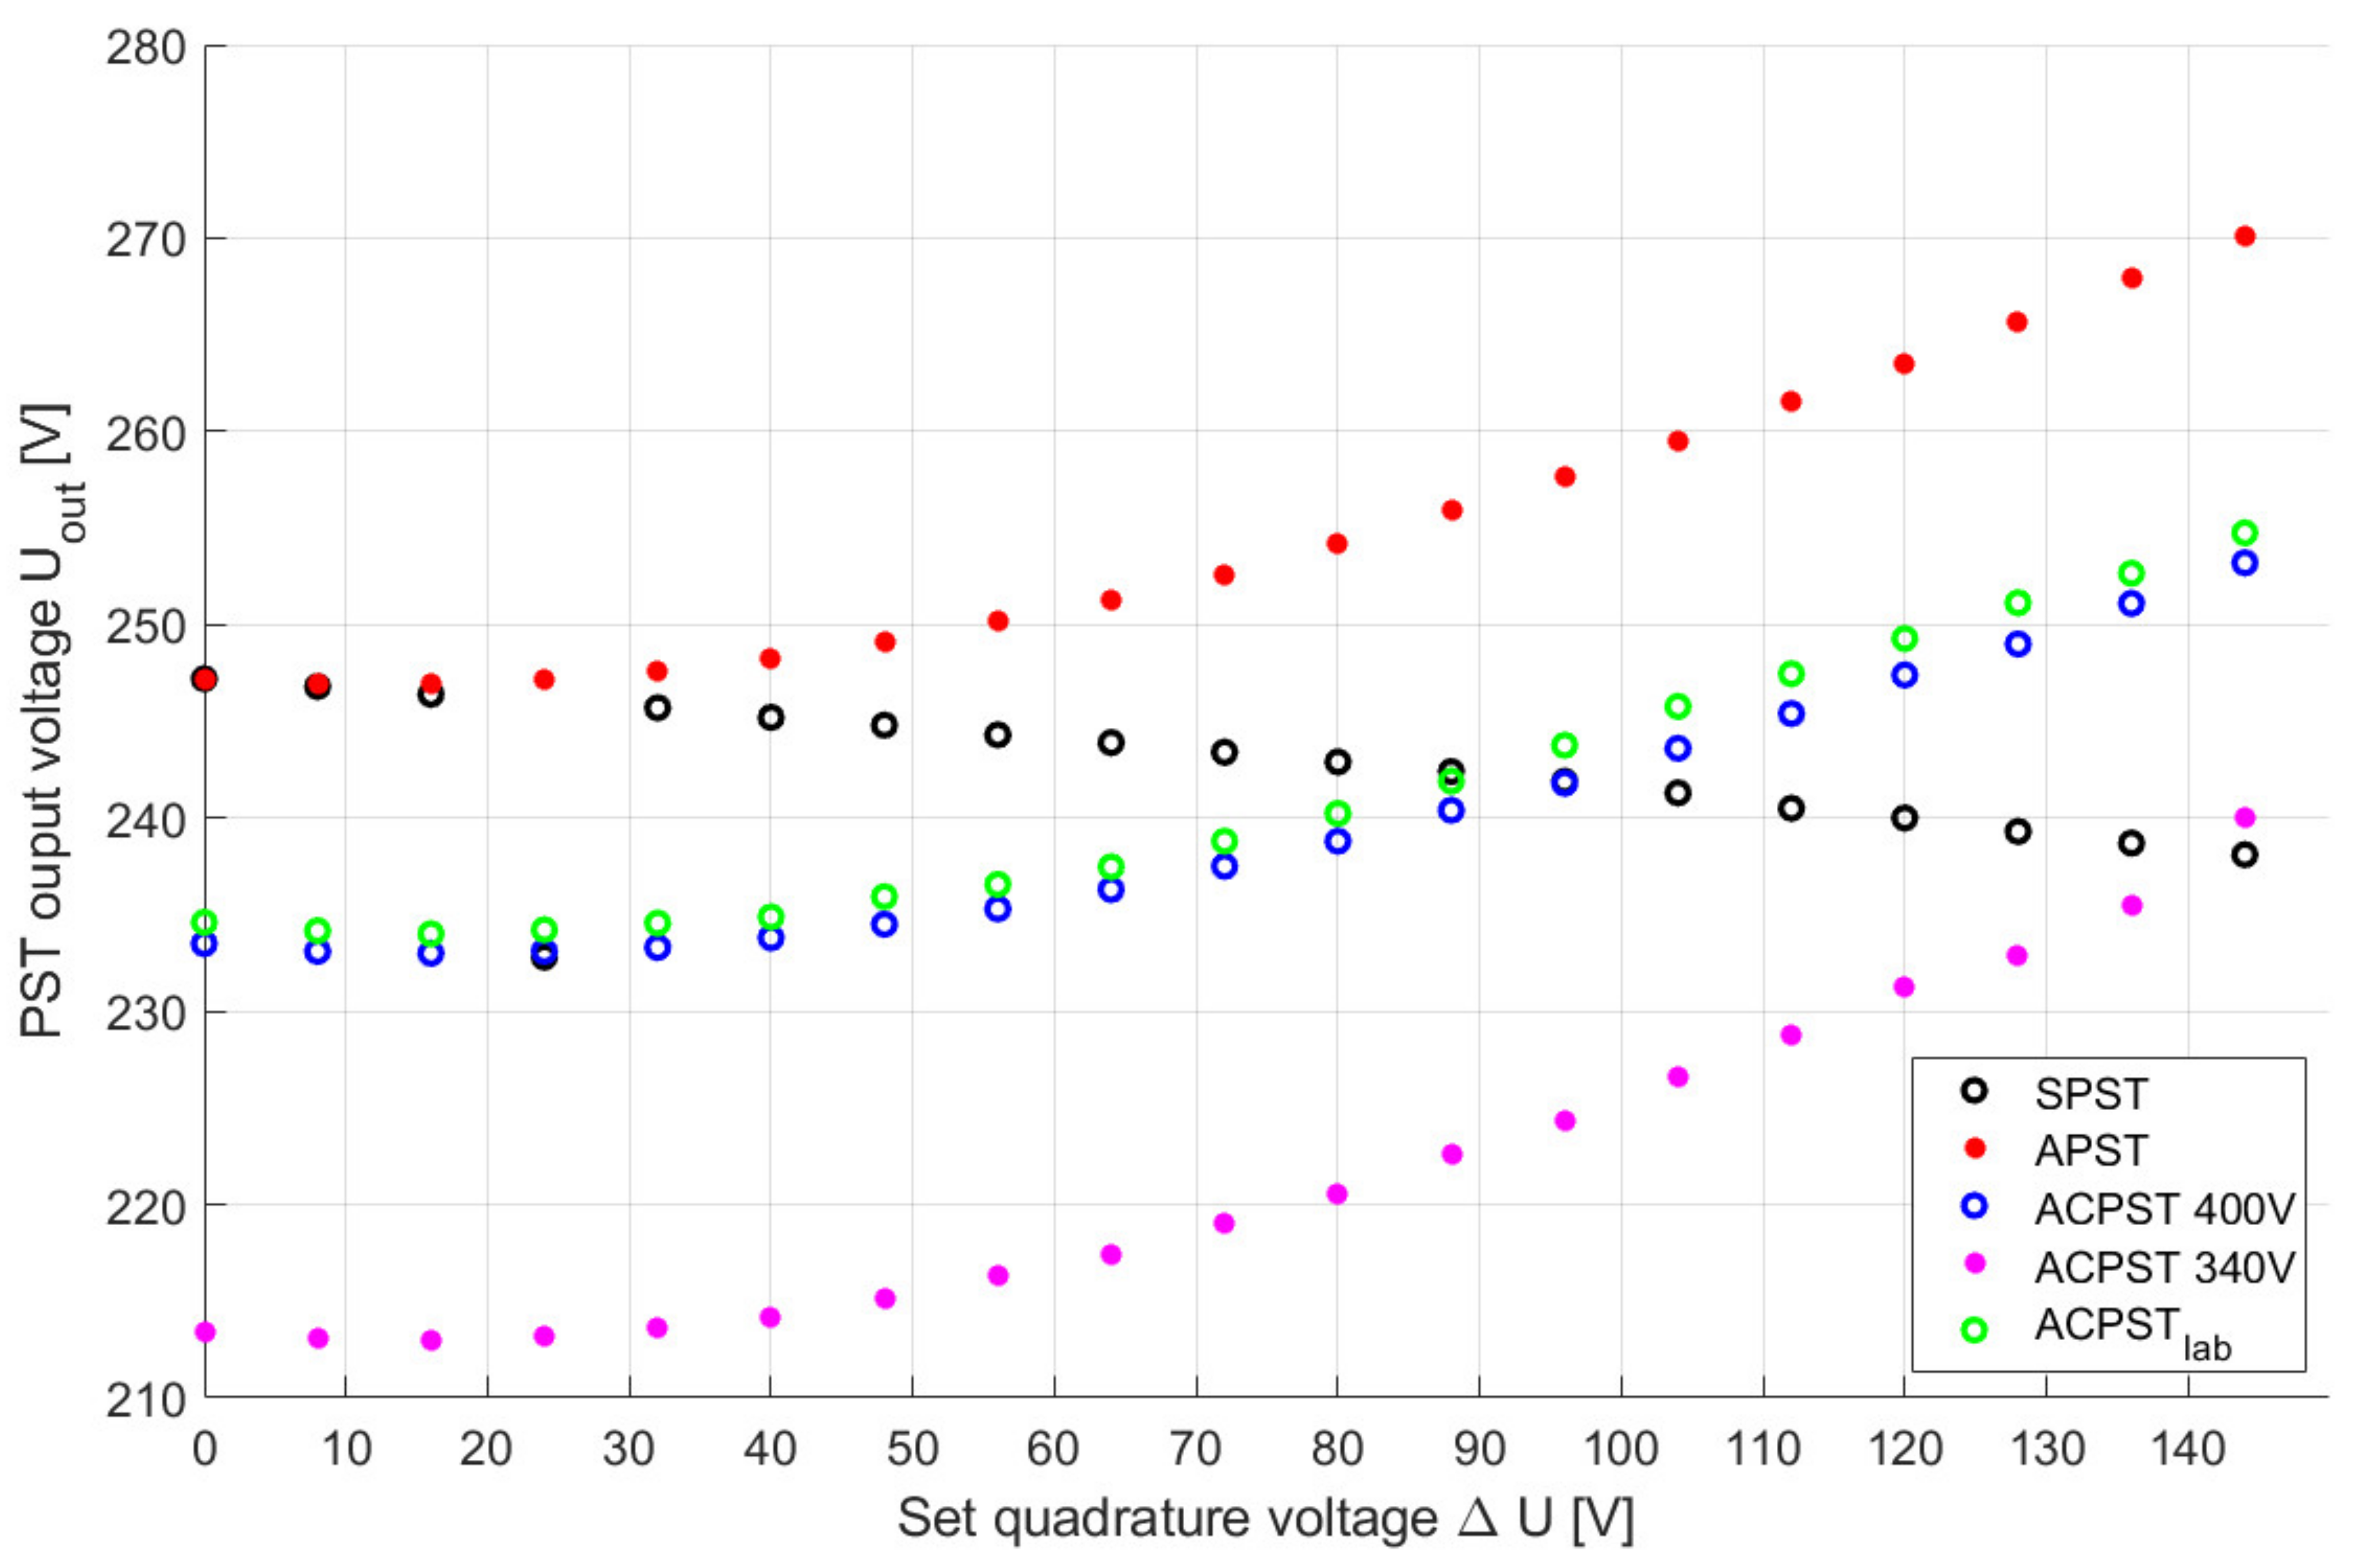
The more critical question is PST’s output voltage value. In the power lines for steady-state, the voltage values are determined by the transmission system operator (TSO) requirements, and for this reason the PST operation cannot exceed the boundary voltage values. The APST type causes a voltage growth in output voltage rated over 10%, which is not acceptable. The output voltage values and transmitted active powers are collected in
Table 3. Additionally, output voltages are presented in
Figure 14.
Considering the data in
Table 3 (or
Figure 14), one can see that the APST resulted in the highest output voltages. For 144 V injected as a quadrature voltage, the output voltage value exceeded 270 V, which is definitely too high for given conditions—it is over 17% greater than the rated line phase-to-ground voltage (230 V). ACPST types, both in simulation and laboratory research, have convergent values. The most profitable in terms of the output voltage were the ACPST, with lowered longitudinal voltage (magenta dots). Only the SPST output voltage decreased, while the quadrature voltage rose. This is a consequence of this PST’s construction. While the quadrature voltage increased, the power flow also increased, resulting in the current value. This influenced the drops in the input voltage to the SPST series windings (which are divided to obtain a symmetrical effect).
Analyzing the efficiency results of each PST (
Figure 12), it is clear that the APST and SPST have the highest values. Considering output voltages, one can note an important disadvantage of the APST—the output voltage values growth is hazardous and, in some cases, unacceptable. Such a disadvantage may result in a decreased regulation possibility in cases of naturally elevated voltage in the APST connection node.
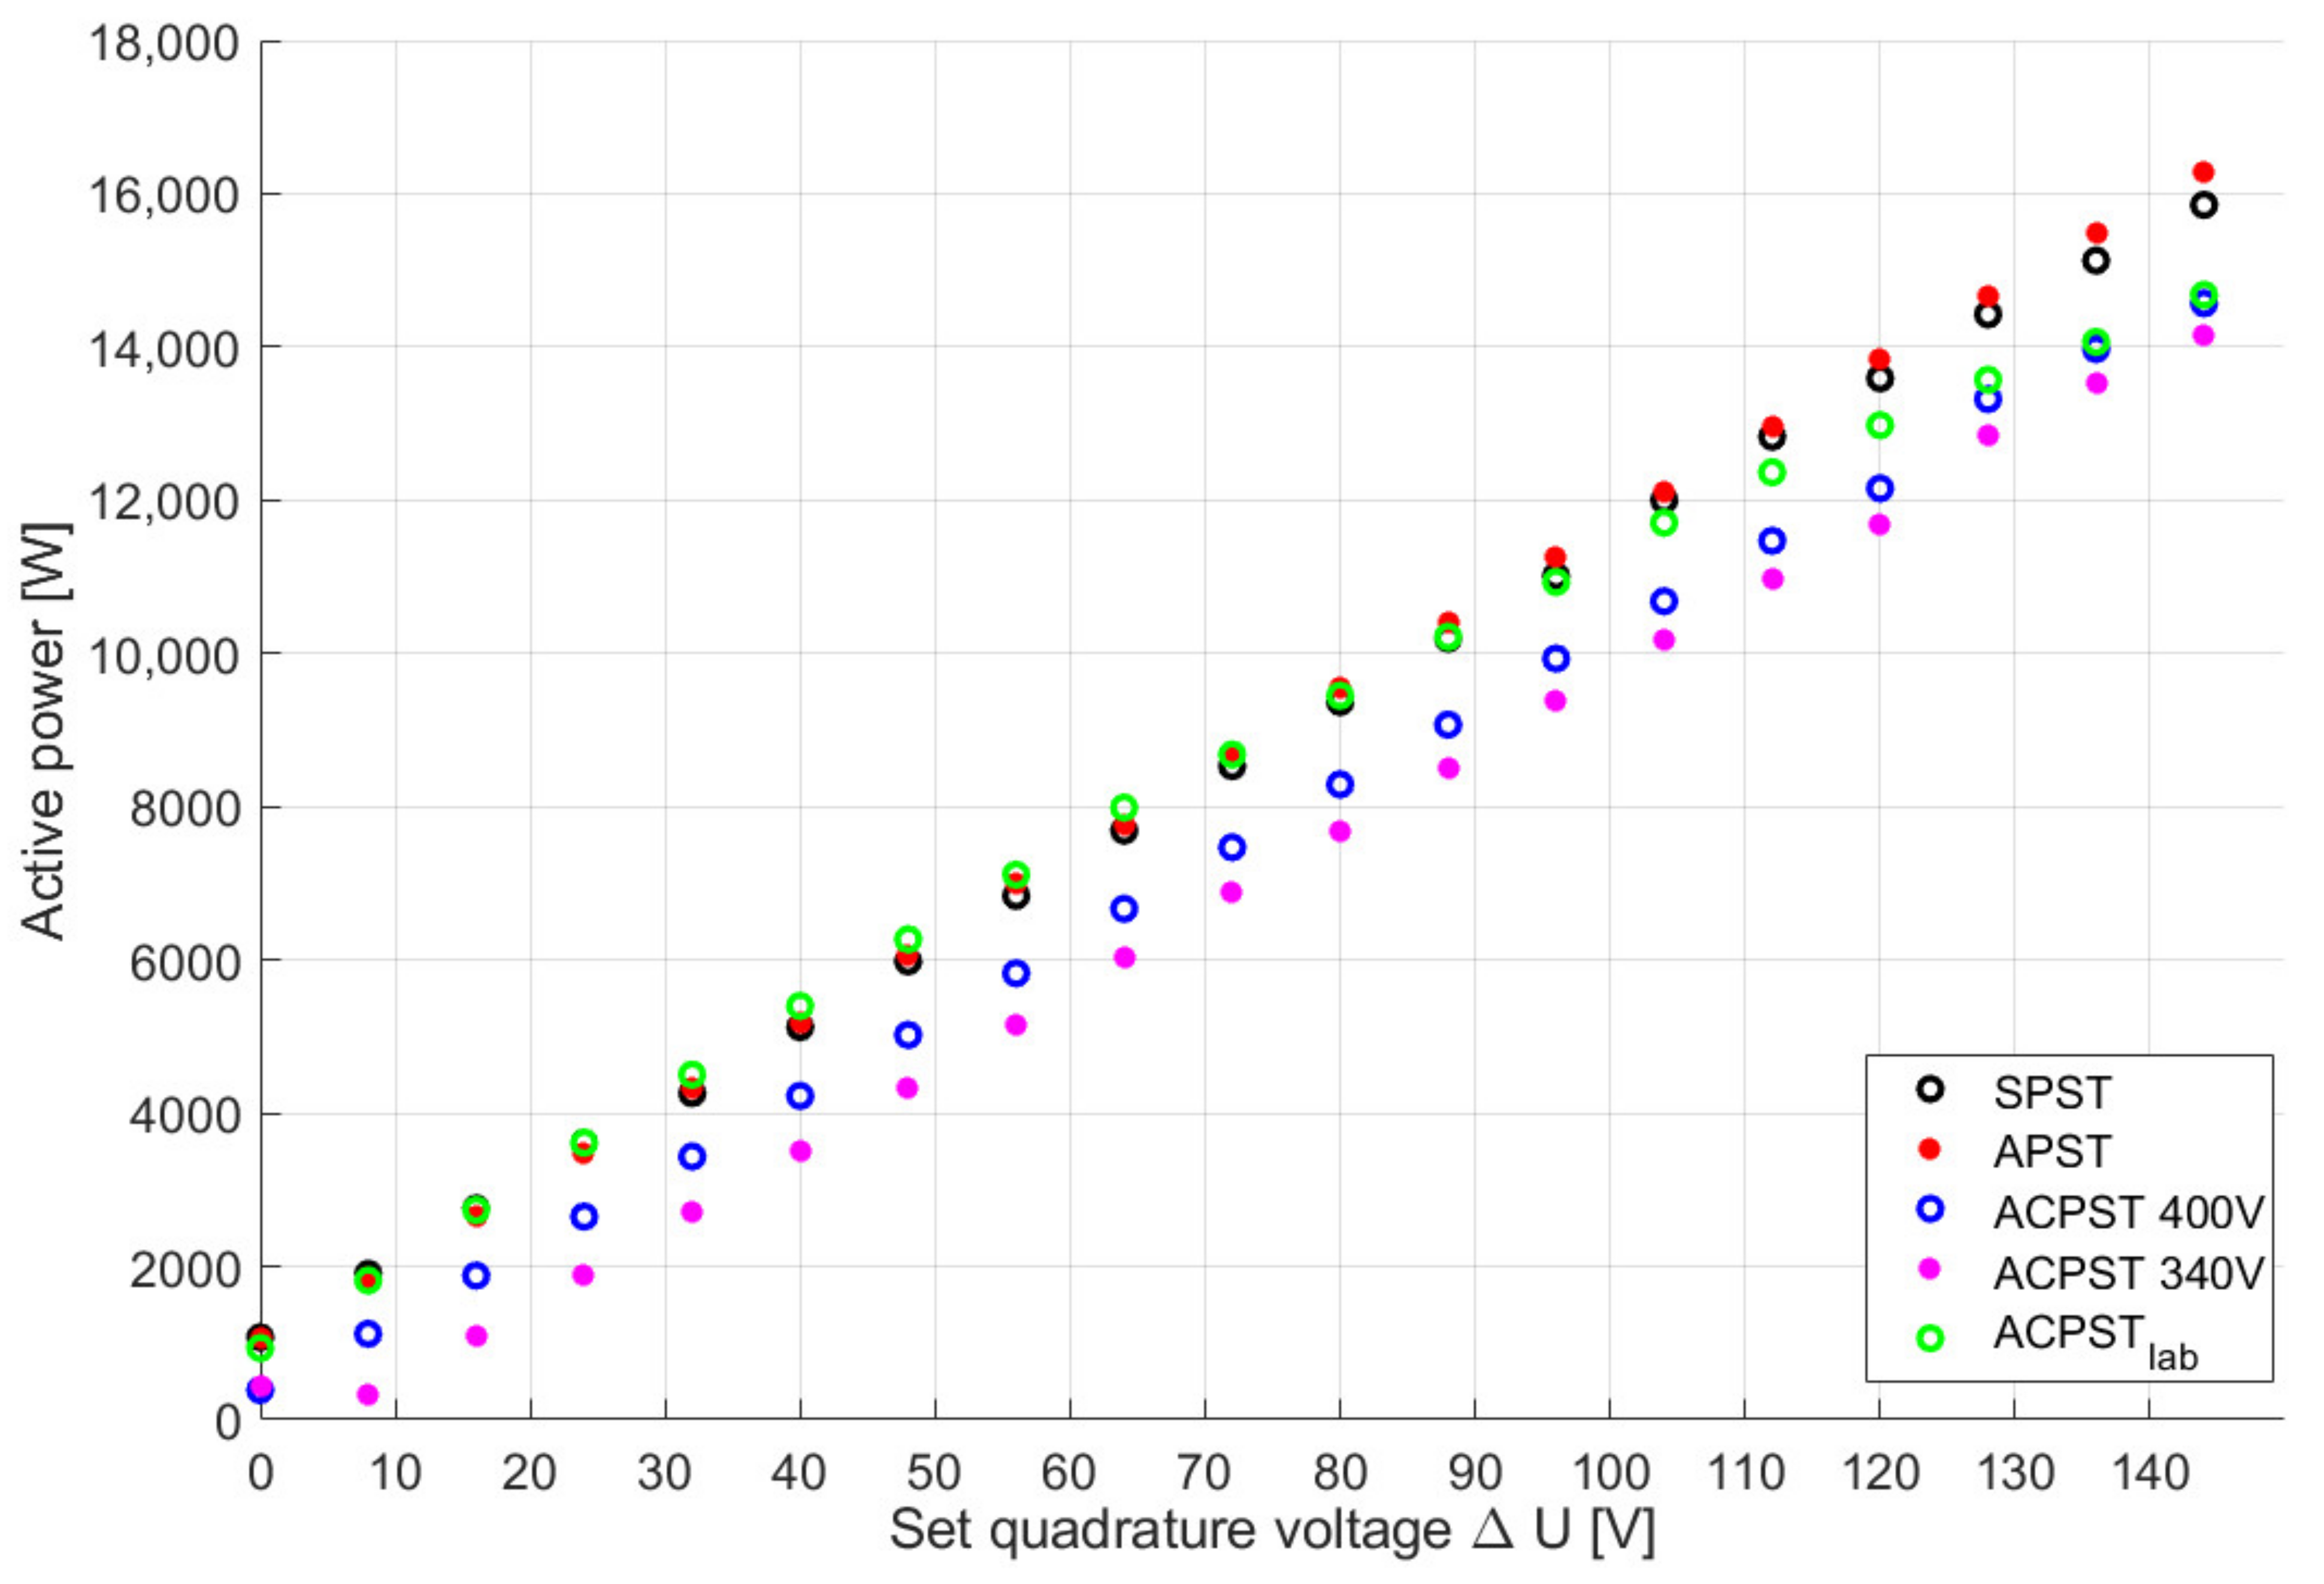
The ACPST type could represent a kind of solution for such a situation, which would allow for the adjusting of longitudinal voltage to quadrature voltage. In the nominal longitudinal voltage (400 V phase to phase—230 V phase to the ground), injecting 10 V more caused the same active power flow—this is shown in
Figure 15. When the longitudinal voltage was lowered to 340 V (phase to phase value), a 16 V higher series voltage was needed to obtain the same power flows. In both ACPST simulation cases, output voltages were much lower for the same active power transfer values, so, despite the minor efficiency difficulties, this dependency is a significant advantage of this PST type.
5. Discussion
The analysis presented above shows both the advantages and disadvantages of each PST type. Taking only one electrical energy parameter (e.g., active power) as a variable in any control process analysis is inappropriate. Therefore, we have presented an analysis considering active power, output voltage, real quadrature voltage, efficiency, and relative power losses (RPL factor).
In case of the APST, an active power transfer maximization approach resulted in high output voltage values, exceeding acceptable voltage range in the power transmission lines. Besides the high efficiency of the APST, tests show that this PST type cannot be used in power system areas where voltage fluctuations occur, especially if the voltage is higher than the nominal one. In these cases, the APST regulation range decreased as an effect of the voltage value line limit.
The SPST was able to achieve a stable output voltage profile as well as high efficiency. However, considering its relatively small active power transfer (in relation to the rated SPST power), it achieved the highest RPL values among all tested PSTs. A main advantage of this PST type is its maintenance of almost constant output value versus the input value.
The ACPST unit was distinguished by the smallest efficiency values, which is an obviously negative feature. However, comparing RPL figures, it is clear that this PST type obtained values for low powers similar to the APST. The analysis of the ACPST operation shows its influence on the output voltage. It can be efficiently installed in power system nodes with variable voltage profiles and also when the voltage is higher than the nominal one. This fact is the main ‘plus point’ of this unit. A longitudinal and quadrature voltage regulation allows for a flexible control strategy, even in the special case of symmetrical ACPST operation, to maintain constant output voltage value (in relation to the input value).
Comparing the real voltage injected into the line with the given values, the SPST achieved the smallest voltage differences. In the rest of analyzed PSTs, voltage drops are visible. The more power was transmitted, the greater the voltage difference that occurred.
The ACPST construction forces higher power losses due to its two-core set. Therefore, RPL factor was implemented. Furthermore, the ACPST unit can very quickly be changed into an APST. This can be achieved by bypassing the extra transformer responsible for the longitudinal regulation.
In summary, the SPST single-core type has the best properties with respect to active power transfer, efficiency, and output voltage. The main problem with this construction is its series winding, which is additionally divided into two parts (
Figure 4). The ACPST allows one to have greater independence in the control strategies required in different power systems and thus to work more flexibly, even if its efficiency is lower than the SPST.
The low-voltage PST representation cannot be used directly for the EHV PSTs, which is a consequence of the transformer’s rated powers and base efficiency. Thus, the efficiency analysis presented here should be considered only for the APST, SPST and ACPST low-voltage cases. The electrical properties and features are valid for each voltage level (e.g., in the APST, the output voltage is always greater than the input; in the SPST, output and input are almost the same). However, early-stage research shows that PSTs may also be installed in low-voltage or medium-voltage power systems with a high concentration of renewable energy sources.
6. Conclusions
The growth in the use of PST units in power systems is unavoidable, so they need to be analyzed not only as elements of the power-flow control system but also with respect to their own properties. The above analysis shows that each PST has some advantages and disadvantages. The SPST type demonstrated high efficiency and an output voltage within the assumed range. The APST allowed the transfer of higher power for the same quadrature voltage, but the output voltage increment was not acceptable according to the transmission system operator requirements.
Our proposed ACPST construction has a lower efficiency than SPST or APST types but allows for more flexible operation, especially in power systems where system voltage can be very variable—for example, in regions with a high penetration of renewable energy sources. The output voltage can be adjusted to the desired level, and the power transfer can be kept at the given rate. For tests, a two-transformer ACPST set was used, but we are undertaking research to prepare a single-core unit working in both longitudinal and quadrature voltage mode. A single-tank unit may reduce power losses and thus increase efficiency.
The ACPST unit can be regulated for a chosen objective function, i.e., a need in a given power system area. Maximal power transfer, constant output voltage value, power losses in the transmission line minimization—these factors are examples of different control strategies that cannot be implemented both in APST and SPST types. The PST type presented here allows the control of longitudinal and quadrature voltages and may be efficiently used to optimize algorithms to find the best solutions both in extra-high-voltage (EHV) power systems and also in lower voltage level systems with a high penetration of renewable energy sources.
From analysis presented here, one can see:
- -
the laboratory ACPST and its simulation model are convergent;
- -
SPST and APST types have the best efficiency rate;
- -
APST output voltage may achieve excessive values;
- -
ACPST provides more possibilities for regulation;
- -
due to its properties, ACPST seems to be the most flexible PST type;
- -
the presented ACPST construction needs to be improved to reduce power losses and increase its efficiency.


