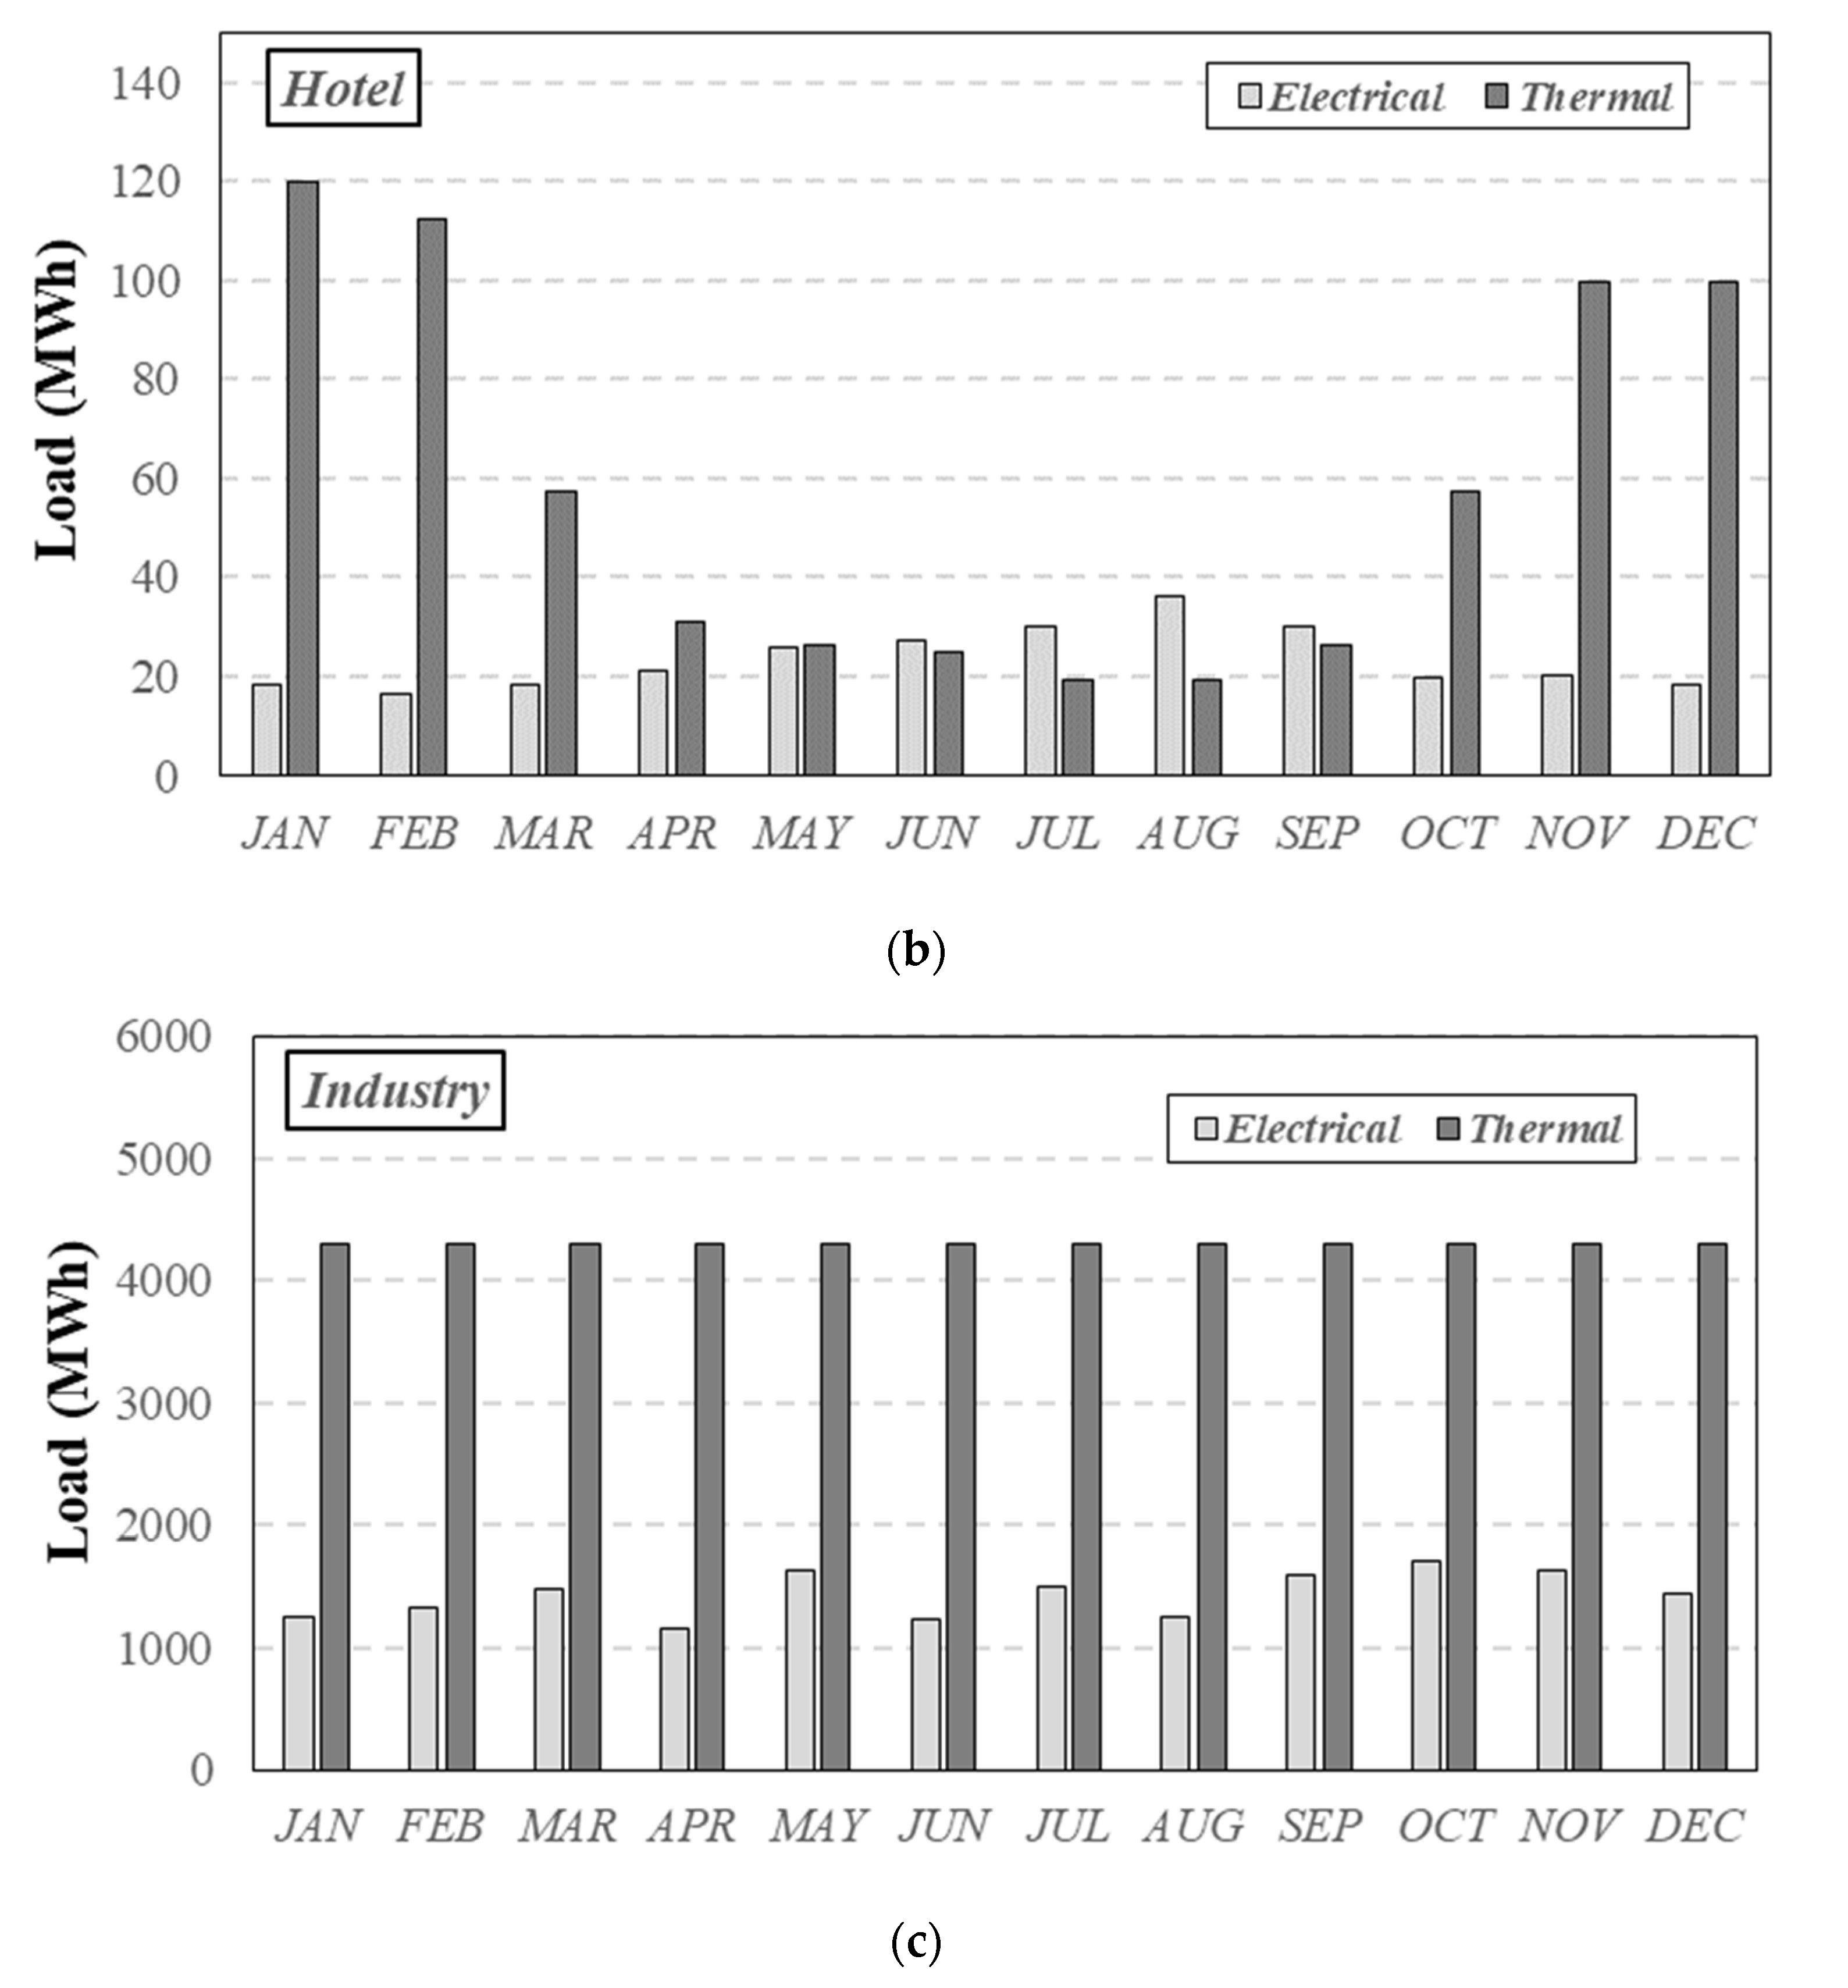
The main aim of this paper is to analyze the feasibility of CPV systems applied to users of increasing size. Hence, first, the electrical and thermal loads of three different users are defined. A house is chosen as a small-size user. A middle-size user, instead, can be well represented by a hotel. Finally, an industry can be representative of a large-size user.
4.2. Results
In this section, the main results of the feasibility studies concerning the three above defined users are discussed. For an accurate evaluation of the CPV system energy performances during the year, the effective annual hourly distributions of DNI and T
env in Salerno is considered [
25].
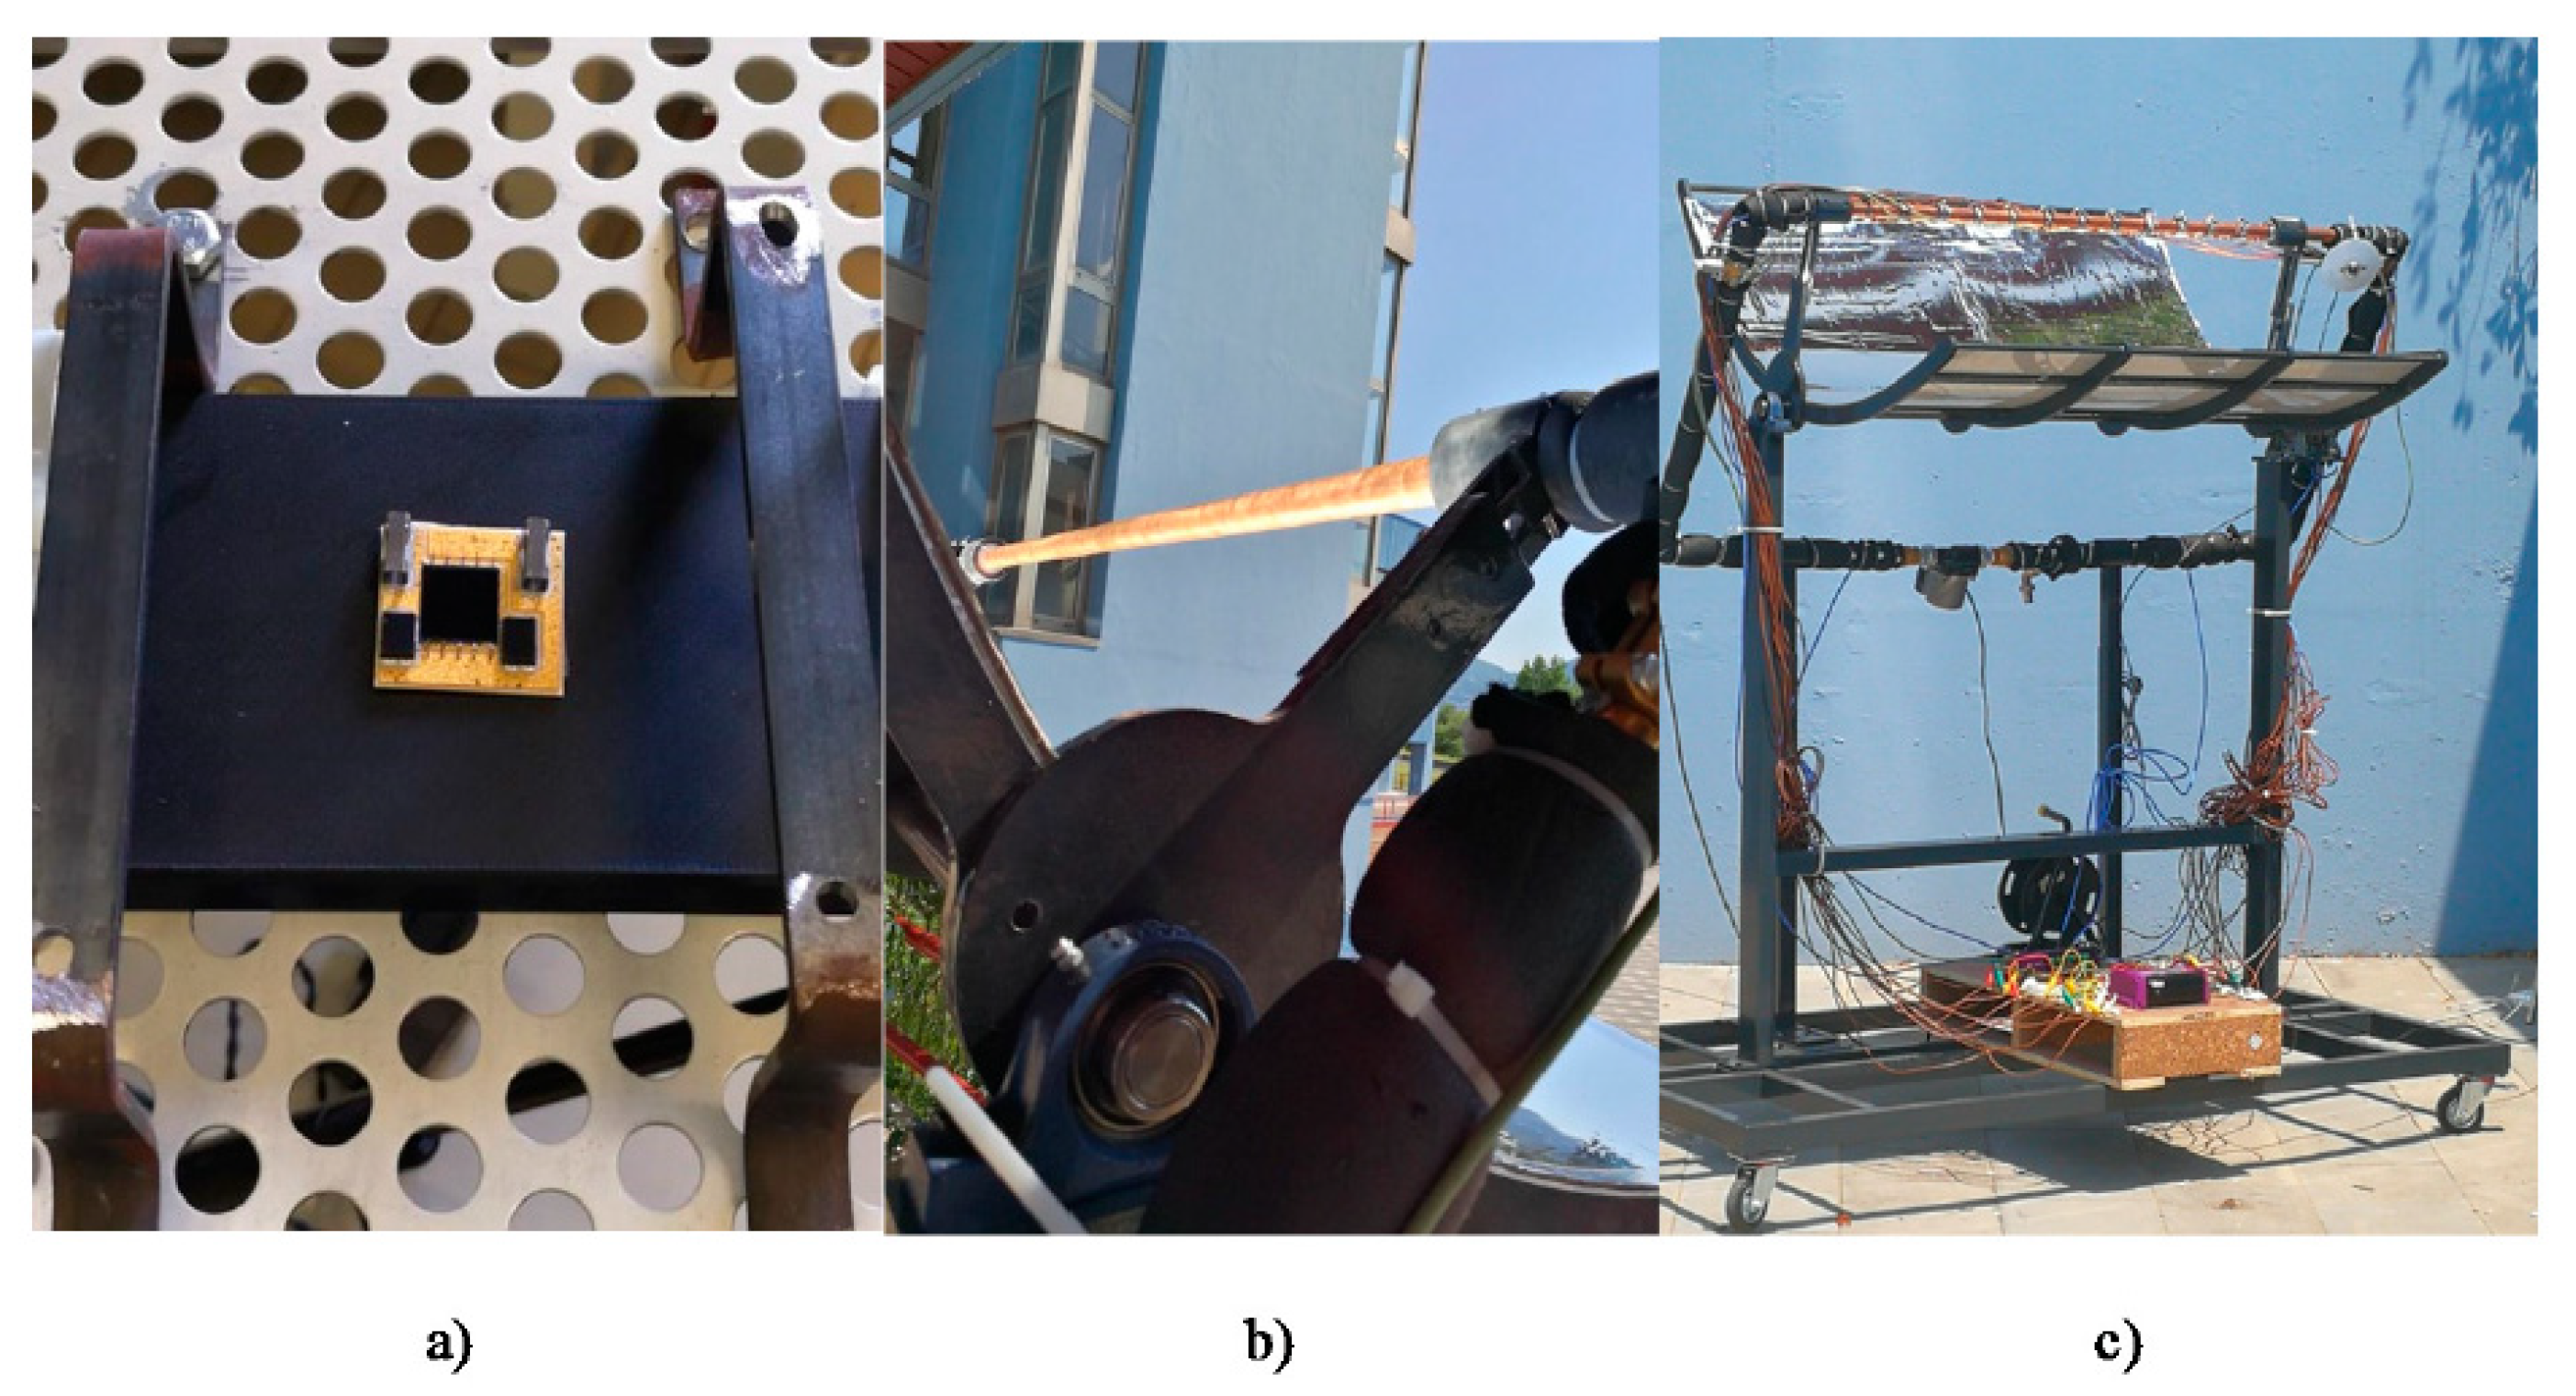
For the CPV/T system, the abovementioned experimental plants, with optical concentration factors equal to 90 and 60 TJ cells, were considered as a single module. The coefficients in Equations (2) and (3) for the calculation of
and
are reported in
Table 3 together with the values of R
2.
Because the annual hourly values of T
env and DNI are available, it is possible to calculate, by means of Equations (6) and (7), the electric (
) and thermal (
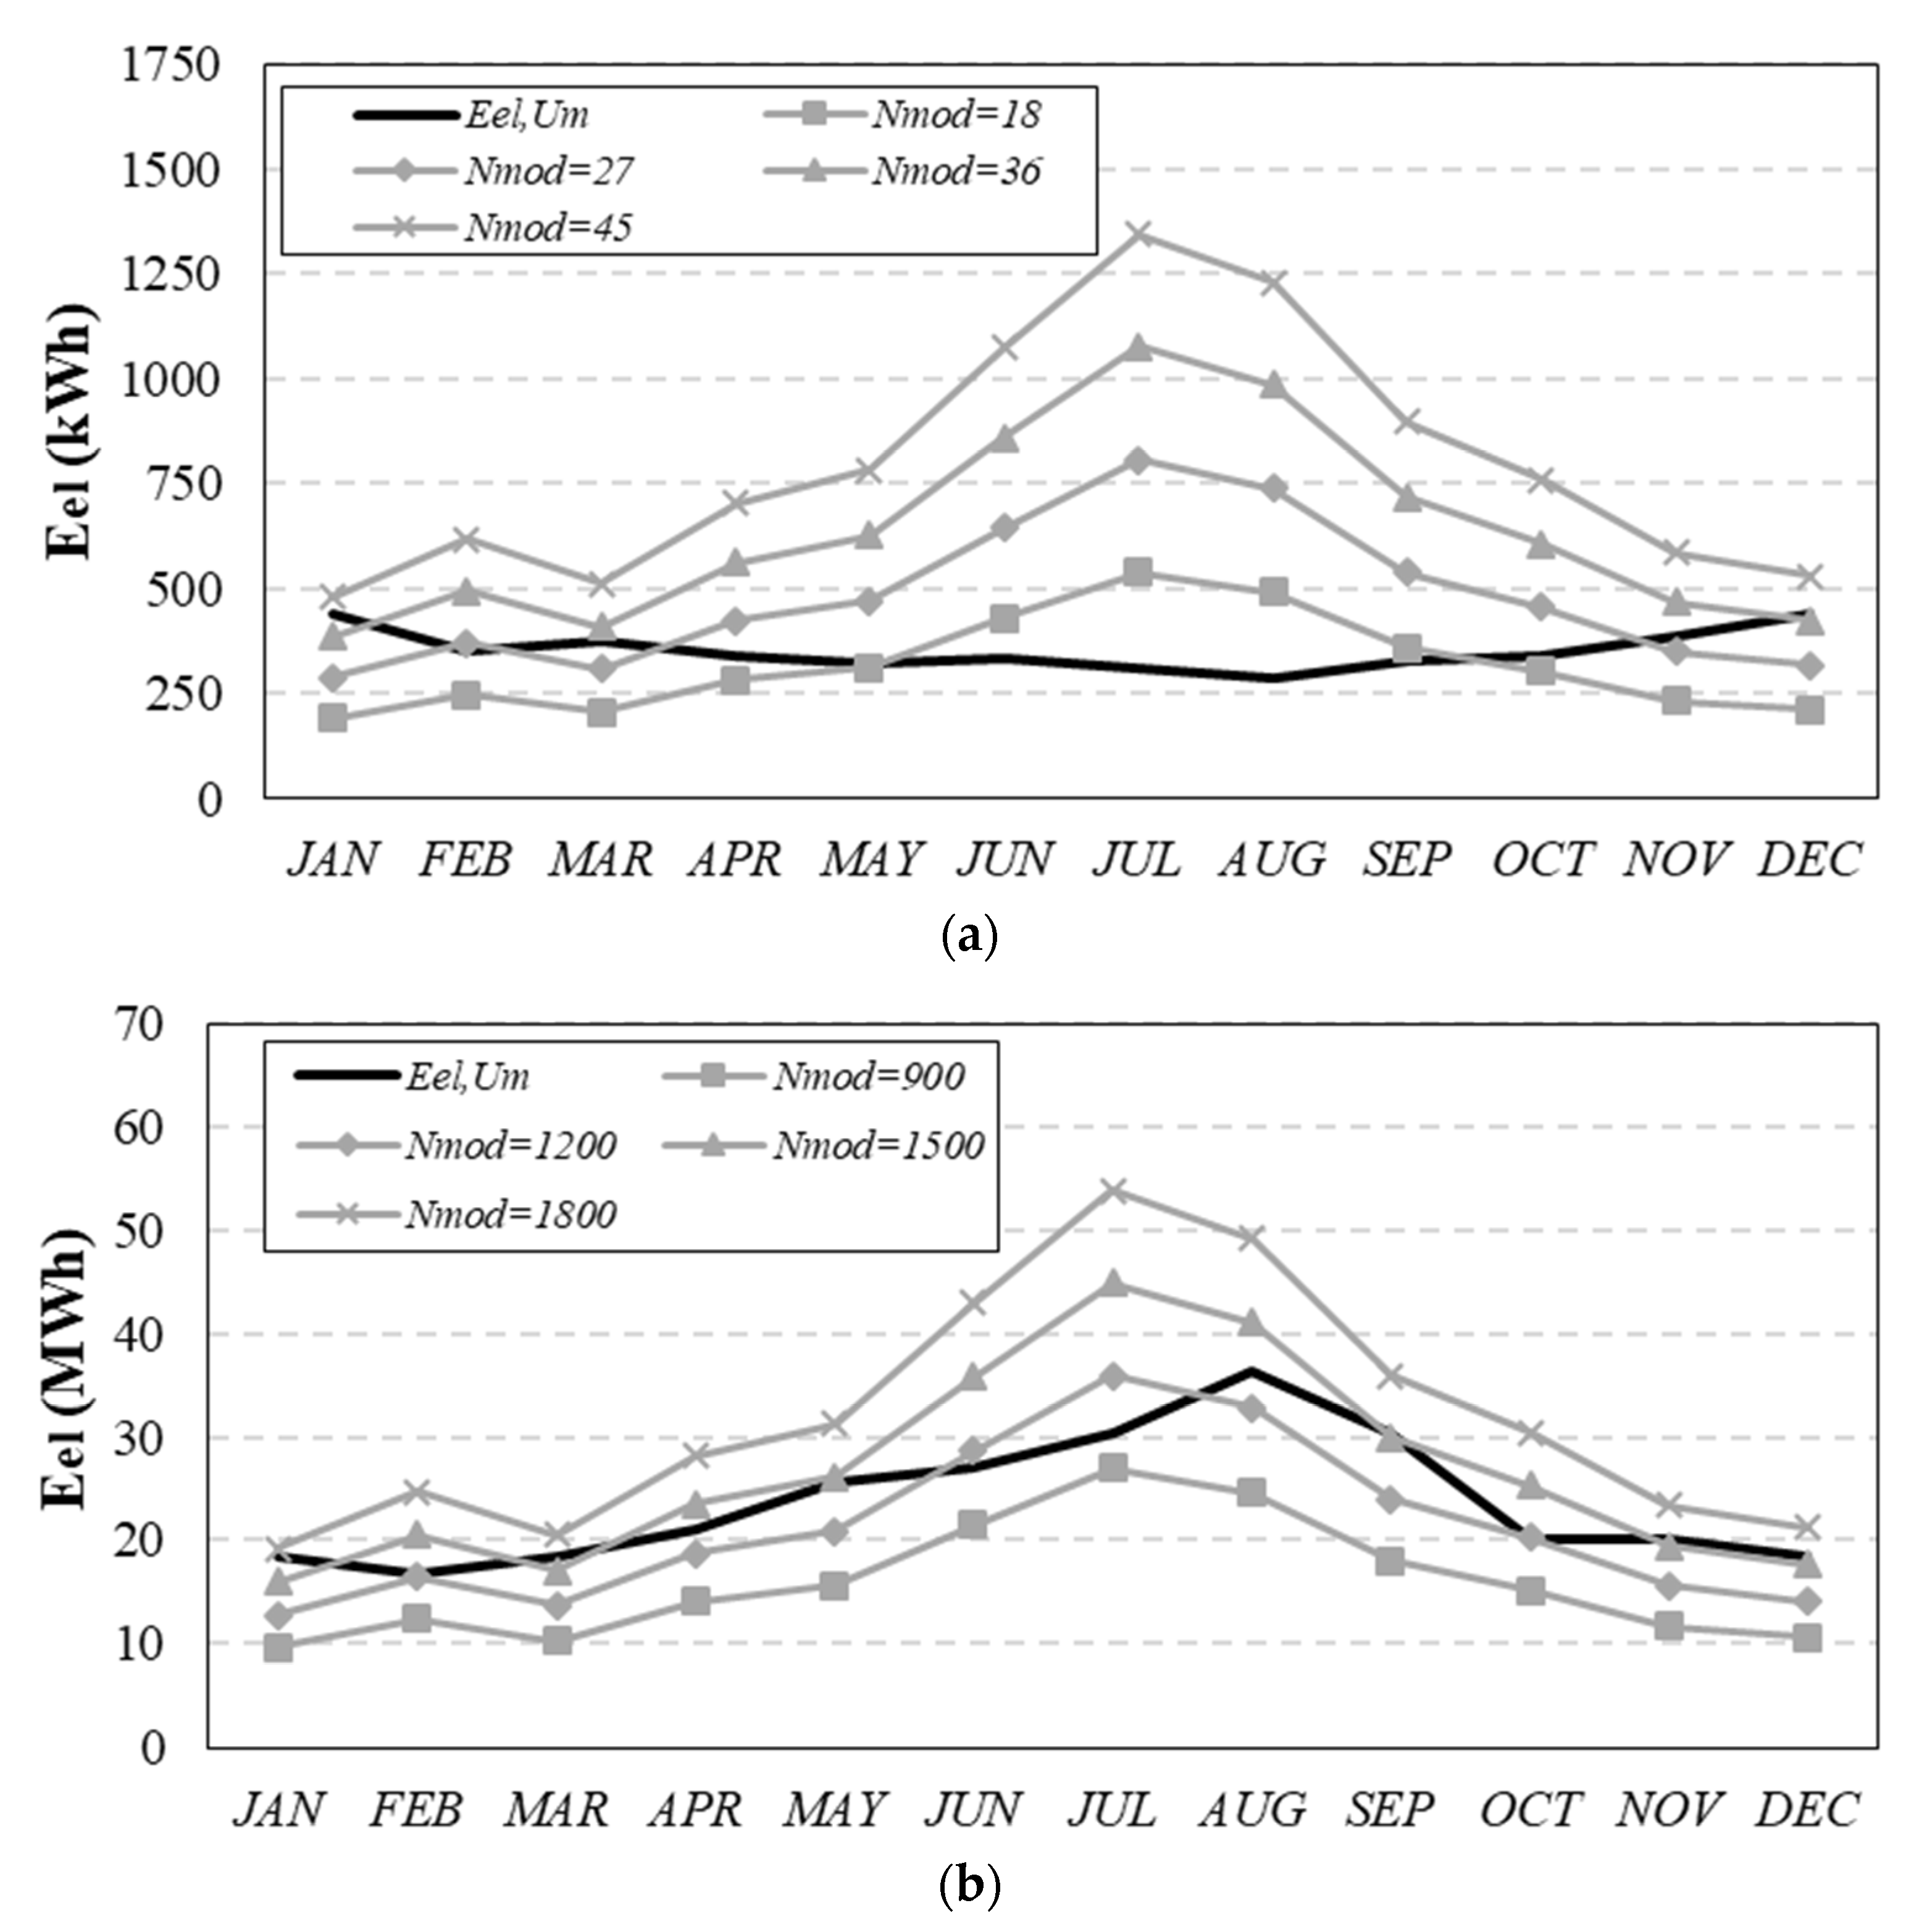
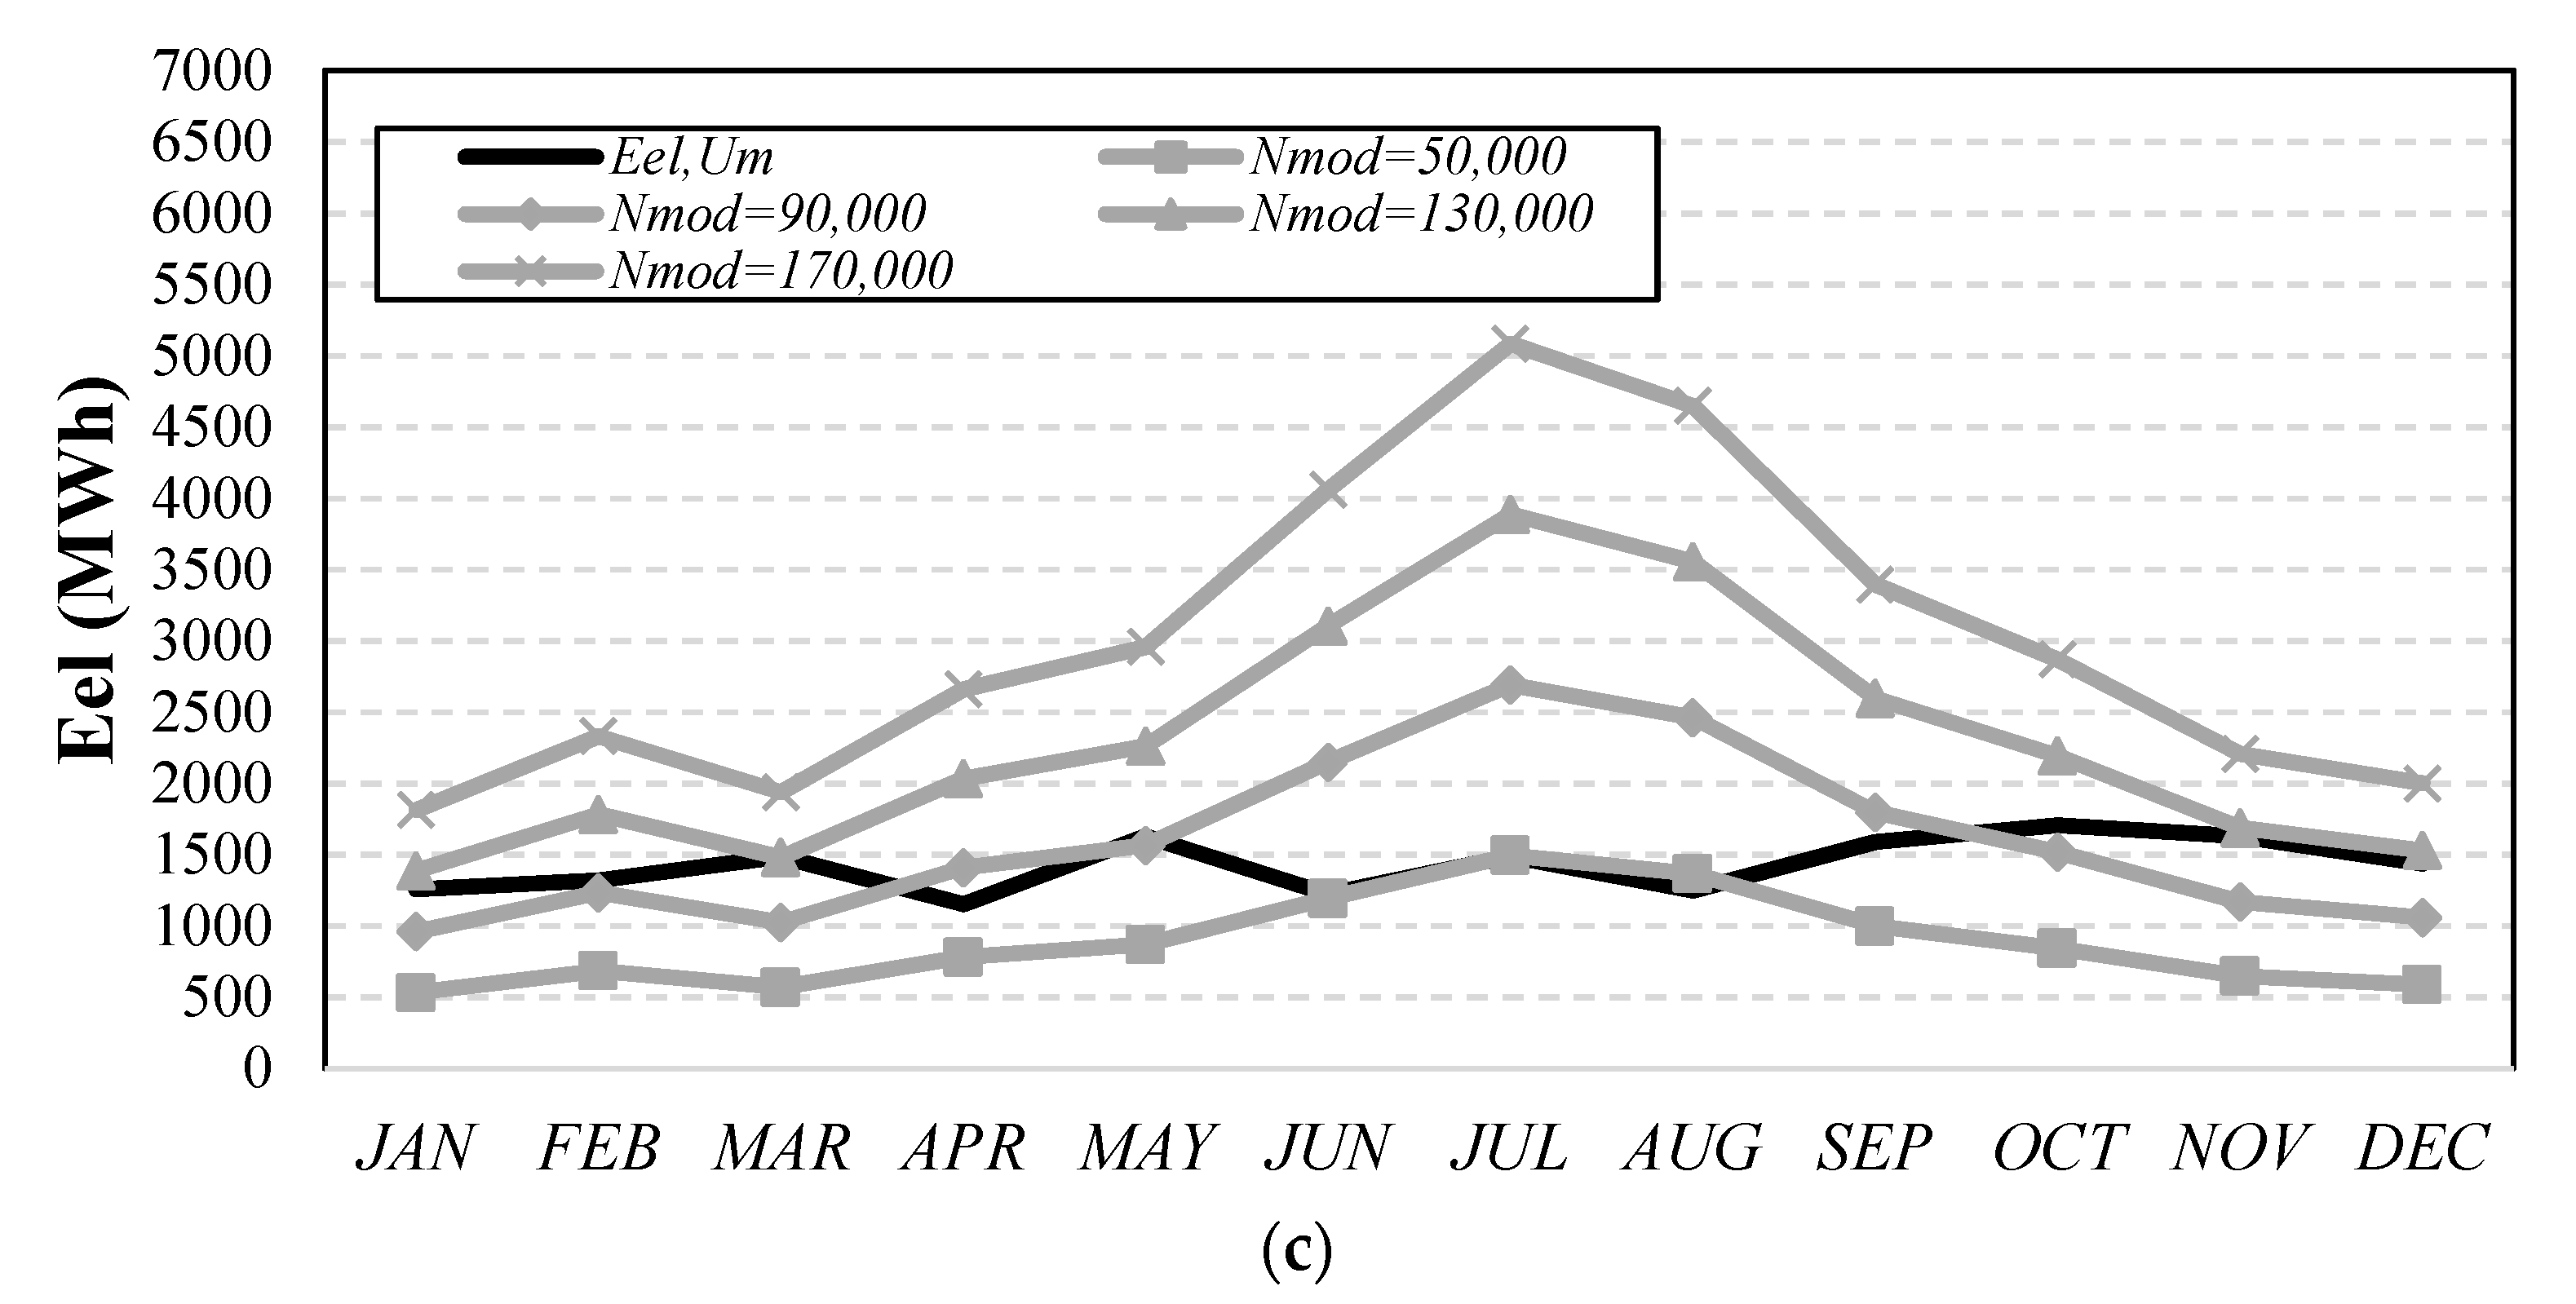
) powers supplied by the CPV systems by varying its number of modules. Generally, it could be interesting to analyze the difference between CPV/T system outputs and energy loads of each user on a monthly basis when its number of modules varies. In
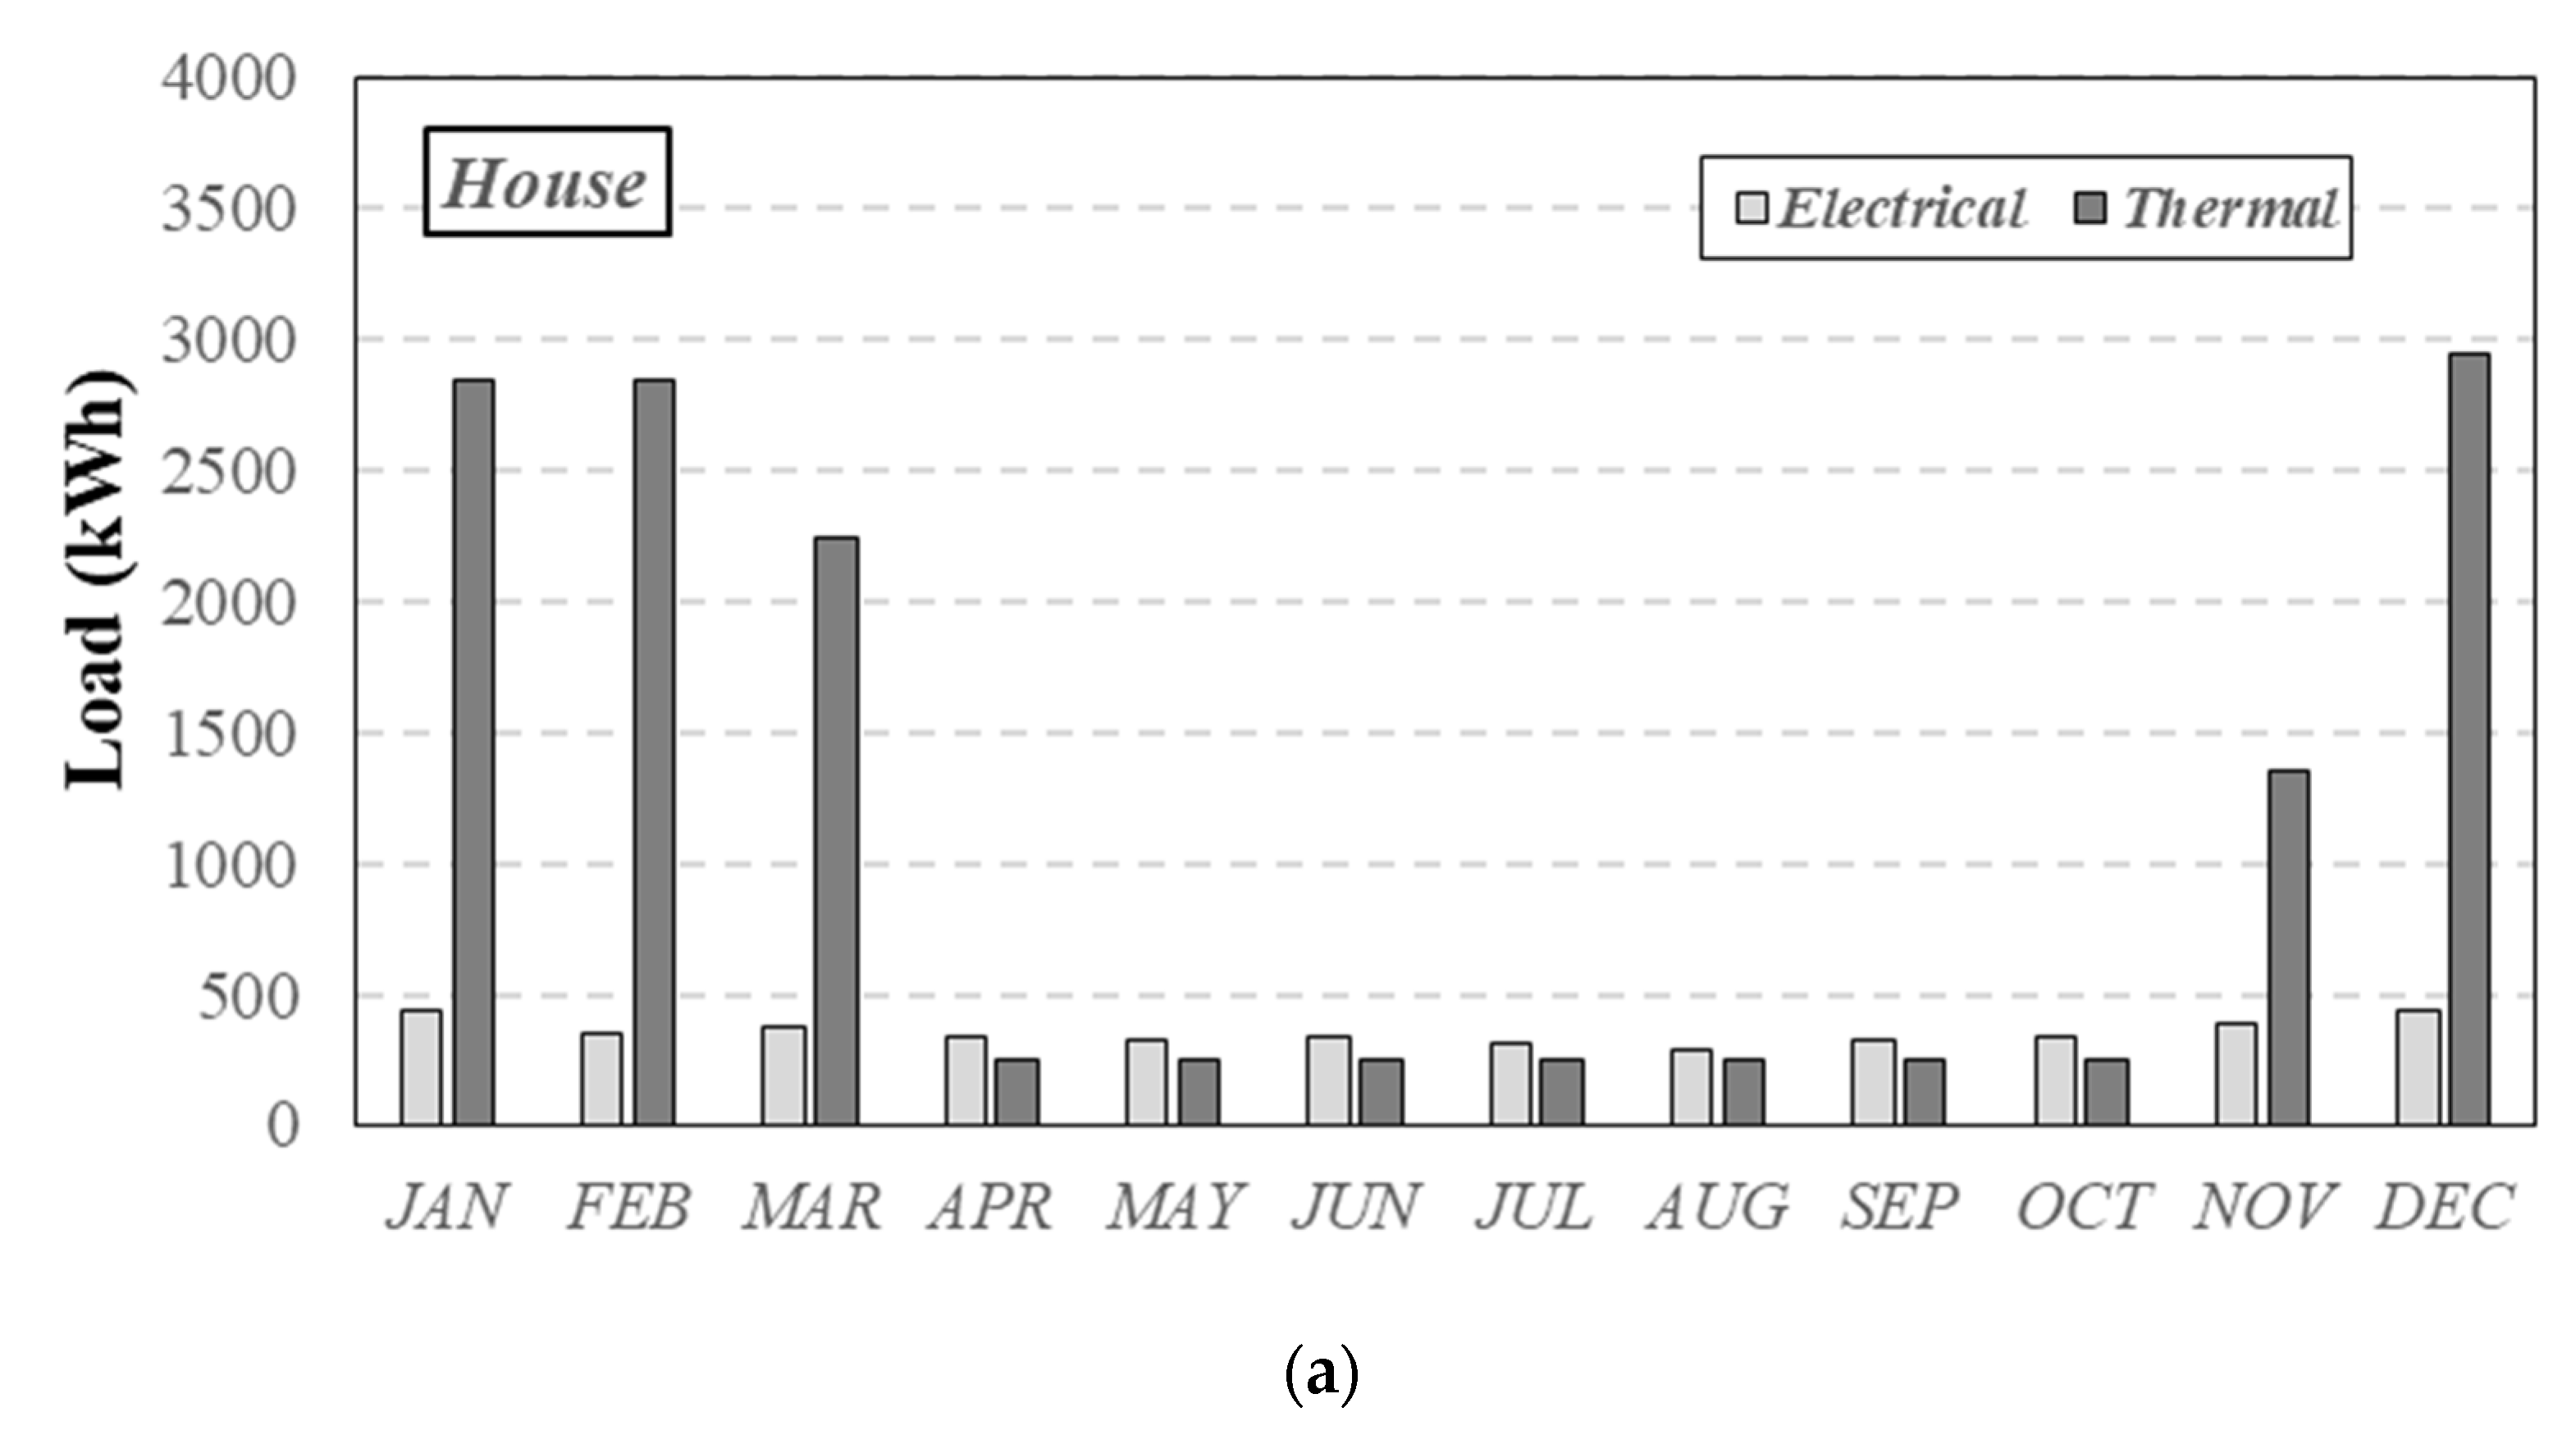
Figure 4, the number of modules of the CPV/T system is varied to match the electrical loads of each user.
As shown, the domestic user presents a monthly electrical load which is not extremely variable during the year. Hence, in the summer period, the CPV/T system producibility always exceeds the user’s loads for the numbers of modules considered. Thirty-six modules would be sufficient to satisfy the electrical energy needs almost all over the year. On the other hand, the hotel presents a greater variability in its monthly energy needs, since they depend on the turnout of the guests. The CPV/T system electrical producibility better fits the user monthly loads, and 1500 modules allow satisfying them almost every month. The electrical loads of the industrial user, instead, are constant enough during the year. Hence, in this case, in the summer period, there is an overproduction of electrical energy. Very high energy needs require 130,000 modules to be satisfied.
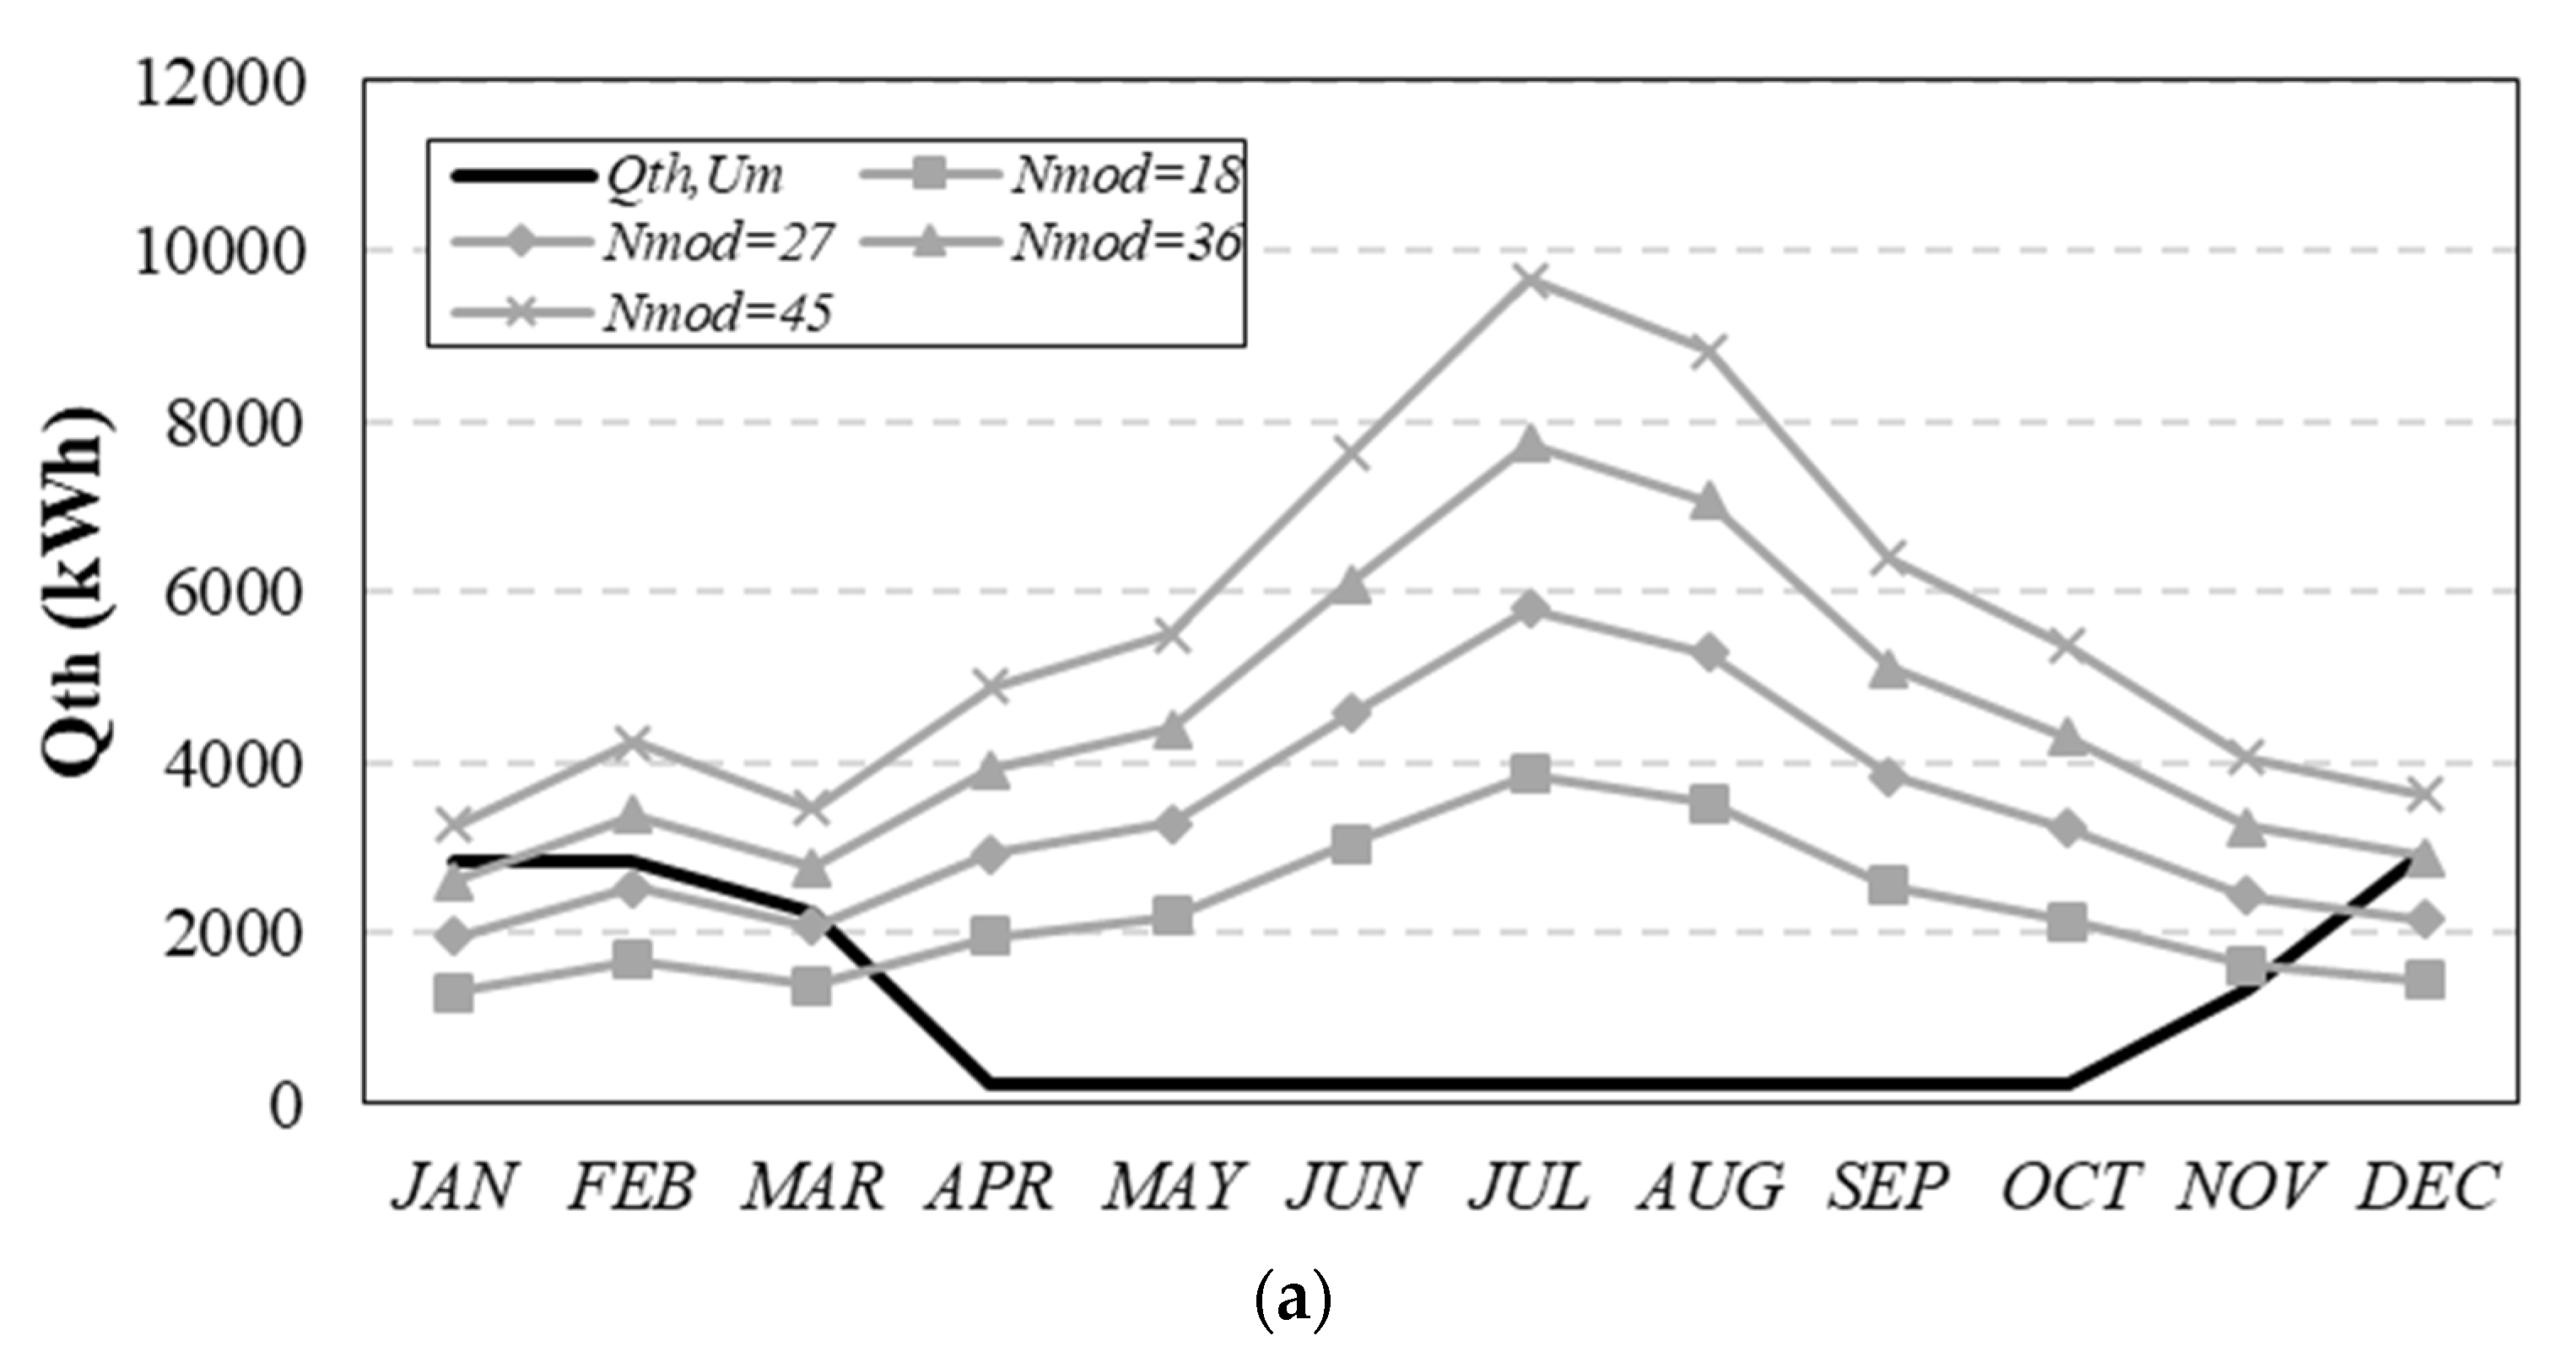
In
Figure 5, the same analysis is performed from a thermal point of view. For each user, the same number of modules of the electrical analysis is considered. In correspondence of the number of modules considered, the CPV/T system thermal producibility exceeds the loads of each user almost all over the year.
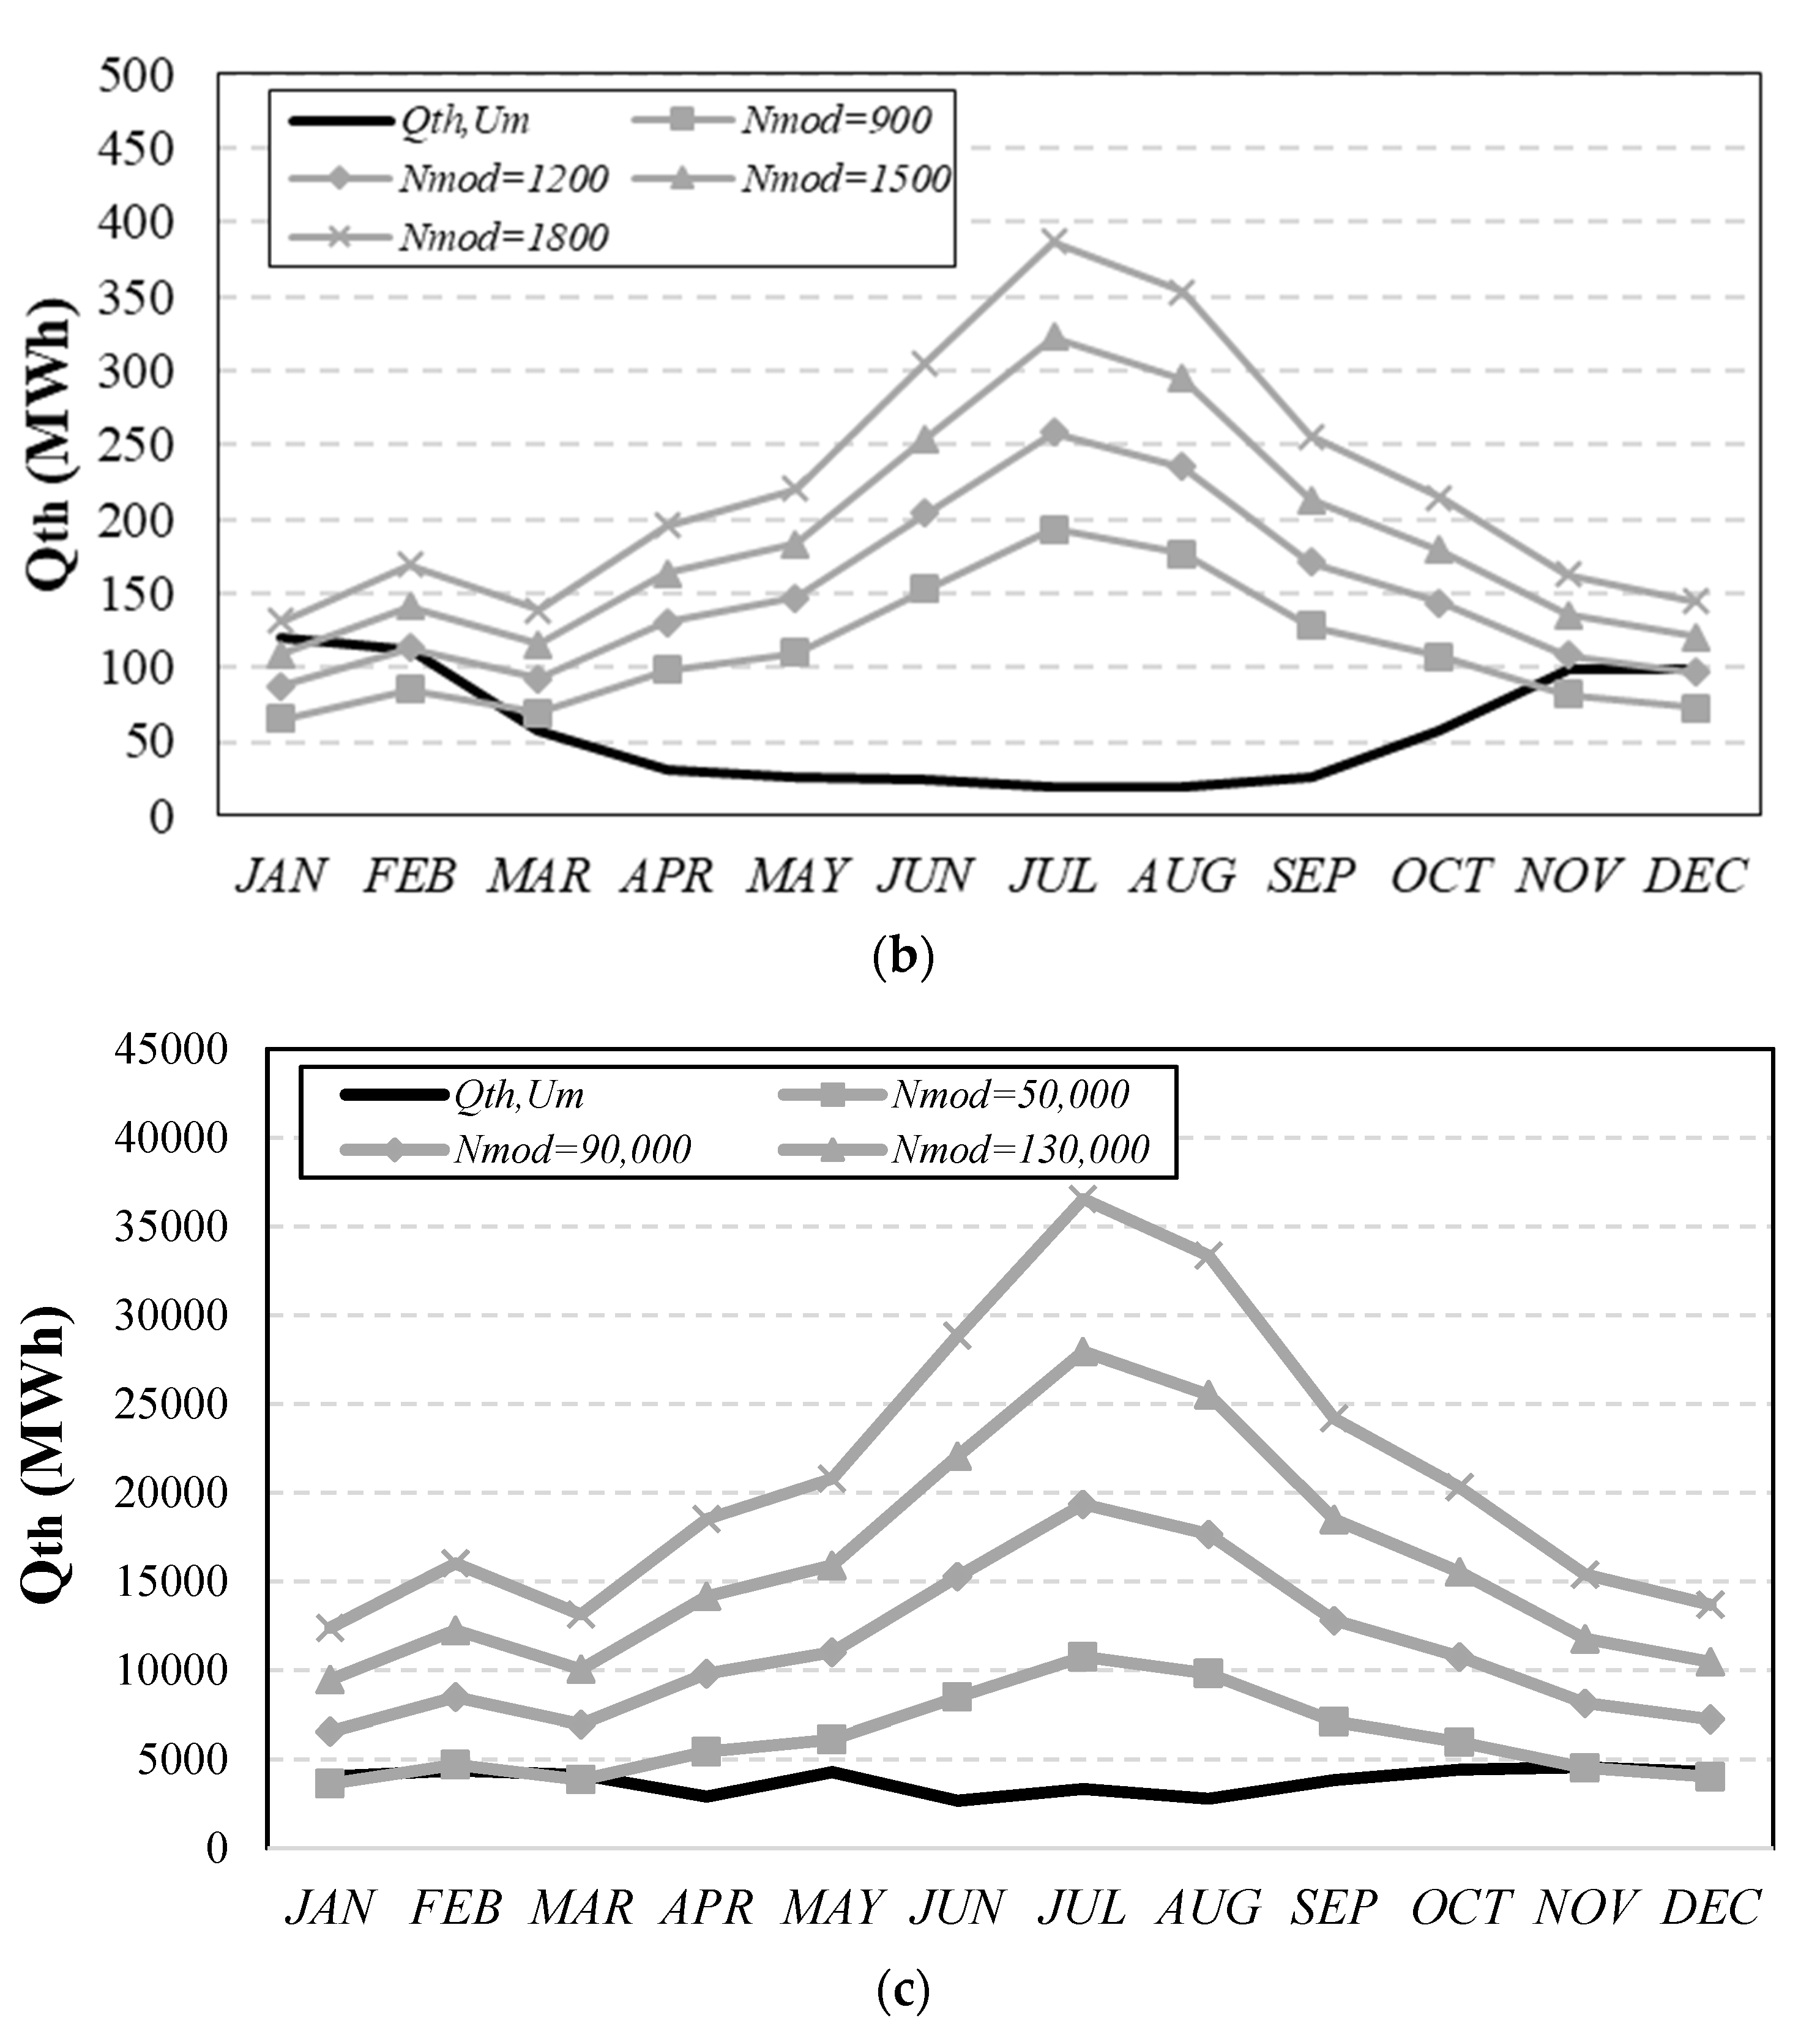
In
Figure 6, the trends of the annual electrical energy used and sold by varying the number of modules for the three users defined are shown. It is evident that by increasing the modules number, the shares of the user energy needs satisfied by means of the CPV/T increase to satisfy all the energy requirements [
27]. A further increase of the CPV/T system size leads to an increase of the only electrical energy sold to the energy network, which represents overproduction with respect to energy needs.
As stated in the previous section, the optimal number of modules for each user can be calculated with the aim of maximizing the profitability of the investment in terms of NPV, calculated by means of Equation (10). The values of all the parameters necessary for this analysis are resumed in
Table 4 [
28,
29].
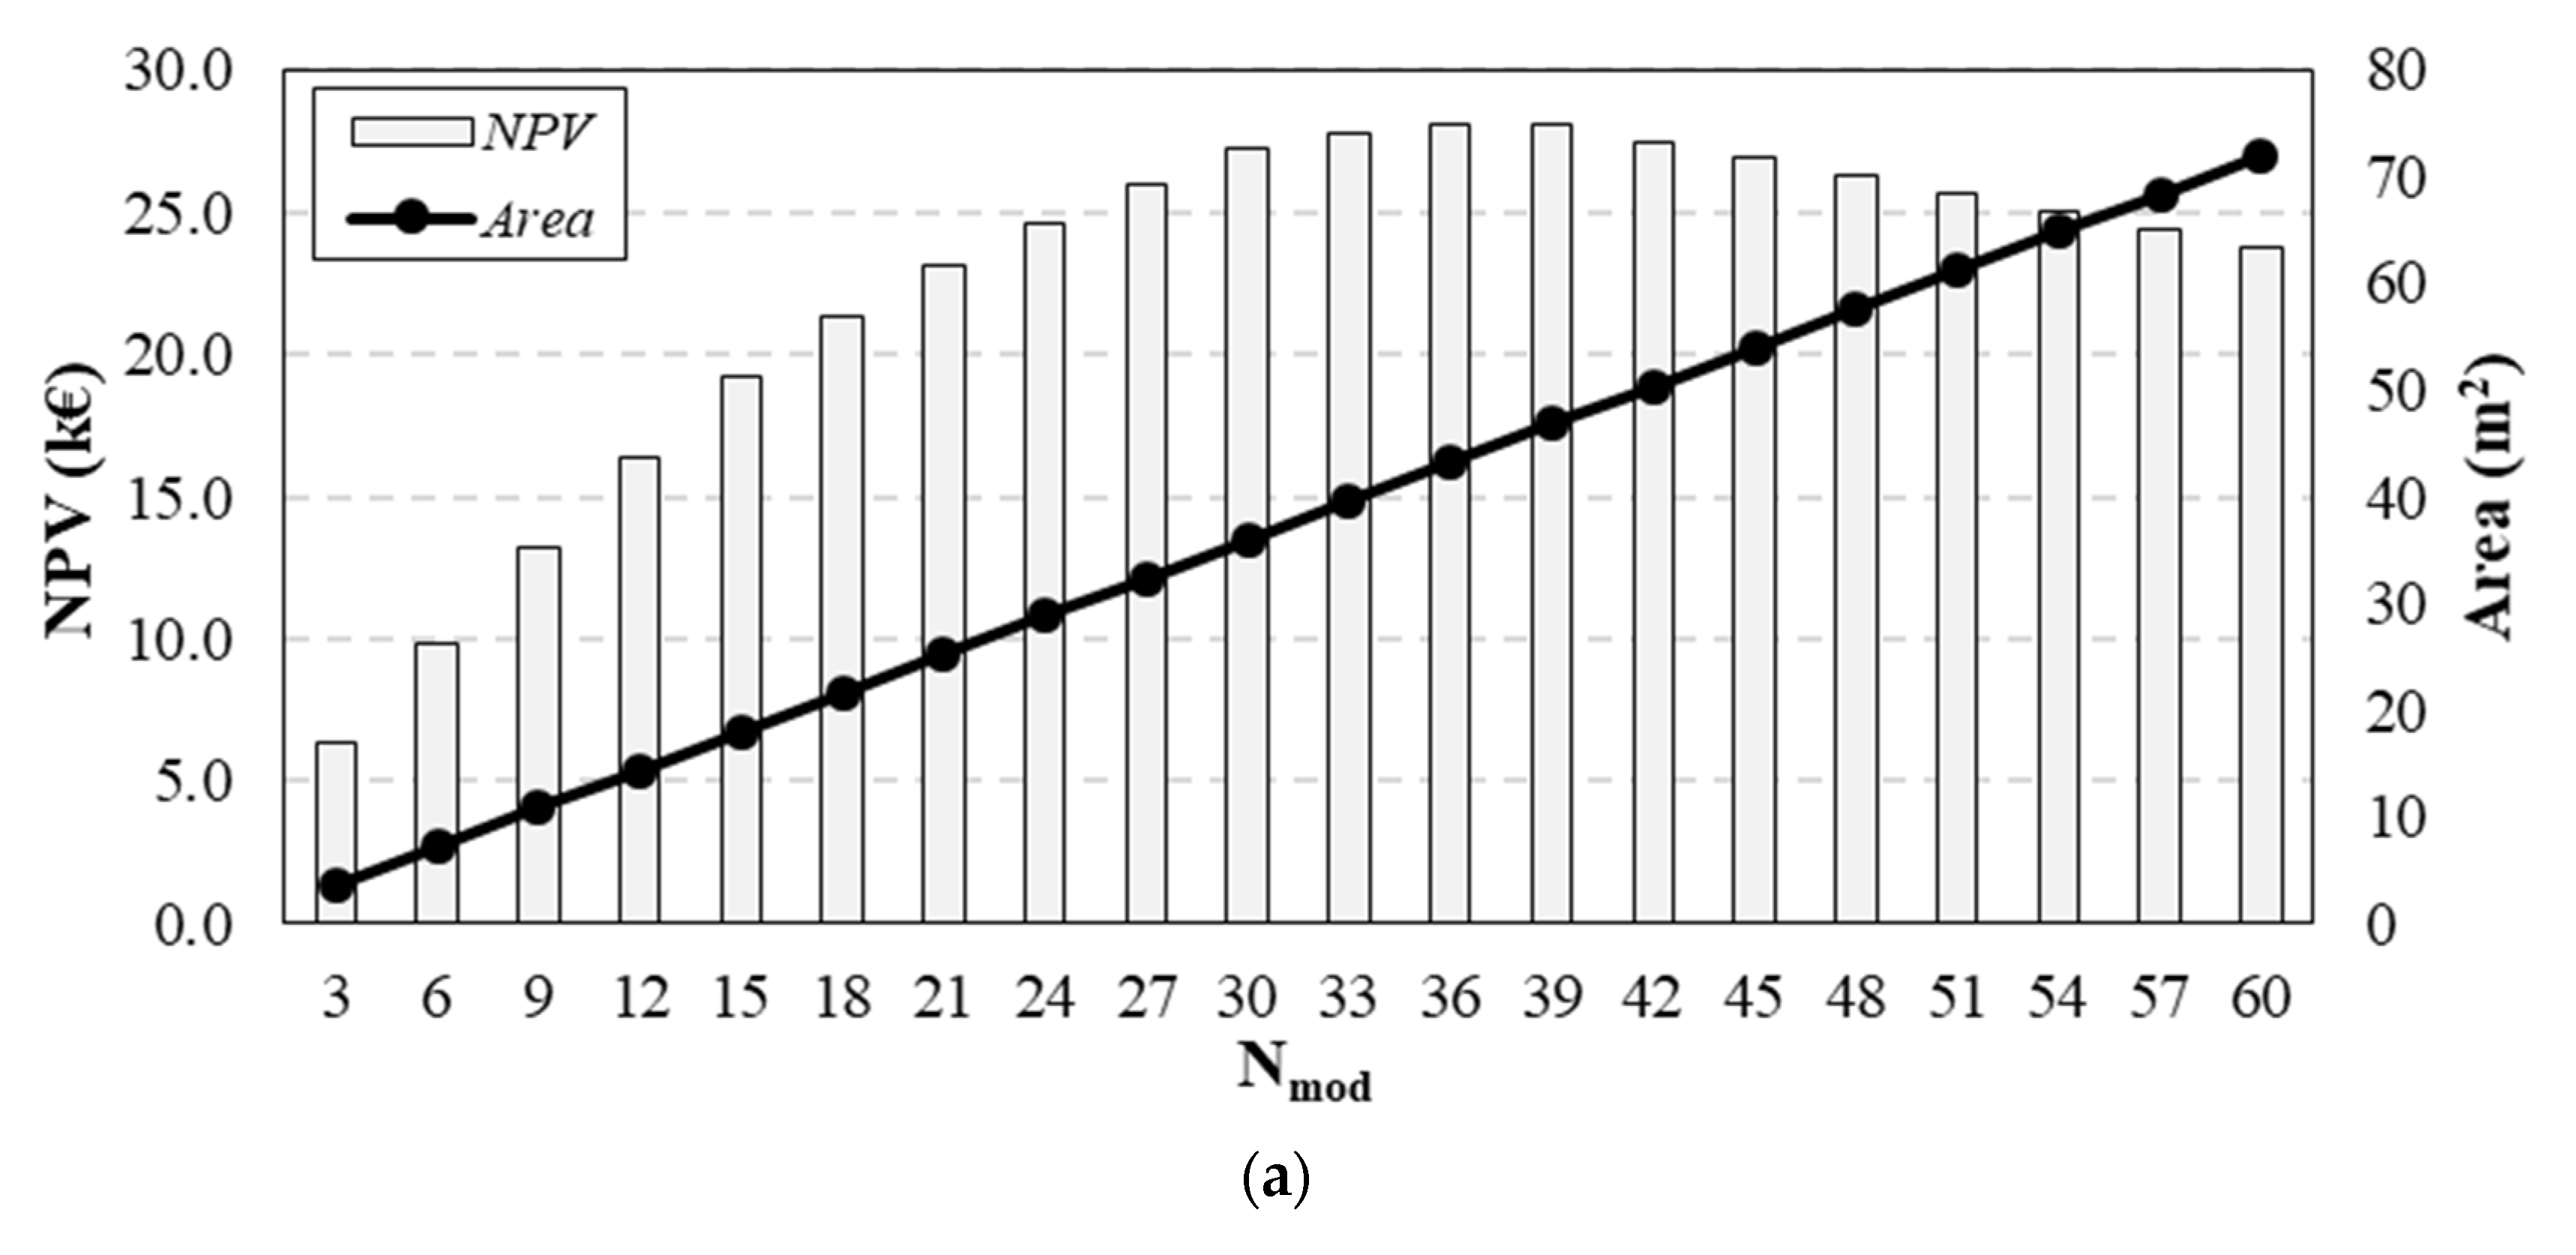
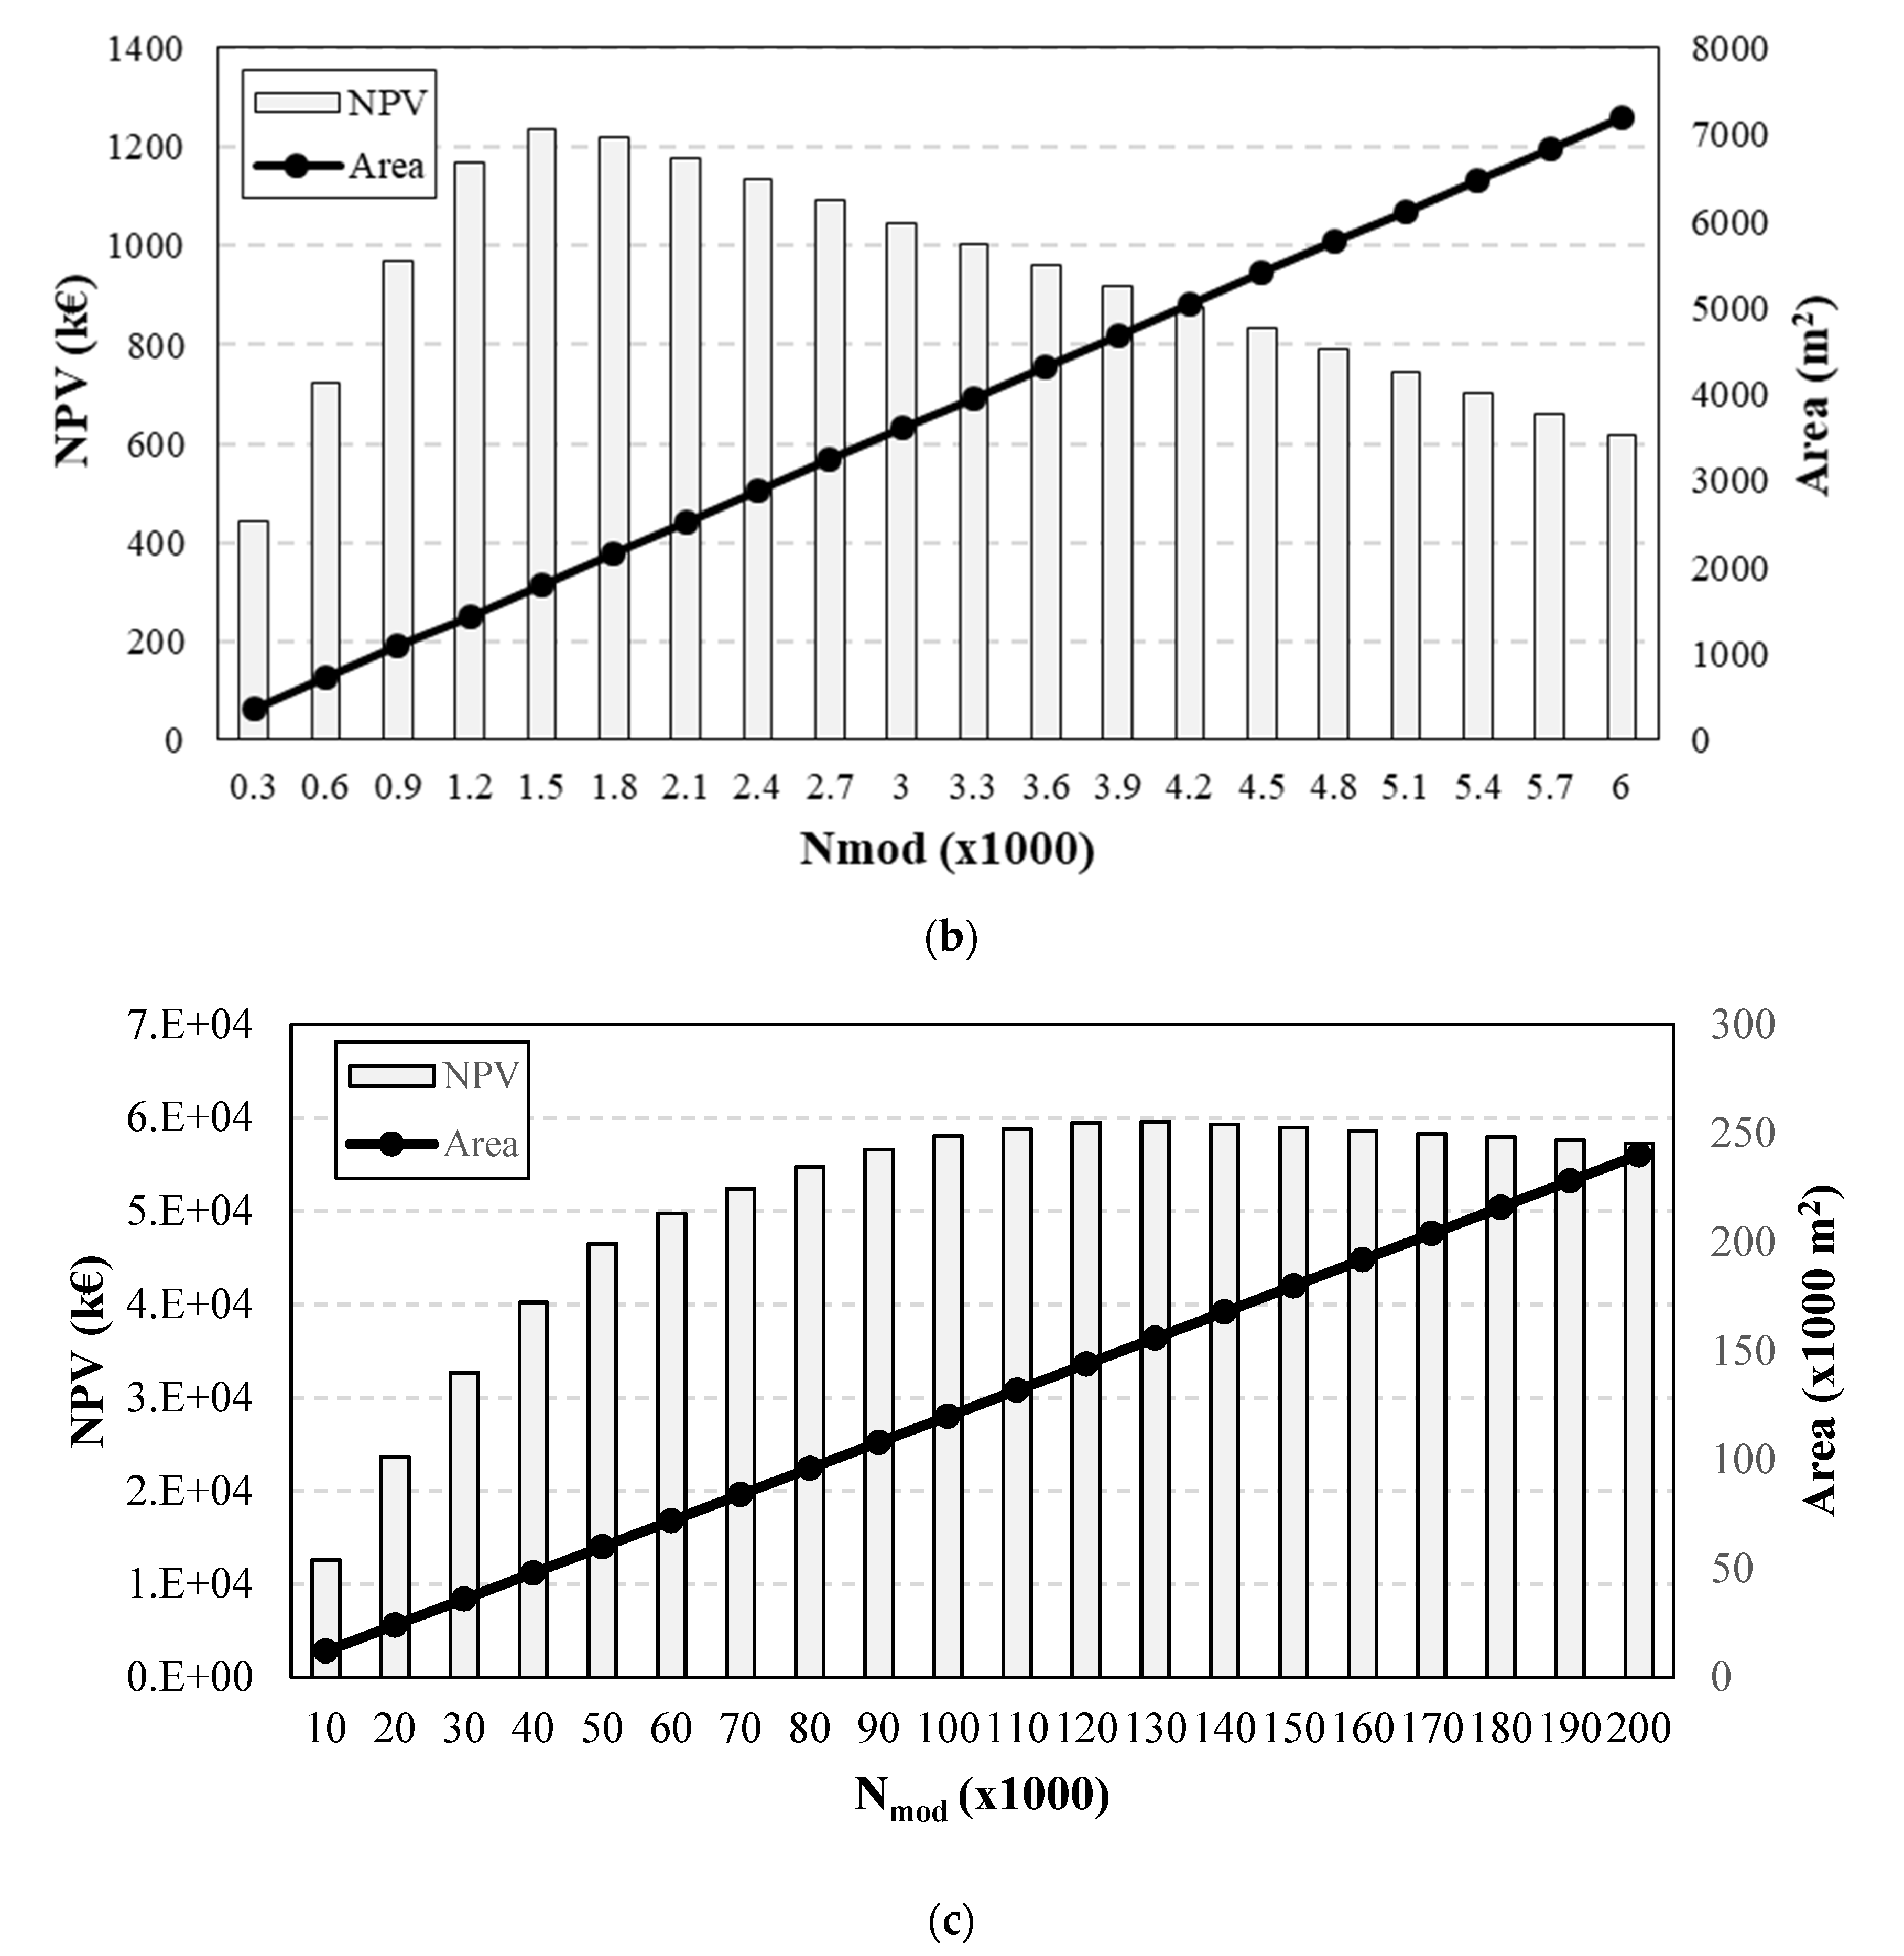
The calculated NPVs at the 20th year, average useful life for a CPV system, as a function of the number of modules are shown in
Figure 7, together with the area required. It can be noted that, for each user, the NPV increases with the number of modules until it reaches its maximum value. A further increase in the CPV system size leads to a surplus electrical energy which is to be sold to the energy network at a price much lower than the purchase price, thus reducing cash flows. Moreover, an oversized system leads to a surplus of thermal energy, which constitute a loss. Hence, the optimal number of modules is 36 for the domestic user, with an NPV equal to 28.1 k€ and a necessary area of 43.2 m
2; the optimal number of modules is 1500 modules for the hotel, with an NPV of 1237 k€ and an area of 1800 m
2. The optimal number of modules is 130,000 for the industry, with an NPV of about 60,000 k€ and an area of 156,000 m
2.
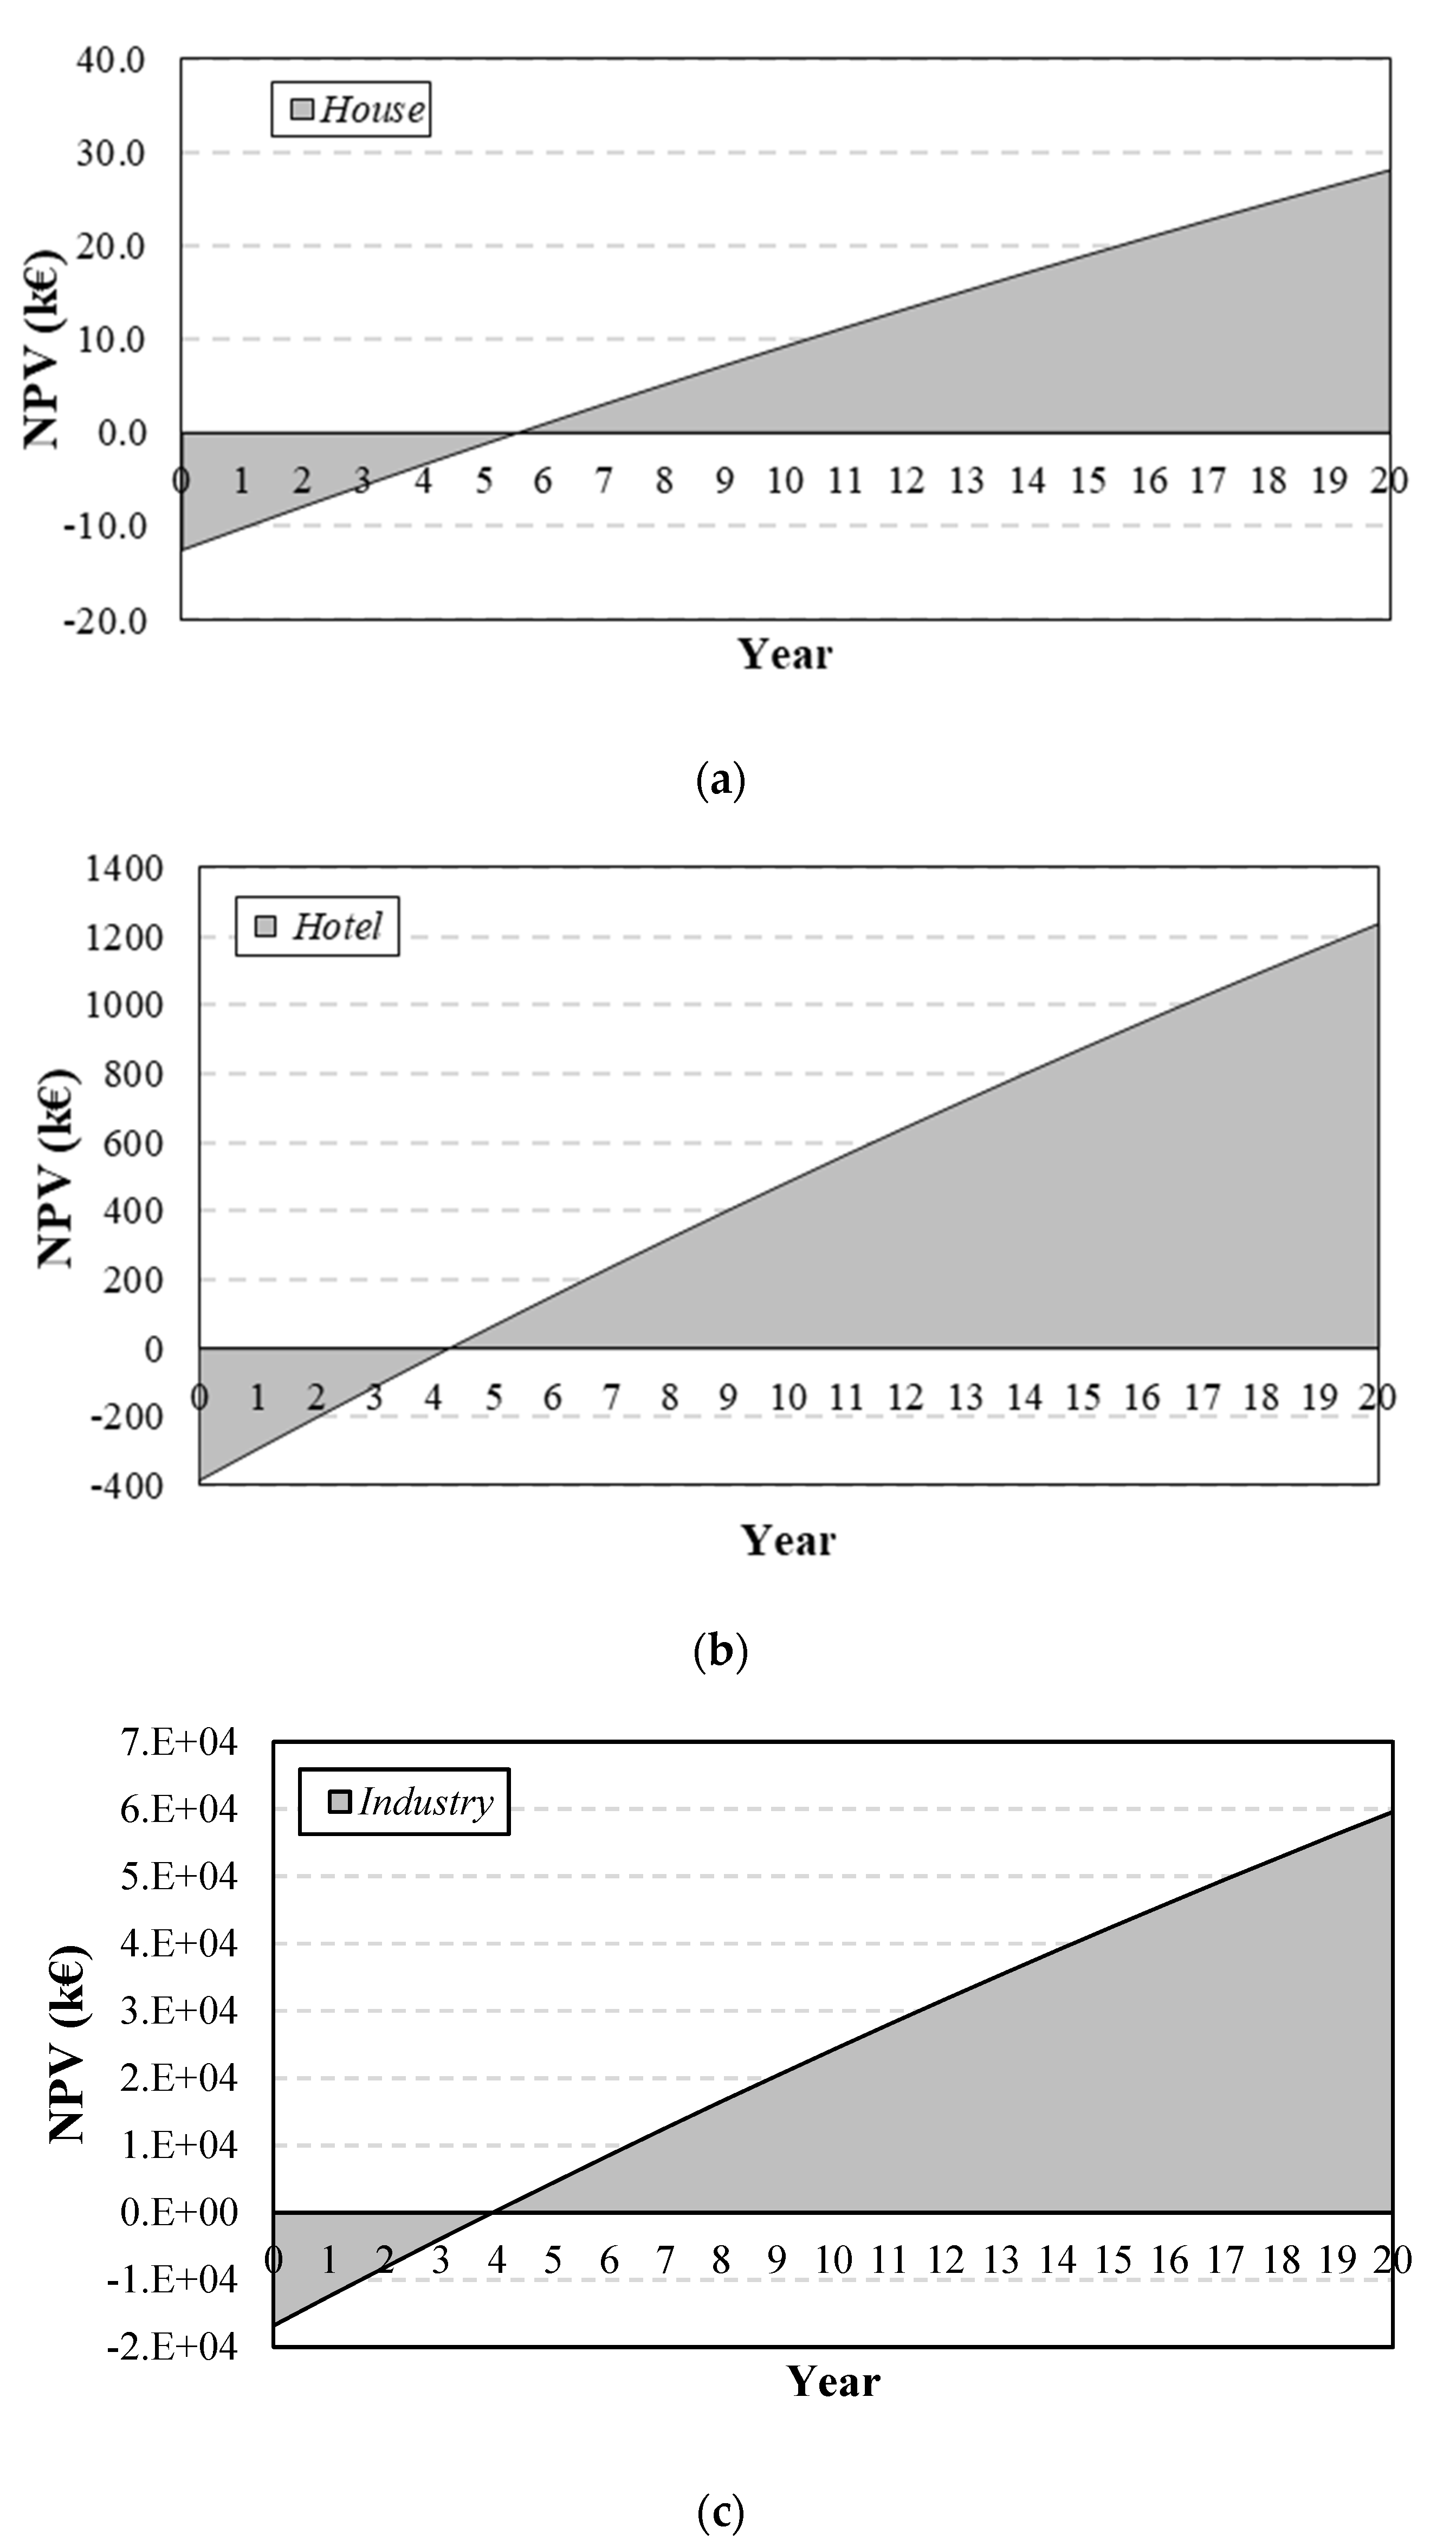
The NPV trends over the years in correspondence of the optimal number of modules for each user are shown in
Figure 8. These trends allow evaluating the DPBP of the investment, which is equal to 6 years for the domestic user and are equal to about 5 and 4 for the hotel and the industry, respectively. The PIs are equal to 224% for the domestic user, 320% for the hotel, and 355% for the industrial user.
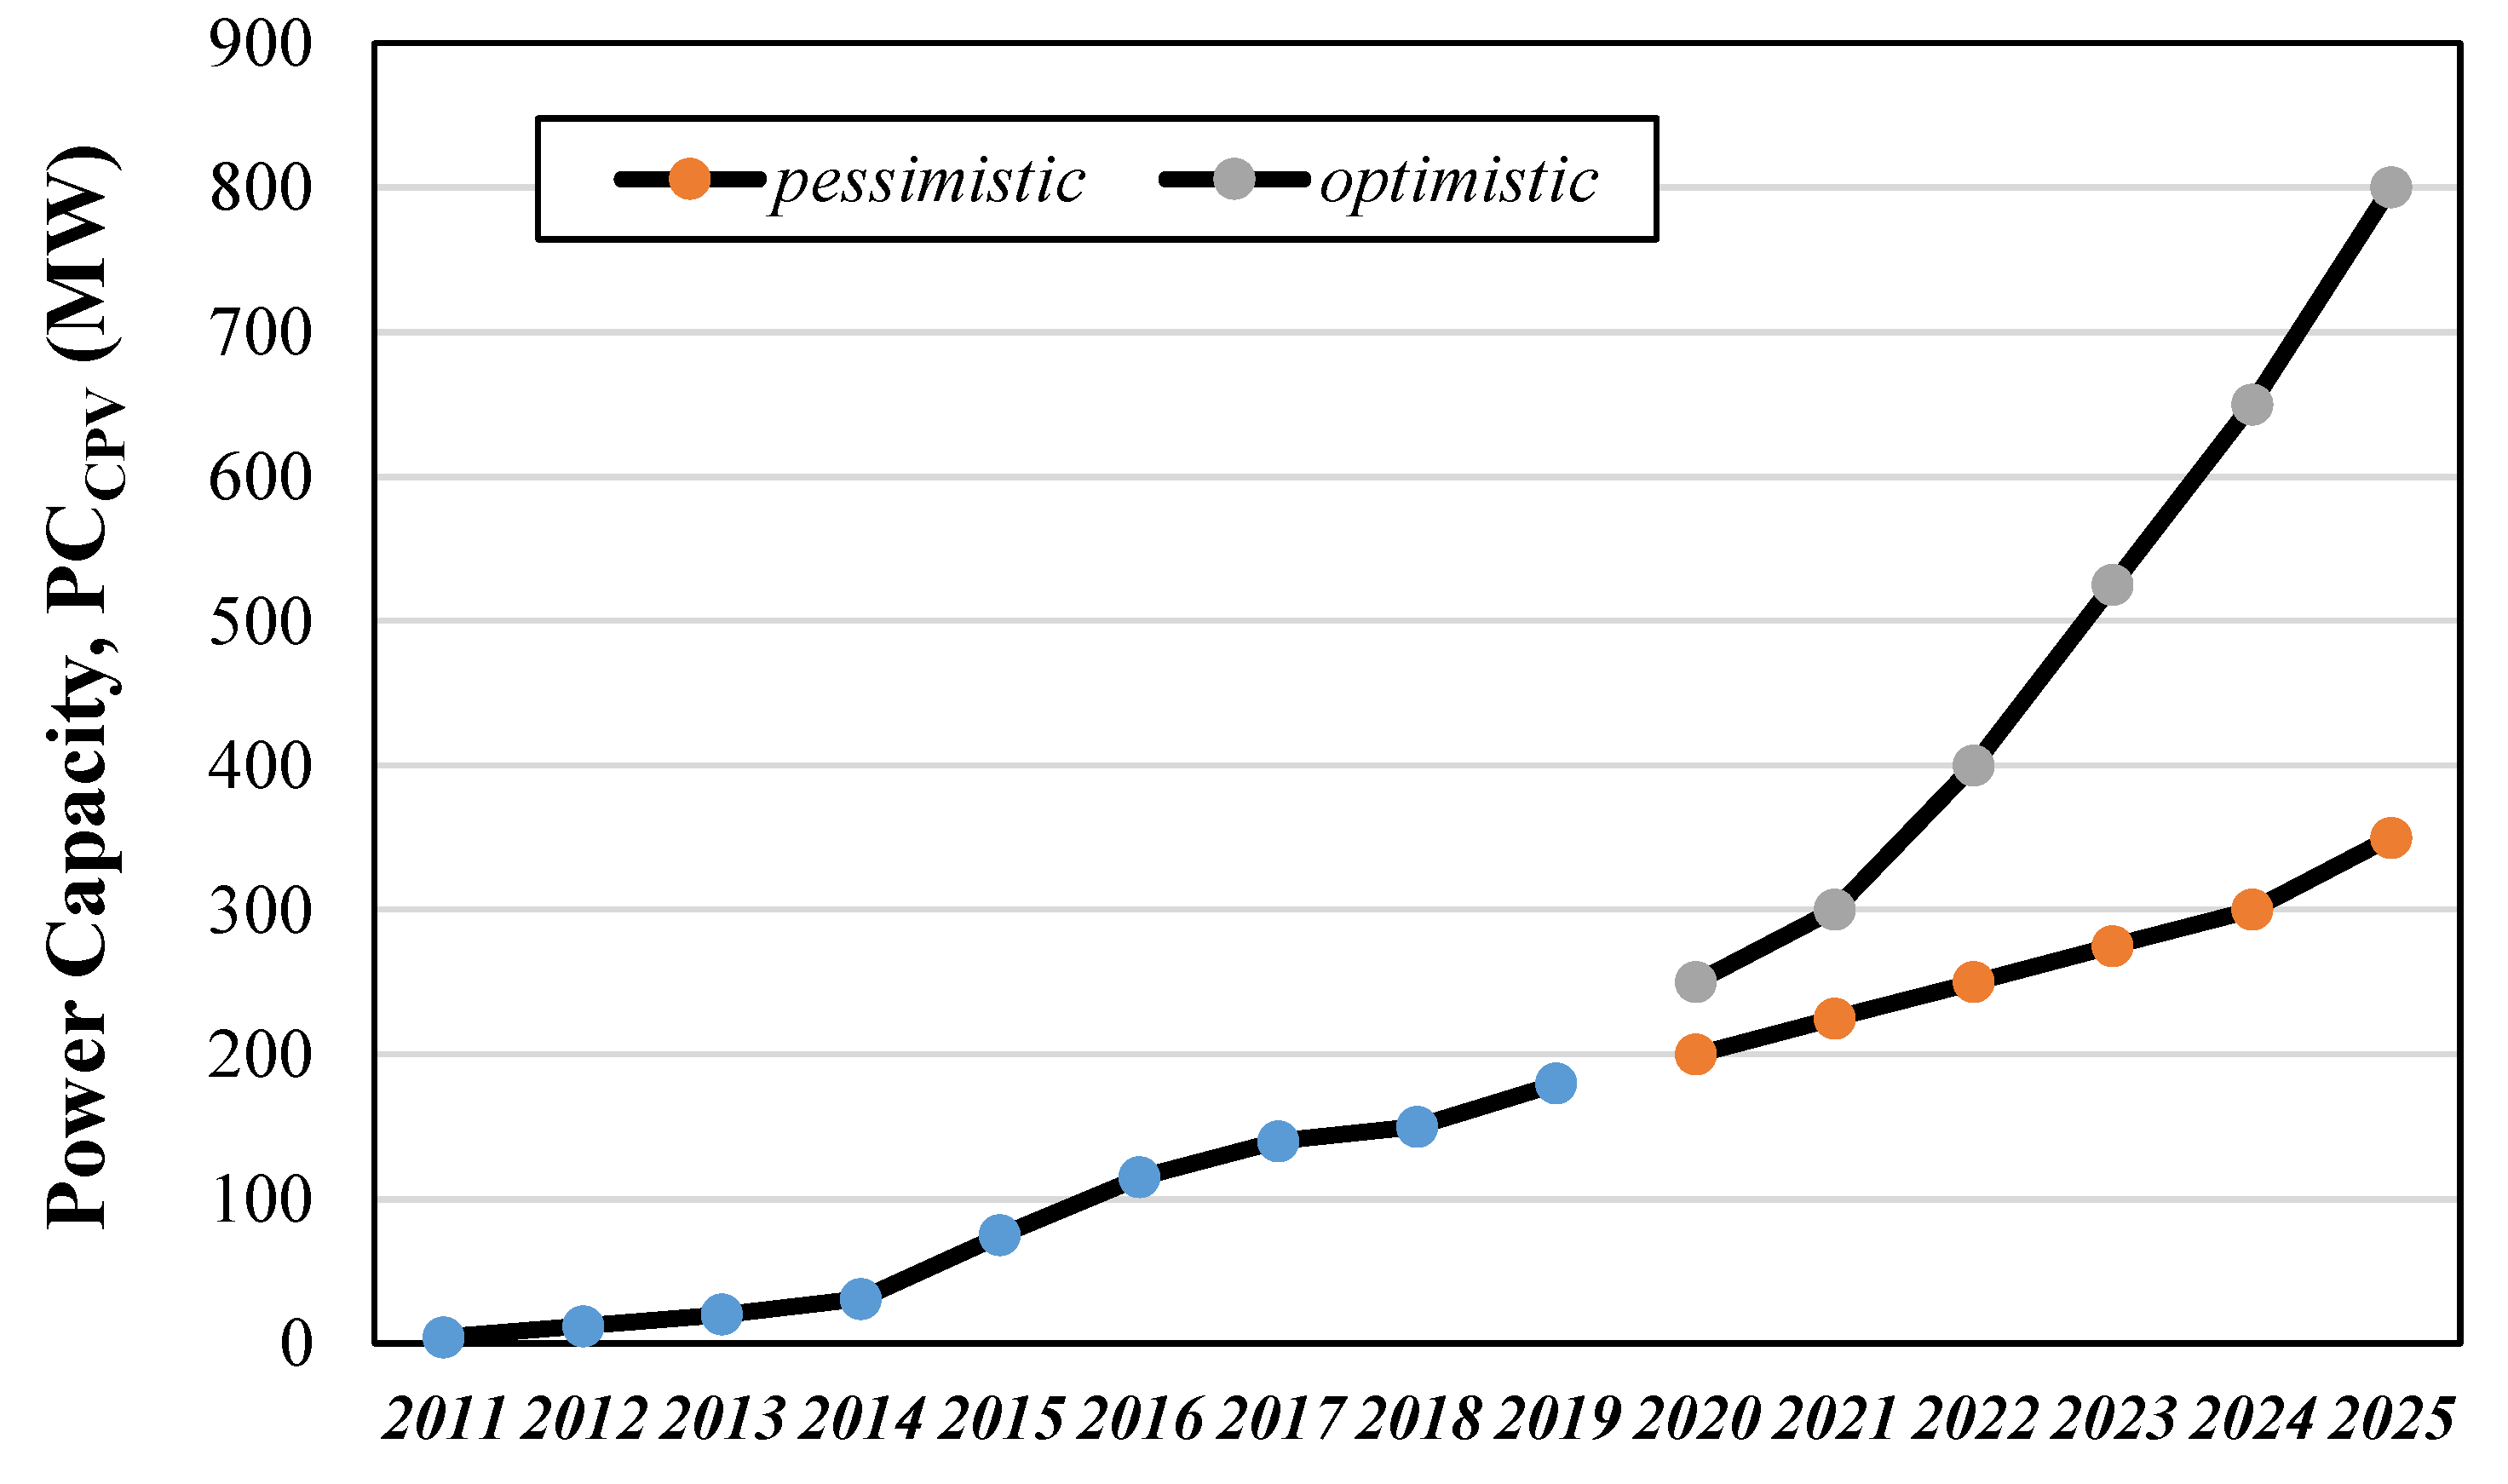
The economic analysis performed refers to the current costs of CPV systems. However, as reported above, because of the forecasted increase of the CPV power capacity (
), a cost decrease of this technology is to be expected in the next years [
19,
20,
21,
22,
23,
24,
25,
26,
27,
28,
29,
30]. Hence, by relating the CPV cost reduction over years reported in
Table 2 with the CPV power capacity (
) per year in
Figure 2, it is possible to plot the trends shown in
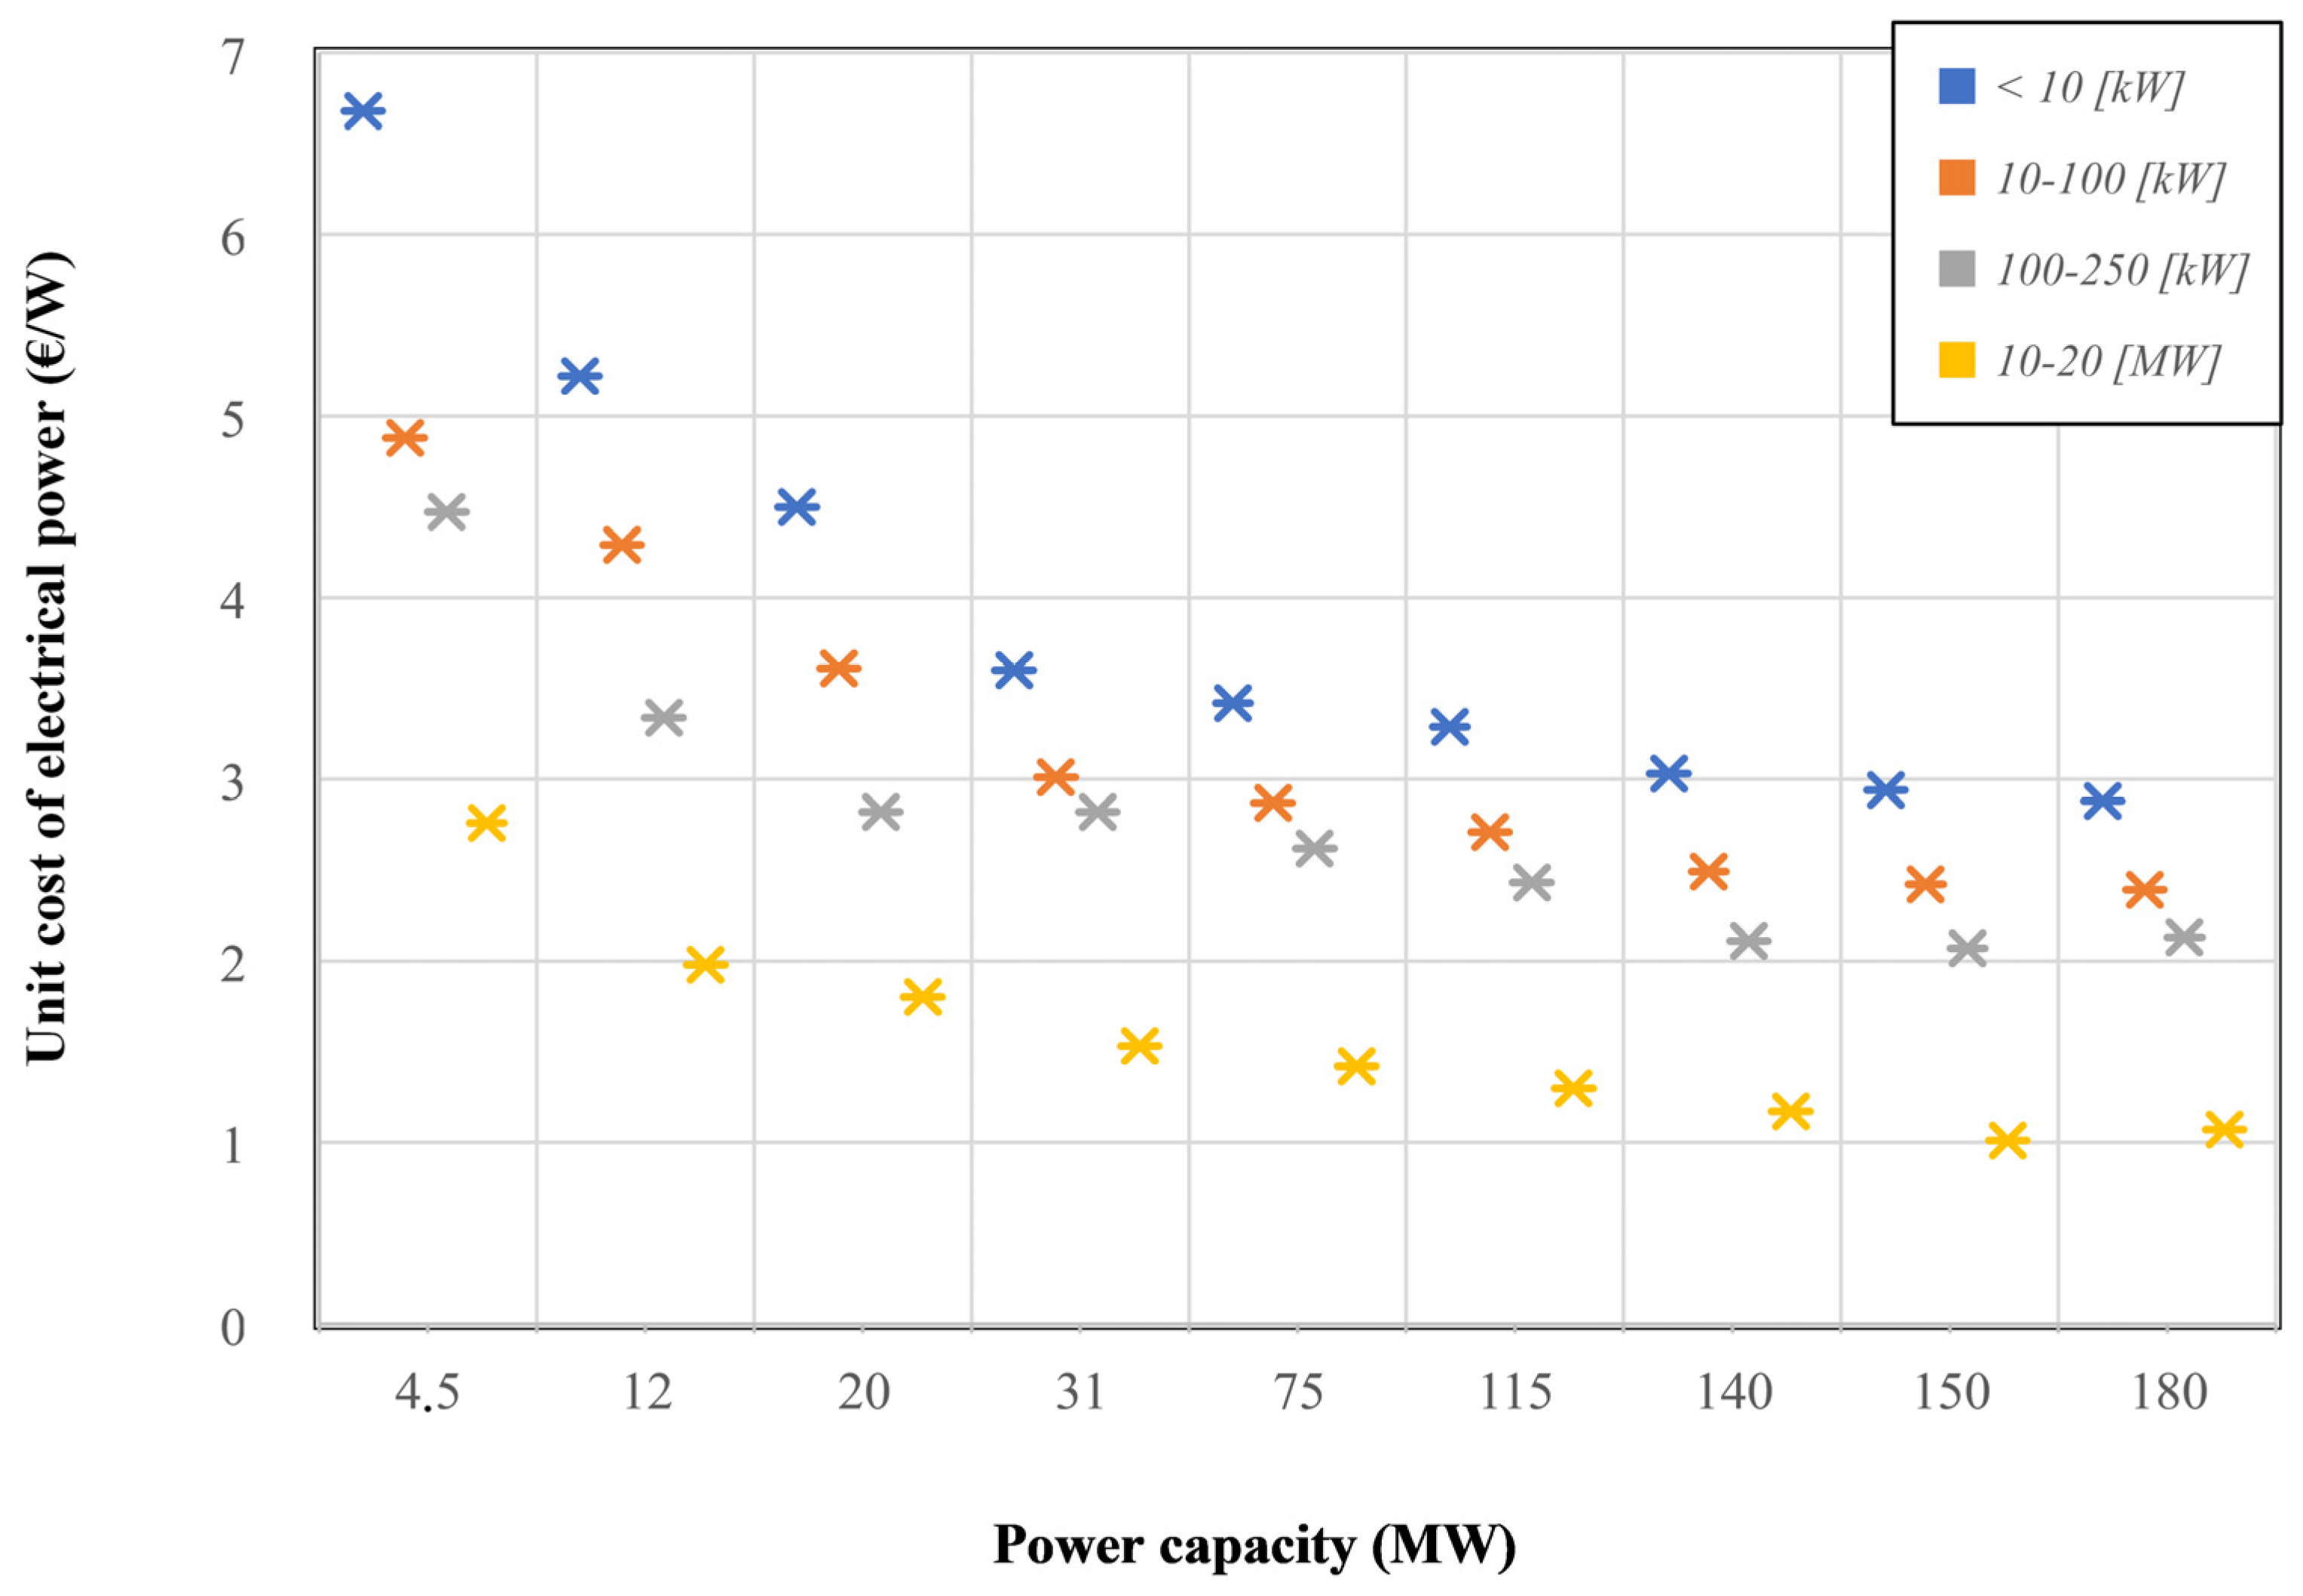
Figure 9 for the four categories previously defined. As shown in
Figure 9, the high increase of the CPV power capacity during the years from 2011 to 2019 leads to a reduction in their unit cost of electrical power, which can be described by means of Equation (9). The values of coefficients γ and δ in Equation (9) are reported in
Table 5 for each category defined of the CPV system, together with the values of
.
These trends can be extrapolated to forecast the values of
till the year 2025 in both an optimistic scenario and a pessimistic scenario, as reported in
Table 6. The results show that the costs of the CPV systems could decrease up to 30% in 2025 in an optimistic scenario.
Considering the values of
reported in
Table 6, it is possible to analyze the variation of the economic performances of a CPV system applied to the three users defined in the present study between the present and 2025 in the two scenarios—optimistic and pessimistic scenarios (
Table 6).
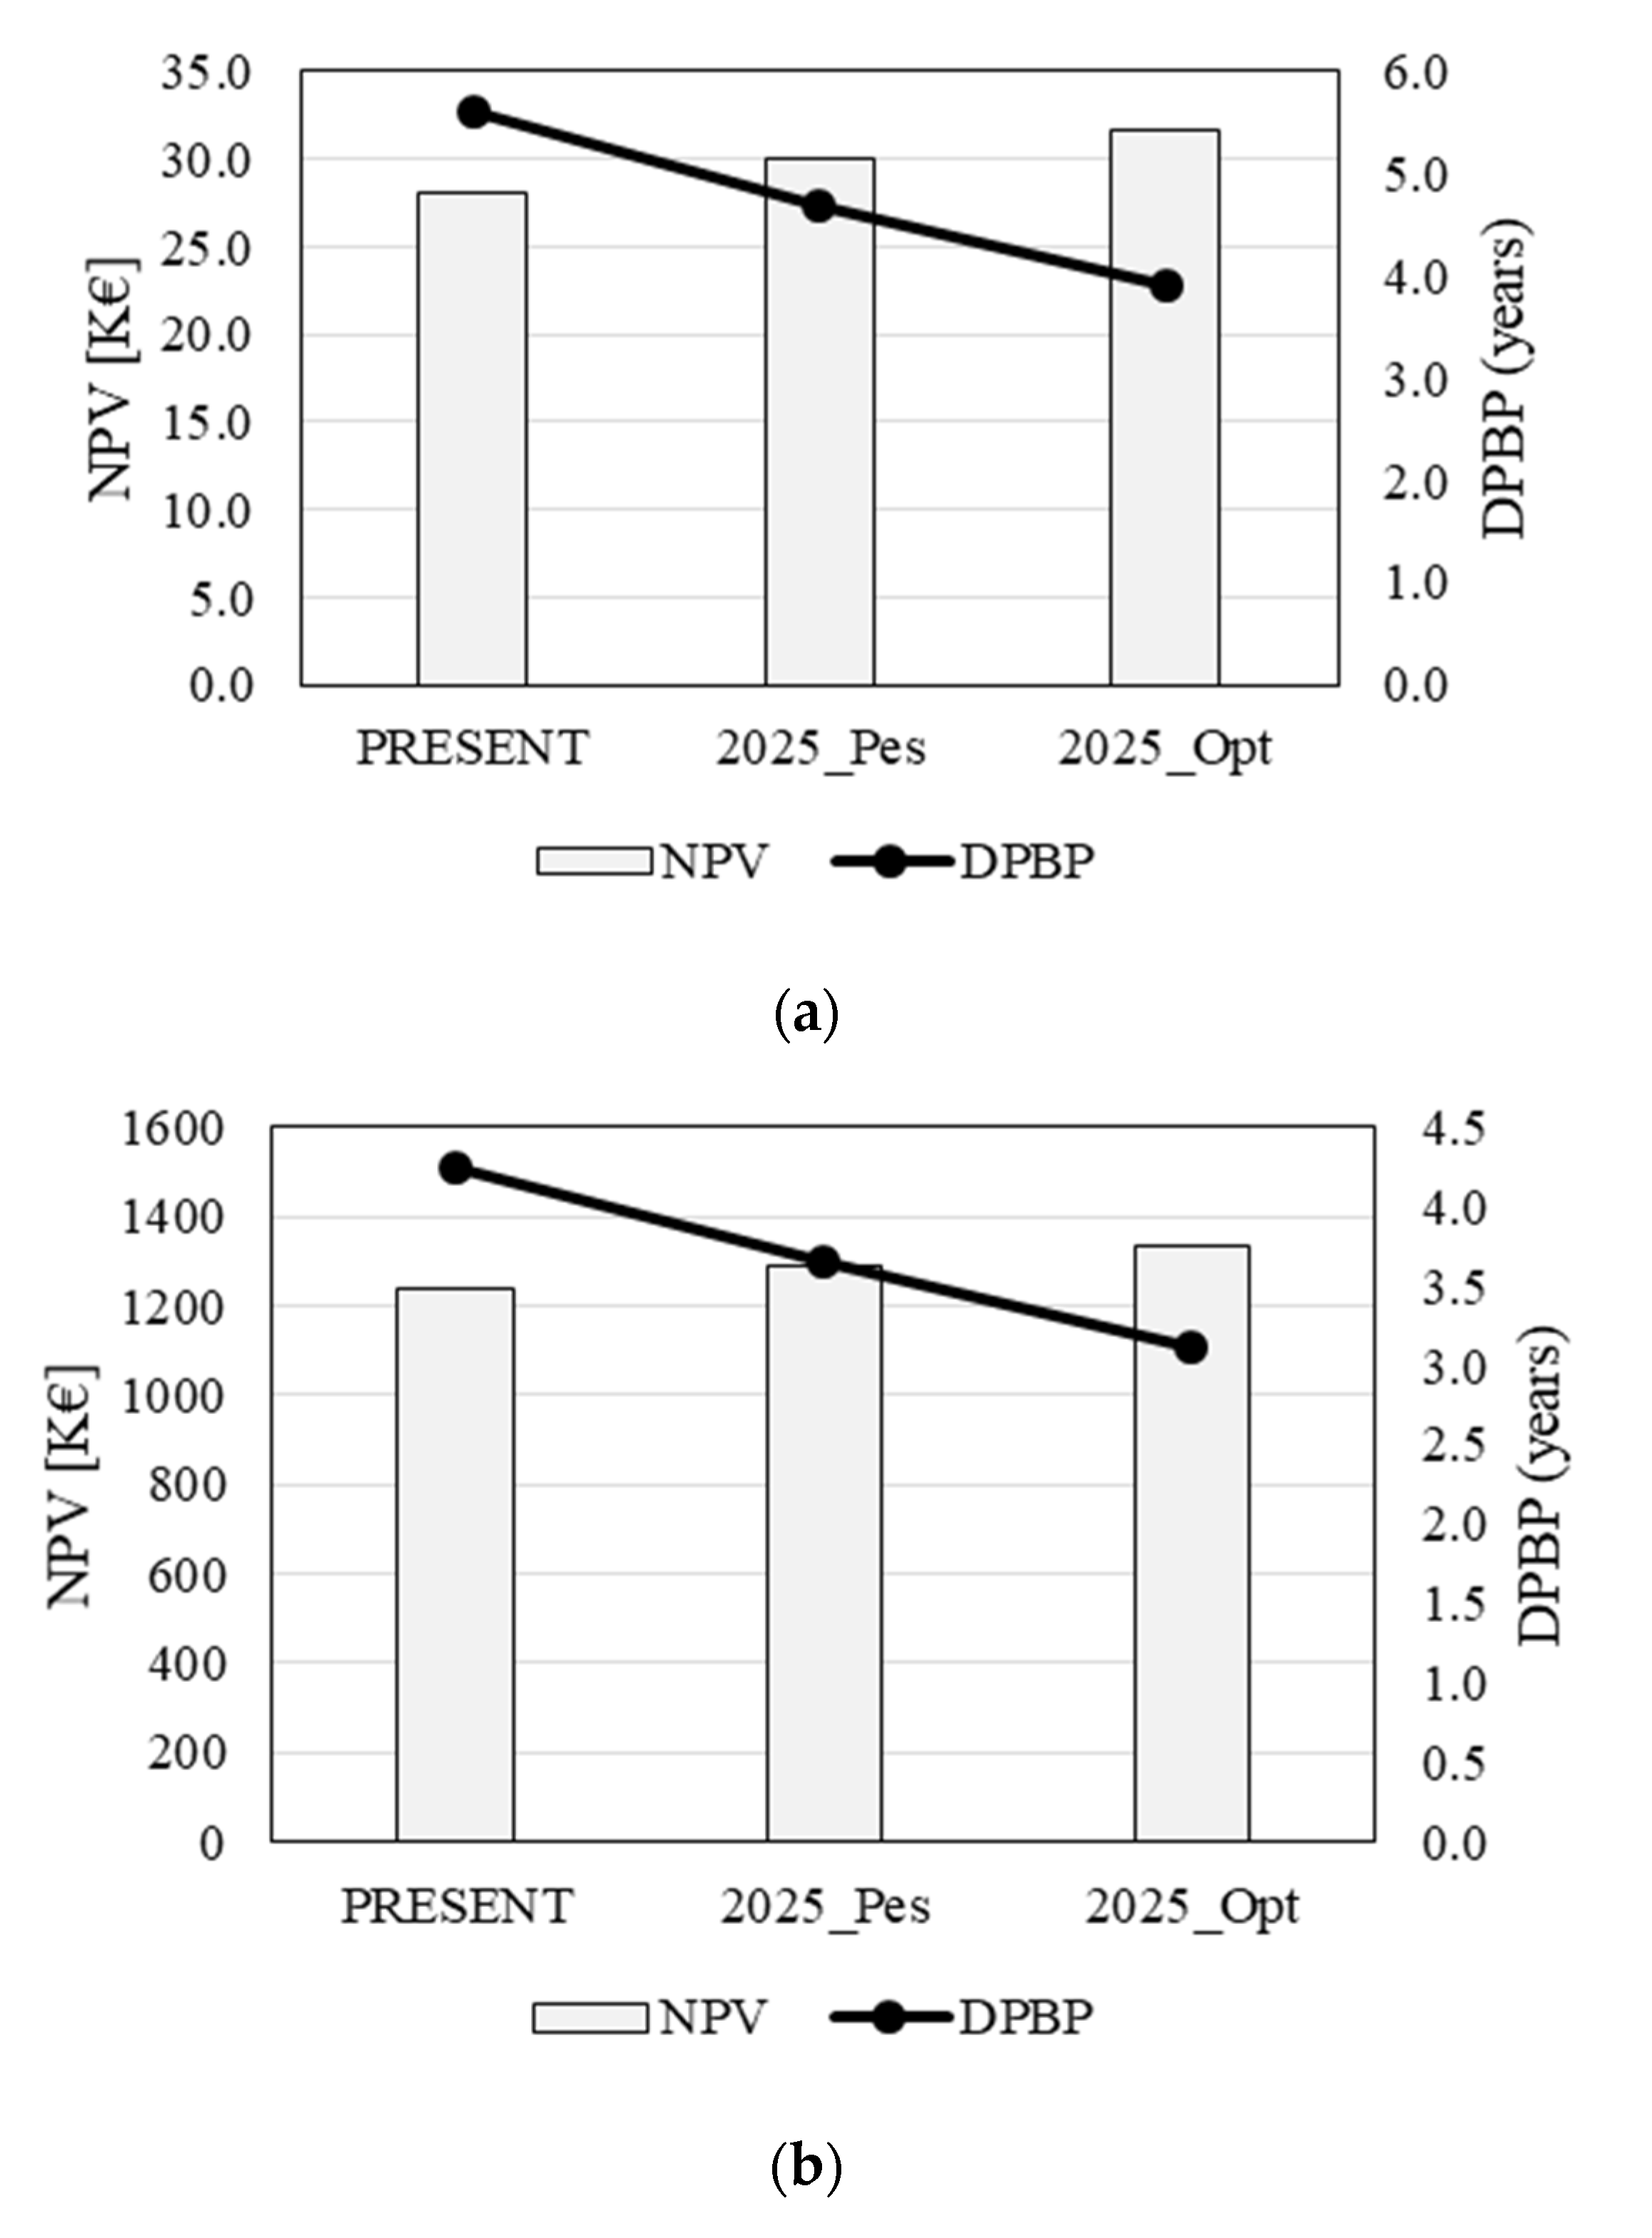
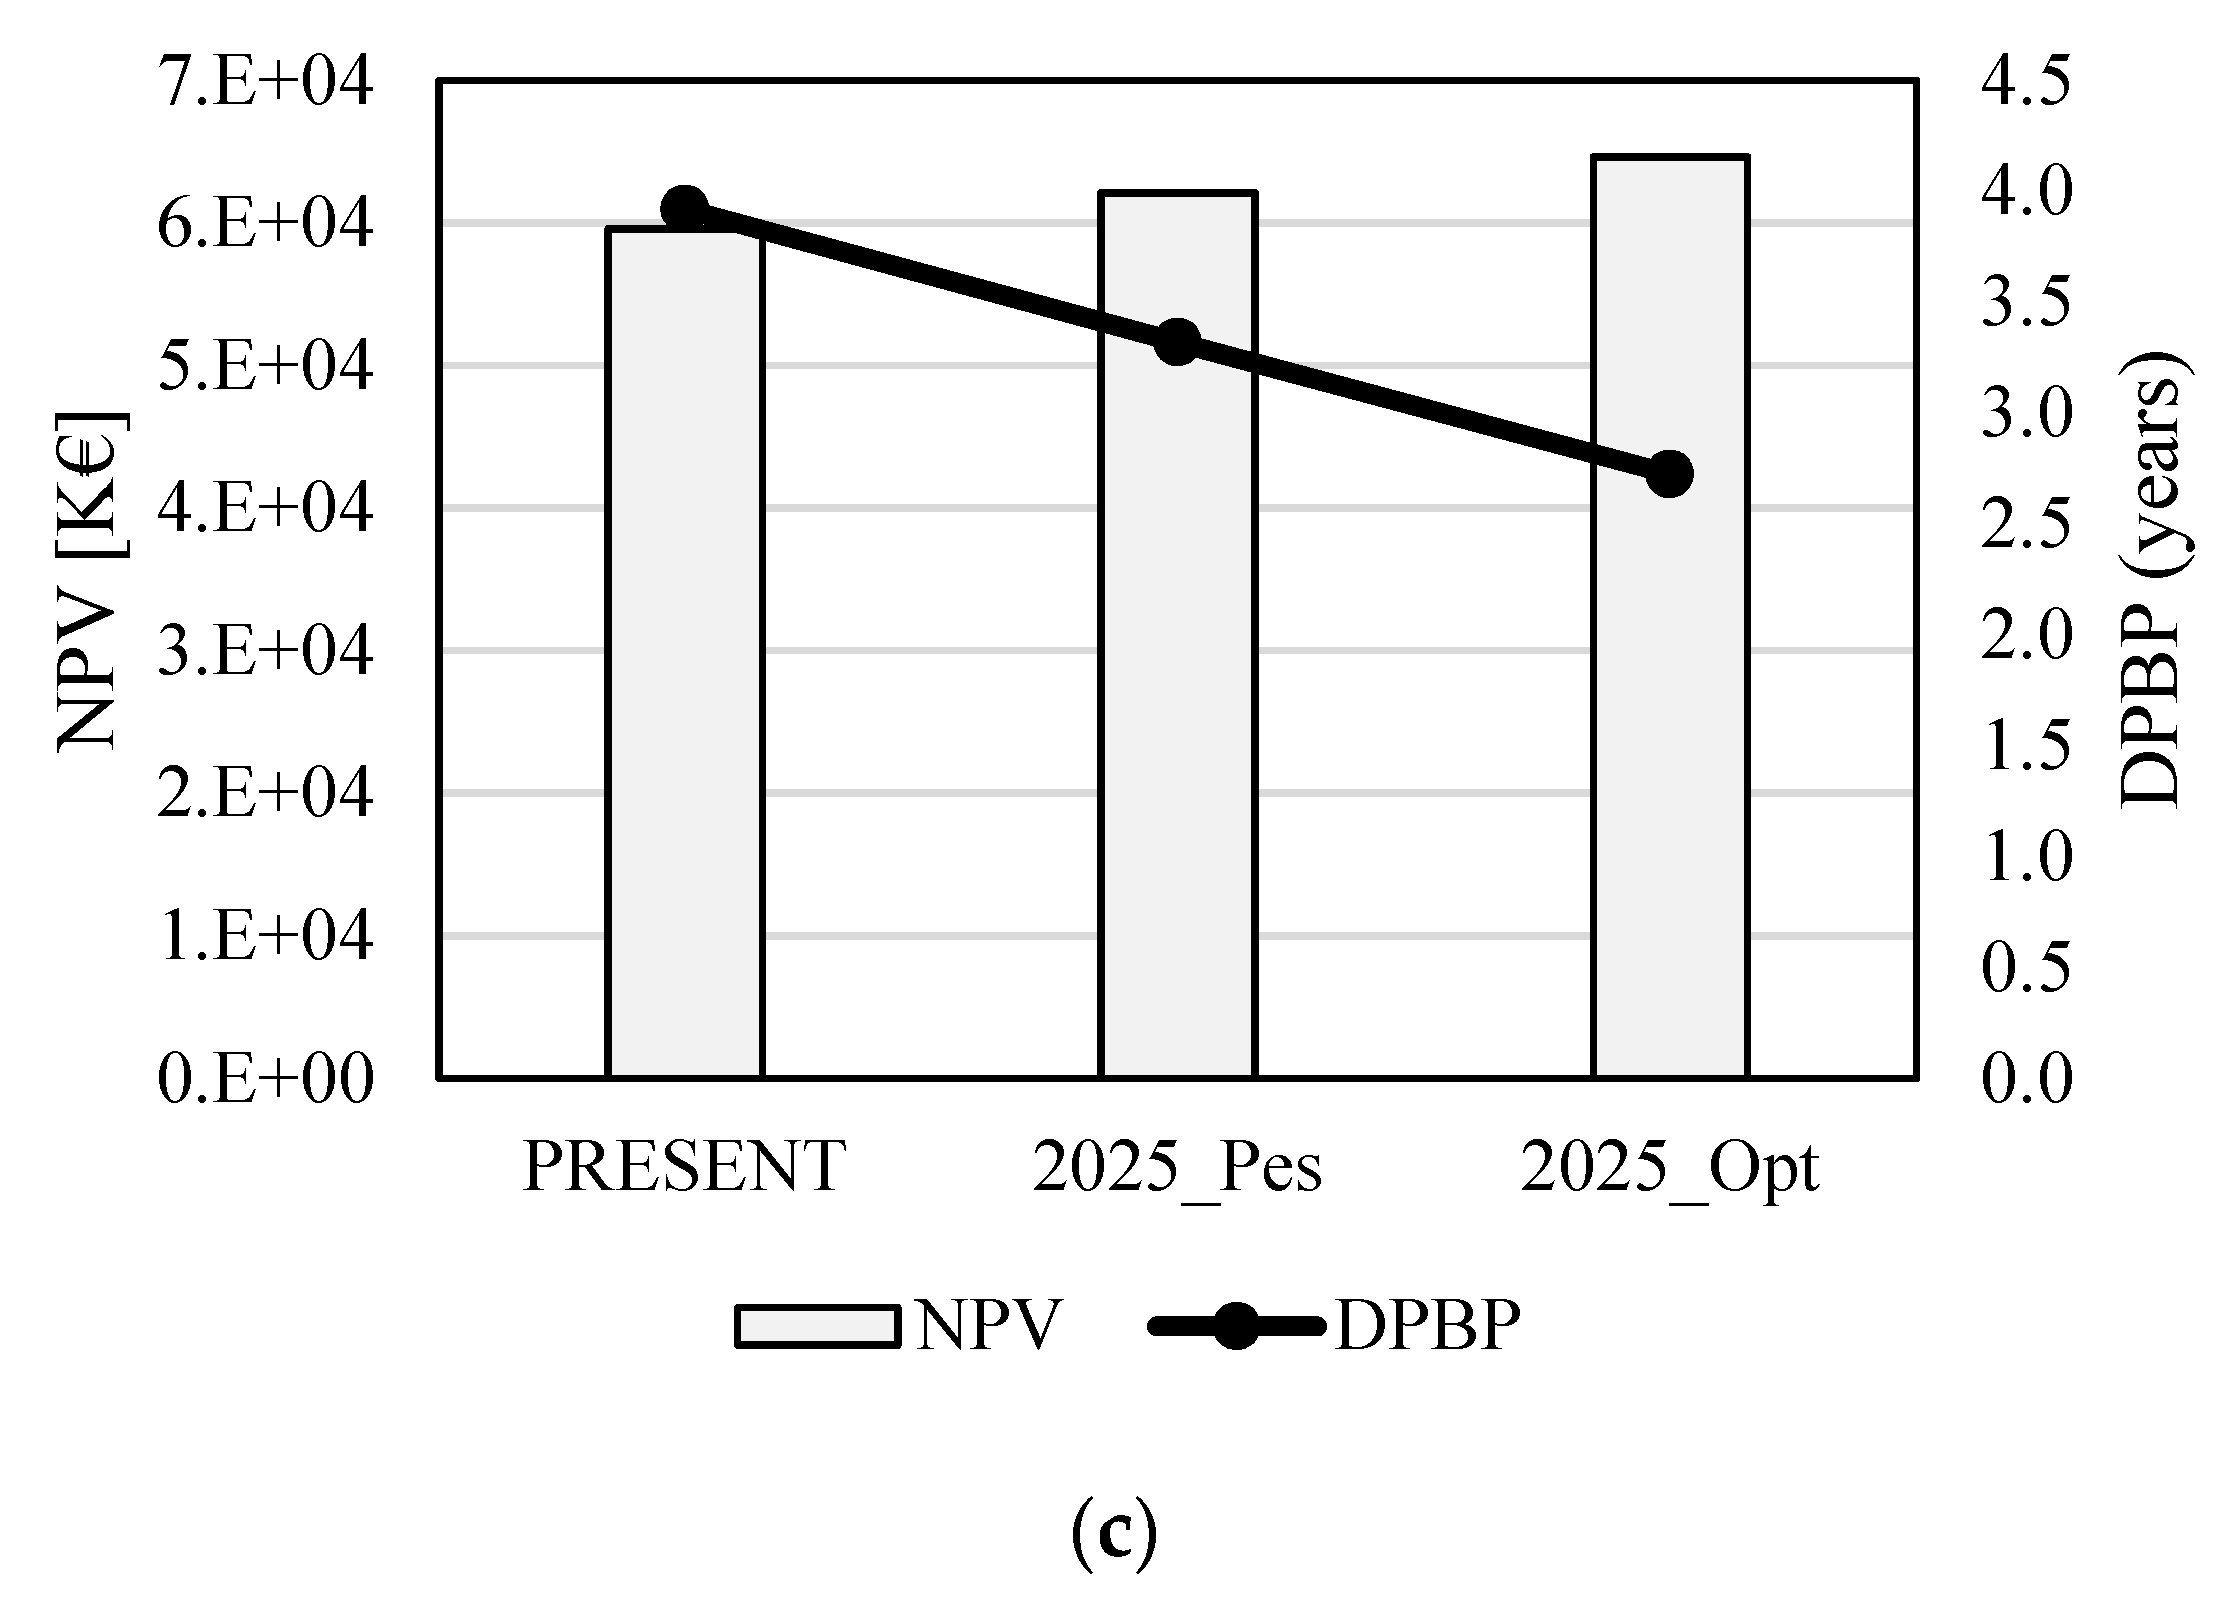
As shown, according to the cost forecasts, CPV systems will become more convenient in 2025. In fact, for the CPV systems adopted for the residential user (
Figure 10a), the NPV will increase from 28.1 k€ to 30.0 k€ in a pessimistic scenario and to 31.7 k€ in an optimistic scenario, while the DPBP will decrease from 5.6 years to 4.7 and 3.9 years in a pessimistic scenario and an optimistic scenario, respectively. As for the hotel (
Figure 10b), the NPV will increase from 1237 k€ to 1289 k€ in a pessimistic scenario and to 1337 k€ in an optimistic scenario, while the DPBP will decrease from 4.2 years to 3.7 and 3.1 years in a pessimistic scenario and an optimistic scenario, respectively. Finally, as for the industrial user (
Figure 10c), the NPV will increase from 59,578 k€ to 62,090 k€ in a pessimistic scenario and to 64,603 k€ in an optimistic scenario, while the DPBP will decrease from 3.9 years to 3.3 and 2.7 years in a pessimistic scenario and an optimistic scenario, respectively.


