
Optimal Allocation and Planning of Distributed Power Generation Resources in a Smart Distribution Network Using the Manta Ray Foraging Optimization Algorithm

 ,
,  ,
,  ,
,  and
and 
Abstract
:1. Introduction
- Optimal allocation and planning of DGSCs in distribution network
- Evaluating the effect of smart and estimated load on energy losses
- Undermining network performance due to load forecasting error
- More net saving with by moving networks towards smartening
- Superiority of the MRFO compared to PSO
2. Problem Formulation
2.1. Optimal Positioning Objective Function
2.1.1. Power Losses
2.1.2. Voltage Profile
2.2. Objective Function of Optimal Planning
2.3. Problem Constraints
- Power capacity
- Limit thermal limits
- Voltage constraint
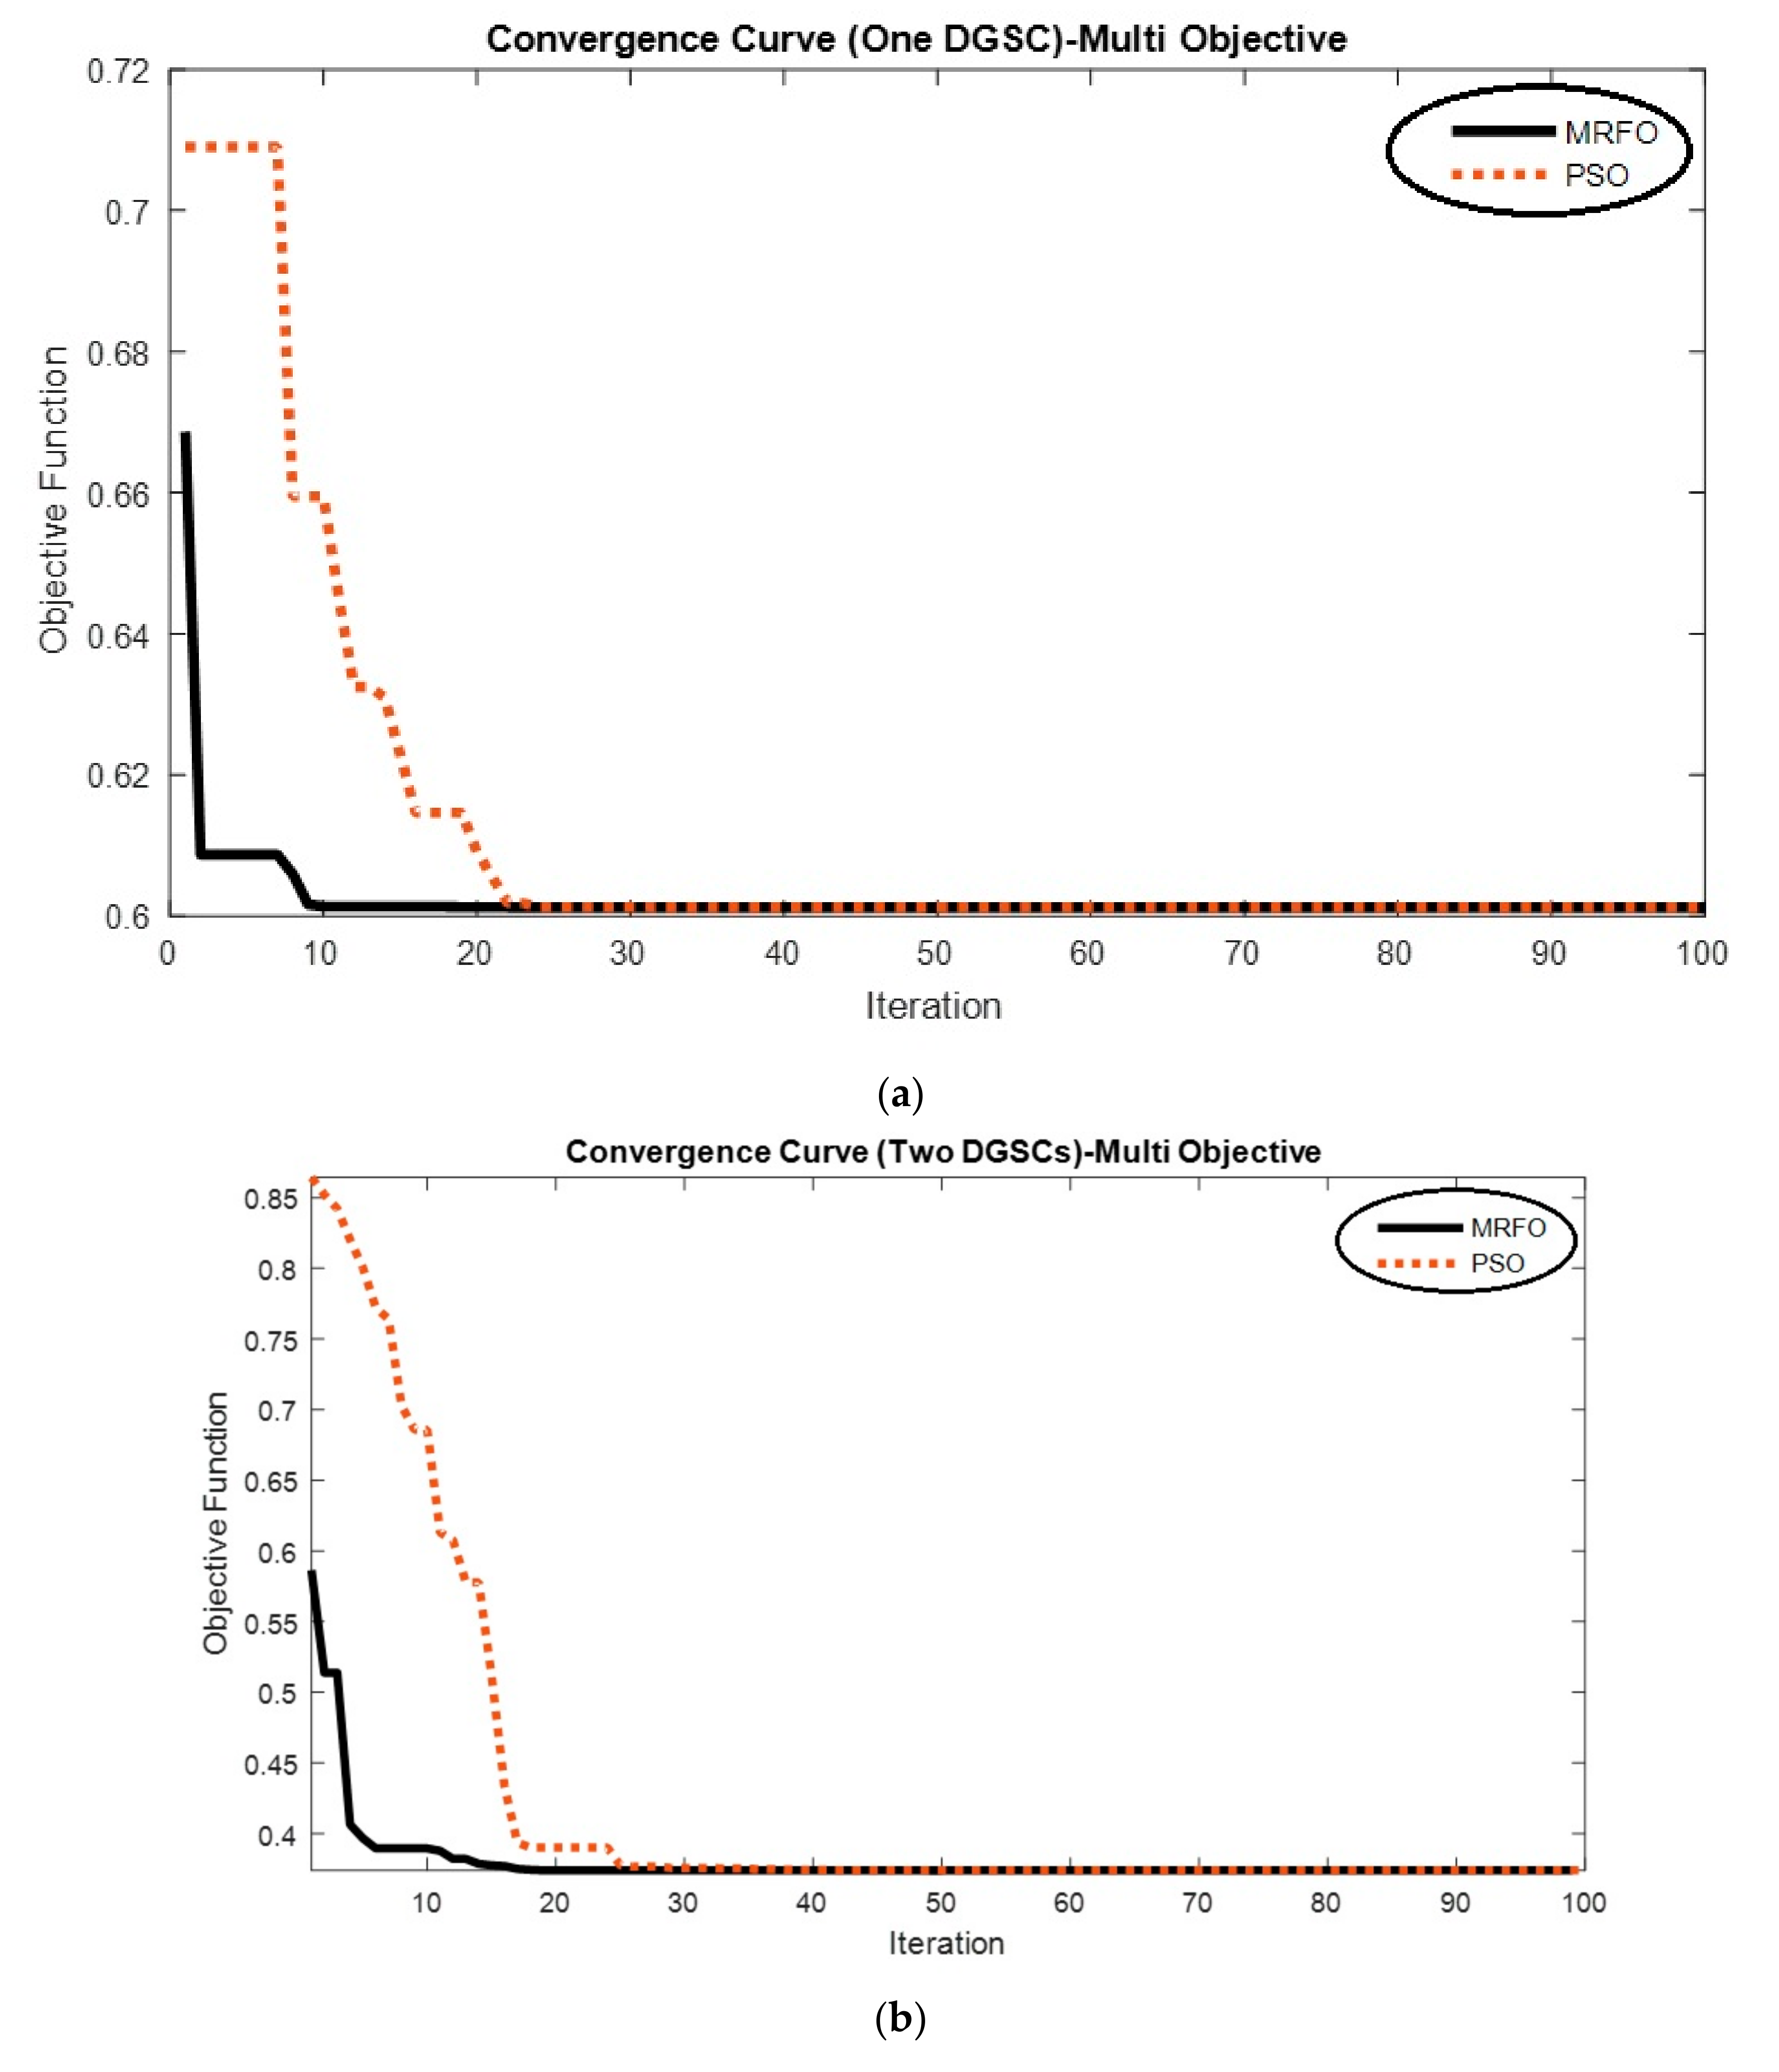
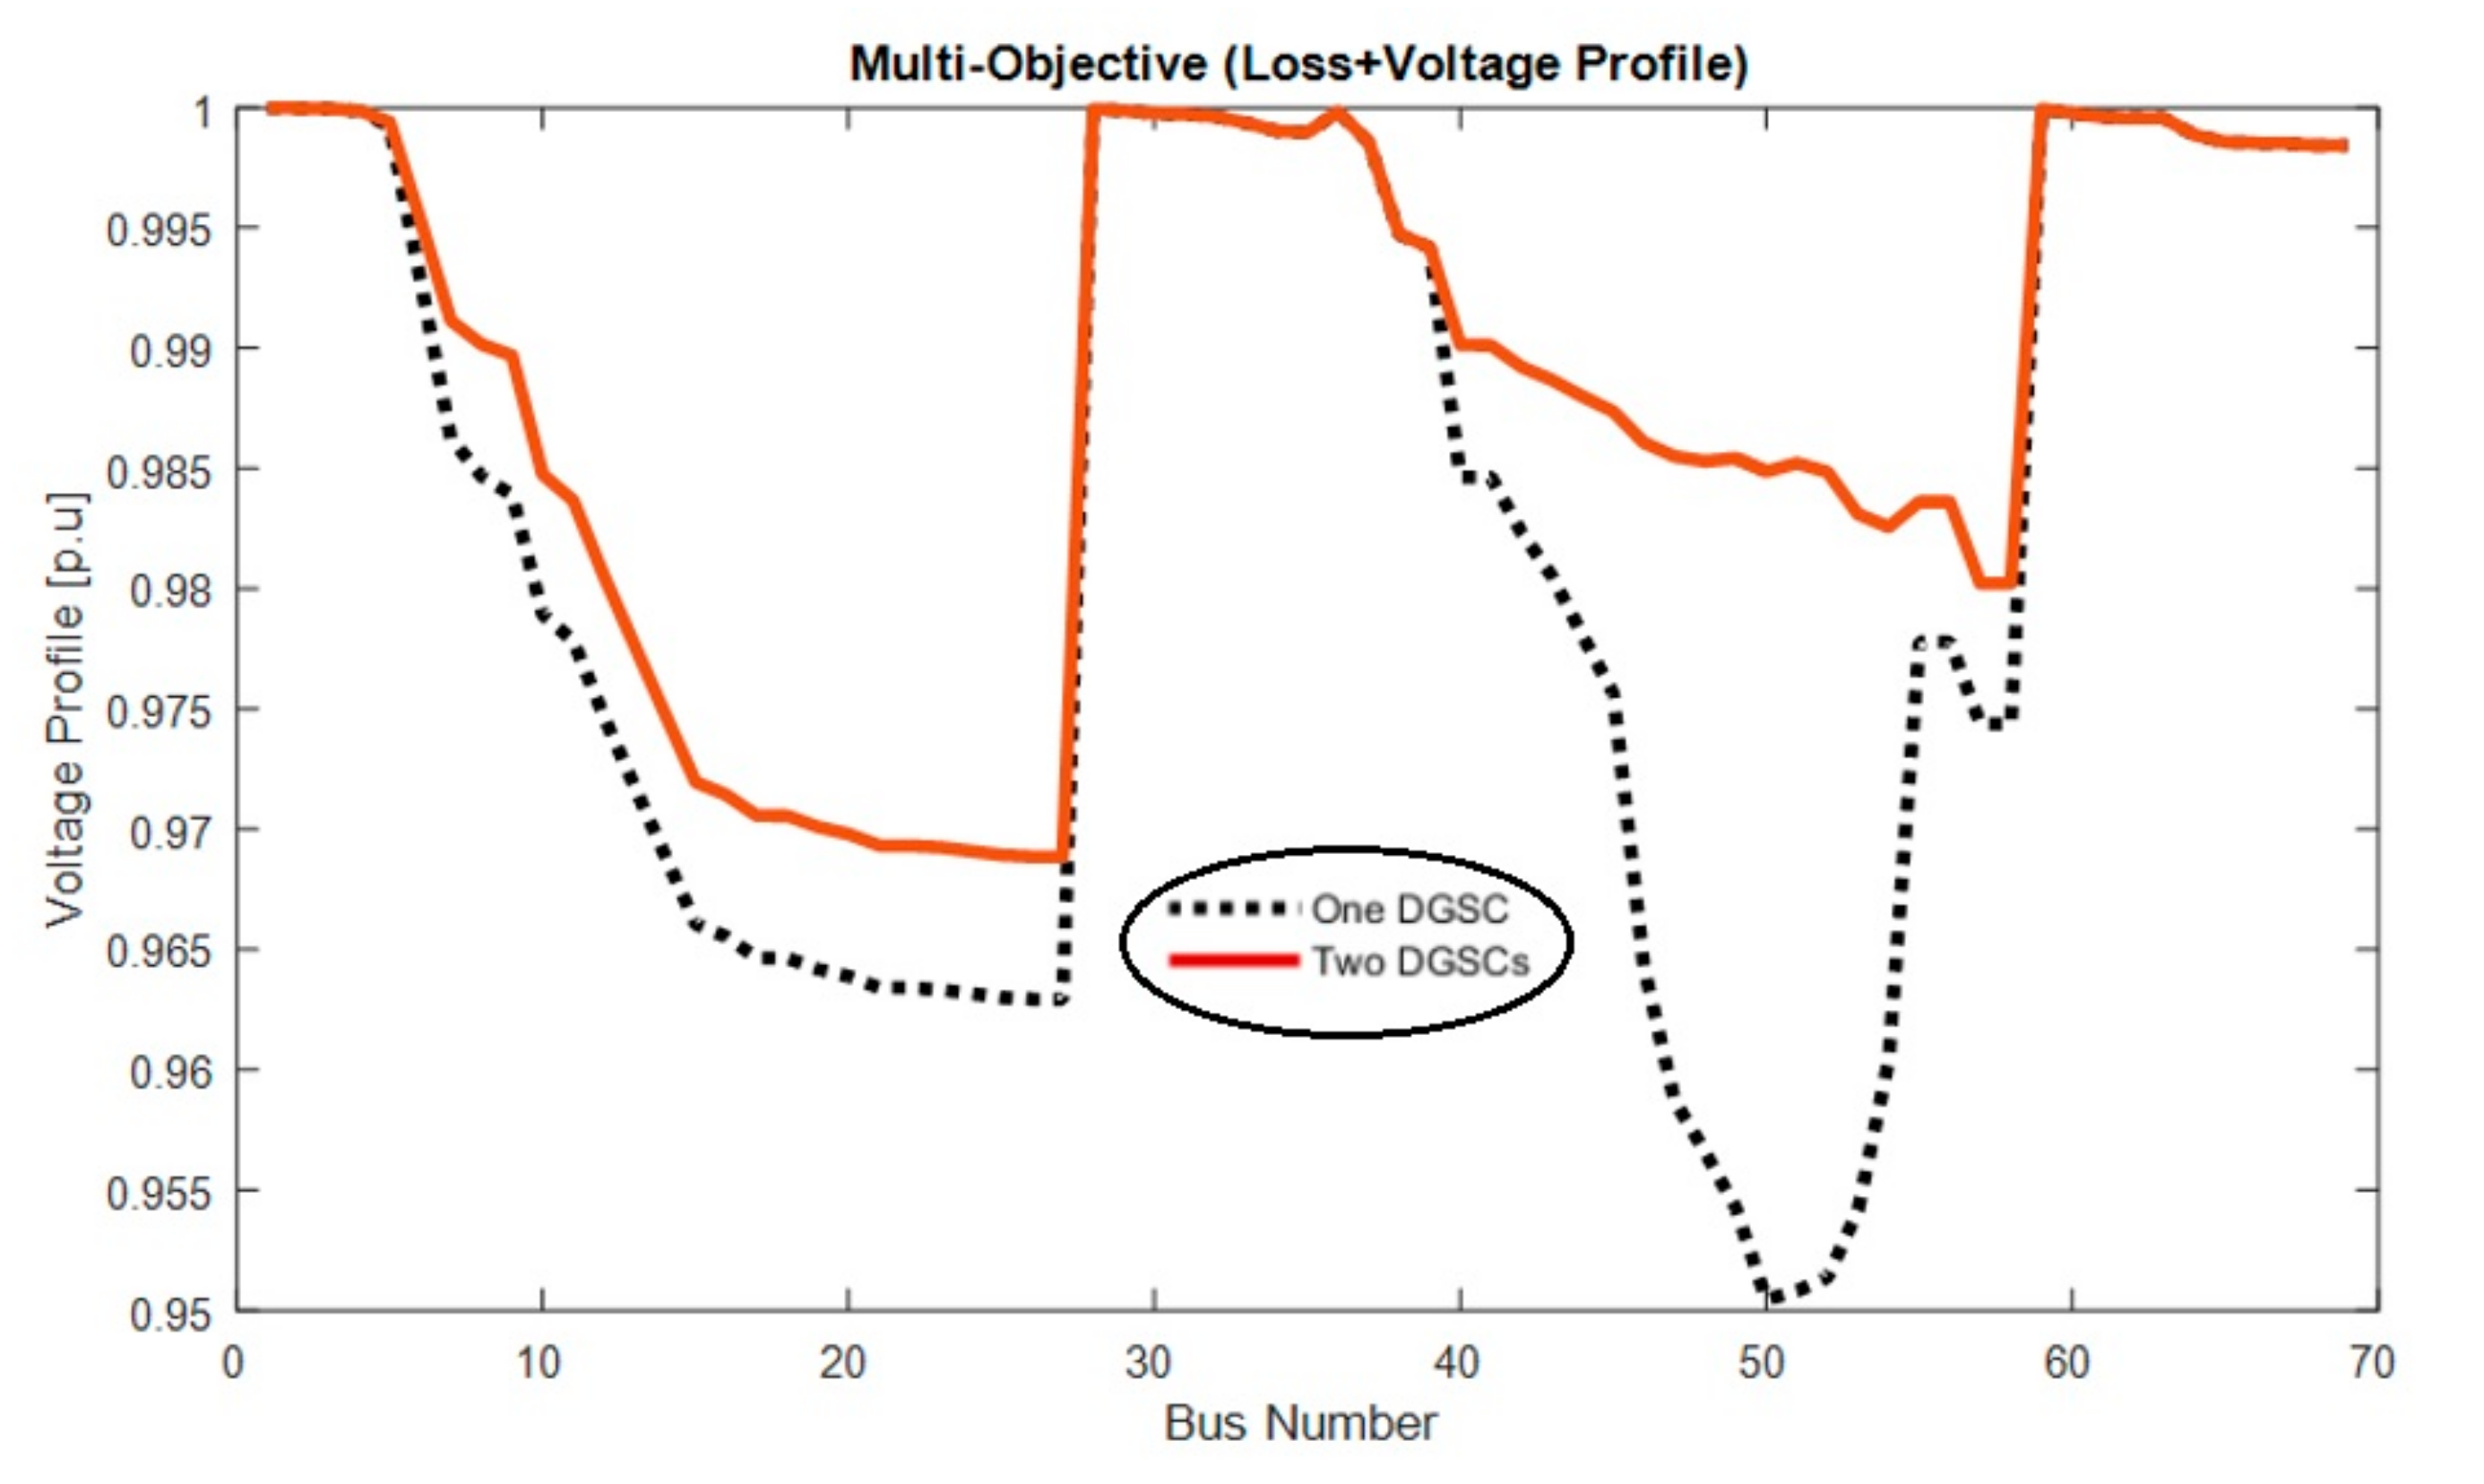
2.4. Multi-Objective Optimization
3. Load Model of the Network
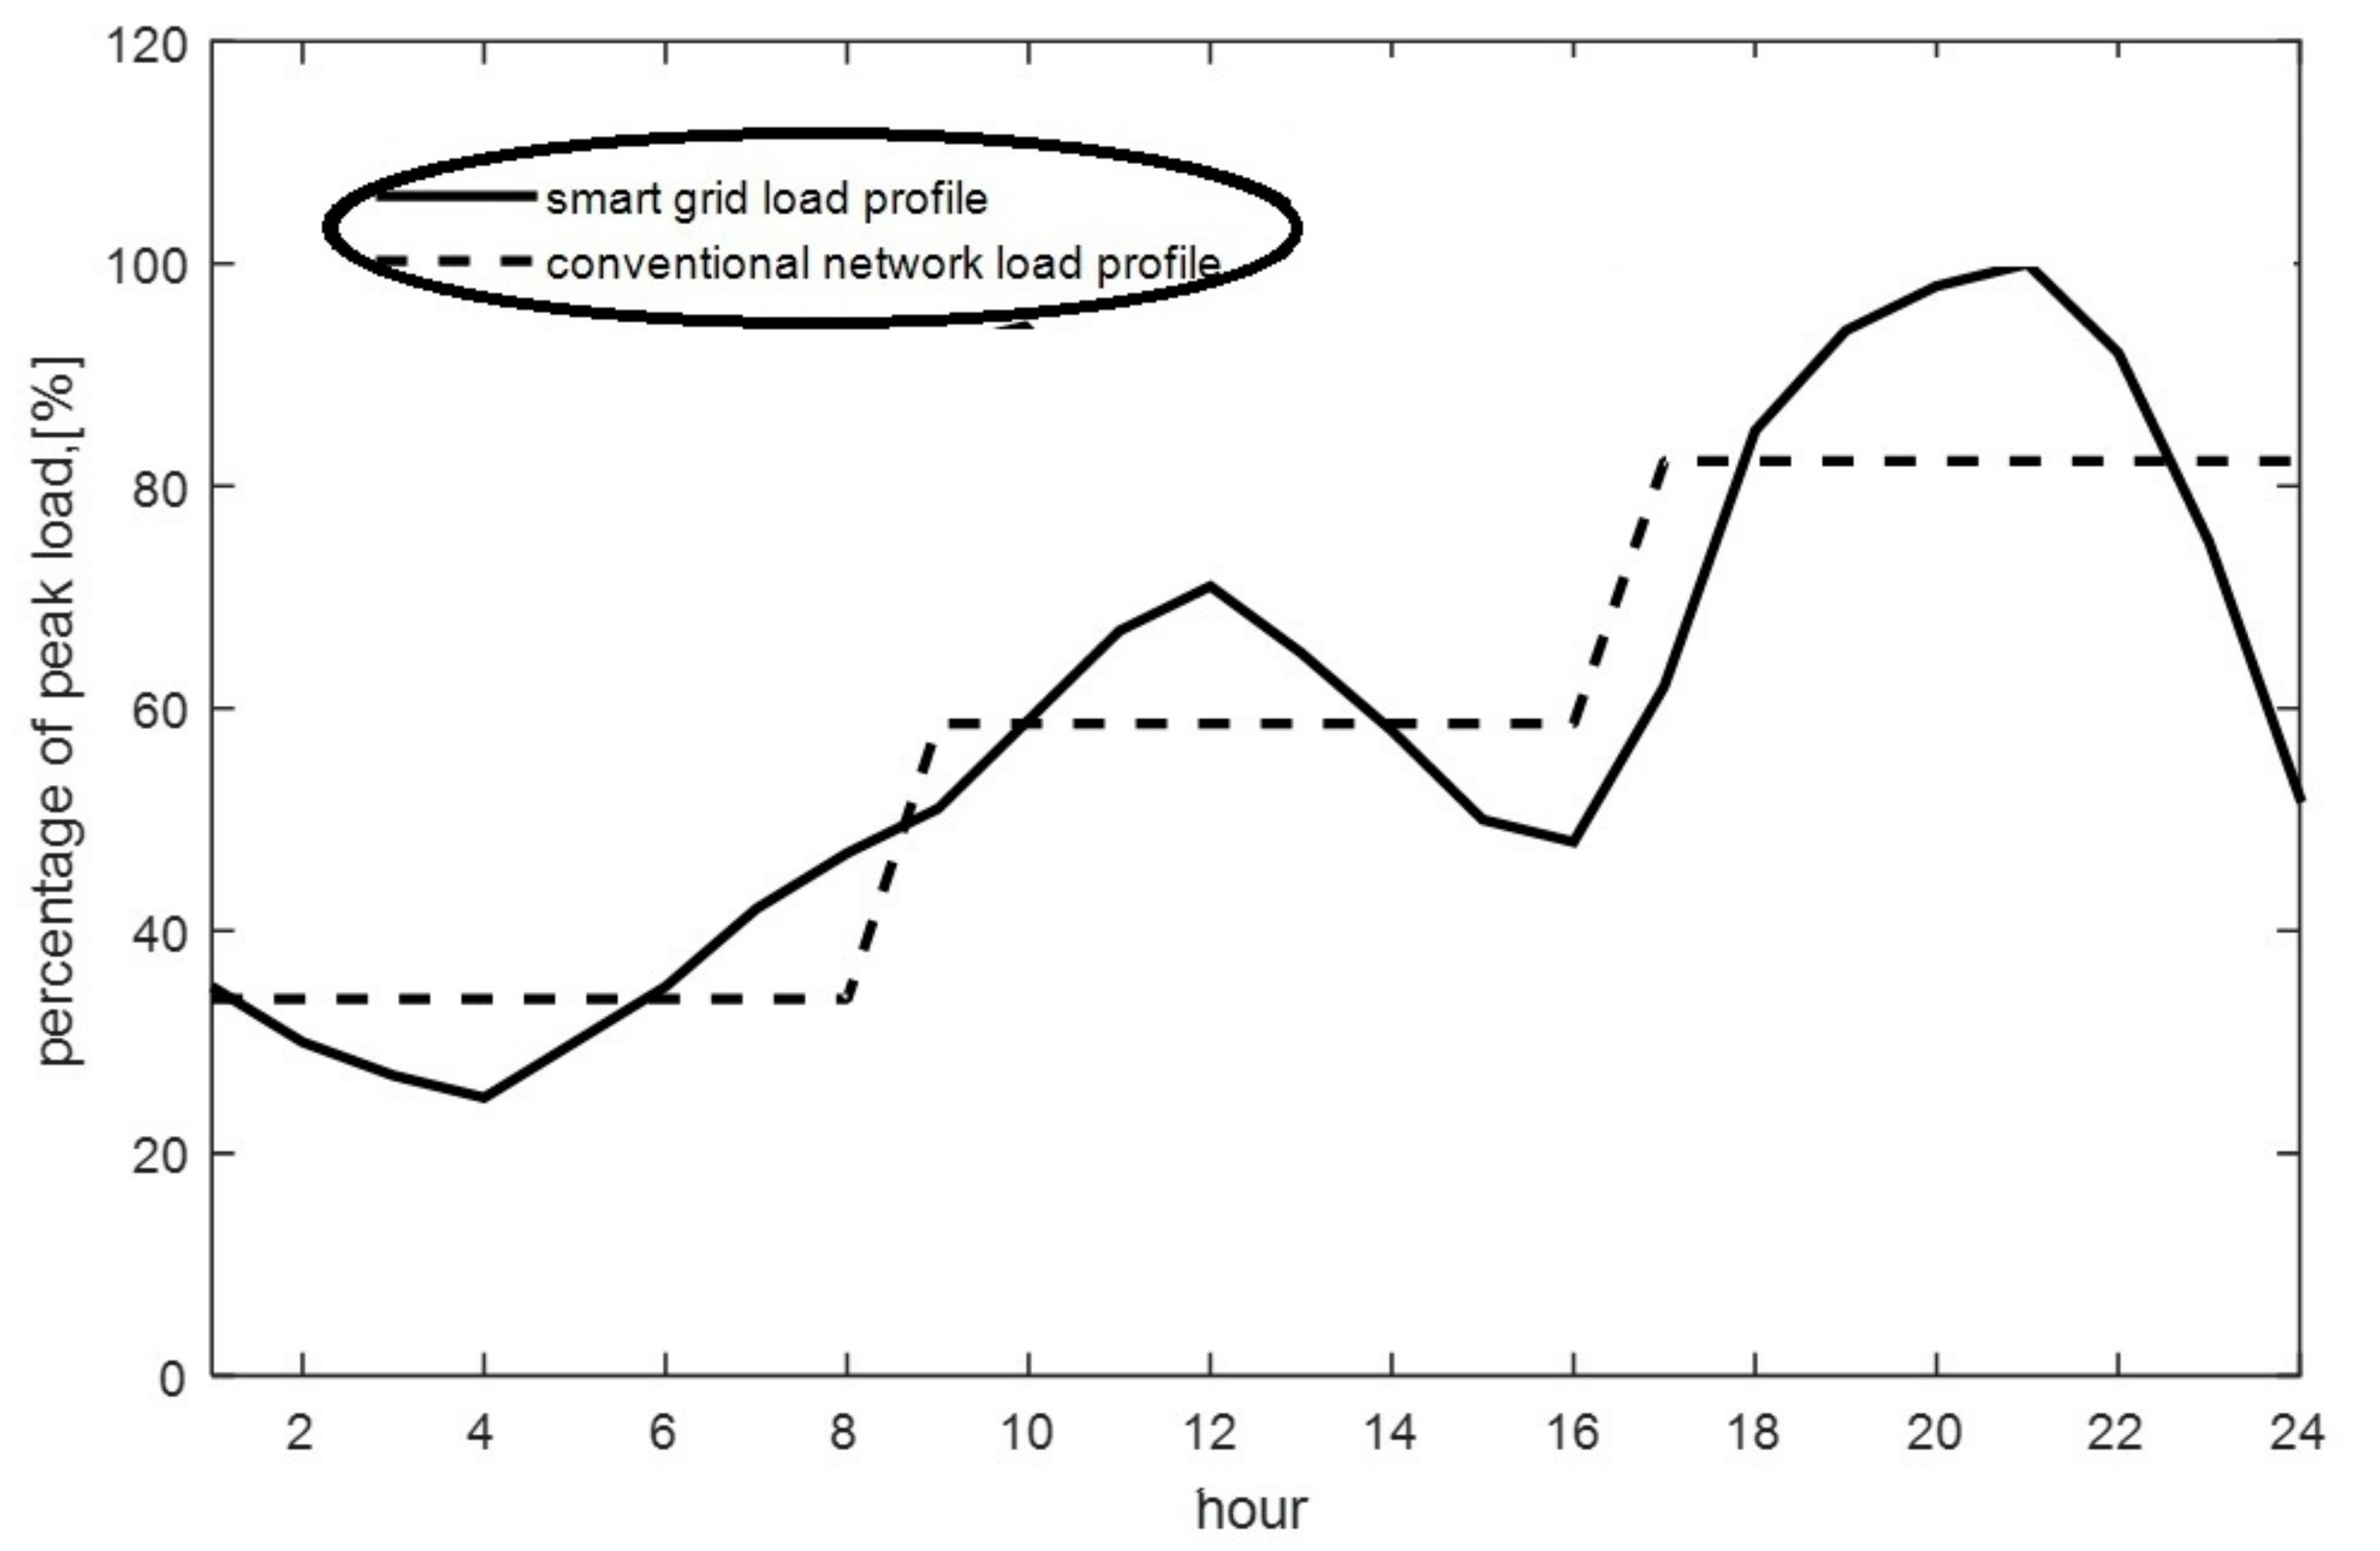
- Case (1) The first case is a 24-h load extracted from the smart network based on smart measuring devices (Figure 1).
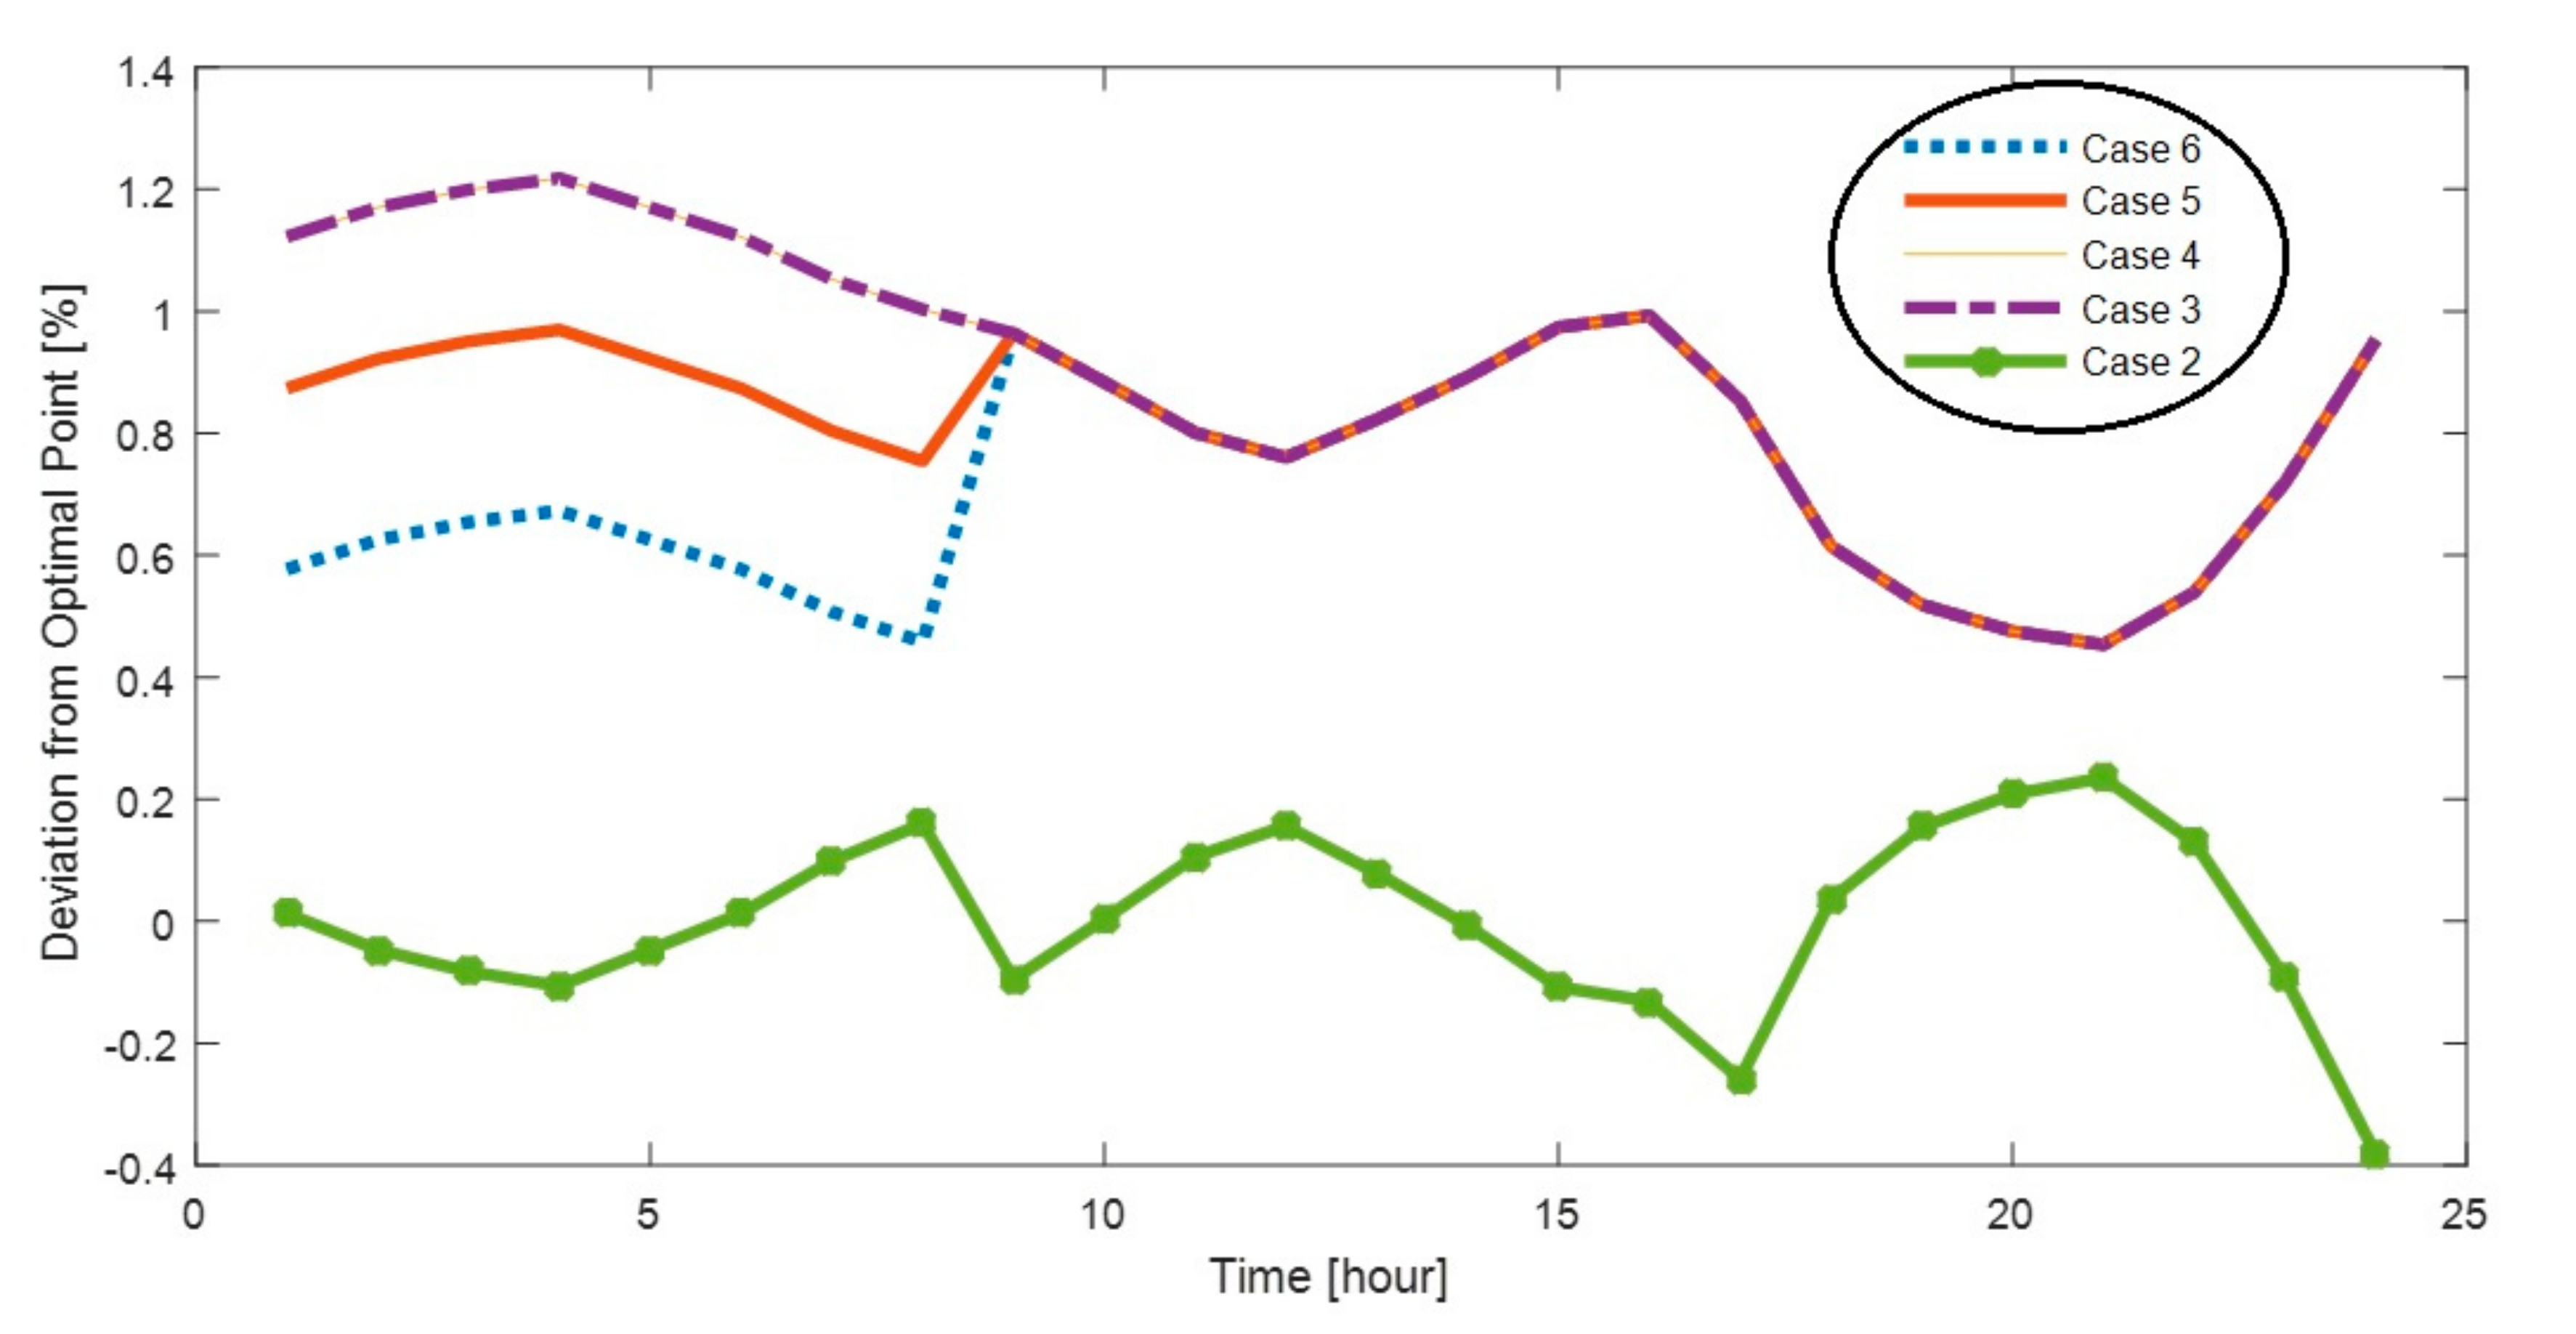
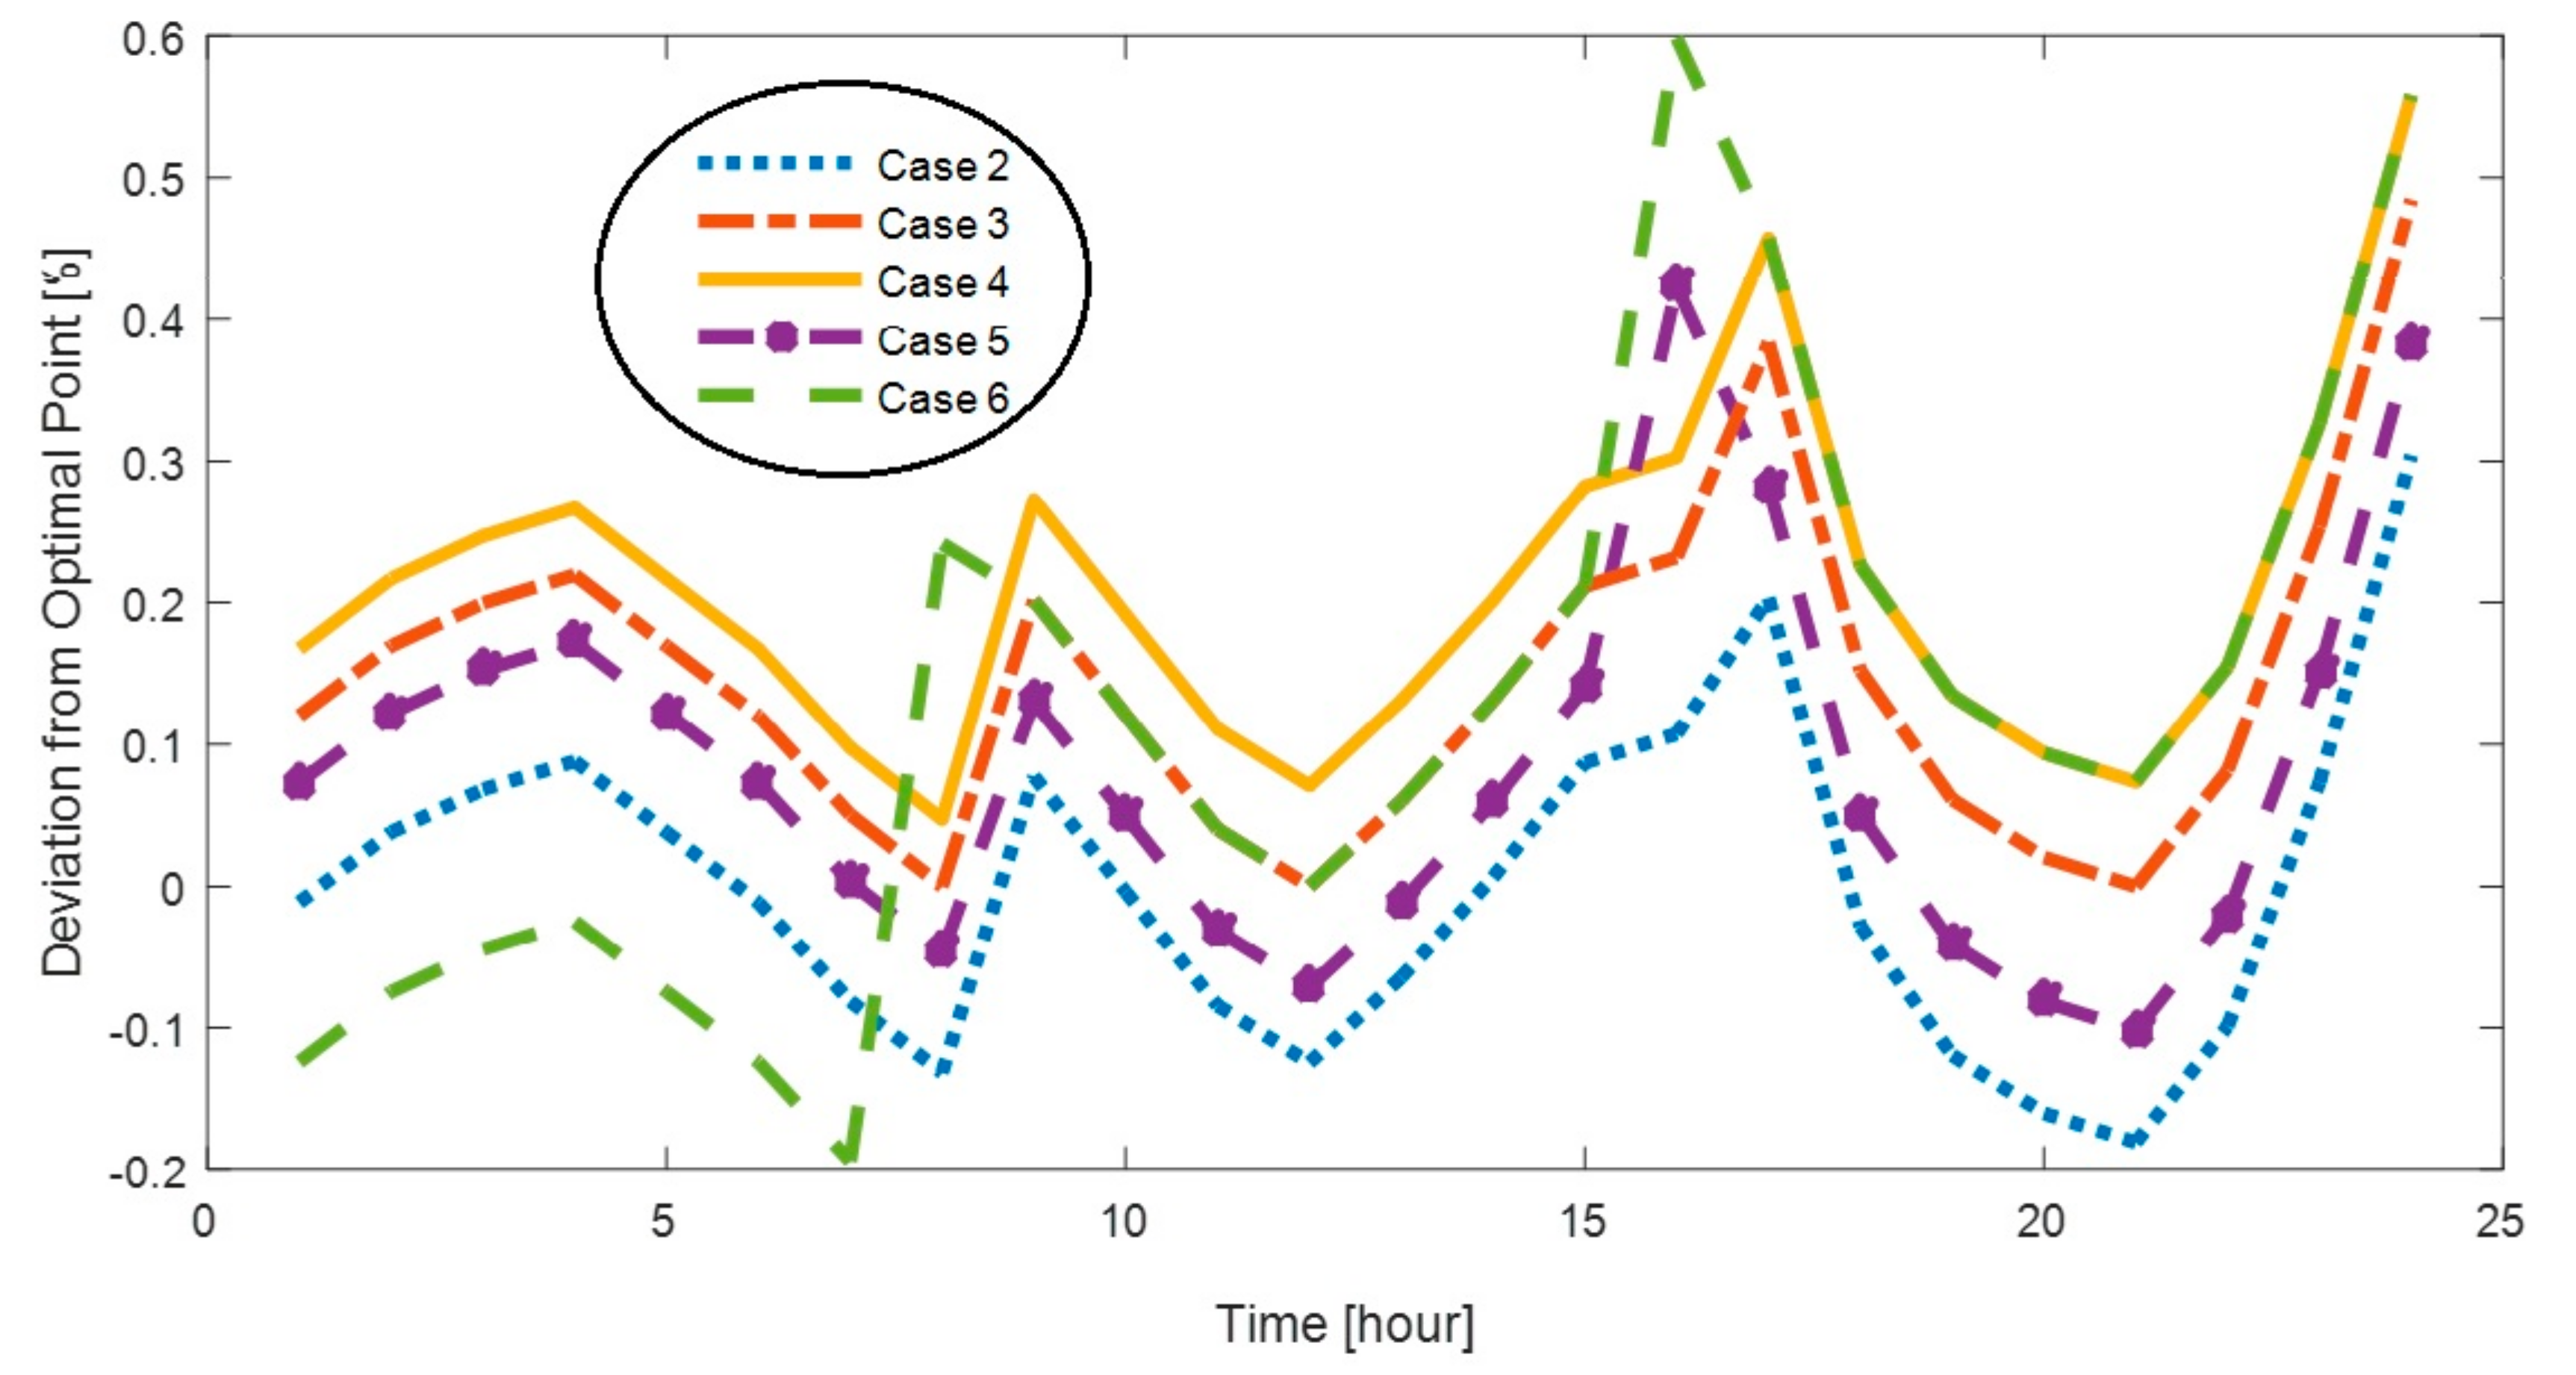
- Case (2) In this case (Figure 1) load of each level (8 h) is equal to average of the smart load demand (accurate forecast).
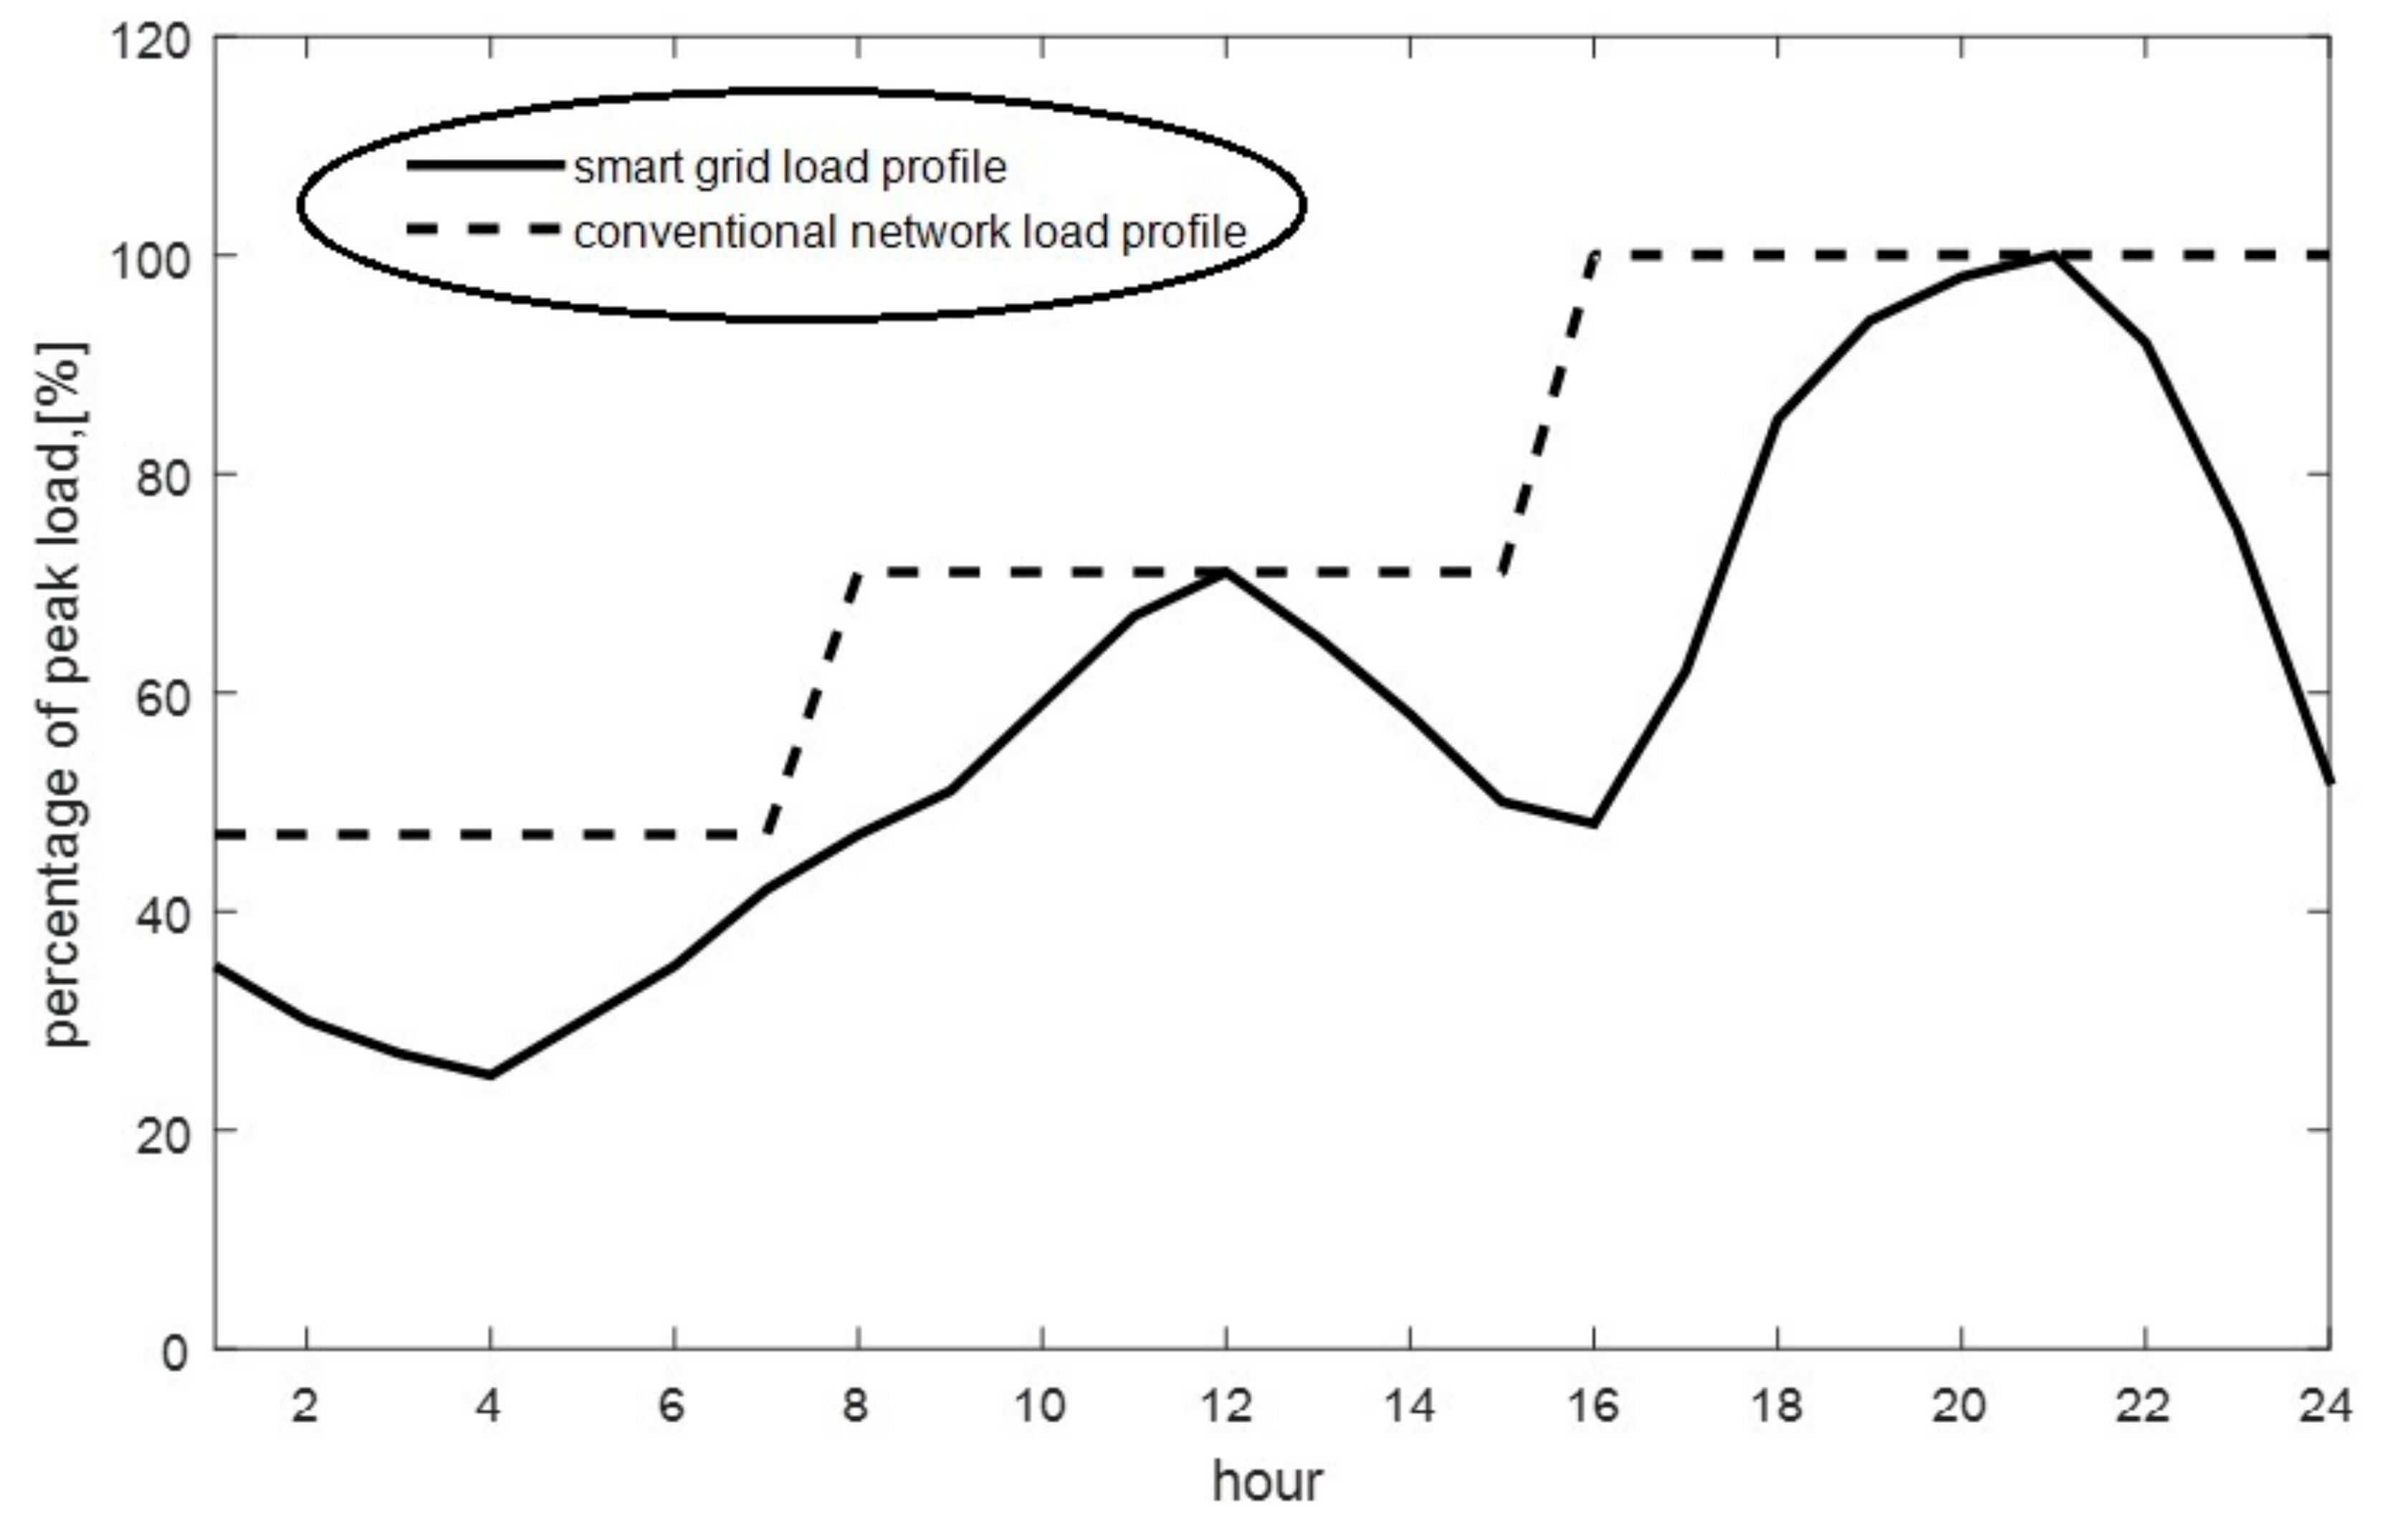
- Case (3) In this case, the load value of each level is considered equal to actual peak load value at that level and is shown in Figure 2 (correct forecasting with covering the worst load condition). Case 3 is more logical than the Case 2.
- Case (4) The estimated demand is 10% more than the three-level demand model in case 3 (Case 4 has a forecasting error).
- Case (5) The estimated load is 10% less than in the three-level load demand in case 3. (Case 5 has a forecasting error).
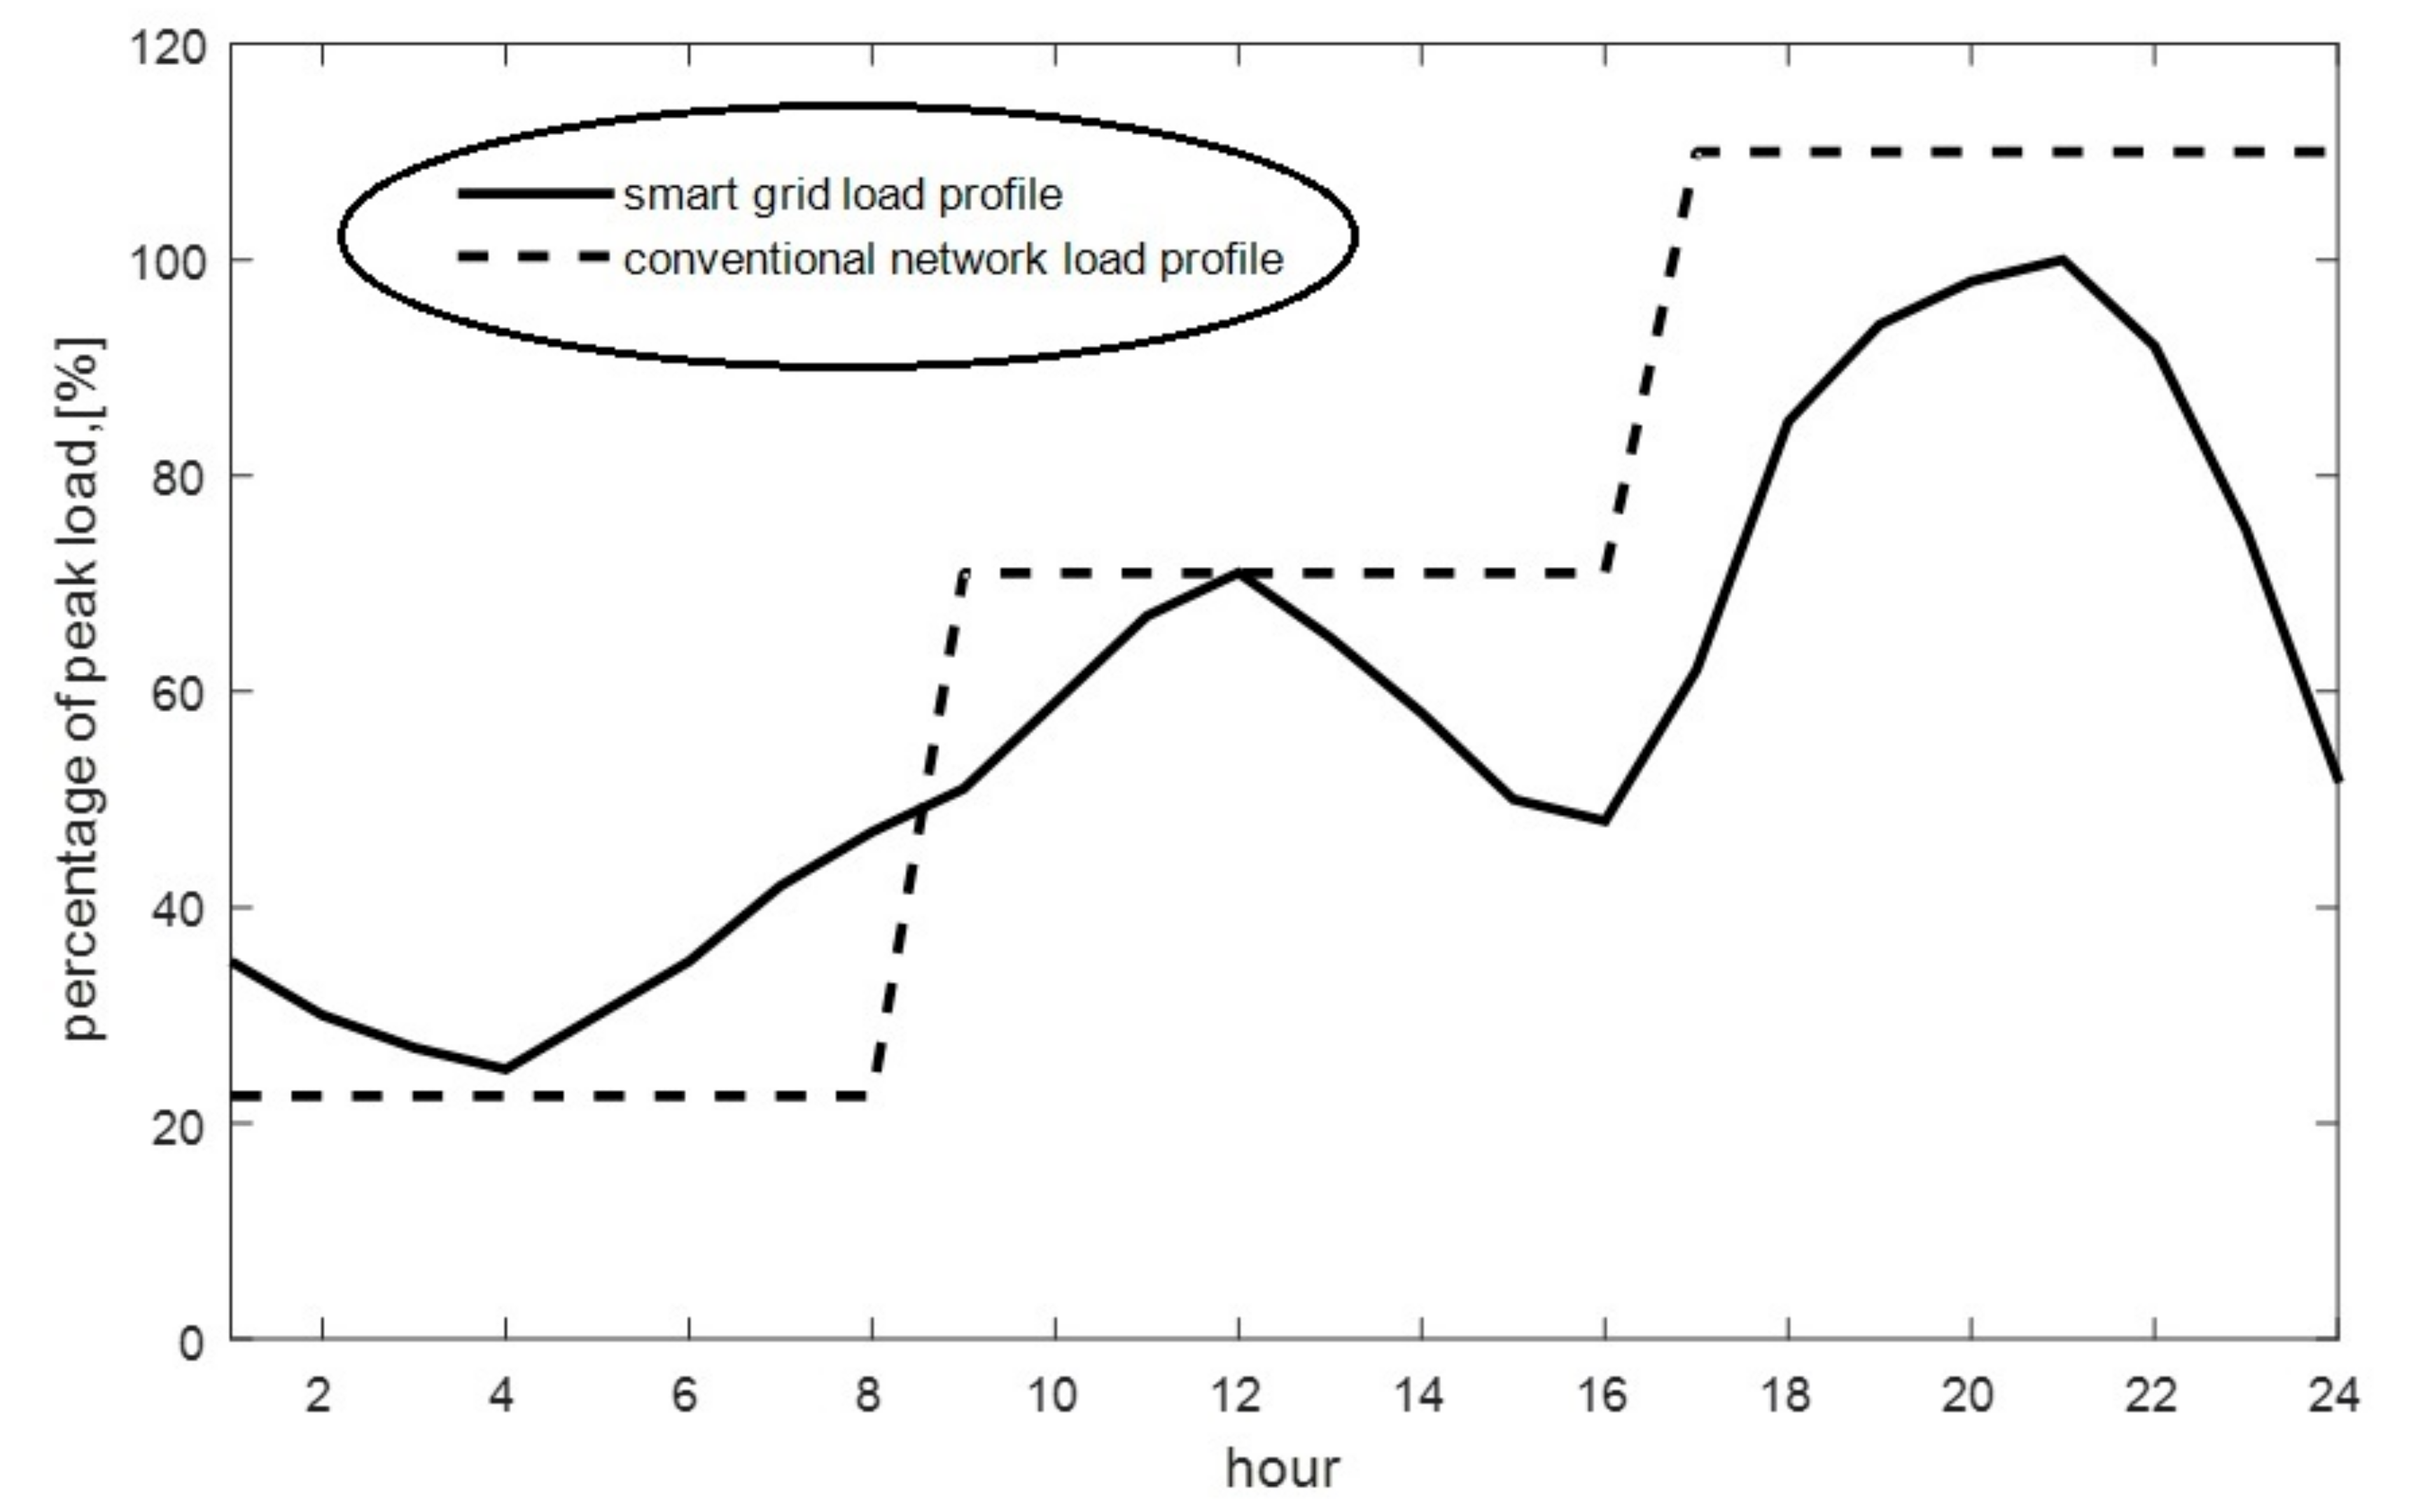
- Case (6) This case is a combination of different modes so that in the first level the load forecast is equal to 10% less than the lowest demand value, in the second level the load forecast is equal to the peak load value and in the third level the load forecast is 25% more than the maximum. This case is illustrated in Figure 3.
4. Proposed Optimization Method
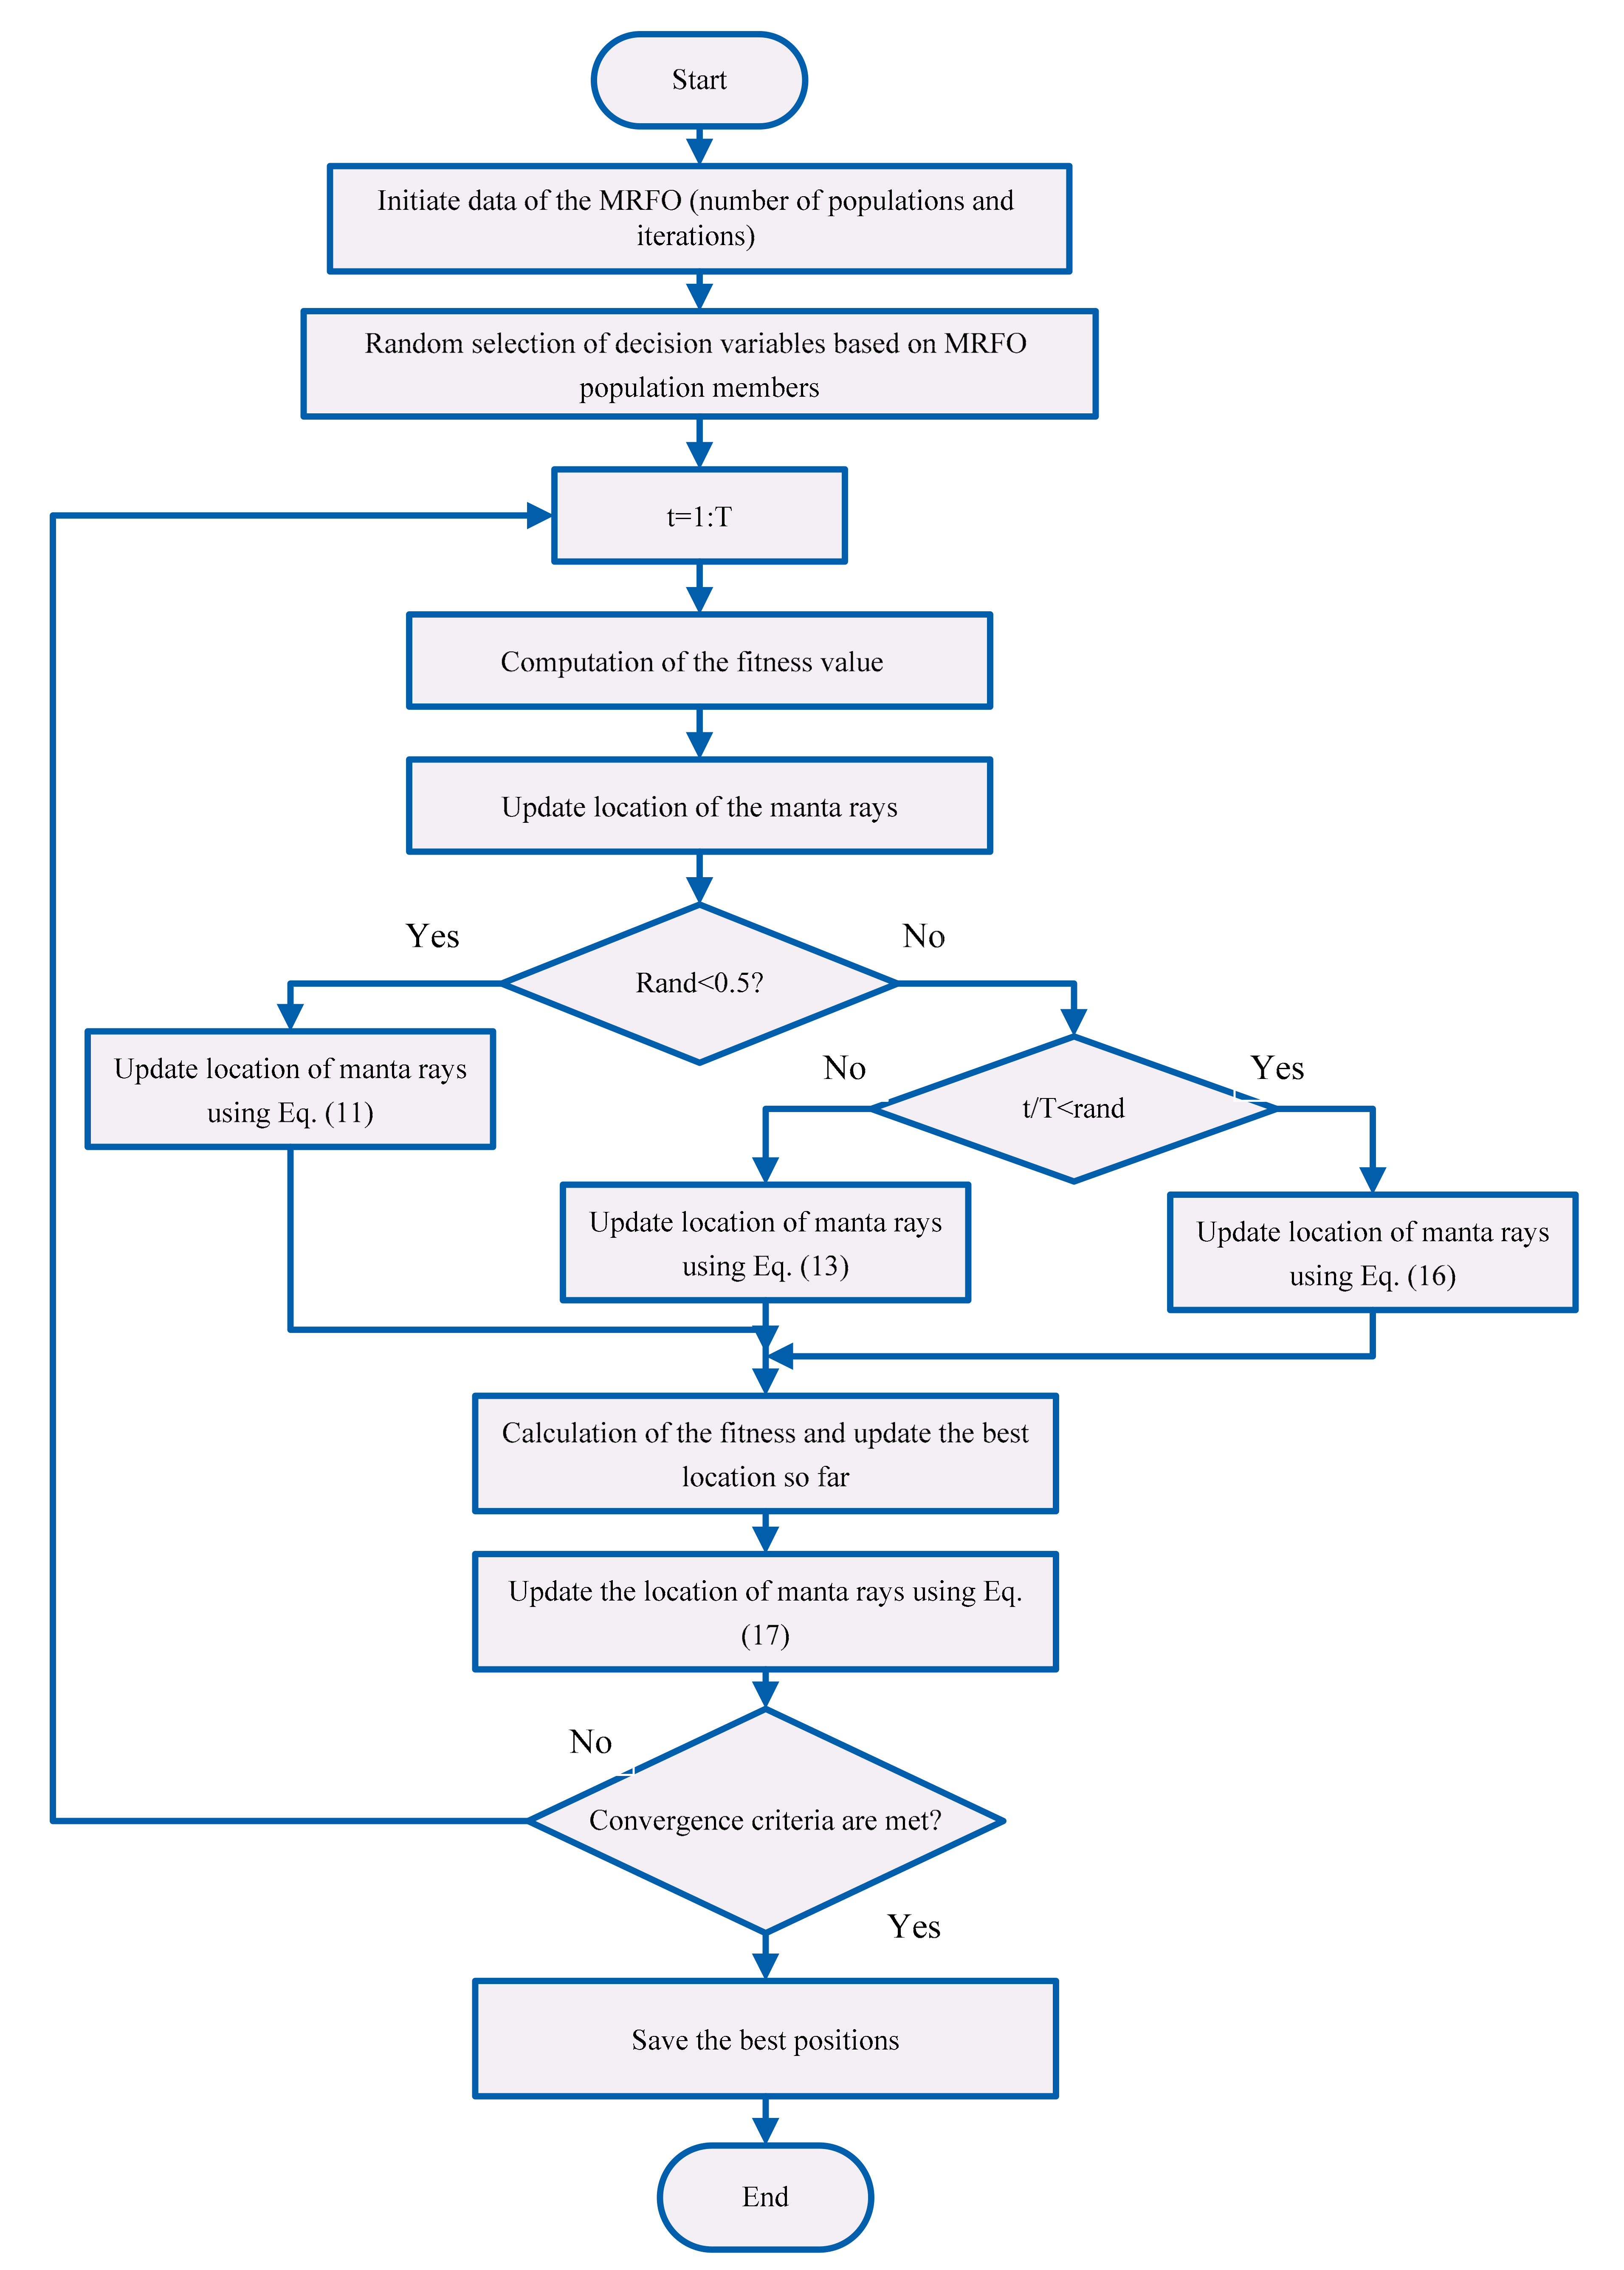
4.1. Introduction of MRFO Method
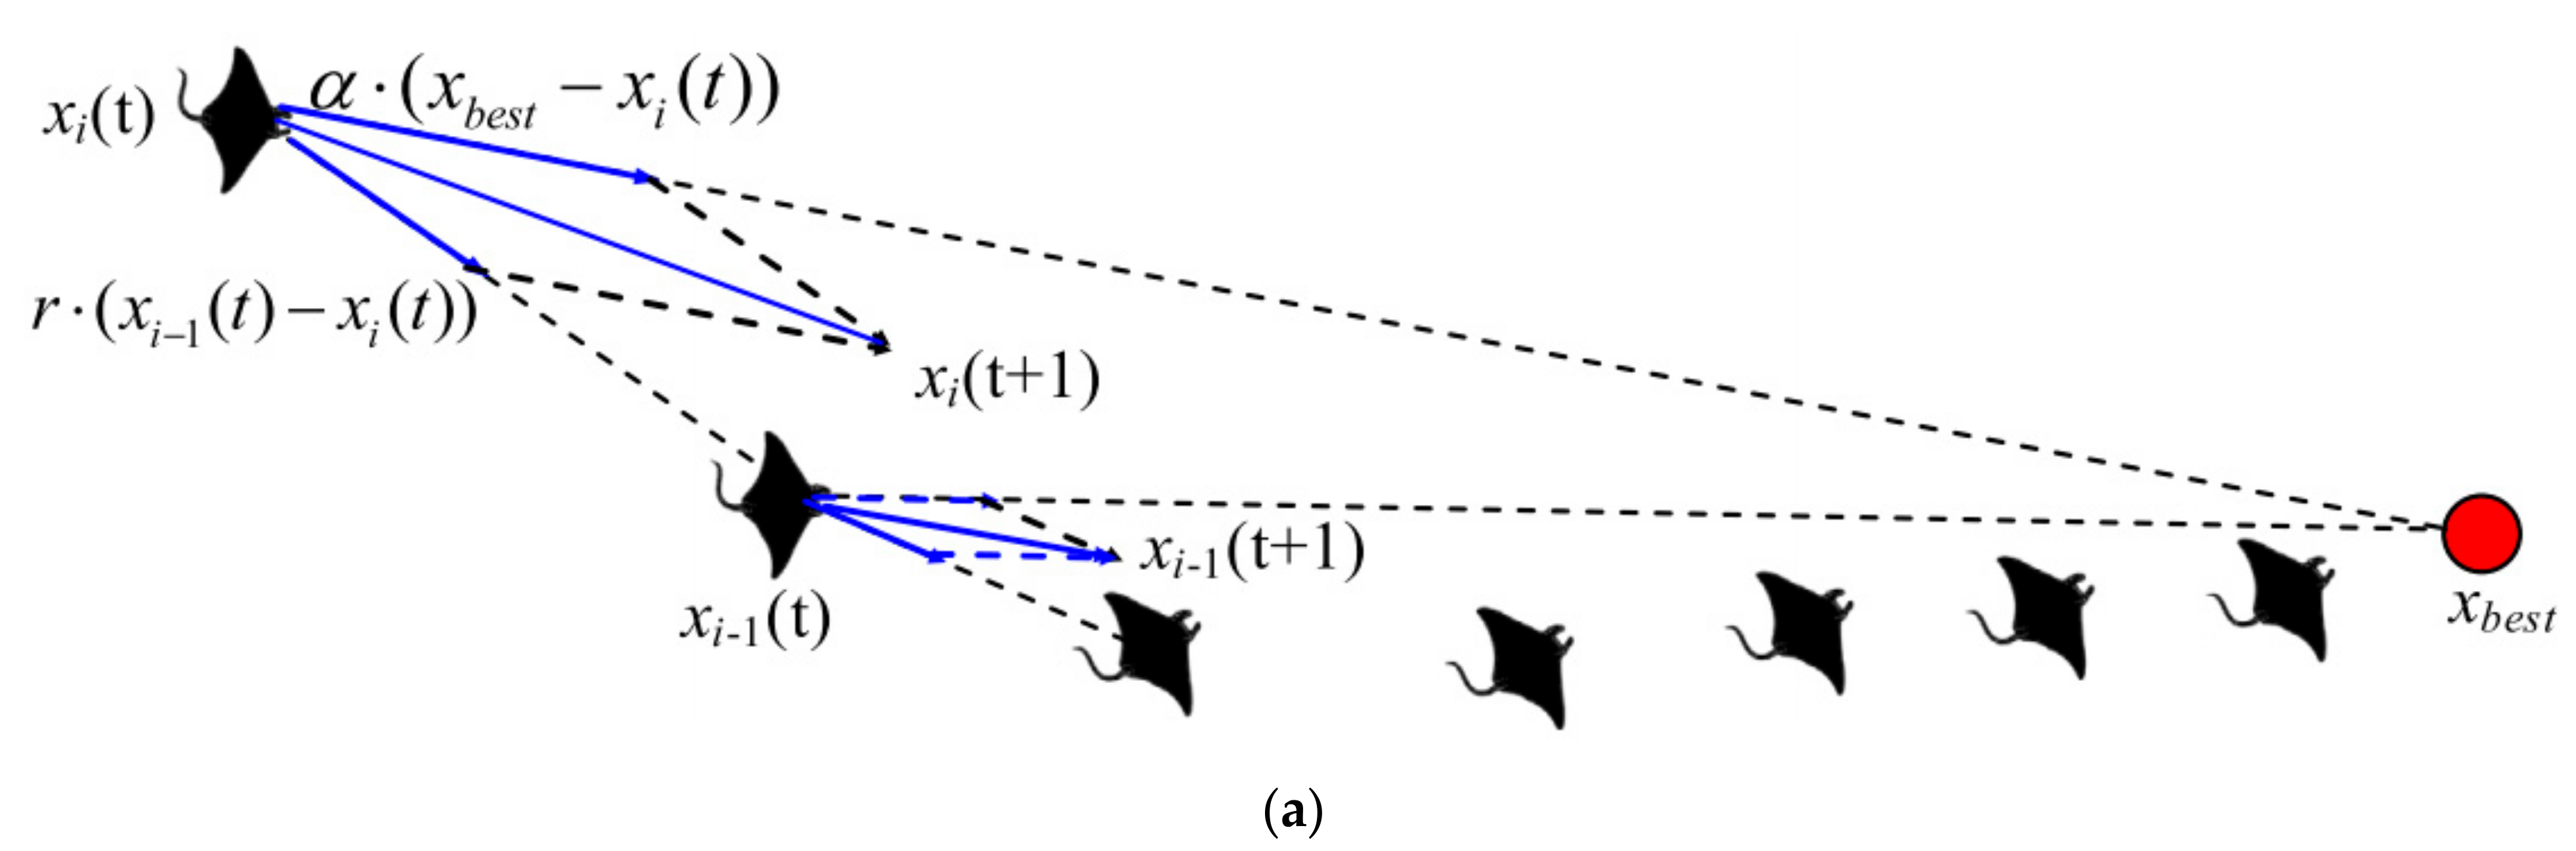
4.1.1. Foraging with Chain Strategy
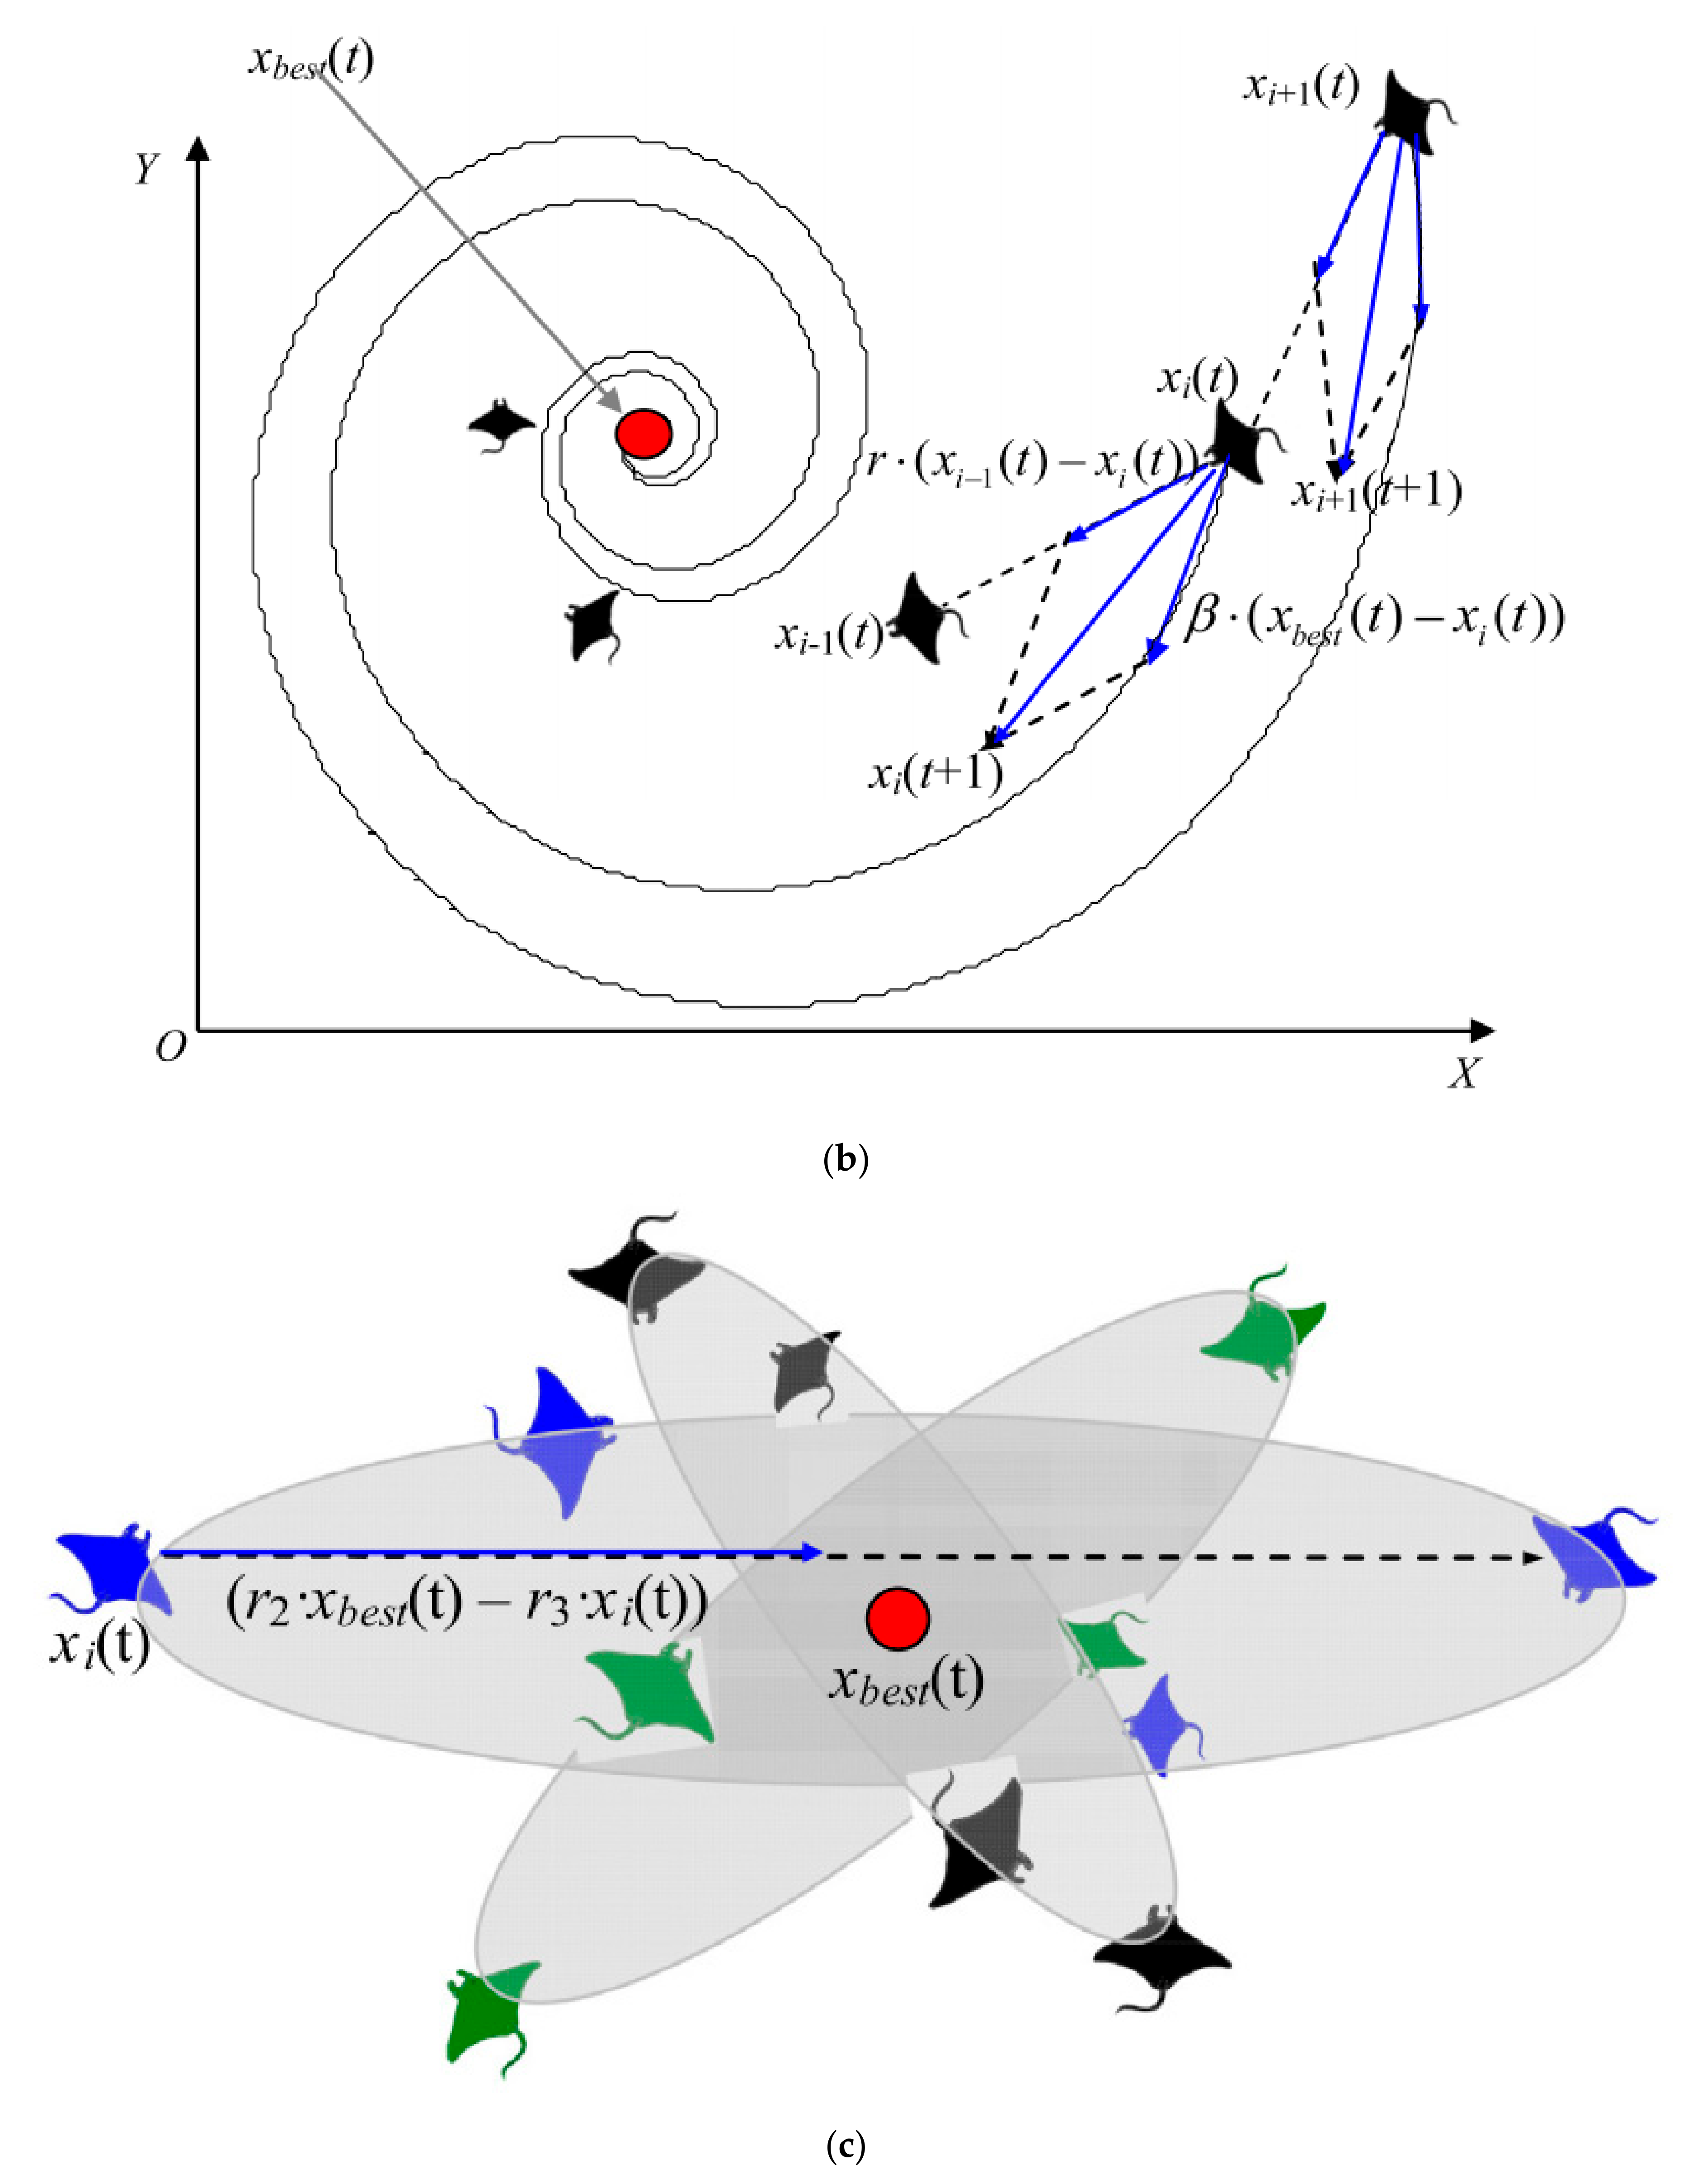
4.1.2. Foraging with Cyclone Strategy
4.1.3. Foraging with Somersault Strategy
4.2. MRFO Based Planning
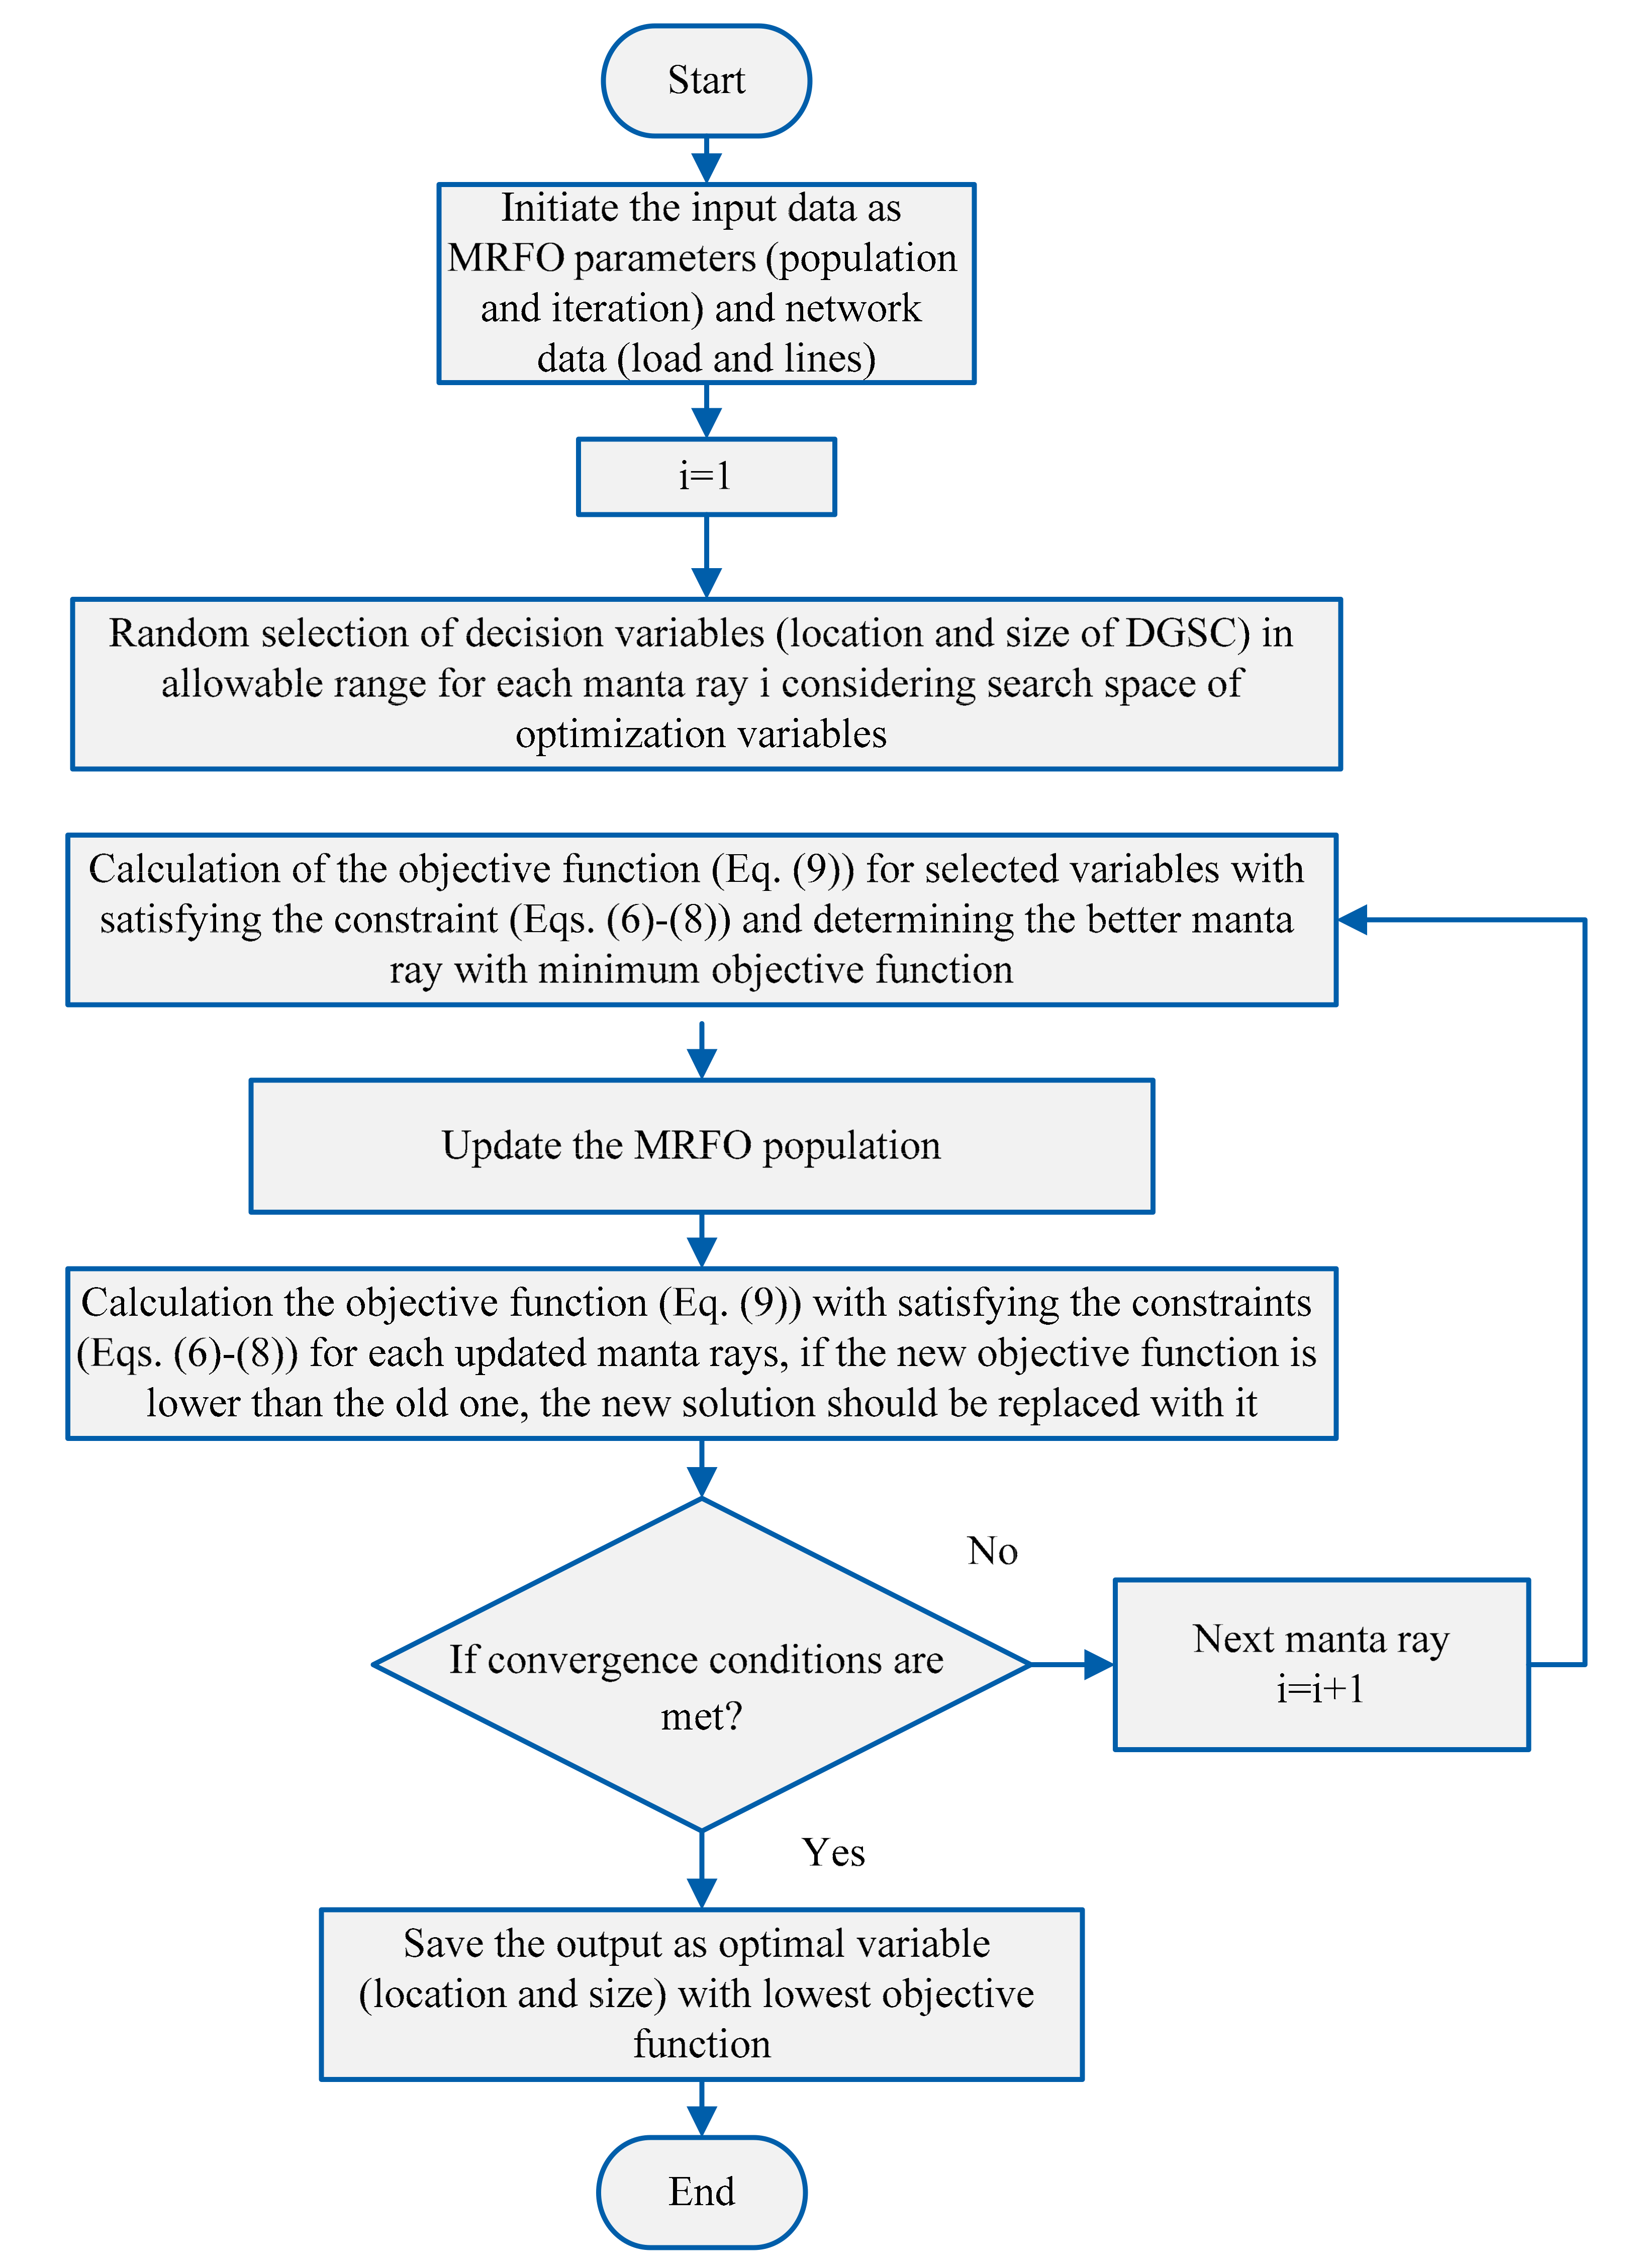
- (Step 1) The data of the distribution network including loads and lines data, location and maximum size of DGSCs (obtained from the DGSCs allocation problem) as well as the load model are applied to the program based on the MRFO method. The parameters of the MRFO are also set. The population, maximum iteration and also repetition are considered 50, 100 and 30, respectively based on trial-and-error method.
- (Step 2) Based on the provided load cases, a load level is evaluated.
- (Step 3) In this step, the optimal planning of DGSCs is implemented. After evaluating the operating constraints, the objective function as energy losses (Equation (5)) is calculated based on the optimal operating point according to the load level considering the constraints (Equations (6)–(8)) in step 2.
- (Step 4) All the load levels are checked. In this case, go to next step, otherwise step 2 must be performed.
- (Step 5) The objective function as energy losses (Equation (5)) is determined for 24-h for the network.
- (Step 6) The optimal distribution of the DGSCs power is determined and stop the algorithm.
5. Simulation Results
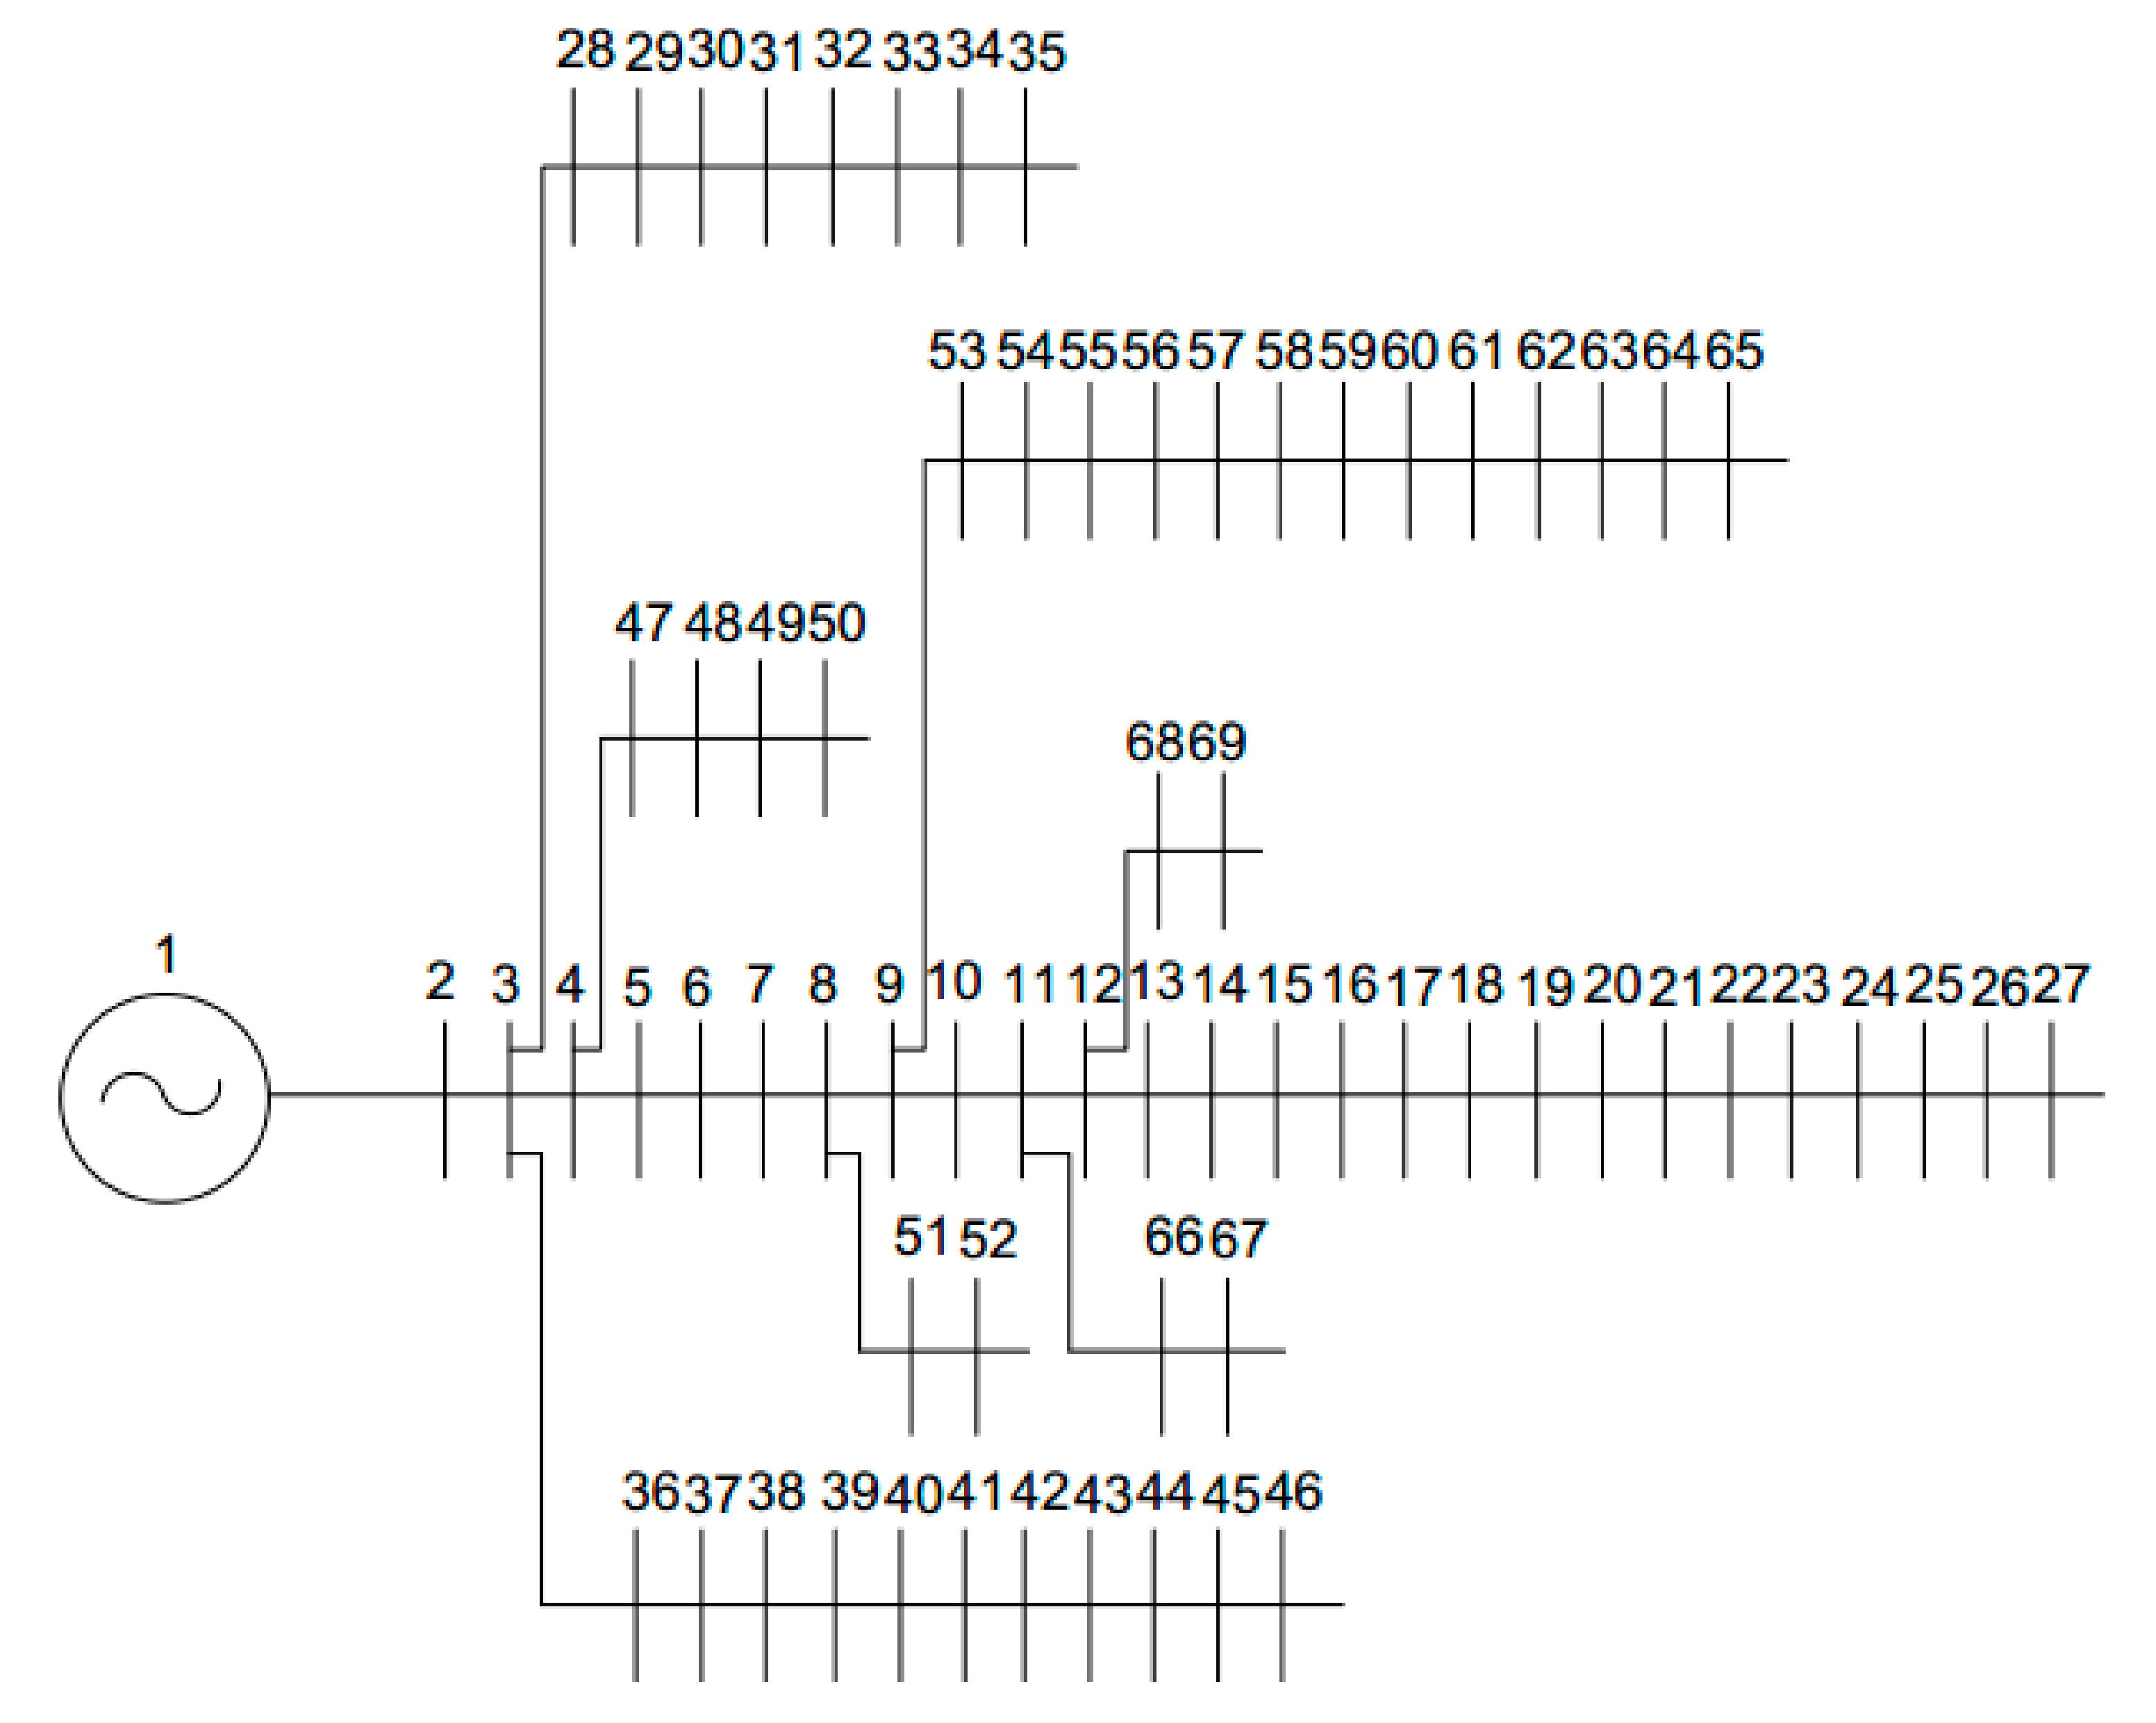
5.1. Network Data
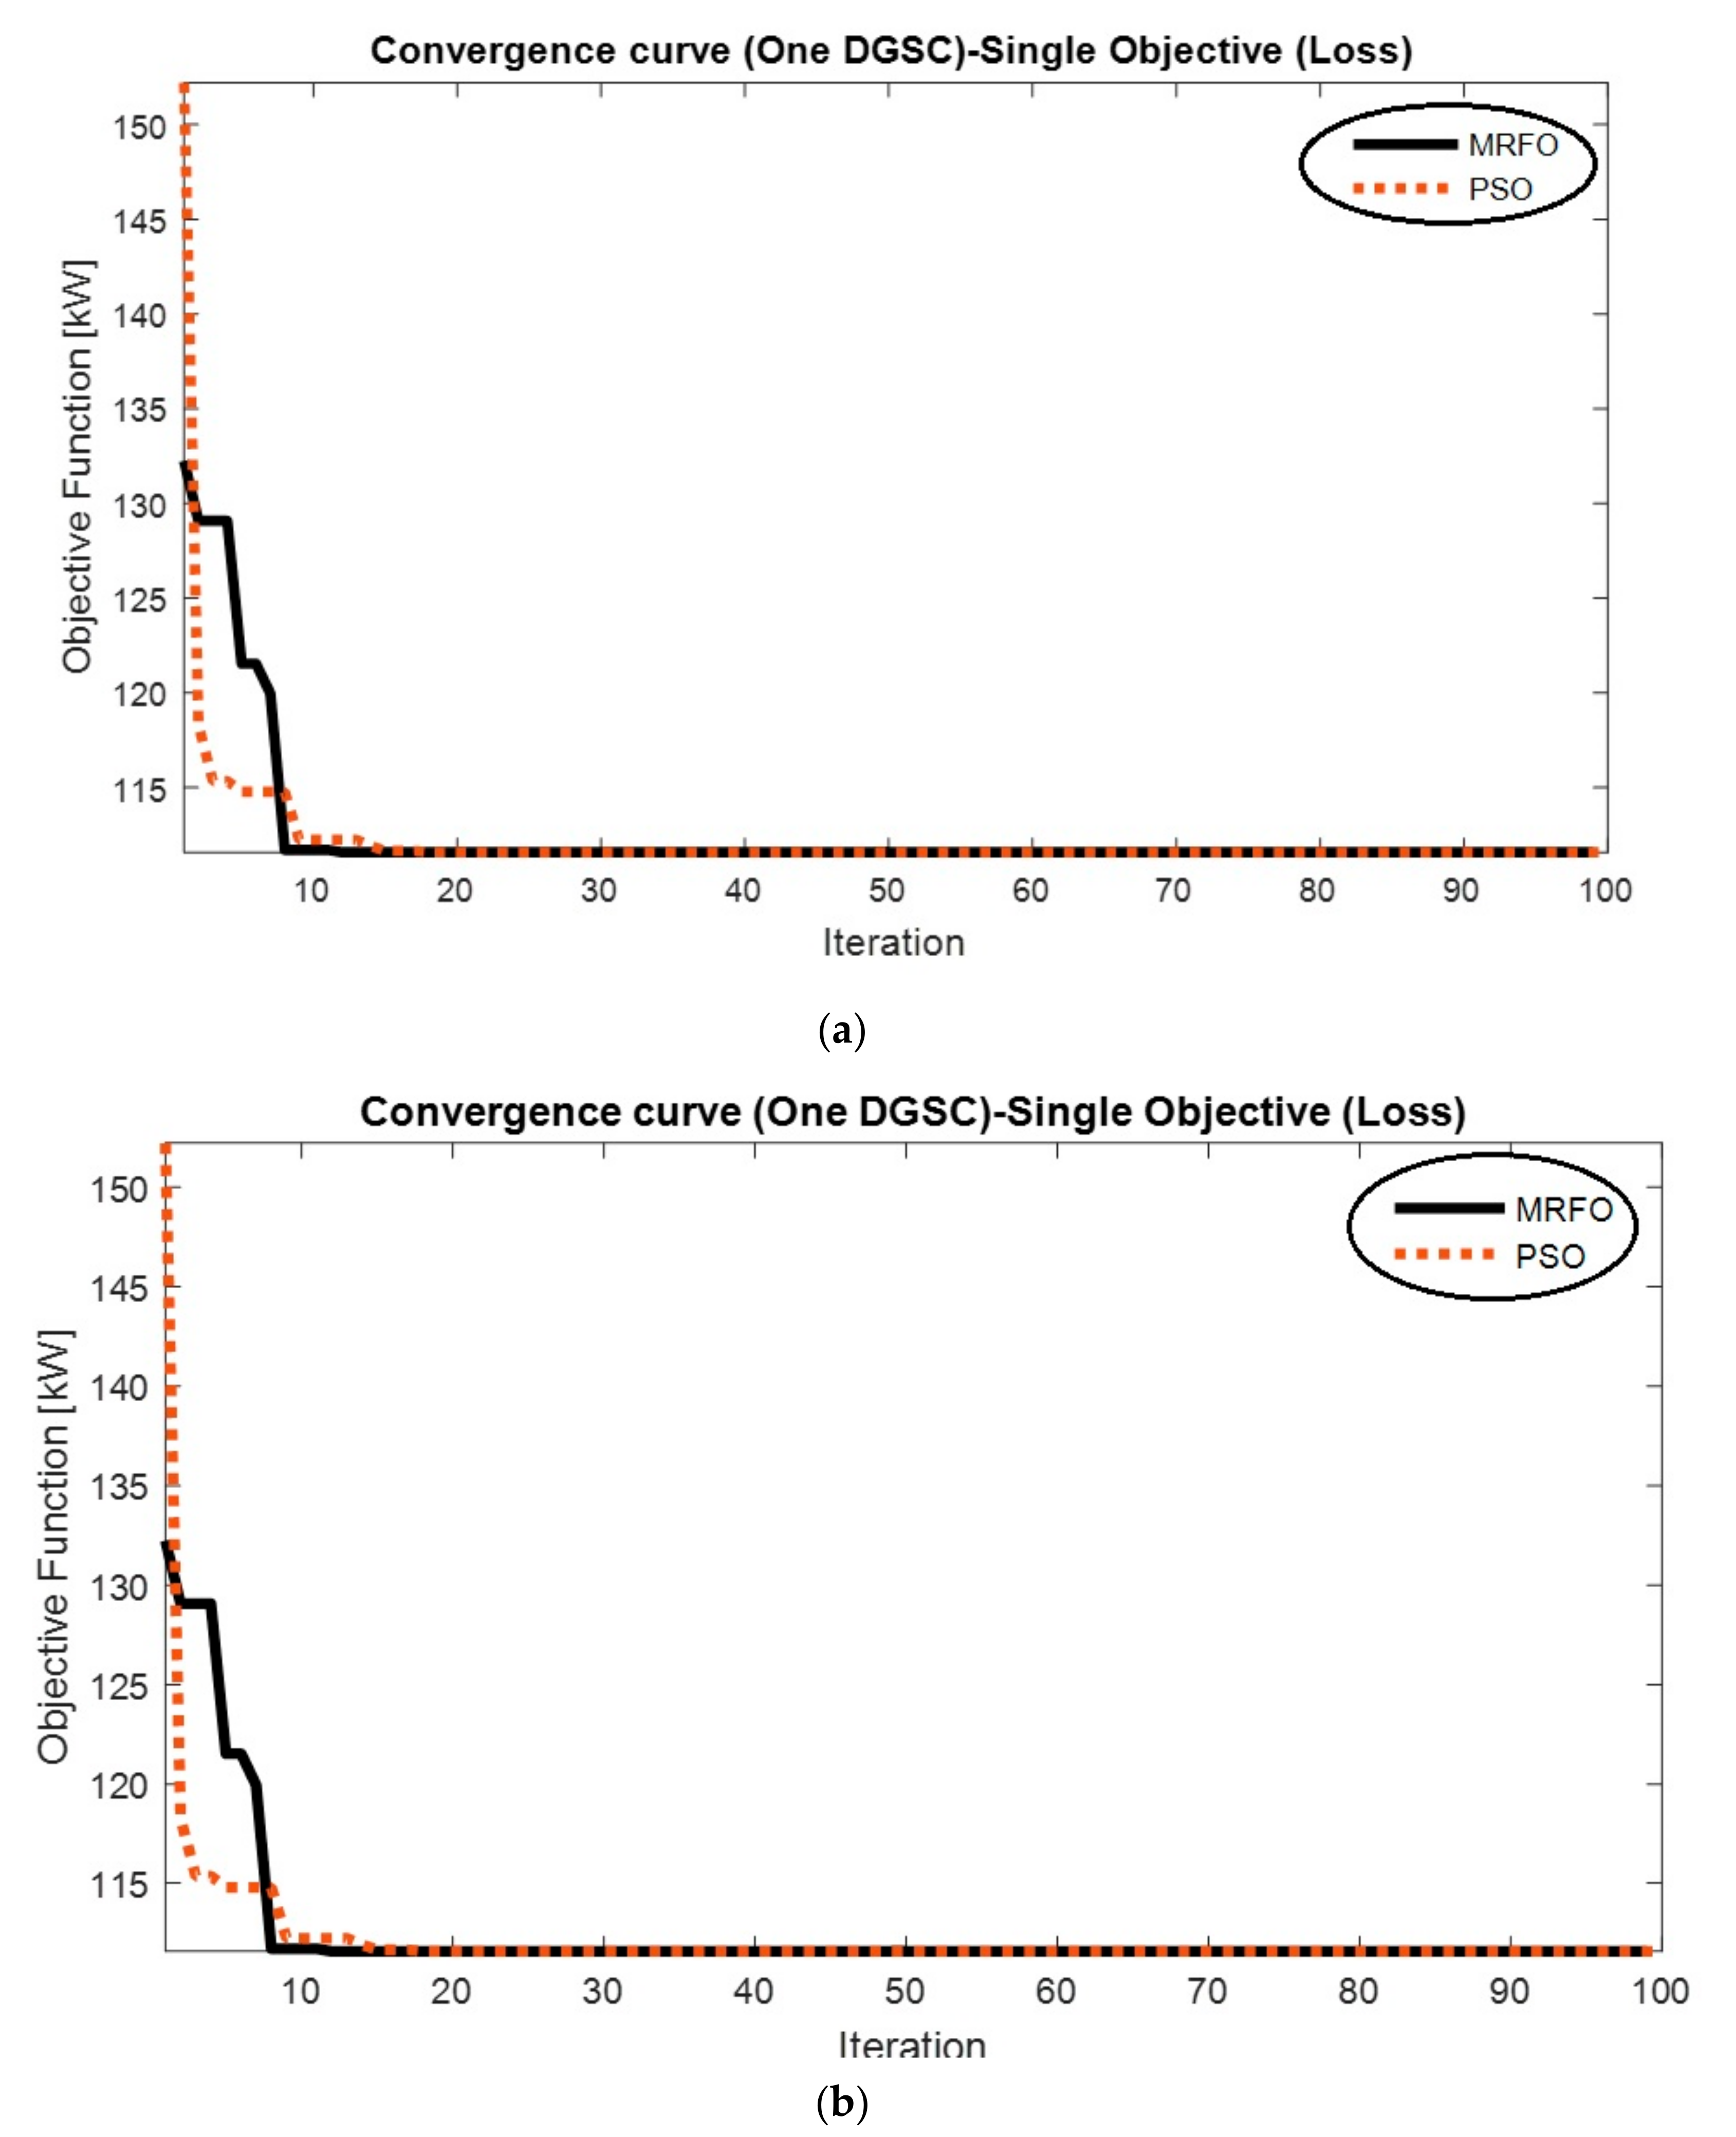
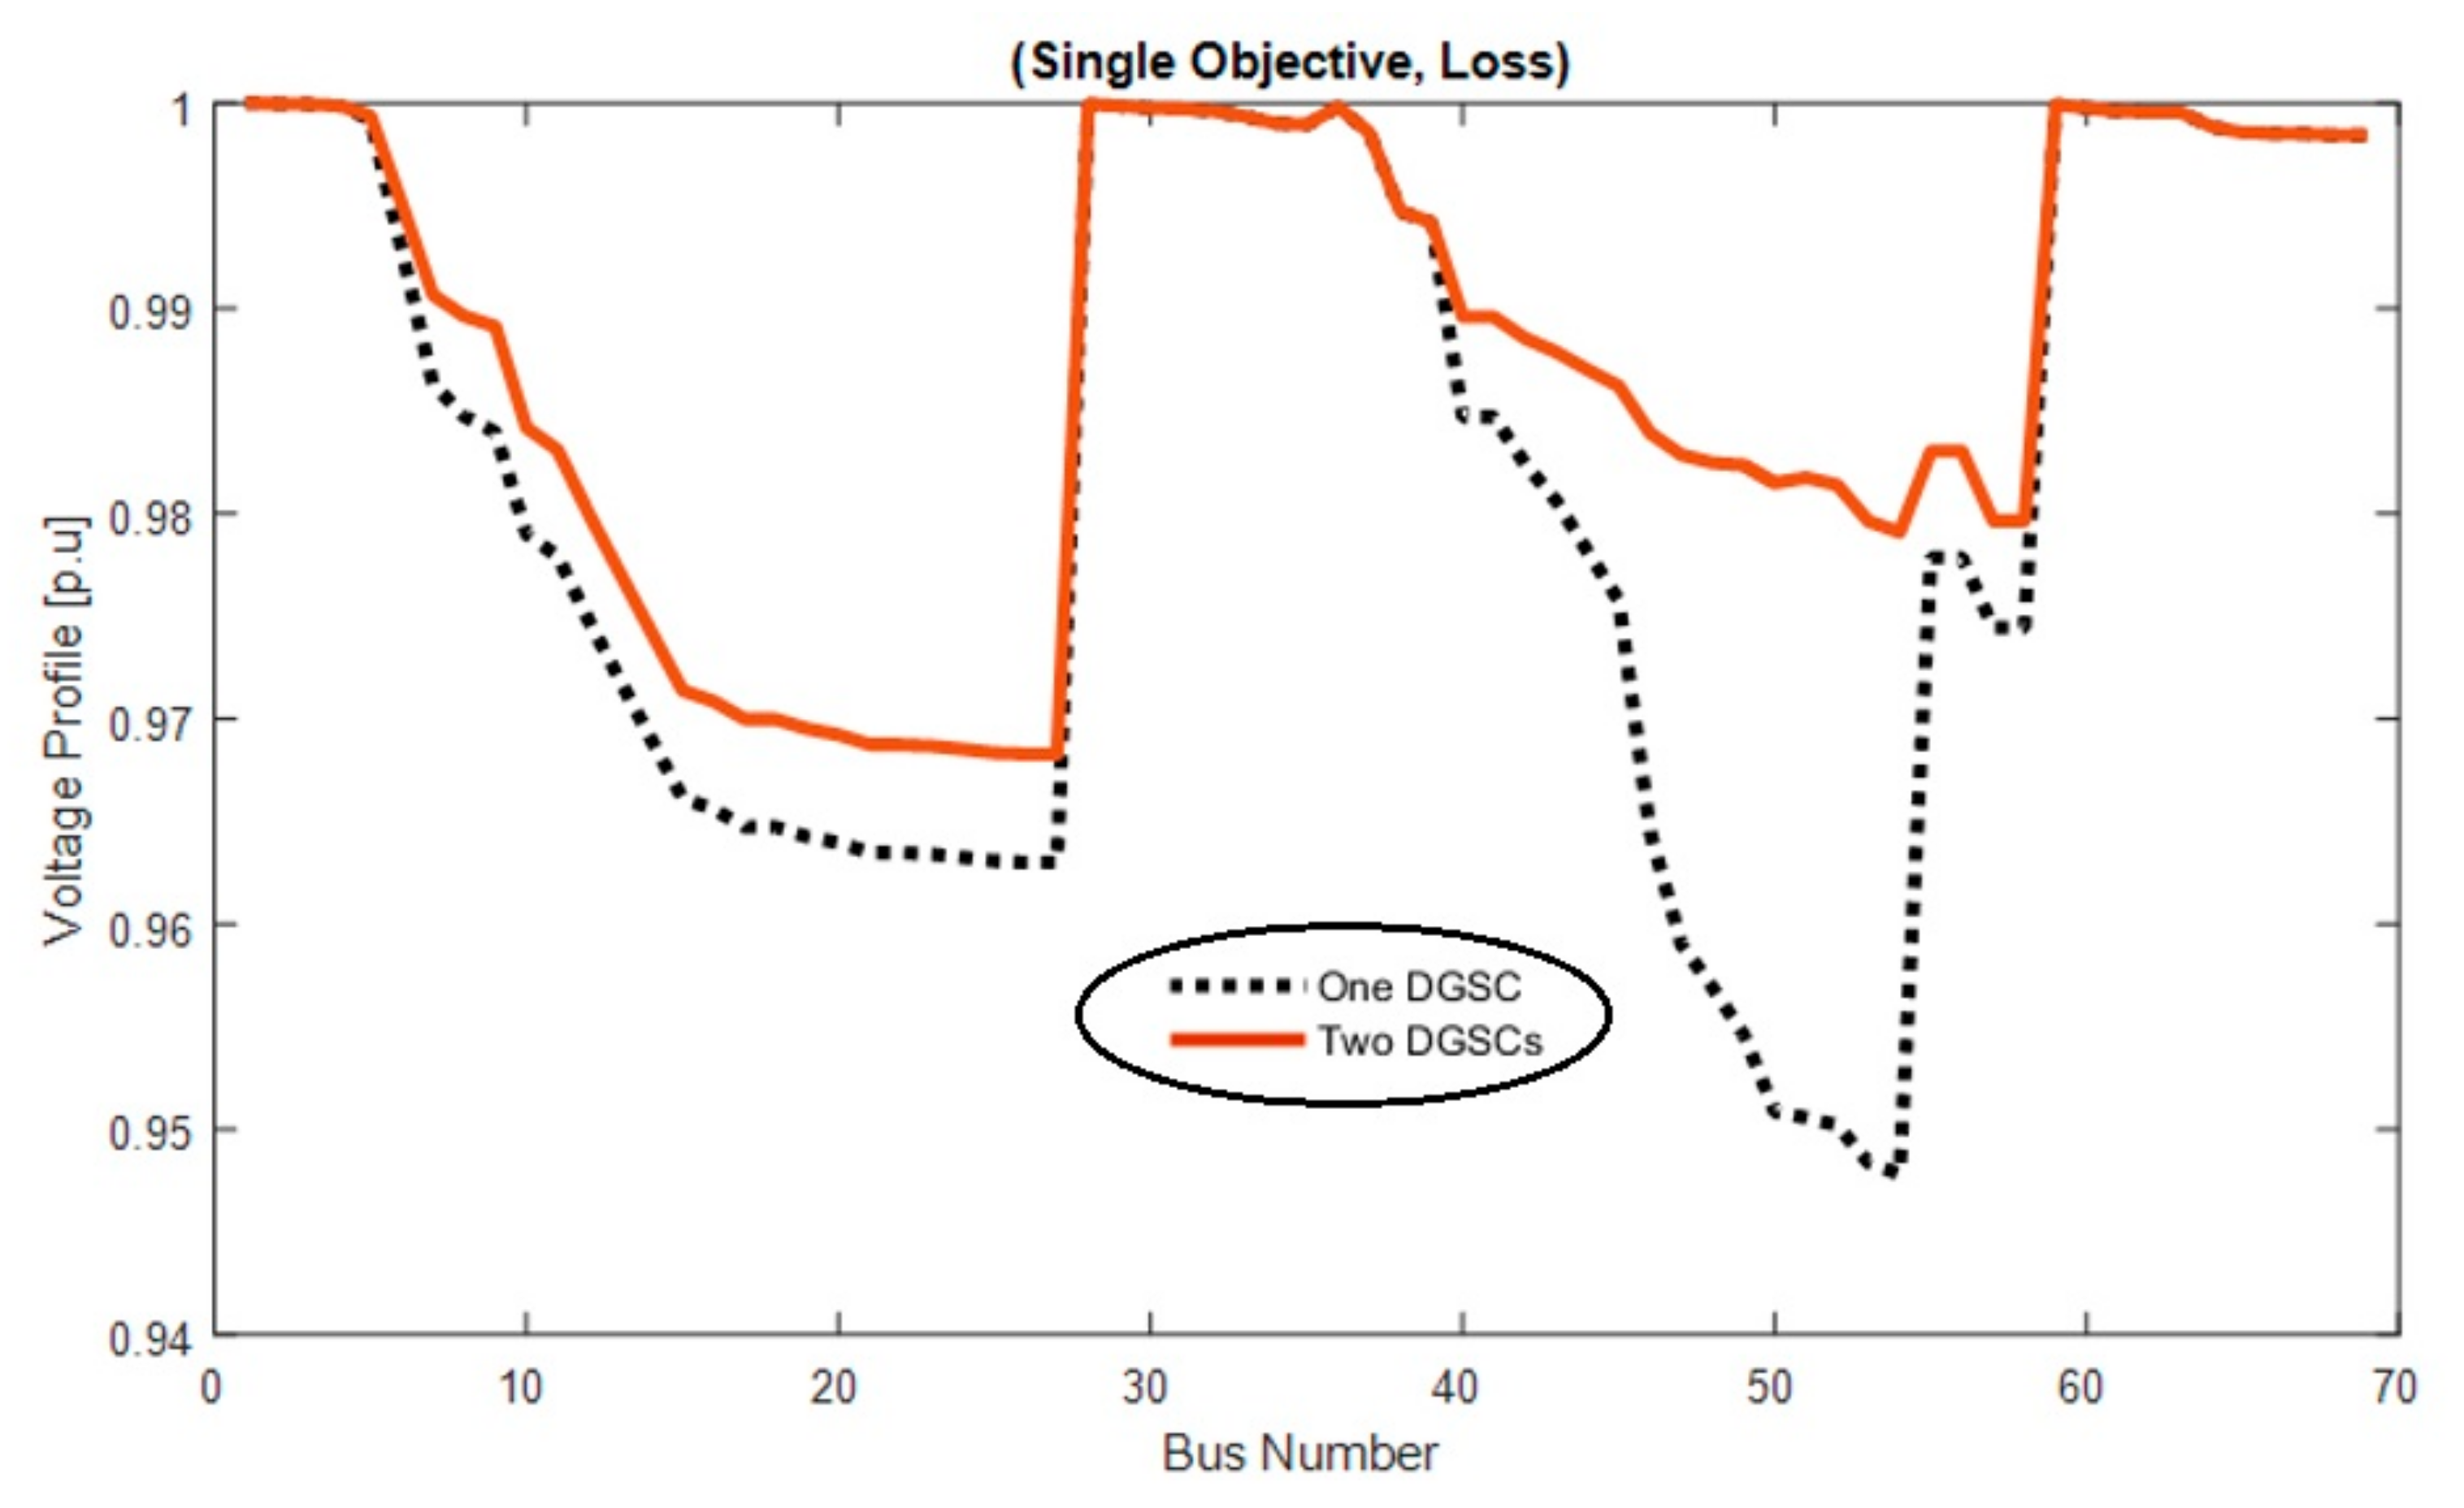
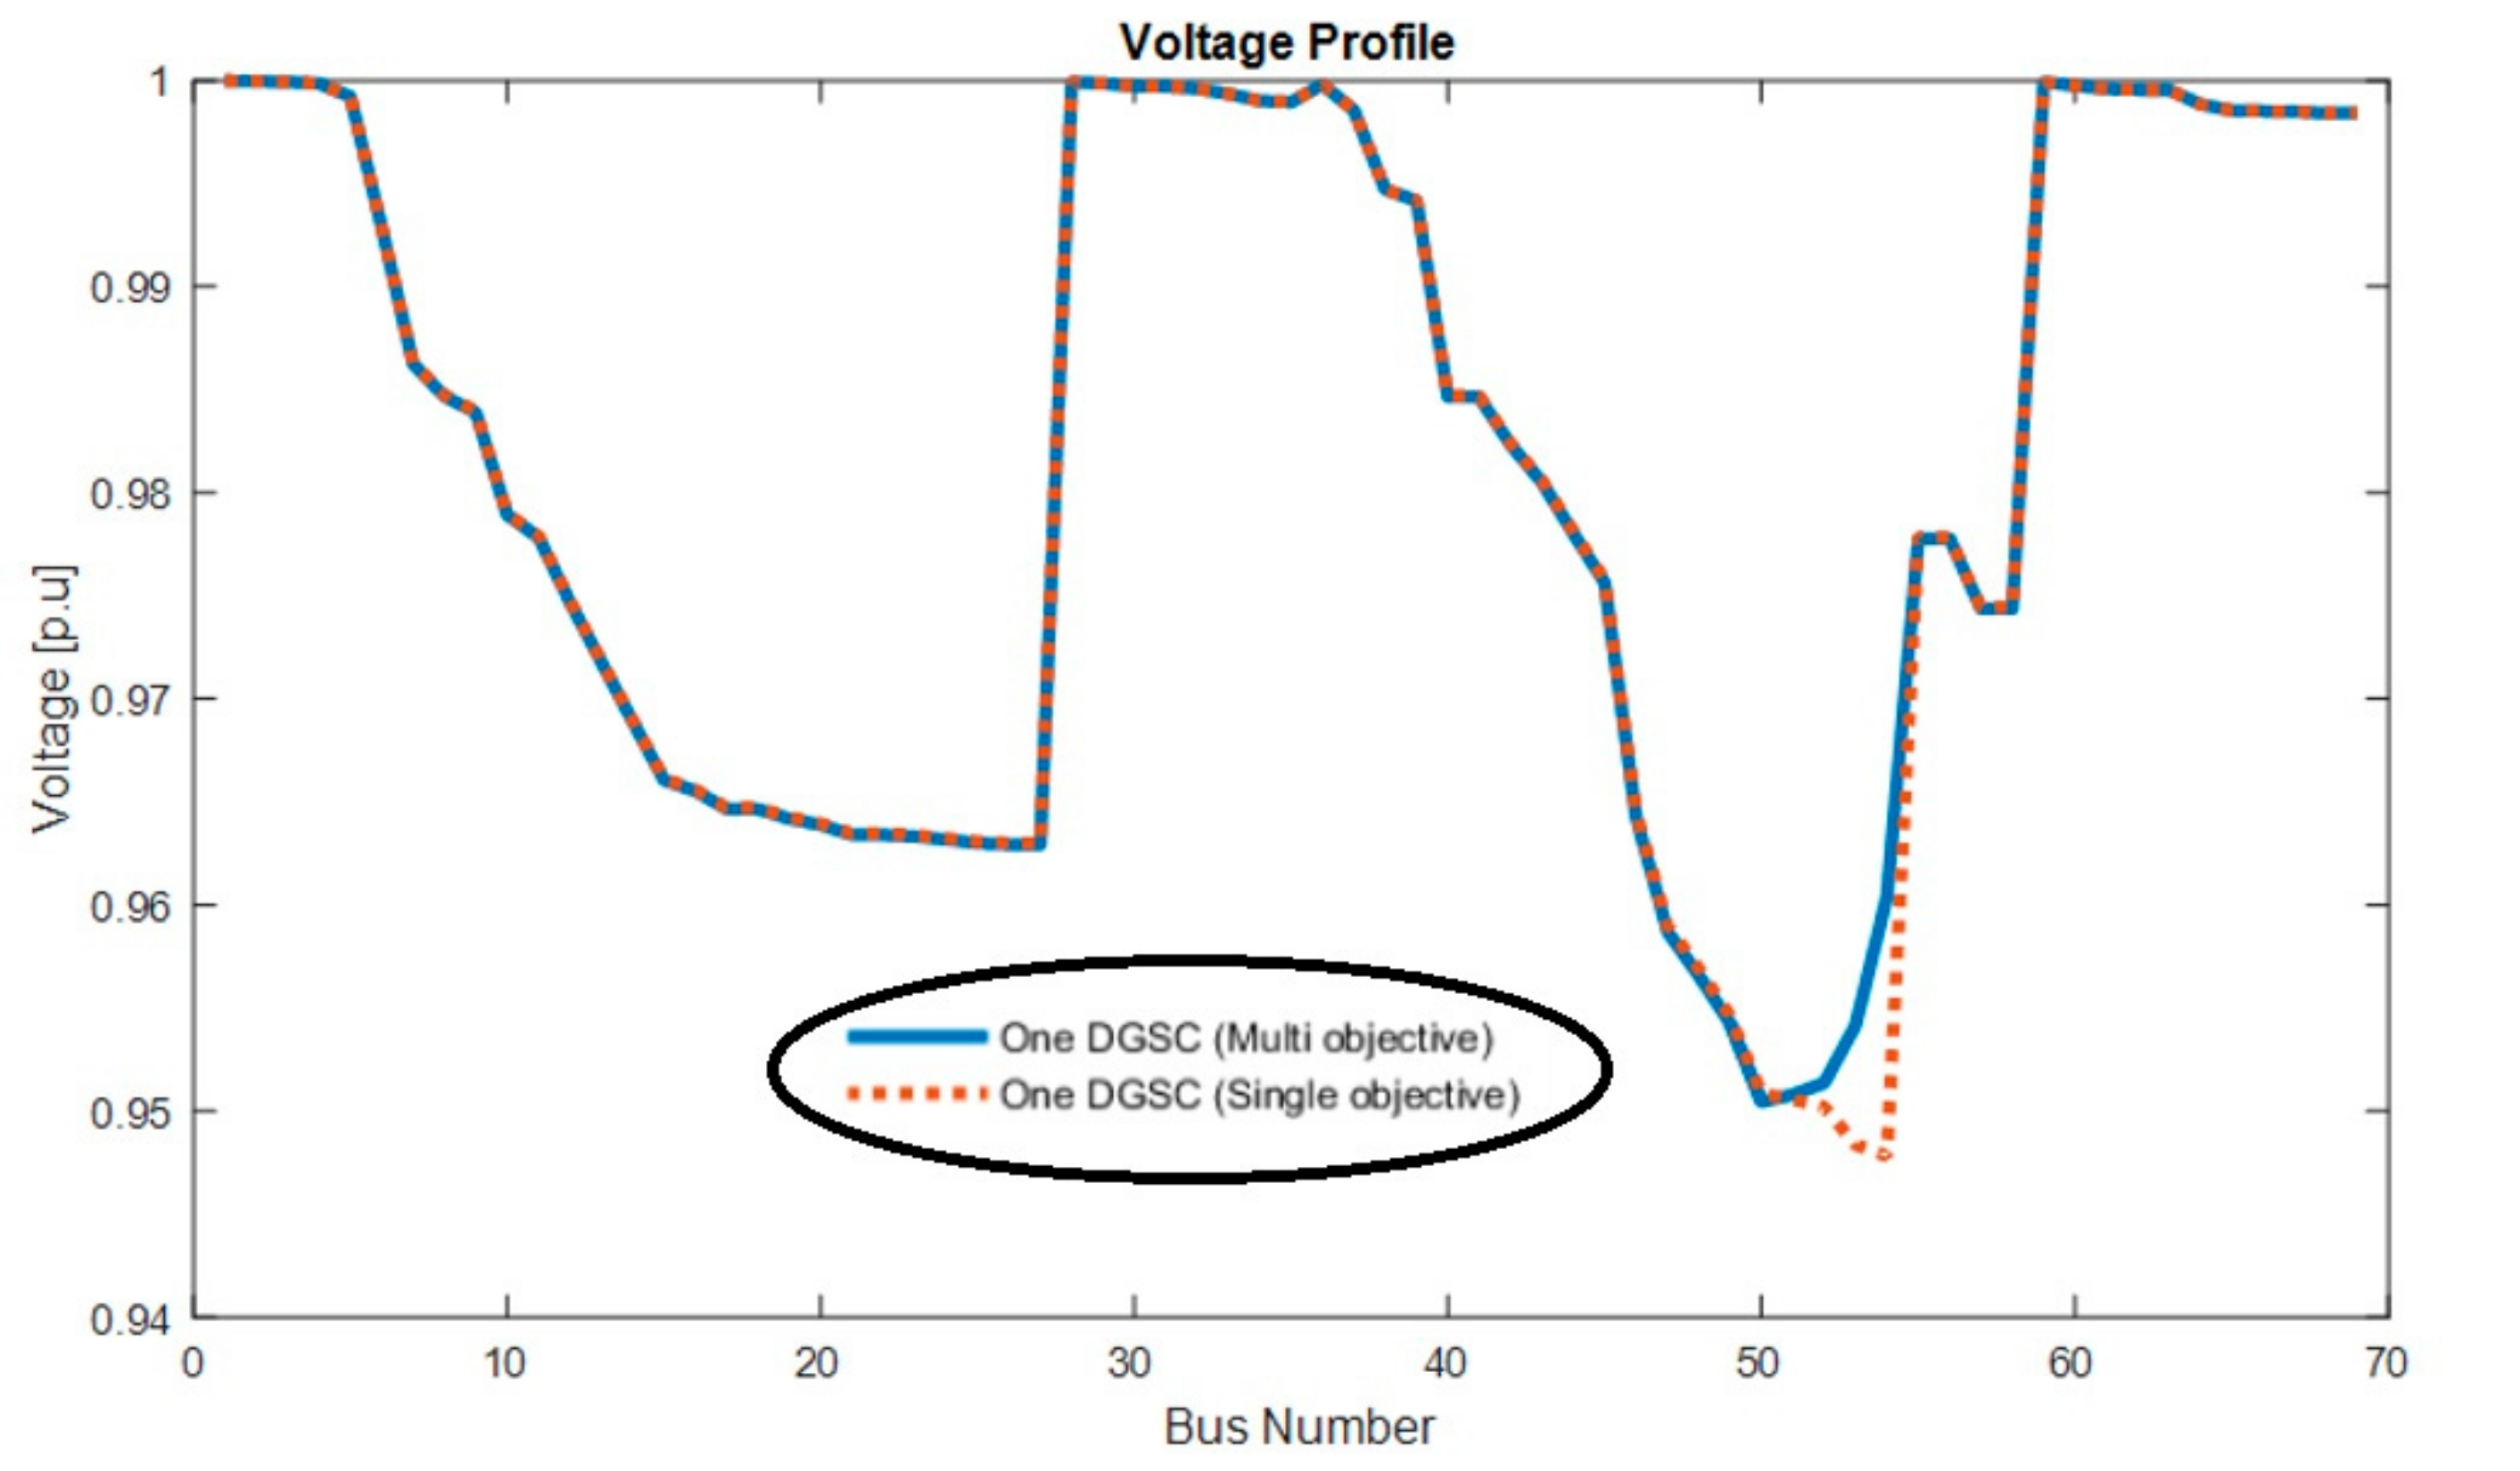
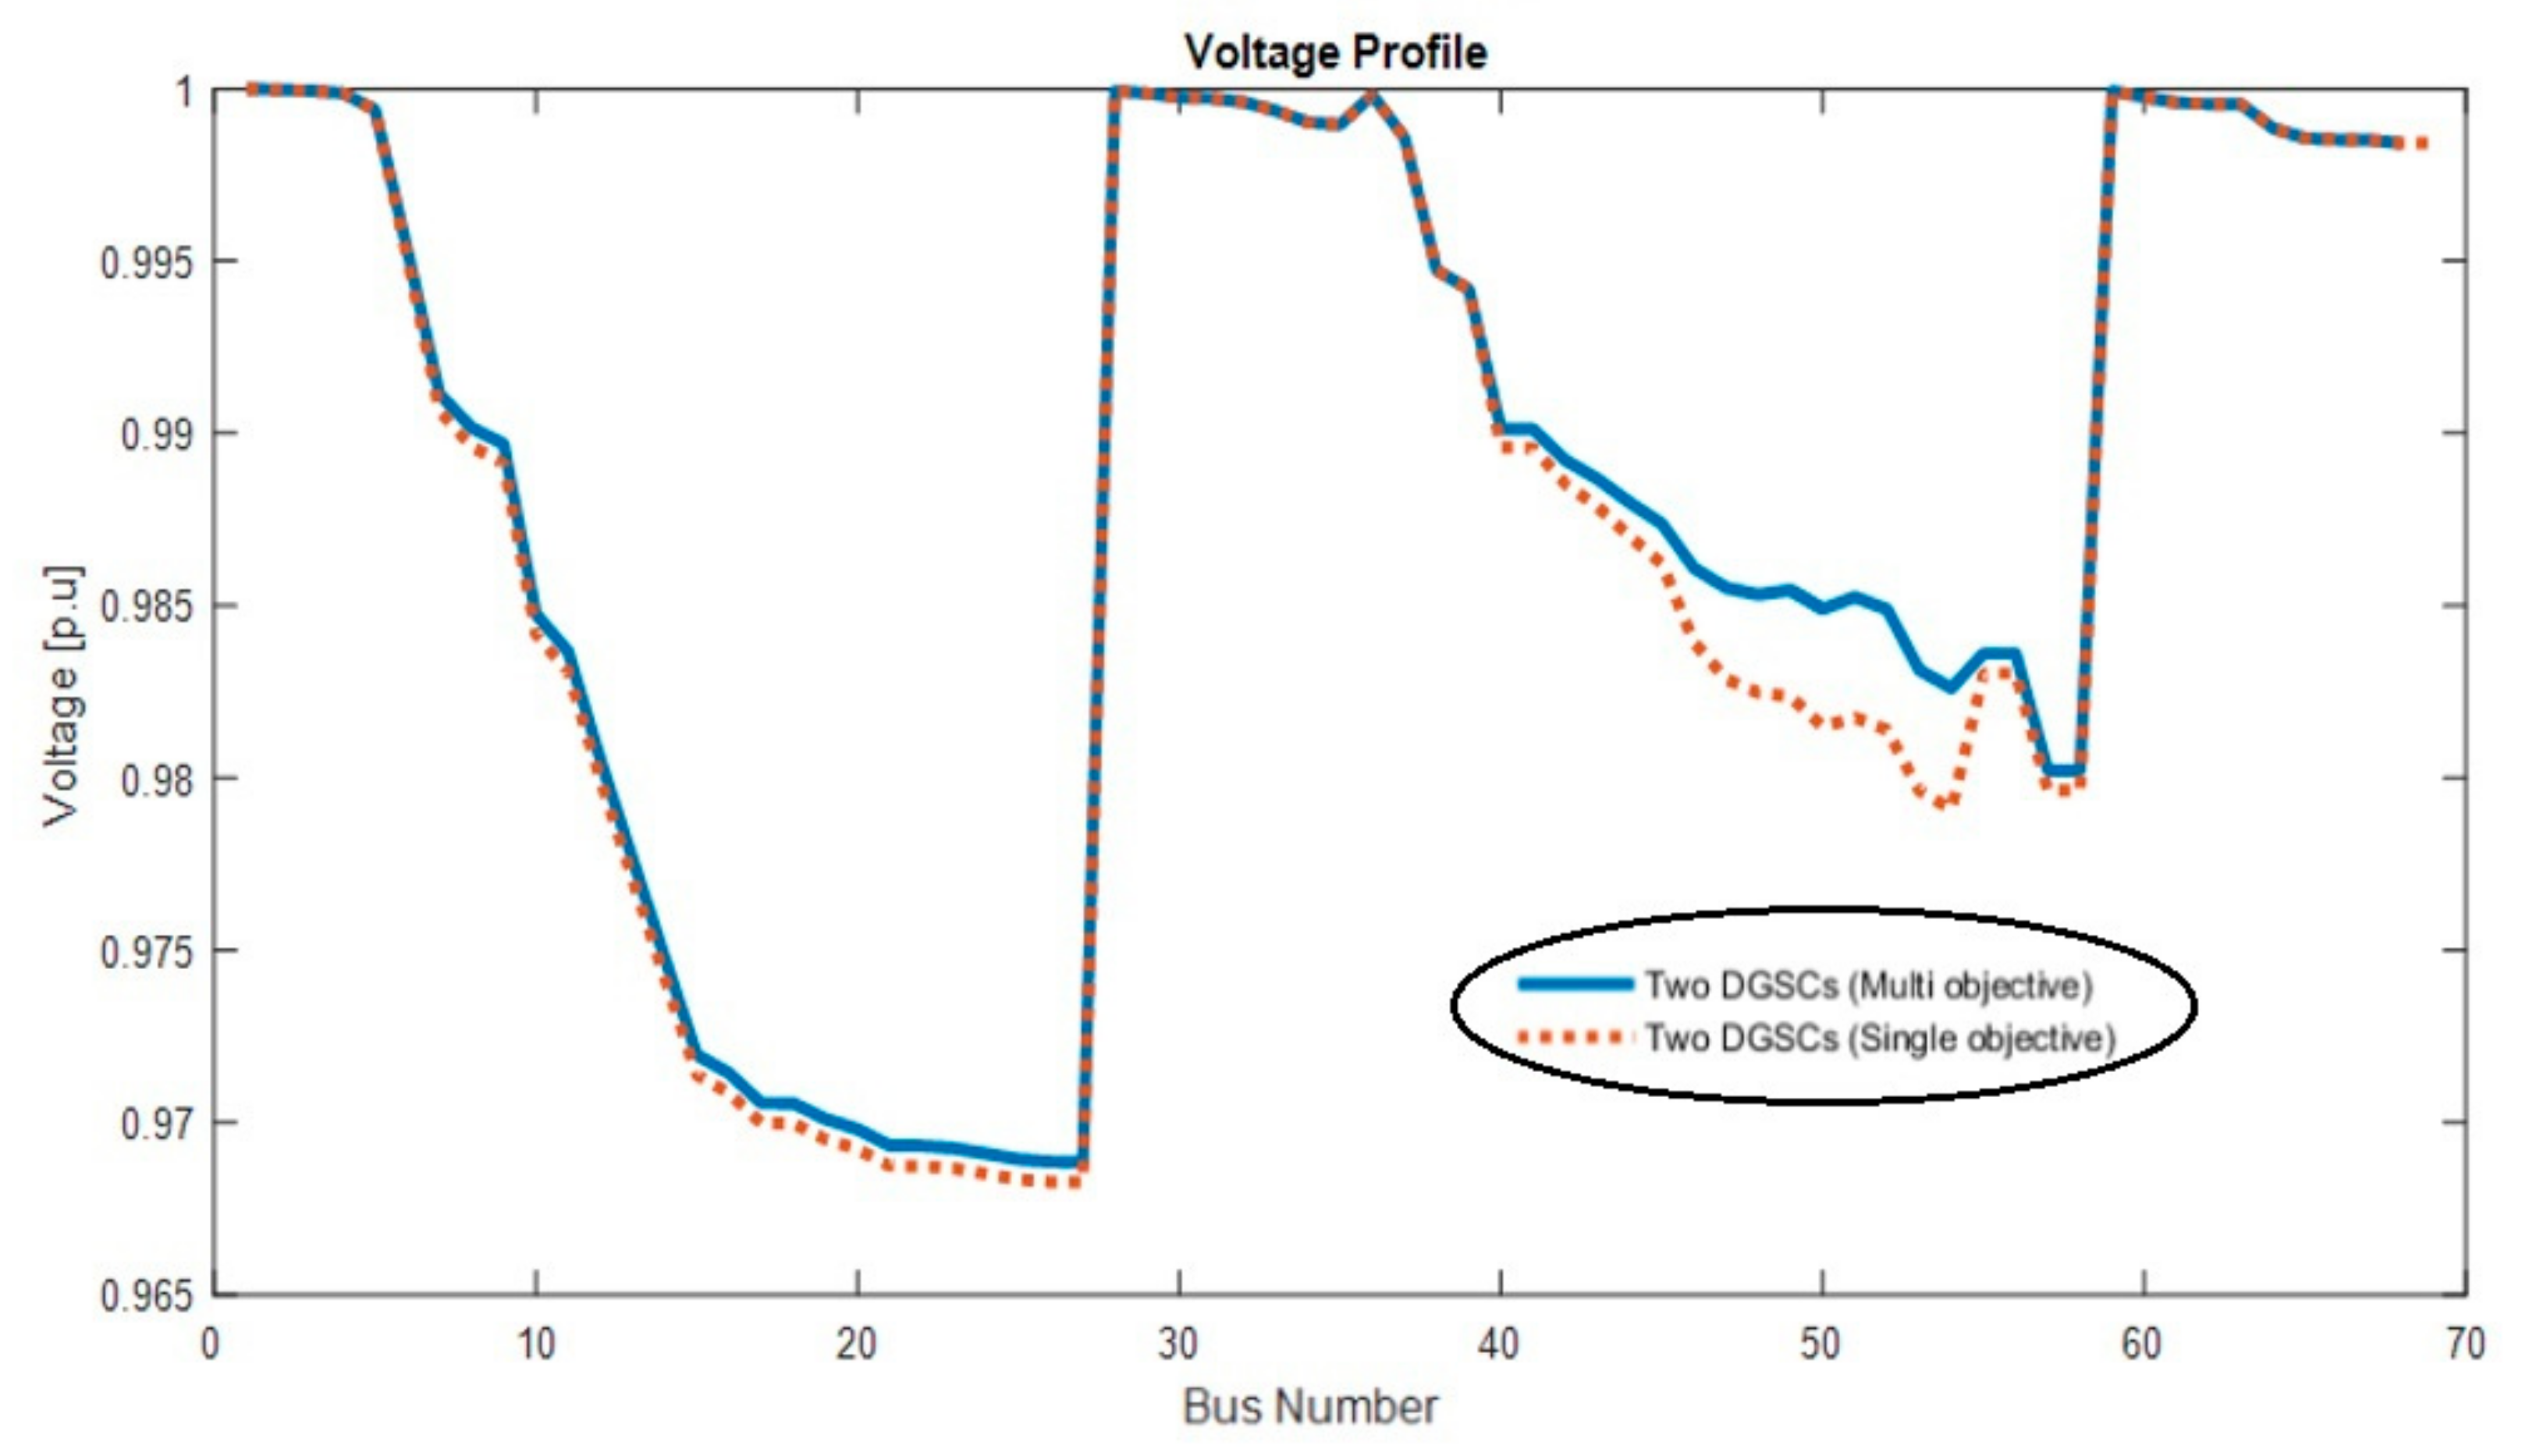
5.2. Optimal Allocation of the DGSCs
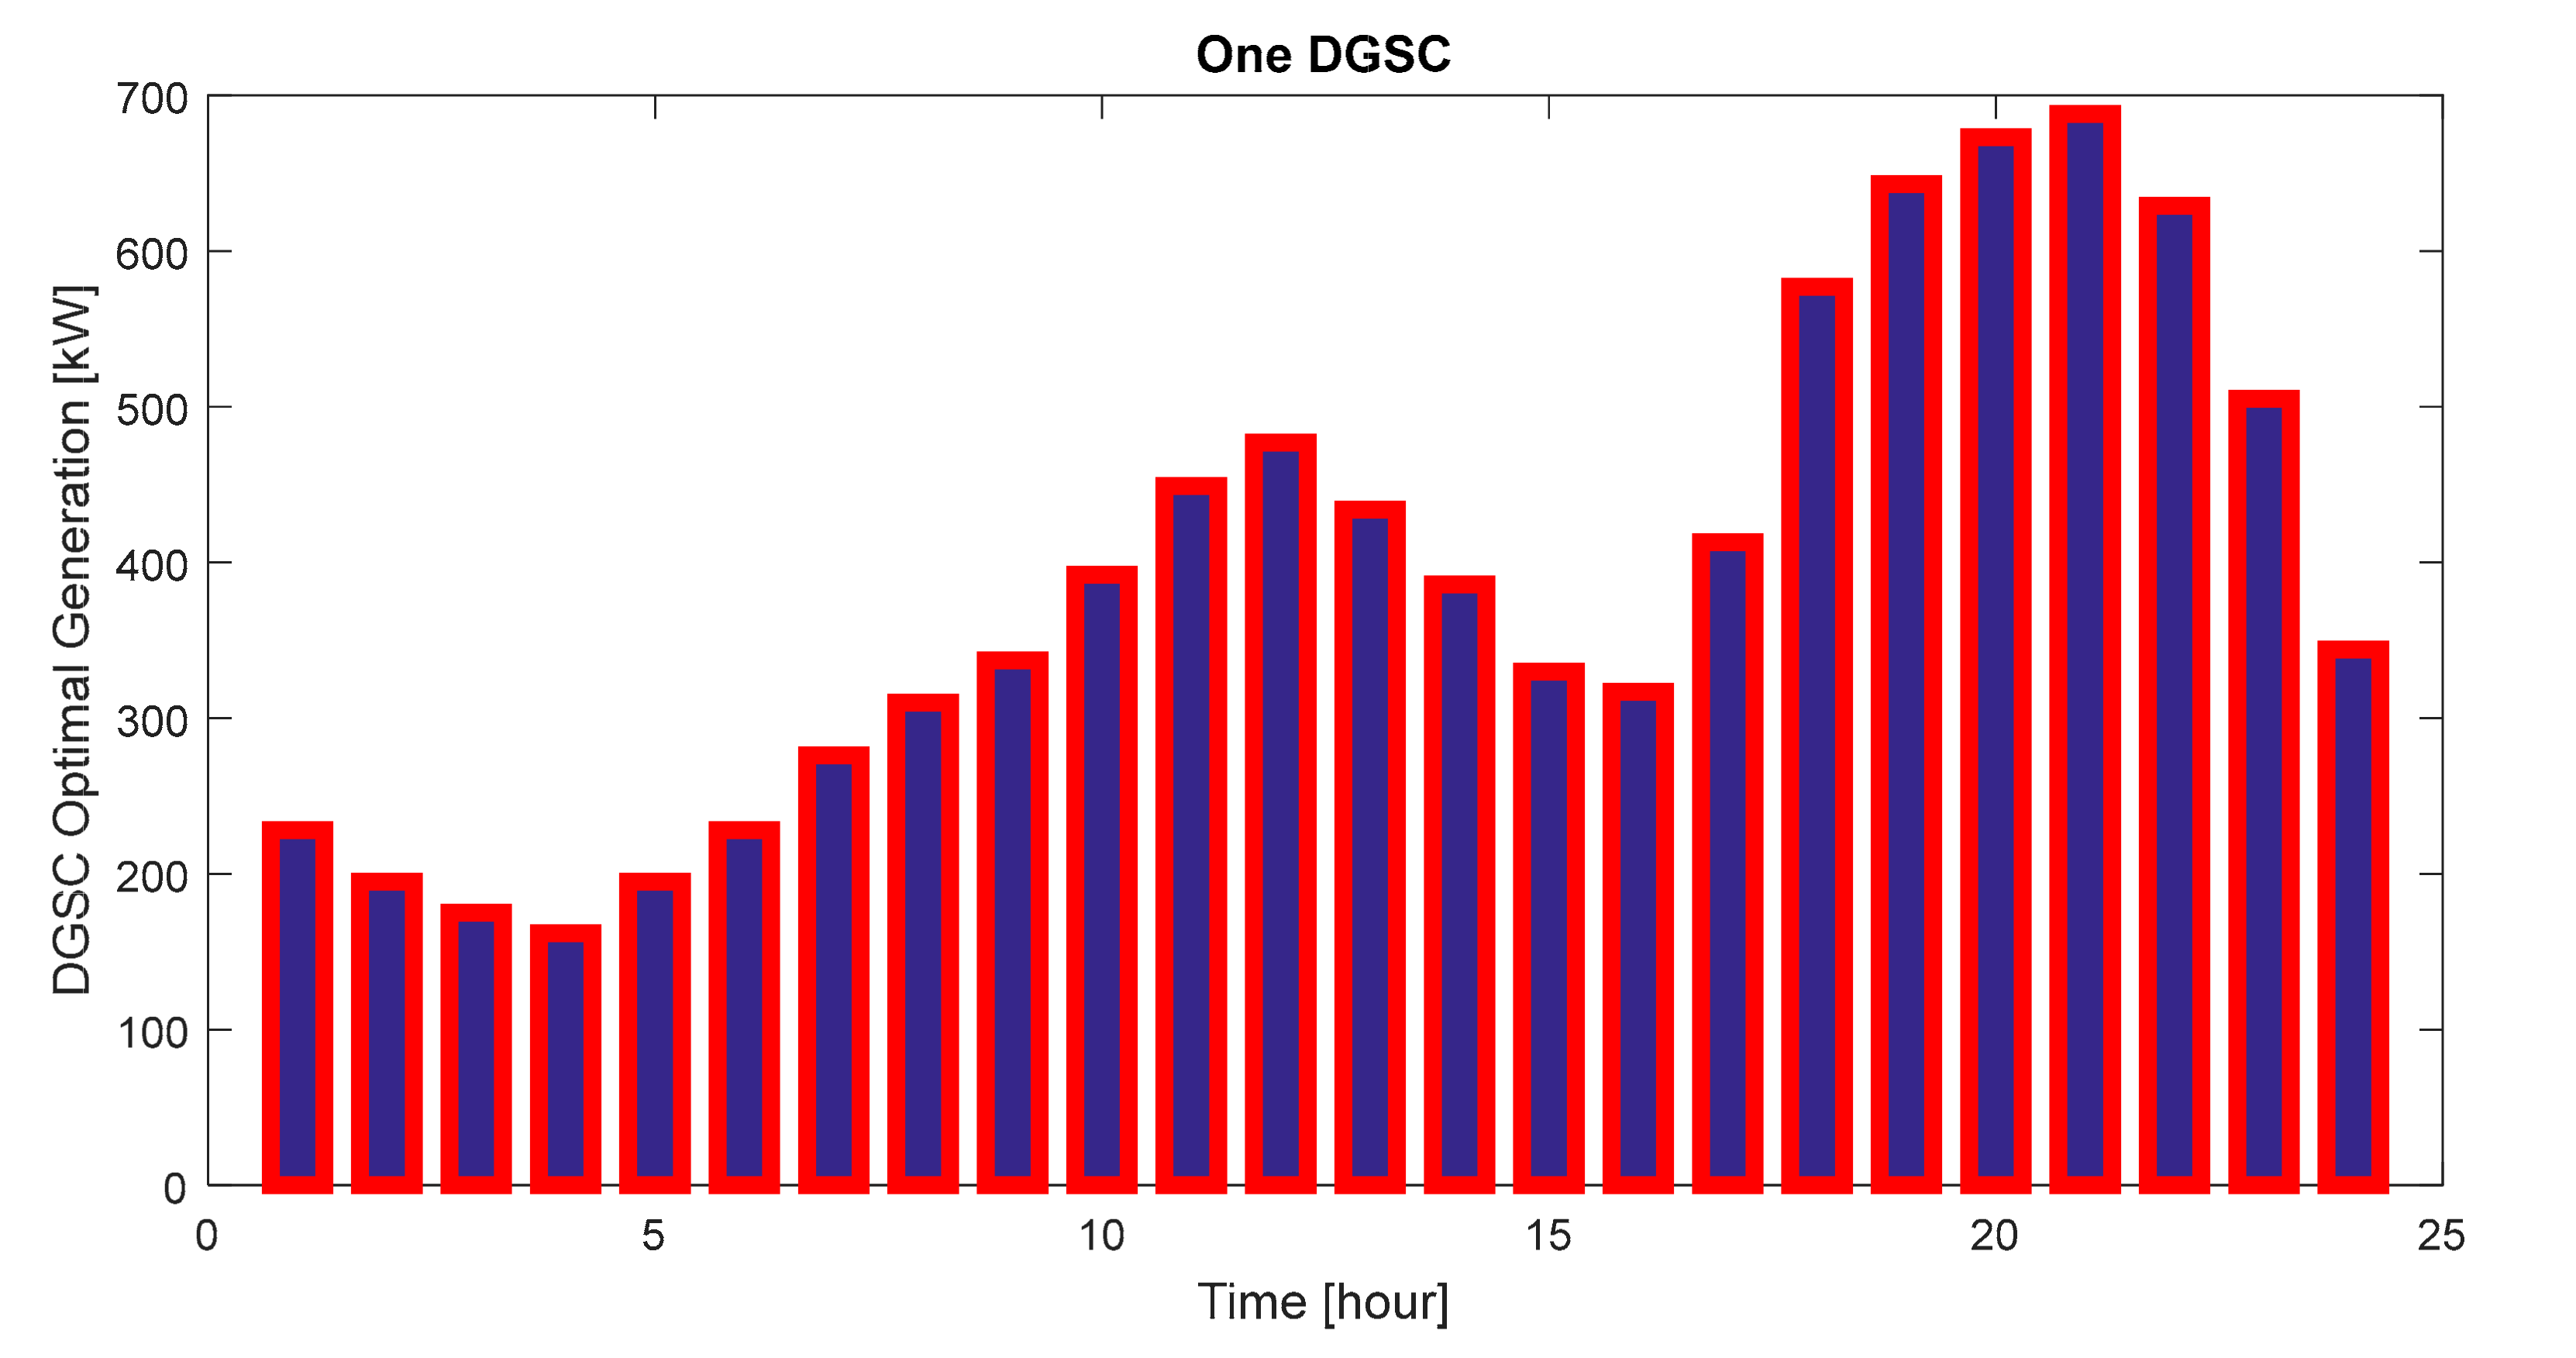
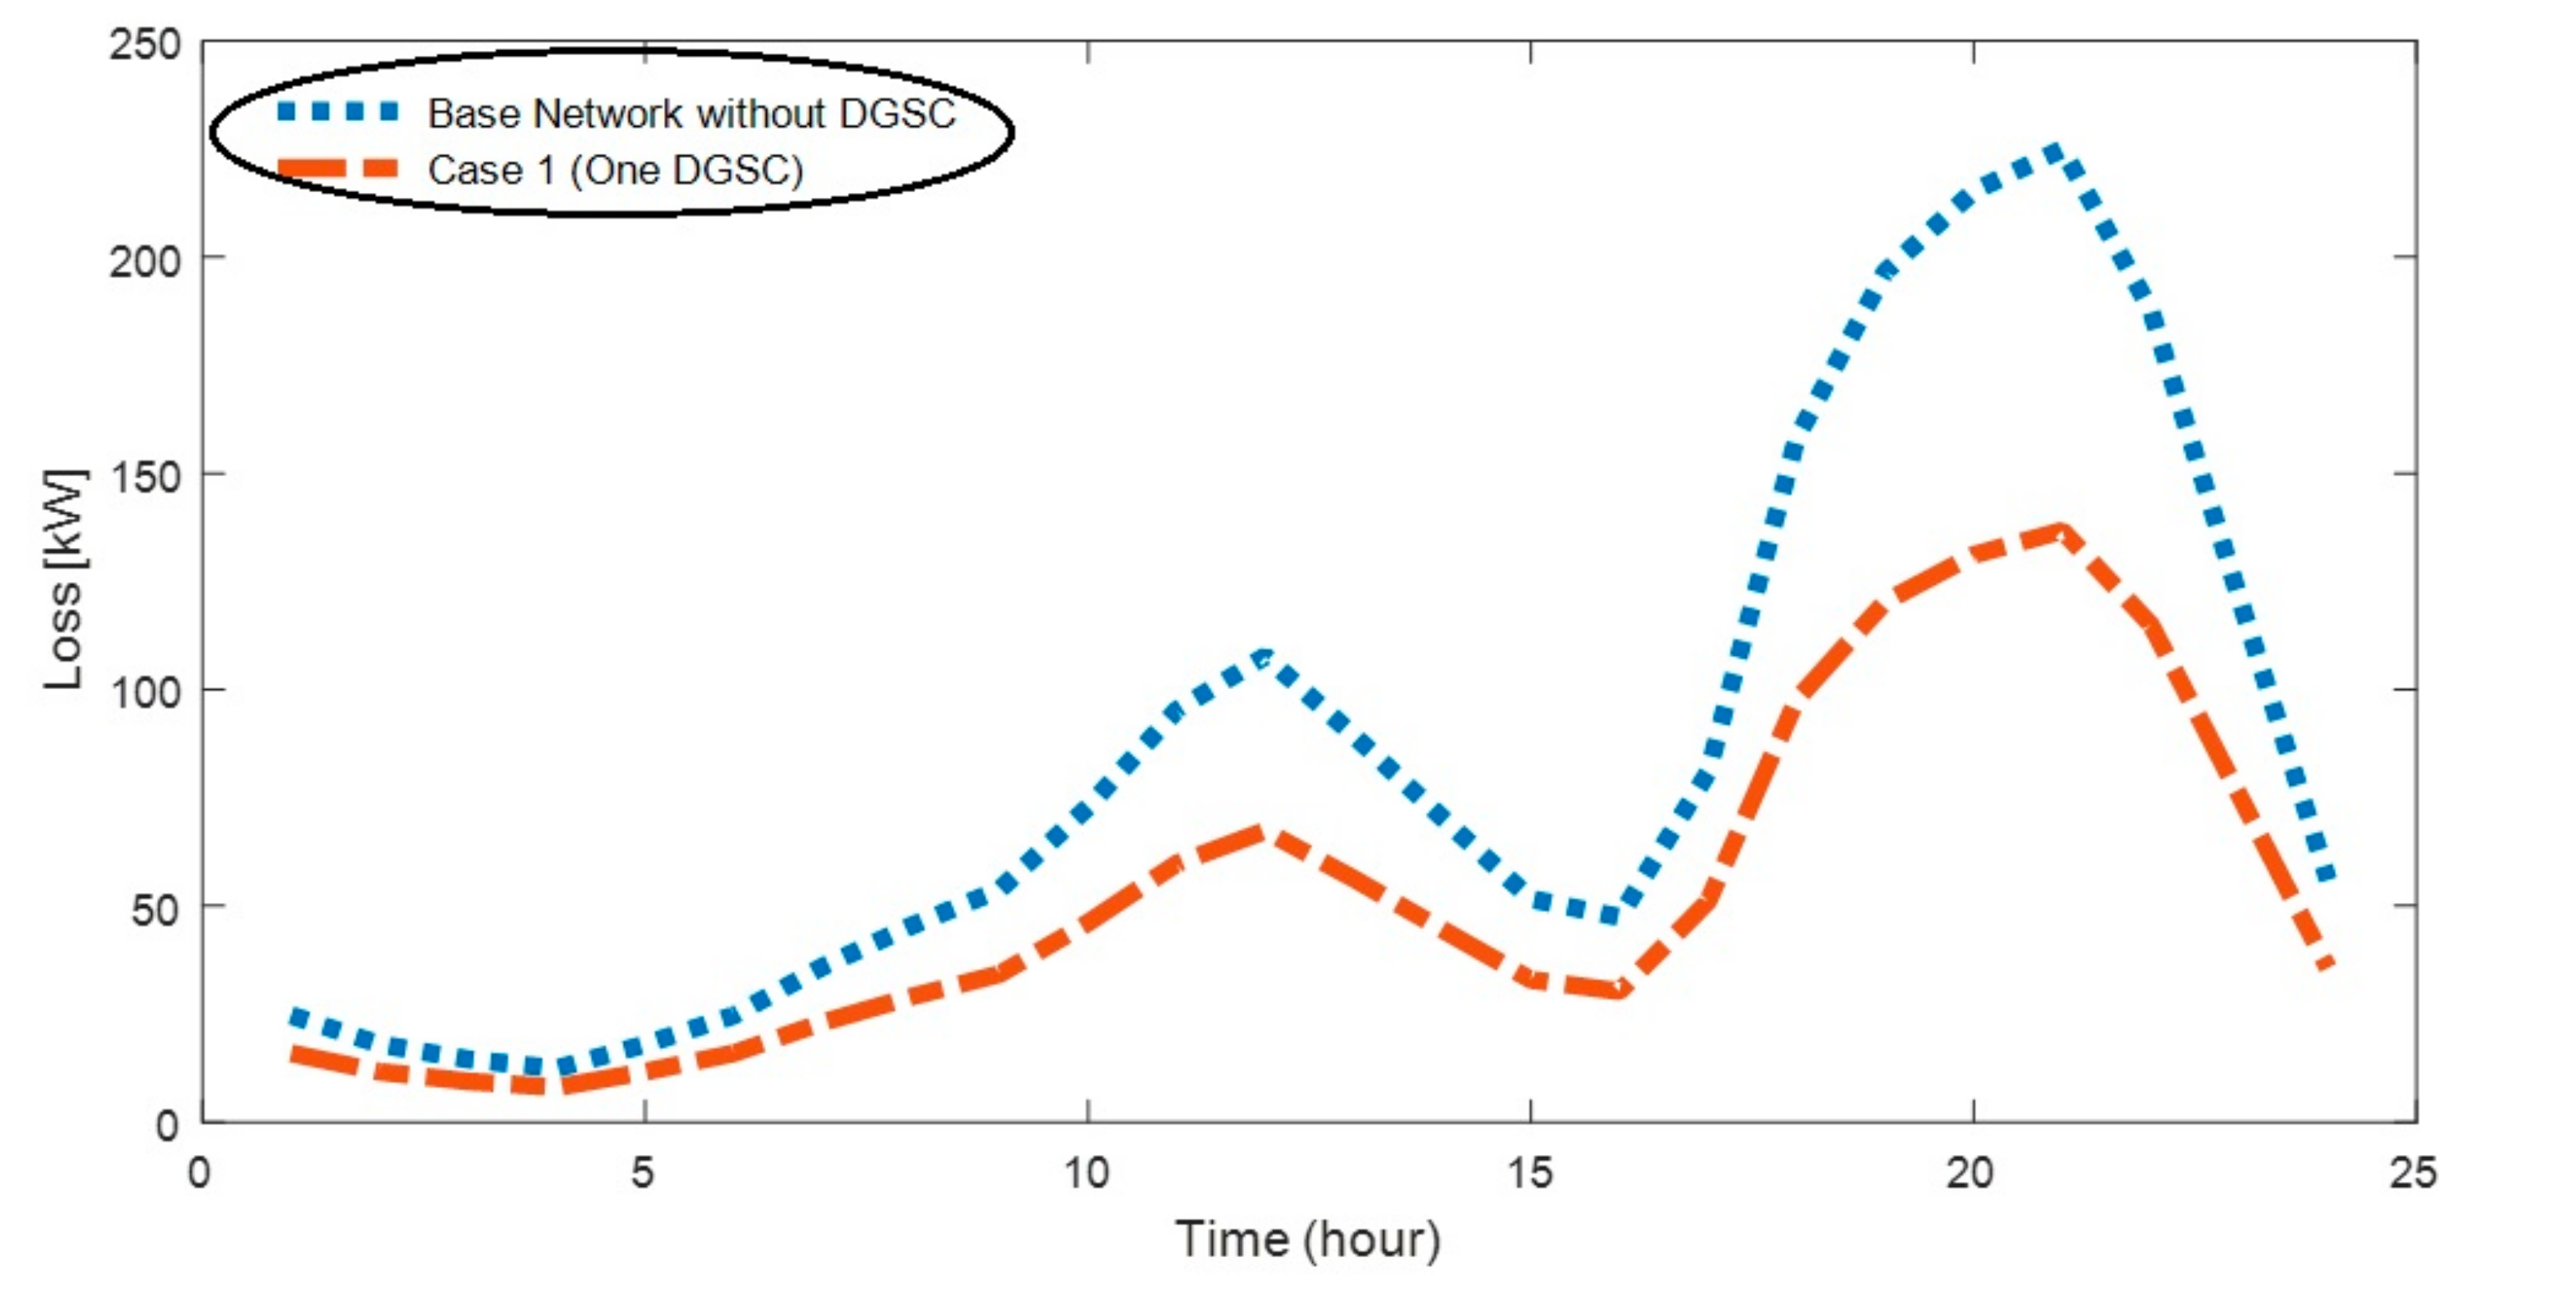
5.3. Optimal DGSC Planning
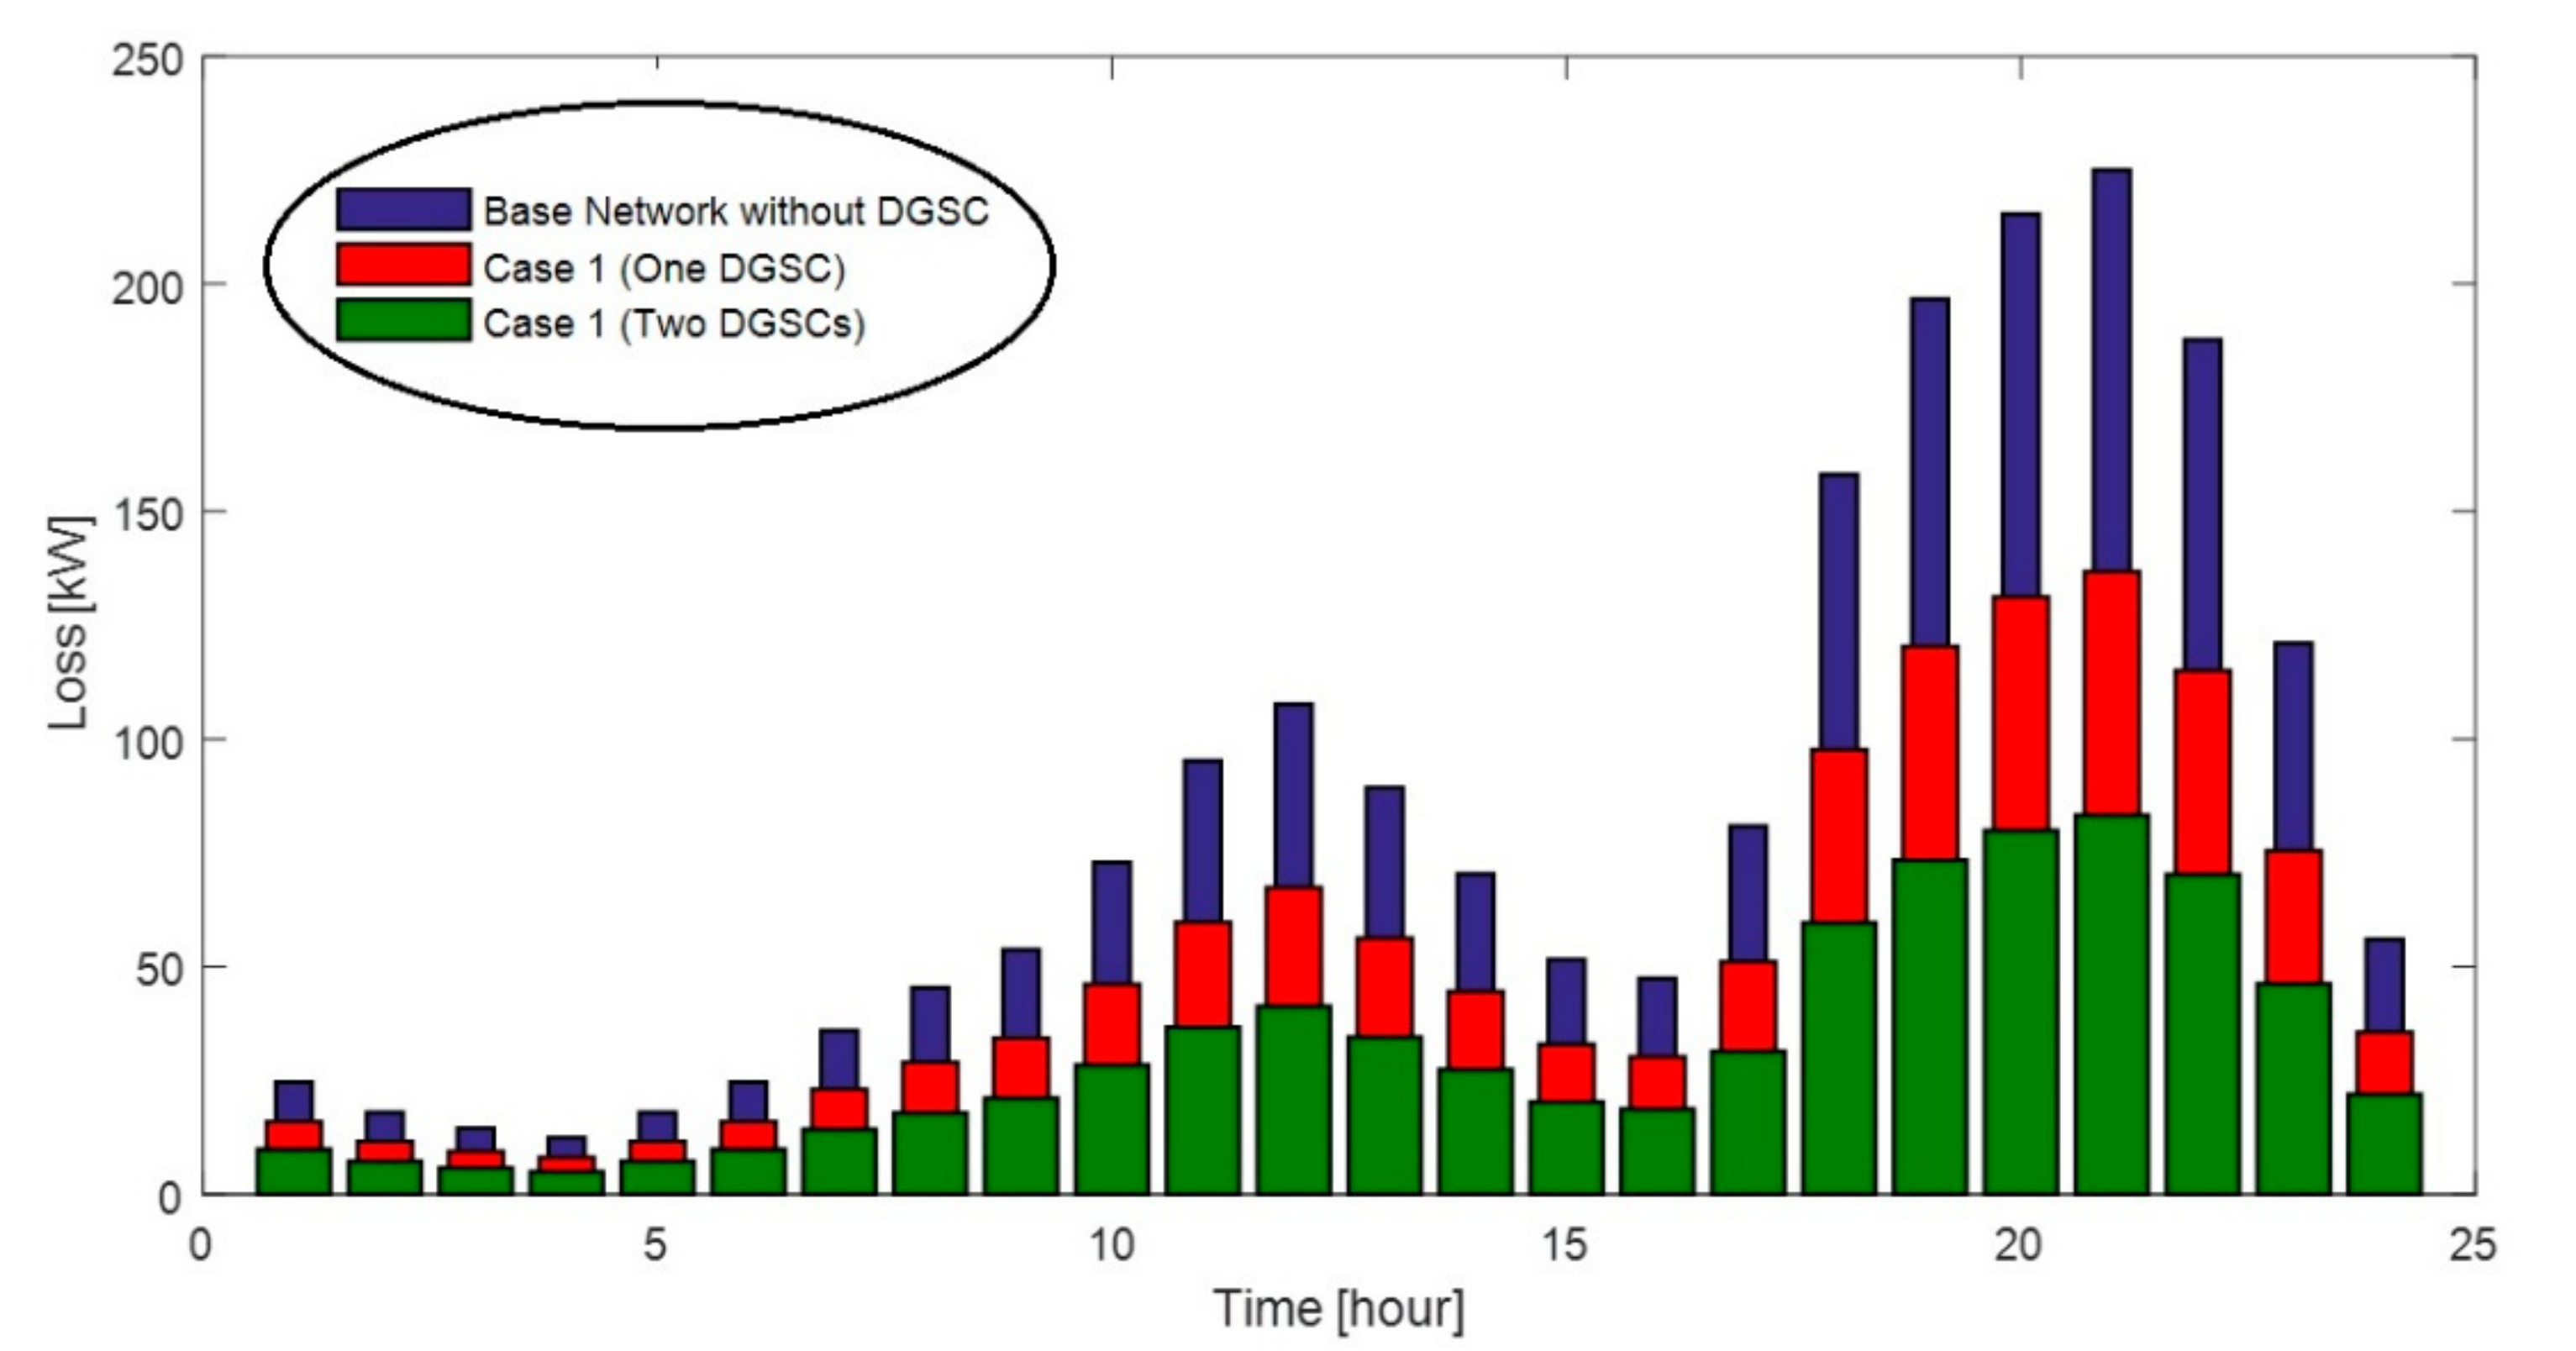
Planning One DGSC (Case 1)
6. Conclusions
Author Contributions
Funding
Institutional Review Board Statement
Informed Consent Statement
Data Availability Statement
Conflicts of Interest
References
- Jafar-Nowdeh, A.; Babanezhad, M.; Arabi-Nowdeh, S.; Naderipour, A.; Kamyab, H.; Abdul-Malek, Z.; Ramachandaramurthy, V.K. Meta-heuristic matrix moth–flame algorithm for optimal reconfiguration of distribution networks and placement of solar and wind renewable sources considering reliability. Environ. Technol. Innov. 2020, 20, 101118. [Google Scholar] [CrossRef]
- Moghaddam, M.J.H.; Kalam, A.; Shi, J.; Nowdeh, S.A.; Gandoman, F.H.; Ahmadi, A. A New Model for Reconfiguration and Distributed Generation Allocation in Distribution Network Considering Power Quality Indices and Network Losses. IEEE Syst. J. 2020, 14, 3530–3538. [Google Scholar] [CrossRef]
- Augusto, A.A.; de Souza, J.C.S.; Do Coutto Filho, M.B.; de Oliveira Rocha, H.R.; Tafur, J.E.V. Optimized Capacitor Placement Considering Load and Network Variability. J. Control Automat. Electr. Syst. 2020, 31, 1489–1498. [Google Scholar] [CrossRef]
- Hayerikhiyavi, M.; Dimitrovski, A. Comprehensive Analysis of Continuously Variable Series Reactor Using GC Framework. arXiv Preprint 2021, arXiv:2103.11136. [Google Scholar]
- Naderipour, A.; Abdul-Malek, Z.; Hajivand, M.; Seifabad, Z.M.; Farsi, M.A.; Nowdeh, S.A.; Davoudkhani, I.F. Spotted hyena optimizer algorithm for capacitor allocation in radial distribution system with distributed generation and microgrid operation considering different load types. Sci. Rep. 2021, 11, 1–15. [Google Scholar] [CrossRef]
- Nowdeh, S.A.; Davoudkhani, I.F.; Moghaddam, M.H.; Najmi, E.S.; Abdelaziz, A.; Ahmadi, A.; Razavi, S.; Gandoman, F. Fuzzy multi-objective placement of renewable energy sources in distribution system with objective of loss reduction and reliability improvement using a novel hybrid method. Appl. Soft Comput. 2019, 77, 761–779. [Google Scholar] [CrossRef]
- Naderipour, A.; Abdul-Malek, Z.; Nowdeh, S.A.; Ramachandaramurthy, V.K.; Kalam, A.; Guerrero, J. Optimal allocation for combined heat and power system with respect to maximum allowable capacity for reduced losses and improved voltage profile and reliability of microgrids considering loading condition. Energy 2020, 196, 117124. [Google Scholar] [CrossRef]
- Hadidian-Moghaddam, M.J.; Nowdeh, S.A.; Bigdeli, M.; Azizian, D. A multi-objective optimal sizing and siting of distributed generation using ant lion optimization technique. Ain Shams Eng. J. 2018, 9, 2101–2109. [Google Scholar] [CrossRef]
- Jahannoush, M.; Nowdeh, S.A. Optimal designing and management of a stand-alone hybrid energy system using meta-heuristic improved sine–cosine algorithm for Recreational Center, case study for Iran country. Appl. Soft Comput. 2020, 96, 106611. [Google Scholar] [CrossRef]
- Nowdeh, S.A.; Ghahnavieh, A.R.; Shojaei, H. Reliable Designing of Stand-alone PV/FC Hybrid System. Majlesi J. Electr. Eng. 2013, 7, 41–47. [Google Scholar]
- Rajabighahnavieh, A.; Nowdeh, S.A. Optimal PV–FC hybrid system operation considering reliability. Int. J. Electr. Power Energy Syst. 2014, 60, 325–333. [Google Scholar] [CrossRef]
- Naderipour, A.; Abdul-Malek, Z.; Nowdeh, S.A.; Kamyab, H.; Ramtin, A.R.; Shahrokhi, S.; Klemeš, J.J. Comparative evaluation of hybrid photovoltaic, wind, tidal and fuel cell clean system design for different regions with remote application considering cost. J. Clean. Prod. 2021, 283, 124207. [Google Scholar] [CrossRef]
- Haggi, H.; Nejad, R.R.; Song, M.; Sun, W. A Review of Smart Grid Restoration to Enhance Cyber-Physical System Resilience. In Proceedings of the 2019 IEEE Innovative Smart Grid Technologies-Asia (ISGT Asia), Chengdu, China, 21–24 May 2019; pp. 4008–4013. [Google Scholar] [CrossRef]
- Haggi, H.; Marjani, S.R.; Golkar, M.A. The effect of rescheduling power plants and optimal allocation of STATCOM in order to Improve power system static security using TLBO algorithm. In Proceedings of the 2017 Iranian Conference on Electrical Engineering (ICEE), Tehran, Iran, 2–4 May 2017; pp. 1120–1125. [Google Scholar] [CrossRef]
- Kayal, P.; Chanda, C.K. Placement of wind and solar based DGs in distribution system for power loss minimization and voltage stability improvement. Int. J. Electr. Power Energy Syst. 2013, 53, 795–809. [Google Scholar] [CrossRef]
- Khatod, D.K.; Pant, V.; Sharma, J. Evolutionary programming based optimal placement of renewable distributed generators. IEEE Trans. Power Syst. 2012, 28, 683–695. [Google Scholar] [CrossRef]
- Nadhir, K.; Chabane, D.; Tarek, B. Firefly algorithm based energy loss minimization approach for optimal sizing & placement of distributed generation. In Proceedings of the 2013 5th International Conference on Modeling, Simulation and Applied Optimization (ICMSAO), Hammamet, Tunisia, 28–30 April 2013; pp. 1–5. [Google Scholar] [CrossRef]
- Rajaram, R.; Kumar, K.S.; Rajasekar, N. Power system reconfiguration in a radial distribution network for reducing losses and to improve voltage profile using modified plant growth simulation algorithm with Distributed Generation (DG). Energy Rep. 2015, 1, 116–122. [Google Scholar] [CrossRef] [Green Version]
- Nguyen, T.T.; Truong, A.V.; Phung, A.-T. A novel method based on adaptive cuckoo search for optimal network reconfiguration and distributed generation allocation in distribution network. Int. J. Electr. Power Energy Syst. 2016, 78, 801–815. [Google Scholar] [CrossRef]
- Khalesi, N.; Rezaei, N.; Haghifam, M.-R. DG allocation with application of dynamic programming for loss reduction and reliability improvement. Int. J. Electr. Power Energy Syst. 2011, 33, 288–295. [Google Scholar] [CrossRef]
- Ochoa, L.; Harrison, G. Minimizing Energy Losses: Optimal Accommodation and Smart Operation of Renewable Distributed Generation. IEEE Trans. Power Syst. 2010, 26, 198–205. [Google Scholar] [CrossRef] [Green Version]
- Nasri, A.; Hamedani Golshan, M.E.; Mortaza Saghaian Nejad, S. Optimal planning of dispatchable and non-dispatchable distributed generation units for minimizing distribution system’s energy loss using particle swarm optimization. Int. Trans. Electr. Energy Syst. 2014, 24, 504–519. [Google Scholar] [CrossRef]
- Guo, Y.; Lin, Y.; Sun, M. The impact of integrating distributed generations on the losses in the smart grid. In Proceedings of the Power and Energy Society General Meeting, Detroit, MI, USA, 24–28 July 2011; pp. 1–6. [Google Scholar]
- Rahiminejad, A.; Vahidi, B.; Hejazi, M.; Shahrooyan, S. Optimal scheduling of dispatchable distributed generation in smart environment with the aim of energy loss minimization. Energy 2016, 116, 190–201. [Google Scholar] [CrossRef]
- Katic, N.; Marijanovic, V.; Stefani, I. Smart grid solutions in distribution networks cost/benefit analysis. In Proceedings of the Electricity Distribution (CICED), 2010 China International Conference, Nanjing, China, 13–16 September 2010; pp. 1–6. [Google Scholar]
- Abaide, A.; Canha, L.; Barin, A.; Cassel, G. Assessment of the smart grids applied in reducing the cost of distribution system losses. In Proceedings of the 2010 7th International Conference on the European Energy Market, Madrid, Spain, 23–25 June 2010; pp. 1–6. [Google Scholar] [CrossRef]
- Eajal, A.A.; El-Saadany, E.F.; AlHajri, M.F. Distributed Generation planning in smart distribution grids via a meta-heuristic approach. In Proceedings of the 2014 IEEE 27th Canadian Conference on Electrical and Computer Engineering (CCECE), Toronto, ON, Canada, 5–8 May 2014; pp. 1–6. [Google Scholar] [CrossRef]
- Alonso, M.; Amaris, H.; Alvarez-Ortega, C. Integration of renewable energy sources in smart grids by means of evolutionary optimization algorithms. Expert Syst. Appl. 2012, 39, 5513–5522. [Google Scholar] [CrossRef]
- Wolpert, D.H.; Macready, W.G. No free lunch theorems for optimization. IEEE Trans. Evol. Comput. 1997, 1, 67–82. [Google Scholar] [CrossRef] [Green Version]
- Adam, S.P.; Alexandropoulos, S.-A.N.; Pardalos, P.M.; Vrahatis, M.N. No Free Lunch Theorem: A Review. Approx. Optim. 2019, 57–82. [Google Scholar] [CrossRef]
- Zhao, W.; Zhang, Z.; Wang, L. Manta ray foraging optimization: An effective bio-inspired optimizer for engineering applications. Eng. Appl. Artif. Intell. 2020, 87, 103300. [Google Scholar] [CrossRef]
- Fathy, A.; Rezk, H.; Yousri, D. A robust global MPPT to mitigate partial shading of triple-junction solar cell-based system using manta ray foraging optimization algorithm. Sol. Energy 2020, 207, 305–316. [Google Scholar] [CrossRef]
- Lotfipour, A.; Afrakhte, H. A discrete Teaching–Learning-Based Optimization algorithm to solve distribution system reconfiguration in presence of distributed generation. Int. J. Electr. Power Energy Syst. 2016, 82, 264–273. [Google Scholar] [CrossRef]
- Baran, M.; Wu, F. Network reconfiguration in distribution systems for loss reduction and load balancing. IEEE Trans. Power Deliv. 1989, 4, 1401–1407. [Google Scholar] [CrossRef]


| One DGSC | Without DGSC | With DGSC (PSO) | With DGSC (MRFO) |
| Item/Value | PSO | MRFO | |
| Location (Bus) | -- | 50 | 50 |
| Size (kW) | -- | 998.96 | 1000 |
| Power Loss (kW) | 202.67 | 111.59 | 111.58 |
| Minimum Voltage (p.u) | 0.9038 | 0.948 | 0.9482 |
| Two DGSC | Without DGSC | With DGSC (PSO) | With DGSC (MRFO) |
| Item/Value | PSO | MRFO | |
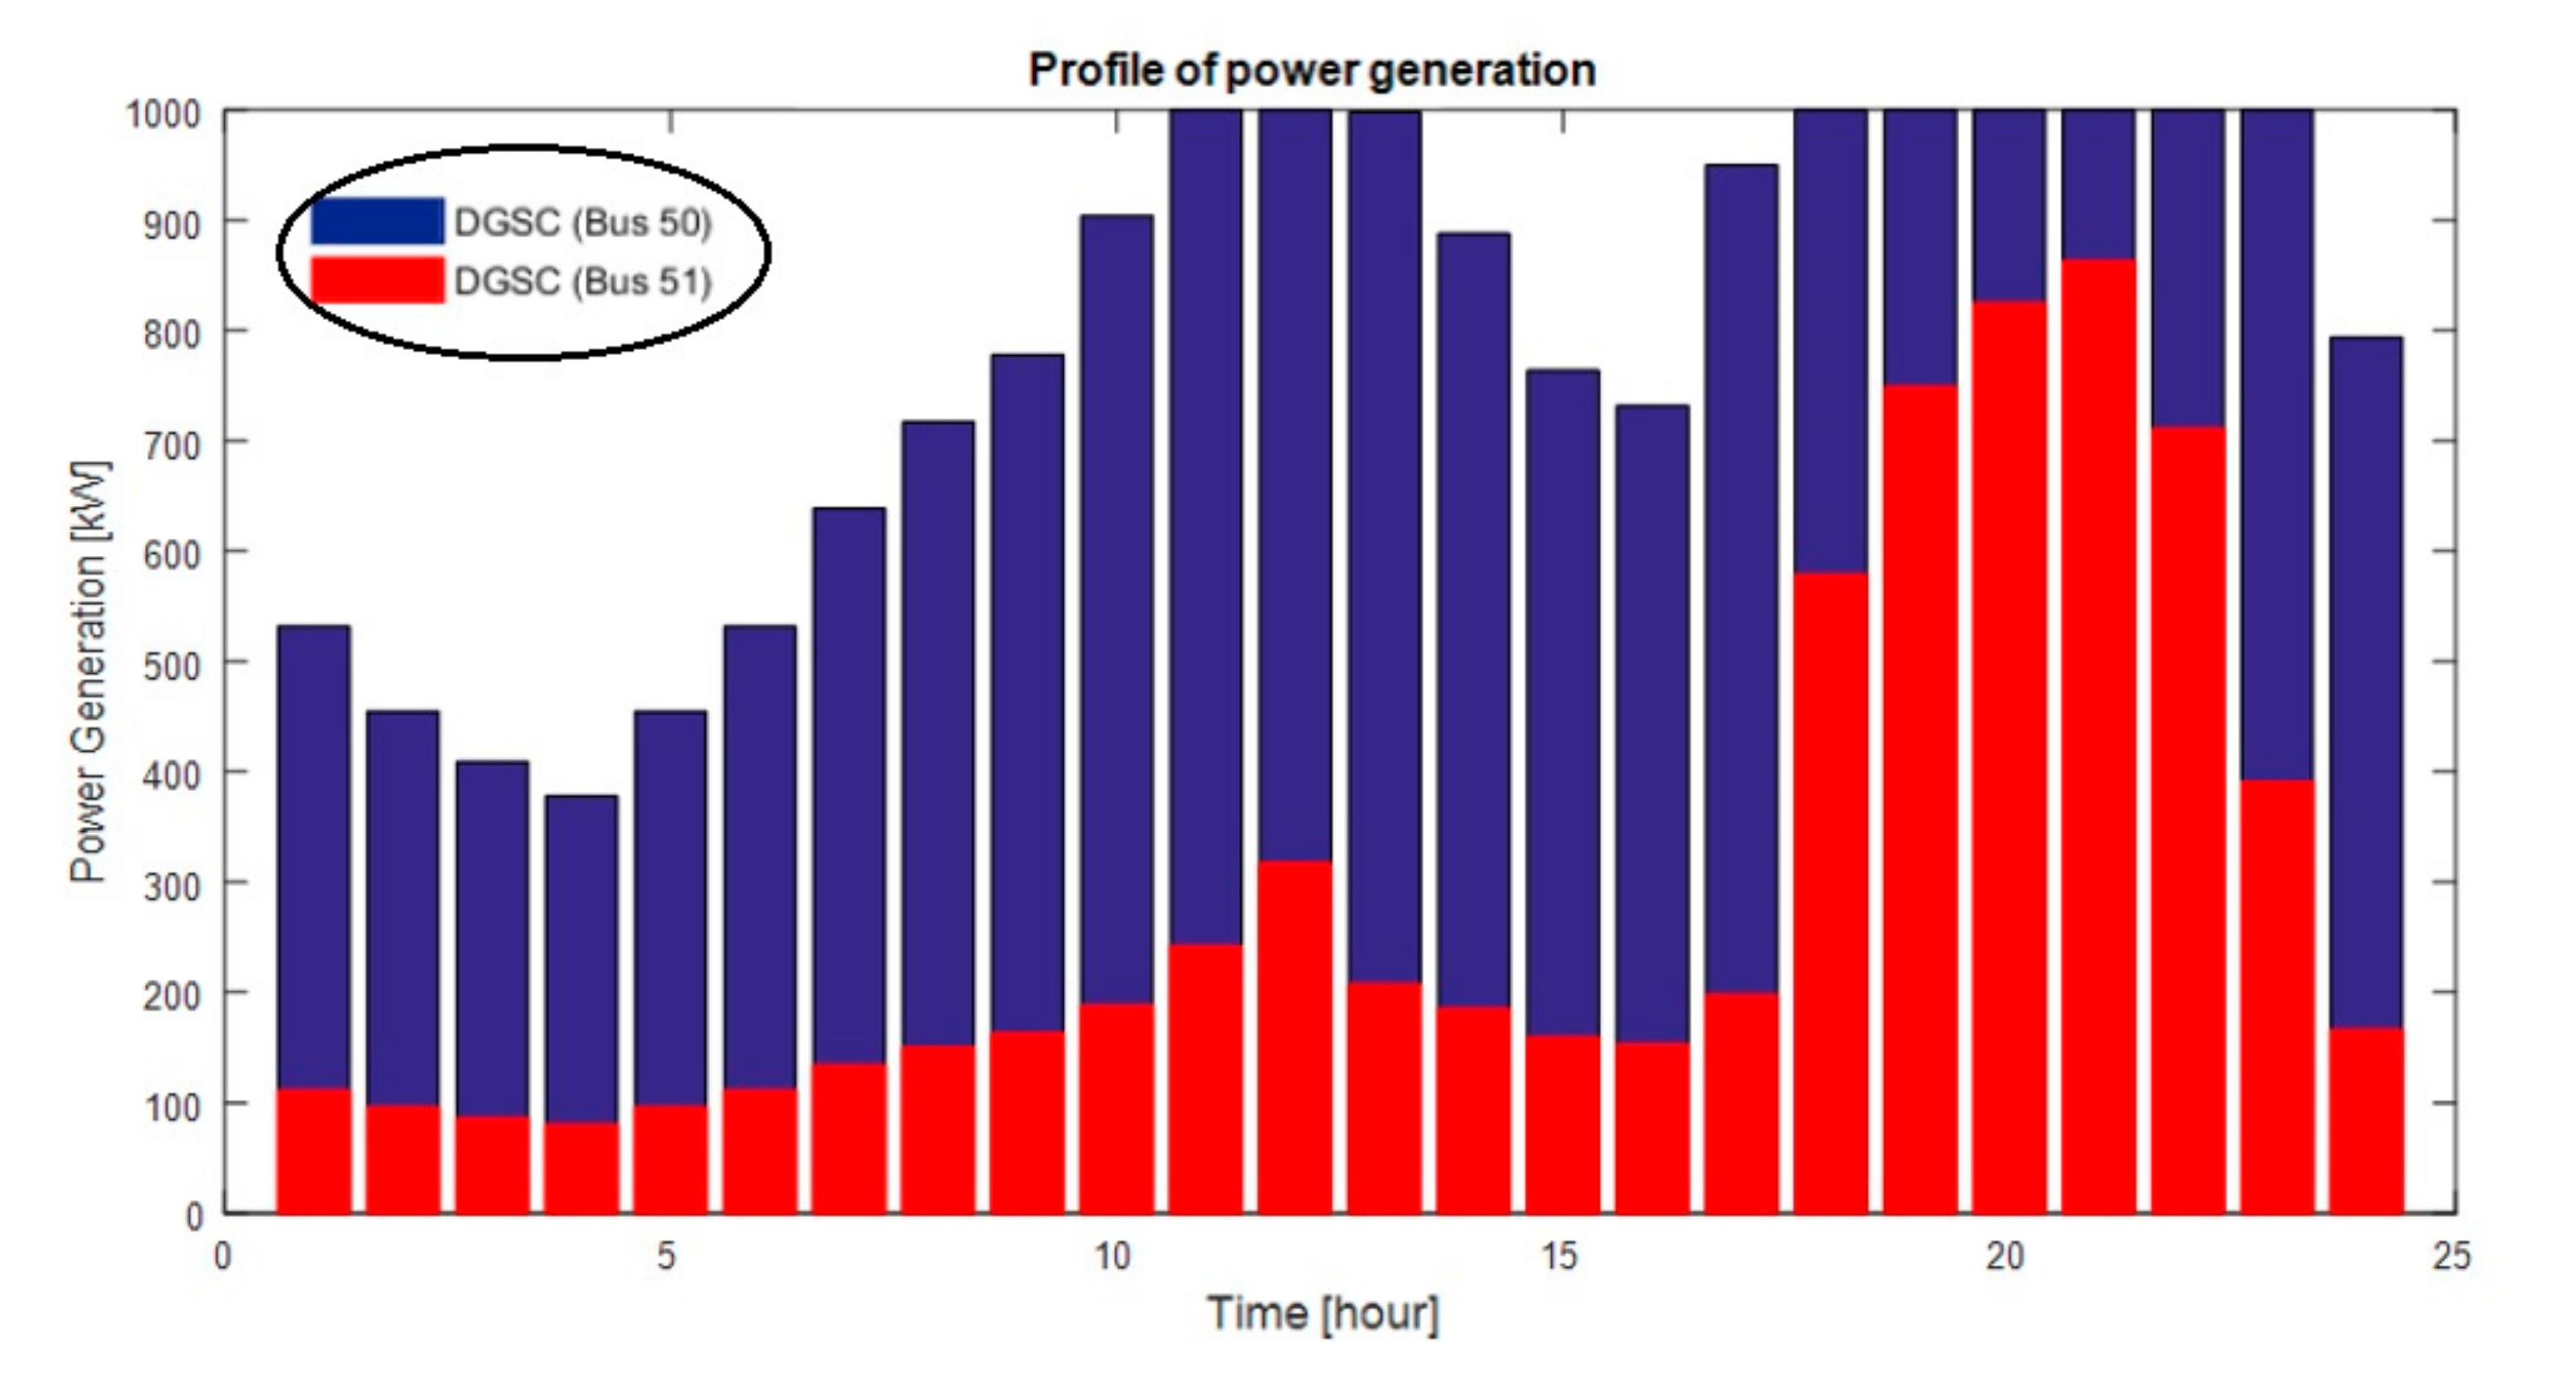
| Location (Buses) | -- | 50, 51 | 50, 51 |
| Sizes (kW) | -- | 1000, 860 | 1000, 865 |
| Power Loss (kW) | 202.67 | 83.370 | 83.330 |
| Minimum Voltage (p.u) | 0.9038 | 0.9681 | 0.9683 |
| Allocation Problem | Method | Best (MUS$) | Mean (MUS$) | Worst (MUS$) | St. D. ($) |
|---|---|---|---|---|---|
| One DGSC | MRFO | 0.6015 | 0.6033 | 0.6076 | 0.247 |
| PSO | 0.6027 | 0.6048 | 0.6090 | 0.261 | |
| Two DGSCs | MRFO | 0.3511 | 0.3519 | 0.3527 | 0.118 |
| PSO | 0.3523 | 0.3530 | 0.3538 | 0.126 |
| One DGSC | Without DGSC | With DGSC (PSO) | With DGSC (MRFO) |
| Item/Value | PSO | MRFO | |
| Location (Bus) | -- | 54 | 54 |
| Size (kW) | -- | 1000 | 1000 |
| Power Loss (kW) | 202.67 | 121.539 | 121.539 |
| Minimum Voltage (p.u) | 0.9038 | 0.9500 | 0.9500 |
| Two DGSC | Withoud DGSC | With DGSC (PSO) | With DGSC (MRFO) |
| Item/Value | PSO | MRFO | |
| Location (Buses) | -- | 50, 12 | 50, 52 |
| Sizes (kW) | -- | 1000, 1000 | 1000, 965 |
| Power Loss (kW) | 202.67 | 85.493 | 83.603 |
| Minimum Voltage (p.u) | 0.9038 | 0.9691 | 0.9694 |
| Item | Base Network | Case 1 | Case 2 | Case 3 | Case 4 | Case 5 | Case 6 |
|---|---|---|---|---|---|---|---|
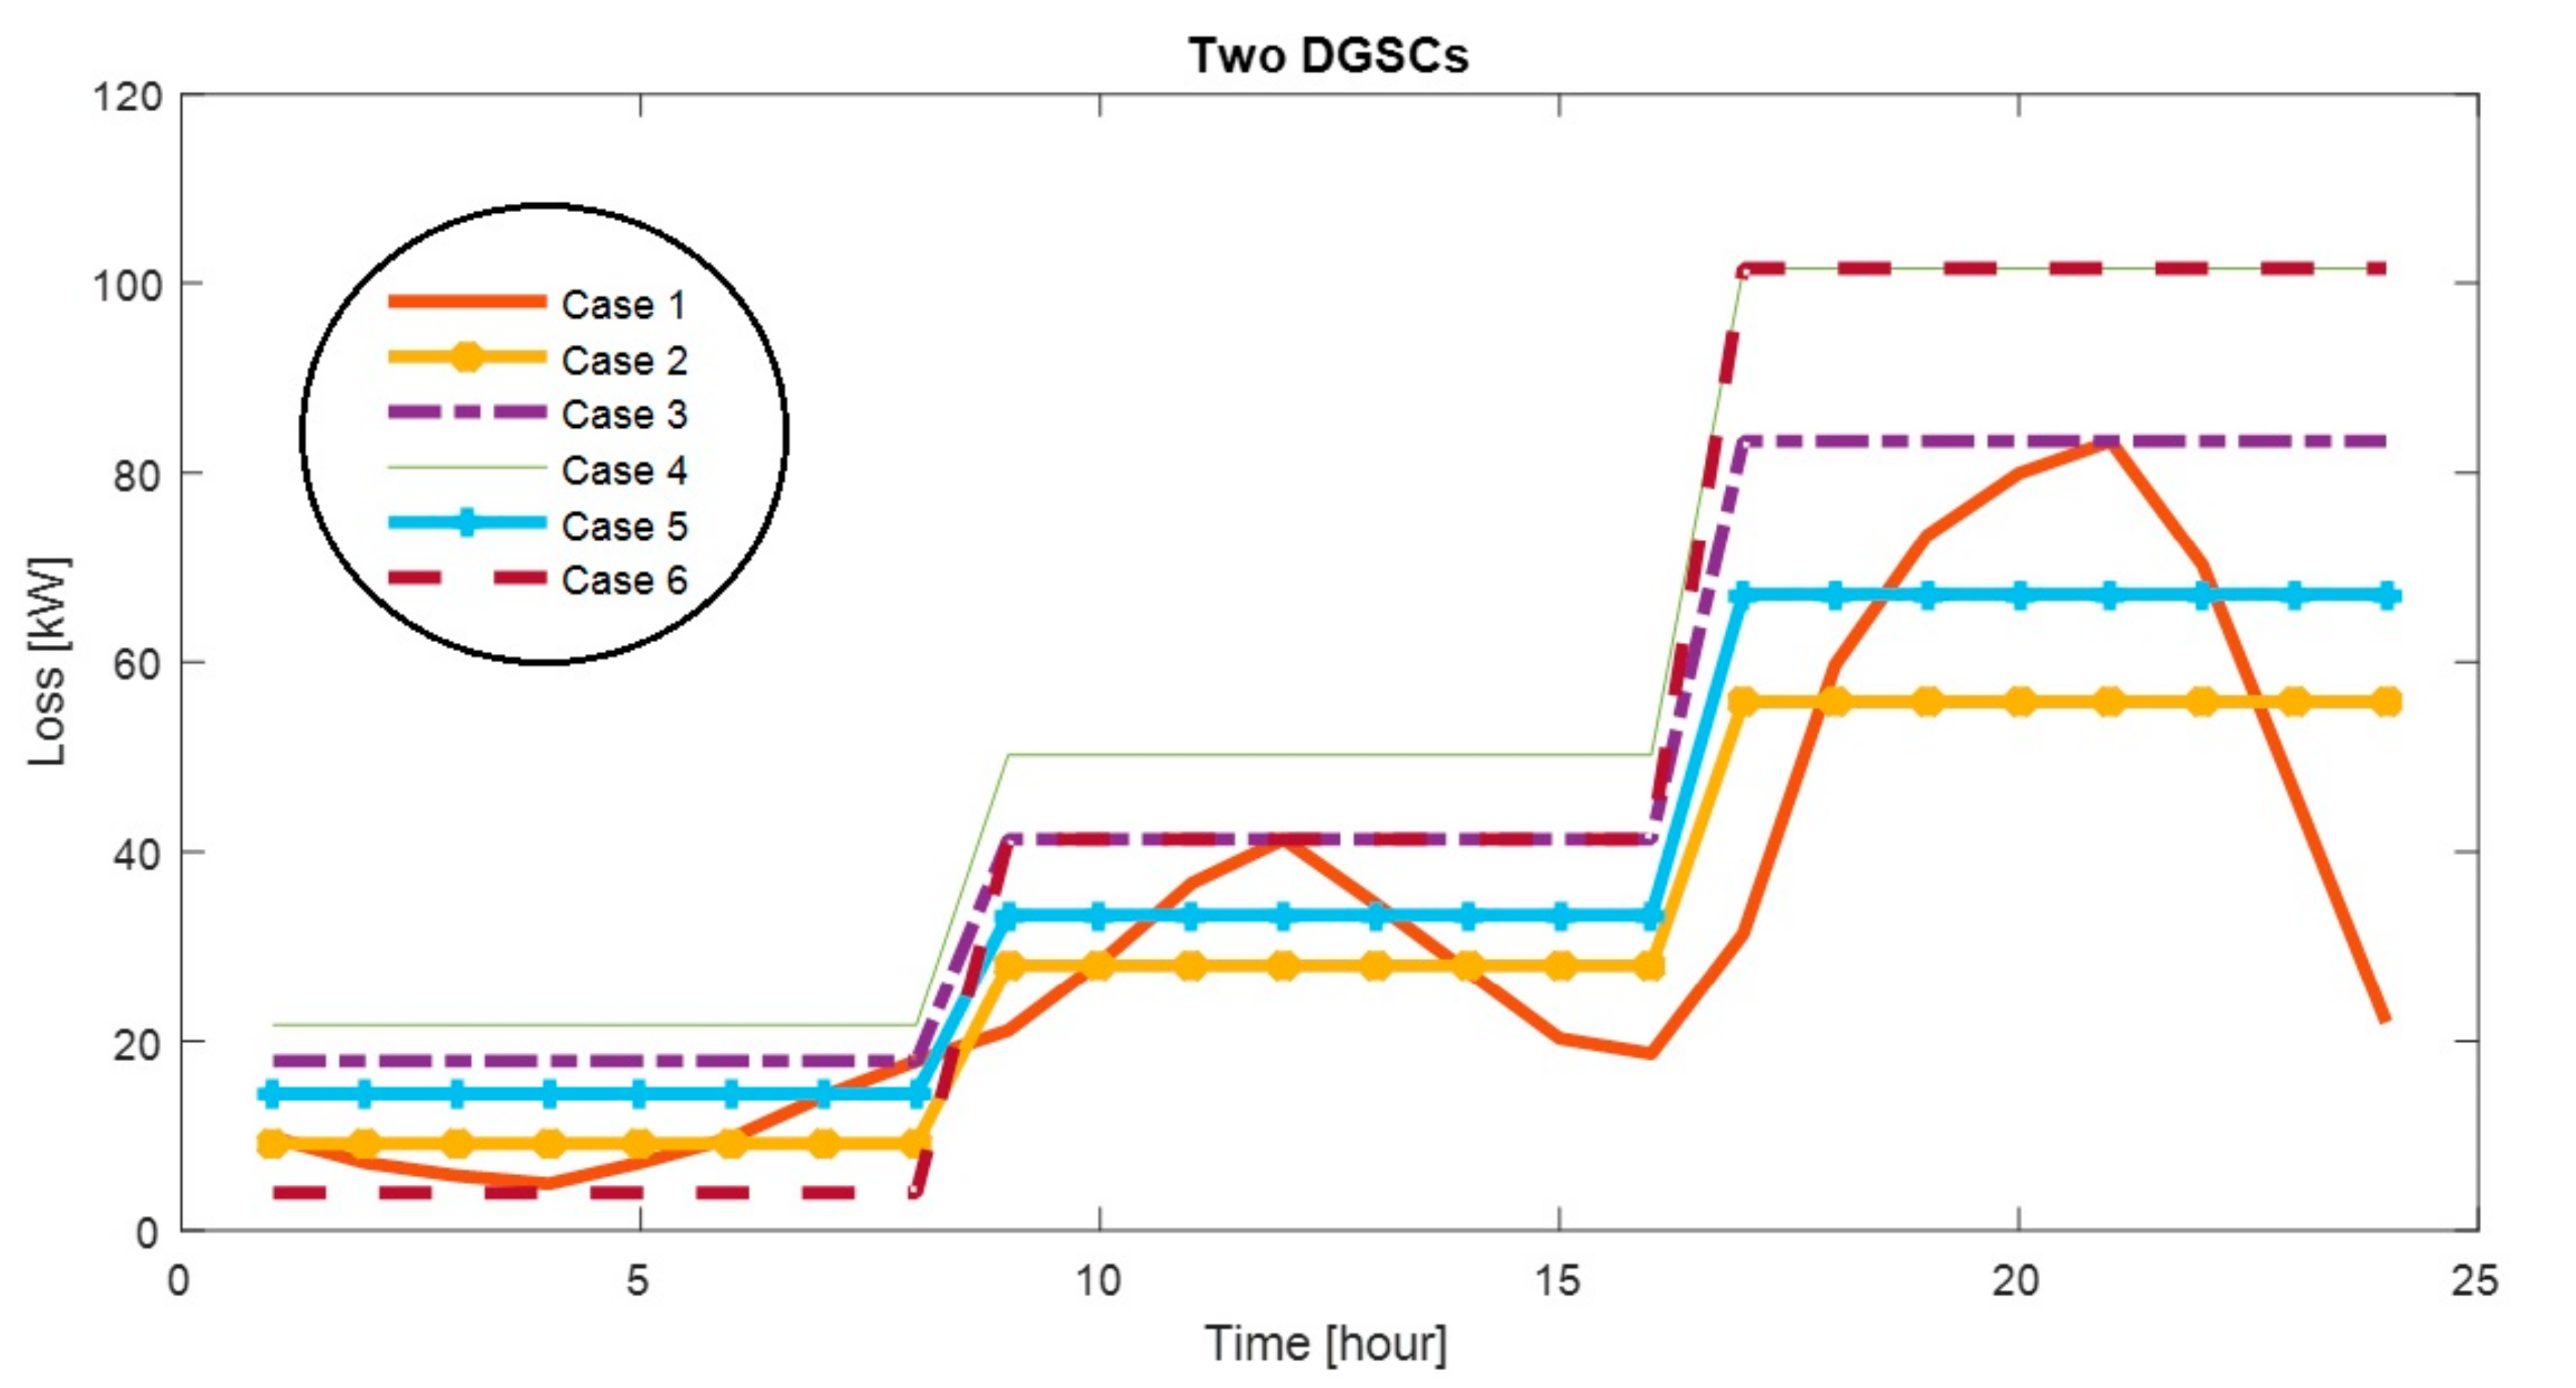
| Energy losses value | 2023 | 1259.39 | 1267.52 | 1645.61 | 2032.79 | 1285.4 | 1759.1 |
| Maximum deviation (%) | -- | -- | 0.64 | 30.66 | 61.42 | 2.06 | 39.68 |
| Item | Base Network | Case 1 | Case 2 | Case 3 | Case 4 | Case 5 | Case 6 |
|---|---|---|---|---|---|---|---|
| Energy losses value | 2023 | 771.77 | 794.37 | 1140.6 | 1387.6 | 819.42 | 1175.4 |
| Maximum deviation of generation (%) | -- | -- | 0.33 | 47.63 | 79.80 | 6.17 | 52.30 |
Publisher’s Note: MDPI stays neutral with regard to jurisdictional claims in published maps and institutional affiliations. |
© 2021 by the authors. Licensee MDPI, Basel, Switzerland. This article is an open access article distributed under the terms and conditions of the Creative Commons Attribution (CC BY) license (https://creativecommons.org/licenses/by/4.0/).
Share and Cite
Zahedi Vahid, M.; Ali, Z.M.; Seifi Najmi, E.; Ahmadi, A.; Gandoman, F.H.; Aleem, S.H.E.A. Optimal Allocation and Planning of Distributed Power Generation Resources in a Smart Distribution Network Using the Manta Ray Foraging Optimization Algorithm. Energies 2021, 14, 4856. https://doi.org/10.3390/en14164856
Zahedi Vahid M, Ali ZM, Seifi Najmi E, Ahmadi A, Gandoman FH, Aleem SHEA. Optimal Allocation and Planning of Distributed Power Generation Resources in a Smart Distribution Network Using the Manta Ray Foraging Optimization Algorithm. Energies. 2021; 14(16):4856. https://doi.org/10.3390/en14164856
Chicago/Turabian StyleZahedi Vahid, Masoud, Ziad M. Ali, Ebrahim Seifi Najmi, Abdollah Ahmadi, Foad H. Gandoman, and Shady H. E. Abdel Aleem. 2021. "Optimal Allocation and Planning of Distributed Power Generation Resources in a Smart Distribution Network Using the Manta Ray Foraging Optimization Algorithm" Energies 14, no. 16: 4856. https://doi.org/10.3390/en14164856
APA StyleZahedi Vahid, M., Ali, Z. M., Seifi Najmi, E., Ahmadi, A., Gandoman, F. H., & Aleem, S. H. E. A. (2021). Optimal Allocation and Planning of Distributed Power Generation Resources in a Smart Distribution Network Using the Manta Ray Foraging Optimization Algorithm. Energies, 14(16), 4856. https://doi.org/10.3390/en14164856