
Analysis of Energy Use and Energy Savings: A Case Study of a Condiment Industry in India


 ,
,
Abstract
:1. Introduction
2. Methodology
2.1. Targeted Manufacturing Factory
2.2. A Detailed Energy Audit
- (a).
- At first, the members of the audit team with their target were introduced to the manager/maintenance engineer of the plant through a kick-off meeting. A review was then made by the plant manager on the manufacturing process and energy consuming machines with operation and maintenance records to give an overall idea for the audit team.
- (b).
- After the meeting, the audit team was guided by the maintenance engineer to visit the manufacturing machines in order to observe the locations, several opportunities and the accessibility of measuring points. The representatives of respective equipment operators accompanied the audit team to describe the equipment precisely.
- (c).
- The operating manual of the energy consuming equipment was reviewed by the audit team to obtain specifications and operating parameters.
- (d).
- Before using the instruments, they were verified for calibration status by the facility manager and were counter checked with the online instruments installed in the facility to assure the accuracy of the data measurement.
2.3. Energy Audit Data
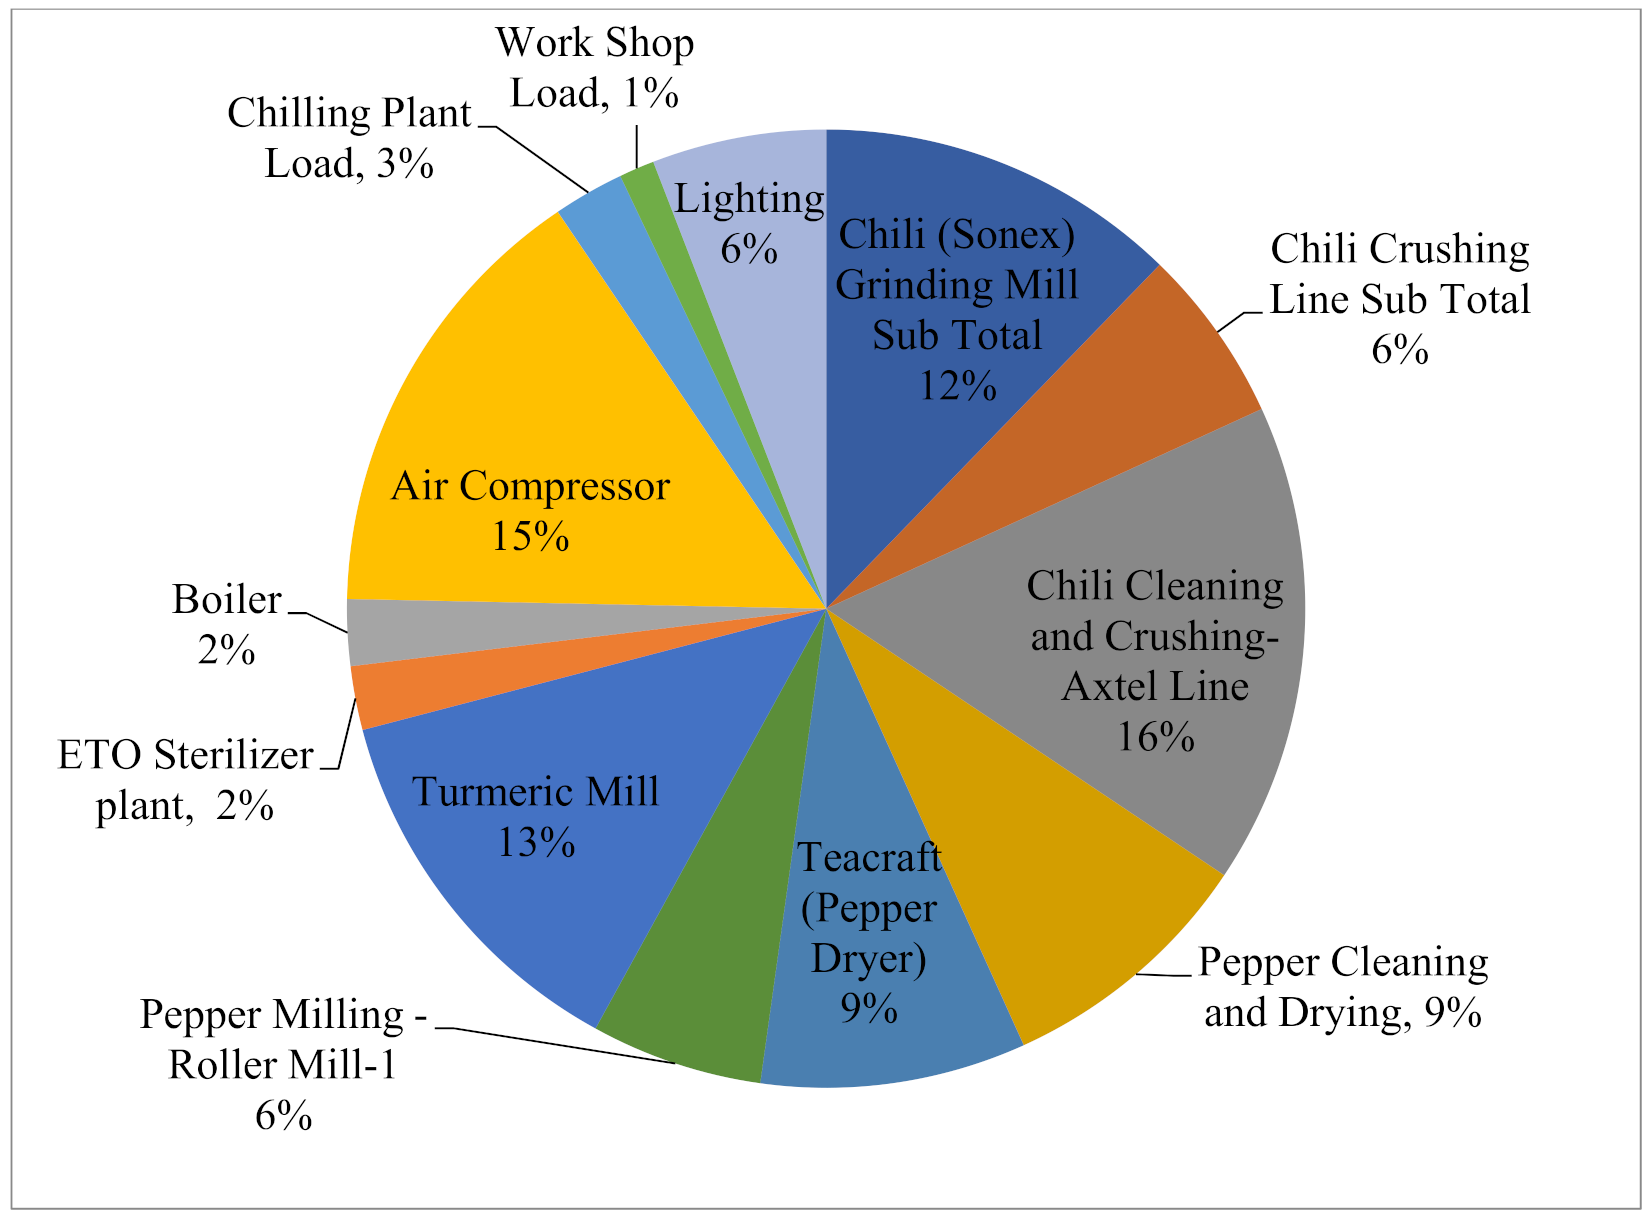
Major Areas of Energy Consumption
2.4. Mathematical Formulation
2.4.1. Load Factor
2.4.2. Estimation of Energy Use
2.4.3. Estimation of Motor Energy Saving by Using VSDs
2.4.4. Estimation of Boiler Energy Savings
2.4.5. Economic Analysis
2.4.6. Payback Period
2.4.7. Estimation of a Capacitor Rating
3. Data, Result Analysis and Discussion
- Electricity
- Compressed air
- Specific energy consumption
- Boiler
- Chilled water
- Motor
- Hot air system
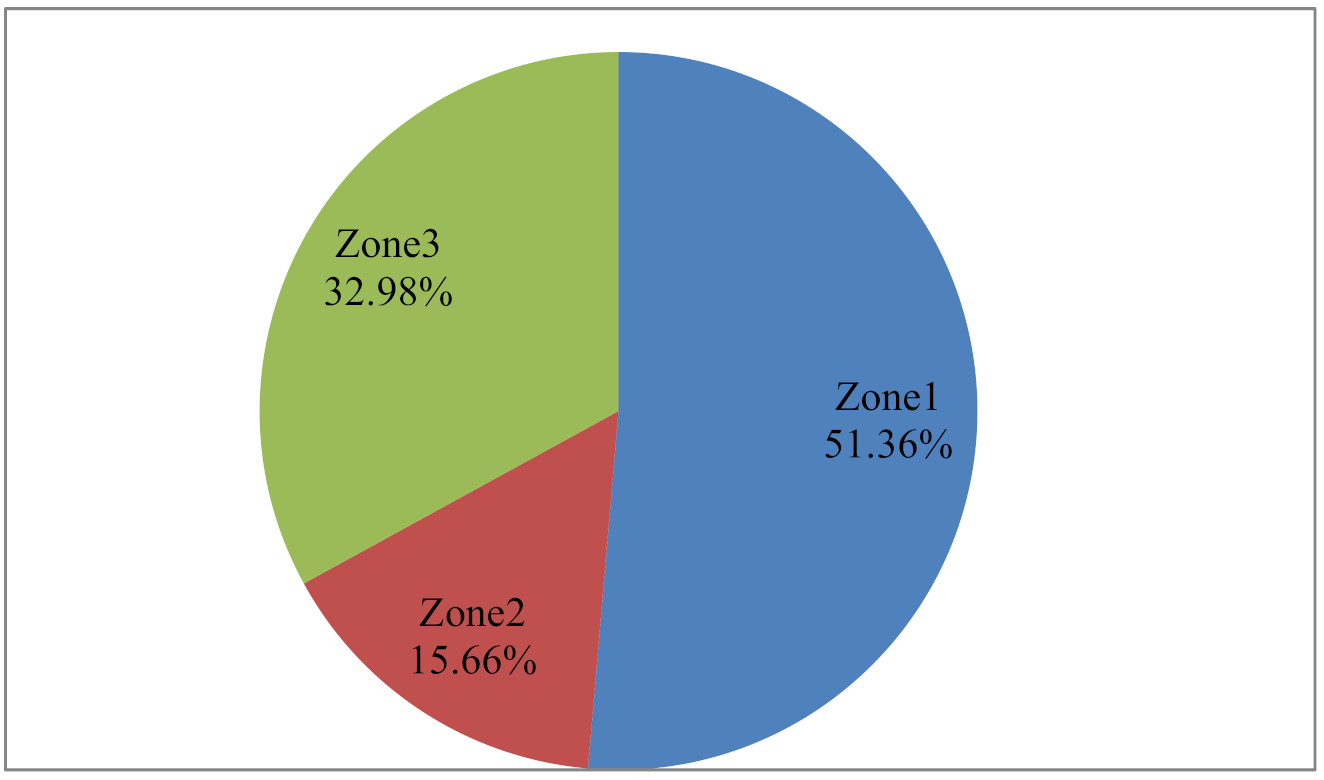
3.1. Electricity
3.2. Compressed Air
3.3. Specific Energy Consumption
3.4. Steam Generation and Boiler Performance Study
3.4.1. Condensate Recovery
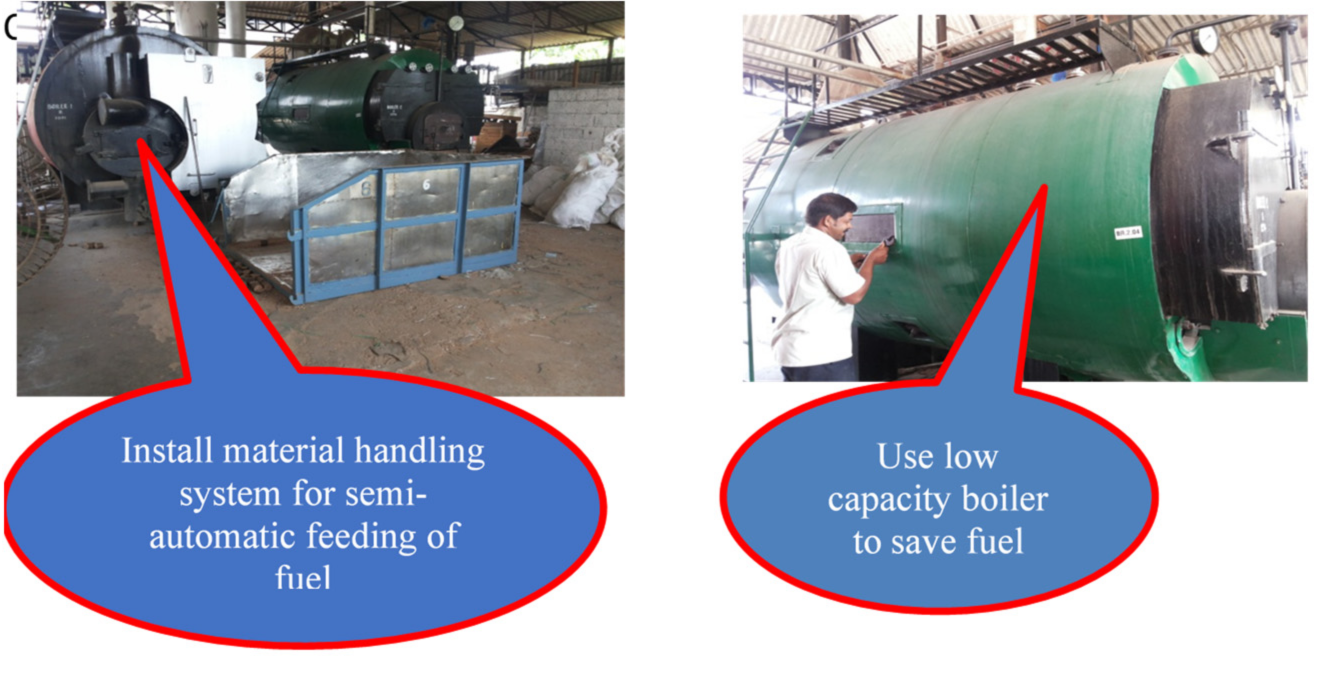
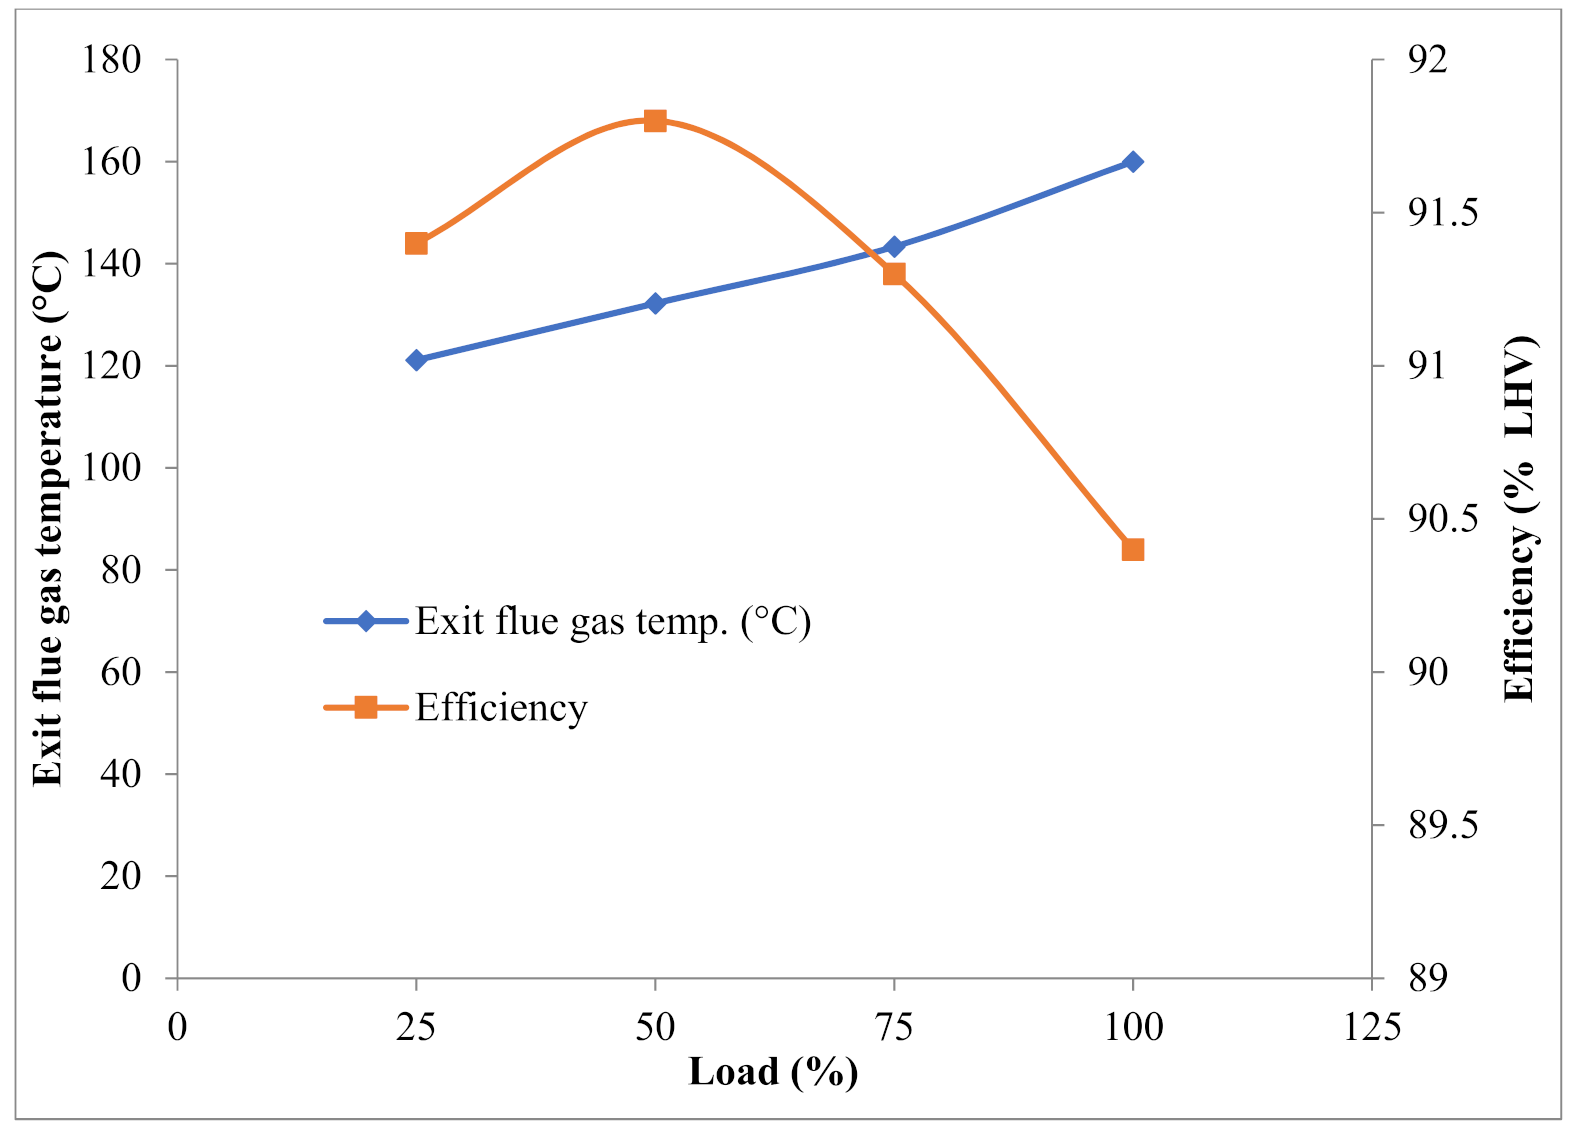
3.4.2. Improving the Load on Boiler
3.5. Compressed Air System Performance
- Conduction of a complete leakage test in the air lines,
- Replacing the existing GI pipes with friction free aluminum pipes to reduce pressure drop,
- Grouping of cleaning points and using a separate low-capacity compressor so that air leakages can be eliminated and the use of high-pressure air can be avoided as below,
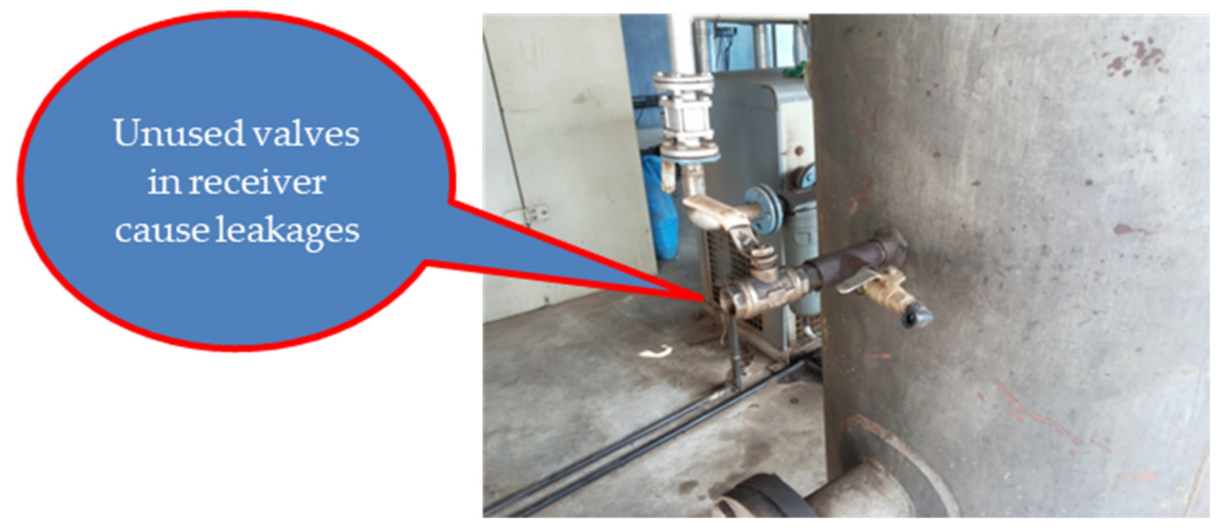
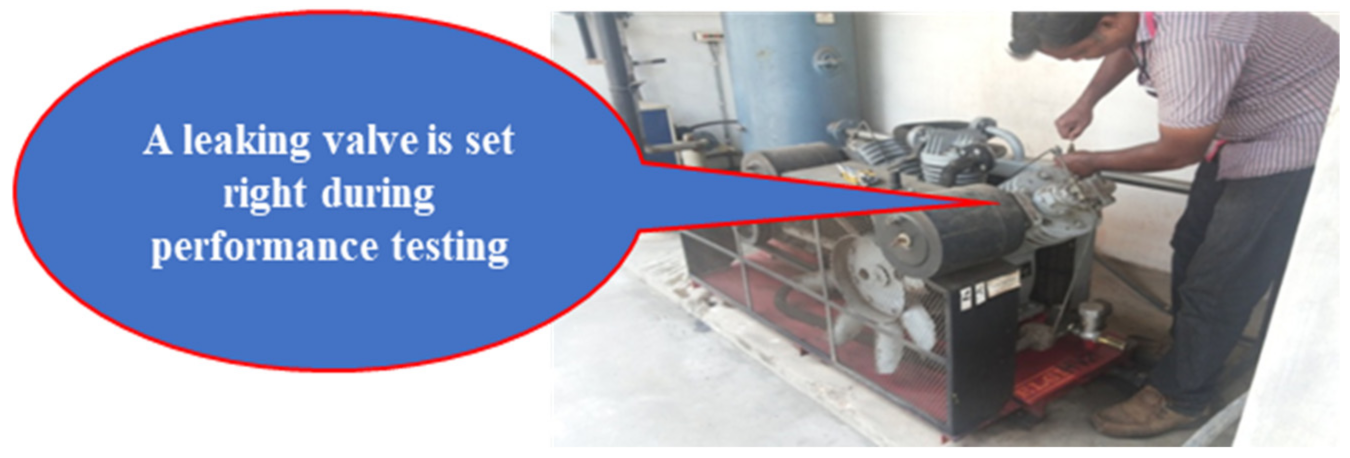
- Replacing the unused valves in receivers and other areas to avoid leakages through defective valves as shown in the Figure 7 below.
3.6. Motor Survey
3.7. Study on Pepper Dryer Hot Air System
- (i).
- The peppers’ hot air and cold air blower system consists of one steam heater with blower for hot air generation and two cold air blowers to supply cooling air to cool the dried pepper. It was observed during the audit that:
- (ii).
- Hot air blower and cold air blowers suction line was 80% choked.
- (iii).
- No significant air flow was measured in these blowers.
- (iv).
- Flow rate from dryer was measured of about 551 kg/.
- (v).
- Cooler surfaces were insulated.
- (vi).
- The steam temperature was measured of about 110 °C and the air temperature was measured of about 60 °C.
- (vii).
- In the cold air blower suction end the filter was completely choked and there was no significant air flow observed in the blower.
- (viii).
- The loads measured in each blower were:
- Cold air blower-1 1.71 kW
- Cold air blower-2 2.17 kW
- Hot air blower 2.39 kW
- ➢
- Regular cleaning of steam heater coil and improve air flow.
- ➢
- Removing the insulation from cooler surfaces.
- ➢
- Isolating the dryer area from cooler area by providing partition strips.
- ➢
- One cooler having the suction near steam trap fan can be removed.
- ➢
- Cleaning the suction filter of the second cooler fan and improve air flow. This flow can be split and connected to the cooler.
- ➢
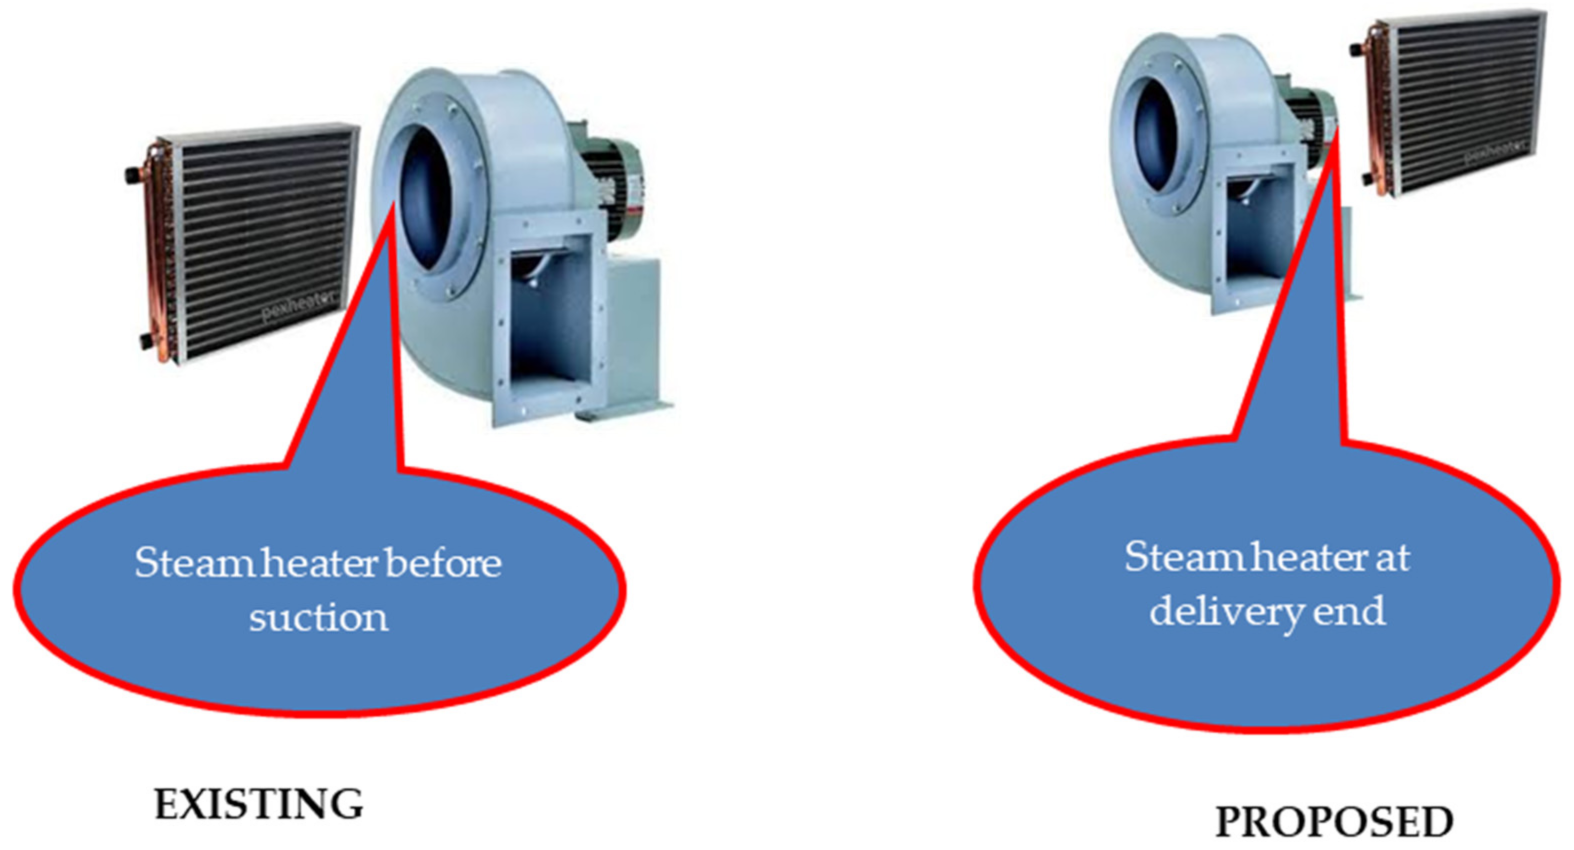
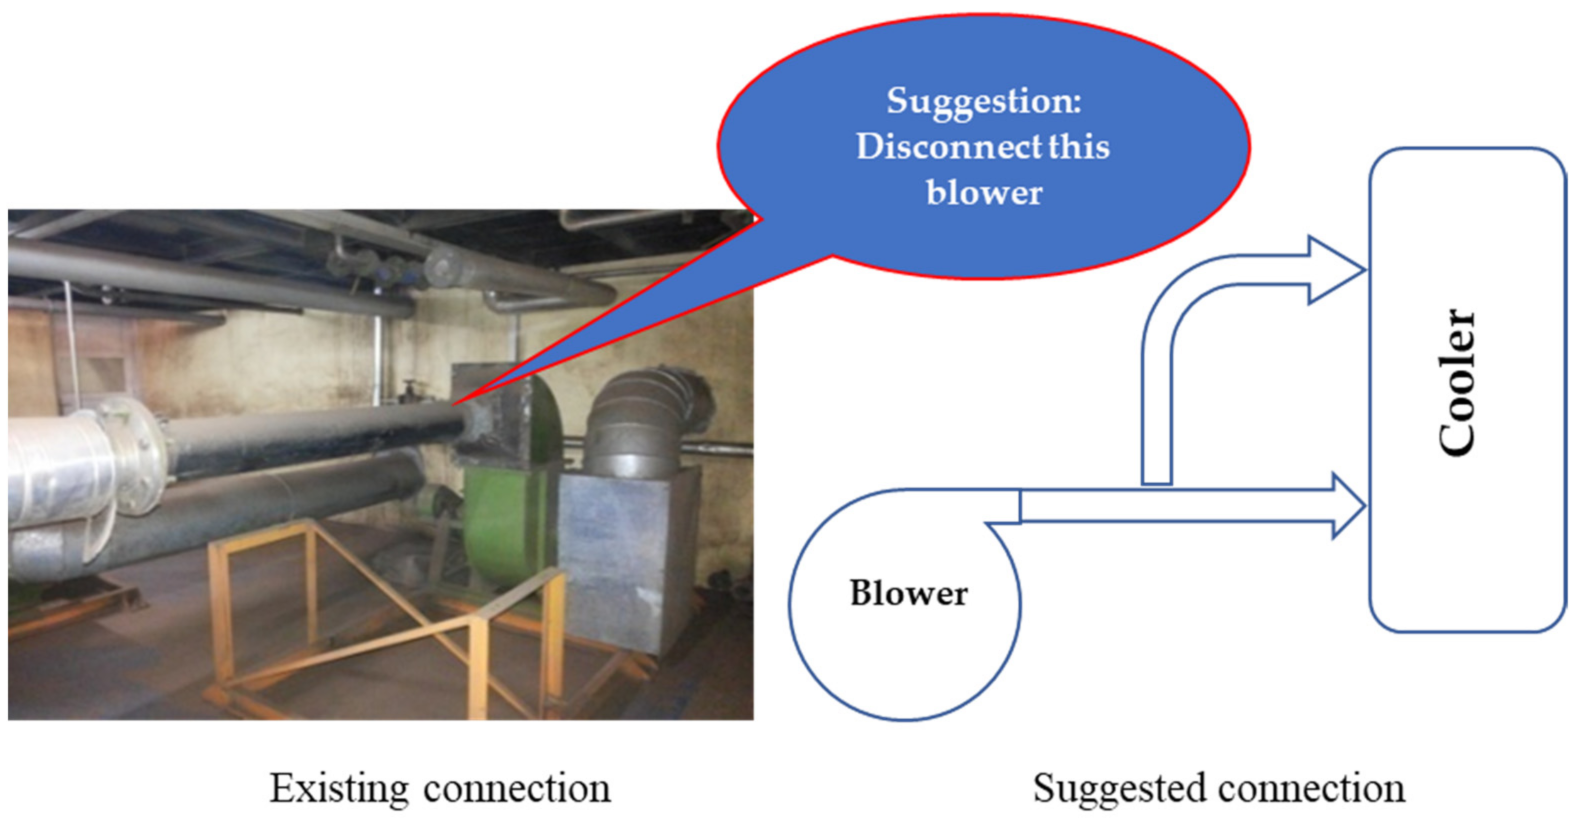
- The steam heater was placed at the suction end of the hot air blower. It was recommended to place the steam heater on the delivery side of the steam heater.
- ➢
- The higher velocity of air at delivery end of the blower will enhance the heat transfer rate and improve efficiency of heat utilization.
- ➢
- At present, the blower handles hot air thus reducing flow rate due to hot gas. If the blower handles cold air, the specific energy consumption will decrease, and flow rate will increase (see Figure 8).
3.8. Cooling Tower Fan
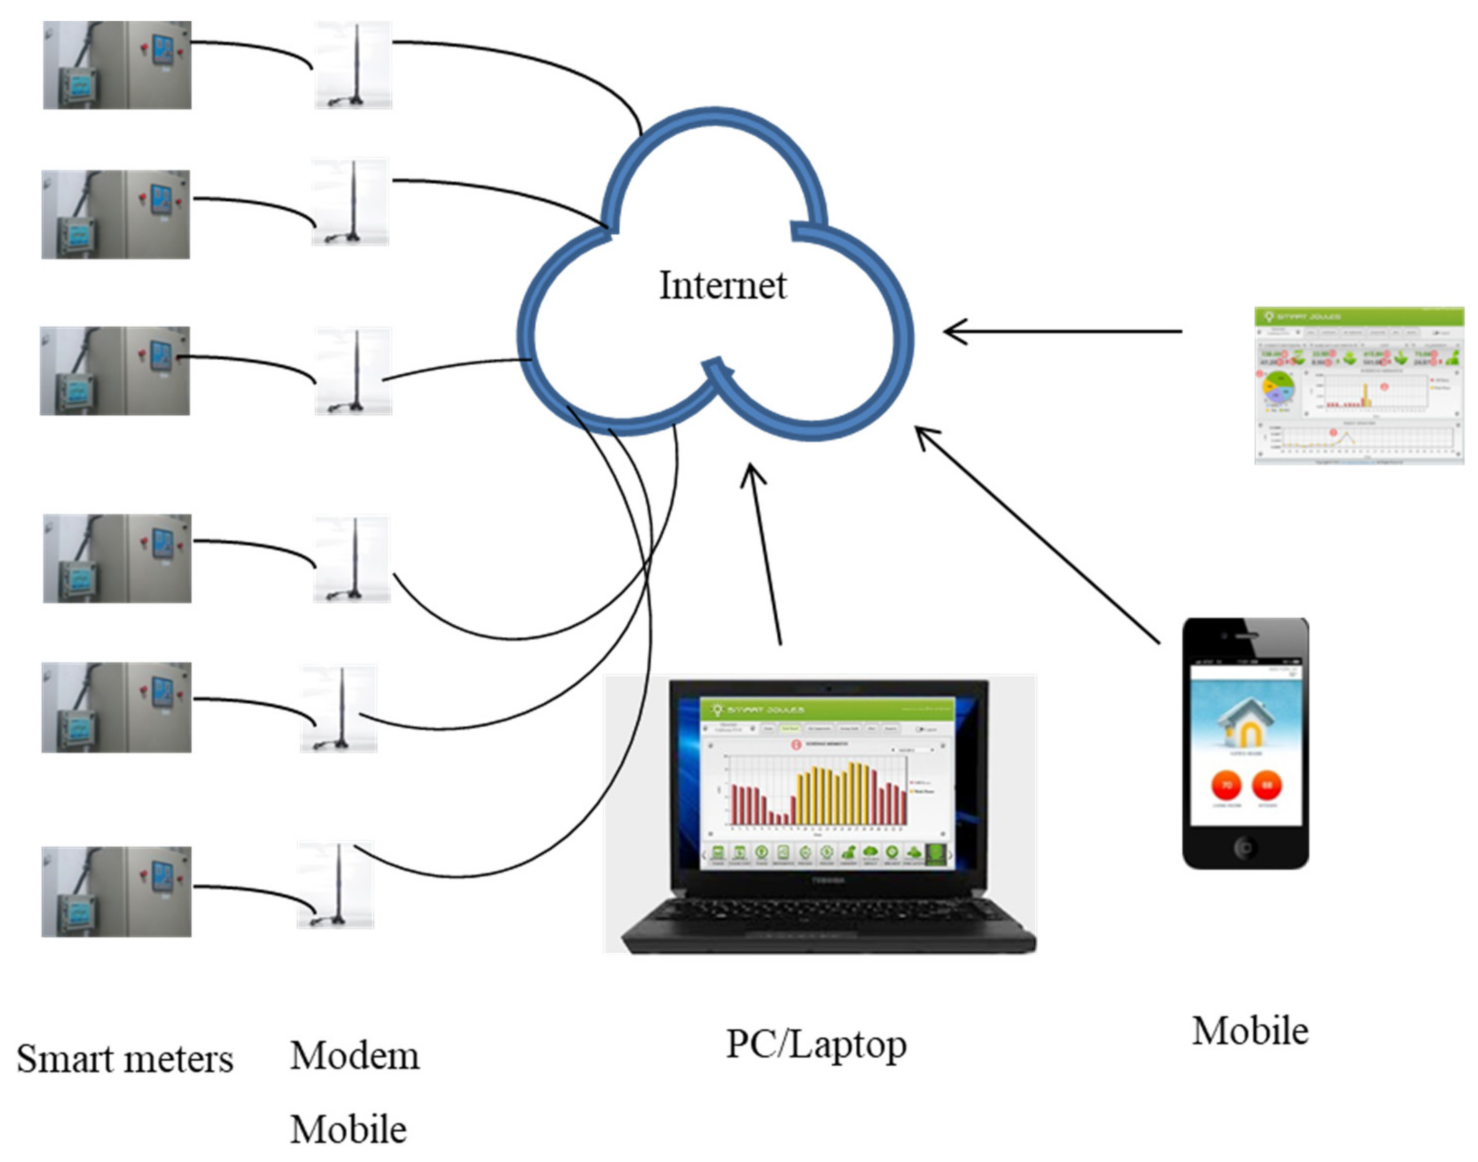
3.9. Improving Monitoring and Control of Energy Consumption
- Main panel
- Turmeric plant
- Chili plant
- Pepper plant
- VAM
- Air compressors
- Hourly energy consumption in a graphical form with values.
- Profile/trend chart for pf and KVA.
- A comparative chart on hourly/monthly/yearly energy consumption along with cost.
- Prediction feature to estimate future demand.
- Mail alerts in case of nearing target values of energy consumption.
- Feature to enter production/fuel consumption/water consumption data manually.
- Generate report on specific energy/fuel/water consumption and energy saving potential in case of low power factor.
3.10. Energy Conservation Options and Recommendations
4. Conclusions
- (a)
- The process of chili cleaning and grinding causes the highest energy consumption (about 34% of total energy) and highest energy intensity (230 kWh/ton) followed by air compressors, approximately 15%, and the turmeric mill, about 227.84 kWh/ton, respectively.
- (b)
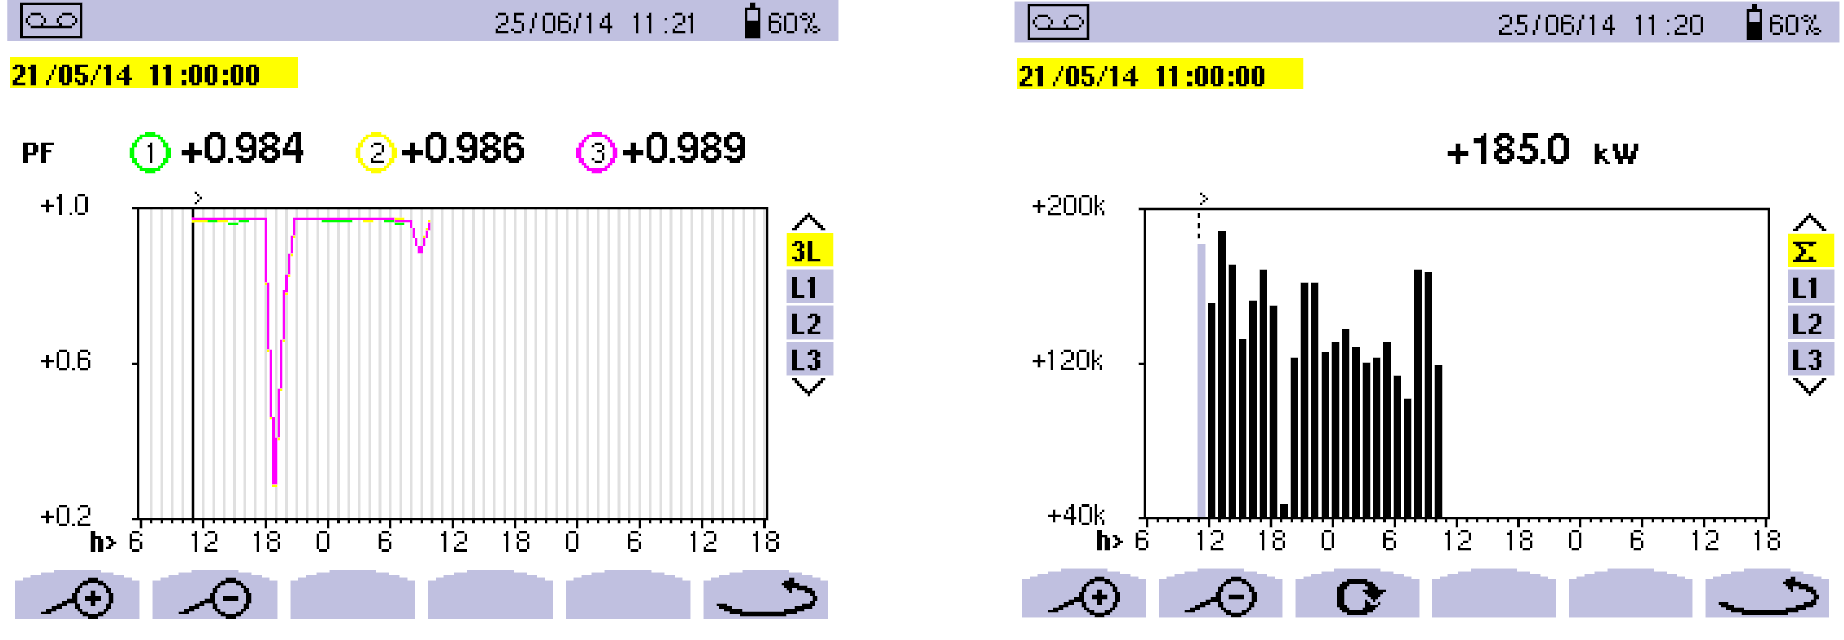
- The average electrical power consumption per month is about 85.36 MWh, where the grid power factor is maintained above 0.95 and at an average of 0.98.
- (c)
- The nonfunctioning capacitor (5 kVAR) would be replaced by APFC panel to improve the power factor of the system.
- (d)
- Energy savings from electric motors can be obtained by using VSDs to ensure maximum energy savings of about 827.10 MWh per annum with PBP below 1 year (in most cases) if the speed of the motors is reduced by about 60%.
- (e)
- The measures considered for condensate recovery of the boilers leads to a reduction of the boiler operational cost by approximately USD 5853.66 per annum, where the water and fuel saving would be 78 kLand 68 ton per annum, respectively.
- (f)
- The enhancement of boilers loading (from 22% to 50%) enables an annual fuel saving of approximately 17 ton of briquettes, where the PBP of the measures taken is found to be about 31 months.
- (g)
- In the case of the panel, the motors used in the cooling water pump, cooling tower fan, workshop panel reading, roller A, roller B, boiler total panel, water pump and D M pump have lower power factors (between 0.51 and 0.74) which causes huge energy losses. Therefore, capacitors of required ratings are suggested for all these motors to enhance the power factor by up to 0.99.
- (h)
- An air-preheater has been suggested to be installed at the output of the boiler to extract the heat from exhausting flue gas which is vastly suitable to preheat the input steam. This measure enables about 68 tons of fuel savings per annum with a PBP of 1 year.
- (i)
- A digital system using “The Smart Joules” software has been proposed to be installed in the plant which will monitor the whole energy system of the plant. This managed to save about 3–5% of total energy per annum with the PBP about one and half years.
Author Contributions
Funding
Institutional Review Board Statement
Informed Consent Statement
Data Availability Statement
Acknowledgments
Conflicts of Interest
Abbreviations
| ABS | Annual Bill Savings |
| AES | Annual Energy Savings |
| AEU | Annual Electrical Energy |
| APFC | Automatic Power Factor Correction |
| CRR | Capacitor Rating Required |
| FAD | Free Air Delivery |
| IEA | International Energy Agency |
| L | Load Factor |
| PBP | Payback Period |
| PF | Power Factor |
| Qf | Heat Recovery |
| VAM | Vapor Absorption Machine |
| VSD | Variable speed drive |
References
- Johansson, I.; Mardan, N.; Cornelis, E.; Kimura, O.; Thollander, P. Designing Policies and Programmes for Improved Energy Efficiency in Industrial SMEs. Energies 2019, 12, 1338. [Google Scholar] [CrossRef] [Green Version]
- Mongia, P.; Schumacher, K.; Sathaye, J. Policy reforms and productivity growth in India’s energy intensive industries. Energy Policy 2001, 29, 715–724. [Google Scholar] [CrossRef]
- Akash, B.A.; Mohsen, M.S. Current situation of energy consumption in the Jordanian industry. Energy Convers. Manag. 2003, 44, 1501–1510. [Google Scholar] [CrossRef]
- Yau, H.Y.; Ng, W.K. A comparison study on energy savings and fungus growth control using heat re-covery devices in a modern tropical operating theatre. Energy Convers. Manag. 2011, 52, 1850–1860. [Google Scholar] [CrossRef]
- Pritoni, M.; Paine, D.; Fierro, G.; Mosiman, C.; Poplawski, M.; Saha, A.; Bender, J.; Granderson, J. Metadata Schemas and Ontologies for Building Energy Applications: A Critical Review and Use Case Analysis. Energies 2021, 14, 2024. [Google Scholar] [CrossRef]
- Liao, F.-F.; Chen, W.-H. Will the Management Structure of Energy Administrators Affect the Achievement of the Electrical Efficiency Mandatory Target for Taiwan Factories? Energies 2021, 14, 2021. [Google Scholar] [CrossRef]
- Milojević, M.; Urbański, M.; Terzić, I.; Prasolov, V. Impact of Non-Financial Factors on the Effectiveness of Audits in Energy Companies. Energies 2020, 13, 6212. [Google Scholar] [CrossRef]
- Tristán, A.; Heuberger, F.; Sauer, A. A Methodology to Systematically Identify and Characterize Ener-gy Flexibility Measures in Industrial Systems. Energies 2020, 13, 5887. [Google Scholar] [CrossRef]
- Luna-Tintos, J.F.; Cobreros, C.; López-Escamilla, Á.; Herrera-Limones, R.; Torres-García, M. Methodology to Evaluate the Embodied Primary Energy and CO2 Production at Each Stage of the Life Cycle of Prefabricated Structural Systems: The Case of the Solar Decathlon Competition. Energies 2020, 13, 4311. [Google Scholar] [CrossRef]
- Oh, S.; Kim, C.; Heo, J.; Do, S.L.; Kim, K.H. Heating Performance Analysis for Short-Term Energy Monitoring and Prediction Using Multi-Family Residential Energy Consumption Data. Energies 2020, 13, 3189. [Google Scholar] [CrossRef]
- Dall’O, G.; Sarto, L.; Panza, A. Infrared Screening of Residential Buildings for Energy Audit Purposes: Results of a Field Test. Energies 2013, 6, 3859–3878. [Google Scholar] [CrossRef] [Green Version]
- Salvadori, G.; Fantozzi, F.; Rocca, M.; Leccese, F. The Energy Audit Activity Focused on the Lighting Systems in Historical Buildings. Energies 2016, 9, 998. [Google Scholar] [CrossRef] [Green Version]
- Rospi, G.; Cardinale, N.; Negro, E. Energy Performance and Economic Feasibility Study of Historical Building in the City of Matera, Southern Italy. Energies 2017, 10, 2009. [Google Scholar] [CrossRef] [Green Version]
- Chan, M.H.E.; Chu, K.-K.; Chow, H.-F.; Tsang, C.-W.; Ho, C.K.D.; Ho, S.-K. Improving the Energy Efficiency of Petrochemical Plant Operations: A Measurement and Verification Case Study Using a Balanced Wave Optimizer. Energies 2019, 12, 4136. [Google Scholar] [CrossRef] [Green Version]
- Hwang, K.D.; Cho, J.; Moon, J. Feasibility Study on Energy Audit and Data Driven Analysis Proce-dure for Building Energy Efficiency: Bench-Marking in Korean Hospital Buildings. Energies 2019, 12, 3006. [Google Scholar] [CrossRef] [Green Version]
- González, G.A.; García-Sanz-Calcedo, J.; Salgado, D.R. Evaluation of Energy Con-sumption in German Hospitals: Benchmarking in the Public Sector. Energies 2018, 11, 2279. [Google Scholar] [CrossRef] [Green Version]
- Franzitta, V.; Longo, S.; Sollazzo, G.; Cellura, M.; Celauro, C. Primary Data Collection and Environmental/Energy Audit of Hot Mix Asphalt Production. Energies 2020, 13, 2045. [Google Scholar] [CrossRef] [Green Version]
- Locmelis, K.; Blumberga, D.; Blumberga, A.; Kubule, A. Benchmarking of Industrial Energy Efficiency. Outcomes of an Energy Audit Policy Program. Energies 2020, 13, 2210. [Google Scholar] [CrossRef]
- Sait, H.H. Auditing and analysis of energy consumption of an educational building in hot and humid area. Energy Convers. Manag. 2013, 66, 143–152. [Google Scholar] [CrossRef]
- Priambodo, A.; Kumar, S. Energy use and carbon dioxide emission of Indonesian small and medium scale industries. Energy Convers. Manag. 2001, 42, 1335–1348. [Google Scholar] [CrossRef]
- Ilic, D.D.; Trygg, L. Economic and environmental benefits of converting industrial processes to district heating. Energy Convers. Manag. 2014, 87, 305–317. [Google Scholar] [CrossRef] [Green Version]
- Engin, T.; Ari, V. Energy auditing and recovery for dry type cement rotary kiln systems—A case study. Energy Convers. Manag. 2005, 46, 551–562. [Google Scholar] [CrossRef]
- Hepbasli, A.; Ozalp, N. Development of energy efficiency and management implementation in the Turkish industrial sector. Energy Convers. Manag. 2003, 44, 231–249. [Google Scholar] [CrossRef]
- Ozkan, B.; Akcaoz, H.; Karadeniz, F. Energy requirement and economic analysis of citrus production in Turkey. Energy Convers. Manag. 2004, 45, 1821–1830. [Google Scholar] [CrossRef]
- Bellarmine, T.G.; Arokiaswamy, N.S.S. Energy management techniques to meet power shortage problems in India. Energy Convers. Manag. 1996, 37, 319–328. [Google Scholar] [CrossRef]
- Mathur, J.; Bansal, N.K.; Wagner, H.-J. Investigation of greenhouse gas reduction potential and change in technological selection in Indian power sector. Energy Policy 2003, 31, 1235–1244. [Google Scholar] [CrossRef]
- Dutta, M.; Mukherjee, S. An outlook into energy consumption in large scale industries in India: The cases of steel, aluminium and cement. Energy Policy 2010, 38, 7286–7298. [Google Scholar] [CrossRef]
- Gielen, D.; Taylor, P. Indicators for industrial energy efficiency in India. Energy 2009, 34, 962–969. [Google Scholar] [CrossRef]
- Spice. 2014. Available online: http://en.wikipedia.org/wiki/Spice (accessed on 26 June 2014).
- Thirugnanasambandam, M.; Hasanuzzaman, M.; Saidur, R.; Ali, M.B.; Rajakarunakaran, S.; Devaraj, D.; Rahim, N.A. Analysis of electrical motors load factors and energy savings in an Indian cement industry. Energy 2011, 36, 4307–4314. [Google Scholar] [CrossRef]
- Christoffersen, B.L.; Larsen, A.; Togeby, M. Empirical analysis of energy management in Danish industry. J. Clean. Prod. 2006, 14, 516–526. [Google Scholar] [CrossRef]
- Öztürk, H.K. Energy usage and cost in textile industry: A case study for Turkey. Energy 2005, 30, 2424–2446. [Google Scholar] [CrossRef]
- Saidur, R.; Rahim, N.A.; Ping, H.; Jahirul, M.; Mekhilef, S.; Masjuki, H. Energy and emission analysis for industrial motors in Malaysia. Energy Policy 2009, 37, 3650–3658. [Google Scholar] [CrossRef]
- Bala Subrahmanya, M. Labour productivity, energy intensity and economic performance in small enterpris-es: A study of brick enterprises cluster in India. Energy Convers. Manag. 2006, 47, 763–777. [Google Scholar] [CrossRef]
- Saidur, R. A review on electrical motors energy use and energy savings. Renew. Sustain. Energy Rev. 2010, 14, 877–898. [Google Scholar] [CrossRef]
- Nadel, S. Energy-Efficient Motor Systems: A Handbook on Technology, Programs, and Policy Opportunities; Amer Council for an Energy: Washington, DC, USA, 2000. [Google Scholar]
- Loganthurai, P.; Rajasekaran, V.; Gnanambal, K. Optimization of operating schedule of machines in granite industry using evolutionary algorithms. Energy Convers. Manag. 2014, 86, 809–817. [Google Scholar] [CrossRef]
- De Almeida, A.T.; Fonseca, P.; Bertoldi, P. Energy-efficient motor systems in the industrial and in the services sectors in the European Union: Characterisation, potentials, barriers and policies. Energy 2003, 28, 673–690. [Google Scholar] [CrossRef] [Green Version]
- Garcia, A.G.P.; Szklo, A.S.; Schaeffer, R.; McNeil, M.A. Energy-efficiency standards for electric motors in Brazilian industry. Energy Policy 2007, 35, 3424–3439. [Google Scholar] [CrossRef]
- Sola, H.A.V.; Mota, C.M.d.M. A multi-attribute decision model for portfolio selection aiming to replace technologies in industrial motor systems. Energy Convers. Manag. 2012, 57, 97–106. [Google Scholar] [CrossRef]
- Einstein, D.; Worrell, E.; Khrushch, M. Steam Systems in Industry: Energy Use and Energy Efficiency Improvement Potentials; Lawrence Berkeley National Laboratory: Berkeley, CA, USA, 2001. [Google Scholar]
- ERC, I. How to Save Energy and Money in Boilers and Furnace Systems; Energy Research Centre (ERC), University of Cape Town: Cape Town, South Africa, 2004. [Google Scholar]
- Jayamaha, L. Energy-Efficient Building Systems: Green Strategies for Operation and Maintenance; McGraw Hill Professional: New York, NY, USA, 2006. [Google Scholar]
- Yeh, S.; Rubin, E.S. A centurial history of technological change and learning curves for pulverized coalfired utility boilers. Energy 2007, 32, 1996–2005. [Google Scholar] [CrossRef]
- Saidur, R.; Ahamed, J.; Masjuki, H. Energy, exergy and economic analysis of industrial boilers. Energy Policy 2010, 38, 2188–2197. [Google Scholar] [CrossRef]
- Salam, R.A.; Amber, K.P.; Ratyal, N.I.; Alam, M.; Akram, N.; Gómez Muñoz, C.Q.; García Márquez, F.P. An Overview on Energy and Development of Energy Integration in Major South Asian Coun-tries: The Building Sector. Energies 2020, 13, 5776. [Google Scholar] [CrossRef]
- Sharma, P.; Mahajan, R.; Sharma, Y. Investigation of the Energy Audit Practice in India. Int. J. Res. Anal. Rev. 2018, 5, 767–772. [Google Scholar]
- Pandey, A.K.; Prakash, R. Energy Conservation Opportunities in Pulp & Paper Industry. Open J. Energy Effic. 2018, 07, 89–99. [Google Scholar] [CrossRef] [Green Version]
- Carpenter, K.; Kissock, K.; D’Antonio, M. Common excess air trends in industrial boilers with single-point positioning control and strategies to optimize efficiency. In ACEEE Summer Study on Energy Efficiency in Industry; American Council for an Energy-Efficient Economy: Washington, DC, USA, 2007. [Google Scholar]


| Country | Motor Energy Usage (%) |
|---|---|
| Australia | 30 |
| Brazil | 49 |
| Canada | 80 |
| China | 60 |
| EU | 65 |
| India | 70 |
| Jordan | 31 |
| Korea | 40 |
| Malaysia | 48 |
| Slovenia | 52 |
| South Africa | 60 |
| Turkey | 65 |
| UK | 50 |
| US | 75 |
| Product Name(s) | Amount (ton/Month) |
|---|---|
| Chili powder | 112 |
| Turmeric powder | 390 |
| Processed pepper | 68 |
| Serial No. | Instruments Name | Manufacturer and Model | Measuring Range and Specifications | Purpose |
|---|---|---|---|---|
| 1 | Weatherproof multifunction clamp on ultrasonic flow meter (liquid flow only) | EESIFLO International PORTALOK 7S | ACCESSORIES: Flow meter probe Range: −30 to 100 °C Model no.: P5l7 24695, U211 Made by: SKINTOP Accuracy: ±1% Linearity: 0.5% Repeatability: 0.2% | Water flow measurement through pipes |
| 2 | 3 phase power and harmonics analyzer | EXTECH INSTRUMENTS 382095 | ACCESSORIES: 1. Current probe Range: 1/10/100 A: 10/100/100 A: 300/3000 A Model: 382097 Accuracy: ±2% 2. Voltage probe Made by: Chising, Model: TL88-4 Range: 600 V Accuracy: ±2% | Electrical parameters measurement |
| 3 | Flexible CT probe | EXTECH INSTRUMENTS 382098 | 0 to 3000 A | Power analyzer |
| 4 | Combustion analyzer | KANE International Ltd. KANE 900 plus | Standard probe | CO2, O2 and excess air in flue gas measurement |
| 5 | IR thermometer with wireless interface | EXTECH INSTRUMENTS 42560 | ACCESSORIES: 1. Temp. probe (−30 to 300 °C) 2. Transmitter Base: Sl.no.:10079526 Accuracy: ±(1% of reading + 20 F/10 °C) Laser point: −50 to 1050 °C K-Type range: −50 to 1370 °C | Surface temperature measurement |
| Sl. No | Location | kWa |
|---|---|---|
| Process Machines | ||
| 1 | Chili (Sonex) Grinding Mill sub total | 23.63 |
| 2 | Chili Crushing Line sub total | 11.36 |
| 3 | Chili Cleaning and Crushing-Axtel Line | 31.28 |
| 4 | Pepper Cleaning and Drying | 17.05 |
| 5 | Teacraft (pepper dryer) | 17.27 |
| 6 | Pepper milling -roller mill-1 | 11.18 |
| 7 | Turmeric mill | 24.92 |
| 8 | ETO sterilizer plant | 4.15 |
| Sub-Total | 140.84 | |
| Utility | ||
| 1 | Boiler | 4.32 |
| 2 | Air compressor | 29.33 |
| 3 | Vapor Absorption Machine (VAM) | 4.61 |
| 4 | Workshop load | 2.30 |
| 5 | Lighting | 11.32 |
| Sub-Total | 51.88 | |
| Gross Total | 192.72 |
| Bill Date | Recorded Demand (kVA) | Recorded Pf | Energy Consumption (kWh) | Total (kWh) | Total Cost (USD) | USD/kWh | ||
|---|---|---|---|---|---|---|---|---|
| Zone 1 | Zone 2 | Zone 3 | ||||||
| 03-04-2014 | 264.05 | 0.98 | 49,790 | 16,030 | 31,010 | 96,830 | 7135.11 | 0.074 |
| 04-03-2014 | 267.42 | 0.98 | 47,370 | 15,750 | 30,670 | 93,790 | 8470.97 | 0.090 |
| 04-02-2014 | 273.22 | 0.98 | 52,335 | 17,780 | 34,875 | 104,990 | 9312.04 | 0.089 |
| 07-01-2014 | 270.41 | 0.98 | 51,565 | 17,225 | 28,865 | 97,655 | 8867.79 | 0.091 |
| 05-12-2013 | 266.53 | 0.99 | 49,805 | 15,130 | 30,010 | 94,945 | 8547.35 | 0.090 |
| 05-11-2013 | 271.31 | 0.99 | 40,615 | 14,105 | 26,175 | 80,895 | 7521.63 | 0.093 |
| 04-10-2013 | 272.95 | 0.99 | 40,850 | 13,435 | 24,860 | 79,145 | 7374.44 | 0.093 |
| 03-09-2013 | 267.04 | 0.99 | 44,655 | 15,810 | 29,830 | 90,295 | 8208.29 | 0.091 |
| 05-08-2013 | 261.81 | 0.99 | 38,505 | 12,355 | 25,325 | 76,185 | 7104.03 | 0.093 |
| 04-07-2013 | 260.87 | 0.99 | 34,115 | 5705 | 23,135 | 62,955 | 5906.76 | 0.094 |
| 04-06-2013 | 256.46 | 0.99 | 39,000 | 3460 | 28,630 | 71,090 | 7007.64 | 0.099 |
| 04-05-2013 | 271.95 | 0.97 | 37,470 | 13,625 | 24,430 | 75,525 | 7233.53 | 0.096 |
| Average | 267.00 | 0.985 | - | - | - | - | - | 0.091 |
| Total | - | - | 526,075 | 160,410 | 337,815 | 1,024,300 | 92,689.57 | - |
| Date | Location | Rating (kVAR) | A Rating/Ph. | A (Actual) | % Derating | Remark (s) | ||
|---|---|---|---|---|---|---|---|---|
| R | Y | B | ||||||
| - | AFC Panel | 5 | 6.65 | 0 | 0 | 0 | 100 | Replace the Capacitor |
| Plant | Power (kW) | Run (h) | Energy Consumption (kWh) | Production (kg) | kWh/kg | kWh/ton | ||
|---|---|---|---|---|---|---|---|---|
| Sonex Grinding Mill, chili | 26.63 | 16 | 426.08 | 4375 | 0.10 | 97.39 | ||
| Chili Cleaning and Crushing-Axtel Line | 31.28 | 16 | 500.48 | 2176 | 0.23 | 230.00 | ||
| Teacraft- Processed Pepper | 17.27 | 24 | 414.48 | 3870 | 0.11 | 107.10 | ||
| Pepper Milling -Roller Mill-1 | 17.18 | 16 | 274.88 | 2676 | 0.10 | 102.72 | ||
| Turmeric Mill | 24.92 | 16 | 398.72 | 1750 | 0.23 | 227.84 |
| Parameter | Unit | Value |
|---|---|---|
| Year of manufacture | 1999 | |
| Type | Shell and tube | |
| Type of fuel | briquettes | |
| Evaporation capacity | MT/h | 2 |
| Steam pressure | bar | 9 |
| Steam condition | - | dry |
| Heat transfer area | m2 | Not available |
| Feed water temperature | °C | 28 |
| Flue gas temperature | °C | 260 |
| Condensate return temperature | °C | 75 |
| Is there any waste heat recovery installed | No | |
| Type of draft | Induced | |
| Feed water TDS | ppm | 300 |
| Parameter | Unit | Value | Recommended Value |
|---|---|---|---|
| Boiler type | Shell and tube, Two-pass | ||
| Made by | Thermax | ||
| Rated capacity | ton/h | 2 | |
| Steam generation | ton/h | 440 | |
| Boiler loading | % | 22 | |
| Steam pressure | bar | 9 | |
| Steam condition | - | Dry saturated | |
| Steam enthalpy | Kcal/kg | 670 | |
| Feed water temperature | °C | 28 | >80 |
| Feed water enthalpy | Kcal/kg | 28 | |
| Flue gas temperature | °C | 260 | 180 |
| Fuel type | Briquette | ||
| Fuel consumption | kg/h | 125 | |
| GCV | Kcal/kg | 4200 | |
| Feed water TDS | ppm | 300 | 3000 |
| O2% in the flue gas | % | 4.5 | 8 |
| Excess air | % | 27 | <30 |
| Stoichiometric air required | kg/kg of fuel | 11 | |
| Energy recovered through air preheater | kg/h | Nil | Proposed to install |
| Thermal efficiency based on direct method | % | 56.14 | |
| Condensate recovery | Nil | ||
| Air preheating | Nil |
| Parameter | Unit | Value |
|---|---|---|
| Condensate temperature | °C | 75 |
| Quantity collected | Lit/shift | 1990 |
| Heat in condensate | Kcal | 149,250 |
| Calorific value of fuel | Kcal/kg | 4200 |
| Fuel equivalent (utilized) | kg/shift | 35.53 |
| Boiler efficiency | % | 56.14 |
| Fuel equivalent input | kg/shift | 63 |
| Operation duration/shift | h | 8 |
| Number of shifts in a day | - | 3 |
| Fuel saved per day | kg | 189 |
| Annual fuel saving for 360 days | ton | 68 |
| Cost of fuel | USD/ton | 73.17 |
| Annual cost saving | USD | 4975.61 |
| Water recycled | kL/annum | 716 |
| Cost of water | USD/kL | 1.30 |
| Annual cost saving due to water recycling | USD | 931.38 |
| Total cost saving (fuel + water) | USD | 5907 |
| Approximate investment for installing additional collection tank, pump and piping to take the condensate to feed water tank | USD | 5691.06 |
| PBP | Months | 12 |
| Type | Power (HP) | Rated cfm | Running h | Actual cfm | Generation Efficiency (%) | Operating Power (kW) | Actual Power (kW) | Internal Leakage cfm |
|---|---|---|---|---|---|---|---|---|
| Screw Type | 50 | 150 | 24 | 145 | 96 | 9 | 29.33 | 10 |
| Reciprocating | 20 | 80 | Stand by | 56 | 69 | 8 | 14 | 24 |
| Parameter | Unit | Value | Recommended |
|---|---|---|---|
| Type | - | Screw | |
| Make | - | Atlas Copco | |
| No. of compressor | - | 1 | |
| Type of loading | - | Intermittent | |
| Application | - | Pneumatic valve and cleaning | |
| Set pressure (max) | bar | 8.9 | |
| Set pressure (min) | bar | 7.9 | |
| Rated power | kW | 30 | |
| Rated FAD | cfm | 150 | |
| Running load | kW | 29.33 | |
| Loading on compressor | % | 97.76 | |
| FAD actual | cfm | 145 | @ > 95% generation |
| Specific power consumption | kW/cfm | 0.20 | |
| Leakage observed | cfm | 10 | @ 6% within generation point |
| Energy lost per day | kWh | 48 | |
| If leakage is arrested cost saving would be per day | USD | 4.34 | |
| Annual energy saving | MWh | 17.28 | |
| Annual cost saving | USD | 1561 | |
| Investment for leakage minimization | USD | 813 | |
| Payback | Months | 6 |
| Motor’s Location | HP | kWr | pf | kWa | Load Factor, L (%) | AEU (MWh) | Annual Energy Savings, AES (MWh) | Annual Bill Savings, ABS (USD) | Payback Period, PBP (Months) | ||||||
|---|---|---|---|---|---|---|---|---|---|---|---|---|---|---|---|
| 20% | 40% | 60% | 20% | 40% | 60% | 20% | 40% | 60% | |||||||
| Chili (Sonex) Grinding Mill | |||||||||||||||
| Pulverizer-2 | 30 | 22.38 | 0.99 | 16.60 | 74.16 | 96.94 | 19.39 | 38.78 | 58.17 | 1727.93 | 3455.86 | 5183.79 | 12 | 6 | 4 |
| Pulverizer Blower | 7.5 | 5.60 | 0.99 | 4.07 | 72.79 | 23.77 | 4.75 | 9.51 | 14.26 | 423.66 | 847.31 | 1270.97 | 12 | 6 | 4 |
| Chili Crushing Line | |||||||||||||||
| Conveying Blower | 15 | 11.19 | 0.98 | 6.75 | 60.30 | 39.42 | 7.88 | 15.77 | 23.65 | 702.62 | 1405.24 | 2107.87 | 15 | 7 | 5 |
| Cyclon and R.A.L.V. | 7.5 | 5.60 | 0.98 | 4.62 | 82.51 | 26.98 | 5.40 | 10.79 | 16.19 | 480.91 | 961.81 | 1442.72 | 11 | 5 | 4 |
| Chili Cleaning and Crushing-Axtel Line | |||||||||||||||
| Conveying Blower | 25 | 18.65 | 0.98 | 16.38 | 87.84 | 95.66 | 19.13 | 38.26 | 57.40 | 1705.03 | 3410.06 | 5115.09 | 10 | 5 | 3 |
| Hammer Mill | 30 | 22.38 | 0.96 | 8.70 | 38.85 | 50.81 | 10.16 | 20.32 | 30.49 | 905.60 | 1811.20 | 2716.81 | 23 | 12 | 8 |
| Blower | 5 | 3.73 | 0.98 | 3.64 | 97.68 | 21.26 | 4.25 | 8.50 | 12.76 | 378.90 | 757.79 | 1136.69 | 9 | 5 | 3 |
| Water Scrubbers ID Fan | 5 | 3.73 | 0.99 | 3.40 | 91.15 | 19.86 | 3.97 | 7.94 | 11.91 | 353.91 | 707.83 | 1061.74 | 10 | 5 | 3 |
| Pepper Cleaning and Drying | |||||||||||||||
| Main Panel | 31 | 23.13 | 0.85 | 17.05 | 73.75 | 149.36 | 29.87 | 59.74 | 89.61 | 2662.16 | 5324.31 | 7986.47 | 8 | 4 | 3 |
| Tea craft (Pepper Dryer) | |||||||||||||||
| Dust Collector | 7.5 | 5.60 | 0.97 | 5.25 | 93.75 | 45.99 | 9.20 | 18.40 | 27.59 | 819.73 | 1639.45 | 2459.18 | 6 | 3 | 2 |
| Hot Air Blower | 7.5 | 5.60 | 0.97 | 2.39 | 42.66 | 20.94 | 4.19 | 8.37 | 12.56 | 373.17 | 746.34 | 1119.51 | 14 | 7 | 5 |
| Vacuum Sucking Motor | 7.5 | 5.60 | 0.84 | 4.75 | 84.84 | 41.61 | 8.32 | 16.64 | 24.97 | 741.66 | 1483.31 | 2224.97 | 7 | 3 | 2 |
| Cold Air Blower -1 | 3 | 2.24 | 0.90 | 1.71 | 76.54 | 14.98 | 3 | 6 | 9 | 267.00 | 534.00 | 801.00 | 8 | 4 | 3 |
| Cold Air Blower-2 | 3 | 2.24 | 0.94 | 2.17 | 97.06 | 19.01 | 3.80 | 7.60 | 11.41 | 338.82 | 677.64 | 1016.46 | 6 | 3 | 2 |
| Pepper Milling -Roller Mill-1 | |||||||||||||||
| Roller A | 10 | 7.46 | 0.69 | 3.41 | 45.74 | 19.91 | 3.98 | 7.97 | 11.95 | 354.95 | 709.91 | 1064.86 | 20 | 10 | 7 |
| Roller B | 10 | 7.46 | 0.74 | 3.62 | 48.53 | 21.14 | 4.23 | 8.46 | 12.68 | 376.81 | 753.63 | 1130.44 | 19 | 9 | 6 |
| Blower | 7.5 | 5.60 | 0.99 | 4.15 | 74.12 | 24.24 | 4.85 | 9.69 | 14.54 | 431.98 | 863.97 | 1295.95 | 12 | 6 | 4 |
| Turmeric mill | |||||||||||||||
| Pre-grinder | 20 | 14.92 | 0.99 | 12.30 | 82.44 | 71.83 | 14.37 | 28.73 | 43.10 | 1280.33 | 2560.67 | 3841.00 | 11 | 5 | 4 |
| Sonex Mill | 50 | 37.3 | 0.94 | 12.62 | 33.83 | 73.70 | 14.74 | 29.48 | 44.22 | 1313.64 | 2627.29 | 3940.93 | 27 | 13 | 9 |
| Eto Sterilizer Plant | |||||||||||||||
| Water Pump | 1 | 0.746 | 0.75 | 0.64 | 85.36 | 5.61 | 1.12 | 2.24 | 3.36 | 99.93 | 199.86 | 299.79 | 7 | 3 | 2 |
| Vacuum Pump | 5 | 3.73 | 0.86 | 3.52 | 94.27 | 30.84 | 6.17 | 12.33 | 18.50 | 549.61 | 1099.21 | 1648.82 | 6 | 3 | 2 |
| Boiler | |||||||||||||||
| Water pump | 5 | 3.73 | 0.51 | 1.94 | 52.03 | 16.99 | 3.40 | 6.80 | 10.20 | 302.91 | 605.82 | 908.73 | 12 | 6 | 4 |
| D M pump motor | 1 | 0.746 | 0.72 | 0.43 | 58.23 | 3.77 | 0.75 | 1.51 | 2.26 | 67.14 | 134.28 | 201.42 | 10 | 5 | 3 |
| Compressor | |||||||||||||||
| Atlas Copco Compressor | 40 | 30 | 0.91 | 29.33 | 97.76 | 256.93 | 51.39 | 102.77 | 154.16 | 4579.53 | 9159.07 | 13,738.6 | 6 | 3 | 2 |
| LG Screw Compressor | 20 | 14.92 | 0.90 | 9.28 | 62.20 | 81.29 | 16.26 | 32.52 | 48.78 | 1448.96 | 2897.93 | 4346.89 | 10 | 5 | 3 |
| Chilling Plant | |||||||||||||||
| Cooling water pump | 5 | 3.73 | 0.65 | 2.27 | 60.74 | 19.89 | 3.98 | 7.95 | 11.93 | 354.43 | 708.87 | 1063.30 | 10 | 5 | 3 |
| Cooling tower fan | 5 | 3.73 | 0.51 | 2.34 | 62.83 | 20.50 | 4.10 | 8.20 | 12.30 | 365.36 | 730.73 | 1096.09 | 10 | 5 | 3 |
| Sl. No | Location | Load (kW) | Pf (Old) | Pf (New) | Capacitor Power Rating, CPR (kVAr) | Suggested Rating (kVAr) |
|---|---|---|---|---|---|---|
| 1 | Cooling water pump | 2.27 | 0.65 | 0.99 | 2.33 | 3 |
| 2 | Cooling tower fan | 2.34 | 0.51 | 0.99 | 3.61 | 4 |
| 3 | Workshop panel reading | 2.3 | 0.53 | 0.99 | 3.35 | 4 |
| 4 | Roller A | 3.41 | 0.69 | 0.99 | 3.09 | 4 |
| 5 | Roller B | 3.62 | 0.74 | 0.99 | 2.77 | 3 |
| 6 | Boiler total panel | 1.94 | 0.59 | 0.99 | 2.38 | 3 |
| 7 | Water pump | 1.94 | 0.51 | 0.99 | 3 | 3 |
| 8 | D M pump motor | 0.43 | 0.72 | 0.99 | 0.35 | 1 |
| Parameters | Unit | Value |
|---|---|---|
| Present annual energy consumption | kWh | 1,024,300 |
| Cost of energy | USD | 0.091 |
| Estimated energy saving | % | 3 |
| Estimated annual energy saving in absolute value | kWh | 30,729 |
| Annual cost saving | USD | 2764.23 |
| Investment for “Smart Joules” for connecting 30 energy meters and one software license | USD | 4471.55 |
| Payback period | months | 19 |
| Area | Recommendations | Estimated Energy Saving (MWh/y) | Estimated Fuel Saving (Ton/y) | Estimated Cost Saving (USD) | Estimated Investment (USD) | Payback (Month) |
|---|---|---|---|---|---|---|
| Boiler Section | Condensate Recovery | - | 78 | 5902.44 | 5691.06 | 12 |
| Installing fuel feeding system to improve the loading and efficiency of boiler | - | 17 | 1243.90 | 3252.03 | 31 | |
| Air compressor | Arresting air leakage within compressor and receiver system | 17.28 | - | 1560.98 | 813.01 | 6 |
| Revamping pipelines, grouping cleaning points and reduce pressure bad | 24.48 | - | 2211.38 | 4065.04 | 24 | |
| Pepper dryer | Improve maintenance of suction side of cold air blowers and install steam heater at delivery section. Remove one cold air blower | 14.77 | - | 1333.33 | Nominal | Immediate |
| Cooling tower | Installing cooling tower fan energy saver | 2.35 | - | 211.38 | 121.95 | 7 |
| Energy Monitoring and Control | Installing smart metering system | 30.73 | - | 2764.23 | 4471.55 | 19 |
| Total | 89.61 | 95 | 15,227.64 | 18,414.63 | 15 | |
Publisher’s Note: MDPI stays neutral with regard to jurisdictional claims in published maps and institutional affiliations. |
© 2021 by the authors. Licensee MDPI, Basel, Switzerland. This article is an open access article distributed under the terms and conditions of the Creative Commons Attribution (CC BY) license (https://creativecommons.org/licenses/by/4.0/).
Share and Cite
Ullah, K.R.; Thirugnanasambandam, M.; Saidur, R.; Rahman, K.A.; Kayser, M.R. Analysis of Energy Use and Energy Savings: A Case Study of a Condiment Industry in India. Energies 2021, 14, 4798. https://doi.org/10.3390/en14164798
Ullah KR, Thirugnanasambandam M, Saidur R, Rahman KA, Kayser MR. Analysis of Energy Use and Energy Savings: A Case Study of a Condiment Industry in India. Energies. 2021; 14(16):4798. https://doi.org/10.3390/en14164798
Chicago/Turabian StyleUllah, Khan Rahmat, Marudhappan Thirugnanasambandam, Rahman Saidur, Kazi Akikur Rahman, and Md. Riaz Kayser. 2021. "Analysis of Energy Use and Energy Savings: A Case Study of a Condiment Industry in India" Energies 14, no. 16: 4798. https://doi.org/10.3390/en14164798
APA StyleUllah, K. R., Thirugnanasambandam, M., Saidur, R., Rahman, K. A., & Kayser, M. R. (2021). Analysis of Energy Use and Energy Savings: A Case Study of a Condiment Industry in India. Energies, 14(16), 4798. https://doi.org/10.3390/en14164798