Article

Challenges in Sustainable Degradability of Bio-Based and Oxo-Degradable Packaging Materials during Anaerobic Thermophilic Treatment

by
Magdalena Zaborowska
1,*,
Katarzyna Bernat
1,
Bartosz Pszczółkowski
2,
Irena Wojnowska-Baryła
1 and
Dorota Kulikowska
1
1
Department of Environmental Biotechnology, Faculty of Geoengineering, University of Warmia and Mazury in Olsztyn, 10-719 Olsztyn, Poland
2
Department of Materials and Machines Technology, University of Warmia and Mazury in Olsztyn, ul. Oczapowskiego 11, 10-719 Olsztyn, Poland
*
Author to whom correspondence should be addressed.
Energies 2021, 14(16), 4775; https://doi.org/10.3390/en14164775
Submission received: 1 July 2021 / Revised: 26 July 2021 / Accepted: 30 July 2021 / Published: 5 August 2021

Abstract

:
Although the manufacturers labelled commercially available bio-based products as biodegradable, there are discrepancies concerning the time frame for their sustainable biodegradation and methane production. Starch-based, polylactic acid-based and oxo-degradable foils were anaerobically treated in thermophilic condition (55 °C, 100 days). The effect of alkaline pretreatment on foils degradation was also investigated. To examine changes in their mechanical and physical properties, static tensile tests and microscopic analyses, FTIR and surface roughness analyses were conducted. Despite the thermophilic condition, and the longer retention time compared to that needed for biowaste, a small amount of methane was produced with bio-based foils, even after pretreatment (ca. 30 vs. 50 L/kg VS) and foils only lost functional and mechanical properties. The pieces of bio-based materials had only disintegrated, which means that digestate may become contaminated with fragments of these materials. Thus, providing guidelines for bio-based foil treatment remains a challenge in waste management.

Graphical Abstract

1. Introduction

Bio-based products are defined as entirely or partially biological in origin. Among the bio-based products, biodegradable polymers (biopolymers) play an important role. Biopolymers can be degraded by microorganisms into water and biomass, and depending on whether oxygen is present, into carbon dioxide under aerobic conditions, or into carbon dioxide and methane under anaerobic conditions. In recent years, the share of biopolymers on the market has been increasing and, in 2019, 1.174 million tons were produced at a global level. Further increases in the share of these plastics on the market are expected (i.e., 1.334 million tons by 2024) [1,2].
One of the most known biopolymers is polylactide (PLA), which is produced by the polymerization of lactic acid via the fermentation of dextrose derived from carbohydrate-rich crops, such as potatoes or corn. PLA is widely used because of its properties, including its biodegradability, biocompatibility, high elastic modulus, transparency and mechanical strength [3]. The other commonly used natural polymer (meaning that it is produced directly in nature) is starch, which is, more specifically, a reserve polysaccharide composed of amylopectin (75−80%) and amylose (20−25%). Starch is used due to its abundance, inexpensiveness, and biodegradability. It is known that, on the market, apart from biopolymers, oxo-degradable polymers are still used in some countries [4]. They contain pro-degradants (e.g., d2w® or TDPA (totally degradable plastic additives)), usually produced from cobalt, manganese, and iron compounds, which should ensure the polymer decomposition. Some authors indicate that oxo-degradable polymers may be partially biodegradable, e.g., with mineralization level of 12.4% after three months of incubation with compost [5].
Among the bio-based and oxo-degradable products present on the market, the most popular are materials used for food packaging or waste bags for biowaste collection. Because they are labelled as biodegradable, these products should be separately collected, together with biowaste. Thus, most of the waste from these products is eventually gathered and processed, aerobically or anaerobically, in mechanical–biological treatment plants (MBT installations), or via a combination of the two methods. Because the share of biodegradable polymers in the stream of selectively collected biowaste will likely continue to increase, it is important to better understand the mechanisms and characteristics of their degradation. Most studies have focused on the biodegradation of biopolymers under environmental conditions, i.e., in soil, compost, and aquatic environments [6]. In aerobic conditions, the characteristics of the process depend on the types of polymers involved (i.e., their molecular weight, crystallinity or type of functional groups) and environmental factors (i.e., temperature, moisture, pH, and presence of oxygen) [7,8]. However, knowledge concerning the possibility of polymer degradation under anaerobic conditions is limited, especially in the context of commonly used methods for the treatment of biowaste. Therefore, it is necessary to determine the conditions that facilitate biodegradation of bio-based and oxo-degradable products and the characteristics of this process. Anaerobic processes seem to be especially profitable because they produce methane, which can be used for energy generation. However, because of amount of time needed for methane production from bio-based products [9], pretreatment is needed. The use of pretreatment may increase the surface area of the material, resulting in more rapid degradation and improved methane production [10]. For example, Yu et al. [11] reported over 70% abiotic degradation of PHB at 70 °C in 4 M sodium hydroxide after 4 h of treatment. However, the treatment of PHB in acidic solutions of sulfuric acid (0.05–2 M) at 70 °C for up to 14 h did not result in abiotic degradation. Myung et al. [12] observed the near complete abiotic degradation of poly(3-hydroxybutyrate-co-3-hydroxyvalerate) (PHBV) at 60 °C in 0.1 M sodium hydroxide after 18 h of treatment.
In conclusion, despite many commercial products on the market being labeled as biodegradable, their detailed compositions are not provided by manufacturers. The content of the polymer and various types of additives in the products can differ, but most likely, the composition affects the biodegradability of polymers and the time frame for their biodegradation, especially in the context of their end-of-life considerations in waste management. Thus, in the present study, degradability and methane production (MP) from commercially available bio-based foils based on starch (FS), polylactic acid (PLA), and additionally oxo-degradable product (OXO), was analyzed. Moreover, alkaline pretreatment was used to check the acceleration of the process. Microscopic and FTIR analyses, and determination of the functional properties of the surfaces and the mechanical properties of the materials (static tensile tests) were also performed. Determination of the mechanical properties of material, as another indicator of its degradation, is not a common practice.

2. Materials and Methods

2.1. Bio-Based and Oxo-Degradable Materials Used in the Experiment

In the experiment, commonly available waste bags made of bio-based materials and oxo-degradable material were used. As bio-based materials, BioBag waste bags made from Mater-Bi® material based on starch (FS) and bags made from polylactic acid (PLA) were used. The oxo-degradable waste bag (OXO) was made from petroleum-based polyethylene containing d2w pro-degradant additive. The characteristics of the materials are as follows:
  • PLA (the VS content of 99.3 % DM, 71.5 g COD/kg DM, 454.9 mg Ntot/kg DM);
  • FS (the VS content of 99.9 % DM, 63.9 g COD/kg DM, 408.6 mg Ntot/kg DM);
  • OXO (the VS content of 93.1 % DM, 3766.8 mg Ntot/kg DM (COD was not possible to determine)).
The products were obtained from the commercial public market; thus, they may have contained other additives, improving their functional properties but, unfortunately, the manufacturer did not report their detailed composition. The waste bags were shredded to a particle size of 10 × 10 mm.
Two sets of experiments were carried out. In the first, all materials (PLA, FS, OXO) were used without pretreatment. In the second set, PLA, FS and OXO were pretreated with 0.1 M potassium hydroxide (KOH) for 2 h; pretreatment was performed at ambient temperature (PLAKOH, FSKOH, OXOKOH). After 2 h, the mixture was neutralized with hydrochloric acid. Solubilized PLA (PLAsolubilized) and FS (FSsolubilized) were used as control samples. Each material was solubilized with the use of 1 M KOH for 24 h. The OXO material did not solubilize under these conditions.

2.2. Measurement of Methane Production (MP) under Thermophilic Conditions

The anaerobic degradation test of bio-based and oxo-degradable products was carried out in thermophilic conditions (55 °C). The experiment was carried out in a methane potential analysis device (Automatic Methane Potential Test System, AMPTS II, Bioprocess Control, Sweden AB) for 100 days. The device consisted of reactors with a volume of 630 mL. The reactors were mixed at a speed of 80 rpm for 1 min every hour. To each reactor, 200 mL of inoculum and the appropriate amount of material was added to ensure a starting organic load of 4 kg VS/m3. Anaerobic conditions were achieved by flushing each reactor with pure nitrogen for 2 min. The inoculum was obtained from a closed chamber for the mesophilic anaerobic digestion of sewage sludge. Thermophilic preincubation of the inoculum was carried out at 55 °C for 14 days. The dry mass (DM) content of the inoculum was approximately 1.7%, whereas VS constituted 69.5% of DM.
The anaerobic degradation test was based on determining the volume of methane produced online. The measurement of MP with each material and inoculum, and with inoculum alone was performed in triplicate. In order to not disturb the MP in the AMPTS II, additional glass bottles were prepared for sampling for microscopic analysis, and roughness and static tensile tests. These bottles had the same volume as the reactors used in the AMPTS II and were dosed with the same amount of inoculum and material, and placed in a thermostatic incubator at 55 °C. When the fragments of bio-based and oxo-degradable materials were collected for analysis, they were cleaned with distilled water.
Based on the anaerobic degradation test in the methane potential system, the biodegradation degree (BD) was assumed. The BD of the bio-based materials (PLA, FS, PLAKOH and FSKOH) during anaerobic treatment at 55 °C was calculated as the ratio of the cumulative MP from the material (after pretreatment (treated) or without pretreatment (untreated)) to the cumulative MP from the material after its solubilization. The cumulative MP from the solubilized material was assumed to be the maximal MP from this material under the experimental conditions. For the OXO material, which did not solubilize, the BD was not determinable.
Methane production (MP) followed pseudo first-order kinetics, and can be described with this equation:
Ct,CH4 = CCH4 · (1 − ekCH4 t)+ C0,CH4,
where Ct;CH4 (L/kg VS) is the cumulative MP at time t (days) of anaerobic measurement; CCH4 (L/kg VS) is the maximal MP; C0,CH4 (L/kg VS) is the initial MP; kCH4 (d−1) is the kinetic coefficient of MP.
The rate of MP is the product of CCH4 and kCH4.
The values of CCH4, C0,CH4 and kCH4 were obtained by nonlinear regression analysis with Statistica software, version 13.0 (StatSoft, Tulsa, OK, USA).

2.3. Microscopic and FTIR Analysis

During anaerobic degradation tests, pieces of FS, PLA, OXO, PLAKOH, FSKOH, and OXOKOH were removed from the inoculum and cleaned with distilled water for the microscopic analysis, and the roughness and static tensile tests.
The changes on the surface of the bio-based and oxo-degradable materials were analyzed using a Nikon eclipse50i (Nikon, Tokyo, Japan) polarizing microscope at a magnification of 10×. Pictures were taken at 0, 20, 45, 59 and 100 days.
The FTIR spectra (with three replicates for each foil material) were obtained using a Perkin Elmer Spectrum Two (with diamond ATR) (Perkin Elmer, Waltham, MA, USA) brand device having a resolution of 4 cm−1 within the wavenumber range of 4000–400 cm−1 at room temperature.

2.4. Functional Properties of the Surface

The geometric structure of the surface and the functional properties of the fragments of foils (five replications) were performed with the profile method (PN-ISO 3274) using a Mitutoyo Surftest SJ-210 profilometer (Mitutoyo, Kawasaki, Japan) with a diamond measuring tip with a point angle of 60° and a stylus radius of 2 μm. The measured length for each material consisted of five elementary sections that were 0.8 mm long. The changes in amplitude (arithmetical mean roughness value (Ra), mean square surface profile deviation (Rq)) were determined. The Abbott–Firestone curves [13] were used to determine the reduced peak height without bearing properties (Rpk); the roughness core height (roughness core profile), characterizing the surface bearing properties (Rk); the reduced valleys depth, characterizing the ability of the surface to hold liquids (Rvk); total height of the roughness profile (Rt) and the percentage of the peaks and valleys (Mr1, Mr2, respectively). A detailed description is given in [14].

2.5. Static Tensile Tests

Static tensile tests (tensile strength at break and elongation at break) were performed according to ISO standard (ISO 527-2:2012, ISO 527-3:2019) with the use of a TA.HD.Plus (Stable Microsystems, Surrey, UK). Five replicate samples of foils were used for the measurements until they were too fragile for analysis, and it was impossible to place them in the tensile test device. The samples were subjected to a tensile force at a constant speed until the moment of fracture.

2.6. Analytical Methods

The volatile substance (VS) content of the FS, PLA and OXO materials was determined as loss after ignition at 550 °C. The chemical oxygen demand (COD) of these materials and the content of nitrogen (Kiejdahl nitrogen) were also determined. All physicochemical analyses were performed according to Greenberg et al. [15]. Flash 2000 Organic Elemental Analyzer (Thermo Scientific, Milan, Italy) was used to determine elemental composition of bio-based materials according to the manufacturer’s protocol.

3. Results and Discussion

3.1. Methane Production during Anaerobic Test

Biodegradation anaerobic of pieces of waste bags made of PLA, FS, OXO, and also the materials after pretreatment (PLAKOH, FS KOH, and OXO
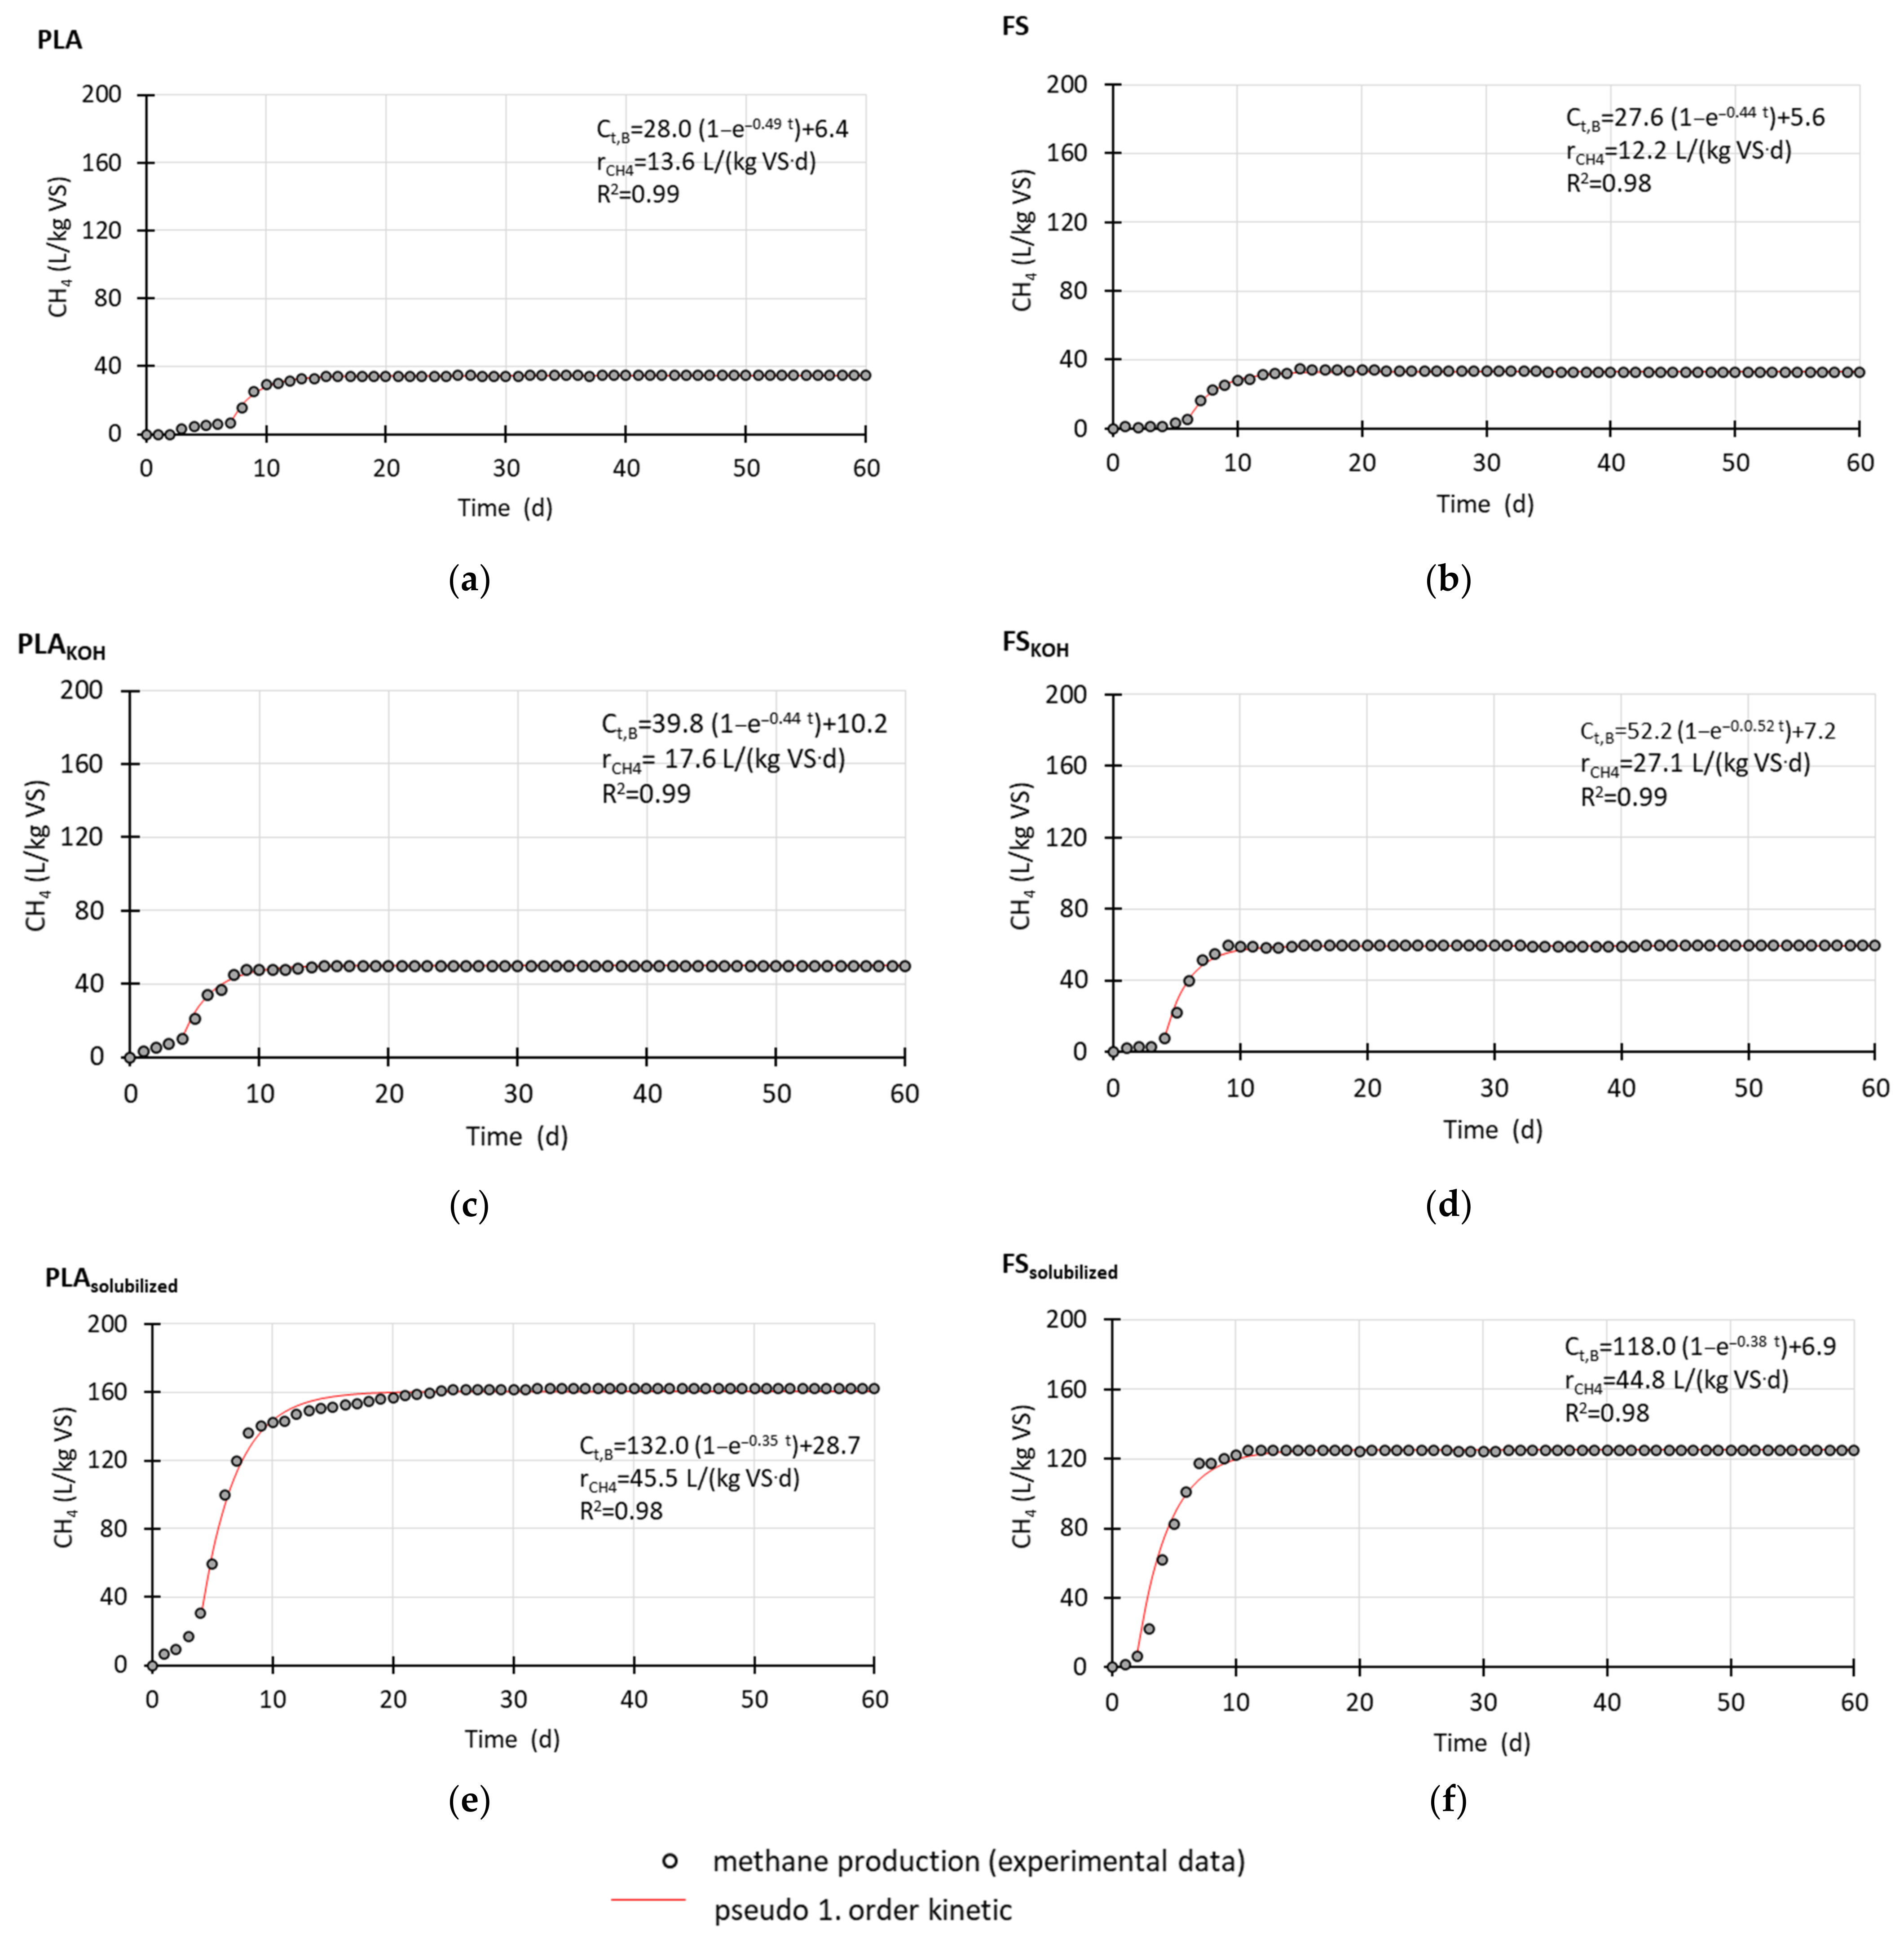
KOH) were carried out under thermophilic conditions at 55 °C. The MP analysis tool allowed measurement of the volume of methane (in mL) produced online. Two MP profiles are considered during the analyses of each material: the first profile corresponds to the inoculum alone, and the second, to both the inoculum and the material. By subtracting the values of the first profile from the second, the profile of the methane volume for the material alone is obtained. In the present study, the VS content of the materials was considered to reflect the organic matter content, and the MP was shown as L/kg VS (Figure 1). To improve the readability of the figure, 60 days of measurements are shown, although the time of measurements was ca. 100 days. The OXO material did not degrade; thus, no MP was observed, and the profiles are not provided.
Regarding bio-based materials made of PLA and FS without pretreatment, lag phases in MP were observed. With FS, the lag phase was shorter, lasting 6 days, whereas with PLA, it lasted 7 days. After the lag phase, MP increased until day 15 or 16 of measurements. Then, the methane volumes remained the same until the end of the anaerobic test, which lasted almost 100 days, and the final methane volumes for PLA and FS were similar, 34.5 and 32.7 L/kg VS, respectively.
After pretreatment, the lag phases shortened to 4 days for both PLAKOH and FSKOH, and after this time, intensive MP took place. After the lag phase, during next 6 days of measurement, PLAKOH produced 47.5 L/kg VS, whereas FSKOH produced almost 25% more, 58.6 L/kg VS.
When solubilized materials were investigated in anaerobic degradation tests, it was found that MP started from the beginning of the measurements. After 15 and 12 days of the measurements with PLAsolubilized and FSsolubilized, respectively, MP reached maximum. Despite the fact that PLA needed a longer time to obtain maximum MP, the final value was 1.3 times higher than MP with FS (162 L/kg VS for PLAsolubilized vs. 125 L/kg VS for FS solubilized).
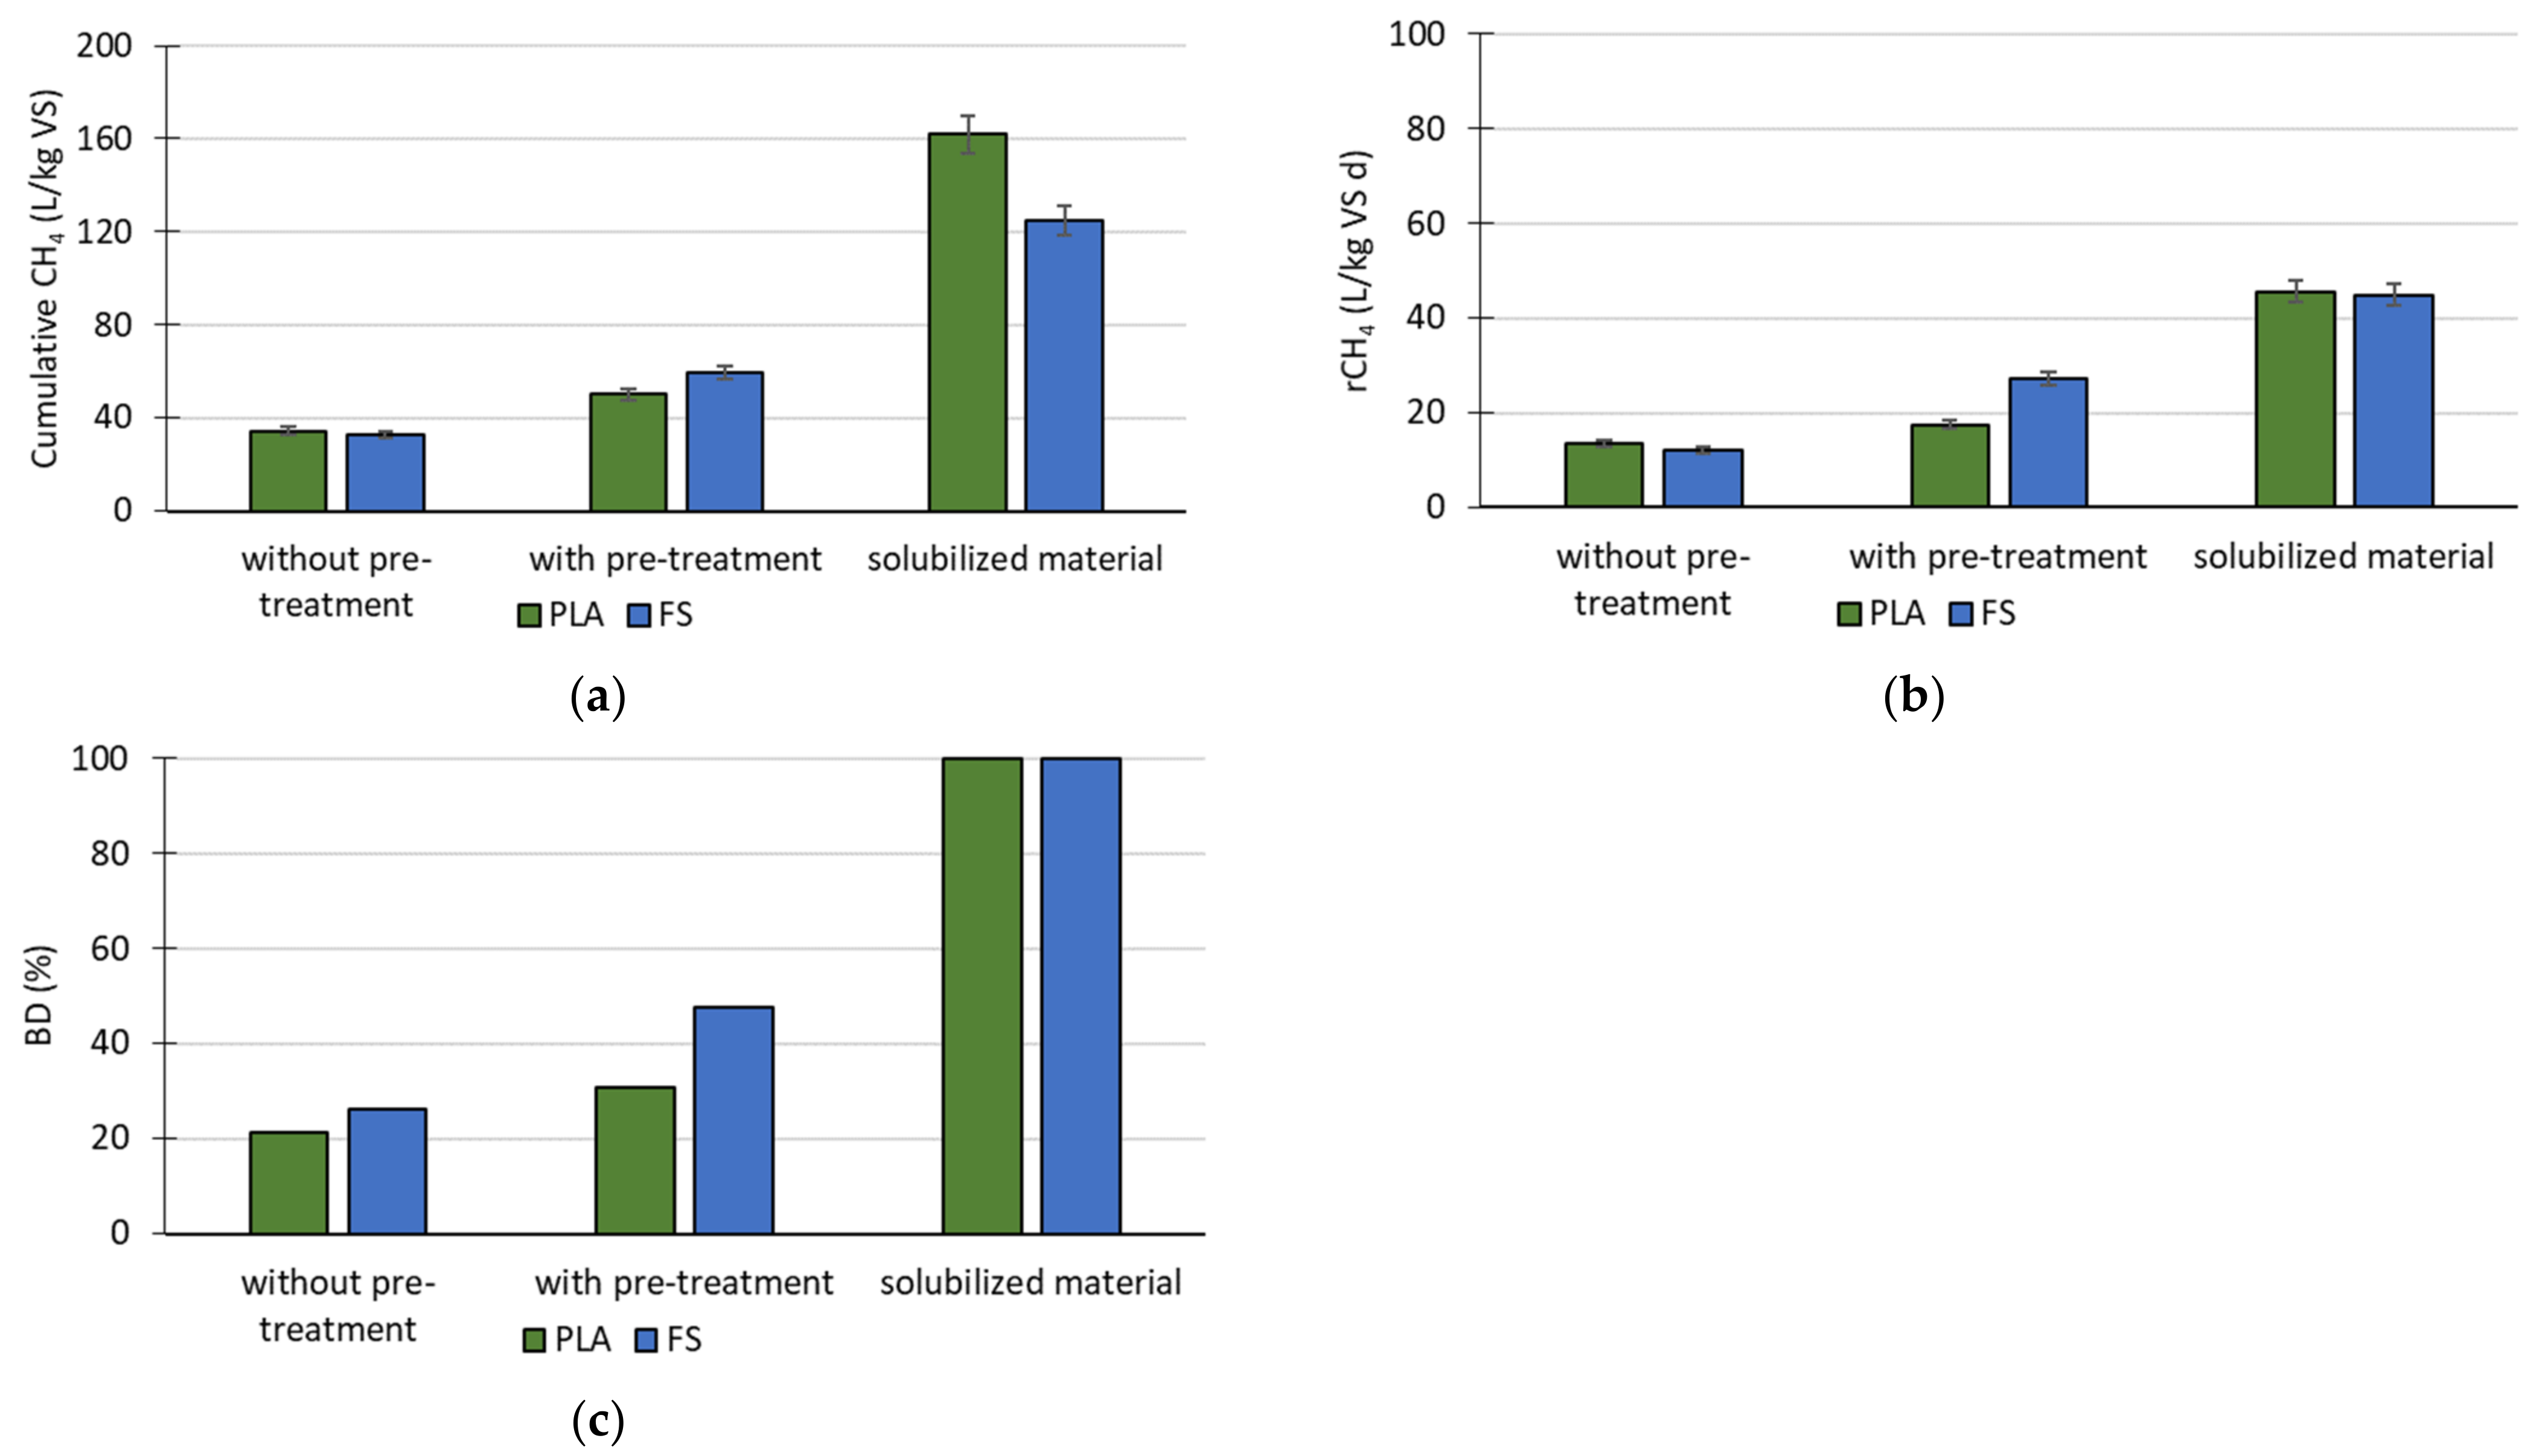
Cumulative MP after 100 days of anaerobic treatment of PLA and FS, without pretreatment, with pretreatment, and the solubilized materials, is shown in Figure 2a. To summarize, cumulative MP was similar with both materials without pretreatment. After pretreatment, cumulative MP with PLAKOH and FSKOH increased almost 40% and 80%, respectively; with the solubilized materials, it was highest. However, the values were much lower than with pure PLA and pure starch materials.
Methane production proceeded with first-order kinetics, and the model fit the experimental data well (R2 = 0.98–0.99). The kinetic models and the initial rates of MP are shown in Figure 1.
The rates of MP, summarized in Figure 2b, corresponded with the cumulative MP with untreated and treated materials. However, the rates of MP with both solubilized materials were similar, despite the difference in cumulative MP.
It was assumed that the solubilized materials (PLAsolubilized and FSsolubilized, i.e., control samples) produced the maximal methane volume, and this equaled 100% of the biodegradation degree (BD) of these materials. For PLA without pretreatment and FS without pretreatment, BD was higher for FS, but for both of the materials, it did not exceed 26% in comparison with solubilize materials. The BD of PLAKOH FSKOH increased to 30 and 47.5%, respectively (Figure 2c).
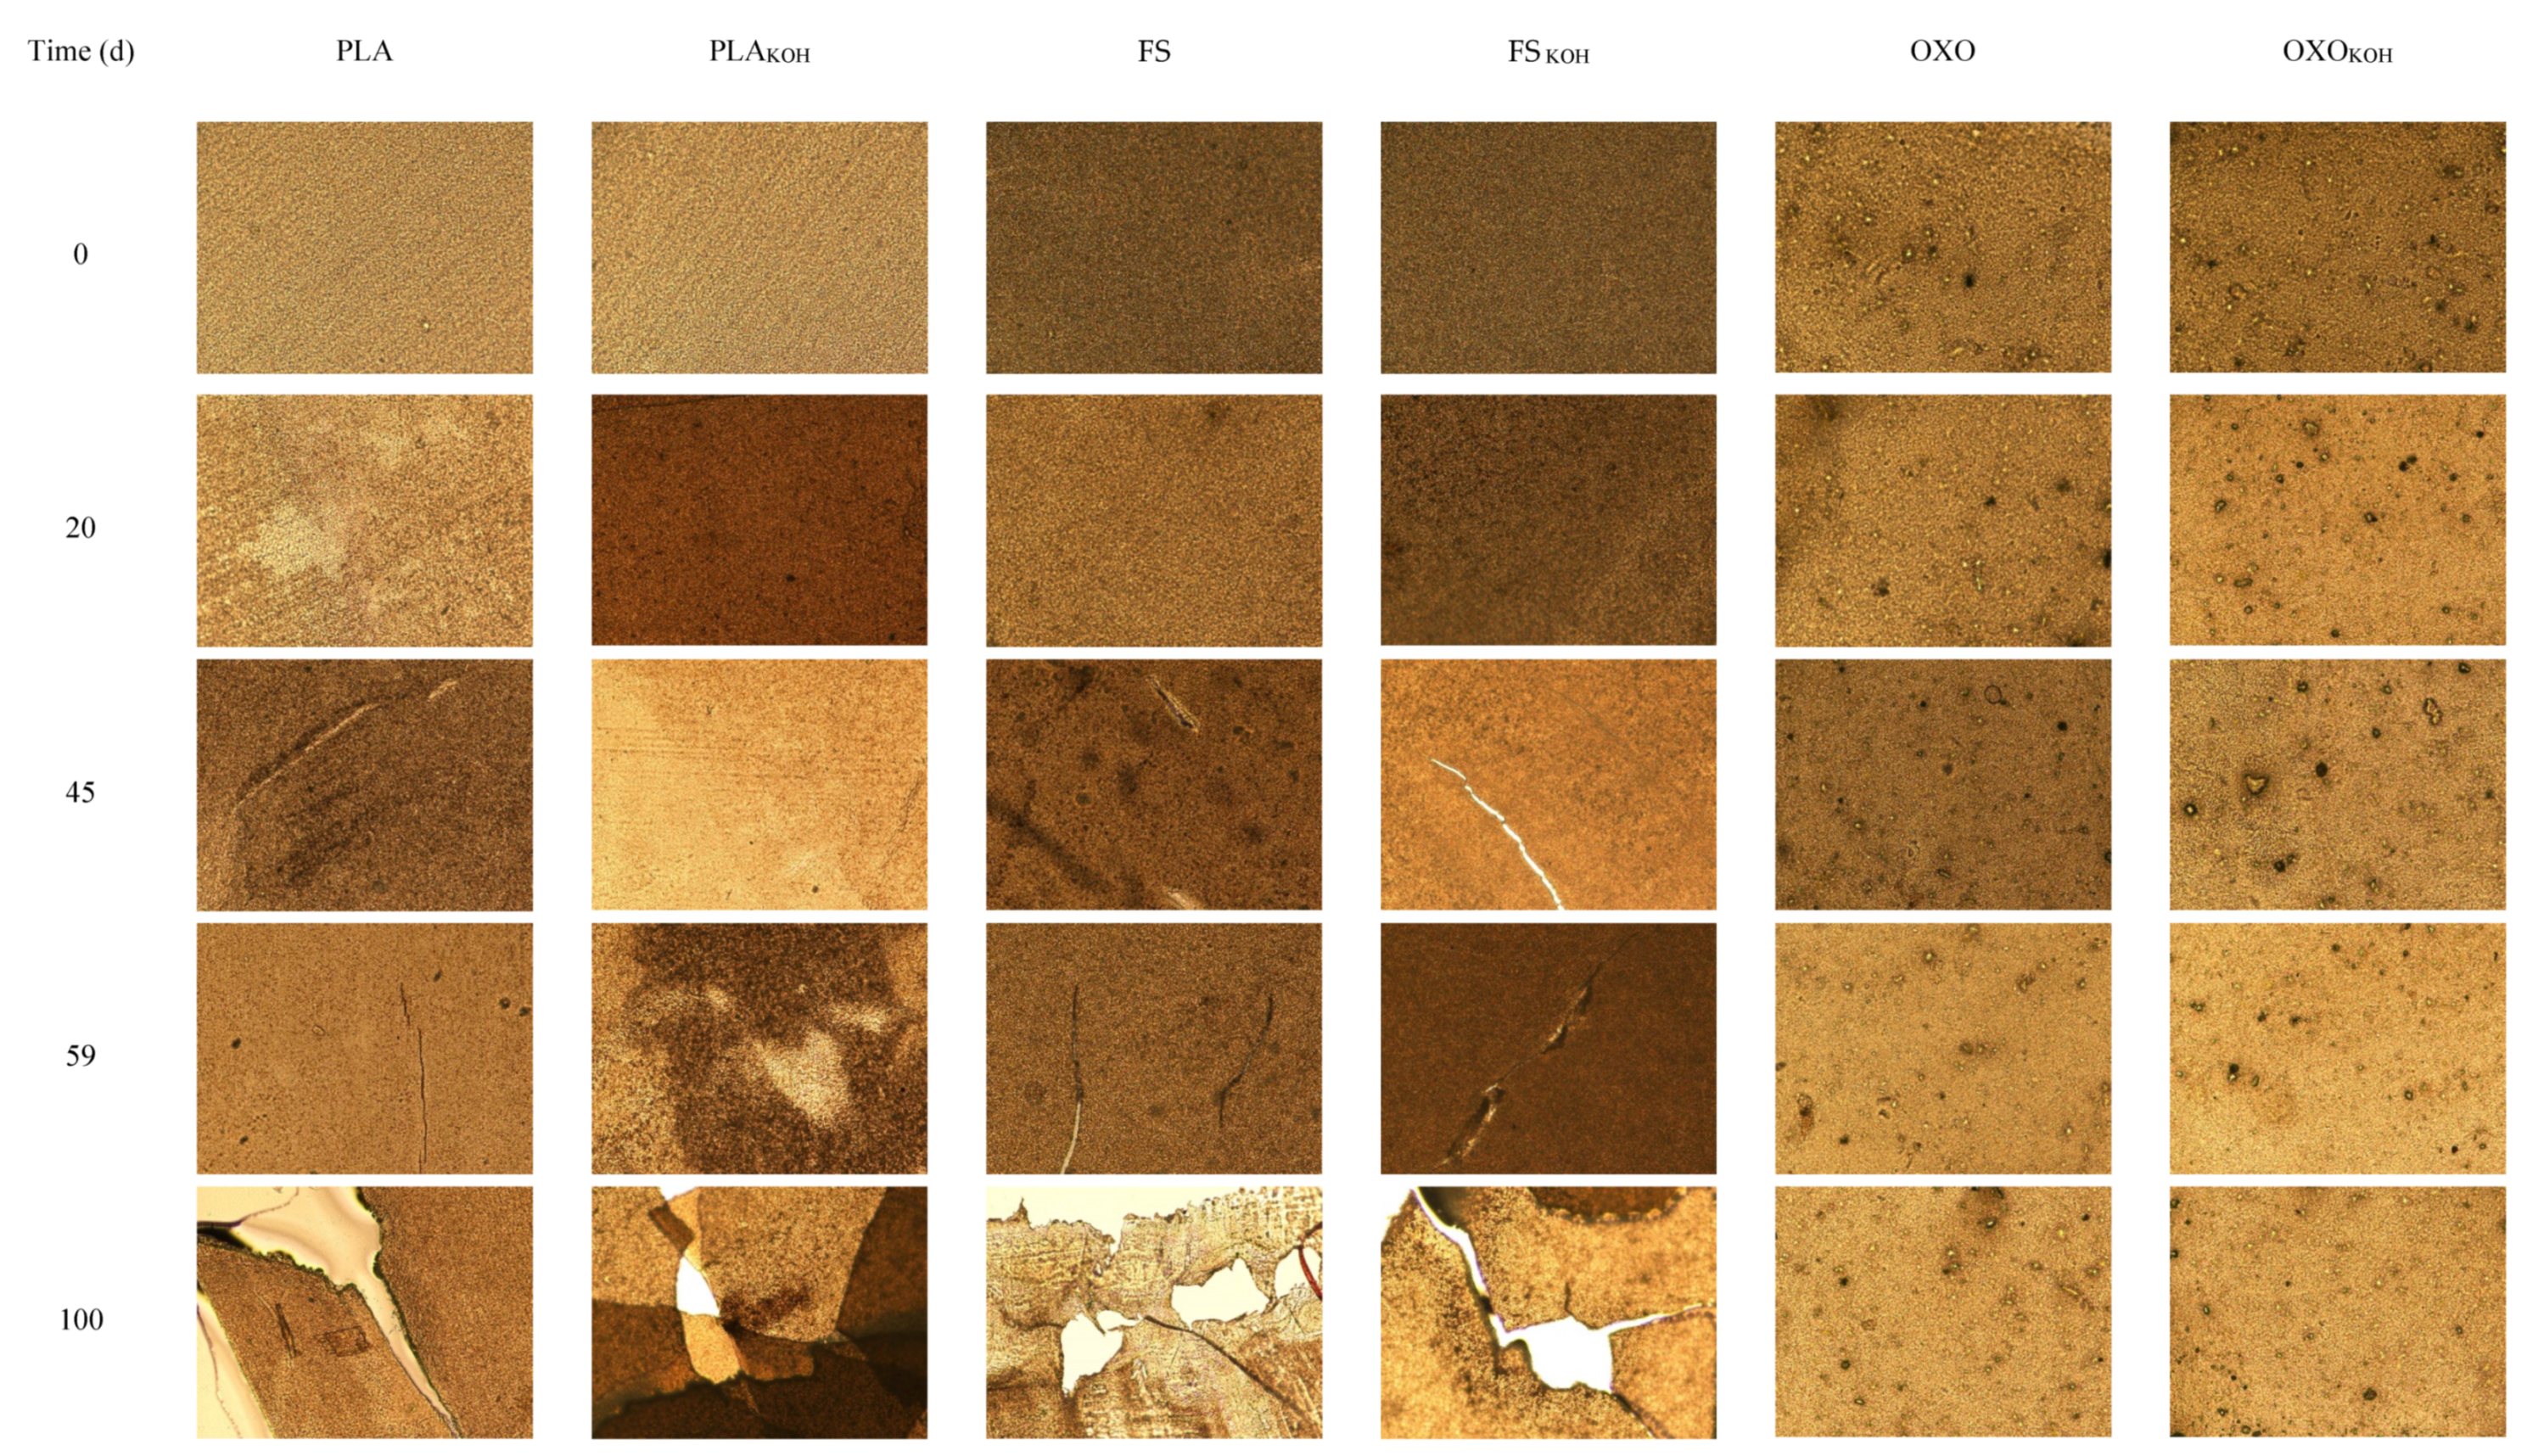
It should be emphasized that, during the long-term anaerobic biodegradation test, the pieces of the materials were still visible in the inoculum, and they did not disintegrate, as shown by the microscopic analyses.
The elemental compositions of the bio-based products, PLA and FS, were determined (Table 1).
PLA contained more carbon and less oxygen than S. The hydrogen content of both foils was about 6.9%. However, it must be emphasized that both foils (PLA, FS) contained more C and H than pure PLA and pure FS, with lower content of O.
The FS foil material is described by the manufacturer as consisting mainly (as much as 85% or more) of modified thermoplastic starch that is biodegradable and compostable [17]. On the basis of the elementary composition of the foil materials and pure polymers (pure PLA, pure FS), the theoretical amounts of methane (TMP) and carbon dioxide that could be obtained, assuming complete conversion of organics into biogas, were calculated using the Buswell equation [16]:
C a H b O c + a b 4 c 2   H 2 O a 2 b 8 + c 4   CO 2 + a 2 + b 8 c 4   CH 4
The TMP values of pure PLA and pure FS were approximately 1.3–1.4-times lower than those of the PLA and FS foils, due to the lower carbon and hydrogen contents of the pure materials (Table 1). As for the cumulative MP during anaerobic digestion at 55° C, PLA and FS produced more than two-times less methane than PLAsolubilized and FSsolubilized. However, even solubilized materials produced methane in amounts constituted only 27% and 22%, respectively, of the TMP values. The small amount of methane produced by all the bio-based materials is connected with the fact that, until 100 days of anaerobic degradation had passed, pieces of the foils were still visible in the inoculum, and these fragments only disintegrated when they were touched.
The results concerning anaerobic treatment of starch-based material are scarce. For example, Mohee et al. [18] found that the cumulative methane production from starch-based material was of 245 mL over 32 days of batch digestion assays. The value was much higher than that obtained in the present study; however, the authors did not provide the initial doses of the material. Therefore, it is not known what the methane production was per 1 g VS, and the efficiency of the process cannot be estimated.
Studies with PLA are more numerous, however, most of them are carried out with the used of pure polymer, not with commercially available foil materials. Itävaara et al. [19] found that at temperatures of 37 °C during 40 days of measurements PLA degradation was not higher than 5%. They reported 60% of PLA degradation after 100 days of an anaerobic test without providing more specific information. Under thermophilic conditions, about 60% of PLA was also degraded, but after 40 days. Contrarily, the results of Yagi et al. [20] showed that PLA biodegradability was 80–91% in aquatic conditions at a thermophilic temperature. In another study, Yagi et al. [21] found approximately 60% biodegradability of PLA powder of 90% in 60 days under thermophilic conditions. However, these studies focused on the biodegradation degree but without determination of the efficiency of methane production. The recovery of energy from municipal waste one of the main key points of the strategy of circular economy. Thus, it is important to determine the biogas potential of packaging materials (foils) considered to be biodegradable. This was done in the present study.

3.2. Changes in the Structure of Tested Materials—Microscopic Analysis

At the beginning, the foil pieces of the investigated materials looked like typical foil waste bag materials, and all of them were green in color and smooth.
Microscopic images of the structure of untreated and treated foils were present in Figure 3. Regarding the structure of FS, the changes were visible from the 28th day of degradation, whereas changes in the structure of PLA were visible from about the 59th day. When the changes became apparent, there were individual cracks and fissures in the structure. After this time, the cracks and fissures had become deeper and more numerous on the surface. Unfortunately, both of the bio-based materials did not disintegrate completely, and they were still visible until almost 100 days of anaerobic treatment. The use of the pretreatment step did not facilitate the process of disintegration of the bio-based foils. The visible changes, in the form of cracks and fissures, appeared on the surface of foils around the same time as in the variant without pretreatment. However, the pretreatment step caused the foil pieces to become severely weakened and fragile, so that they crumbled when touched after a shorter time of degradation.
As mentioned, the OXO foil did not produce methane, and microscopic analyses did not show any structural changes even after the pretreatment step.

3.3. Changes in the Mechanical Properties of the Materials

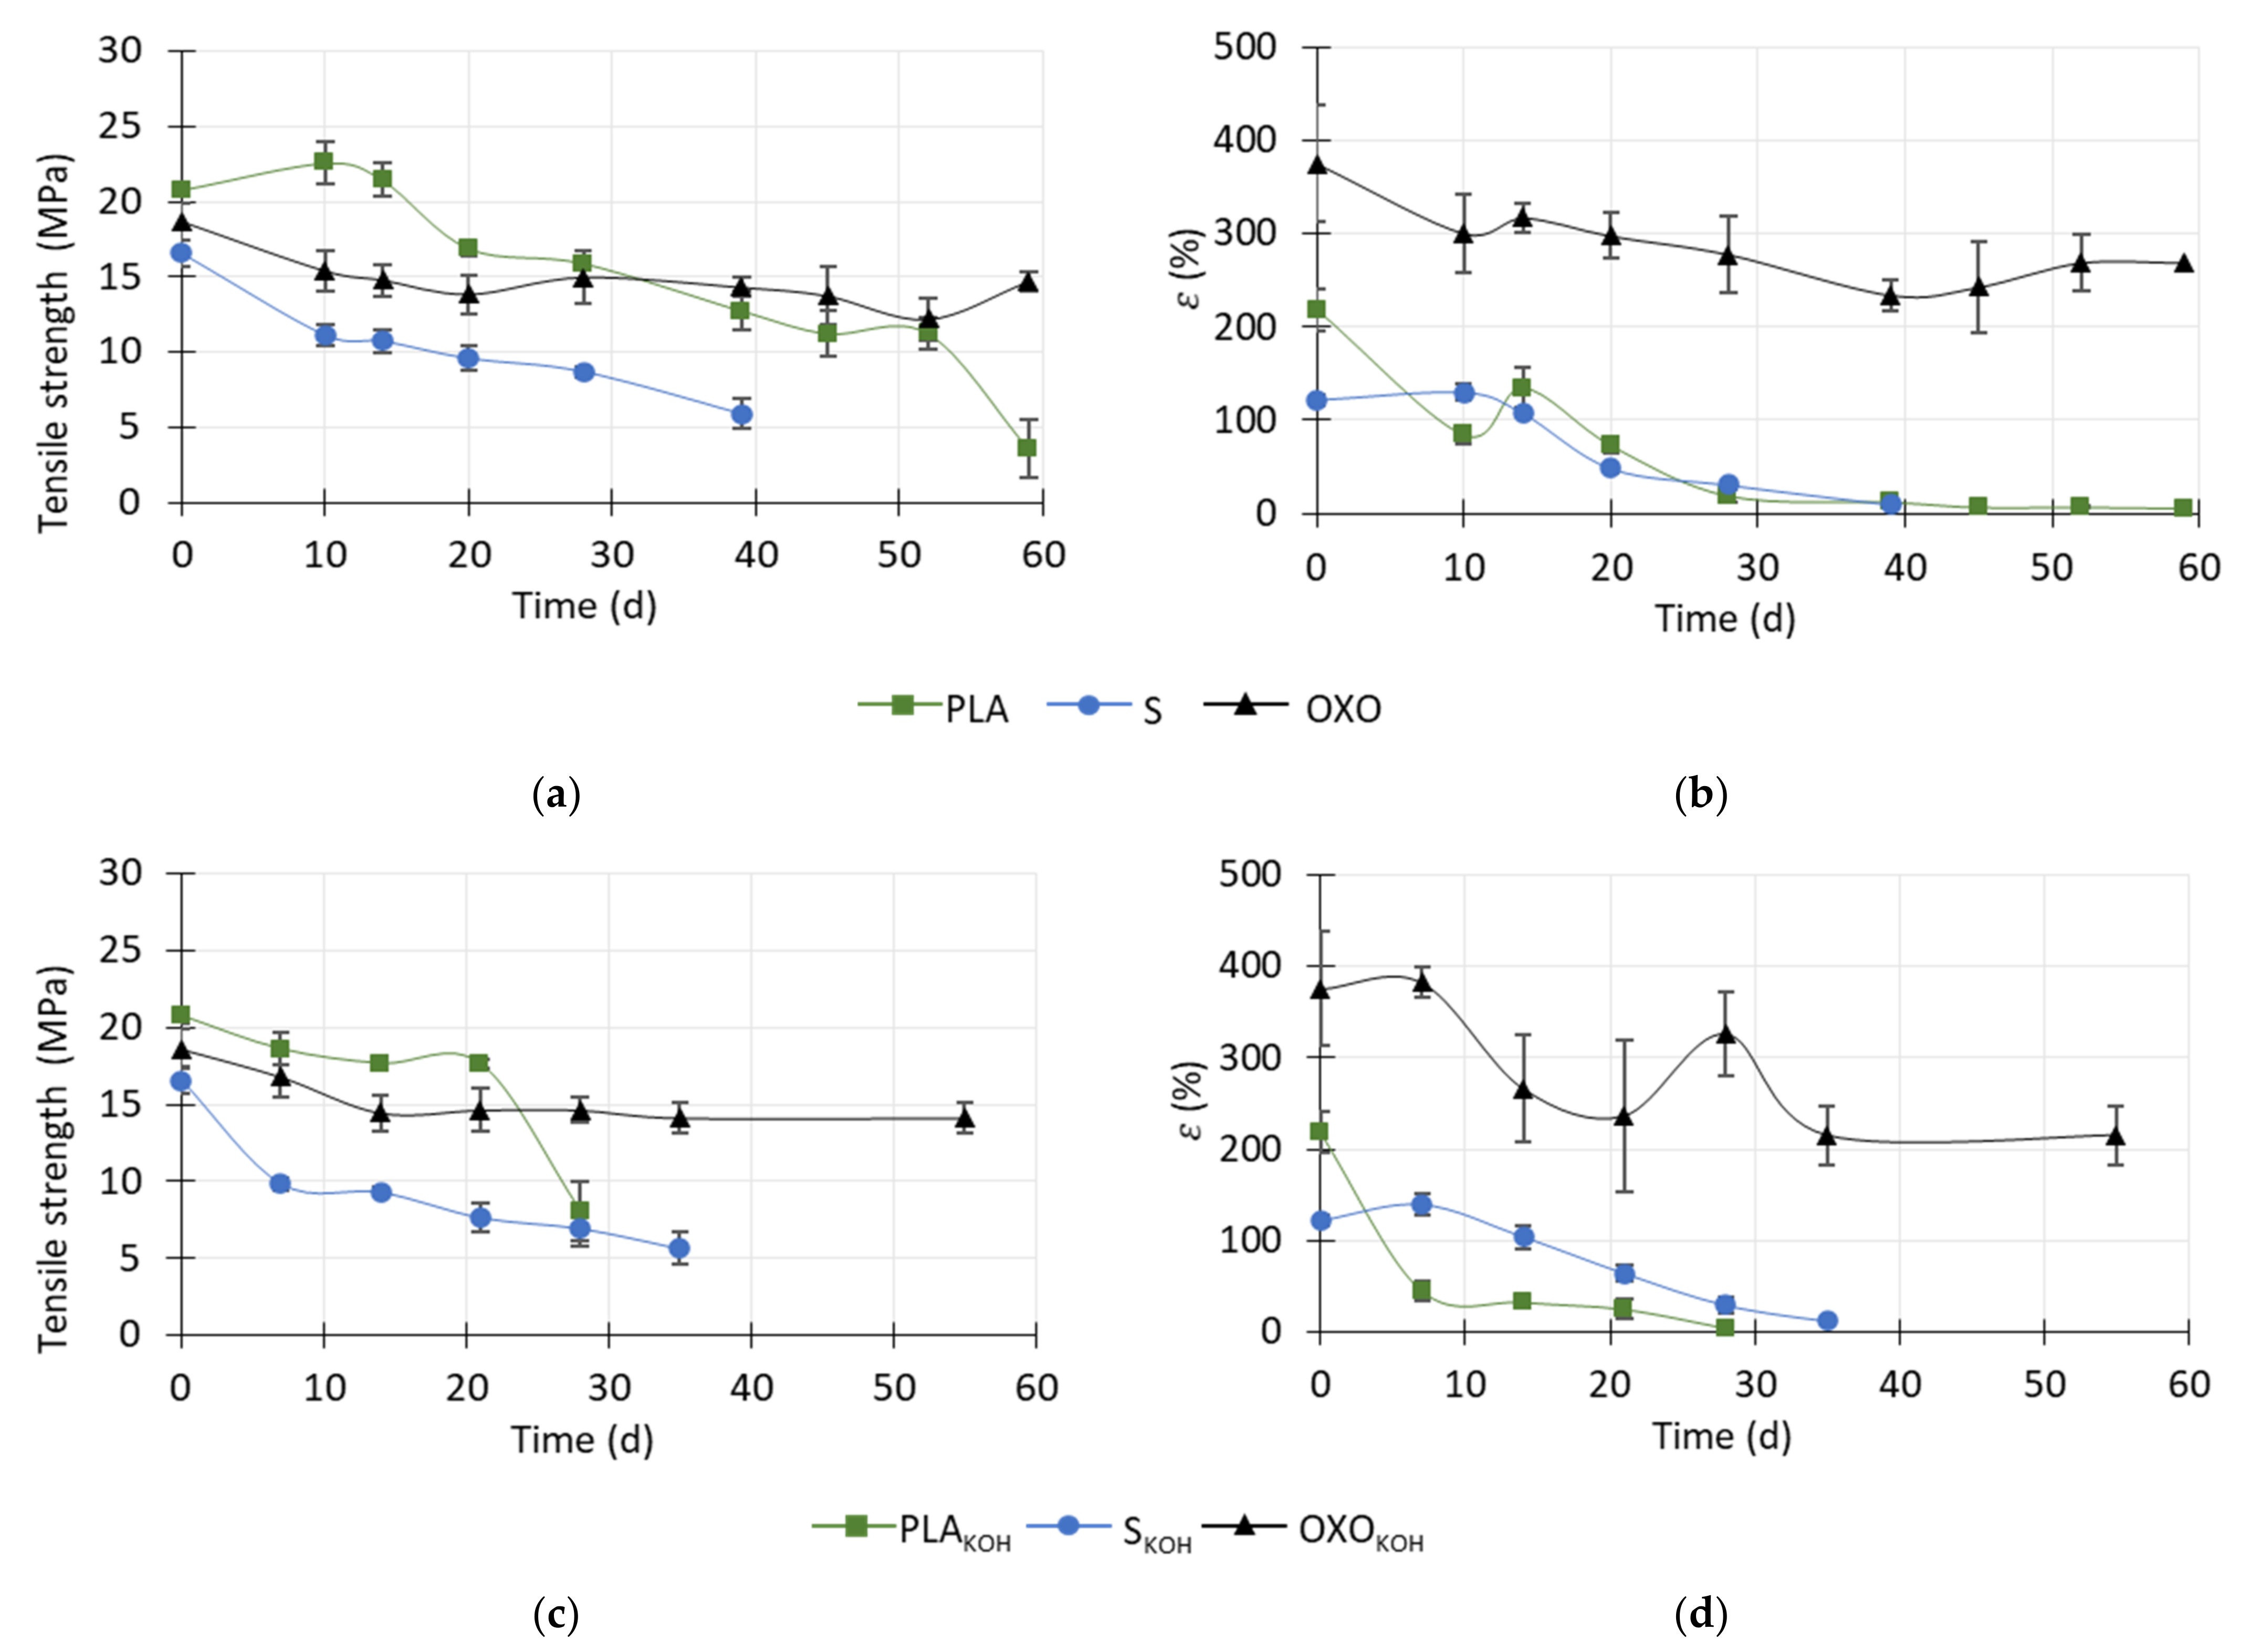
During the anaerobic degradation test, the mechanical properties of the foils before and after the pretreatment were investigated. The results of tensile strength are presented in Figure 4a,b. Regarding the untreated OXO material, the tensile strength decreased by about 17.5 ± 6.8% in the first 10 days of the experiment. Then, until the end of the test, the tensile strength remained at a similar level. The initial decrease could result from the presence of the oxo-degradant, which may weaken the mechanical properties of polyethylene (PE) under thermophilic conditions [22,23].
Regarding the bio-based products without pretreatment, a decrease in tensile strength was observed, which indicated that degradation was progressing (Figure 4). It was possible to measure the tensile strength of FS until to the 39th day of the anaerobic degradation test, at which point the tensile strength had decreased by almost three fold. After this time, the foil was too brittle to be subjected to the strength test and it was not possible to place particles of FS in the measuring device. During the first 10 days, the tensile strength decreased sharply, from 16.6 ± 0.8 MPa in the raw material, to 11.1 ± 0.7 MPa. After this time, the tensile strength continued to decrease steadily, and after 39 days, it reached 5.9 ± 0.9 MPa (Figure 4a).
Tensile strength measurements of PLA were possible until the 59th day of the test, which means that, in this regard, the material was more resistant than FS.
Up to day 14 of the experiment, the tensile strength of PLA increased by about 9% because the material stiffened. Vasile et al. [24] carried out burial soil degradation of pure PLA and found that, after an initial decrease in tensile strength by about 14% on day 50, the material stiffened slightly, corresponding to a tensile strength increase after 100 days. After 150 days, the tensile strength decreased again. Stiffening of PLA may be caused by the water diffusing into the amorphous region of the material and random scission of ester bonds. This causes an increase in the degree of crystallinity during the degradation process. Next, after the degradation of the amorphous regions, degradation proceeds towards the center of the crystalline parts [25,26].
In the present study, the tensile strength of the PLA continuously decreased from day 14 to day 52 of the test, reaching 11.3 ± 1.0 MPa. On the last day, the PLA material was still collectible for the test, and the tensile strength was 3.6 ± 2.0 MPa, which was almost six times lower than in the raw/starting material (Figure 4a).
Rajesh et al. [27] carried out the soil burial degradation of pure PLA for 90 days at room temperature. Before starting degradation, the tensile strength of the material was 50 MPa and, during their study, it decreased by 26.5% (to ca. 38 MPa). Compared to the present study, the reduction in tensile strength was much smaller, but the tensile strength values were much higher. It should be emphasized that those authors conducted their degradation tests under aerobic conditions at room temperature, and they used pure PLA, which has greater tensile strength than the material used in the study presented here. The decrease in the tensile strength of bio-based products during degradation tests may be caused by the diffusion of water into the polymer matrix, causing hydrolysis to begin faster [28].
Then, as a result of breaking the secondary bonds (hydrogen, van der Waals bonds), the polymer is weakened, and the long polymer chains are converted to chains of low molecular weight. Then, the covalent bonds between the monomers are broken, which continues until the polymer is completely degraded [29].
The elongation at break (ε) of PLA, FS and OXO was also determined (Figure 4b,d). The value of ε for OXO material slightly decreased during the first 10 days of the degradation test, but over the next few days, only the small changes were noted. However, it should be emphasized that the initial ε of OXO was the highest of all the tested materials (375%), in contrast to its tensile strength, which was similar to that of the other foil materials.
Generally, the ε value of FS and PLA decreased as anaerobic degradation progressed. Despite the fact that the tensile strengths of both materials were similar, the elongation at the break of PLA was almost two-times higher than that of FS (ca. 220% and ca. 120%, respectively). However, in the case of PLA foil, a rapid initial decrease in ε (to ca. 85%) corresponded to the initial increase in tensile strength (from ca. 21 to ca. 23 MPa). The material may have stiffened due to an increase in its degree of crystallinity, which caused its tensile strength to increase. Then, at ca. 15 days, its elongation at break increased to 135%, which may have been caused by the breakdown of the secondary bonds between the polymer chains. From day 14 to day 45, the ε value decreased, reaching ca. 7%, which was only 3.2% of the initial value. The ε value then remained the same until the 59th day of the test, when the last measurement of this characteristic was possible. Regarding FS, its ε value increased by about 6% (from ca. 122%) during the first 10 days of measurement. This might have been caused by the polymer absorbing water. Then, at day 39, when the last measurement was possible, ε had decreased to ca. 10 ± 2% (Figure 4b,d).
The tensile strength and ε of KOH-pretreated OXO were virtually the same as those of OXO that had not been pretreated. Initially, the tensile strength slowly decreased, and after the 14th it was 22 ± 6% lower than the initial value. Then, the tensile strength and ε remained the same until the end of the degradation test. However, it should be emphasized that the KOH-pretreatment of OXO increased the standard deviation of the ε values (Figure 4c,d).
In contrast, pretreatment weakened the mechanical properties of both bio-based materials. Moreover, the time during which it was possible to determine the mechanical properties of these two foils was shorter with pretreatment than without pretreatment (for PLAKOH, reduced from 52 to 28 days; for FSKOH, from 39 to 35 days).
After 7 days of anaerobic degradation of PLAKOH, the tensile strength decreased by about 11 ± 4% in comparison to the raw material (ca. 21 MPa). No temporary stiffness was observed, unlike the PLA, which was not pretreated. This lack of stiffness was also confirmed by the fact that, during this time, elongation at break decreased rapidly to 45%, which was almost two-times lower than the value obtained during the first days with the untreated PLA. Until 21 days of the test, the tensile strength remained at a similar level, while ε decreased slightly. Then, at 28 days, the tensile strength and ε decreased to ca. 8 MPa and 5%, respectively. With regard to both FS and FSKOH, the tensile strength decreased sharply to ca. 10 MPa within the first 10 days of degradation.
In general, the decrease in elongation at the break of both the pretreated bio-based products and those without pretreatment was caused by an increase in the stiffness and a decrease in the flexibility of those materials. Similarly, Vasile et al. [24] reported that the tensile strength and elongation at break of pure PLA materials and PLA biocomposites decreased during soil burial biodegradation. The authors stated that, as the time of degradation progressed, the stiffness of the investigated materials increased.

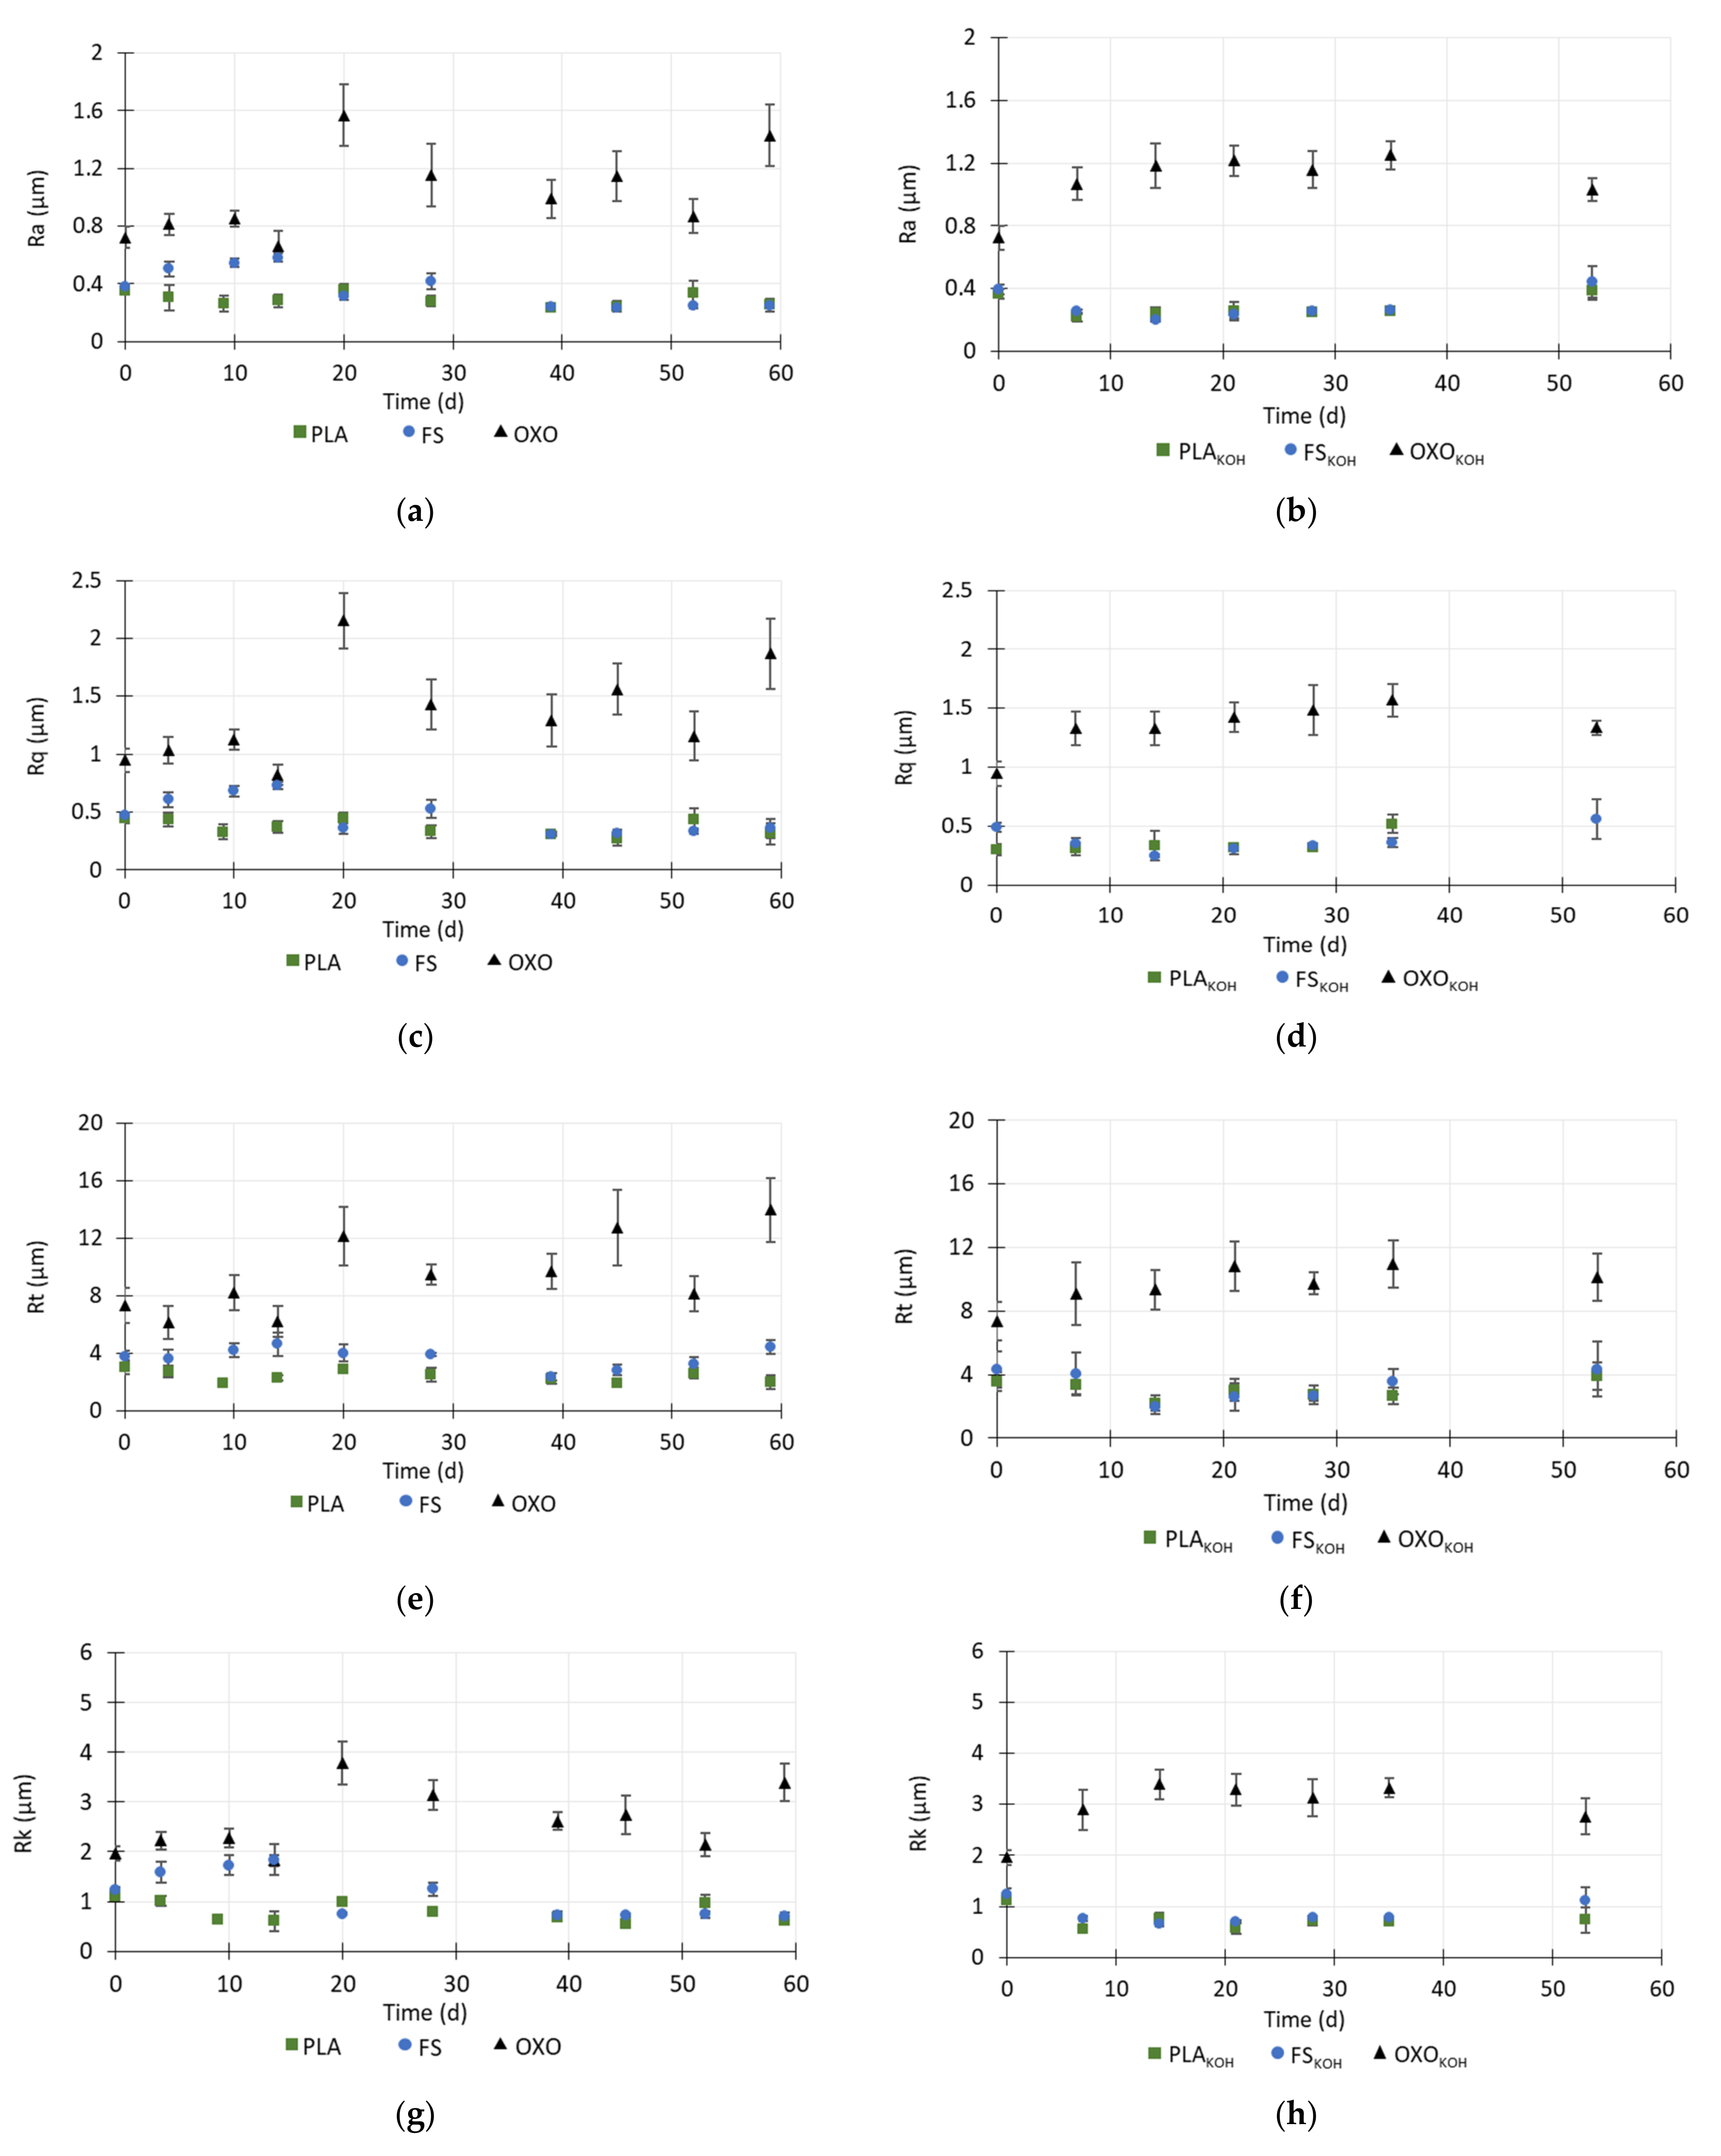
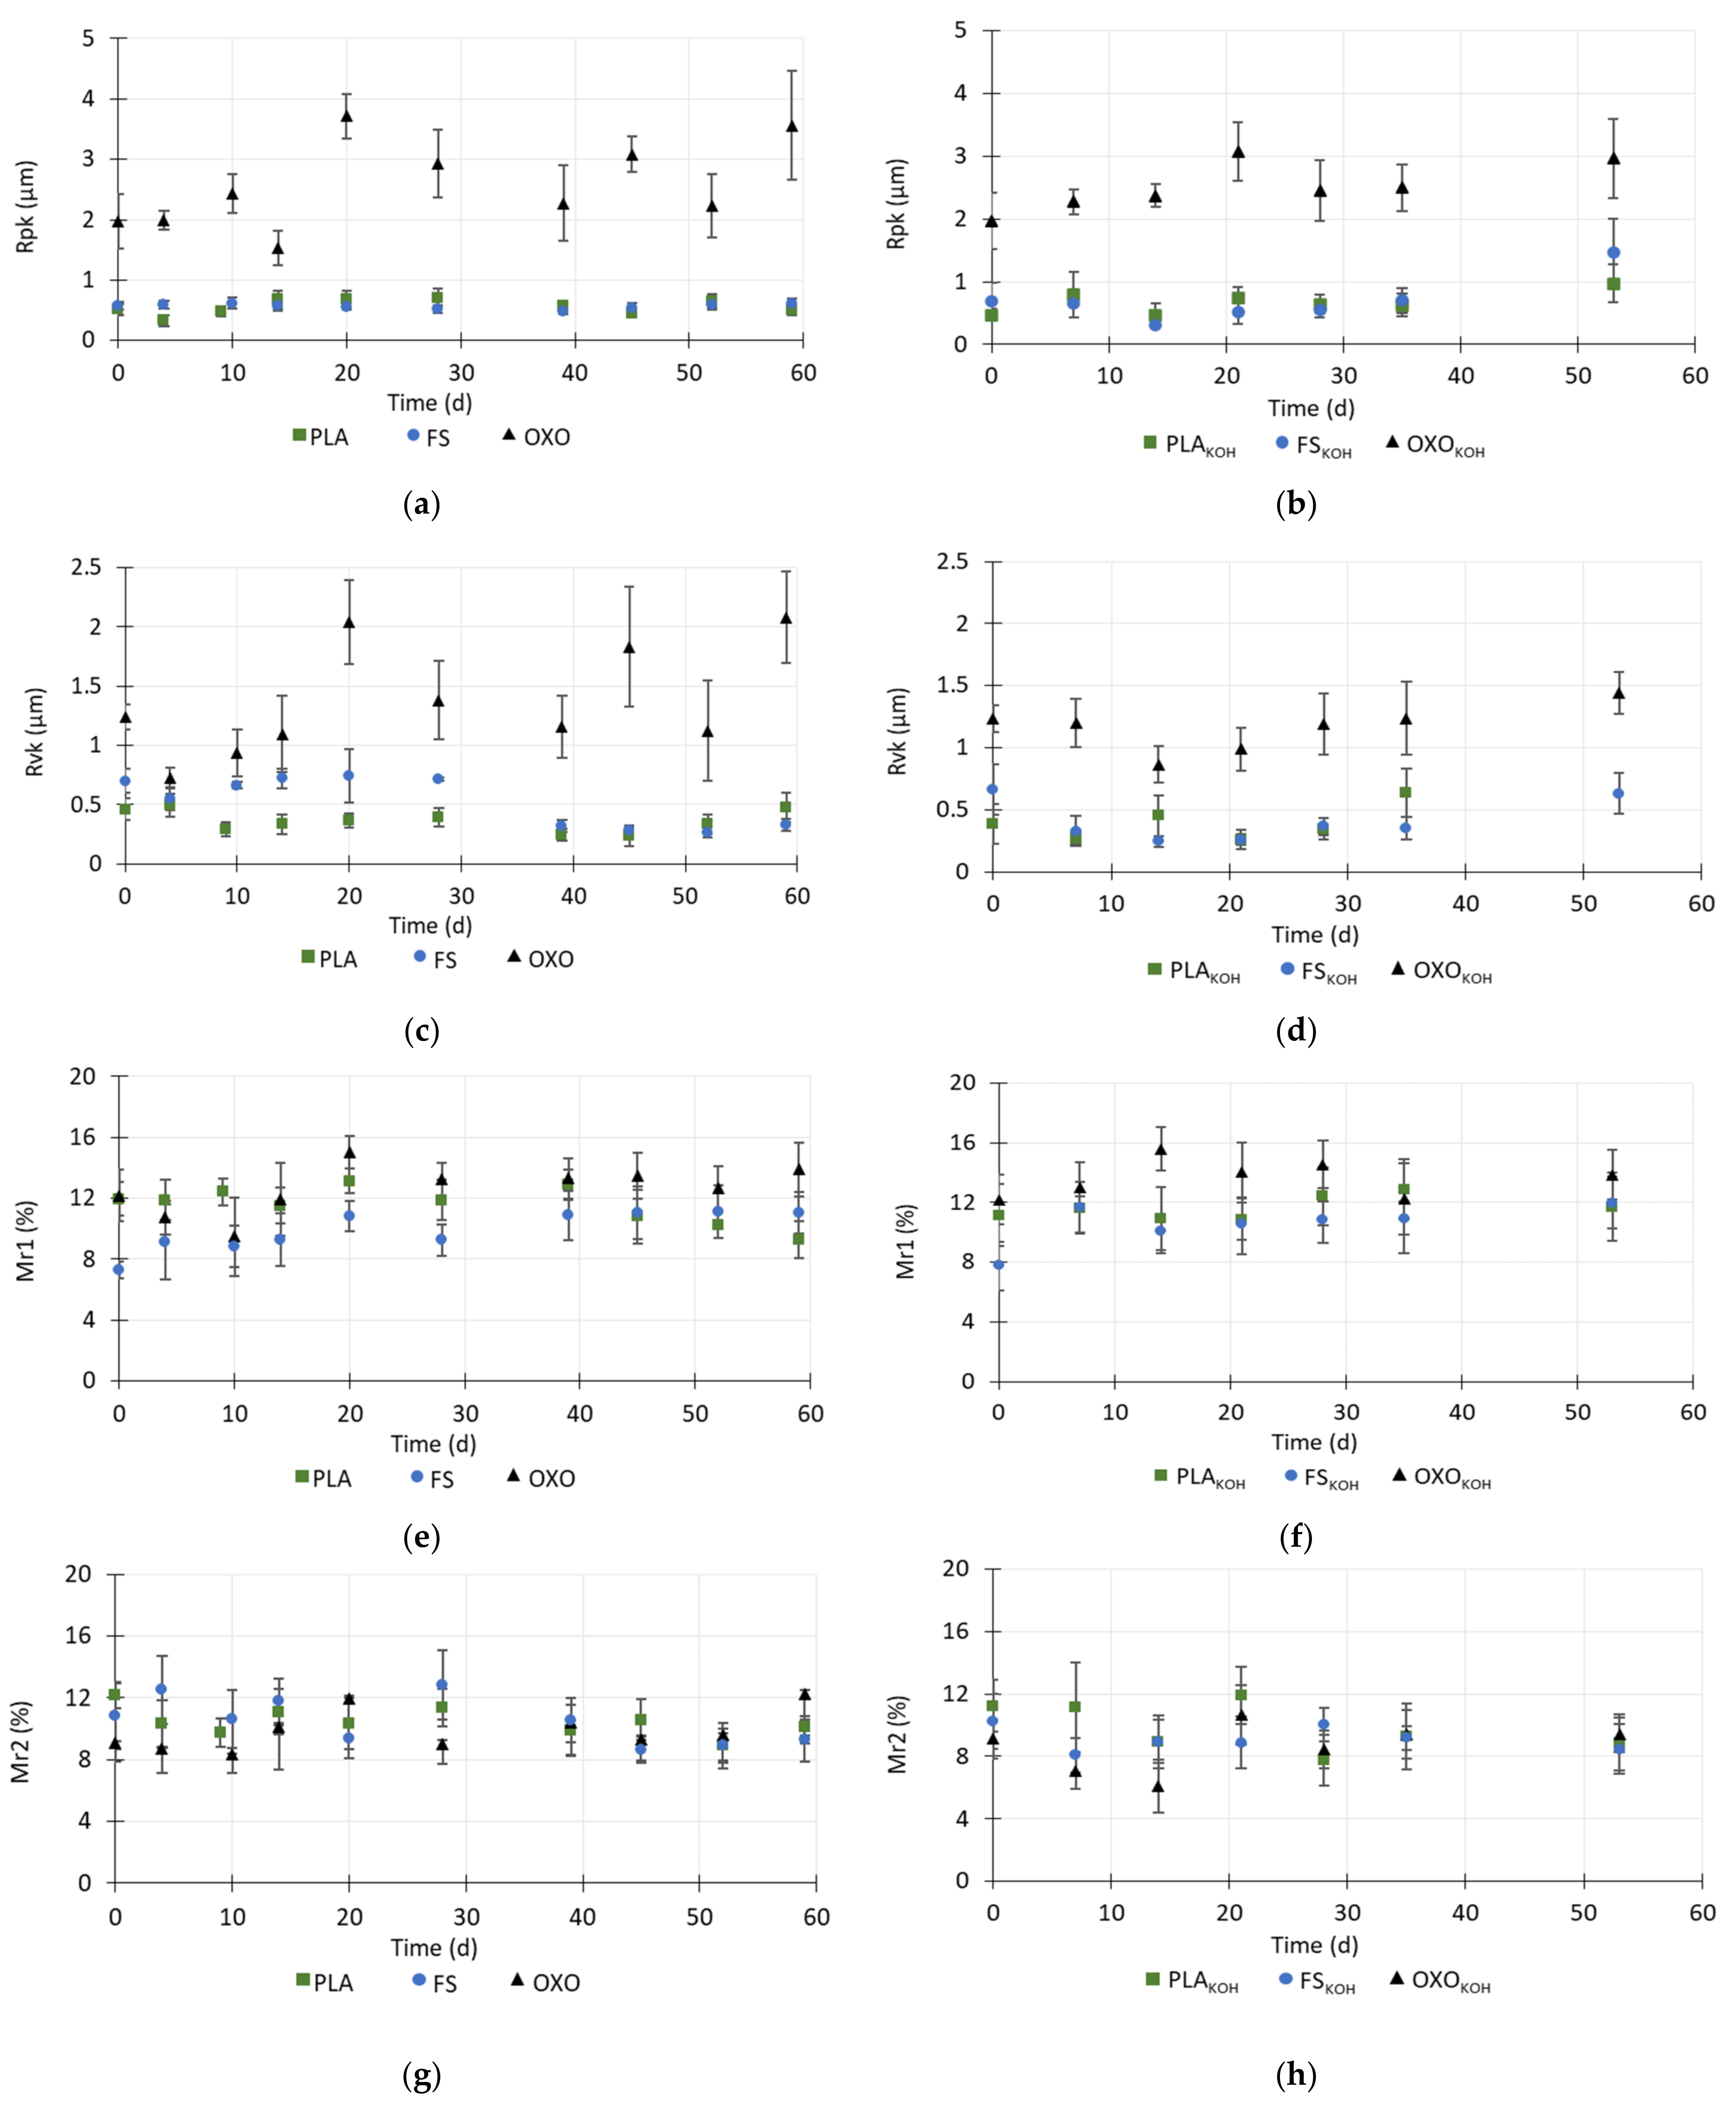
3.4. Changes in the Surface Roughness of the Foils

During anaerobic degradation, the surface roughness of the foils decreased. Measurements of roughness were carried out to days 59 and 53 of degradation of the untreated and treated foils, respectively. After this time, the foils were too brittle to be analyzed.
During the first 9 days of anaerobic degradation, the Ra, Rq and Rt values of untreated PLA decreased, corresponding to a decrease in the roughness core (Rk). In addition, the reduced valley depth (Rvk) also decreased. Taken together, the decreases in these values indicated that the roughness of the PLA decreased, which may be due to the diffusion of the inoculum into the polymer matrix and water adsorption by the polymer. From day 9 to day 20, the Ra, Rq, Rt values increased, and on day 28, these values were similar to values noted in the raw material. In contrast, the Rpk value decreased until day 4, and then until day 14, it increased more than 2-times, and then remained at a similar level until the end of the measurements (Figure 5 and Figure 6).
Until day 45, the the Ra, Rq, Rt values for PLA decreased again by about 1.4–1.5 times compared to the raw material, which was probably related to the secondary diffusion of water into the material structure. This also may indicate a gradual decrease in the thickness of the foil. The percentage of the peaks and valleys (Mr1 and Mr2) remained at a same level until day 45, then slightly decreased.
Regarding the FS foil, the Ra, Rq and Rt values increased during the first days of the anaerobic testing, which may indicate that the top layer of the material quickly dissolved. The structure of the material then became more complex and non-homogeneous. The roughness (Ra, Rq, Rt, Rk) of foil FS decreased to the 39th day of the analysis, and after this time, it remained at a constant level. However, the total height of the profile (Rt) increased, which may mean that larger random height peaks occurred in the structure, which are characteristic of damage to the surface structure.
Regarding the OXO foil, the roughness indicators did not display any differences up to day 14, and then, on day 20, all of these values except Mr1 and Mr2 increased 1.7–2.3-times. After day 20, all roughness indicators decreased. However, on the 59th day of degradation, the Ra, Rq, Rt, Rk, Rpk and Rvk values increased, which may have been related to the removal of oxo-additives from the surface structure. During the degradation test, the value of Mr1 decreased slightly, while that of Mr2 remained at a similar level (Figure 5 and Figure 6).
Generally, after the pretreatment with KOH, the roughness of the bio-based materials decreased. This may be due to degradation of the external layers of the foils. However, the MR2 and MR1 values remained at a level similar to that in the untreated materials (Figure 5 and Figure 6).
The pretreatment caused the initial weakening of the surface structure of the PLA. After the pretreatment with KOH, binding of PLA and KOH might have taken place, which would have created a layer that partially blocked the pores in the structure, resulting in the lack of change in the roughness indicators. The slight fluctuations in their values may have resulted from the damage to the surface of the materials after pretreatment. The Ra, Rq, Rt, Rk, Rpk and Rvk values decreased on day 53 of the anaerobic test. This may indicate that particles were rinsed out of the material into the inoculum. Moreover, the lower Rk value indicated a decrease in the roughness core, which could be connected with damage to the top layer of the material. At this time, the material defragmented when it was touched and further determination of the surface roughness was not possible. In contrast, Luo et al. [30] found that, in compost conditions, the neat PLA did not present significant changes on the surface after 5 days biodegradation, but after 20 days, the surface roughness increased. This could be owned to the hydrolysis of PLA and microorganism activities. With increasing incubation time, the cracks and voids became substantially deep and large.
After the KOH pretreatment, the roughness indicators of the FS were lower than those of the untreated material, and they decreased with time until 14 days of the anaerobic test had passed, indicating rapid initial degradation of S. The changes in the values of the roughness indicators corresponded to changes in the MP profile. The lag phase of MP lasted only 4 days and was shorter with pretreated material than with untreated foil, and after this time methane started to be produced rapidly until day 15.
Cumulative MP was higher with treated FS than with the untreated material. Between 15 and 35 days of the test, the roughness indicators did not change much. On day 53, these values differed from what was observed on the other days. This was connected with the non-homogenous structure of SKOH and the presence of small, deep micropores on the surface, which increased the roughness indicator values.
The pretreatment of OXO foil caused the initial values of its roughness indicators to be higher than those of the untreated material. This might have been caused by rapid removal of oxo-additives from the surface structure of OXO. It should be emphasized that the OXO was very rough and heterogenous in its structure. The polymer was not damaged during the anaerobic test, even after the pretreatment, and the changes in its roughness resulted from this heterogenous structure and degradation of the oxo-additive.

3.5. Changes in the Structure of Bio-Based and Oxo-Degradable Foil Materials—FTIR Analysis

Regarding the raw PLA foil material, the FTIR analysis showed typical peaks for pure PLA. Hydrogen-bonded (intra- and intermolecular) -OH groups corresponded to the band at 3371 cm−1. The asymmetric and symmetric vibrations of the -CH3 groups were represented by the bands located at 3000–2850 cm−1. The strong band at 1713 cm−1 indicated asymmetric stretching of carbonyl C=O groups, which may correspond to the amorphous phase of PLA.
In contrast, if a weak band is observed at ~1720 cm−1, it may be assigned to C=O stretching of the crystalline phase of PLA [31]. The bands at 1271, 1104, and 1019 cm−1 corresponded to stretching vibrations of the C-O-C and -CH-O- groups. The band at 930 cm−1 combined contributions of both -CH3 rocking and deformation of the carboxylic -OHH groups [32]. The O-CH-CH3, esters and/or C-C and rocking vibrations of -CH3 groups were noted at 874 and 727 cm−1, respectively (Figure 7).
With the untreated PLA foil material, the intensity of all bands increased after ca. 100 days of the anaerobic thermophilic test, except the one corresponding to -OH (at 3371 cm−1), which indicated PLA degradation. For example, the intensity of the peak at 1713 cm−1 increased, which corresponds to a larger amount of carbonyl C=O groups, which are terminal groups in PLA chains. This indicates that the molecular weight of the PLA chains decreased. Although high molecular weight PLA is insoluble in water, during the degradation process, water diffuses into the polymer matrix, causing the hydrolysis of the ester groups of the amorphous phase. As a result, short-chain soluble carboxyl-terminated oligomers and monomers are formed and penetrate the aqueous environment. This causes an increase in the number of carboxyl chain ends, which was shown by the greater intensity of the peak corresponding to this group [33,34].
On the contrary, with PLA foil pretreated with KOH, the intensity of all bands decreased. However, in both cases biodegradation took place, which was confirmed by the weakness of the mechanical properties of the material and MP.
However, the time during which it was possible to determine the mechanical properties of PLAKOH was 28 days, which was almost 2 two times shorter than that during which the properties of PLA could be determined. Pretreatment influenced the mechanical properties more than biogas production.
Vasile et al. [24] found that, during the degradation of PLA and its composite in soil burial conditions, degradation included the ester groups destroyed by hydrolysis.
In the present study, the intensity of the ATR-FT-IR spectra decreased due to hydrolytic degradation. These results are consistent with those in the literature, Maharana et al. [35] concluded that chain scission of the PLA main chain takes place where the ester bonds are located, leading to the formation of oligomers.
Regarding the raw FS foil material, the bands at 2915 cm−1 indicated C–H stretching in aliphatic and aromatic groups (Figure 7). The bands at 1715 and 1272 cm−1 corresponded to C=O groups and C–O bonds found in ester linkages. The peak at 1019 cm−1 was caused by the stretching of phenylene groups. The band at 727 cm−1 indicated four or more adjacent methylene (–CH2–) groups. The FTIR spectra of FS foil contained bands characteristic of plasticized starch. The peaks between 3558–3100 cm−1 and between 1269–900 cm−1 corresponded to O–H stretching groups and to C-O stretching and hydrogen bonding peaks, respectively. The peaks recorded at 1140 and 1103 cm−1 corresponded to C–O stretching in the C–O–H group. At 1016 cm−1, evidence of C–O stretching in the C–O–C group of the starch anhydroglucose ring could be seen. After 100 days of anaerobic degradation of untreated FS foil material, the bands in the FTIR spectrum were almost identical to those in the spectrum of the raw material, and no new peaks were formed. Only the intensity of the spectra increased.
Regarding the treated FS foil material, the bands in the FTIR spectrum and their intensities were even more similar to those in the spectrum obtained from the raw material. It should be emphasized that pretreatment weakened the mechanical properties of the material more rapidly, and FSKOH produced 80% more methane than FS. Thus, the FTIR spectrums that were obtained after degradation of FS and FSKOH differed.
The FTIR spectra of OXO and OXOKOH were typical of PE (Figure 7). The bands at 2849 and 2846 cm−1 corresponded to C–H stretching asymmetric and symmetric vibrations, whereas the band at 1464 cm−1 was due to scissoring CH2 groups. The bands at 720 cm−1 and 717 cm−1 were caused by CH2 rocking vibrations. A small band was noted at 1630 cm−1, related to a double bond (or aromatic rings), probably due to some surface antioxidant additive. The spectra obtained from the material after 100 days of anaerobic treatment displayed lower intensity peaks. The band at 1630 cm−1 was not observed, which means that the antioxidant additive was washed away or assimilated by bacteria and the spectrum was from pure PE [36]. As a result of the disappearance of the additive, the OXO chains shortened, which slightly weakened the mechanical properties of the material. Degradation of modified polyethylene can proceed via two mechanisms (i) hydro-biodegradation and (ii) oxo-biodegradation, depending on the two additives, starch or pro-oxidant, used in the synthesis polymer [37]. Starch blend polyethylene contains starch inclusions which makes the material hydrophilic and, therefore, microbial amylase enzymes can easily access, attack and remove this part.
Polyethylene with pro-oxidant additive can be photodegraded and chemically degraded, and low molecular weight products are sequentially oxidized [38,39].

4. Conclusions

Because the share of usable polymers has increased in municipal waste streams, it is necessary to the determine the degradability of these materials, which is the current challenge of organic recycling strategies. It was shown that untreated and treated OXO did not degrade; thus, there was no methane production and no visible changes on the surface or in the mechanical properties. Untreated bio-based foils began to lose mechanical properties by day 50 of the anaerobic thermophilic degradation test; the pieces were still visible even after 100 days, and they only disintegrated when touched. Cumulative MP reached only 34 L/kg VS. After pretreatment, cumulative MP increased to 47.5 L/kg VS (PLAKOH) and 58.6 L/kg VS (FSKOH). However, these values constituted only 8–10% of the theoretical MP. Pretreatment of bio-based foils increased surface damage and weakened their mechanical properties (tensile strength, elongation at break). This means that the pieces of bio-based materials may contaminate digestate at municipal waste treatment plant.

Author Contributions

Conceptualization, M.Z. and K.B.; methodology, M.Z., K.B., and B.P.; formal analysis, K.B., I.W.-B., and D.K.; validation, M.Z. and B.P.; investigation, M.Z., B.P., and K.B.; resources, M.Z., K.B., I.W.-B., and D.K.; data curation, M.Z. and K.B.; writing—original draft preparation, M.Z., K.B., B.P., and D.K.; writing—review and editing, M.Z., B.P., K.B., I.W.-B., and D.K.; visualization, M.Z. and B.P.; supervision, K.B.; funding acquisition, K.B., I.W.-B., and D.K. All authors have read and agreed to the published version of the manuscript.

Funding

We are grateful for the financial support of the Ministry of Science and Higher Education, Poland (statutory project No. 29.610.024-110). Publication (Open Access) of this research was financially co-supported by Minister of Science and Higher Education in the range of the program entitled “Regional Initiative of Excellence” for the years 2019–2022, Project No. 010/RID/2018/19, amount of funding 12,000,000 PLN.

Institutional Review Board Statement

Not applicable.

Informed Consent Statement

Not applicable.

Data Availability Statement

Not applicable.

Conflicts of Interest

The authors declare no conflict of interest. The funders had no role in the design of the study; in the collection, analyses, or interpretation of data; in the writing of the manuscript, or in the decision to publish the results.

References

  1. Plastics Europe. Plastics—The Facts 2019. An Analysis of European Plastics Production, Demand and Waste Data. Available online: https://www.plasticseurope.org/application/files/9715/7129/9584/FINAL_web_version_Plastics_the_facts2019_14102019.pdf (accessed on 30 June 2021).
  2. Zhao, X.; Cornish, K.; Vodovotz, Y. Narrowing the Gap for Bioplastic Use in Food Packaging: An Update. Environ. Sci. Technol. 2020, 54, 4712–4732. [Google Scholar] [CrossRef]
  3. Mallegni, N.; Phuong, T.V.; Coltelli, M.-B.; Cinelli, P.; Lazzeri, A. Poly(lactic acid) (PLA) Based Tear Resistant and Biodegradable Flexible Films by Blown Film Extrusion. Materials 2018, 11, 148. [Google Scholar] [CrossRef] [Green Version]
  4. Abdelmoez, W.; Dahab, I.; Ragab, E.M.; Abdelsalam, O.A.; Mustafa, A. Bio-and oxo-degradable plastics: Insights on facts and challenges. Polym. Adv. Technol. 2021, 32, 1981–1996. [Google Scholar] [CrossRef]
  5. Ojeda, T.F.; Dalmolin, E.; Forte, M.M.; Jacques, R.J.S.; Bento, F.M.; Camargo, F.A. Abiotic and biotic degradation of oxo-biodegradable polyethylenes. Polym. Degrad. Stab. 2009, 94, 965–970. [Google Scholar] [CrossRef]
  6. Emadian, S.M.; Onay, T.T.; Demirel, B. Biodegradation of bioplastics in natural environments. Waste Manag. 2017, 59, 526–536. [Google Scholar] [CrossRef] [PubMed]
  7. Artham, T.; Doble, M. Biodegradation of Aliphatic and Aromatic Polycarbonates. Macromol. Biosci. 2007, 8, 14–24. [Google Scholar] [CrossRef] [PubMed]
  8. Ahmed, T.; Shahid, M.; Azeem, F.; Rasul, I.; Shah, A.A.; Noman, M.; Hameed, A.; Manzoor, N.; Manzoor, I.; Muhammad, S. Biodegradation of plastics: Current scenario and future prospects for environmental safety. Environ. Sci. Pollut. Res. 2018, 25, 7287–7298. [Google Scholar] [CrossRef] [PubMed]
  9. Bernat, K.; Kulikowska, D.; Wojnowska-Baryła, I.; Zaborowska, M.; Pasieczna-Patkowska, S. Thermophilic and mesophilic biogas production from PLA-based materials: Possibilities and limitations. Waste Manag. 2021, 119, 295–305. [Google Scholar] [CrossRef]
  10. Benn, N.; Zitomer, D. Pretreatment and Anaerobic Co-digestion of Selected PHB and PLA Bioplastics. Front. Environ. Sci. 2018, 5, 93. [Google Scholar] [CrossRef] [Green Version]
  11. Yu, J.; Plackett, D.; Chen, L.X. Kinetics and mechanism of the monomeric products from abiotic hydrolysis of poly[(R)-3-hydroxybutyrate] under acidic and alkaline conditions. Polym. Degrad. Stab. 2005, 89, 289–299. [Google Scholar] [CrossRef]
  12. Myung, J.; Strong, N.I.; Galega, W.M.; Sundstrom, E.R.; Flanagan, J.C.; Woo, S.-G.; Waymouth, R.; Criddle, C.S. Disassembly and reassembly of polyhydroxyalkanoates: Recycling through abiotic depolymerization and biotic repolymerization. Bioresour. Technol. 2014, 170, 167–174. [Google Scholar] [CrossRef] [Green Version]
  13. Abbott, E.J.; Firestone, F.A. Specifying surface quality: A method based on accurate measurement and comparison. Spie MS 1995, 107, 63. [Google Scholar]
  14. Pszczółkowski, B.; Bramowicz, M.; Rejmer, W.; Chrostek, T.; Senderowski, C. The influence of the processing temperature of polylactide on geometric structure of the surface using FDM technique. Arch. Metall. Mater. 2021, 66, 181–186. [Google Scholar] [CrossRef]
  15. Greenberg, A.E.; Clesceri, L.S.; Eaton, A.D. Standard Methods for the Examination of Water and Wastewater, 18th ed.; APHA: Washington, DC, USA, 1992.
  16. Buswell, A.M.; Mueller, H.F. Mechanism of Methane Fermentation. Ind. Eng. Chem. 1952, 44, 550–552. [Google Scholar] [CrossRef]
  17. Aldas, M.; Ferri, J.M.; Lopez-Martinez, J.; Samper, M.D.; Arrieta, M.P. Effect of pine resin derivatives on the structural, thermal, and mechanical properties of Mater-Bi type bioplastic. J. Appl. Polym. Sci. 2019, 137. [Google Scholar] [CrossRef]
  18. Mohee, R.; Unmar, G.; Mudhoo, A.; Khadoo, P. Biodegradability of biodegradable/degradable plastic materials under aerobic and anaerobic conditions. Waste Manag. 2008, 28, 1624–1629. [Google Scholar] [CrossRef]
  19. Itävaara, M.; Karjomaa, S.; Selin, J.-F. Biodegradation of polylactide in aerobic and anaerobic thermophilic conditions. Chemosphere 2002, 46, 879–885. [Google Scholar] [CrossRef]
  20. Yagi, H.; Ninomiya, F.; Funabashi, M.; Kunioka, M. Anaerobic biodegradation tests of poly(lactic acid) and polycaprolactone using new evaluation system for methane fermentation in anaerobic sludge. Polym. Degrad. Stab. 2009, 94, 1397–1404. [Google Scholar] [CrossRef]
  21. Yagi, H.; Ninomiya, F.; Funabashi, M.; Kunioka, M. Anaerobic Biodegradation Tests of Poly(lactic acid) under Mesophilic and Thermophilic Conditions Using a New Evaluation System for Methane Fermentation in Anaerobic Sludge. Int. J. Mol. Sci. 2009, 10, 3824–3835. [Google Scholar] [CrossRef] [Green Version]
  22. Corti, A.; Muniyasamy, S.; Vitali, M.; Imam, S.H.; Chiellini, E. Oxidation and biodegradation of polyethylene films containing pro-oxidant additives: Synergistic effects of sunlight exposure, thermal aging and fungal biodegradation. Polym. Degrad. Stab. 2010, 95, 1106–1114. [Google Scholar] [CrossRef]
  23. Yashchuk, O.; Portillo, F.; Hermida, E. Degradation of Polyethylene Film Samples Containing Oxo-Degradable Additives. Procedia Mater. Sci. 2012, 1, 439–445. [Google Scholar] [CrossRef] [Green Version]
  24. Vasile, C.; Pamfil, D.; Râpă, M.; Darie-Niţă, R.N.; Mitelut, A.C.; Popa, E.E.; Popescu, P.A.; Draghici, M.C.; Popa, M.E. Study of the soil burial degradation of some PLA/CS biocomposites. Compos. Part B Eng. 2018, 142, 251–262. [Google Scholar] [CrossRef]
  25. De Jong, S.; Arias, E.; Rijkers, D.T.; van Nostrum, C.; Bosch, J.K.-V.D.; Hennink, W. New insights into the hydrolytic degradation of poly(lactic acid): Participation of the alcohol terminus. Polymer 2001, 42, 2795–2802. [Google Scholar] [CrossRef]
  26. Elsawy, M.; Kim, K.-H.; Park, J.-W.; Deep, A. Hydrolytic degradation of polylactic acid (PLA) and its composites. Renew. Sustain. Energy Rev. 2017, 79, 1346–1352. [Google Scholar] [CrossRef]
  27. Rajesh, G.; Prasad, A.R.; Gupta, A. Soil Degradation Characteristics of Short Sisal/PLA Composites. Mater. Today Proc. 2019, 18, 1–7. [Google Scholar] [CrossRef]
  28. Sevim, K.; Pan, J. A model for hydrolytic degradation and erosion of biodegradable polymers. Acta Biomater. 2018, 66, 192–199. [Google Scholar] [CrossRef] [Green Version]
  29. Lv, S.; Zhang, Y.; Gu, J.; Tan, H. Physicochemical evolutions of starch/poly (lactic acid) composite biodegraded in real soil. J. Environ. Manag. 2018, 228, 223–231. [Google Scholar] [CrossRef]
  30. Luo, Y.; Lin, Z.; Guo, G. Biodegradation Assessment of Poly (Lactic Acid) Filled with Functionalized Titania Nanoparticles (PLA/TiO2) under Compost Conditions. Nanoscale Res. Lett. 2019, 14, 56. [Google Scholar] [CrossRef] [Green Version]
  31. Silva, R.D.N.; Oliveira, T.A.; Da Conceição, I.D.; Araque, L.M.; Alves, T.S.; Barbosa, R. Evaluation of hydrolytic degradation of bionanocomposites through fourier transform infrared spectroscopy. Polimeros 2018, 28, 348–354. [Google Scholar] [CrossRef]
  32. Socrates, G. Infrared and Raman Characteristic Group Frequencies, 3rd ed.; John Wiley and Sons, Ltd.: Chichester, UK, 2004; Volume 35, ISBN 978-0-470-09307-8. [Google Scholar]
  33. Gupta, A.; Kumar, V. New emerging trends in synthetic biodegradable polymers—Polylactide: A critique. Eur. Polym. J. 2007, 43, 4053–4074. [Google Scholar] [CrossRef]
  34. Middleton, J.C.; Tipton, A.J. Synthetic biodegradable polymers as orthopedic devices. Biomaterials 2000, 21, 2335–2346. [Google Scholar] [CrossRef]
  35. Maharana, T.; Mohanty, B.; Negi, Y. Melt–solid polycondensation of lactic acid and its biodegradability. Prog. Polym. Sci. 2009, 34, 99–124. [Google Scholar] [CrossRef]
  36. Bandini, F.; Frache, A.; Ferrarini, A.; Taskin, E.; Cocconcelli, P.S.; Puglisi, E. Fate of Biodegradable Polymers Under Industrial Conditions for Anaerobic Digestion and Aerobic Composting of Food Waste. J. Polym. Environ. 2020, 28, 2539–2550. [Google Scholar] [CrossRef]
  37. Shah, A.A.; Hasan, F.; Hameed, A.; Ahmed, S. Biological degradation of plastics: A comprehensive review. Biotechnol. Adv. 2008, 26, 246–265. [Google Scholar] [CrossRef]
  38. Bonhomme, S.; Cuer, A.; Delort, A.-M.; Lemaire, J.; Sancelme, M.; Scott, G. Environmental biodegradation of polyethylene. Polym. Degrad. Stab. 2003, 81, 441–452. [Google Scholar] [CrossRef]
  39. Yamada-Onodera, K.; Mukumoto, H.; Katsuyaya, Y.; Saiganji, A.; Tani, Y. Degradation of polyethylene by a fungus, Penicillium simplicissimum YK. Polym. Degrad. Stab. 2001, 72, 323–327. [Google Scholar] [CrossRef]
Figure 1. Methane production profiles during an anaerobic degradation test at 55 °C of bio-based materials made of PLA and FS without pretreatment (a,b), of these materials with pretreatment (c,d), and solubilized materials (e,f); to improve the readability of the figure, 60 days of measurements are shown, although the time of measurements was ca. 100 days.
Energies 14 04775 g001
Figure 2. Cumulative methane production after 100 days of anaerobic degradation of PLA and FS (a), the rate of methane production (b), and the biodegradation degree (BD) (c).
Energies 14 04775 g002
Figure 3. Microscopic images of the structure of untreated and treated foil materials during anaerobic thermophilic degradation test.
Energies 14 04775 g003
Figure 4. Changes in the mechanical properties (tensile strength and elongation at break ε) during an anaerobic degradation test of untreated foils (a,b) and foils after pretreatment with KOH (c,d).
Energies 14 04775 g004
Figure 5. The surface roughness indicators (arithmetical mean roughness value (Ra), mean square surface profile deviation (Rq), the roughness core height (roughness core profile) (Rk), total height of the roughness profile (Rt)) during an anaerobic degradation test of untreated foils (PLA, FS, OXO) (a,c,e,g) and foils after pretreatment with KOH (PLAKOH, FSKOH, OXOKOH) (b,d,f,h).
Energies 14 04775 g005
Figure 6. The surface roughness indicators (the reduced peak height without bearing properties (Rpk), the reduced valleys depth (Rvk); the percentage of the peaks and valleys (Mr1, Mr2, respectively)) during an anaerobic degradation test of untreated foils (PLA, FS, OXO) (a,c,e,g) and foils after pretreatment with KOH (PLAKOH, FSKOH, OXOKOH) (b,d,f,h).
Energies 14 04775 g006
Figure 7. FTIR spectra of untreated foil materials (PLA, FS, OXO) (a,c,e) and foil materials after pretreatment with KOH (PLAKOH, FSKOH, OXOKOH) (b,d,f) before and after 100 days of anaerobic degradation at 55 °C.
Energies 14 04775 g007
Table 1. Elemental composition, empirical formula, and theoretical methane production (TMP) of foil materials (PLA, FS) and of pure polymers (pure PLA, pure FS).
CharacteristicsPure PLAPLAPure FSFS
Empirical formulaC3H4O2C4.4H6.31O2C6H10O5C9.8H14.7O5
Elemental composition
Carbon, % TS50.0057.5644.4455.36
Hydrogen, % TS5.566.886.176.90
Oxygen, % TS44.4434.8649.3837.64
Methane production
* TMP, L/kg467610413577
** MP, L/kg162125
* TMP calculated using the Buswell equation [16]; ** cumulative methane production (MP) after 100 days of anaerobic thermophilic treatment of solubilized PLA and FS.
Publisher’s Note: MDPI stays neutral with regard to jurisdictional claims in published maps and institutional affiliations.

