
Cold Ageing of NMC811 Lithium-ion Batteries

 ,
, 
Abstract
:1. Introduction
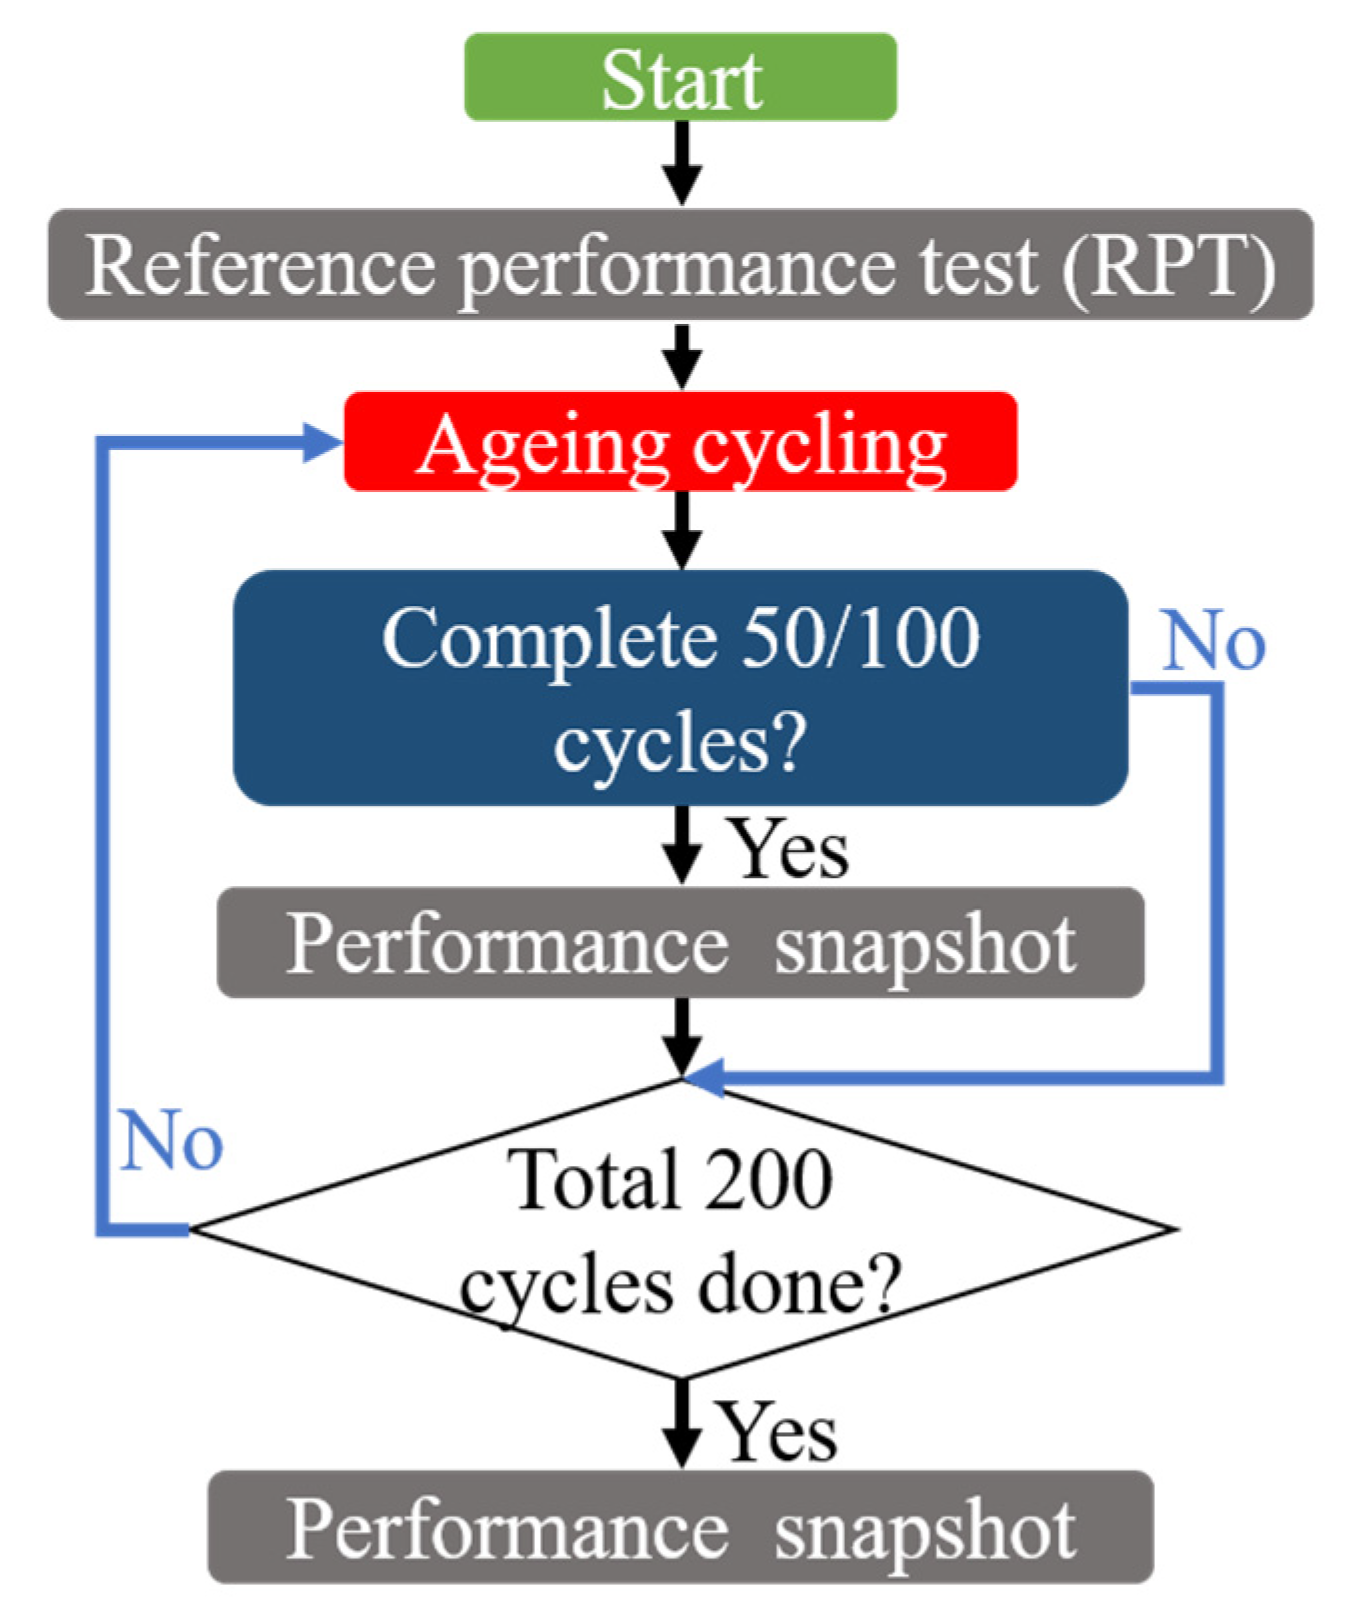
2. Experimental Setup and Procedures
3. Results
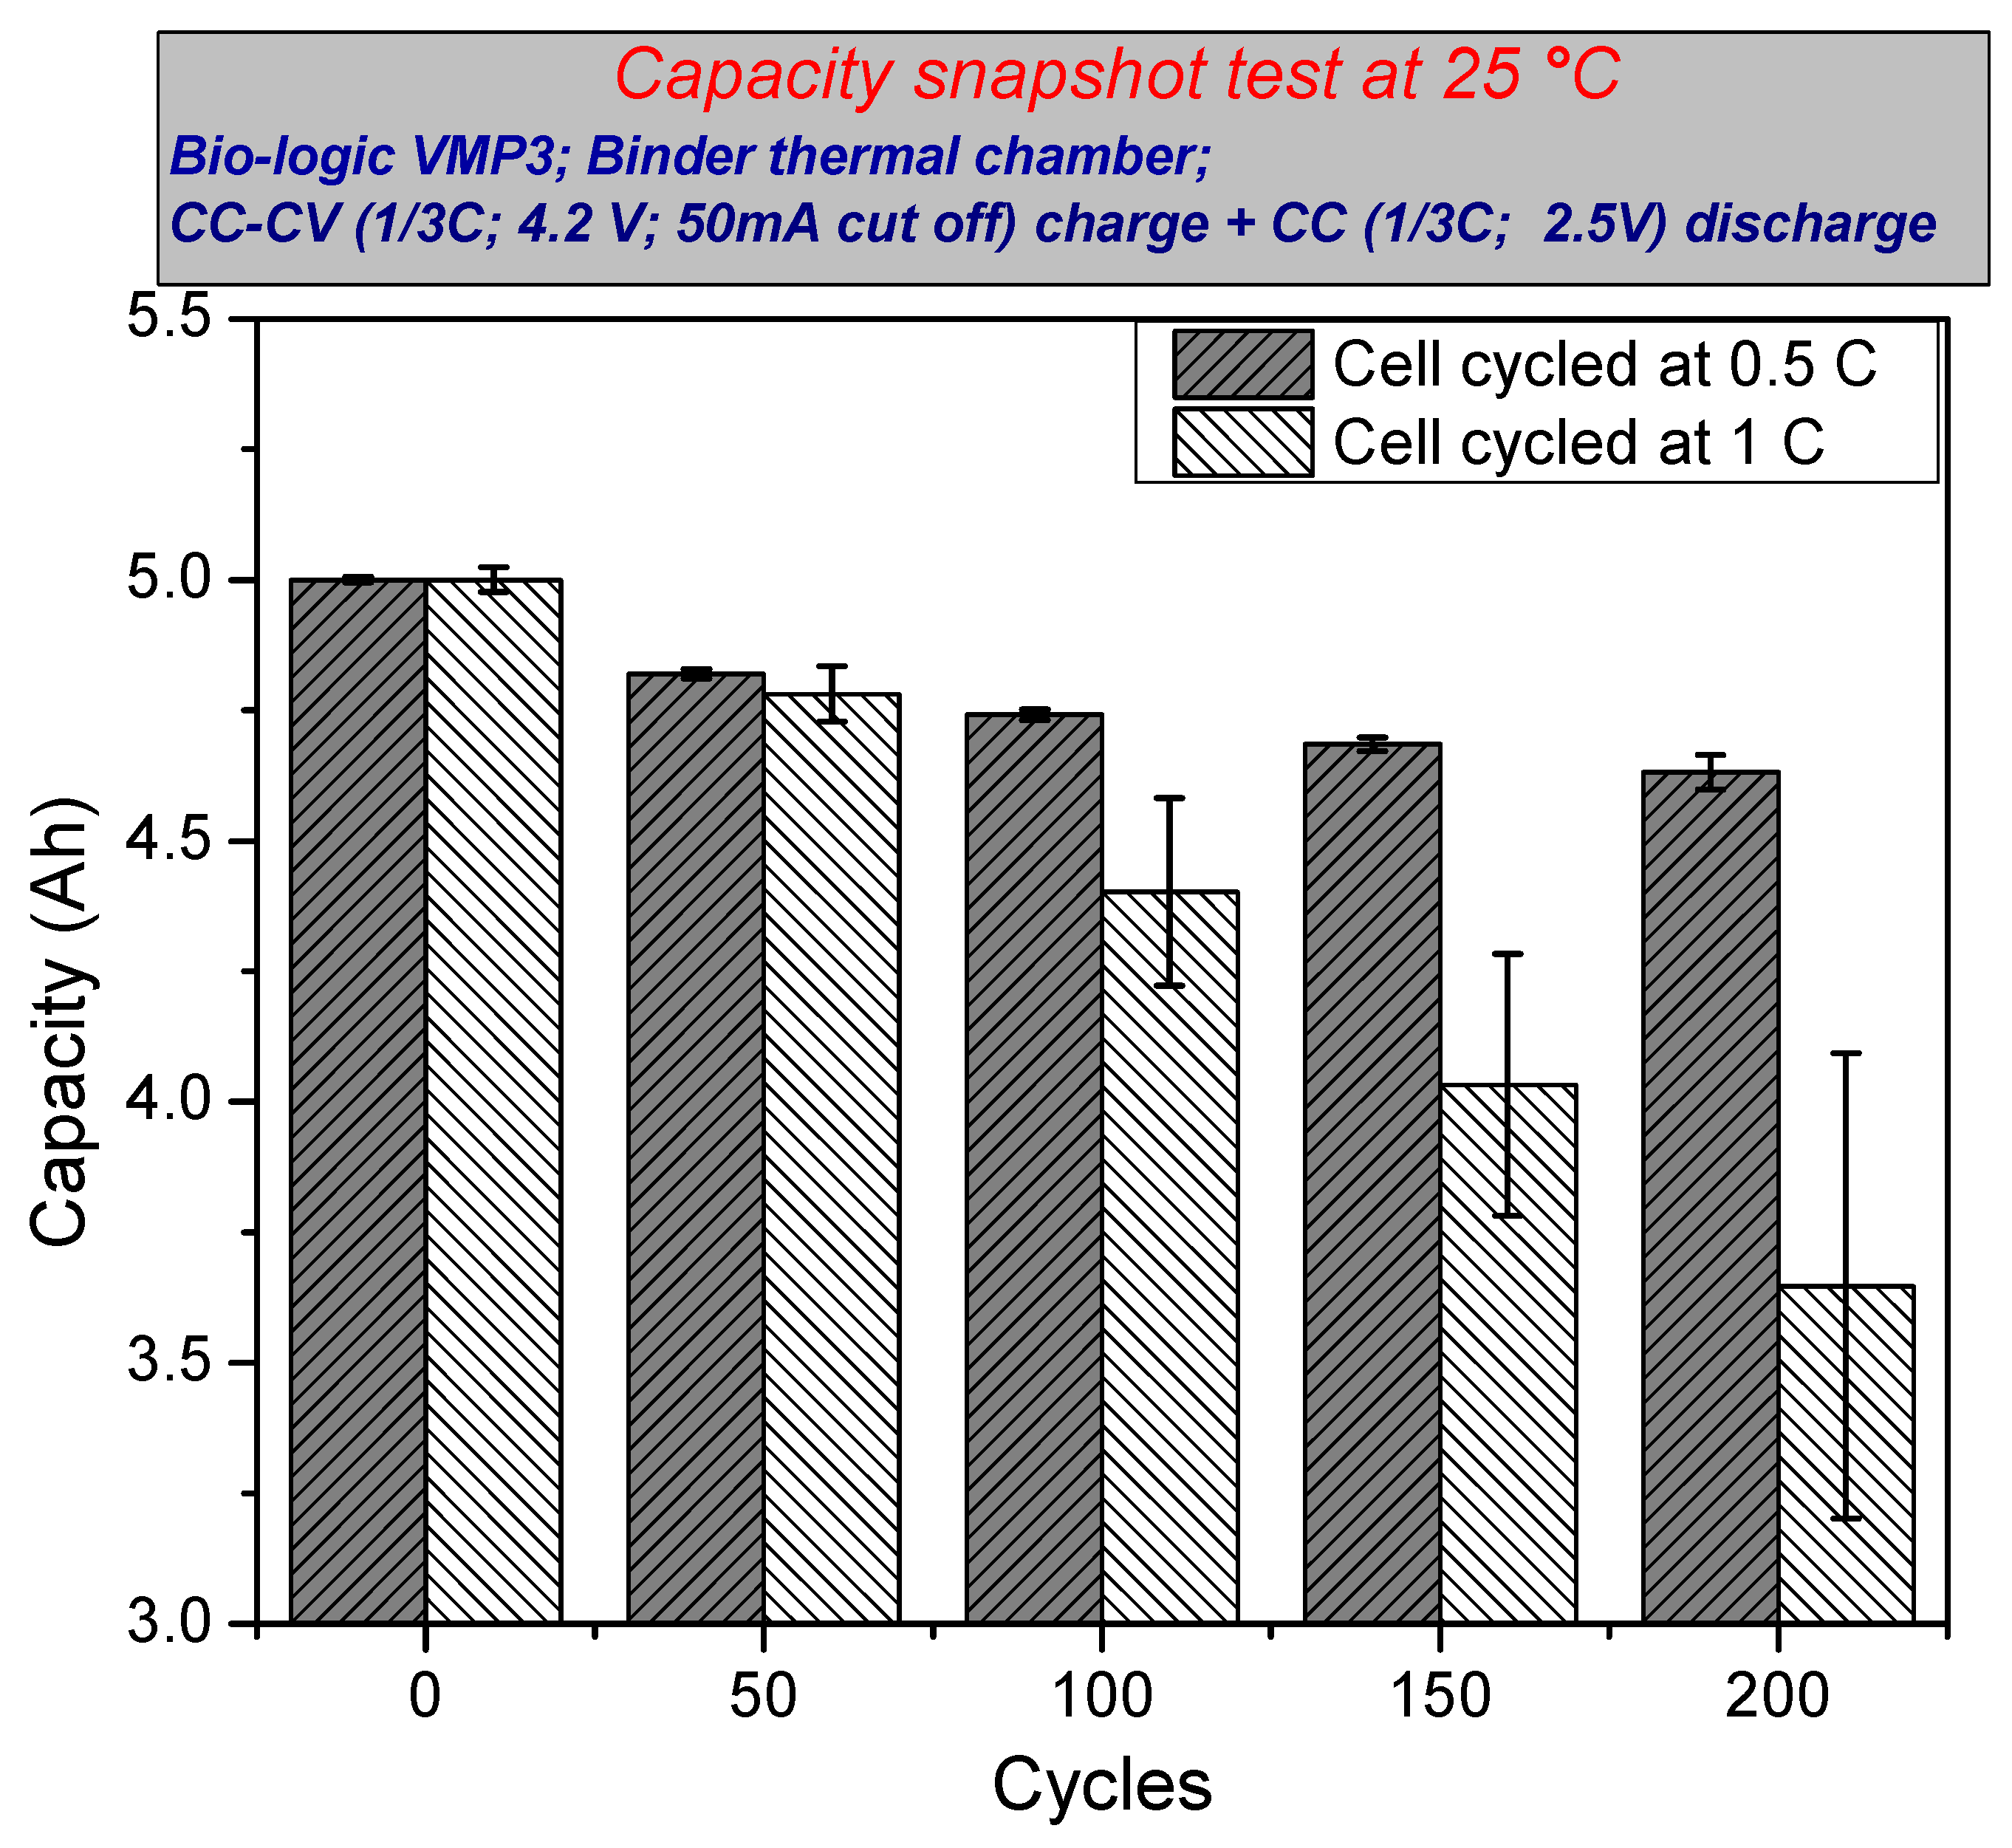
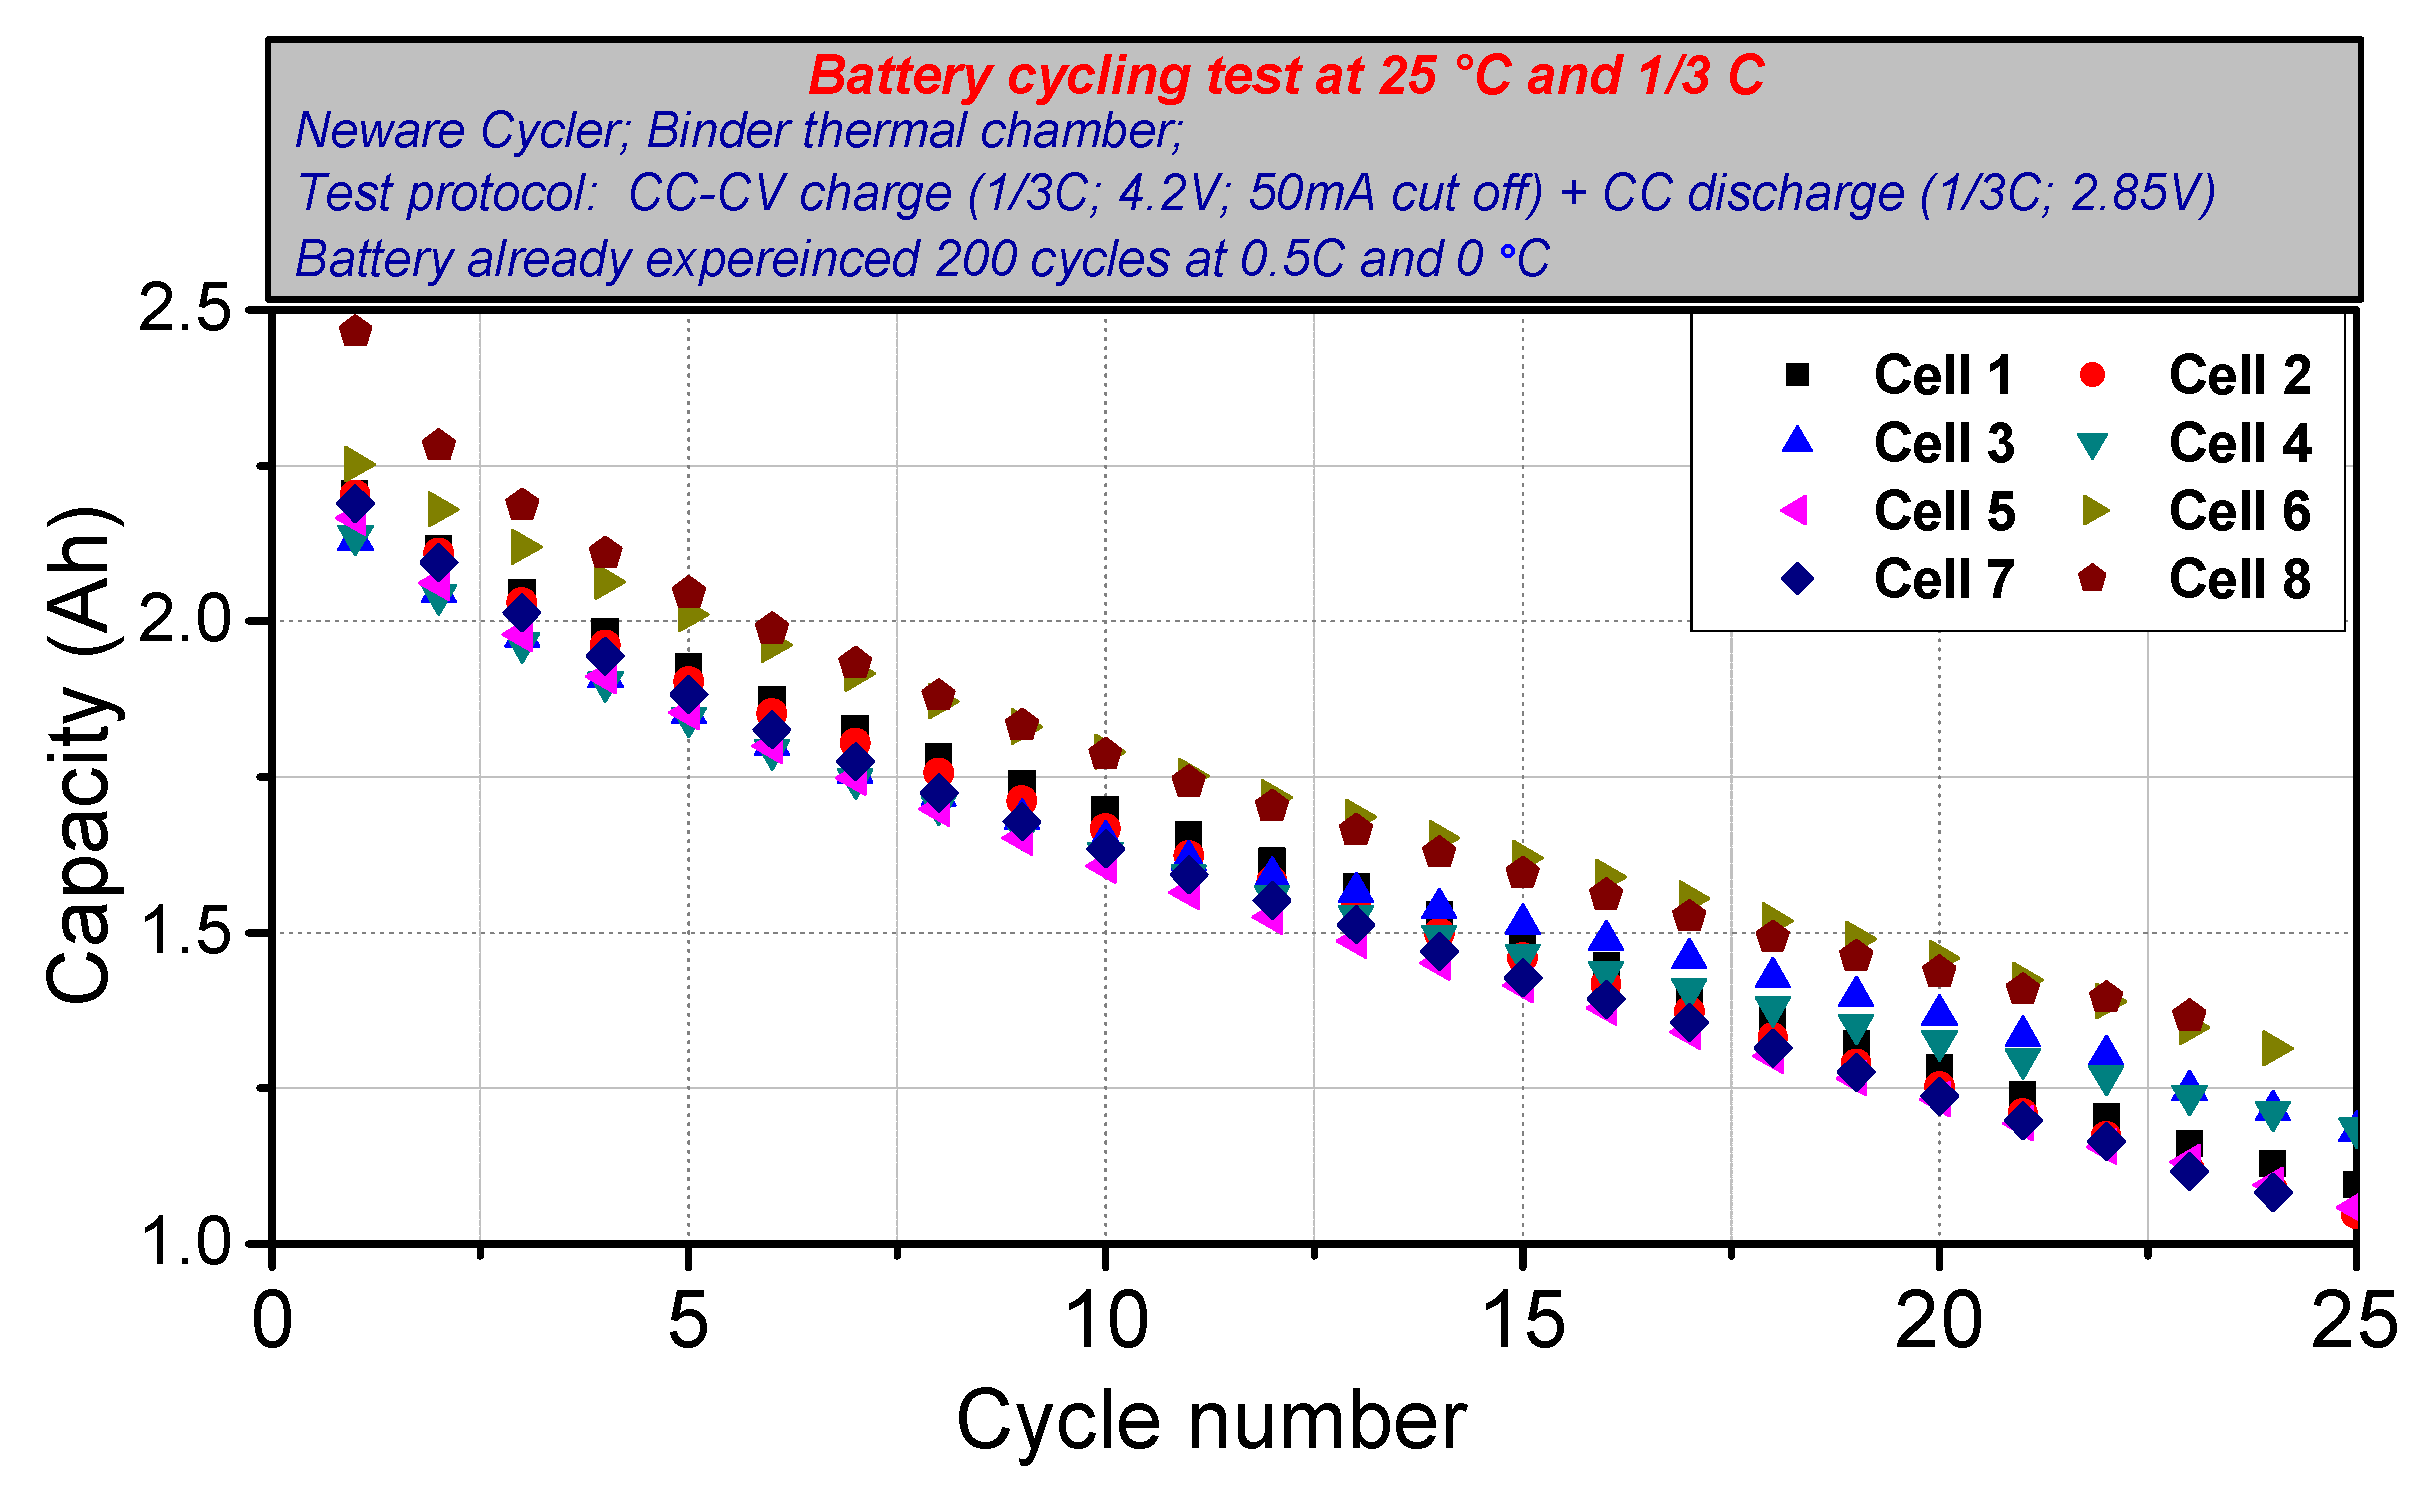
3.1. Capacity
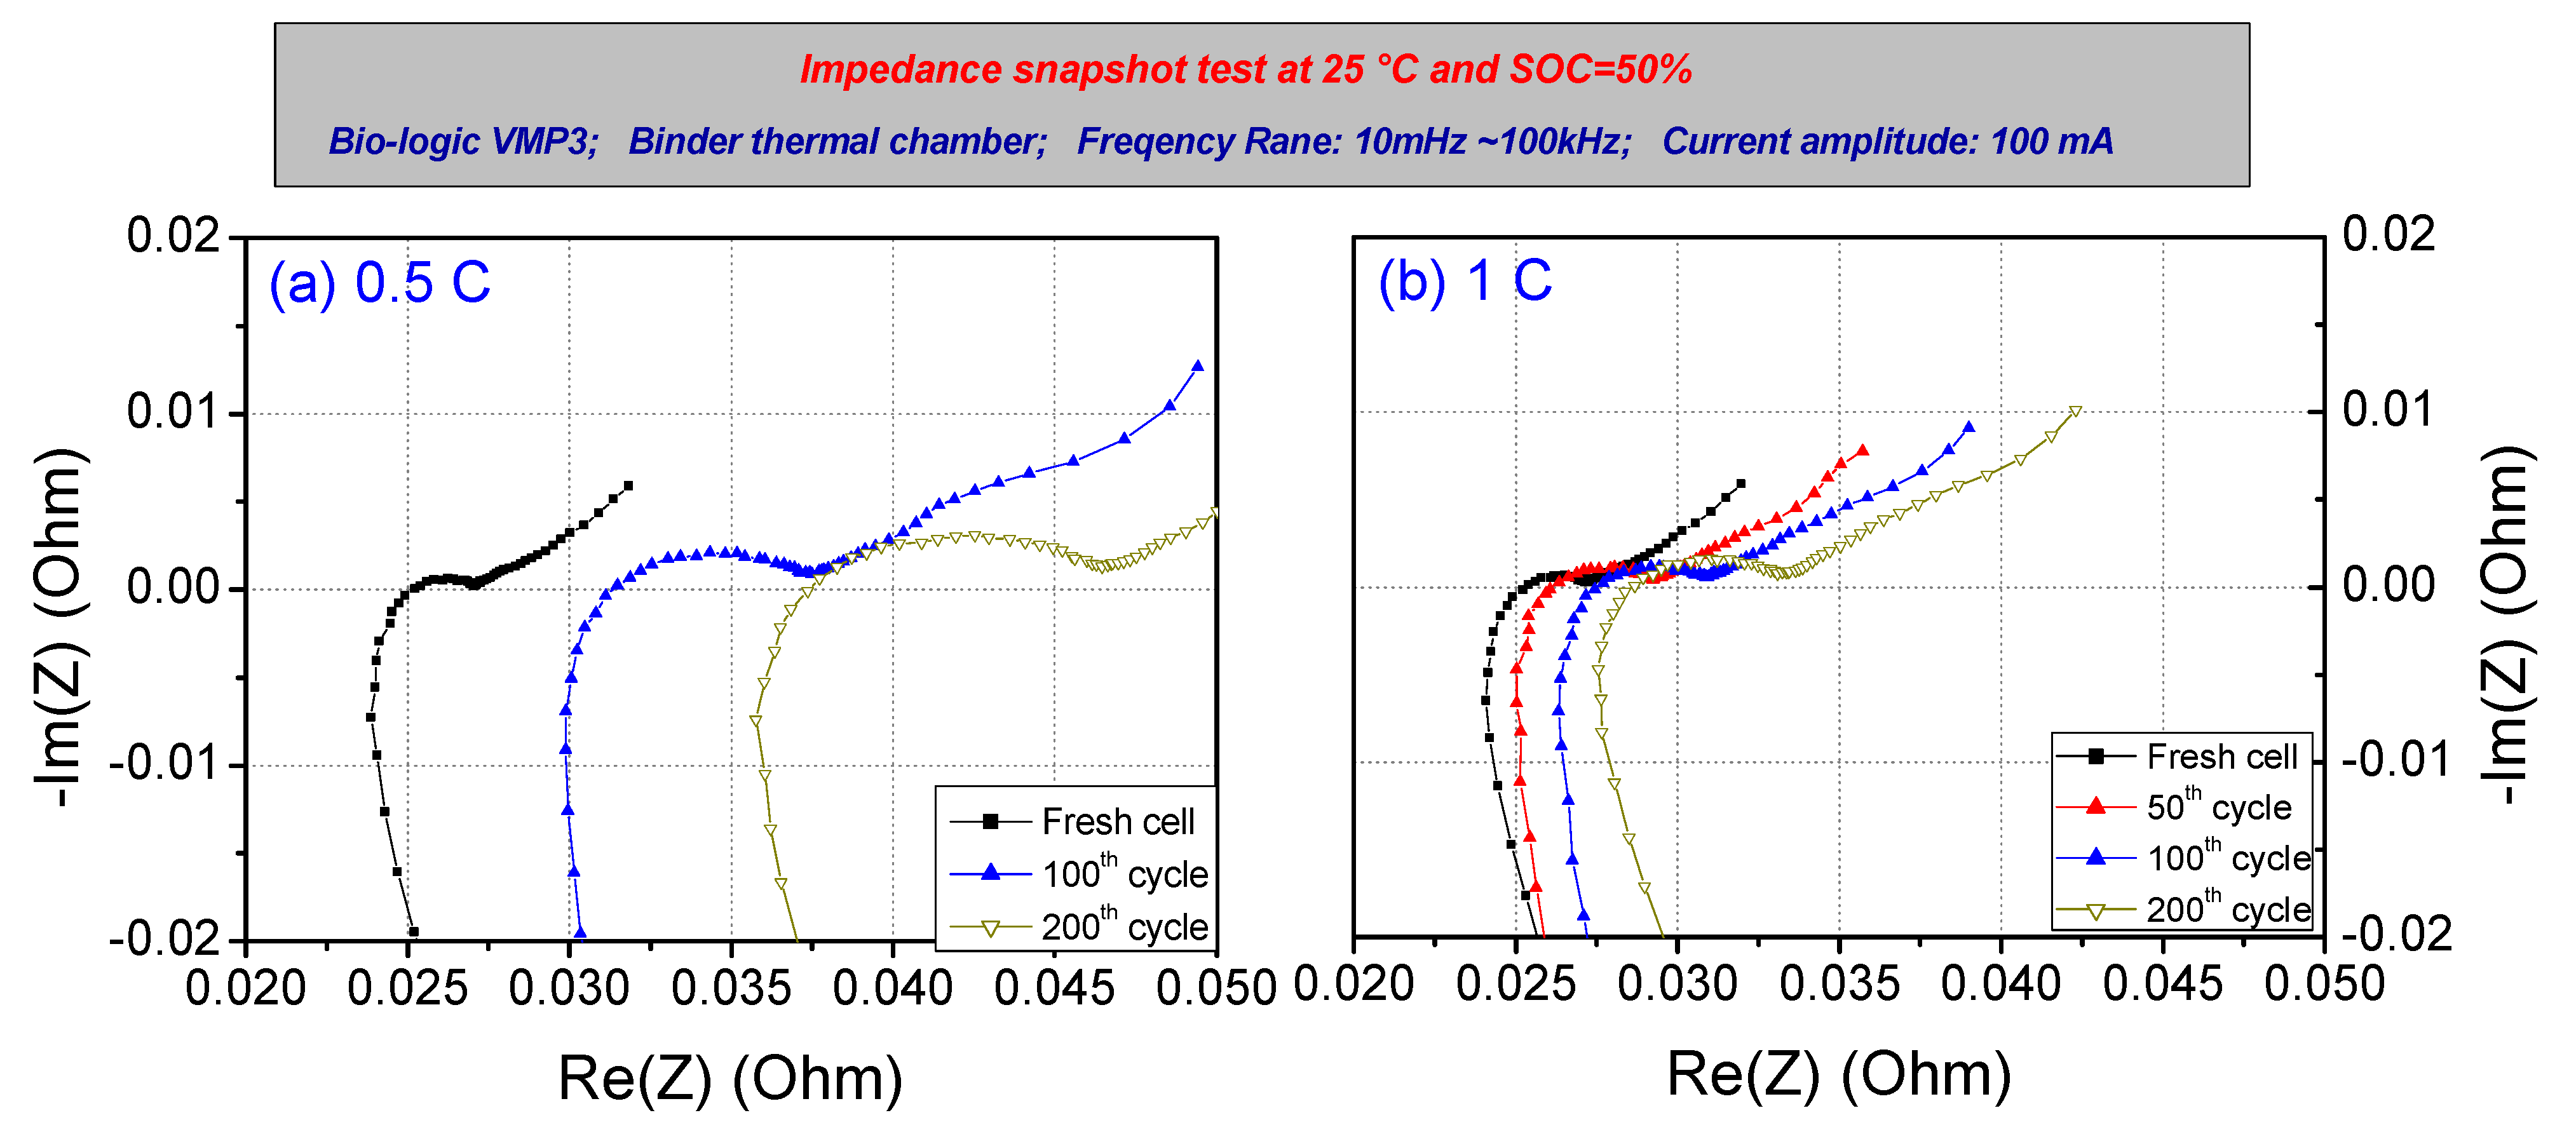
3.2. Impedance
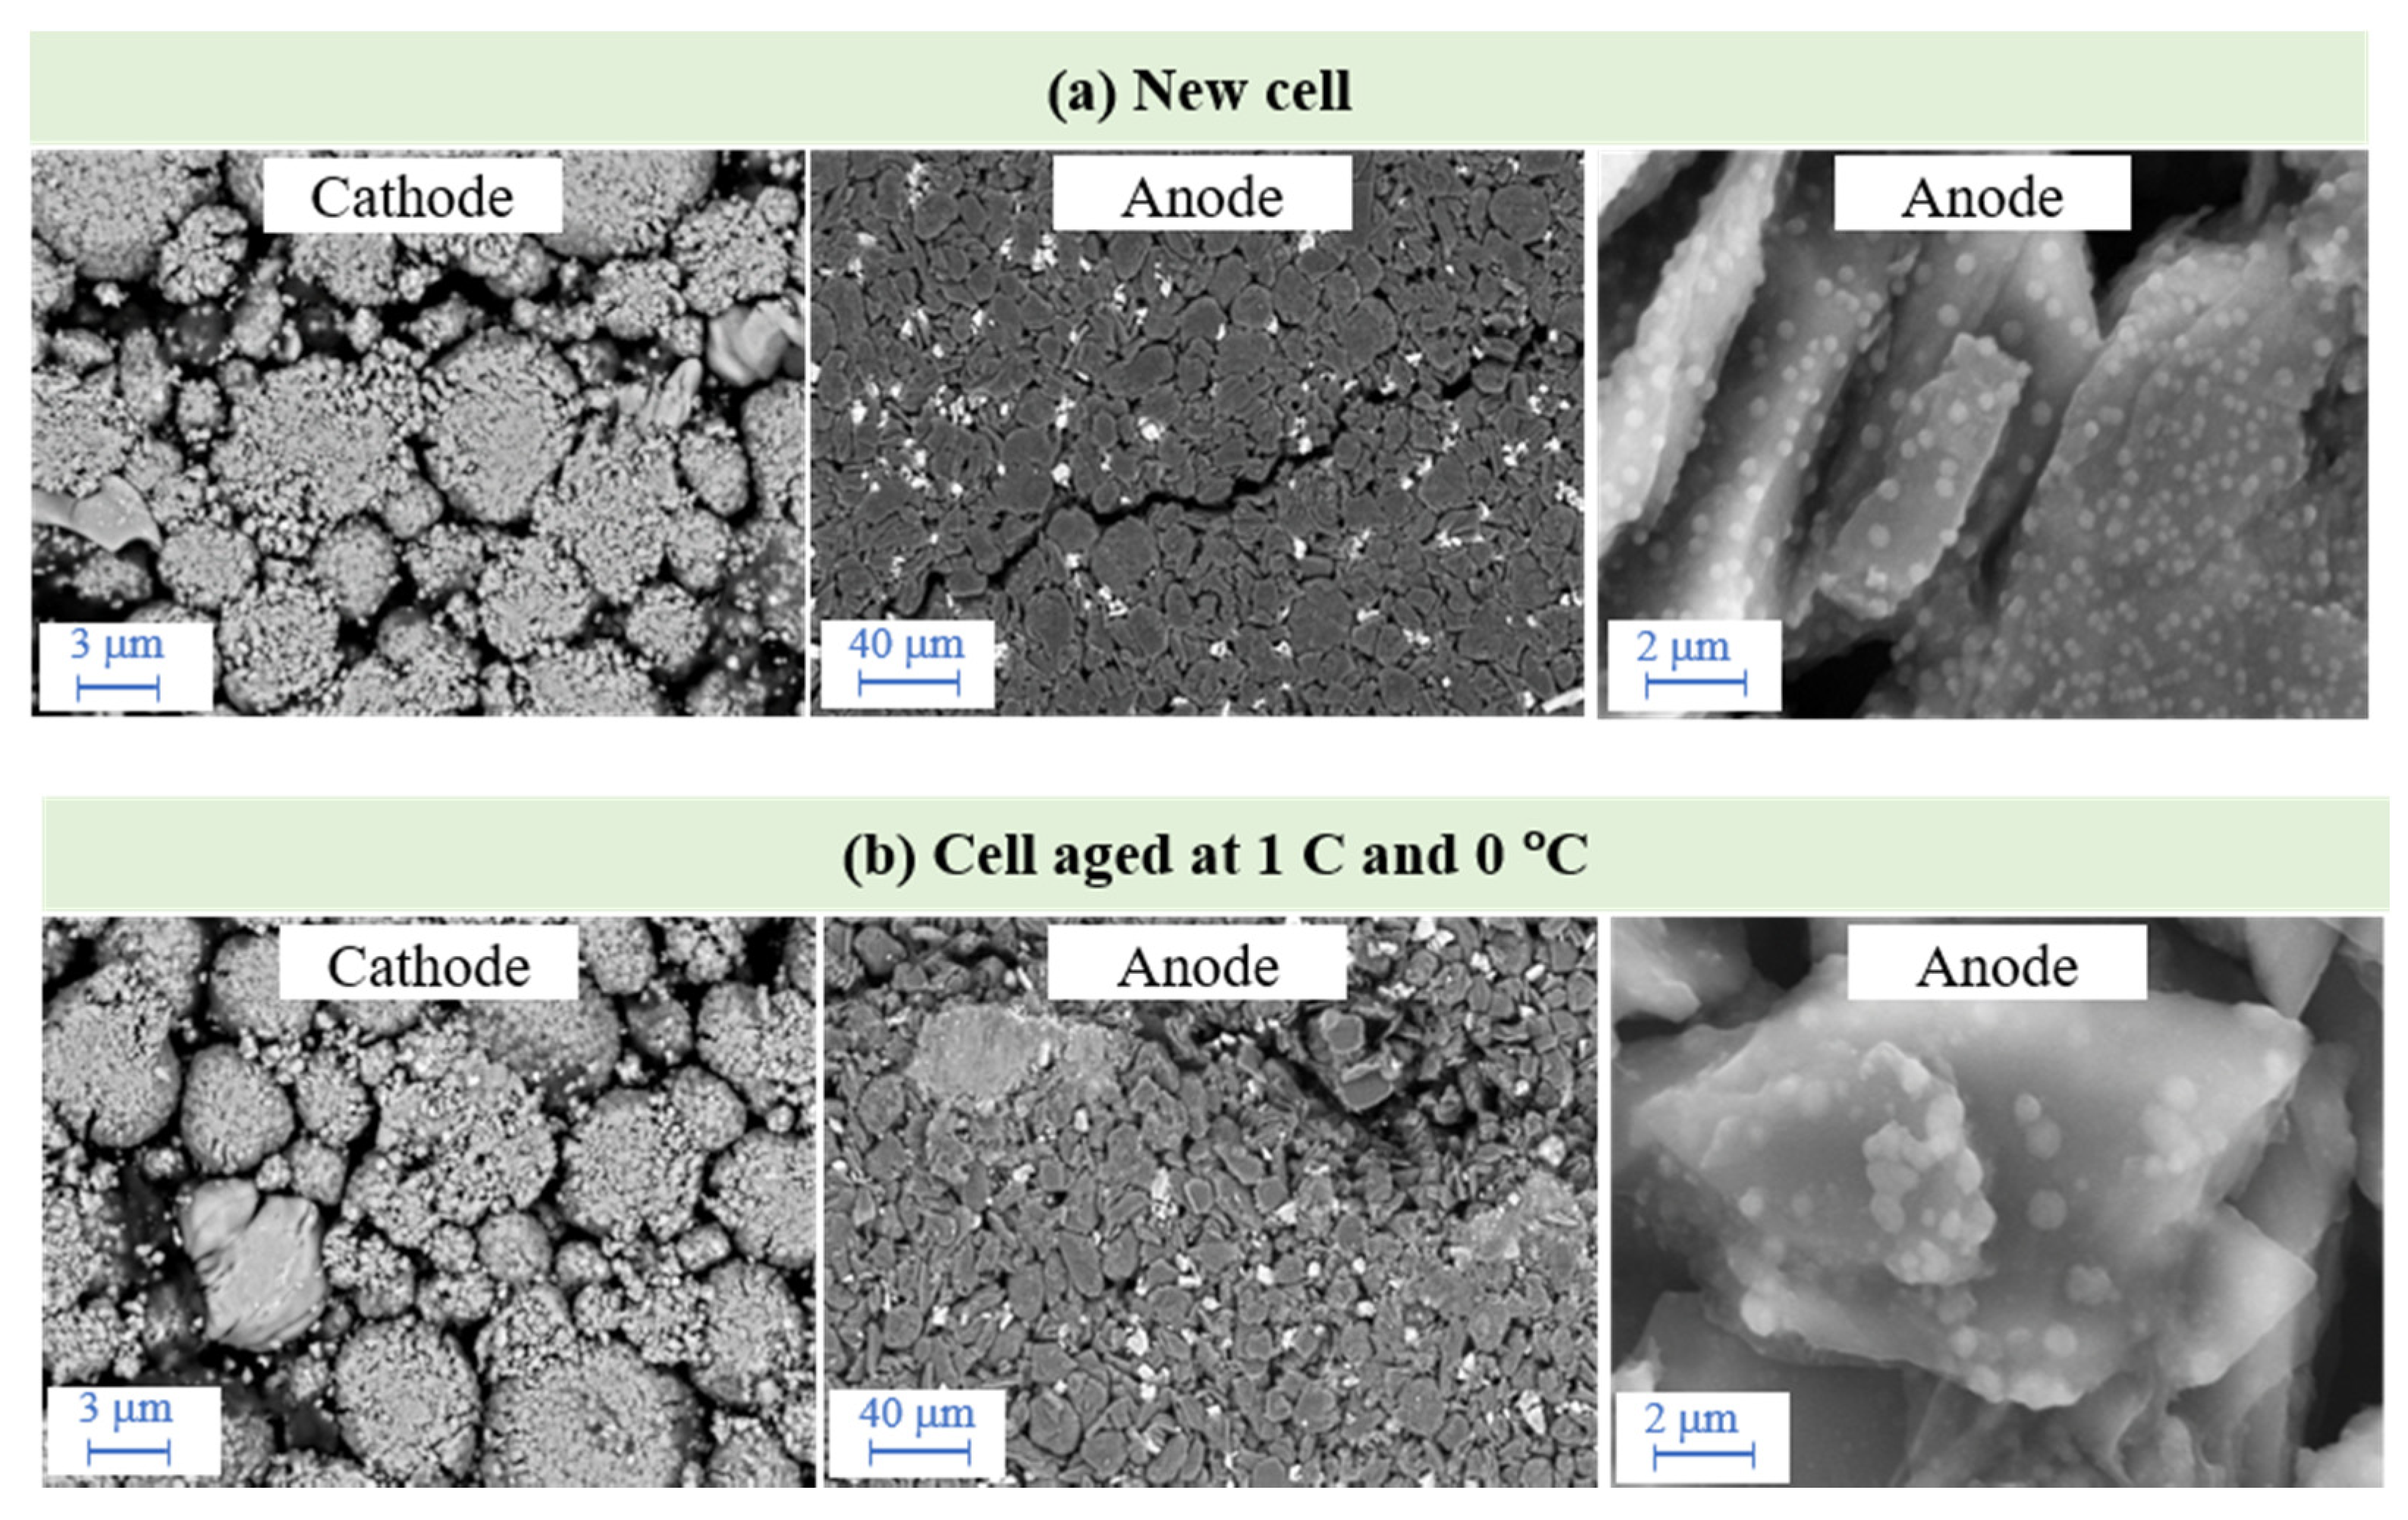
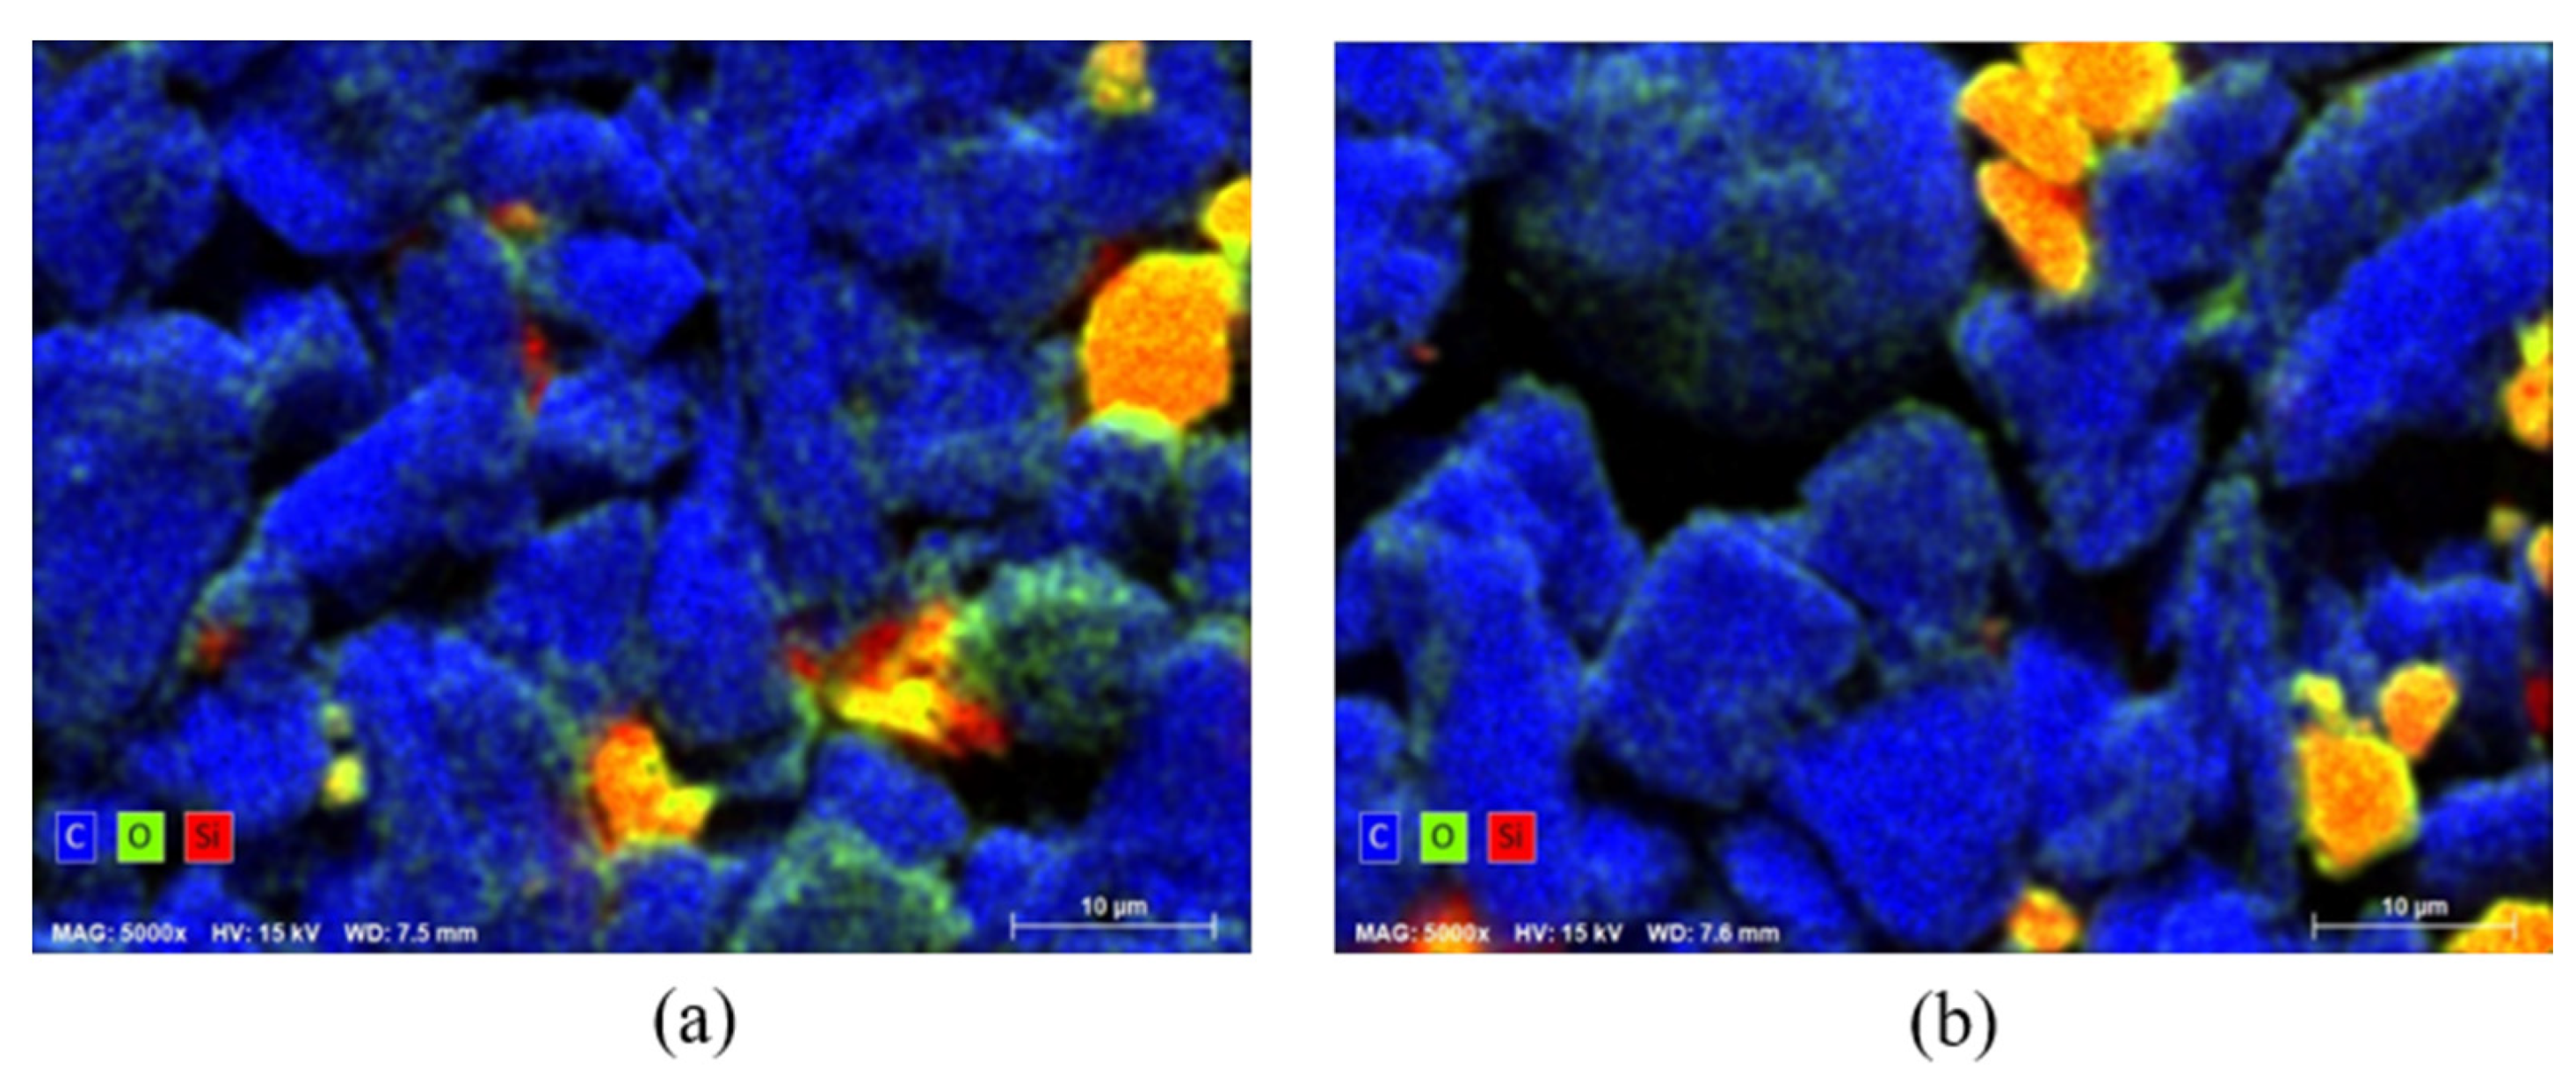
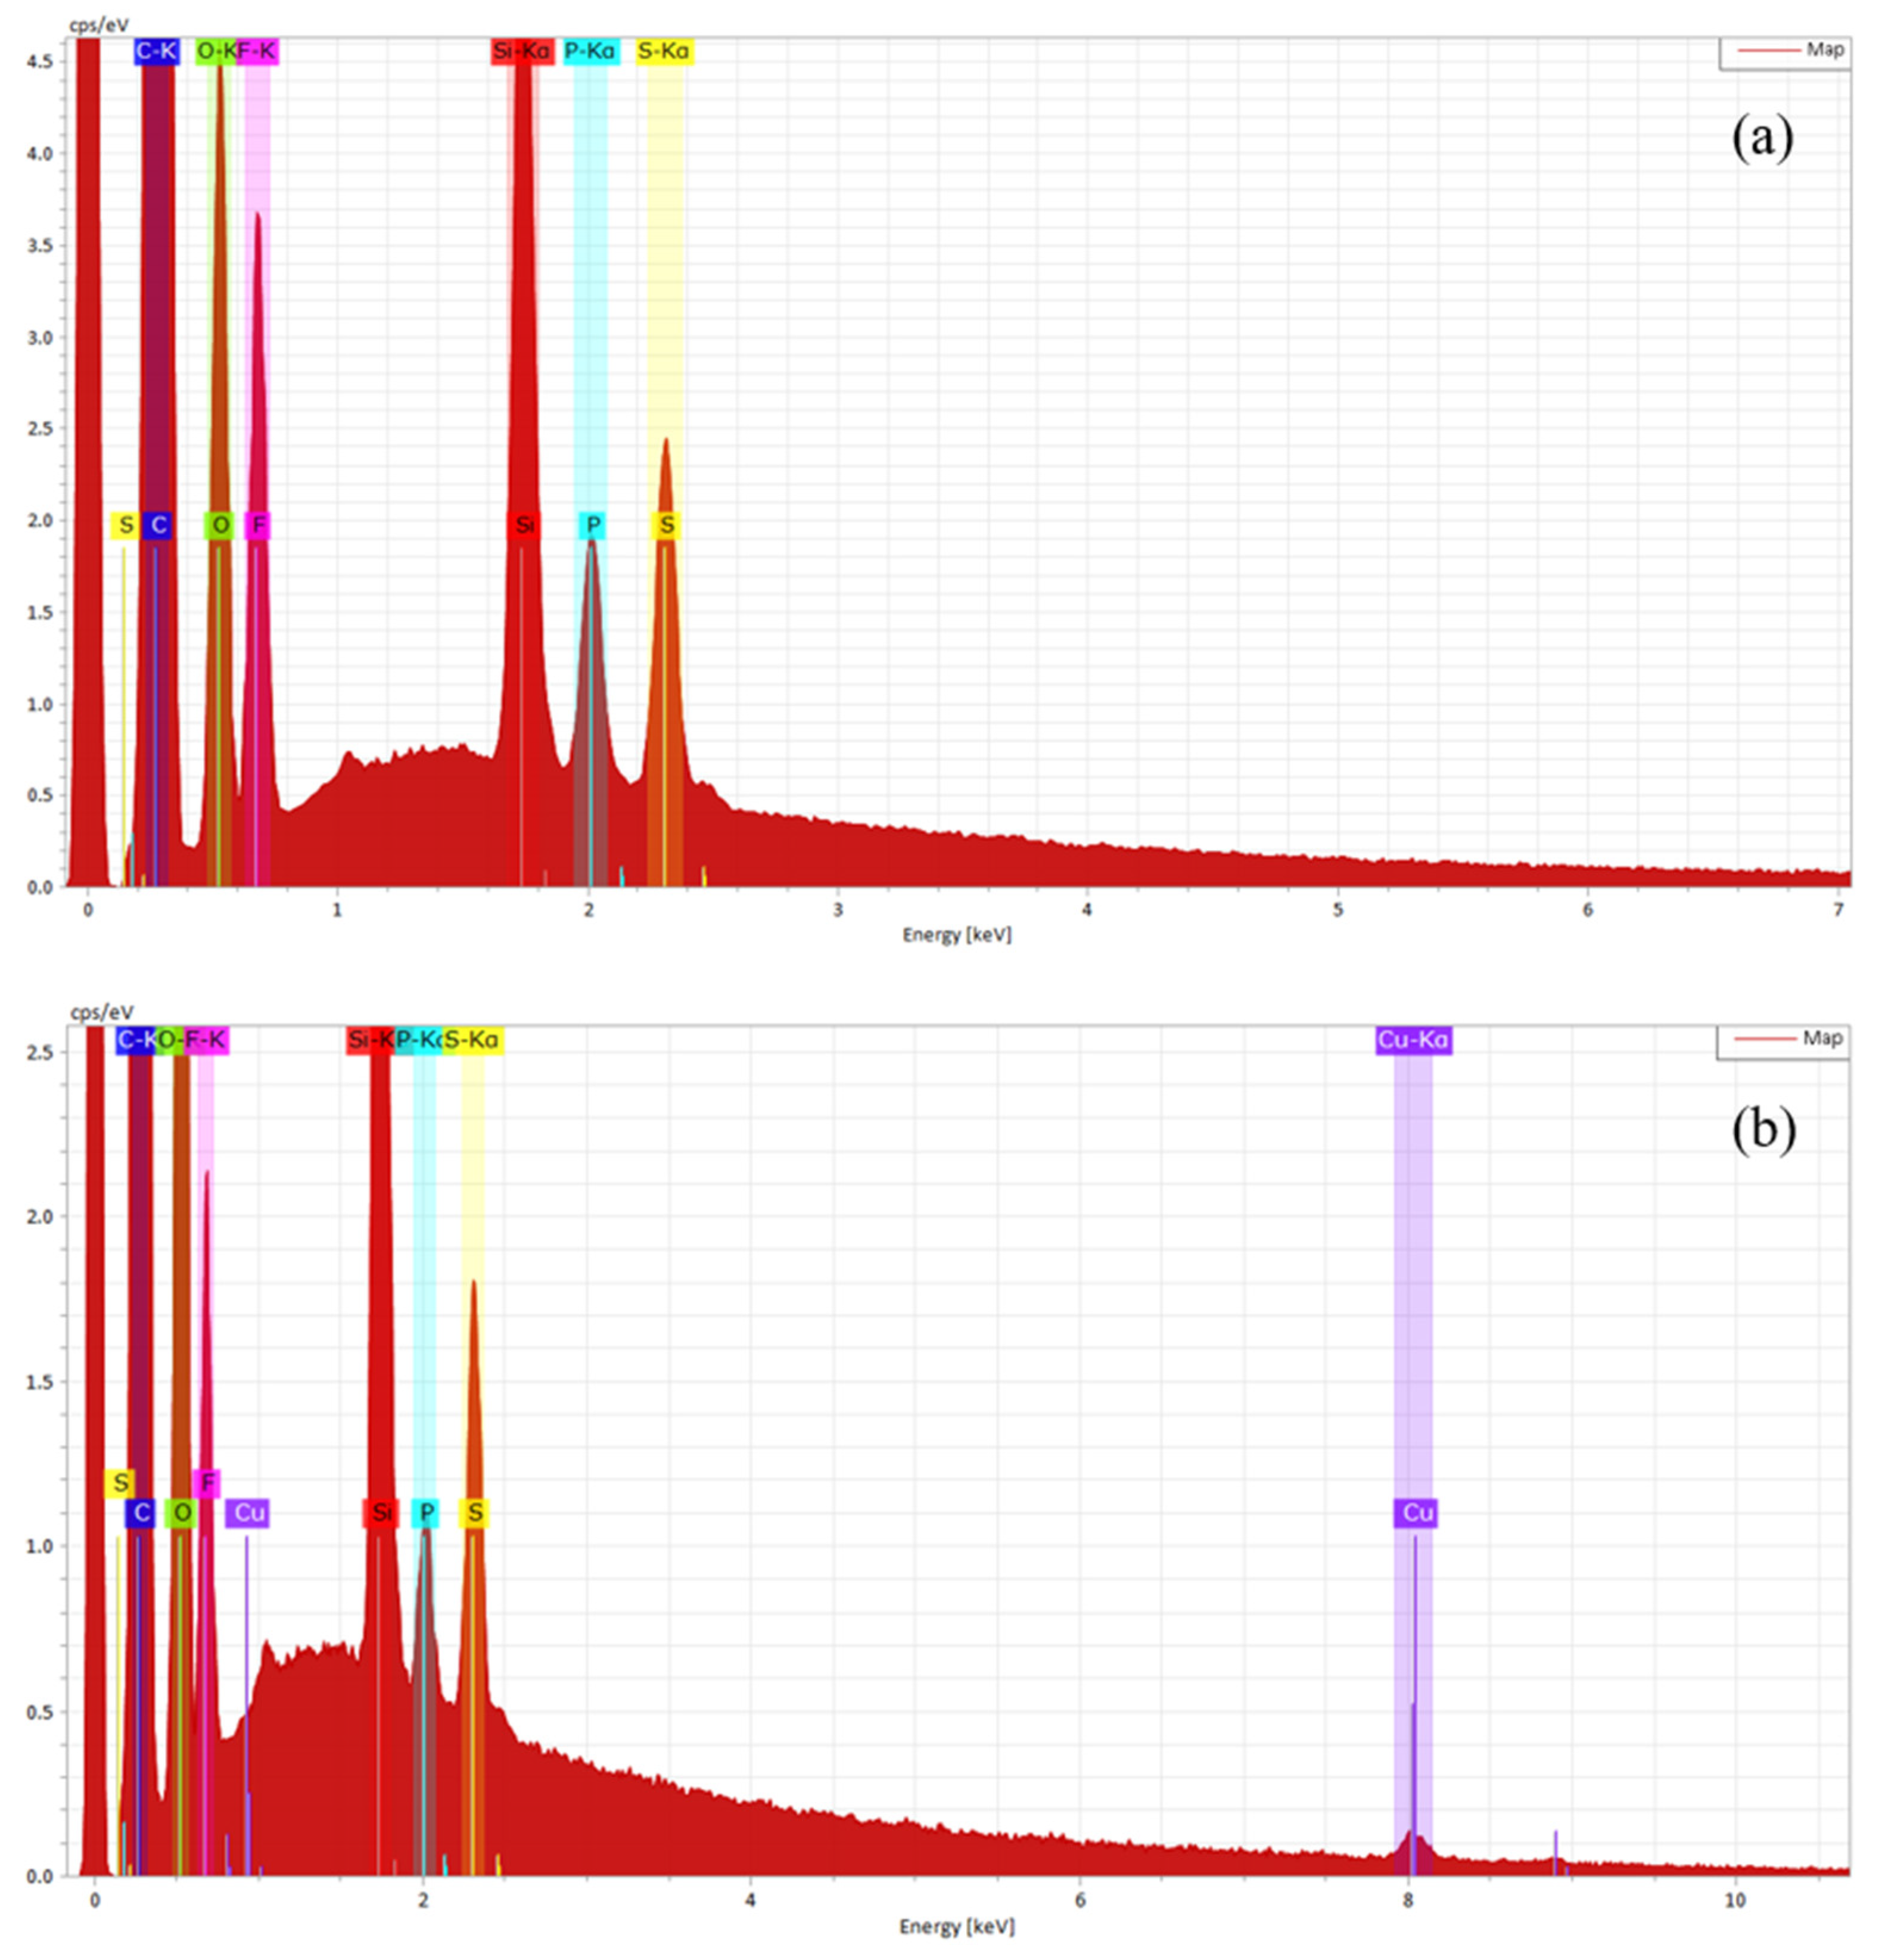
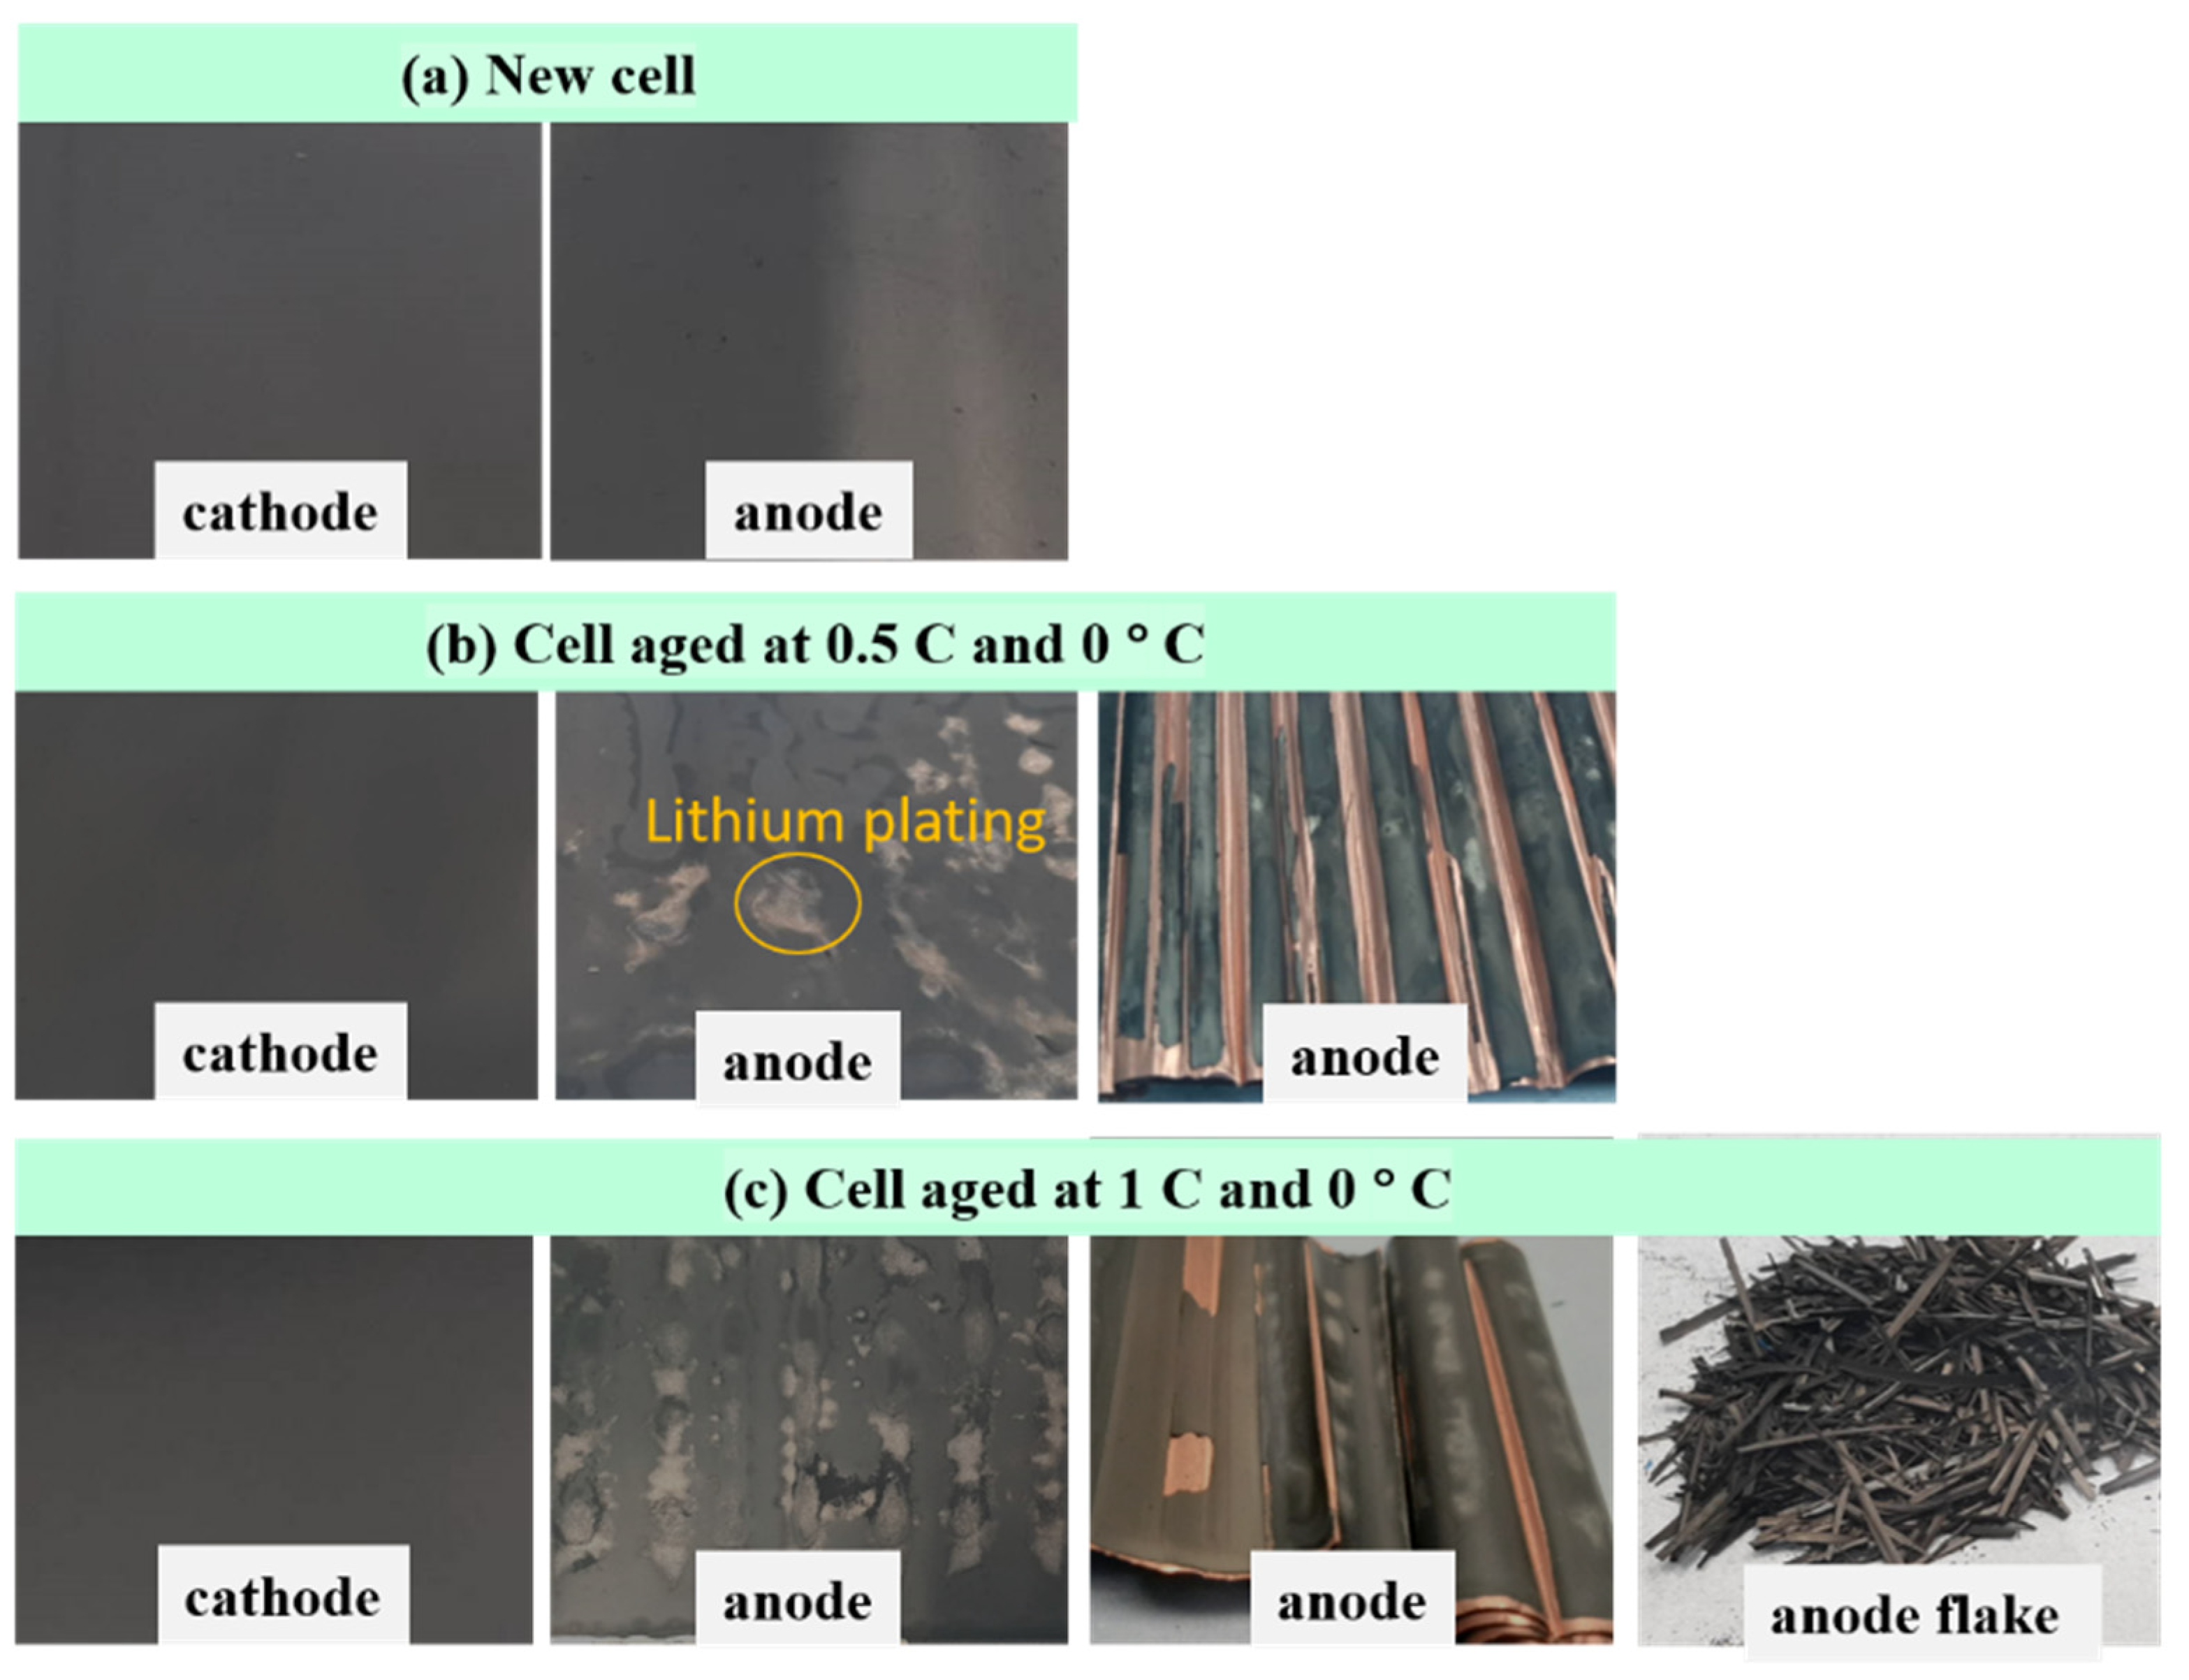
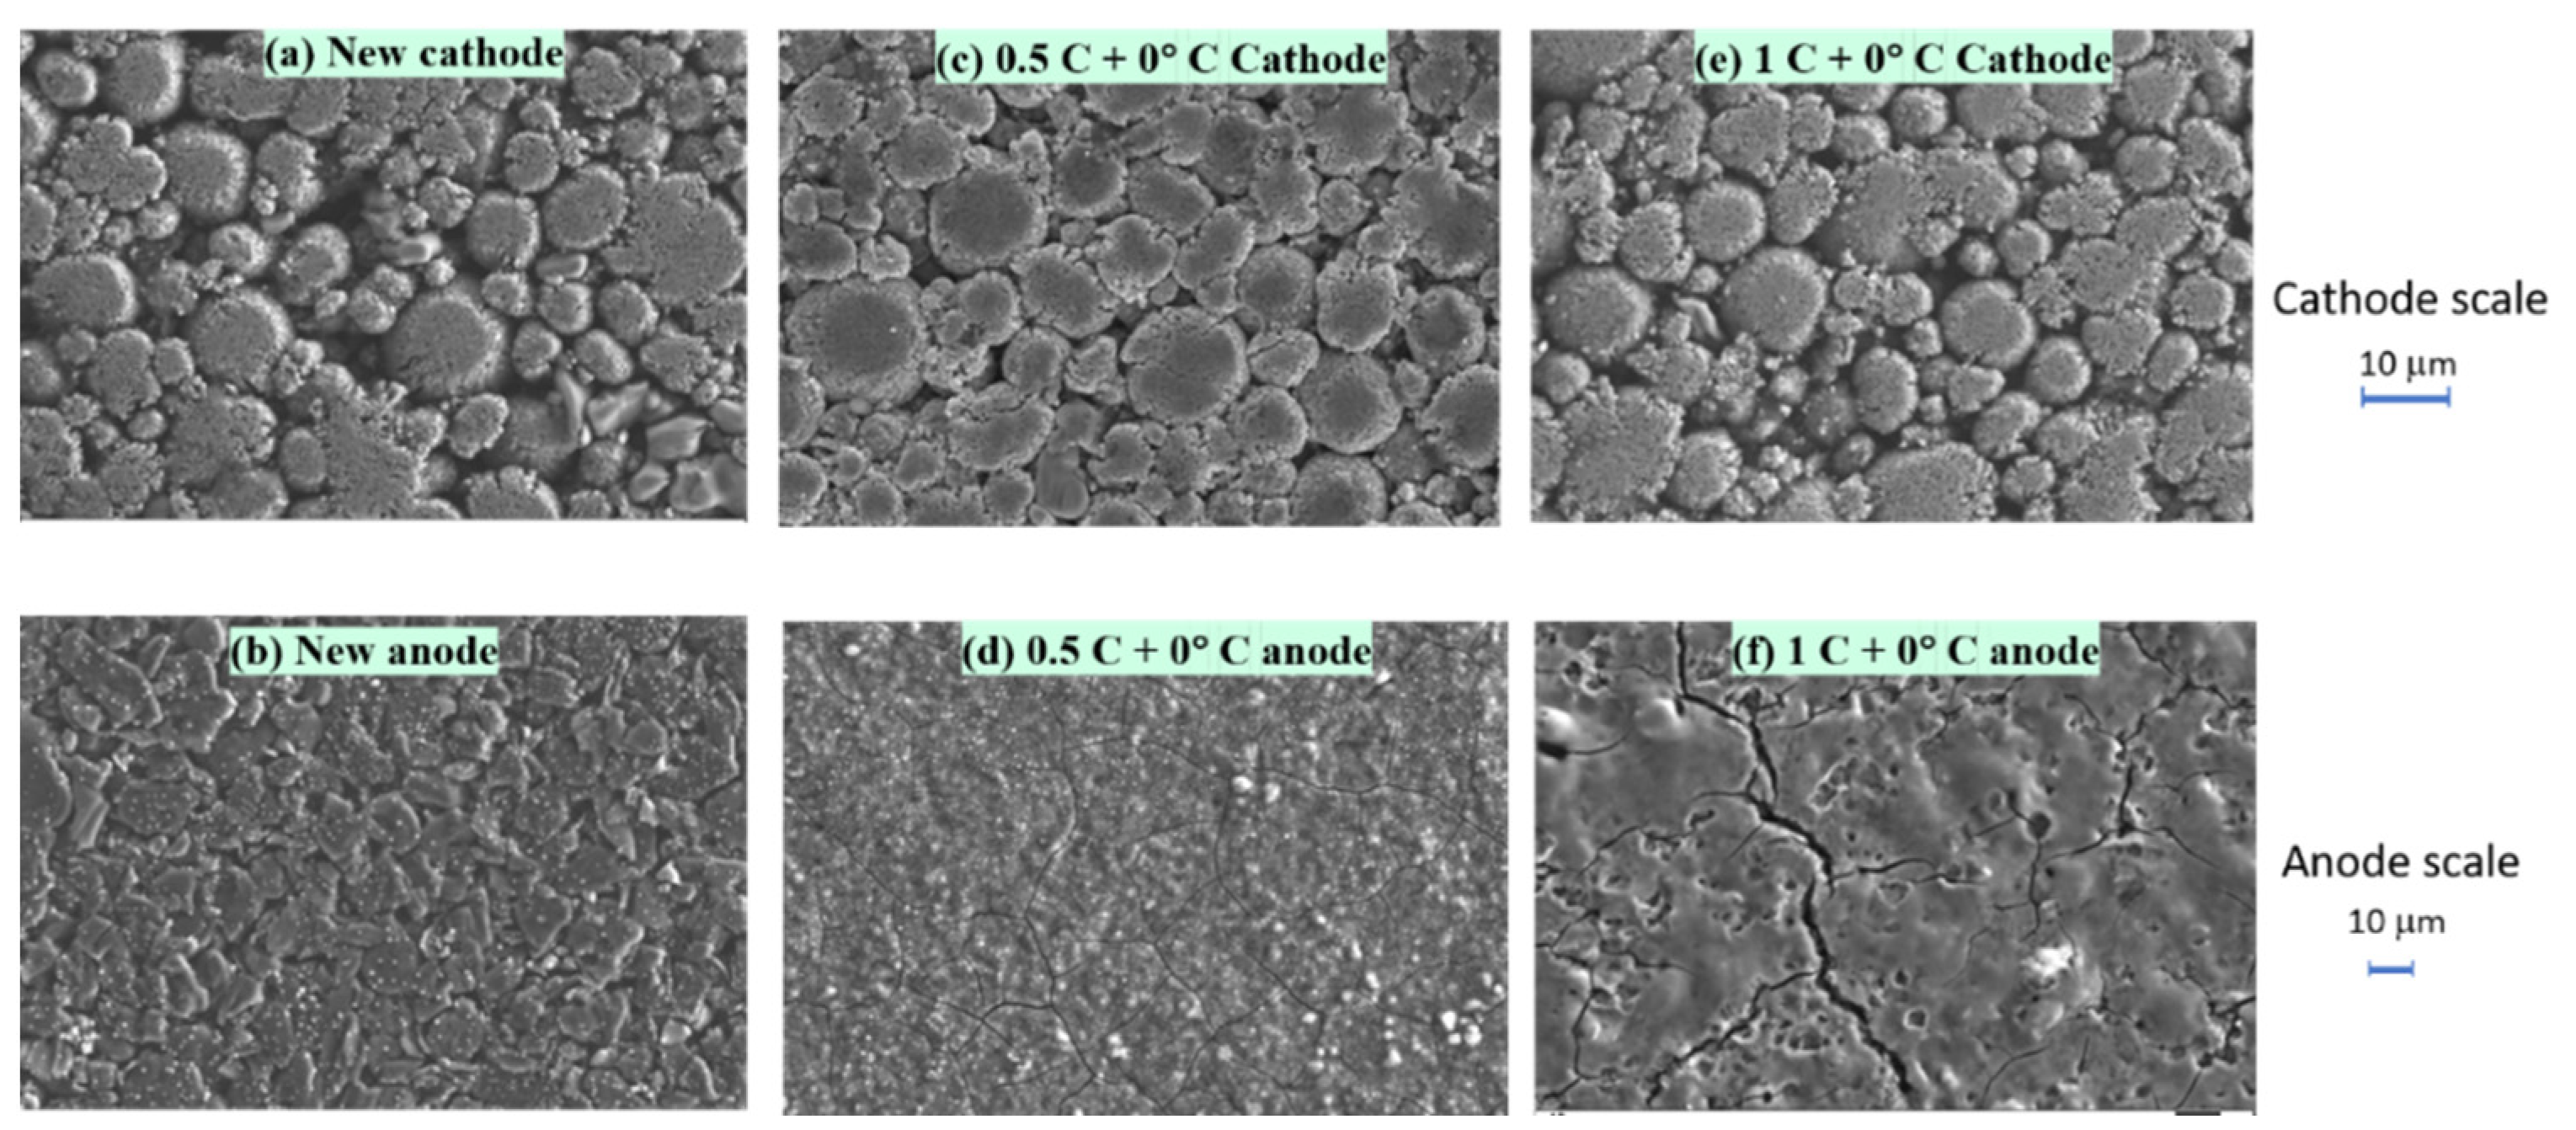
3.3. Electrodes Post-Mortem Inspection
4. Conclusions
- 1.
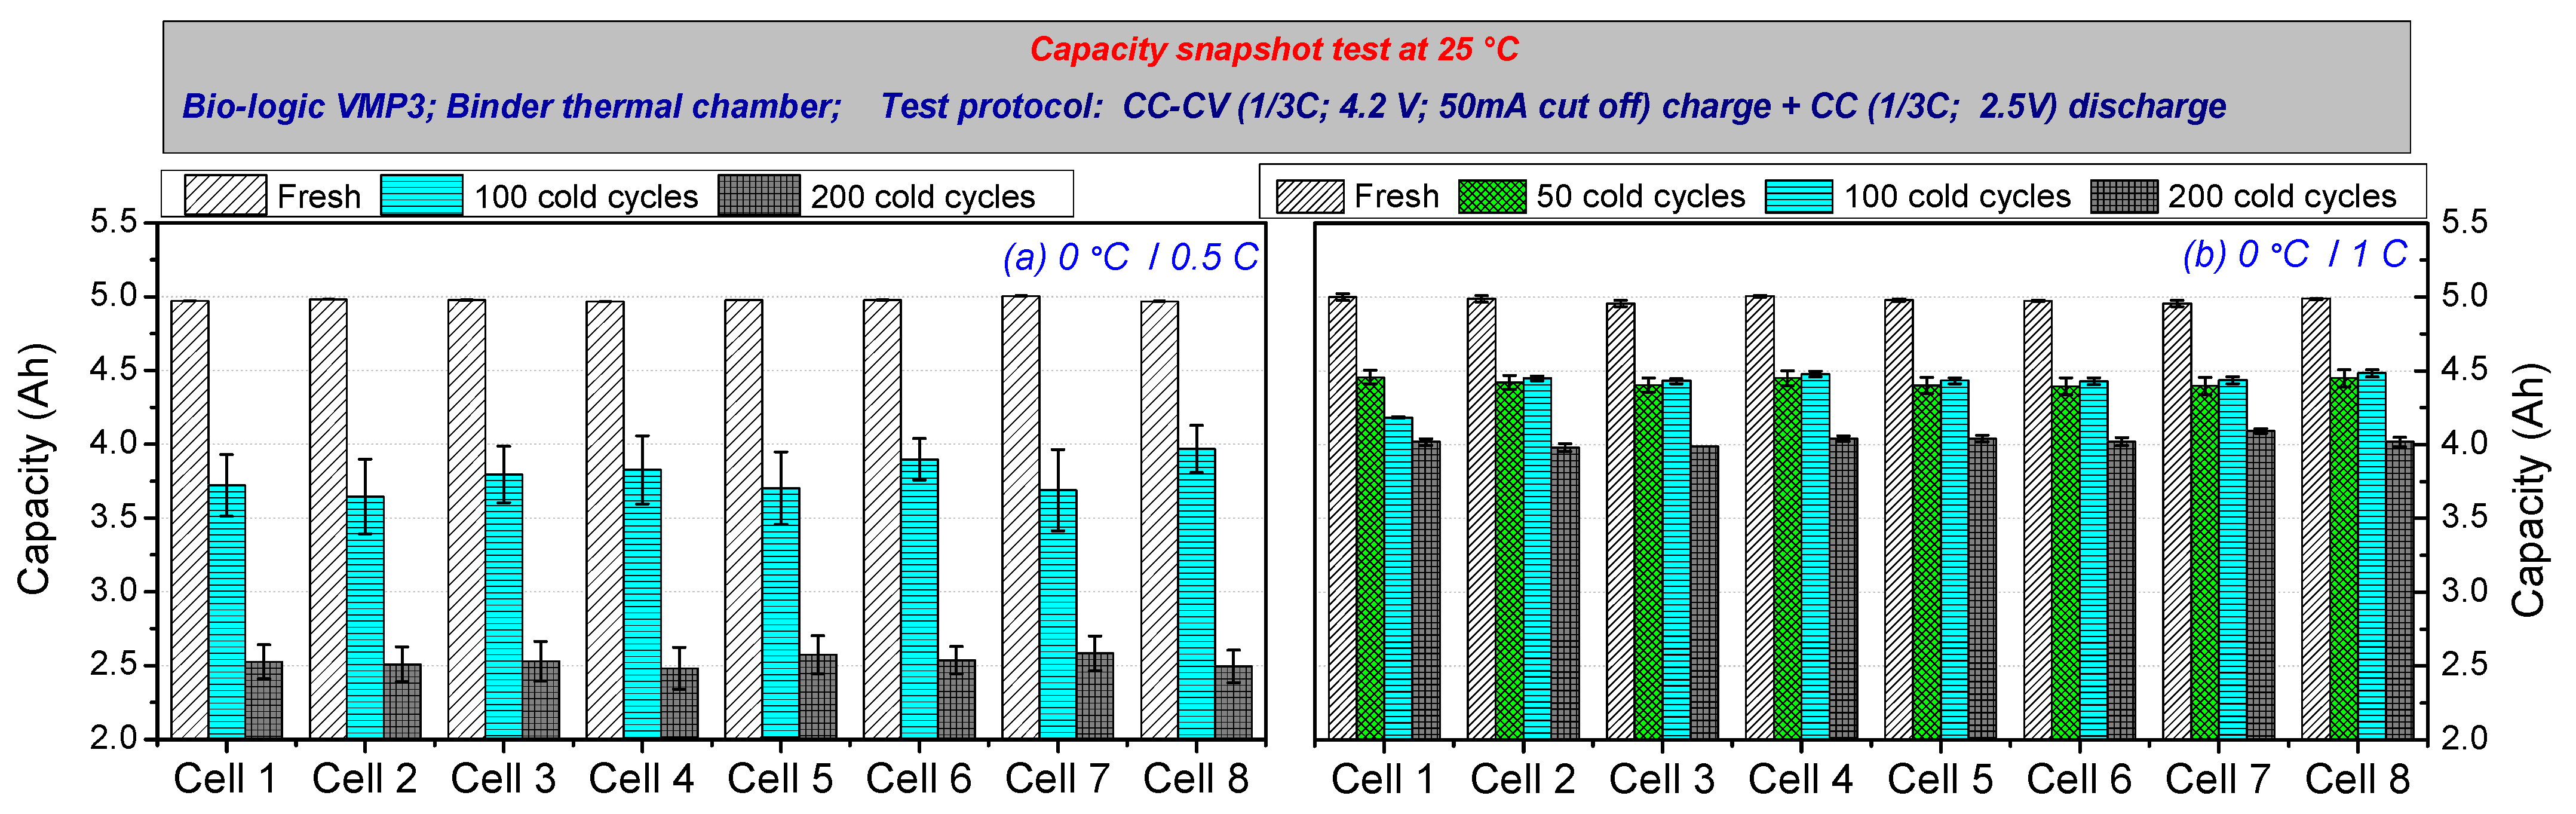
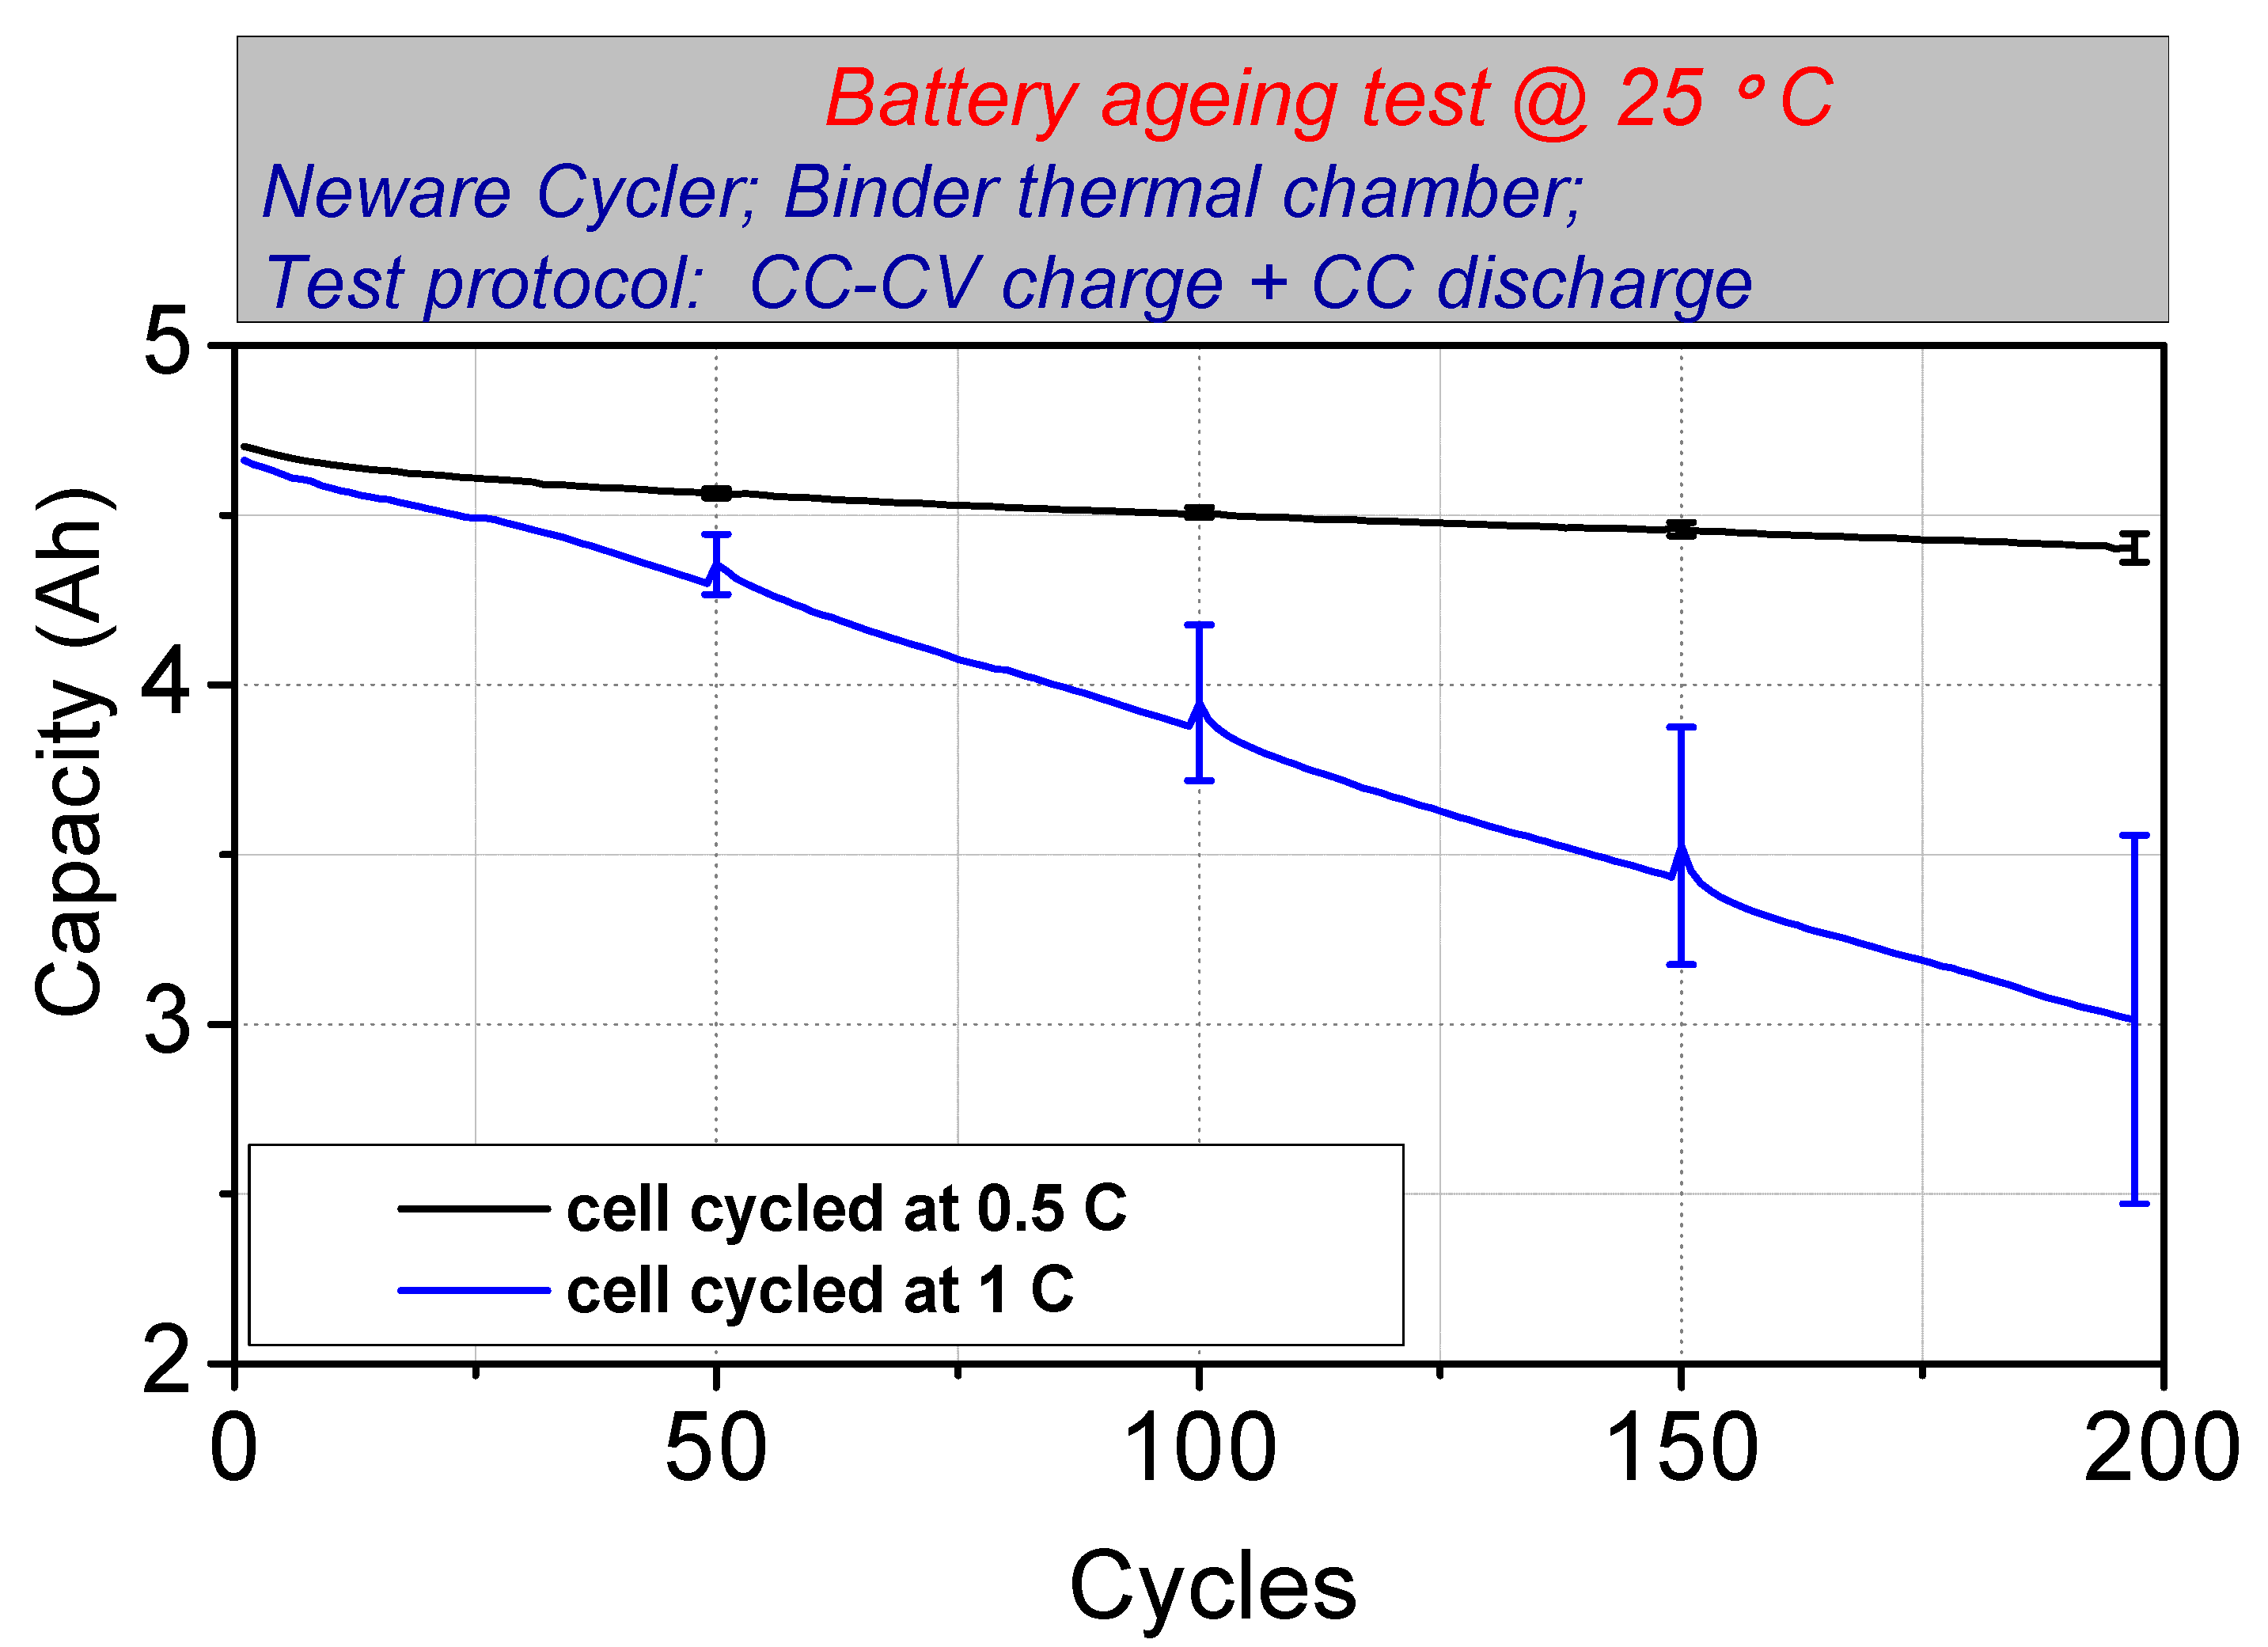
- After just 200 cycles at 0 °C, the NMC811 battery capacity was reduced by 20% (1 C) and 49% (0.5 C). The standard end-of-life state of 80% remaining capacity was reached after less than 100 cycles for cells cycled at 0 °C and 0.5 C. The reason behind the more significant capacity loss during 0.5 C cycling is due to the reduced cell self-heating.
- 2.
- Cell impedance increases during cold cycling, especially for cells cycled at 0.5 C. After 200 cyclings at 0 °C, the ohmic resistance increased from 25.1 to 37.4 mΩ and 28.6 mΩ for cells cycled at 0.5 and 1 C, respectively. Increased impedance further limits accessible cell capacity.
- 3.
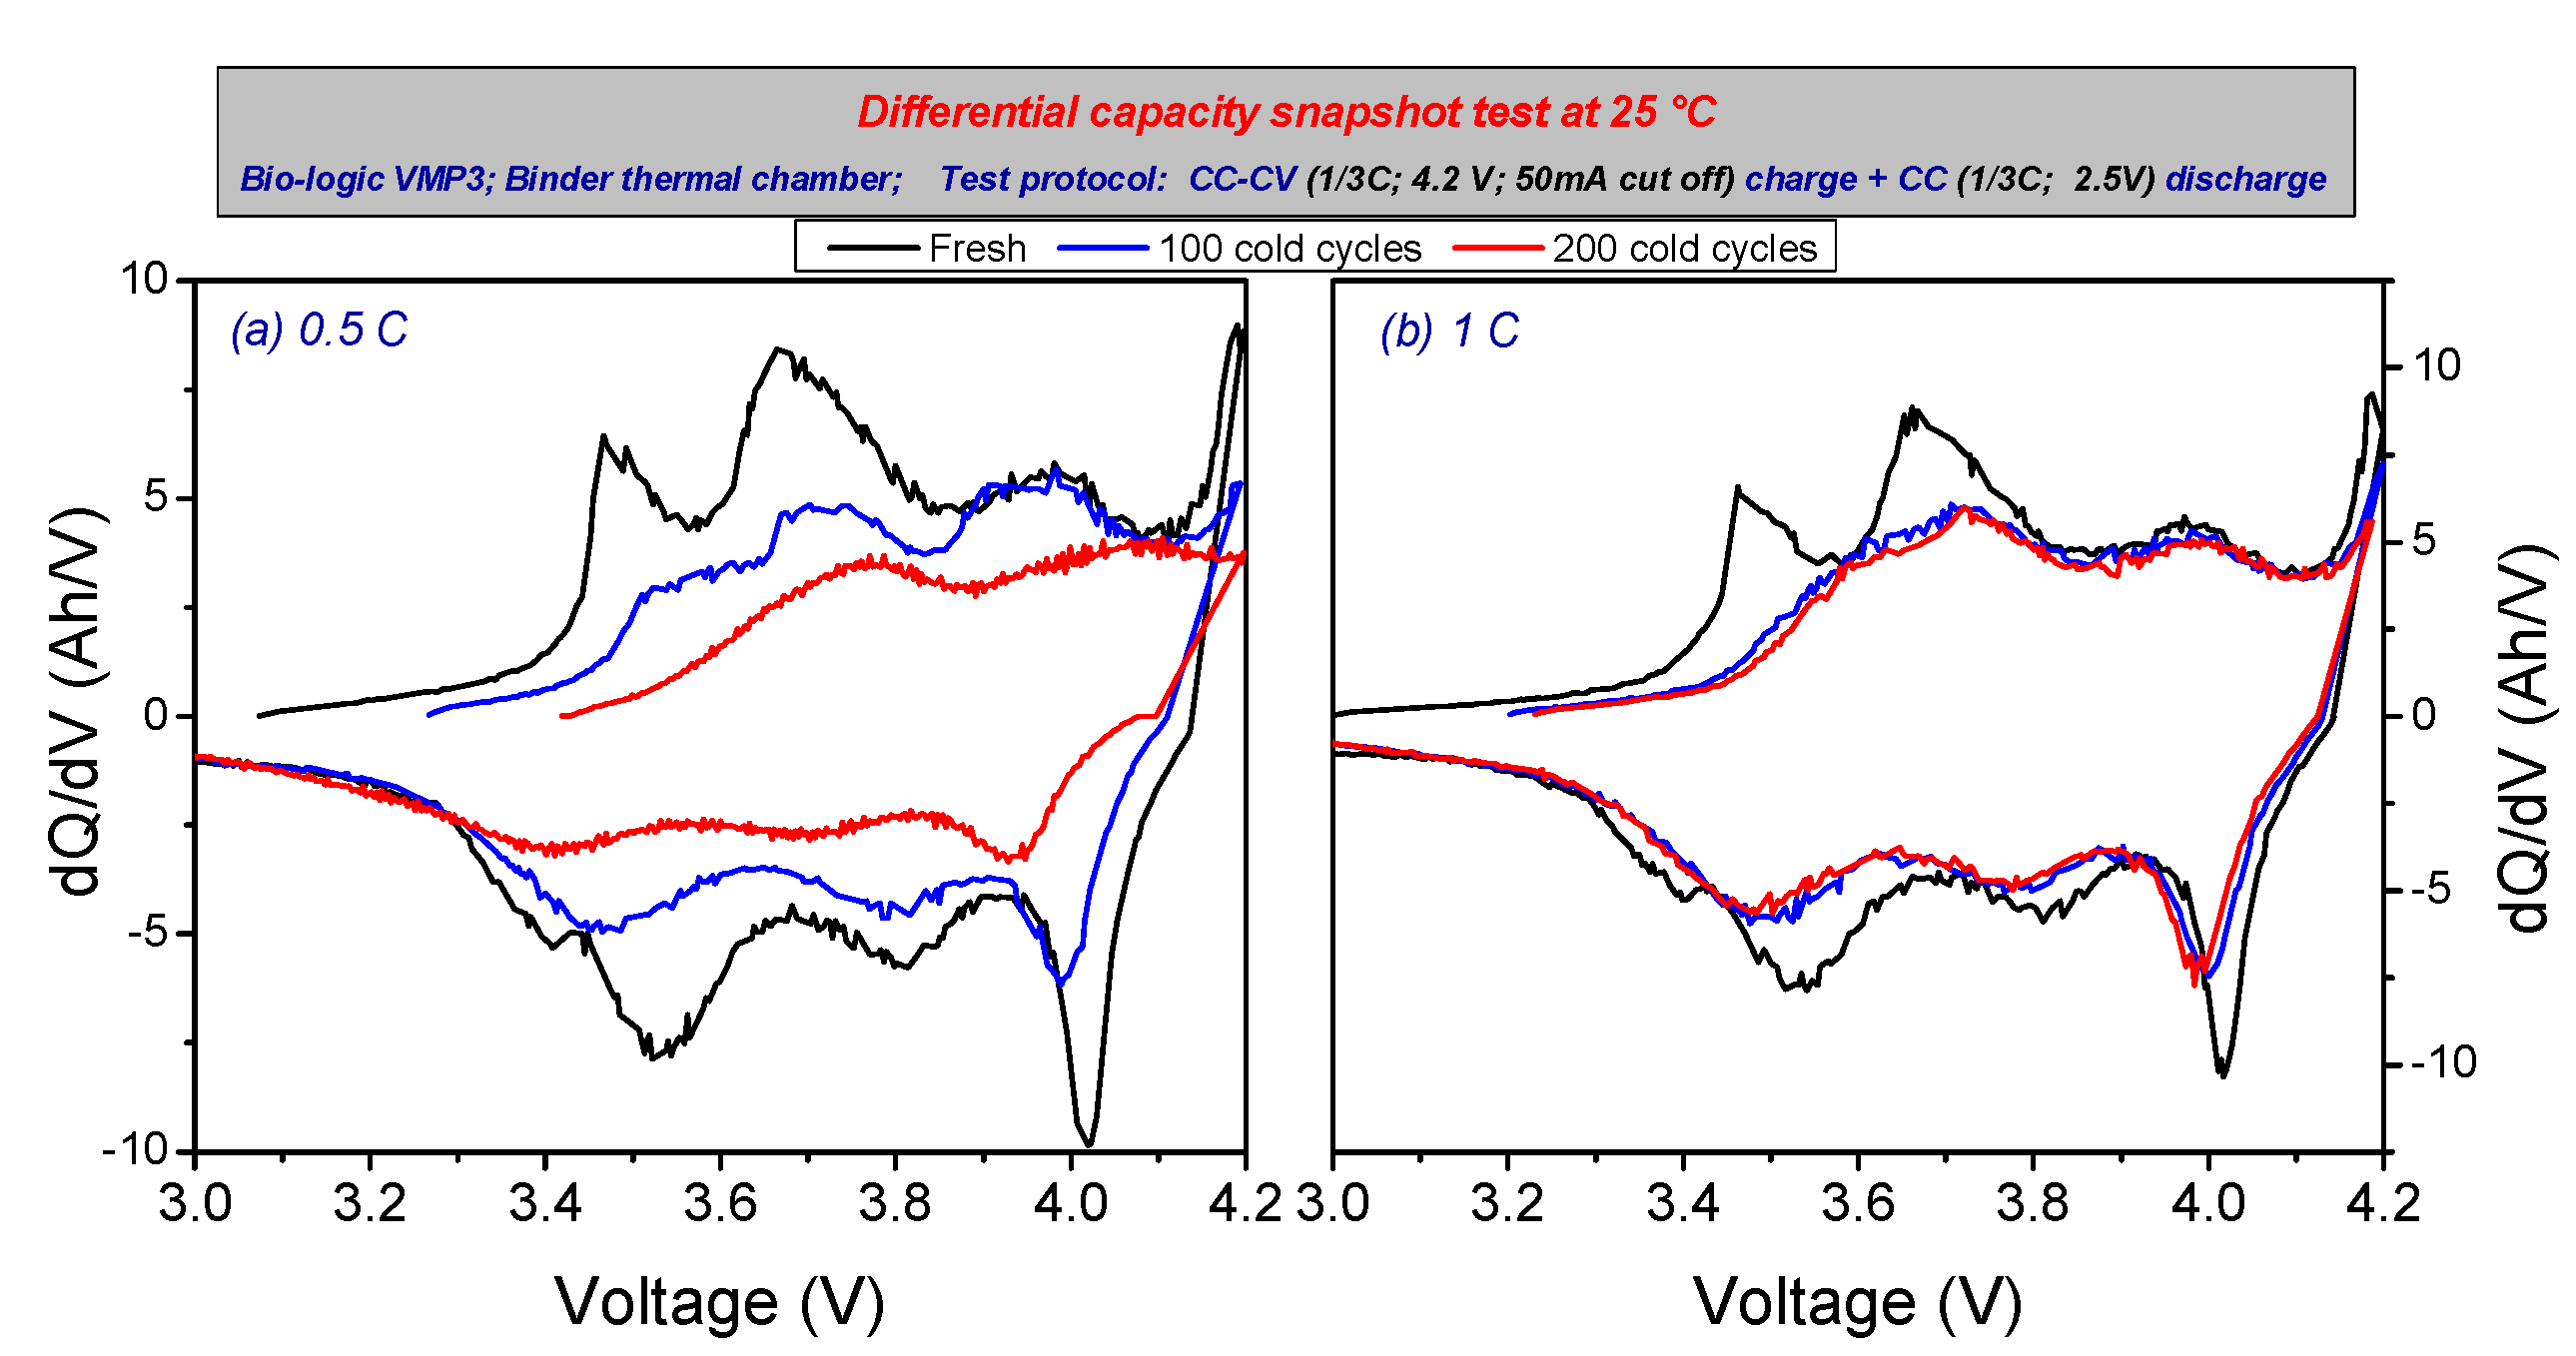
- The differential capacity peak curves fall significantly, and the peak position shift as the cell ages, which reflects the damage to the active material and its structure.
- 4.
- Cells that experienced cold ageing showed a noticeable negative impact on the anode, where active material became rigid and readily delaminated. Active material delamination is more obverse at the inner part of the jerry roll. SEM inspection confirmed significant anode cracking, leading to active materials and lithium inventory loss, and an increase in the negative electrode resistance. Lithium plating was also observed on the anode. Only minor cracks in cathode particles were observed.
Author Contributions
Funding
Institutional Review Board Statement
Informed Consent Statement
Data Availability Statement
Conflicts of Interest
Appendix A


References
- IEA, Global EV Outlook 2020. Available online: https://www.iea.org/reports/global-ev-outlook-2020 (accessed on 21 June 2021).
- Duffner, F.; Wentker, M.; Greenwood, M.; Leker, J. Battery cost modeling: A review and directions for future research. Renew. Sustain. Energy Rev. 2020, 127, 109872. [Google Scholar] [CrossRef]
- Fleming, J.; Amietszajew, T.; Charmet, J.; Roberts, A.J.; Greenwood, D.; Bhagat, R. The design and impact of in-situ and operando thermal sensing for smart energy storage. J. Energy Storage 2019, 22, 36–43. [Google Scholar] [CrossRef]
- Opitz, A.; Badami, P.; Shen, L.; Vignarooban, K.; Kannan, A.M. Can Li-Ion batteries be the panacea for automotive applications? Renew. Sustain. Energy Rev. 2017, 68, 685–692. [Google Scholar] [CrossRef] [Green Version]
- Budde-Meiwes, H.; Drillkens, J.; Lunz, B.; Muennix, J.; Rothgang, S.; Kowal, J.; Sauer, D.U. A review of current automotive battery technology and future prospects. Proc. Inst. Mech. Eng. Part D J. Automob. Eng. 2013, 227, 761–776. [Google Scholar] [CrossRef]
- Yuan, A.; Tang, H.; Liu, L.; Ying, J.; Tan, L.; Tan, L.; Sun, R. High performance of phosphorus and fluorine co-doped LiNi0.8Co0.1Mn0.1O2 as a cathode material for lithium ion batteries. J. Alloys Compd. 2020, 844, 156210. [Google Scholar] [CrossRef]
- Zhao, S.; Zhu, Y.; Qian, Y.; Wang, N.; Zhao, M.; Yao, J.; Xu, Y. Annealing effects of TiO2 coating on cycling performance of Ni-rich cathode material LiNi0.8Co0.1Mn0.1O2 for lithium-ion battery. Mater. Lett. 2020, 265, 127418. [Google Scholar] [CrossRef]
- Nanthagopal, M.; Santhoshkumar, P.; Shaji, N.; Sim, G.S.; Park, J.W.; Senthil, C.; Lee, C.W. An encapsulation of nitrogen and sulphur dual-doped carbon over Li[Ni0.8Co0.1Mn0.1]O2 for lithium-ion battery applications. Appl. Surf. Sci. 2020, 511, 145580. [Google Scholar] [CrossRef]
- Sun, H.; Wang, J.; Liu, Q.; Zhang, Y.; Zhang, D.; Wang, Q.; Li, Z.; Li, W.; Wang, B. Ag–Sn dual-modified LiNi0.8Co0.1Mn0.1O2 as cathode for lithium storage. J. Alloys Compd. 2021, 850, 156763. [Google Scholar] [CrossRef]
- Birkl, C.R.; Roberts, M.R.; McTurk, E.; Bruce, P.G.; Howey, D.A. Degradation diagnostics for lithium ion cells. J. Power Source 2017, 341, 373–386. [Google Scholar] [CrossRef]
- Xiong, R.; Pan, Y.; Shen, W.; Li, H.; Sun, F. Lithium-ion battery aging mechanisms and diagnosis method for automotive applications: Recent advances and perspectives. Renew. Sustain. Energy Rev. 2020, 131, 110048. [Google Scholar] [CrossRef]
- Petzl, M.; Kasper, M.; Danzer, M.A. Lithium plating in a commercial lithium-ion battery—A low-temperature aging study. J. Power Source 2015, 275, 799–807. [Google Scholar] [CrossRef]
- Waldmann, T.; Wilka, M.; Kasper, M.; Fleischhammer, M.; Wohlfahrt-Mehrens, M. Temperature dependent ageing mechanisms in Lithium-ion batteries—A Post-Mortem study. J. Power Source 2014, 262, 129–135. [Google Scholar] [CrossRef]
- Burow, D.; Sergeeva, K.; Calles, S.; Schorb, K.; Börger, A.; Roth, C.; Heitjans, P. Inhomogeneous degradation of graphite anodes in automotive lithium ion batteries under low-temperature pulse cycling conditions. J. Power Source 2016, 307, 806–814. [Google Scholar] [CrossRef]
- Ouyang, M.; Chu, Z.; Lu, L.; Li, J.; Han, X.; Feng, X.; Liu, G. Low temperature aging mechanism identification and lithium deposition in a large format lithium iron phosphate battery for different charge profiles. J. Power Source 2015, 286, 309–320. [Google Scholar] [CrossRef]
- Zhang, S.S.; Xu, K.; Jow, T.R. Electrochemical impedance study on the low temperature of Li-ion batteries. Electrochim. Acta. 2004, 49, 1057–1061. [Google Scholar] [CrossRef]
- Ma, S.; Jiang, M.; Tao, P.; Song, C.; Wu, J.; Wang, J.; Deng, T.; Shang, W. Temperature effect and thermal impact in lithium-ion batteries: A review. Prog. Nat. Sci. Mater. Int. 2018, 28, 653–666. [Google Scholar] [CrossRef]
- Jones, P.; Smart, M.C.; Krause, F.C.; Bugga, R.V. The Effect of Electrolyte Additives upon Lithium Plating during Low Temperature Charging of Graphite-LiNiCoAlO2 Lithium-Ion Three Electrode Cells. J. Electrochem. Soc. 2020, 167, 020536. [Google Scholar] [CrossRef] [Green Version]
- Koleti, U.R.; Rajan, A.; Tan, C.; Moharana, S.; Dinh, T.Q.; Marco, J. A Study on the Influence of Lithium Plating on Battery Degradation. Energies 2020, 13, 3458. [Google Scholar] [CrossRef]
- Koleti, U.R.; Zhang, C.; Malik, R.; Dinh, T.Q.; Marco, J. The development of optimal charging strategies for lithium-ion batteries to prevent the onset of lithium plating at low ambient temperatures. J. Energy Storage 2019, 24, 100798. [Google Scholar] [CrossRef]
- Downie, L.E.; Krause, L.J.; Burns, J.C.; Jensen, L.D.; Chevrier, V.L.; Dahn, J.R. In Situ Detection of Lithium Plating on Graphite Electrodes by Electrochemical Calorimetry. J. Electrochem. Soc. 2013, 160, A588–A594. [Google Scholar] [CrossRef]
- Reichert, M.; Andre, D.; Rösmann, A.; Janssen, P.; Bremes, H.G.; Sauer, D.U.; Passerini, S.; Winter, M. Influence of relaxation time on the lifetime of commercial lithium-ion cells. J. Power Source 2013, 239, 45–53. [Google Scholar] [CrossRef]
- Vetter, J.; Novák, P.; Wagner, M.R.; Veit, C.; Möller, K.C.; Besenhard, J.O.; Winter, M.; Wohlfahrt-Mehrens, M.; Vogler, C.; Hammouche, A. Ageing mechanisms in lithium-ion batteries. J. Power Source 2005, 147, 269–281. [Google Scholar] [CrossRef]
- Duong, T.Q. USABC and PNGV test procedures. J. Power Source 2000, 89, 244–248. [Google Scholar] [CrossRef]
- Panasonic, Lithium-Ion Battery UR18650E Data Sheet. 2014. Available online: https://voltaplex.com/media/whitepapers/specification-sheet/Sanyo_E_Specification_Sheet.pdf (accessed on 5 May 2021).
- Baumhöfer, T.; Brühl, M.; Rothgang, S.; Sauer, D.U. Production caused variation in capacity aging trend and correlation to initial cell performance. J. Power Source 2014, 247, 332–338. [Google Scholar] [CrossRef]
- Popp, H.; Attia, J. Lifetime analysis of four different lithium ion batteries for plug-in electric vehicle. In Proceedings of the Transport Research Arena (TRA) 5th Conference: Transport Solutions from Research to Deployment, Paris, France, 14–17 April 2014. [Google Scholar]
- Leng, Y.; Ge, S.; Marple, D.; Yang, X.-G.; Bauer, C.; Lamp, P.; Wang, C.-Y. Electrochemical Cycle-Life Characterization of High Energy Lithium-Ion Cells with Thick Li(Ni0.6Mn0.2Co0.2)O2 and Graphite Electrodes. J. Electrochem. Soc. 2017, 164, A1037–A1049. [Google Scholar] [CrossRef] [Green Version]
- Klein, S.; Bärmann, P.; Beuse, T.; Borzutzki, K.; Frerichs, J.E.; Kasnatscheew, J.; Winter, M.; Placke, T. Exploiting the Degradation Mechanism of NCM523Graphite Lithium-Ion Full Cells Operated at High Voltage. ChemSusChem 2021, 14, 595–613. [Google Scholar] [CrossRef]
- Li, J.; Harlow, J.; Stakheiko, N.; Zhang, N.; Paulsen, J.; Dahn, J. Dependence of Cell Failure on Cut-Off Voltage Ranges and Observation of Kinetic Hindrance in LiNi0.8Co0.15Al0.05O2. J. Electrochem. Soc. 2018, 165, A2682–A2695. [Google Scholar] [CrossRef]
- Liu, J.; Duan, Q.; Chen, H.; Sun, J.; Wang, Q. An optimal multistage charge strategy for commercial lithium ion batteries. Sustain. Energy Fuels 2018, 2, 1726–1736. [Google Scholar] [CrossRef]
- Lin, H.-P.; Chua, D.; Salomon, M.; Shiao, H.-C.; Hendrickson, M.; Plichta, E.; Slane, S. Low-temperature behavior of Li-ion cells. Electrochem. Solid-State Lett. 2001, 4, A71–A73. [Google Scholar] [CrossRef]


Publisher’s Note: MDPI stays neutral with regard to jurisdictional claims in published maps and institutional affiliations. |
© 2021 by the authors. Licensee MDPI, Basel, Switzerland. This article is an open access article distributed under the terms and conditions of the Creative Commons Attribution (CC BY) license (https://creativecommons.org/licenses/by/4.0/).
Share and Cite
Wang, C.; Amietszajew, T.; Carvajal, R.; Guo, Y.; Ahmed, Z.; Zhang, C.; Goodlet, G.; Bhagat, R. Cold Ageing of NMC811 Lithium-ion Batteries. Energies 2021, 14, 4724. https://doi.org/10.3390/en14164724
Wang C, Amietszajew T, Carvajal R, Guo Y, Ahmed Z, Zhang C, Goodlet G, Bhagat R. Cold Ageing of NMC811 Lithium-ion Batteries. Energies. 2021; 14(16):4724. https://doi.org/10.3390/en14164724
Chicago/Turabian StyleWang, Chongming, Tazdin Amietszajew, Ruth Carvajal, Yue Guo, Zahoor Ahmed, Cheng Zhang, Gregory Goodlet, and Rohit Bhagat. 2021. "Cold Ageing of NMC811 Lithium-ion Batteries" Energies 14, no. 16: 4724. https://doi.org/10.3390/en14164724
APA StyleWang, C., Amietszajew, T., Carvajal, R., Guo, Y., Ahmed, Z., Zhang, C., Goodlet, G., & Bhagat, R. (2021). Cold Ageing of NMC811 Lithium-ion Batteries. Energies, 14(16), 4724. https://doi.org/10.3390/en14164724