Abstract
A control algorithm for Parallel Connected Offshore Wind Turbines with permanent magnet synchronous Generators (PCOWTG) is presented in this paper. The algorithm estimates the optimal collective speed of turbines based on the estimated mechanical power of wind turbines without direct measurement of wind speed. In the proposed topology of the wind farm, direct-drive Wind Turbine Generators (WTG) is connected to variable low-frequency AC Collection Grids (ACCG) without the use of individual power converters. The ACCG is connected to a variable low-frequency offshore AC transmission grid using a step-up transformer. In order to achieve optimum wind power extraction, the collective speed of the WTGs is controlled by a single onshore Back to Back converter (B2B). The voltage control system of the B2B converter adjusts voltage by keeping a constant Volt/Hz ratio, ensuring constant magnetic flux of electromagnetic devices regardless of changing system frequency. With the use of PI pitch compensators, wind power extraction for each wind turbine is limited within rated WTG power limits. Lack of load damping in offshore wind parks can result in oscillatory instability of PCOWTG. In this paper, damping torque is increased using P pitch controllers at each WTG that work in parallel with PI pitch compensators.
1. Introduction
The first offshore wind farm installed on the coast of Sweden, with a rated power of 220 kW, dates back to 1990. Since then, the number and size of offshore wind farms have constantly been increasing, and their installation has become increasingly remote from the mainland. The main reasons for installing offshore wind turbines are the reduction of visual and acoustic impact on the environment, less wind turbulence, and higher average wind speeds than onshore wind turbines. Possible grid topologies for offshore windfarms include wind parks with High Voltage AC (HVAC) offshore transmission lines, and wind parks with High Voltage DC (HVDC) offshore transmission lines [1,2,3]. Most offshore wind parks installed today use the HVAC offshore transmission grid. In offshore wind parks with HVAC transmission lines, Wind Turbine Generators (WTG) are connected to an AC collector grid using an AC/AC power converter. The offshore substation contains a step-up transformer by which the collector grid voltage is raised to the high voltage of the transmission AC grid. Onshore substations also have a transformer. Wind parks with HVDC transmission grids usually have an identical collector grid solution as wind parks with HVAC transmission lines. However, the offshore transmission line is DC, where the collector grid frequency is decoupled from the mainland AC frequency. In this case, offshore and onshore substations contain AC/DC and DC/AC power converters in addition to transformers.
Deployment of power electronics in harsh offshore environments has been identified as a major challenge associated with any offshore wind system. Recent trends in offshore wind industry have been directed toward minimising the complexity of offshore assets, aiming to provide an adequate level of reliability in operation of wind farms. In Parallel (directly) Connected Offshore Wind Turbine Generators (PCOWTG) wind park configuration, proposed in this paper, directly-driven Permanent Magnet Synchronous Generators (PMSG) are connected to variable low-frequency AC Collection Grid (ACCG) without using a power converter. By using a step-up transformer, the ACCG is connected to a Variable Low-Frequency offshore AC transmission grid (VLFAC). The Back to Back (B2B) power converter acts as the point of connection for the VLFAC grid to the mainland grid, regulating the Wind Turbine Generator’s (WTG) collective speed and voltage at the B2B Point Of Interconnection (POI) to the VLFAC grid. The control system of the mainland grid side part of the B2B converter is responsible for controlling the DC link voltage of the B2B converter and reactive power injected (absorbed) to (from) mainland grid. DC link voltage of the B2B converter, without decreasing generality, is regarded as constant, and consequently, the control system of the mainland grid side part of the B2B converter is outside the interest of this paper.
A similar wind park (farm) configuration is proposed and analysed in [4,5] with the constant speed operation of Wind Turbine Generators. Another similar configuration of offshore wind parks under the name “slim wind turbine concept” is proposed and analysed in [6] at the level of feasible study, without designing the system’s controller. This paper extends this concept by developing a detailed simulation model using the Matlab/Simulink and Simscape Specialized Power System toolbox, designing the closed-loop control system and solving the problem of undamped oscillations of rotor angles. Each component of the system is carefully designed to make it as close to real-world components as possible. Due to the absence of gearboxes and offshore power converters, the proposed wind park configuration concept decreases both capital expenditure (CAPEX) and operational expenditure (OPEX), reduces subsystem complexity, and increases overall system reliability [7,8]. According to [9,10], the main reasons for offshore wind park outages are gearboxes and power electronics failures.
Underwater offshore AC cables have very high shunt capacitance, so the use of HVAC transmission cables is limited to 50–80 km distances due to large charging currents [11]. Consequently, the cables’ capability to transfer active power decreases either due to thermal limits or voltage stability. The simplified formula for charging cable currents calculation is:
where f is frequency; C is capacitance of the cable per unit length; l is the length of the cable; V is voltage. From (1), it can be seen that the reduction of cable charging currents is achieved by decreasing system frequency. Reactive power generated by the transmission cable with prevailing capacitive reactance by simplification can be calculated as:
From (2), it can be seen that Qc depends on the product of frequency and cable length. Accordingly, the transmission cable length can be increased by decreasing system frequency for the same reactive power generated by the cable.
The typical choice for nominal frequency in Low-Frequency AC systems (LFAC) is 50/3 Hz. This frequency in some countries is used for railway power supply (fractional frequency transmission systems). LFAC transmission systems are proposed and analysed in many papers [12,13,14]. In [15], a comparison of energy losses, total CAPEX and OPEX of LFAC and HVDC system was performed. It has been concluded that LFAC, with the extended length of the transmission, is comparable to HVDC (CAPEX costs are 6% lower than HVDC, and OPEX costs are 3% lower than HVDC). In a general case, the wind speed on each wind turbine may be different; this means that, in PCOWTG wind park configuration, the MPPT of the individual WTG’s cannot be achieved. The decreased amount of extracted wind power of individual WTs is compensated due to the absence of thermal losses of individual WTG power converters because they are not present in this configuration. A simpler system with less equipment also reduces the number of potential failures and reduces WTG’s downtime. Consequently, it can be concluded that the proposed configuration not only reduces the CAPEX and OPEX but could also potentially improve the Levelised Cost of Energy (LCOE).
A medium-frequency windfarm and modular multi-level converter-based high-voltage direct current transmission (MMC-HVDC) integration system are proposed in [16]. One of the features of the proposed scheme is the adoption of the rectifier station and inverter station due to high scalability and low switching frequencies with satisfactory output harmonics characteristics. One of the most important features of the proposed scheme is the increase of the operating frequency of the offshore AC system to the medium-frequency range (100–400 Hz) instead of the conventional 50/60 Hz.
The feasibility of employing the LFAC system for subsea transmission and distribution of 58 MW power is investigated in [17]. The authors developed simulation model of the LFAC-based subsea transmission and distribution system, which includes a hexverter as a frequency converter. A novel control strategy was developed to optimise its zero-sequence circulating current. The authors designed a dedicated control system to reduce the impact of real-time disturbances, such as wind speed fluctuations and harmonics due to heavy inductive load operating at 16 Hz.
In [18], the main characteristics of the control algorithm of PCOWTG are presented. The control algorithm is applied to an offshore wind park with a transmission grid 20 km in length and used for the limited wind speed region between cut-in wind speed and nominal wind speed. The wind speed is estimated from the Wind Turbine (WT) speed and active power of the Wind Generator (WG). Due to lack of load damping, a significant amplitude of oscillations of WG rotor angles was observed.
The rest of the paper is organised as follows. Section 2 provides an overview methodology of the paper. A detailed PCOWTG system description is given in Section 3, including a problem statement and control system architecture. In Section 4, the proposed PCOWTG control system is validated based on a realistic wind park simulator with a detailed discussion of the simulation results. Finally, Section 5 summarises concluding remarks and provides indications for further research.
2. Methodology
In this paper, the control algorithm is implemented on PCOWTG with a 150 km length of transmission grid. Additionally, a control algorithm is applied in case of wind speed changes from cut-in wind speed to above nominal wind speed. Instead of using the WGs active power, which was the case of the PCOWTG control system presented in [18], the calculated mechanical power of the WTG is used for estimating the wind speed of each WT. By using a P pitch controller with adequately adjusted parameters, the damping torque of the WTG is increased, and significant deviations of rotor angles are prevented, ensuring wind generators’ angle stability. In order to compensate for the reactive power generated by the transmission cable, shunt reactors are added on both sides of the transmission grid cable.
In order to achieve optimal wind power extraction (Maximum Power Point Tracking—MPPT), the collective rotational speed of WTGs is controlled by the B2B converter depending on wind speed. In order to keep magnetic flux in electromagnetic devices (transformers etc.) constant regardless of changes in system frequency, constant Volt/Hz ratio operation is adopted. This control strategy is well known in scalar control of asynchronous motors. It is also proposed in some papers that consider the variable frequency operation of wind parks [16,17], where the authors implemented the constant Volt/Hz operation on the AC collection grid for offshore wind with an HVDC transmission grid. Additionally, the wind speed is measured, which was not estimated in the approach proposed in [19,20]. In this paper, constant Volt/Hz operation is implemented in both collection and transmission offshore grids. In order to find the optimal collective rotational speed of WTG, the wind speed at each wind turbine is estimated by applying the original method, which is presented in this paper for the first time.
3. PCOWTG System Description
3.1. Overview
A schematic diagram of PCOWTG is presented in Figure 1. In Figure 1, n is the number of WTGs (or the number of clusters of WTGs); Vr is the space vector of regulated voltage (voltage at POI); I is the space vector of converter current; θf1, θf2, …, θfn are PMSGs rotor field angles; ωt1, ωt2, …, ωtn are rotational speeds of WTGs; β1, β2, …, βn are pitch angles of WTs; ωopt is the optimal collective speed of WTGs in wind parks; ωt is the collective (average) speed of WTGs in wind parks; I1, I2, …, In are the space vectors of currents of wind generators; V1, V2, …, Vn are the space vectors of voltages of wind generators; Pmc1, Pmc2, …, Pmcn are estimated mechanical powers of WTs; vw1, vw2, …, vwn are wind speeds of each WT; Rc and Lc represent resistance and inductance for the converter coupling inductor, respectively. The rotor field angles and turbine speeds are measured using encoders.

Figure 1.
Schematic diagram of PCOWTG.
3.2. Problem Statement
Generally speaking, the PCOWTG is a complex nonlinear multiple input multiple output systems with spatially distributed elements and a random source of mechanical (wind) energy. Due to the variable speed operation, the reactance of electrical elements of the system is changing with the change of system frequency, causing the analysis of the system and control system design to be more complex. Although the exclusion of power converters at WTGs reduces overall system complexity, at the same time, it reduces the controllability of the system. Consequently, the design of a control system of PCOWTG is a demanding task. The main controlled variables of the system are the collective speed of WTGs, the voltage at POI of the B2B converter, and pitch angles of WTs. The PCOWTG control system should simultaneously ensure the system’s angle stability of WGs and voltage stability, ensuring that voltages and currents are within rated limits of all equipment. Reactive power flow should be minimised in order to reduce thermal losses. Additionally, by adjusting the speed of the turbines to the wind speed, maximum extraction of wind power should be ensured. In order to accomplish these tasks, the novel control system architecture combined with reactive power compensation and constant Volt/Hz operation is proposed.
3.3. Control System Architecture
A block diagram of the offshore B2B converter control system of the Voltage Source Converter (VSC) on the wind park side is presented in Figure 2. Inputs into the control system are measured using WTG speeds and PMSG rotor field angles, space vectors of currents from wind generators (that is, phase currents of PMSGs), space vectors of regulated voltage Vr (that is, phase voltages of regulated voltage), and space vectors of the current I of the B2B converter (that is, phase currents of B2B converter). The control system is realized as a multi-loop control system. The inner control loops represent a decoupled current controller of direct (d) and quadrature (q) components of the current converter. The outer loops realize the WTG (collective) Speed controller and the B2B converter Voltage controller. The WTG Speed controller calculates reference Id current command (Idcmd) for the Current controller while the Voltage controller calculates Iq current command (Iqcmd) for the Current controller (see Figure 3).
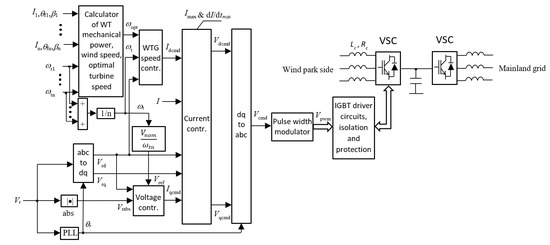
Figure 2.
B2B converter control system (wind park side).
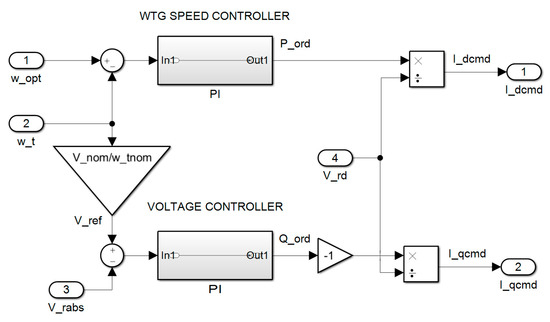
Figure 3.
WTG Speed controller and Voltage controller.
The WTG Speed controller, the Voltage controller, and the Current controller are realized in a rotating dq frame, where d axis is aligned with the space vector of voltage Vr. The Phase-Locked Loop (PLL) is used to calculate system frequency and calculate angle θr (angle of space vector Vr) of the abc to dq transformation. In this way, the q component of voltage Vr equals zero. Consequently, active and reactive powers of the B2B converter are (per unit—pu)
where Vrd is the d component of regulated voltage Vr; Id and Iq are the d and q components of the B2B converter currents, respectively. The reference value of the regulated voltage Vr is found according to a constant Volt/Hz ratio operation using the formula:
where Vnom is the nominal converter voltage (pu); ωtn is the nominal WTG’s rotational speed (pu), and ωt is the WTG’s (collective) rotational speed (pu). The PI Voltage controller calculates reactive power order Qord while Iq cmd signal is found using Formula (4). The reference value of WTG collective speed ωopt is found by the Calculator block shown in Figure 2. The Calculator block calculates WT mechanical power, wind speed at each WT, and optimal collective speed of wind turbines ωopt. WTG Speed controller calculates active power order Pord, by means of the Id cmd signal found using Formula (3).
The block diagram of a decoupled Current controller of the B2B converter is shown in Figure 4. In Figure 4, Rc and Lc represent resistance and inductance of the converter coupling inductor, respectively; ω is the system rotational frequency. The “P, Q priority” block in Figure 4 limits the Iq converter current component (P priority) or Id converter current component (Q priority) in order to limit the converter current according to the P, Q priority algorithm described in Appendix A, Figure A1. In the same Figure, Vd cmd and Vq cmd represent command signals for the d and q components of voltage Vc for the B2B converter, as shown in Figure 1. These components are inputs into the PWM modulator of the B2B converter. Id and Iq represent d and q components of the space vector for current I of the B2B converter.
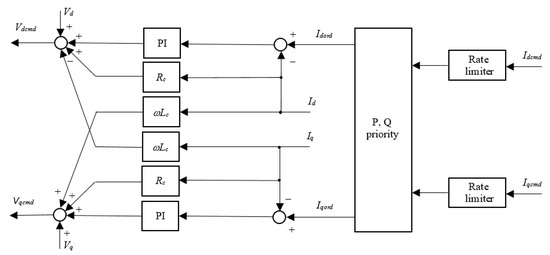
Figure 4.
Decoupled Current controller of B2B converter.
The converter coupling circuit is driven by the following set of equations:
From this set of equations, receiving a block diagram of the decoupled Current controller of the B2B converter is straightforward, as shown in Figure 4. The block diagram of a decoupled Current controller of B2B, as shown in Figure 4, is a “standard“ block, which can be found in many textbooks discussing power converters in wind energy conversion systems and is not be further explained.
Figure 5 shows the block diagram representing the Pitch control system. It consists of a PI Pitch compensator and a P pitch controller, which work in parallel. If the extracted mechanical power of WT is larger than rated WT power Prated, then the PI pitch compensator increases pitch angle β and limits extracted mechanical power to Prated. The algorithm for estimating WT mechanical power Pmci (Pmcipu is an abbreviation for Pmci pu) is explained in Section 3.4. The P Pitch controller increases the damping torque of WTG, preventing oscillatory instability of wind generators. The reference signal for this controller is an averaged rotational speed of WTG ωt. In Figure 5, Pmci and ωti represent the estimated mechanical power and rotational speed of ith WT, respectively. In order to mitigate blade passing effects and prevent excessive pitch activity in the practical realization of the proposed control system, adaptive notch filters for both error signals in Figure 5 should be used, i.e., adaptive notch filter blocks should be added before the P and PI blocks. The notch frequencies of these filters should be selected as multiples of the WTG’s rotational speed and as the resonant frequencies of the WTG’s drive system.

Figure 5.
WT pitch control system.
3.4. Estimation of WTG Mechanical Power, Wind Speed and Optimal WTG Speed
The extracted mechanical wind power Pmi of ith WT is provided as:
where: ρ is air density (kg/m3); A is the area swept by blades of WT (m2); vwi is wind speed at ith WT (m/s); Cp is the power coefficient (coefficient of performance); λi is the tip speed ratio (ratio of speed at the tip of blades and wind speed); βi is the pitch angle (deg); n is the number of WTs. In Equation (7), it is assumed that uniform air density over the area of the offshore wind park and all WTGs are identical. According to [21], the power coefficient is provided as:
where c1, c2, …, c9 are constants that depend on the type of WT used. Different approximations of Formula (8) can be found in the literature. For convenience, polynomial approximations provided in [22] are used in this paper:
where R is the radius of the blade of WT (m); ωti is ith WTG speed (rad/s); and coefficients αjk are provided in [22]. These coefficients depend on the type of WT used. If coefficients αjk are chosen according to [22], the maximum of power coefficient Cpmax = 0.517 at tip speed ratio λopt = 8.805 and βi = 0 (deg) is achieved.
A common control strategy of variable speed WTG is shown in Figure 6, which is also applied in the PCOWTG control system [23]. In the region of wind speed [0, vwcut-in] (region I), the wind turbine is turned off by moving the blades toward the feather position. When the wind speed is between vwcut-in and the base wind speed vwb (region II), the WTG control system adjusts WTG speed in a way that achieves optimum tip speed ratio:
where at vw = vwb nominal WTG speed ωtn is achieved. In this region, the PCOWTG control system keeps pitch angle βi = 0 (deg). In this way, the optimum mechanical power (Pm) extraction from wind power is achieved. At vw = vwb, the extracted mechanical power of WTG is Pmb.
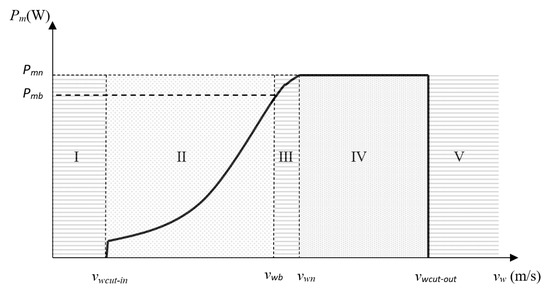
Figure 6.
Control regions of WTG.
When the wind speed is between vwb and nominal wind speed vwn (region III), the PCOWTG control system keeps WT speed at nominal level ωtn and pitch angle at 0 deg. Consequently, the tip speed ratio is not at the optimal level; that is, Cp is slightly below Cpmax. This region was introduced to achieve a better transition from region II to region IV. In region IV, the PCOWTG control system limits extracted mechanical power to nominal WTG mechanical power Pmn while keeping WTG speed at nominal level ωtn; this is achieved by increasing the pitch angle. In region V, WTG is turned off by moving the blades toward the feather position.
According to previous considerations, it follows:
where Sb is base system power (W). The subscript “pu” in (12) is added to differentiate per-unit quantities. In direct-drive, WTG generator speed ωg equals turbine speed ωt. If at base WTG speed is chosen ωb = ωtn, then for any wind speed and ith WTG we have:
where ωtpu is the collective rotational speed of turbine per-unit of the base rotational speed ωb; vwipu is wind speed of ith WT per-unit of base wind speed vwb. By combining (12) and (13) we have:
The overall extracted mechanical power of the wind park, which consists of n parallel connected WTG, is:
where
From (14) it follows:
Formula (17) can be written in the form:
where .
The left-hand side of Equation (18) is a polynomial of the 4th order in vwipu. Positive zero of this polynomial, between vcut-in and vcut-out, represents a wind speed of ith WT. The issue with Equation (18) is that mechanical power Pmipu of WT is challenging to measure. In this paper, the estimation of the mechanical power of WT by using the WTG swing equation is proposed as follows:
where Teipu is the electromagnetic torque (pu) of ith WG; Tmipu is the mechanical torque (pu) of ith WT; H is WTG inertia constant in seconds (MWs/MVA), and D is the WTG damping coefficient. Electromagnetic torque of a non-salient pole PMSG can be found using formula:
where λfpu is rotor flux linkage (pu) produced by permanent magnets; iqipu (pu) is q component of ith PMSG stator current in the rotor field synchronous dq frame, whose angle θfi is measured using an encoder.
From (19), it follows that the mechanical power of ith WT can be found from:
Since the filtered derivation (approximation of ideal derivation) is used in simulations, the estimated Pmcipu is an approximation of Pmipu.
After estimating wind speed at each WT, the optimal collective speed of WT can be found from (18) as follows:
The overall extracted mechanical power of the wind park is:
The right-hand side of (23) is the fourth-order polynomial in ωtpu. The maximum of Pm is achieved for ωt = ωopt, which can be determined by using derivate or non-derivate optimisation algorithm to find the maximum value of the right-hand side of (23). The estimated ωopt is used as a reference value of the WTG Speed controller. A schematic diagram of the Calculator block is shown in Figure 7. In Figure 7, variable s represents the Laplace operator and Tf is the time constant of a low-pass filter.
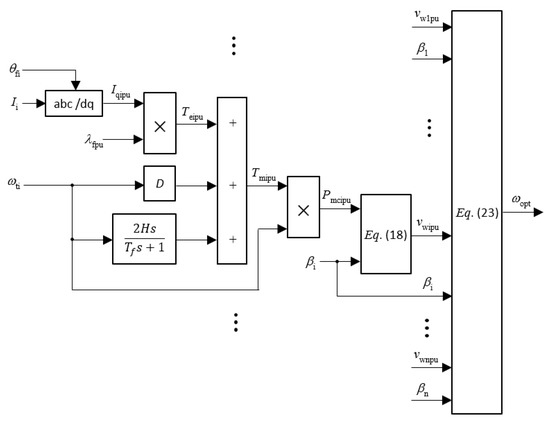
Figure 7.
Schematic diagram of the Calculator block.
4. Case Study
4.1. System Parameters
The simulations are based on realistic models of all wind park components using Matlab/Simulink and Simscape Specialized Power System toolbox. The wind park consists of 3 WTGs to only simulate the main characteristics of the system. The model of the WTGs is based on the NOWITECH 10 MW direct-drive WTG model [24]. In this model, the optimum (maximum) tip speed ratio is 7.8, the number of poles of the WG is 198 and rated WTG speed is 13.54 rpm. In order to comply with the new maximum (optimum) tip speed ratio λopt = 8.805 used in this paper, some parameters of WTG were changed, which is explained in the following text. These changes do not influence the main results achieved in this paper in any way. Since it is supposed that system nominal frequency is fn = 16.67 Hz, it follows that the nominal WTG speed is:
For convenience, the number of poles equal to 130 is proposed in this paper. Accordingly, it follows ωtn = 1.61 rad/s = 15.39 rpm. It is also supposed that the base wind speed is vwb = 12 m/s.
From (11) the radius of WT blades is found to be R = 65.75 m, while WT mechanical power, achieved at base wind speed, is Pmbpu = 0.755 pu found using (12). From (18), by setting Pmipu = 1 pu, nominal wind speed is equal to vwn = 13.24 m/s. Since we changed the nominal WTG speed compared with the original NOWITECH WTG, the inertial constant of WTG was also changed to H = 3.48 MWs/MVA. It is also assumed that the air density is ρ = 1.25 kg/m3. The rest of the parameters of the WTG are shown in Table 1. The base system power is Sb = 10 MVA.

Table 1.
WTG parameters.
The parameters of transformers Tr1, Tr2 and Tr3, are similar to parameters of transformers in the Matlab/Simulink “power_wind_dfig” example, which are given in Table 2. Resistance and inductance of the converter coupling inductor are Rc = 0.0015 pu and Lc = 0.15 pu. These values are also taken from the same example.
Table 2.
Transformer parameters.
The transmission and collection cables used are three core cross-linked polyethylene (XLPE) cables, modelled using a three-phase π section line in Matlab/Simulink. The length of the transmission network used in this paper is 150 km, and the lengths of collection network lines are 1 km, 3 km, and 5 km. The parameters of the XLPE cables are given in Table 3 [25]. In order to compensate for the reactive power generated by the cables, shunt reactors Ls1 = 0.5 pu and Ls2 = 1.25 pu were applied on both ends of the transmission grid cable. All simulations were performed based on per-unit system base quantities. Simulation time was set to 360 s.
Table 3.
ABB XLPE cables parameters.
4.2. Simulation Results
4.2.1. Steady-State Analysis
Figure 8 shows voltages of nodes from the system at a steady-state for different wind speeds. In Figure 8, Eint1 represents the internal voltage of PMSG1. Approximate reactive power absorbed by reactors Ls1 and Ls2 can be represented as:
where f is system frequency and V is the voltage applied to shunt reactors. Since constant Volt/Hz ratio operation is employed and system frequency is proportional to wind speed, it follows:
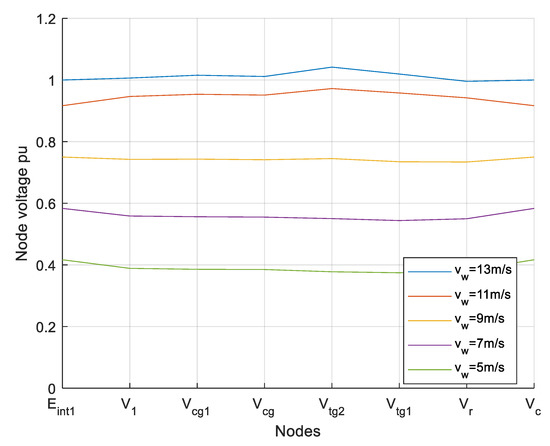
Figure 8.
Node voltage for different wind speeds.
From (2), (25) and (26) it follows:
When wind speed decreases, capacitive reactive power production decreases at a higher rate than the decreasing inductive reactive power consumption; this is the reason why, in Figure 8, by decreasing wind speed, the voltage at the inner nodes of the system decreases to a more significant extent than voltages at the outer (generators and converter) nodes of the system. In order to achieve even better voltage profiles than those presented in Figure 8, tapped reactors can be used [26] (p. 630).
4.2.2. Dynamic Responses
Figure 9 displays wind profiles applied to the wind park; as shown in Figure 9, the wind speed changes from 9.5 m/s to 14 m/s. In this way, wind speed varies from region II to region IV (see Figure 6), in which the control system is active. Regions I and region V were not used since WTGs are shut down in these regions. Additionally, the wind profiles are delayed relative to each other to consider the spatial distribution of WTGs and the limited travel speed of the wind disturbance front. The time between decreasing and increasing wind profiles is long enough to allow the system to settle in a steady-state.
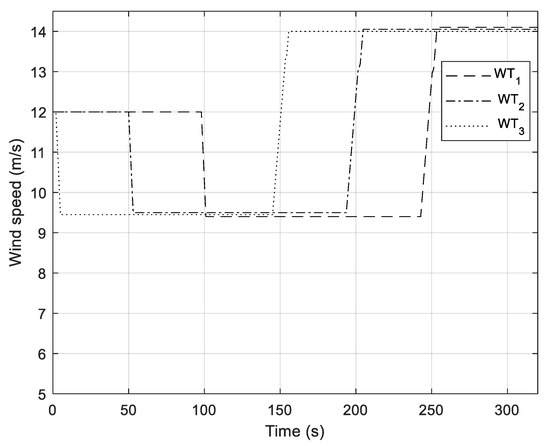
Figure 9.
Wind profiles applied to the wind park.
Deviations of rotor angles around the average rotor angle of all WTGs in the wind park, and responses from the B2B converter current and WGs currents for using the control system of PCOWTG with a disabled P pitch controller are shown in Figure 10 and Figure 11, respectively.
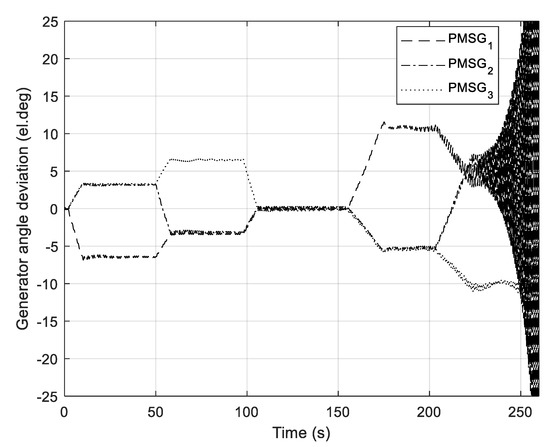
Figure 10.
Deviations of rotor angles for control system with disabled P pitch controller.
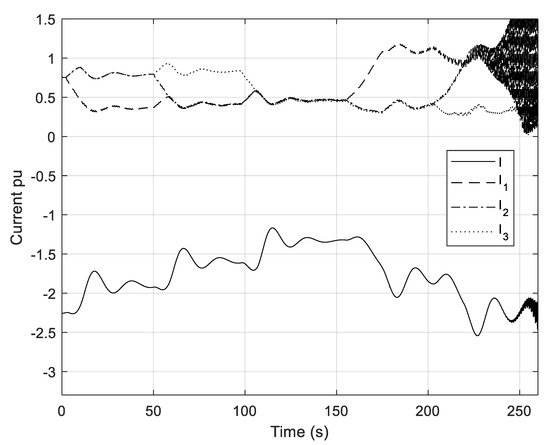
Figure 11.
Currents of the B2B converter and WGs for control system with disabled P pitch controller.
Due to the lack of load damping, oscillations of rotor angles in Figure 11 increase, leading to system instability (unbounded oscillations). In this case, simulation time is shortened to 260 s since, due to oscillatory instability, the signals rapidly increase after 220 s.
Figure 12, Figure 13, Figure 14, Figure 15, Figure 16, Figure 17, Figure 18 and Figure 19 show simulation results with the enabled P pitch controller. Figure 12 shows the power coefficients of WTs. It can be seen in the steady-state and for the case vw ≤ vwn, that power coefficients are close to the optimal value Cpmax = 0.517. Pitch angles of WTs are shown in Figure 13. When wind speed is below vwn, it can be seen that pitch angles are equal to zero for most of the time. During wind disturbance, P pitch controllers slightly increase their pitch angles in order to damp rotor angle oscillations. If wind speed is above vwn, PI pitch compensators increase their pitch angles to limit the extracted mechanical power of WT to a rated power of WTGs.
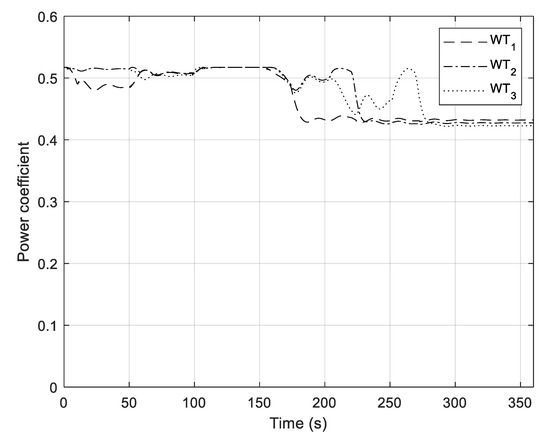
Figure 12.
Power coefficient Cp of the wind turbines.
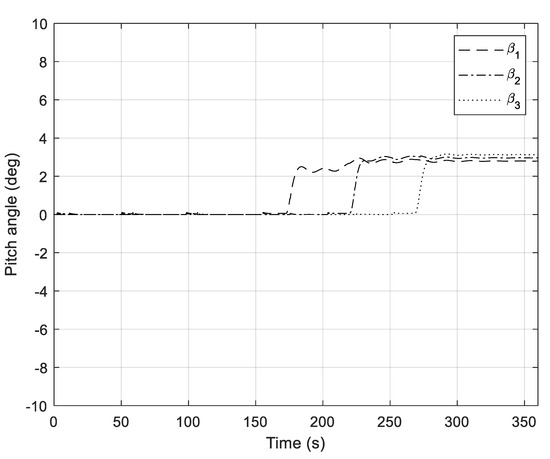
Figure 13.
Pitch angles of the wind turbines.
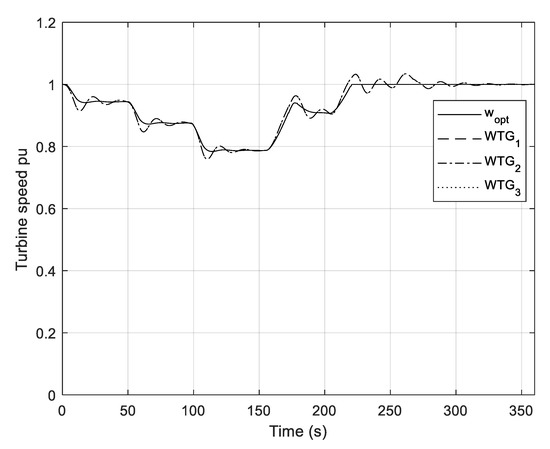
Figure 14.
Reference (optimal) speed and speeds of WTGs.
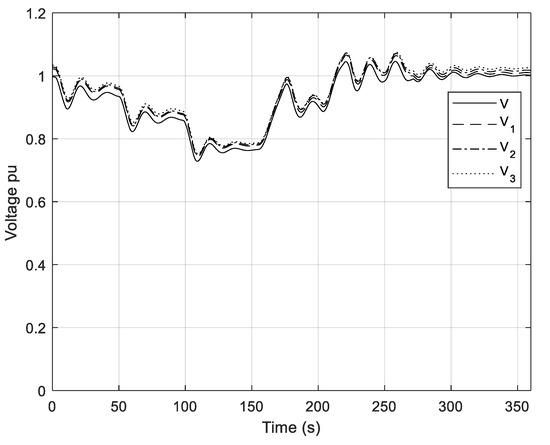
Figure 15.
Regulated voltage Vr and voltages V1–V3 of PMSGs.
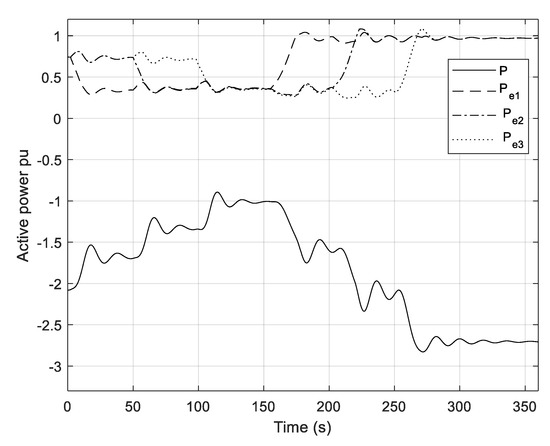
Figure 16.
Active power of B2B converter and active power of the PMSGs.
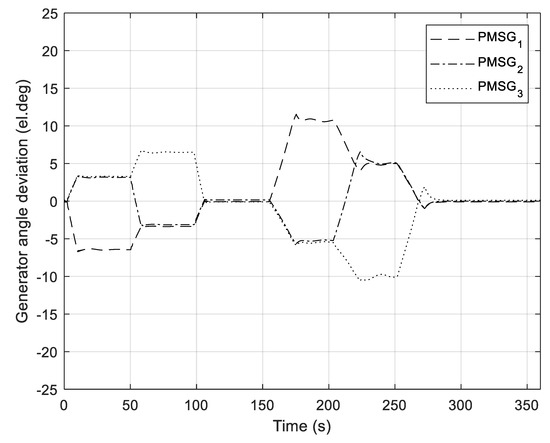
Figure 17.
Deviations of rotor angles of PMSGs.
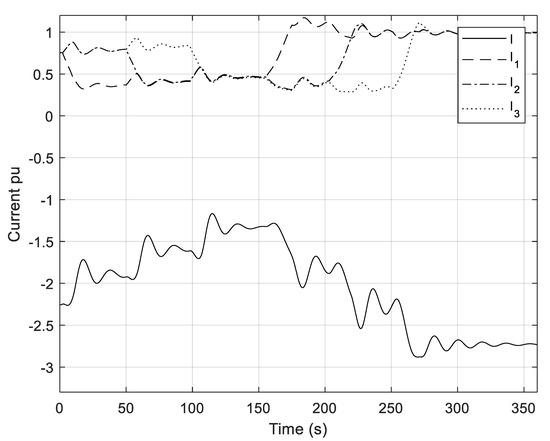
Figure 18.
Current of the B2B converter and currents of PMSGs.
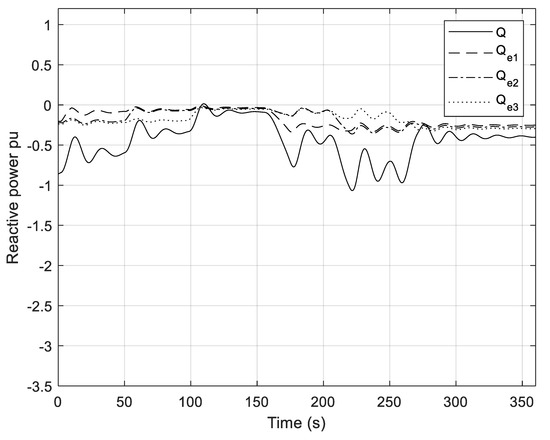
Figure 19.
Reactive power of the B2B converter and the reactive powers of PMSGs.
The reference (optimal) speed (estimated by the Calculator block) and speeds of WTGs are shown in Figure 14. Since PMSGs rotate synchronously, only a one-time response from the speed of WTGs can be observed. It should be emphasised that the speeds of WTGs may be slightly different during disturbances of active power, that is, during wind disturbances. Otherwise, WTGs rotate with the same collective speed or ωt.
Waveforms of regulated voltage Vr and PMSG voltages V1, V2, and V3 are presented in Figure 15. It can be seen that, due to “electrical vicinity” and voltage control by the B2B converter, the voltages of all generators and the B2B converter are in close proximity to each other. Figure 14 and Figure 15 show that waveforms of the WTG’s speed, voltages of WTGs and the B2B converter are very similar, which is to be expected. The internal voltage of WG is inherently proportional to WTG speed, so the time constant of the internal voltage of WG equals the mechanical time constant of WTGs. Due to constant Volt/Hz ratio operation at steady-state, regulated voltage Vr is proportional to WTG speed. Since we have chosen the same parameters for the PI WTG Speed controller and the PI Voltage controller, the waveform of regulated voltage is very similar to the WTG speed waveform during wind disturbances (that is, during transients). Figure 15 shows that voltages achieve their maximum values during wind disturbances and if the wind speed is close to vwn or above vwn. The achieved maximum is less than 110% of Vnom, which is acceptable in most practical realisations.
In Figure 16, the active power of the B2B converter and PMSGs is shown. Due to the chosen direction of the B2B converter’s active power, shown in Figure 1, the active power of the B2B converter is negative. It is interesting to note that after the decrease in wind speed of the WTG1, the active power of PMSG2 and PMSG3 immediately start to increase. In this case, the PMSG1 temporarily runs slower than the other two generators, so the angular position of the PMSG1, relative to the faster PMSG2 and PMSG3, lags behind.
Similar behaviour can also be observed from Figure 17, where deviations of rotor angles of WGs around the average rotor angle of WGs are shown. As stated in [26] (p. 22), the resulting angular difference transfers part of the load from a slow machine to a faster machine. The situation is reversed if wind speed increases.
Waveforms of B2B converter currents and PMSG currents are shown in Figure 18. These waveforms are qualitatively similar to waveforms from the active power of the B2B converter and the active powers of PMSGs. The current of the B2B converter is negative due to the chosen direction of the current. Due to the use of P pitch controller, oscillations of rotor angles and currents are mitigated, which can be seen in Figure 17 and Figure 18, respectively.
Waveforms of reactive power from the B2B converter and PMSG are shown in Figure 19. It can be seen that, according to the chosen directions of reactive power in Figure 1, reactive powers are negative—that is, the B2B converter and generators absorb reactive power.
A unit variance is a band-limited white noise signal passed through a forming filter, an approximation of the Von Kármán velocity spectra (MIL—F-8785C) used as input into the system, as shown in Figure 20 [27]. The mean value of this random (turbulent) wind disturbance is 12 m/s while variance is 1.5 (m/s)2, that is, turbulence intensity is 10.2%. Responses from the system are shown in Figure 21, Figure 22, Figure 23, Figure 24, Figure 25, Figure 26, Figure 27 and Figure 28. In Figure 22, it can be noticed that more pitch action occurs than in non-turbulent cases, which can lead to bearing and actuator wear as well as mechanical fatigue. One of the measures to reduce these effects is introducing a dead zone in the P pitch controller. In this way, the P pitch controller will not react to small wind disturbances. Other techniques to increase system damping will be the subject of future investigation. In Figure 21, it can be seen that the power coefficient in the region below nominal wind speed, as a result of non-zero pitch angle, is below the optimal level for most of the time. This behaviour is quite different from wind parks with variable speed WTGs that use a power converter per WTG, leading to decreased amounts of extracted wind power for individual WTs than is optimal. This loss is partially compensated by the absence of thermal losses in individual WTG power converters in PCOWTG configurations.
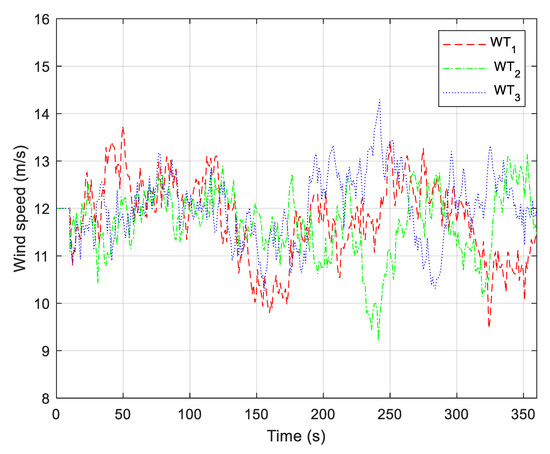
Figure 20.
Random wind disturbance applied to the wind park.
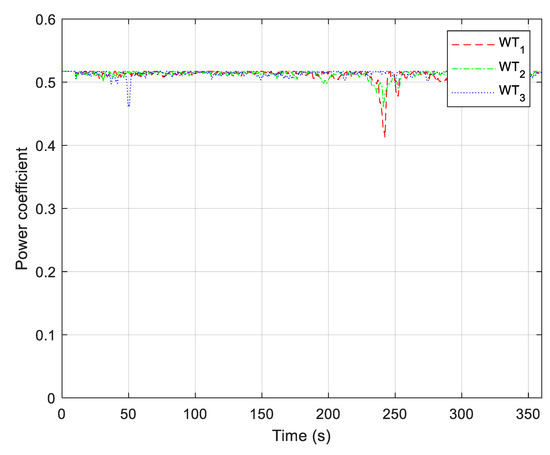
Figure 21.
Power coefficient Cp of the wind turbines (random wind disturbance).

Figure 22.
Pitch angles of the wind turbines (random wind disturbance).
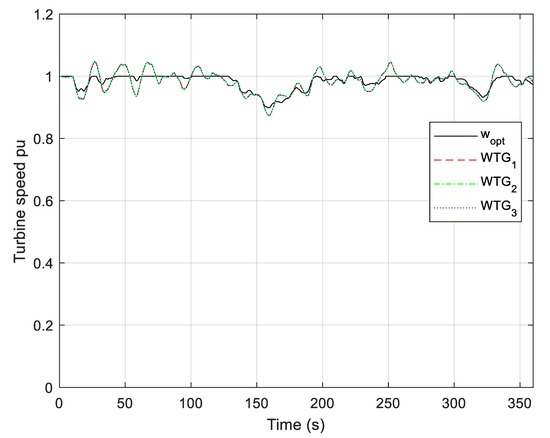
Figure 23.
Reference (optimal) speed and speeds of WTGs (random wind disturbance).
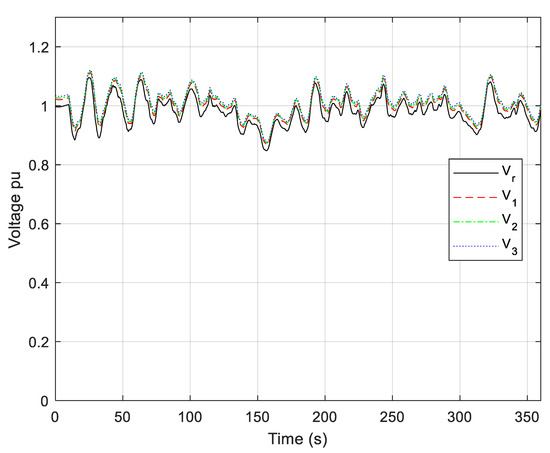
Figure 24.
Regulated voltage Vr and voltages V1–V3 of PMSGs (random wind disturbance).
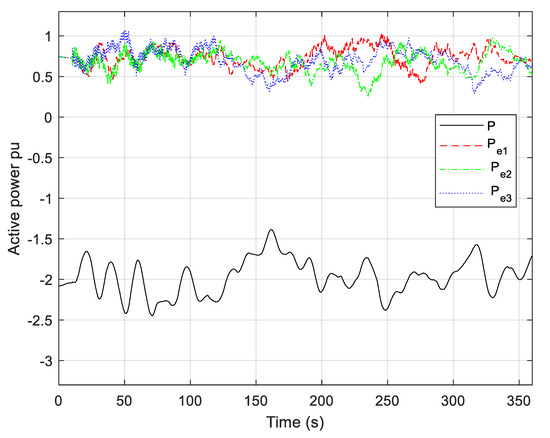
Figure 25.
Active power of the B2B converter and active power of the PMSGs (random wind disturbance).
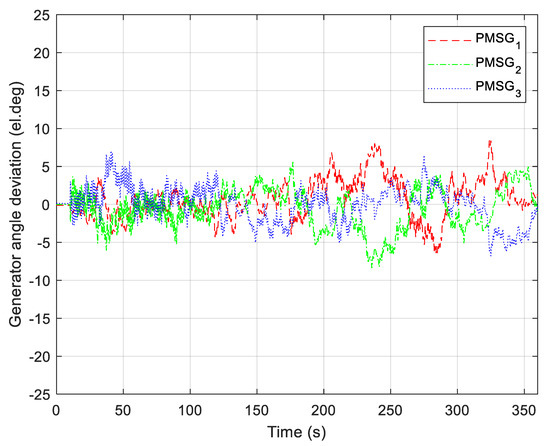
Figure 26.
Deviations of rotor angles of PMSGs (random wind disturbance).
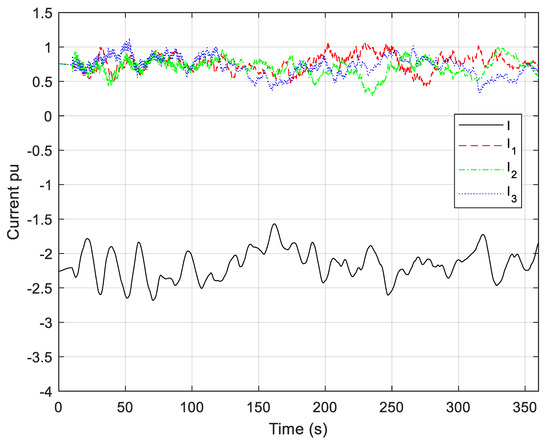
Figure 27.
Current of the B2B converter and currents of PMSGs (random wind disturbance).
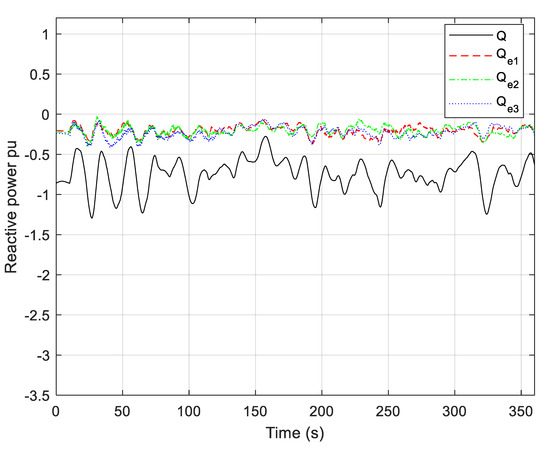
Figure 28.
Reactive power of the B2B converter and the reactive powers of PMSGs (random wind disturbance).
5. Conclusions and Further Work
This paper presents the new control algorithm for PCOWTG with a 150 km length of transmission grid for cases where wind speed changes from cut-in wind speeds of above nominal wind speed. The problem of large charging currents in underwater cables is mitigated by decreasing system frequency. In order to achieve maximum extraction of wind power, WTG speed changes as the wind speed changes, while reference WTG speed is determined using an optimisation algorithm. Instead of measuring wind speed, the algorithm for wind speed calculation is used at each wind WT. Shunt reactors are added to both sides of the transmission grid cable to compensate for the reactive power generated by the transmission cable. The magnetic flux of electromagnetic devices is kept constant regardless of changing of system frequency by applying the constant Volt/Hz ratio controller. Damping torque is increased by using P pitch controllers at each WTG that work parallel with PI pitch compensators. The use of a well-tuned P pitch controller guarantees the stability of the PCOWTG.
The main contributions and novelty of this paper are summarised as follows:
- The first published control algorithm for control of PCOWTG;
- A novel algorithm for estimation of wind speed and optimal collective speed for PCOWTG.
In further research, more analytical studies of PCOWTG and the stability of PCOWTG will be investigated. Additionally, more advanced control algorithms such as adaptive control and fuzzy logic control of PCOWTG will be designed. Analysis of thermal losses in PCOWTG will be conducted, and a comparison with other wind topologies will be performed. Due to the low and variable voltages and frequencies associated with PCOWTG, we will consider the use of nonstandard equipment and power conversion topologies. Further increase in system damping using alternative methods combined with pitch angle control (to decrease pitch action and turbine elements fatigue) will also be the subject of future research, together with an investigation of alternative methods to reduce bearing wear and mechanical fatigue.
Author Contributions
Conceptualisation, E.O. (Emir Omerdic) and J.O.; validation, E.O. (Edin Omerdic) and C.O.; formal analysis, J.O.; investigation, E.O. (Emir Omerdic); writing—review and editing, E.O. (Emir Omerdic) and J.O., E.O. (Edin Omerdic); supervision, C.O. All authors have read and agreed to the published version of the manuscript.
Funding
This research was funded by Science Foundation Ireland Centre Confirm, the Smart Manufacturing Centre, Grant No 16/RC/3918.
Informed Consent Statement
Not applicable.
Data Availability Statement
Data available on request due to privacy.
Acknowledgments
The authors also acknowledge Erasmus + Staff Mobility Training & Teaching Agreements for period 2016–2019 between University of Tuzla & University of Limerick.
Conflicts of Interest
The authors declare no conflict of interest.
Abbreviations
The following abbreviations are used in this manuscript:
| ACCG | AC Collection Grid |
| B2B | Back to Back converter |
| CAPEX | CApital EXpenditure |
| HVAC | High Voltage AC |
| HVDC | High Voltage DC |
| LCOE | Levelised Cost Of Energy |
| LFAC | Low-Frequency AC |
| MMC-HVDC | Modular Multi-level Converter-based High-Voltage Direct Current |
| OPEX | OPerational EXpenditure |
| PCOWTG | Parallel Connected Offshore Wind Turbine Generators |
| PMSG | Permanent Magnet Synchronous Generators |
| POI | Point Of Interconnection |
| PWM | Pulse Width Modulation |
| VLFAC | Variable Low-Frequency AC transmission grid |
| VSC | Voltage Source Converter |
| WG | Wind Generator |
| WT | Wind Turbine |
| WTG | Wind Turbine Generators |
Appendix A. P, Q Priority Algorithm
Inputs: rate-limited current commands Idcmd and Iqcmd; converter rated current Irated; priority (P or Q)
Outputs: current orders Idord and Iqord.
The P, Q priority algorithm is used to limit converter current inside the block “P, Q priority” (Decoupled Current controller of B2B converter) in Figure 4.
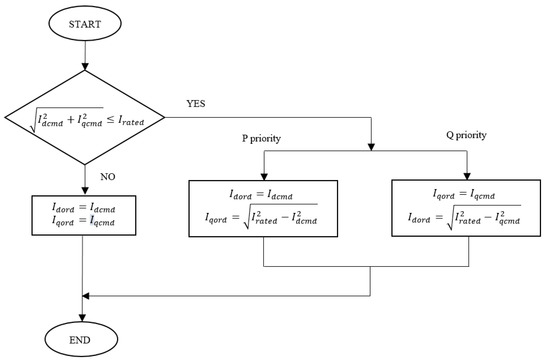
Figure A1.
P, Q Priority algorithm.
References
- SINTEF. Report on Deep Offshore Wind Farm Grid Integration Aspects Including a Case Study. SINTEF Energy Research—Electric Power Systems. Available online: https://sintef.brage.unit.no/sintef-xmlui/bitstream/handle/11250/2368443/TR%2bA7482.pdf?sequence=3&isAllowed=y (accessed on 26 May 2021).
- Himanshu, J.B.; Bruce, A.M.; Hans, K.H. Comparison of wind farm topologies for offshore applications. In Proceedings of the 2012 IEEE Power and Energy Society General Meeting, San Diego, CA, USA, 22–26 July 2012. [Google Scholar]
- Daniel, J.; Liu, S.; Ibanez, E.; Pennock, K.; Reed, G.; Hanes, S. National Offshore Wind Energy Grid Inter-Connection Study Executive Summary (PDF). Available online: https://www.energy.gov/sites/prod/files/2014/08/f18/NOWEGIS%20Executive%20Summary.pdf, (accessed on 23 May 2021).
- Pican, E.; Omerdic, E.; Toal, D.; Leahy, M. Direct interconnection of offshore electricity generators. Energy 2011, 36, 1543–1553. [Google Scholar] [CrossRef] [Green Version]
- Pican, E.; Omerdic, E.; Toal, D.; Leahy, M. Analysis of parallel connected synchronous generators in a novel offshore wind farm model. Energy 2011, 36, 6387–6397. [Google Scholar] [CrossRef]
- Hole, A.N. A Slim Wind Turbine Concept with Low Frequency AC Connection. Master’s Thesis, Norwegian University of Science and Technology Level, Trondheim, Norway, 2016. [Google Scholar]
- Chen, H.; Johnson, M.H.; Aliprantis, D.C. Low frequency AC transmission for offshore wind power. IEEE Trans. Power Deliv. 2013, 28, 2236–2244. [Google Scholar] [CrossRef]
- Pfaffel, S.; Faulstich, S.; Rohrig, K. Performance and Reliability of Wind Turbines: A Review. Energies 2017, 10, 1904. [Google Scholar] [CrossRef] [Green Version]
- Spinato, F.; Tavner, P.J.; van Bussel, G.J.W.; Koutoulakos, E. Reliability of wind turbine subassemblies. IET Renew. Power Gener. 2009, 3, 387–401. [Google Scholar] [CrossRef] [Green Version]
- Hahn, B.; Durstewitz, M.; Rohrig, K. Reliability of wind turbines—Experience of 15 years with 1500 WTs. Wind. Energy Proc. Euromech Colloq. 2012, 101, 329–332. [Google Scholar]
- Fischer, W.; Braun, R.; Erlich, I. Low frequency high voltage offshore grid for transmission of renewable power. In Proceedings of the 3rd IEEE PES Innovative Smart Grid Technologies Europe, Berlin, Germany, 14–17 October 2012. [Google Scholar]
- Xifan, W.; Chengjun, C.; Zhichao, Z. Experiment on fractional frequency transmission system. IEEE Trans. Power Syst. 2006, 21, 372–377. [Google Scholar] [CrossRef]
- Ruddy, J.; Meere, R.; O’Donnell, T. Low Frequency AC Transmission as an Alternative to VSC-HVDC for Grid Interconnection of Offshore Wind. In Proceedings of the 2015 IEEE Eindhoven PowerTech, Eindhoven, The Netherlands, 29 June–2 July 2015. [Google Scholar]
- Ruddy, J.; Meere, R.; O’Loughlin, C.; O’Donnell, T. Design of VSC Connected Low Frequency AC Offshore Transmission with Long HVAC Cables. IEEE Trans. Power Deliv. 2018, 33, 960–970. [Google Scholar] [CrossRef]
- Meere, R.; Ruddy, J.; McNamara, P.; O’Donnell, T. Variable AC transmission frequencies for offshore wind farm interconnection. Renew. Energy 2017, 103, 321–332. [Google Scholar] [CrossRef]
- Zhang, Z.; Tang, Y.; Xu, Z. Miniaturization of an Offshore Platform with Medium-Frequency Offshore Wind Farm and MMC-HVDC Technology. Energies 2021, 14, 2058. [Google Scholar] [CrossRef]
- Safder, M.U.; Rizvi, S.T.H.; Meng, Y.; Javed, M.Y.; Jaffery, M.H.; Hassan, M.S. Low-Frequency AC Power Transmission and Distribution for Subsea Application Using Hexverter. Electronics 2020, 9, 61. [Google Scholar] [CrossRef] [Green Version]
- Omerdic, E.; Osmic, J.; Toal, D.; O’Donnell, C.W. A New Control Algorithm for Directly Interconnected Offshore Wind Turbine Generators. In Proceedings of the 54th International University Power Engineering Conference, UPEC 2019, Bucharest, Romania, 3–6 September 2019. [Google Scholar]
- Gevorian, V.; Singh, M.; Muljadi, E. Variable frequency operations of an offshore wind power plant with HVDC-VSC. In Proceedings of the IEEE Power and Energy Society General Meeting, San Diego, CA, USA, 22–26 July 2012. [Google Scholar]
- Meere, R.; Ruddy, J.; O’Donnell, T. Variable frequency operation for the future offshore wind farm—Design: A comparison with conventional wind turbines. Energy Procedia 2014, 53, 280–289. [Google Scholar] [CrossRef] [Green Version]
- Heier, S. Grid Integration of Wind Energy Conversion Systems; John Wiley and Sons: Hoboken, NJ, USA, 1998. [Google Scholar]
- Clark, K.; Miller, N.W.; Sanchez-Gasca, J.J. Modelling of GE Wind Turbine-Generators for Grid Studies; Tech. Rep.; Version 4.5; General Electric International: Schenectady, NY, USA, 2010. [Google Scholar]
- Garcia-Sanz, M.; Houpis, C.H. Wind Energy Systems—Control Engineering Design; CRC Press: Boca Raton, FL, USA, 2012; p. 253. [Google Scholar]
- NOWITECH. Available online: https://www.sintef.no/projectweb/nowitech/ (accessed on 14 October 2020).
- XLPE Submarine Cable Systems Attachment to XLPE Land Cable Systems—User’s Guide. Available online: https://new.abb.com/docs/default-source/ewea-doc/xlpe-submarine-cable-systems-2gm5007.pdf (accessed on 11 December 2020).
- Kundur, P. Power System Stability and Control, 1st ed.; McGraw-Hill: New York, NY, USA, 1994; pp. 22, 630. [Google Scholar]
- Ly, U.; Chan, Y. Time-Domain Computation of Aircraft Gust Covariance Matrices. AIAA Paper 80-1615. In Proceedings of the Atmospheric Flight Mechanics Conference, Danvers, MA, USA, 11–13 August 1980. [Google Scholar]
Publisher’s Note: MDPI stays neutral with regard to jurisdictional claims in published maps and institutional affiliations. |
© 2021 by the authors. Licensee MDPI, Basel, Switzerland. This article is an open access article distributed under the terms and conditions of the Creative Commons Attribution (CC BY) license (https://creativecommons.org/licenses/by/4.0/).