
Land Subsidence Estimation for Aquifer Drainage Induced by Underground Mining


Abstract
1. Introduction
- (1)
- to model the entire field of land subsidence related to mining-induced drainage of an aquifer system;
- (2)
- to separate land subsidence related to direct mining impact from the imposing influence of drainage-related land subsidence;
- (3)
- to analyze the regional-scale impact of mining-induced drainage on the environment considering prone surface water reservoirs.
2. Study Area and Materials
2.1. Study Area
2.1.1. Geology
2.1.2. Hydrogeology
2.1.3. Underground Mining Exploitation and Its Past, Current and Future Impact on Aquifer System and Terrain Surface
2.2. Materials
2.2.1. Land Subsidence Data
2.2.2. Groundwater Data
2.2.3. Geological and Geographic Data
3. Methodology
3.1. Estimation of Past and Current Land Subsidence Due to Mining-Induced Drainage
3.2. Influence Function Model for Groundwater-Related Land Subsidence Estimation
3.2.1. Development of the Mathematical Model
3.2.2. Conceptualization and Numerical Representation of the Model
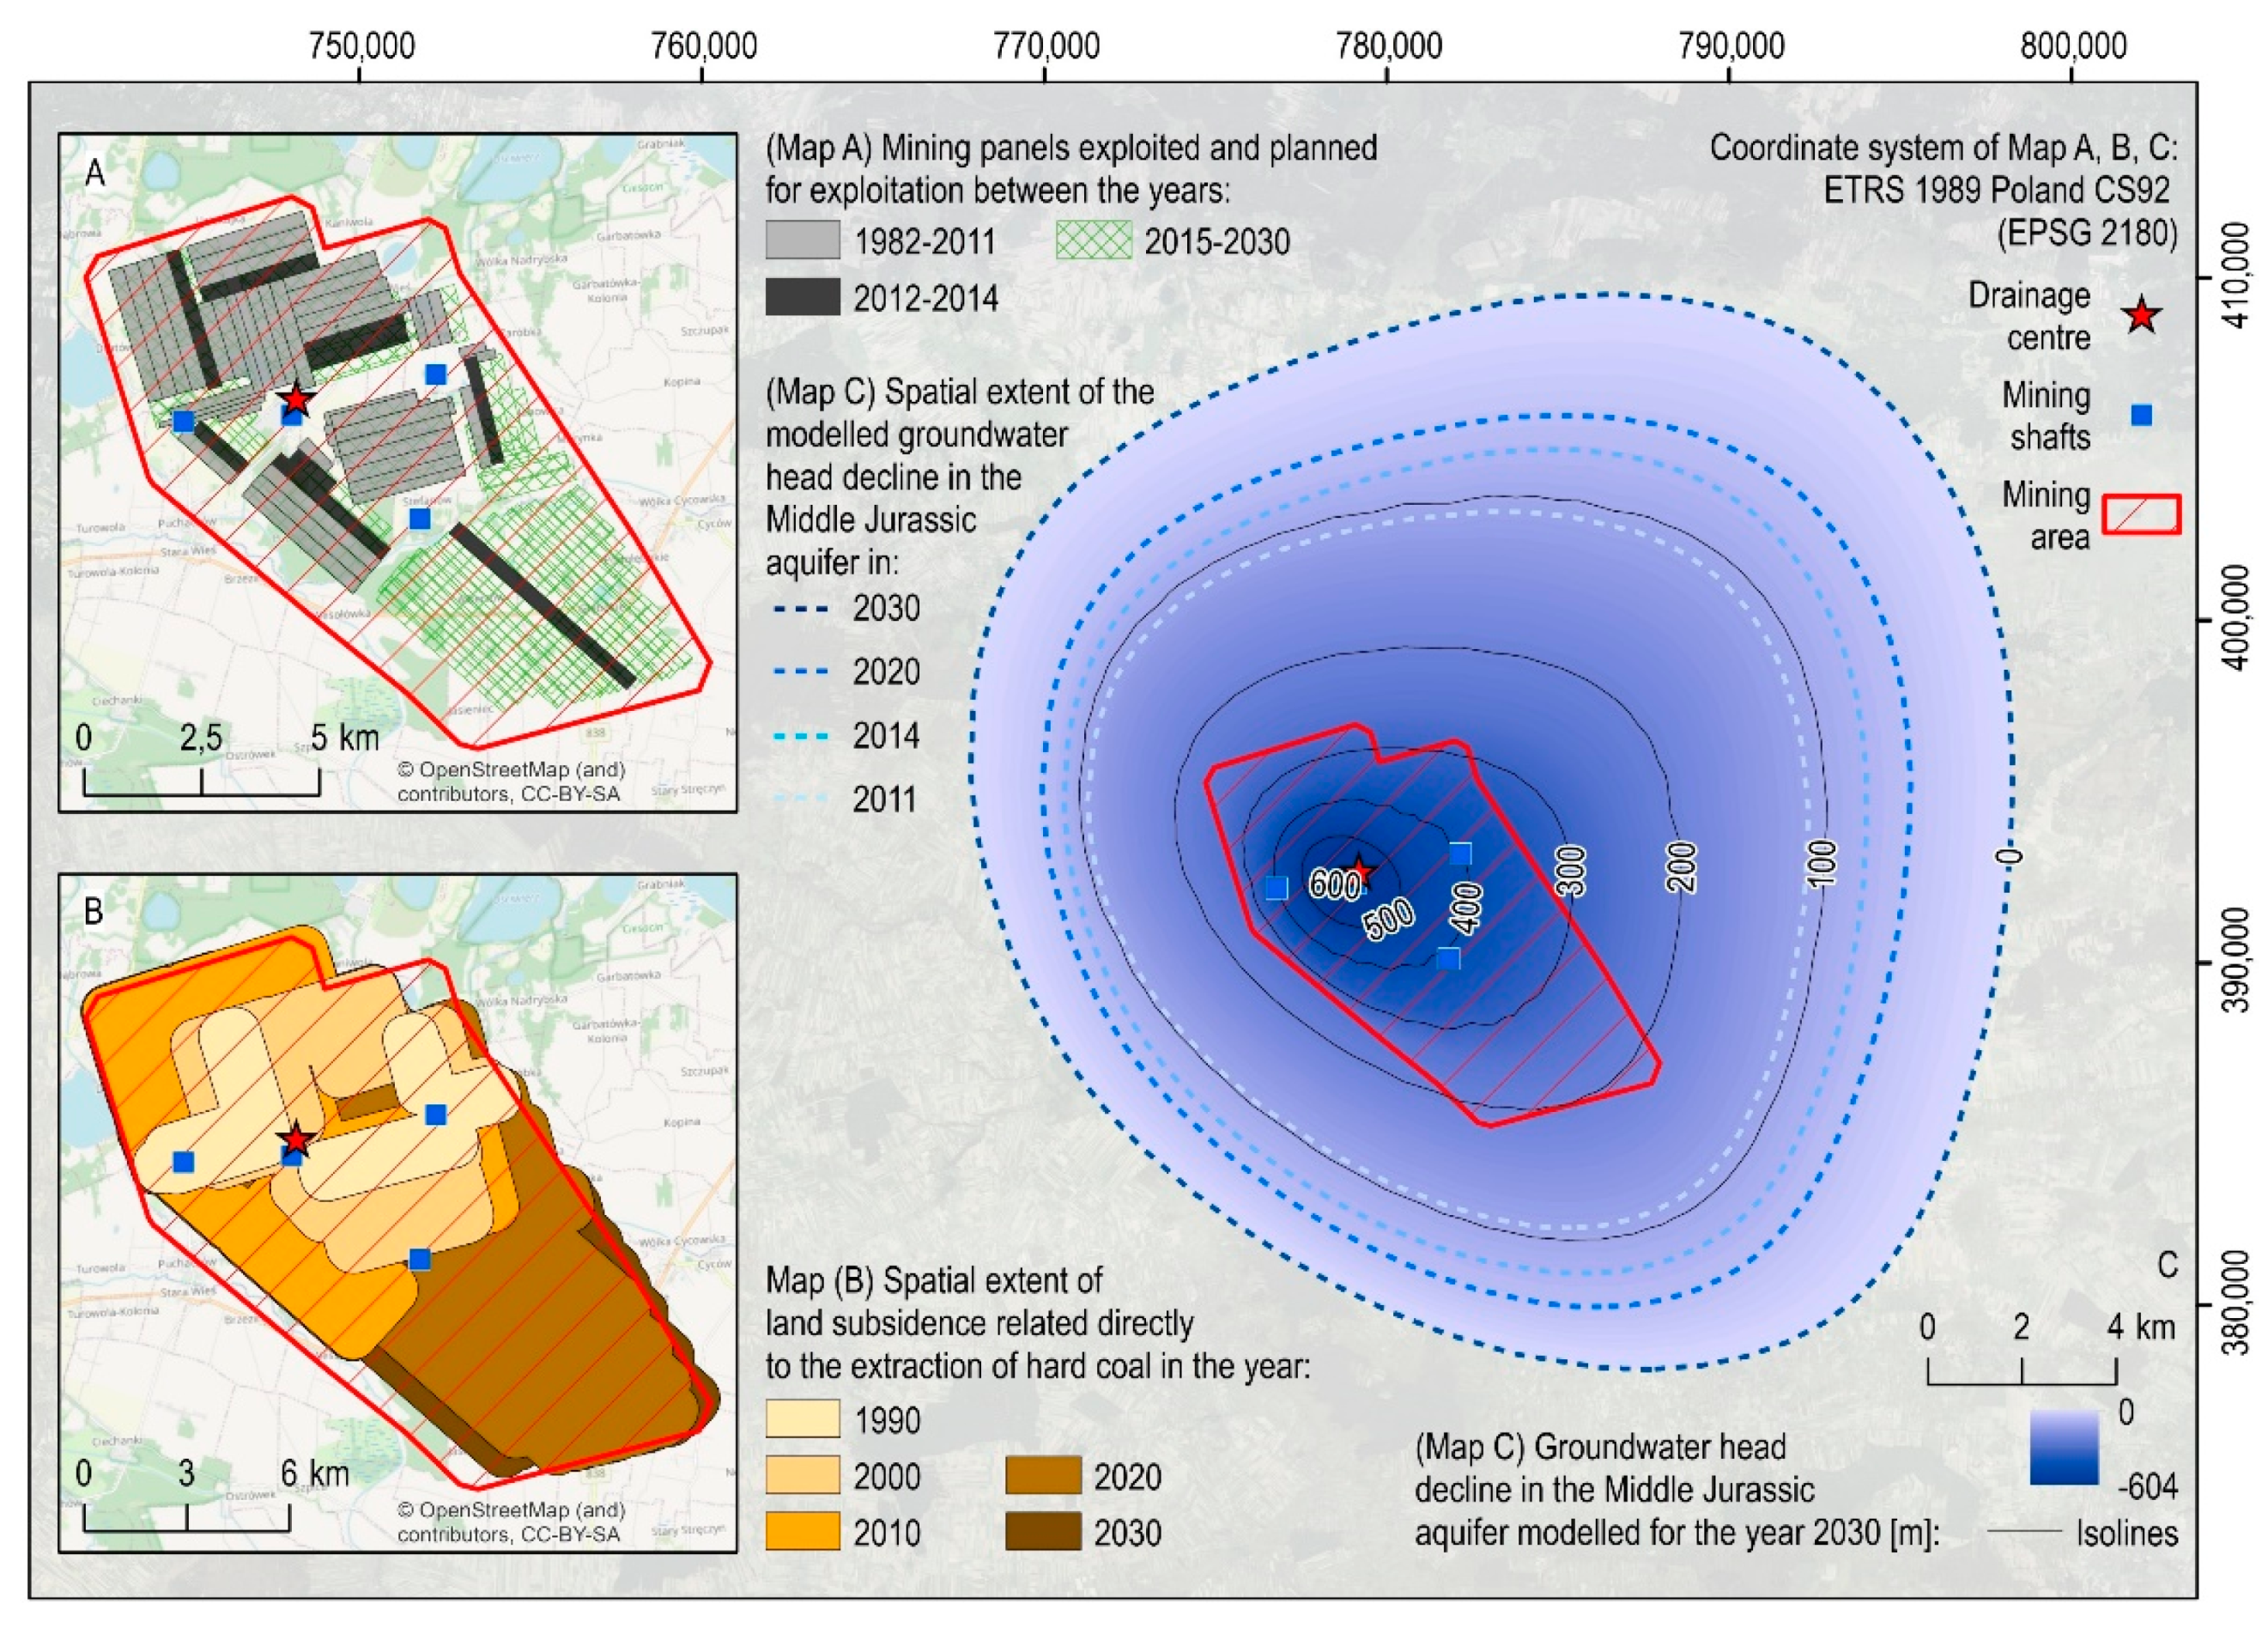
- The research area was determined based on the groundwater head change modelling results in the Main Jurassic aquifer due to mining drainage in 2030. As a result, the maximum predicted spatial extent of the depression cone in the main aquifer and thus the maximum forecasted spatial extent of land subsidence due to mining drainage could be included in the presented study.
- Mining drainage was assumed to cause direct compaction of the Middle Jurassic aquifer. Furthermore, since there is no direct hydraulic connection with the Middle Jurassic aquifer, the remaining aquifers do not undergo compaction due to changes in groundwater head due to mining-induced drainage. As a result, it is assumed that these aquifers do not directly contribute to the formation of drainage-related land subsidence.
- According to the assumptions of the Knothe-Budryk theory, the propagation of the Middle Jurassic aquifer deformation occurs through a homogeneous rock mass adjacent to this aquifer. As a result, the rock mass deformation process is revealed in discontinuous land surface deformation.
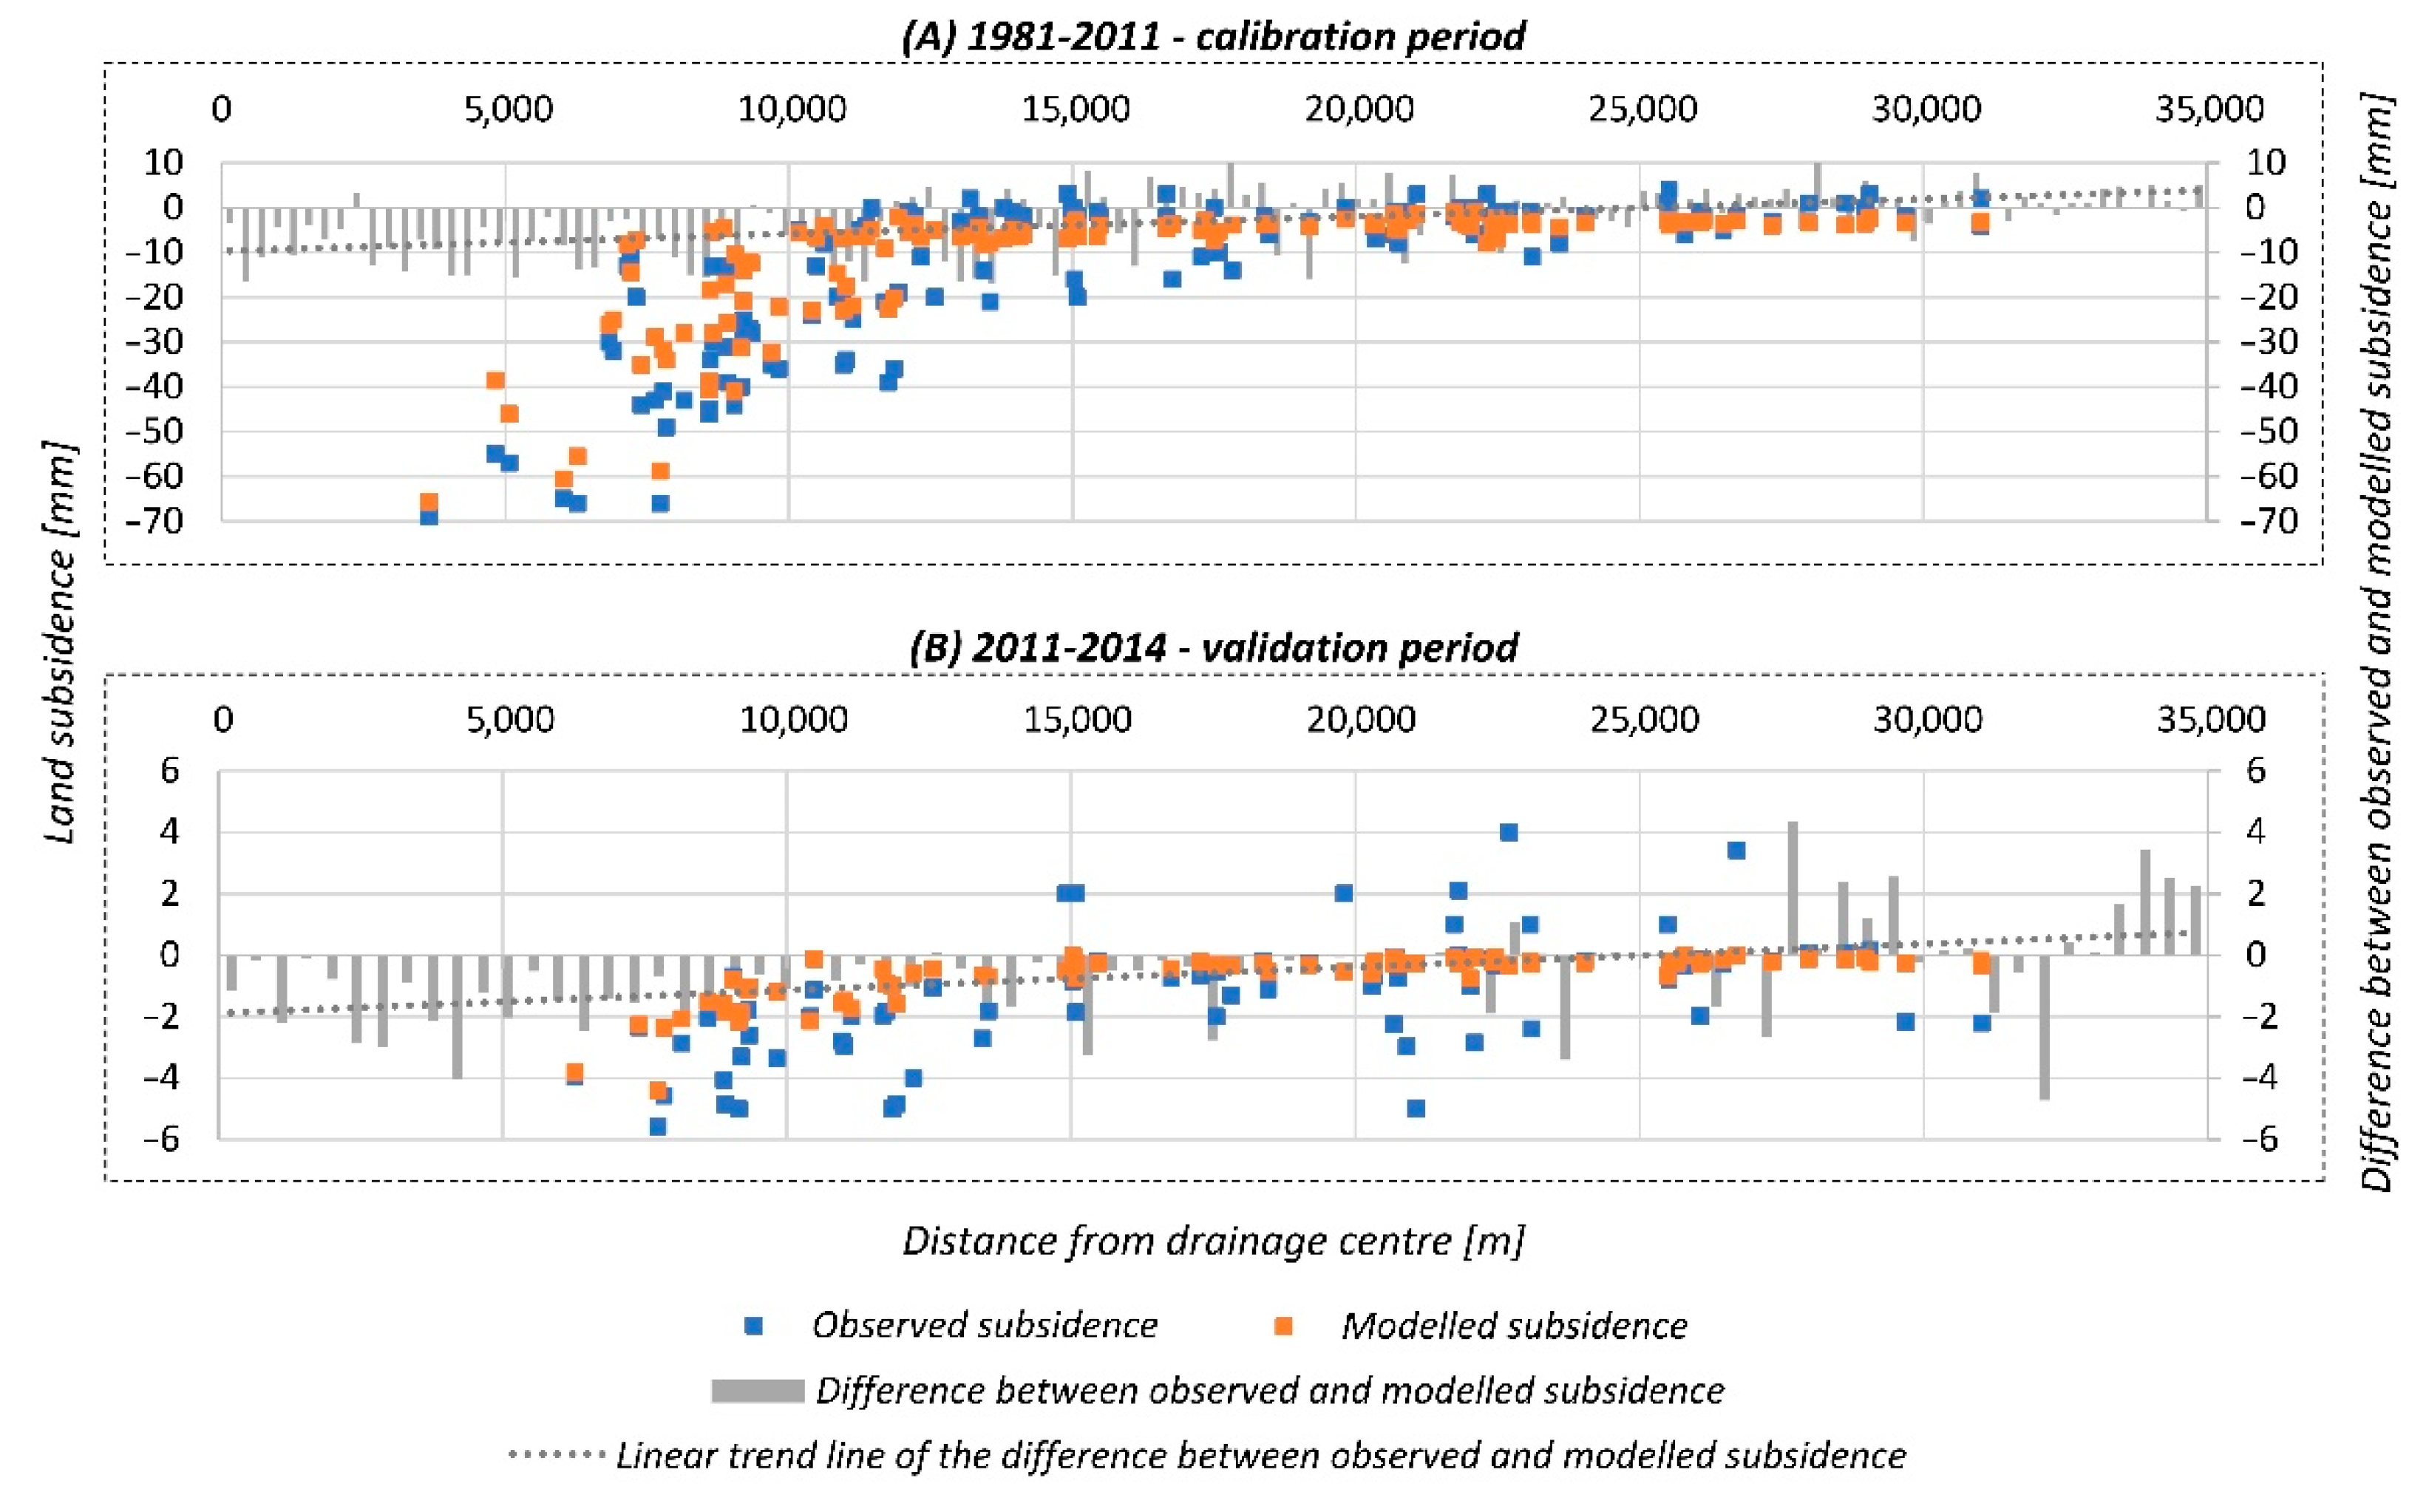
3.2.3. Model Calibration, Validation and Future Scenario
3.3. Assessment of the Impact of Land Subsidence Induced by Mining Drainage on Surface Water Reservoirs
4. Results and Discussion
4.1. Spatial and Temporal Distribution of Drainage-Related Land Subsidence
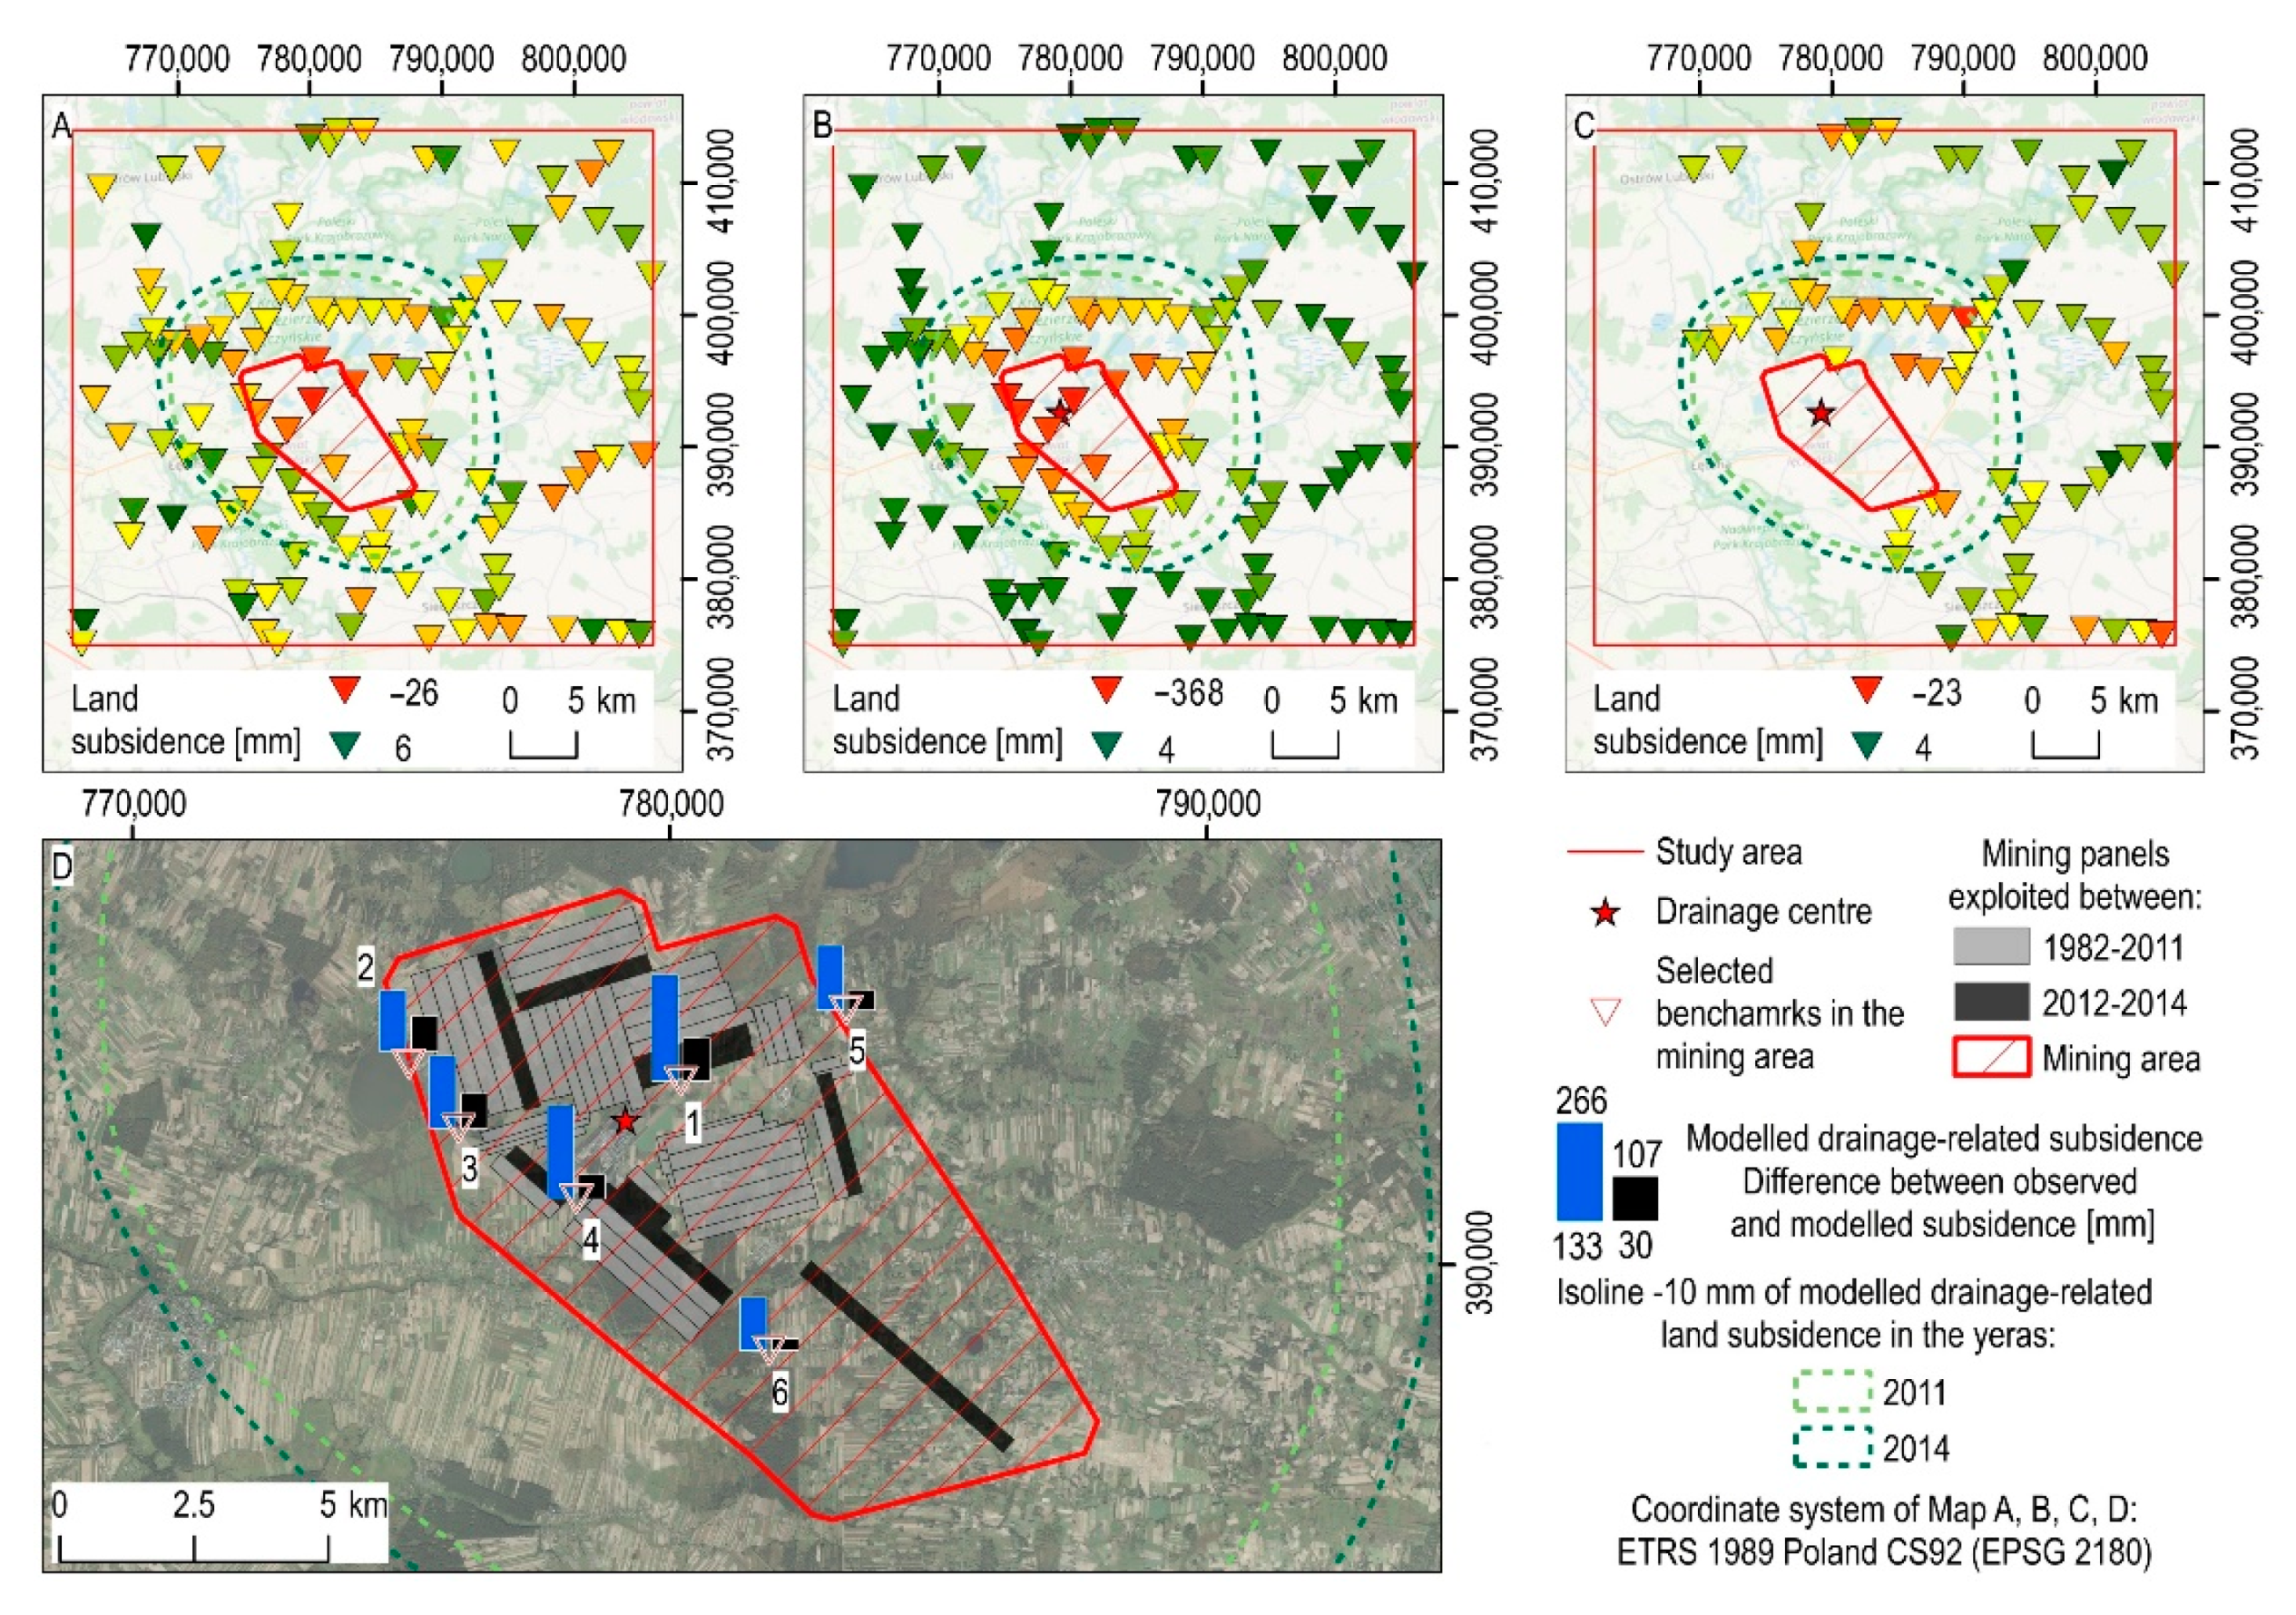
4.2. Separation of Direct Mining-Related Land Subsidence from the Imposing Influence of Drainage-Related Land Subsidence
4.3. Regional-Scale Impact of Land Subsidence Due to Mining-Induced Drainage on Surface Water Reservoirs
5. Conclusions
- In 2014 and 2030, the calculated values of land subsidence due to mining-induced drainage reached a maximum of 0.313 m and 0.369 m, respectively. The highest values of land subsidence due to mining drainage were calculated in the vicinity of shafts, representing the drainage center. Subsidence troughs have a similar shape but are asymmetrical. As a result, the maximum spatial extent of subsidence troughs is 15.2 km and 20.3 km, respectively, with the greatest extent to the northeast. Our findings show that the environmental impact of underground mining is much broader than direct land subsidence. What is more, the spatial extent of the drainage-related land subsidence significantly exceeds the mine’s boundaries, which cover approximately 80 km2. The total area of the subsidence trough caused by aquifer compaction was 483.1 km2 in 2014, and it is expected to increase to 770.3 km2 by 2030.
- The mining area had the greatest disparity between observed and modelled ground surface subsidence values. They reached a maximum of −107.5 mm, compared to the modelled value of −266.5 mm. This result demonstrates that the direct effects of coal exploitation, namely the propagation of the post-mining void and the results of drainage-related rock layer compaction, overlap in the central part of the mine. However, it was impossible to determine the extreme difference between land subsidence caused by hard coal extraction and aquifer system compaction due to a lack of measurement data distributed directly above the hard coal mining fields. Only at six benchmarks could observed land subsidence be compared to modelled drainage-related land subsidence in the area above mining panels. As a result, the obtained results should be regarded as understated and inadequate. However, due to a lack of data, we were unable to conduct a more thorough analysis.
- Due to the relatively low values, land subsidence caused by rock mass drainage will not cause significant disturbances in the course of surface streams in the study area. Only a few small sections of the selected streams will experience a change in the spatial course up to several hundred m long. These changes, however, will occur in areas that are already heavily flooded or are peat bogs. Furthermore, the research indicates that natural hydraulic drops of watercourses will be unaffected by land subsidence. As a result, rapid surface water runoff or flooding is not expected to occur. Therefore, surface water reservoirs in the research area, including particularly protected areas, will be unaffected by the negative effects of mining.
- Without requiring extensive calibration or an elaborate numerical subsidence model, the influence-function model provided land subsidence patterns based on the relationship between groundwater head decrease, the spatial distribution of the drained aquifer and subsequent subsidence, as well as geological data. In general, the obtained modelling results agree well with the empirical data. Nonetheless, the model has some inaccuracies, such as a slight underestimation of the value of land subsidence in the central drainage region and an overestimation of these values in the marginal part of the area of interest. Despite this, the research findings show that the method presented can be used effectively for land subsidence control and regulation plans and that it could be widely used for land subsidence estimation based solely on land subsidence and groundwater head data and geological recognition of the study area. As a result, our findings may pave the way for a more reliable assessment of the impact of underground mining on the aquifer system.
Author Contributions
Funding
Data Availability Statement
Acknowledgments
Conflicts of Interest
References
- Arfai, J.; Franke, D.; Lutz, R.; Reinhardt, L.; Kley, J.; Gaedicke, C. Rapid Quaternary Subsidence in the Northwestern German North Sea. Sci. Rep. 2018, 8, 11524. [Google Scholar] [CrossRef]
- Hamlyn, J.; Wright, T.; Walters, R.; Pagli, C.; Sansosti, E.; Casu, F.; Pepe, S.; Edmonds, M.; McCormick Kilbride, B.; Keir, D.; et al. What Causes Subsidence Following the 2011 Eruption at Nabro (Eritrea)? Prog. Earth Planet. Sci. 2018, 5, 31. [Google Scholar] [CrossRef]
- Imakiire, T.; Koarai, M. Wide-Area Land Subsidence Caused by “the 2011 off the Pacific Coast of Tohoku Earthquake”. Soils Found. 2012, 52, 842–855. [Google Scholar] [CrossRef]
- Shi, W.; Chen, G.; Meng, X.; Jiang, W.; Chong, Y.; Zhang, Y.; Dong, Y.; Zhang, M. Spatial-Temporal Evolution of Land Subsidence and Rebound over Xi’an in Western China Revealed by SBAS-InSAR Analysis. Remote Sens. 2020, 12, 3756. [Google Scholar] [CrossRef]
- Zhang, P.; Pan, Y.; Yu, Z.; Guan, X.; Wang, G.; An, J.; Lei, H. Ground Subsidence Characteristics Caused by Construction of Shallow-Buried Tunnel in a Sandy Soil Composite Formation. Arab. J. Geosci. 2020, 13, 901. [Google Scholar] [CrossRef]
- Gurevich, A.E.; Chilingarian, G.V. Subsidence over Producing Oil and Gas Fields, and Gas Leakage to the Surface. J. Pet. Sci. Eng. 1993, 9, 239–250. [Google Scholar] [CrossRef]
- Guzy, A.; Malinowska, A.A. State of the Art and Recent Advancements in the Modelling of Land Subsidence Induced by Groundwater Withdrawal. Water 2020, 12, 2051. [Google Scholar] [CrossRef]
- Pawluszek-Filipiak, K.; Borkowski, A. Monitoring Mining-Induced Subsidence by Integrating Differential Radar Interferometry and Persistent Scatterer Techniques. Eur. J. Remote Sens. 2020, 54 (Suppl. S1), 18–30. [Google Scholar] [CrossRef]
- Bagheri-Gavkosh, M.; Hosseini, S.M.; Ataie-Ashtiani, B.; Sohani, Y.; Ebrahimian, H.; Morovat, F.; Ashrafi, S. Land Subsidence: A Global Challenge. Sci. Total Environ. 2021, 778, 146193. [Google Scholar] [CrossRef]
- Margat, J.; van der Gun, J. Groundwater around the World; CRC Press: Boca Raton, FL, USA, 2013. [Google Scholar] [CrossRef]
- Gleeson, T.; Befus, K.M.; Jasechko, S.; Luijendijk, E.; Cardenas, M.B. The Global Volume and Distribution of Modern Groundwater. Nat. Geosci. 2016, 9, 161–164. [Google Scholar] [CrossRef]
- Gleeson, T.; Richter, B. How Much Groundwater Can We Pump and Protect Environmental Flows through Time? Presumptive Standards for Conjunctive Management of Aquifers and Rivers. River Res. Appl. 2018, 34, 83–92. [Google Scholar] [CrossRef]
- Giordano, M. Global Groundwater? Issues and Solutions. Annu. Rev. Environ. Resour. 2009, 34, 153–178. [Google Scholar] [CrossRef]
- De Graaf, I.E.M.; Gleeson, T.; van Beek, L.P.H.R.; Sutanudjaja, E.H.; Bierkens, M.F.P. Environmental Flow Limits to Global Groundwater Pumping. Nature 2019, 574, 90–94. [Google Scholar] [CrossRef] [PubMed]
- Galloway, D.L.; Burbey, T.J. Review: Regional Land Subsidence Accompanying Groundwater Extraction. Hydrogeol. J. 2011, 19, 1459–1486. [Google Scholar] [CrossRef]
- Figueroa-Miranda, S.; Tuxpan-Vargas, J.; Ramos-Leal, J.A.; Hernández-Madrigal, V.M.; Villaseñor-Reyes, C.I. Land Subsidence by Groundwater Over-Exploitation from Aquifers in Tectonic Valleys of Central Mexico: A Review. Eng. Geol. 2018, 246, 91–106. [Google Scholar] [CrossRef]
- Sun, H.; Grandstaff, D.; Shagam, R. Land Subsidence Due to Groundwater Withdrawal: Potential Damage of Subsidence and Sea Level Rise in Southern New Jersey, USA. Environ. Geol. 1999, 37, 290–296. [Google Scholar] [CrossRef]
- Feng, Q.-Y.; Liu, G.-J.; Meng, L.; Fu, E.-J.; Zhang, H.-R.; Zhang, K.-F. Land Subsidence Induced by Groundwater Extraction and Building Damage Level Assessment—A Case Study of Datun, China. J. China Univ. Min. Technol. 2008, 18, 556–560. [Google Scholar] [CrossRef]
- Jones, L.L.; Larson, J. Economics Effects of Land Subsidence Due to Excessive Groundwater Withdrawal in the Texas Gulf Coast Area; Texas Water Resources Institute: Forney, TX, USA, 1975. [Google Scholar]
- Holzer, T.L.; Johnson, A.I. Land Subsidence Caused by Ground Water Withdrawal in Urban Areas. GeoJournal 1985, 11, 245–255. [Google Scholar] [CrossRef]
- Hu, B.; Chen, X.; Zhang, X. Using Multisensor SAR Datasets to Monitor Land Subsidence in Los Angeles from 2003 to 2017. J. Sensors 2019, 2019, 9389820. [Google Scholar] [CrossRef]
- Jones, C.E.; An, K.; Blom, R.G.; Kent, J.D.; Ivins, E.R.; Bekaert, D. Anthropogenic and Geologic Influences on Subsidence in the Vicinity of New Orleans, Louisiana. J. Geophys. Res. Solid Earth 2016, 121, 3867–3887. [Google Scholar] [CrossRef]
- Burbey, T.J.; Zhang, M. Inverse Modeling Using PS-InSAR for Improved Calibration of Hydraulic Parameters and Prediction of Future Subsidence for Las Vegas Valley, USA. Proc. Int. Assoc. Hydrol. Sci. 2015, 372, 411–416. [Google Scholar] [CrossRef][Green Version]
- Castellazzi, P.; Arroyo-Domínguez, N.; Martel, R.; Calderhead, A.I.; Normand, J.C.L.; Gárfias, J.; Rivera, A. Land Subsidence in Major Cities of Central Mexico: Interpreting InSAR-Derived Land Subsidence Mapping with Hydrogeological Data. Int. J. Appl. Earth Obs. Geoinf. 2016, 47, 102–111. [Google Scholar] [CrossRef]
- Gambolati, G.; Teatini, P. Geomechanics of Subsurface Water Withdrawal and Injection. Water Resour. Res. 2015, 51, 3922–3955. [Google Scholar] [CrossRef]
- Pirouzi, A.; Eslami, A. Ground Subsidence in Plains around Tehran: Site Survey, Records Compilation and Analysis. Int. J. Geo-Engineering 2017, 8, 30. [Google Scholar] [CrossRef]
- Minderhoud, P.S.J.; Erkens, G.; Pham, V.H.; Bui, V.T.; Erban, L.; Kooi, H.; Stouthamer, E. Impacts of 25 Years of Groundwater Extraction on Subsidence in the Mekong Delta, Vietnam. Environ. Res. Lett. 2017, 12, 064006. [Google Scholar] [CrossRef] [PubMed]
- Xu, Y.S.; Shen, S.L.; Cai, Z.Y.; Zhou, G.Y. The State of Land Subsidence and Prediction Approaches Due to Groundwater Withdrawal in China. Nat. Hazards 2008, 45, 123–135. [Google Scholar] [CrossRef]
- Aobpaet, A.; Cuenca, M.C.; Hooper, A.; Trisirisatayawong, I. InSAR Time-Series Analysis of Land Subsidence in Bangkok, Thailand. Int. J. Remote Sens. 2013, 34, 2969–2982. [Google Scholar] [CrossRef]
- Li, F.; Gong, H.; Chen, B.; Zhou, C.; Guo, L. Analysis of the Contribution Rate of the Influencing Factors to Land Subsidence in the Eastern Beijing Plain, China Based on Extremely Randomized Trees (ERT) Method. Remote Sens. 2020, 12, 2963. [Google Scholar] [CrossRef]
- Yin, H.; Zhao, H.; Xie, D.; Sang, S.; Shi, Y.; Tian, M. Mechanism of Mine Water Inrush from Overlying Porous Aquifer in Quaternary: A Case Study in Xinhe Coal Mine of Shandong Province, China. Arab. J. Geosci. 2019, 12, 163. [Google Scholar] [CrossRef]
- Gao, G.; San, L.H.; Zhu, Y. Flood Inundation Analysis in Penang Island (Malaysia) Based on Insar Maps of Land Subsidence and Local Sea Level Scenarios. Water 2021, 13, 1518. [Google Scholar] [CrossRef]
- Ye, S.; Franceschini, A.; Zhang, Y.; Janna, C.; Gong, X.; Yu, J.; Teatini, P. A Novel Approach to Model Earth Fissure Caused by Extensive Aquifer Exploitation and Its Application to the Wuxi Case, China. Water Resour. Res. 2018, 54, 2249–2269. [Google Scholar] [CrossRef]
- Abidin, H.Z.; Andreas, H.; Gumilar, I.; Brinkman, J.J. Study on the Risk and Impacts of Land Subsidence in Jakarta. Proc. Int. Assoc. Hydrol. Sci. 2015, 372, 115–120. [Google Scholar] [CrossRef]
- Allison, M.; Yuill, B.; Törnqvist, T.; Amelung, F.; Dixon, T.; Erkens, G.; Stuurman, R.; Jones, C.; Milne, G.; Steckler, M.; et al. Global Risks and Research Priorities for Coastal Subsidence. Eos 2016, 97. [Google Scholar] [CrossRef]
- Gazzola, L.; Ferronato, G.; Frigo, M.; Janna, C.; Teatini, P.; Zoccarato, C.; Antonelli, M.; Corradi, A.; Dacome, M.C.; Mantica, S. A Novel Methodological Approach for Land Subsidence Prediction through Data Assimilation Techniques. Comput. Geosci. 2021, 1–20. [Google Scholar] [CrossRef]
- Bonì, R.; Herrera, G.; Meisina, C.; Notti, D.; Béjar-Pizarro, M.; Zucca, F.; González, P.J.; Palano, M.; Tomás, R.; Fernández, J.; et al. Twenty-Year Advanced DInSAR Analysis of Severe Land Subsidence: The Alto Guadalentín Basin (Spain) Case Study. Eng. Geol. 2015, 198, 40–52. [Google Scholar] [CrossRef]
- Adams, R.; Younger, P.L. A Strategy for Modeling Ground Water Rebound in Abandoned Deep Mine Systems. Ground Water 2001, 39, 249–261. [Google Scholar] [CrossRef]
- Rapantova, N.; Grmela, A.; Vojtek, D.; Halir, J.; Michalek, B. Ground Water Flow Modelling Applications in Mining Hydrogeology. Mine Water Environ. 2007, 26, 264–270. [Google Scholar] [CrossRef]
- Prilendi, D. Underground Mine Dewatering System Below +500 MASL South Ciurug. In Mine Planning and Equipment Selection; Springer: Berlin/Heidelberg, Germany, 2014; pp. 189–196. [Google Scholar] [CrossRef]
- Kratzsch, I.H. Mining Subsidence Engineering. Environ. Geol. Water Sci. 1986, 8, 133–136. [Google Scholar] [CrossRef]
- Atlin, C.; Gibson, R. Lasting Regional Gains from Non-Renewable Resource Extraction: The Role of Sustainability-Based Cumulative Effects Assessment and Regional Planning for Mining Development in Canada. Extr. Ind. Soc. 2017, 4, 36–52. [Google Scholar] [CrossRef]
- Tolvanen, A.; Eilu, P.; Juutinen, A.; Kangas, K.; Kivinen, M.; Markovaara-Koivisto, M.; Naskali, A.; Salokannel, V.; Tuulentie, S.; Similä, J. Mining in the Arctic Environment—A Review from Ecological, Socioeconomic and Legal Perspectives. J. Environ. Manag. 2019, 233, 832–844. [Google Scholar] [CrossRef]
- Tepanosyan, G.; Sahakyan, L.; Belyaeva, O.; Asmaryan, S.; Saghatelyan, A. Continuous Impact of Mining Activities on Soil Heavy Metals Levels and Human Health. Sci. Total Environ. 2018, 639, 900–909. [Google Scholar] [CrossRef]
- Levin, L.A.; Amon, D.J.; Lily, H. Challenges to the Sustainability of Deep-Seabed Mining. Nat. Sustain. 2020, 3, 784–794. [Google Scholar] [CrossRef]
- Whittaker, B.N.; Reddish, D.J. Subsidence: Occurrence, Prediction, and Control; Elsevier: Amsterdam, The Netherlands, 1989. [Google Scholar]
- Milczarek, W.; Kopeć, A.; Głąbicki, D.; Bugajska, N. Induced Seismic Events—Distribution of Ground Surface Displacements Based on InSAR Methods and Mogi and Yang Models. Remote Sens. 2021, 13, 1451. [Google Scholar] [CrossRef]
- Milczarek, W.; Głowacki, T. Secondary Surface Deformations of Former Mining Areas. Min. Sci. 2013, 20, 39–55. [Google Scholar] [CrossRef]
- Blachowski, J.; Kopec, A.; Milczarek, W.; Owczarz, K. Evolution of Secondary Deformations Captured by Satellite Radar Interferometry: Case Study of an Abandoned Coal Basin in SW Poland. Sustainability 2019, 11, 884. [Google Scholar] [CrossRef]
- Grzempowski, P.; Badura, J.; Milczarek, W.; Blachowski, J.; Glowacki, T.; Zajac, M. Determination of the Long-Term Ground Surface Displacements Using a PSI Technique-Case Study on Wroclaw (Poland). Appl. Sci. 2020, 10, 3343. [Google Scholar] [CrossRef]
- Pawluszek-Filipiak, K.; Borkowski, A. Integration of DInSAR and SBAS Techniques to Determine Mining-Related Deformations Using Sentinel-1 Data: The Case Study of Rydultowy Mine in Poland. Remote Sens. 2020, 12, 242. [Google Scholar] [CrossRef]
- Yang, Q.; Ke, Y.; Zhang, D.; Chen, B.; Gong, H.; Lv, M.; Zhu, L.; Li, X. Multi-Scale Analysis of the Relationship between Land Subsidence and Buildings: A Case Study in an Eastern Beijing Urban Area Using the PS-InSAR Technique. Remote Sens. 2018, 10, 1006. [Google Scholar] [CrossRef]
- Unlu, T.; Akcin, H.; Yilmaz, O. An Integrated Approach for the Prediction of Subsidence for Coal Mining Basins. Eng. Geol. 2013, 166, 186–203. [Google Scholar] [CrossRef]
- Cai, Y.; Li, X.; Xiao, W.; Zhang, W. Simulation of Mining-Induced Ground Damage Using Orthogonal Experiments to Determine Key Parameters of Super-Large Coalface: A Case Study in Shendong Coalfield in China. Appl. Sci. 2020, 10, 2258. [Google Scholar] [CrossRef]
- Wang, Z.; Zhang, J.; Yu, Y.; Liu, J.; Liu, W.; Jiang, N.; Guo, D. Monitoring, Analyzing, and Modeling for Single Subsidence Basin in Coal Mining Areas Based on SAR Interferometry with L-Band Data. Sci. Program. 2021, 2021, 6662097. [Google Scholar] [CrossRef]
- Zheng, L.; Zhu, L.; Wang, W.; Guo, L.; Chen, B. Land Subsidence Related to Coal Mining in China Revealed by L-Band Insar Analysis. Int. J. Environ. Res. Public Health 2020, 17, 1170. [Google Scholar] [CrossRef]
- Meng, F.F.; Piao, C.D.; Shi, B.; Sasaoka, T.; Shimada, H. Calculation Model of Overburden Subsidence in Mined-out Area Based on Brillouin Optical Time-Domain Reflectometer Technology. Int. J. Rock Mech. Min. Sci. 2021, 138. [Google Scholar] [CrossRef]
- Guo, Q.; Meng, X.; Li, Y.; Lv, X.; Liu, C. A Prediction Model for the Surface Residual Subsidence in an Abandoned Goaf for Sustainable Development of Resource-Exhausted Cities. J. Clean. Prod. 2021, 279, 123803. [Google Scholar] [CrossRef]
- Lizárraga, J.J.; Buscarnera, G. A Geospatial Model for the Analysis of Time-Dependent Land Subsidence Induced by Reservoir Depletion. Int. J. Rock Mech. Min. Sci. 2020, 129, 104272. [Google Scholar] [CrossRef]
- Wang, B.; Xu, J.; Xuan, D. Time Function Model of Dynamic Surface Subsidence Assessment of Grout-Injected Overburden of a Coal Mine. Int. J. Rock Mech. Min. Sci. 2018, 104, 1–8. [Google Scholar] [CrossRef]
- Abdikan, S.; Arıkan, M.; Sanli, F.B.; Cakir, Z. Monitoring of Coal Mining Subsidence in Peri-Urban Area of Zonguldak City (NW Turkey) with Persistent Scatterer Interferometry Using ALOS-PALSAR. Environ. Earth Sci. 2014, 71, 4081–4089. [Google Scholar] [CrossRef]
- Tan, X.; Song, B.; Bo, H.; Li, Y.; Wang, M.; Lu, G. Extraction of Irregularly Shaped Coal Mining Area Induced Ground Subsidence Prediction Based on Probability Integral Method. Appl. Sci. 2020, 10, 6623. [Google Scholar] [CrossRef]
- Zhang, L.; Cheng, H.; Yao, Z.; Wang, X. Application of the Improved Knothe Time Function Model in the Prediction of Ground Mining Subsidence: A Case Study from Heze City, Shandong Province, China. Appl. Sci. 2020, 10, 3147. [Google Scholar] [CrossRef]
- Malinowska, A.; Hejmanowski, R.; Witkowski, W.T.; Guzy, A. Mapping of Slow Vertical Ground Movement Caused by Salt Cavern Convergence with Sentinel-1 Tops Data. Arch. Min. Sci. 2018, 63. [Google Scholar] [CrossRef]
- Xu, X.; Ma, C.; Lian, D.; Zhao, D. Inversion and Analysis of Mining Subsidence by Integrating DInSAR, Offset Tracking, and PIM Technology. J. Sensors 2020, 2020, 4136837. [Google Scholar] [CrossRef]
- Caro Cuenca, M.; Hooper, A.J.; Hanssen, R.F. Surface Deformation Induced by Water Influx in the Abandoned Coal Mines in Limburg, The Netherlands Observed by Satellite Radar Interferometry. J. Appl. Geophys. 2013, 88, 1–11. [Google Scholar] [CrossRef]
- Guzy, A.; Malinowska, A.A.A. Assessment of the Impact of the Spatial Extent of Land Subsidence and Aquifer System Drainage Induced by Underground Mining. Sustainability 2020, 12, 7871. [Google Scholar] [CrossRef]
- Guzy, A.; Ahmed, A.W.; Malinowska, A. Spatio-Temporal Distribution of Land Subsidence and Water Drop Caused by Underground Exploitation of Mineral Resources. In Proceedings of the International Multidisciplinary Scientific GeoConference Surveying Geology and Mining Ecology Management (SGEM), Albena, Bulgaria, 30 June–9 July 2018. [Google Scholar] [CrossRef]
- Teatini, P.; Ferronato, M.; Gambolati, G.; Gonella, M. Groundwater Pumping and Land Subsidence in the Emilia-Romagna Coastland, Italy: Modeling the Past Occurrence and the Future Trend. Water Resour. Res. 2006, 42. [Google Scholar] [CrossRef]
- Malinowska, A.A.; Witkowski, W.T.; Guzy, A.; Hejmanowski, R. Satellite-Based Monitoring and Modeling of Ground Movements Caused by Water Rebound. Remote Sens. 2020, 12, 1786. [Google Scholar] [CrossRef]
- Hejmanowski, R.; Witkowski, W.T. Suitability Assessment of Artificial Neural Network to Approximate Surface Subsidence Due to Rock Mass Drainage. J. Sustain. Min. 2015, 14, 101–107. [Google Scholar] [CrossRef]
- Faunt, C.C.; Hanson, R.T.; Martin, P.; Schmid, W. Planned Updates and Refinements to the Central Valley Hydrologic Model, with an Emphasis on Improving the Simulation of Land Subsidence in the San Joaquin Valley. In Proceedings of the 2011 World Environmental and Water Resources Congress, Palm Springs, CA, USA, 22–26 May 2011; pp. 864–870. [Google Scholar] [CrossRef]
- Witkowski, W.T.; Hejmanowski, R. Software for Estimation of Stochastic Model Parameters for a Compacting Reservoir. Appl. Sci. 2020, 10, 3287. [Google Scholar] [CrossRef]
- Goorabi, A.; Karimi, M.; Yamani, M.; Perissin, D. Land Subsidence in Isfahan Metropolitan and Its Relationship with Geological and Geomorphological Settings Revealed by Sentinel-1A InSAR Observations. J. Arid Environ. 2020, 181, 104238. [Google Scholar] [CrossRef]
- Wang, D.; Li, M.; Chen, J.; Xia, X.; Zhang, Y. Numerical Study on Groundwater Drawdown and Deformation Responses of Multi-Layer Strata to Pumping in a Confined Aquifer. J. Shanghai Jiaotong Univ. 2019, 24, 287–293. [Google Scholar] [CrossRef]
- Buckley, S.M. Land Subsidence in Houston, Texas, Measured by Radar Interferometry and Constrained by Extensometers. J. Geophys. Res. 2003, 108, 2542. [Google Scholar] [CrossRef]
- Wang, G.Y.; You, G.; Shi, B.; Yu, J.; Tuck, M. Long-Term Land Subsidence and Strata Compression in Changzhou, China. Eng. Geol. 2009, 104, 109–118. [Google Scholar] [CrossRef]
- Liu, S.P.; Shi, B.; Gu, K.; Zhang, C.C.; Yang, J.L.; Zhang, S.; Yang, P. Land Subsidence Monitoring in Sinking Coastal Areas Using Distributed Fiber Optic Sensing: A Case Study. Nat. Hazards 2020, 103, 3043–3061. [Google Scholar] [CrossRef]
- Barrias, A.; Casas, J.R.; Villalba, S. A Review of Distributed Optical Fiber Sensors for Civil Engineering Applications. Sensors 2016, 16, 748. [Google Scholar] [CrossRef]
- Yang, Z.F.; Li, Z.W.; Zhu, J.J.; Hu, J.; Wang, Y.J.; Chen, G.L. Analysing the Law of Dynamic Subsidence in Mining Area by Fusing Insar and Leveling Measurements. ISPRS Int. Arch. Photogramm. Remote Sens. Spat. Inf. Sci. 2013, XL-7/W1, 163–166. [Google Scholar] [CrossRef]
- Kortas, G.; Maj, A.; Drogowski, J. Land Subsidence Caused by Solution Mining in the Mogilno Salt Dome. Geol. Geophys. Environ. 2013, 39, 175. [Google Scholar] [CrossRef][Green Version]
- Tao, T.; Liu, J.; Qu, X.; Gao, F. Real-Time Monitoring Rapid Ground Subsidence Using GNSS and Vondrak Filter. Acta Geophys. 2019, 67, 133–140. [Google Scholar] [CrossRef]
- Gao, J.-x.; Hu, H. Advanced GNSS Technology of Mining Deformation Monitoring. Procedia Earth Planet. Sci. 2009, 1, 1081–1088. [Google Scholar] [CrossRef]
- Biggs, J.; Wright, T.J. How Satellite InSAR Has Grown from Opportunistic Science to Routine Monitoring over the Last Decade. Nat. Commun. 2020, 11, 3863. [Google Scholar] [CrossRef]
- Zhou, C.; Gong, H.; Chen, B.; Li, J.; Gao, M.; Zhu, F.; Chen, W.; Liang, Y. InSAR Time-Series Analysis of Land Subsidence under Different Land Use Types in the Eastern Beijing Plain, China. Remote Sens. 2017, 9, 380. [Google Scholar] [CrossRef]
- Yixuan, L.; Zhihai, G.; Junkai, Y.; Zhenying, D.; Jiuli, C. Subsidence Extraction Model of Mining Area with Probability Integral Method Based on SBAS Technology. Coal Sci. Technol. 2017, 45, 156–161. [Google Scholar]
- Bateson, L.; Cigna, F.; Boon, D.; Sowter, A. The Application of the Intermittent SBAS (ISBAS) InSAR Method to the South Wales Coalfield, UK. Int. J. Appl. Earth Obs. Geoinf. 2015, 34, 249–257. [Google Scholar] [CrossRef]
- Zhimin, L.; Yongsheng, L.; Jingfa, Z.; Yi, L.; Bin, L. An Analysid of Surface Deformation in Changzhi Mining Area Using SBAS-InSAR. Remote Sens. Land Resour. 2014, 26, 37–42. [Google Scholar] [CrossRef]
- Zhu, Y.; Ding, X.; Li, Z.; Luo, Y. Monitoring of Surface Subsidence of the Mining Area Based on SBAS. J. Comput. 2014, 9, 1177–1184. [Google Scholar] [CrossRef]
- Zheng, M.; Deng, K.; Fan, H.; Du, S. Monitoring and Analysis of Surface Deformation in Mining Area Based on InSAR and GRACE. Remote Sens. 2018, 10, 1392. [Google Scholar] [CrossRef]
- Milczarek, W.; Blachowski, J.; Grzempowski, P. Application of PSInSAR for Assessment of Surface Deformations in Post-Mining Area—Case Study of the Former Walbrzych Hard Coal Basin (SW Poland). Acta Geodyn. Geomater. 2017, 14, 41–52. [Google Scholar] [CrossRef]
- Wang, H.; Feng, G.; Xu, B.; Yu, Y.; Li, Z.; Du, Y.; Zhu, J. Deriving Spatio-Temporal Development of Ground Subsidence Due to Subway Construction and Operation in Delta Regions with PS-InSAR Data: A Case Study in Guangzhou, China. Remote Sens. 2017, 9, 1004. [Google Scholar] [CrossRef]
- Tien Bui, D.; Long, N.Q.; Bui, X.-N.; Nguyen, V.-N.; Van Pham, C.; Van Le, C.; Ngo, P.-T.T.; Bui, D.T.; Kristoffersen, B. Lightweight Unmanned Aerial Vehicle and Structure-from-Motion Photogrammetry for Generating Digital Surface Model for Open-Pit Coal Mine Area and Its Accuracy Assessment. In Advances and Applications in Geospatial Technology and Earth Resources; Springer: Berlin/Heidelberg, Germany, 2018; pp. 17–33. [Google Scholar] [CrossRef]
- Puniach, E.; Gruszczyński, W.; Ćwiąkała, P.; Matwij, W. Application of UAV-Based Orthomosaics for Determination of Horizontal Displacement Caused by Underground Mining. ISPRS J. Photogramm. Remote Sens. 2021, 174, 282–303. [Google Scholar] [CrossRef]
- Matwij, W.; Gruszczyński, W.; Puniach, E.; Ćwiąkała, P. Determination of Underground Mining-Induced Displacement Field Using Multi-Temporal TLS Point Cloud Registration. Measurement 2021, 180, 109482. [Google Scholar] [CrossRef]
- Ćwiakała, P.; Gruszczyński, W.; Stoch, T.; Puniach, E.; Mrocheń, D.; Matwij, W.; Matwij, K.; Nedzka, M.; Sopata, P.; Wójcik, A. UAV Applications for Determination of Land Deformations Caused by Underground Mining. Remote Sens. 2020, 12, 1733. [Google Scholar] [CrossRef]
- Malinowska, A.A.; Witkowski, W.T.; Hejmanowski, R.; Chang, L.; van Leijen, F.J.; Hanssen, R.F. Sinkhole Occurrence Monitoring over Shallow Abandoned Coal Mines with Satellite-Based Persistent Scatterer Interferometry. Eng. Geol. 2019, 262, 105336. [Google Scholar] [CrossRef]
- Hejmanowski, R.; Malinowska, A.A.; Witkowski, W.T.; Guzy, A. An Analysis Applying InSAR of Subsidence Caused by Nearby Mining-Induced Earthquakes. Geosciences 2019, 9, 490. [Google Scholar] [CrossRef]
- Malinowska, A.A.; Witkowski, W.T.; Guzy, A.; Hejmanowski, R. Mapping Ground Movements Caused by Mining-Induced Earthquakes Applying Satellite Radar Interferometry. Eng. Geol. 2018, 246, 402–411. [Google Scholar] [CrossRef]
- Ilieva, M.; Rudziński, Ł.; Pawłuszek-Filipiak, K.; Lizurek, G.; Kudłacik, I.; Tondaś, D.; Olszewska, D. Combined Study of a Significant Mine Collapse Based on Seismological and Geodetic Data-29 January 2019, Rudna Mine, Poland. Remote Sens. 2020, 12, 1570. [Google Scholar] [CrossRef]
- Owczarz, K.; Blachowski, J. Analysis of the Geometry of Surface Deformations Caused by Induced Tremors in the Area of Underground Copper Mining. ISPRS Ann. Photogramm. Remote. Sens. Spat. Inf. Sci. 2020, 5, 149–156. [Google Scholar] [CrossRef]
- Sopata, P.; Stoch, T.; Wójcik, A.; Mroche, D. Land Surface Subsidence Due to Mining-Induced Tremors in the Upper Silesian Coal Basin (Poland)—Case Study. Remote Sens. 2020, 12, 3923. [Google Scholar] [CrossRef]
- Małkowski, P.; Niedbalski, Z.; Sojka, W. The Assessment of the Optimal Time Window for Prediction of Seismic Hazard for Longwall Coal Mining: The Case Study. Acta Geophys. 2021, 69, 691–699. [Google Scholar] [CrossRef]
- Ghabraie, B.; Ghabraie, K.; Ren, G.; Smith, J.V. Numerical Modelling of Multistage Caving Processes: Insights from Multi-Seam Longwall Mining-Induced Subsidence. Int. J. Numer. Anal. Methods Geomech. 2017, 41, 959–975. [Google Scholar] [CrossRef]
- Zhang, K.; Bai, L.; Wang, P.; Zhu, Z. Field Measurement and Numerical Modelling Study on Mining-Induced Subsidence in a Typical Underground Mining Area of Northwestern China. Adv. Civ. Eng. 2021, 2021, 5599925. [Google Scholar] [CrossRef]
- Polanin, P.; Kowalski, A.; Walentek, A. Numerical Simulation of Subsidence Caused by Roadway System. Arch. Min. Sci. 2019, 64, 385–397. [Google Scholar] [CrossRef]
- Chrzanowski, A.; Monahan, C.; Roulston, B.; Szostak-Chrzanowski, A. Integrated Monitoring and Modelling of Ground Subsidence in Potash Mines. Int. J. Rock Mech. Min. Sci. Geomech. Abstr. 1997, 34, 621. [Google Scholar] [CrossRef]
- Guo, W.; Xu, F. Numerical Simulation of Overburden and Surface Movements for Wongawilli Strip Pillar Mining. Int. J. Min. Sci. Technol. 2016, 26, 71–76. [Google Scholar] [CrossRef]
- Szostak-Chrzanowski, A.; Chrzanowski, A.; Ortiz, E. Modeling of Ground Subsidence in Oil Fields. Tech. Sci. Pap. Rep. 2006, 9, 133–146. [Google Scholar]
- Hejmanowski, R.; Malinowska, A.A. Wykorzystanie Metody Odwrotnej w Estymacji Osiadań Powierzchni Terenu Dla Złóż Soli. Gospod. Surowcami Miner. Miner. Resour. Manag. 2017, 33, 179–200. [Google Scholar] [CrossRef][Green Version]
- Hejmanowski, R.; Malinowska, A. Evaluation of Reliability of Subsidence Prediction Based on Spatial Statistical Analysis. Int. J. Rock Mech. Min. Sci. 2009, 46, 432–438. [Google Scholar] [CrossRef]
- Malinowska, A.; Hejmanowski, R.; Dai, H. yang. Ground Movements Modeling Applying Adjusted Influence Function. Int. J. Min. Sci. Technol. 2020, 30, 243–249. [Google Scholar] [CrossRef]
- Vušović, N.; Vlahović, M.; Kržanović, D. Stochastic Method for Prediction of Subsidence Due to the Underground Coal Mining Integrated with GIS, a Case Study in Serbia. Environ. Earth Sci. 2021, 80, 67. [Google Scholar] [CrossRef]
- Kwinta, A.; Gradka, R. Analysis of the Damage Influence Range Generated by Underground Mining. Int. J. Rock Mech. Min. Sci. 2020, 128, 104263. [Google Scholar] [CrossRef]
- Chu, H.J.; Ali, M.Z.; Tatas; Burbey, T.J. Development of Spatially Varying Groundwater-Drawdown Functions for Land Subsidence Estimation. J. Hydrol. Reg. Stud. 2021, 35, 100808. [Google Scholar] [CrossRef]
- Luo, Y. An Improved Influence Function Method for Predicting Subsidence Caused by Longwall Mining Operations in Inclined Coal Seams. Int. J. Coal Sci. Technol. 2015, 2, 163–169. [Google Scholar] [CrossRef]
- Saeidi, A.; Deck, O.; Seifaddini, M.; Heib, M.A.L.; Verdel, T. An Improved Methodology for Applying the Influence Function for Subsidence Hazard Prediction. Georisk 2021, 1–13. [Google Scholar] [CrossRef]
- Cheng, J.; Liu, F.; Li, S. Model for the Prediction of Subsurface Strata Movement Due to Underground Mining. J. Geophys. Eng. 2017, 14, 1608–1623. [Google Scholar] [CrossRef]
- Suh, J. An Overview of GIS-Based Assessment and Mapping of Mining-Induced Subsidence. Appl. Sci. 2020, 10, 7845. [Google Scholar] [CrossRef]
- Park, I.; Lee, J.; Saro, L. Ensemble of Ground Subsidence Hazard Maps Using Fuzzy Logic. Cent. Eur. J. Geosci. 2014, 6, 207–218. [Google Scholar] [CrossRef]
- Blachowski, J.; Milczarek, W. Analysis of Surface Changes in the Wałbrzych Hard Coal Mining Grounds (Sw Poland) between 1886 and 2009. Geol. Q. 2014, 58, 353–368. [Google Scholar] [CrossRef]
- Raucoules, D.; Maisons, C.; Carnec, C.; Le Mouelic, S.; King, C.; Hosford, S. Monitoring of Slow Ground Deformation by ERS Radar Interferometry on the Vauvert Salt Mine (France): Comparison with Ground-Based Measurement. Remote Sens. Environ. 2003, 88, 468–478. [Google Scholar] [CrossRef]
- Blachowski, J. Application of GIS Spatial Regression Methods in Assessment of Land Subsidence in Complicated Mining Conditions: Case Study of the Walbrzych Coal Mine (SW Poland). Nat. Hazards 2016, 84, 997–1014. [Google Scholar] [CrossRef]
- Lee, S.; Park, I. Application of Decision Tree Model for the Ground Subsidence Hazard Mapping near Abandoned Underground Coal Mines. J. Environ. Manag. 2013, 127, 166–176. [Google Scholar] [CrossRef]
- Kumar, S.; Lal, R.; Liu, D. A Geographically Weighted Regression Kriging Approach for Mapping Soil Organic Carbon Stock. Geoderma 2012, 189–190, 627–634. [Google Scholar] [CrossRef]
- Malinowska, A. Classification and Regression Tree Theory Application for Assessment of Building Damage Caused by Surface Deformation. Nat. Hazards 2014, 73, 317–334. [Google Scholar] [CrossRef]
- Oh, H.J.; Lee, S. Integration of Ground Subsidence Hazard Maps of Abandoned Coal Mines in Samcheok, Korea. Int. J. Coal Geol. 2011, 86, 58–72. [Google Scholar] [CrossRef]
- Dong, S.; Samsonov, S.; Yin, H.; Yao, S.; Xu, C. Spatio-Temporal Analysis of Ground Subsidence Due to Underground Coal Mining in Huainan Coalfield, China. Environ. Earth Sci. 2015, 73, 5523–5534. [Google Scholar] [CrossRef]
- Kadlečík, P.; Kajzar, V.; Nekvasilová, Z.; Wegmüller, U.; Doležalová, H. Evaluation of the Subsidence Based on Dinsar and GPS Measurements near Karviná, Czech Republic. Acta Univ. Carolinae Geogr. 2015, 50, 51–61. [Google Scholar] [CrossRef]
- Zamanirad, M.; Sarraf, A.; Sedghi, H.; Saremi, A.; Rezaee, P. Modeling the Influence of Groundwater Exploitation on Land Subsidence Susceptibility Using Machine Learning Algorithms. Nat. Resour. Res. 2020, 29, 1127–1141. [Google Scholar] [CrossRef]
- Li, H.; Zhu, L.; Gong, H.; Sun, H.; Yu, J. Land Subsidence Modelling Using a Long Short-Term Memory Algorithm Based on Time-Series Datasets. Proc. Int. Assoc. Hydrol. Sci. 2020, 382, 505–510. [Google Scholar] [CrossRef]
- Rahmati, O.; Falah, F.; Naghibi, S.A.; Biggs, T.; Soltani, M.; Deo, R.C.; Cerdà, A.; Mohammadi, F.; Tien Bui, D. Land Subsidence Modelling Using Tree-Based Machine Learning Algorithms. Sci. Total Environ. 2019, 672, 239–252. [Google Scholar] [CrossRef] [PubMed]
- Yu, Y.; Chen, S.E.; Deng, K.Z.; Wang, P.; Fan, H.D. Subsidence Mechanism and Stability Assessment Methods for Partial Extraction Mines for Sustainable Development of Mining Cities-A Review. Sustainability 2018, 10, 113. [Google Scholar] [CrossRef]
- Tolman, C.F.; Poland, J.F. Ground-water, Salt-water Infiltration, and Ground-surface Recession in Santa Clara Valley, Santa Clara County, California. Eos, Trans. Am. Geophys. Union 1940, 21, 23–35. [Google Scholar] [CrossRef]
- Zhao, C.; Liu, C.; Zhang, Q.; Lu, Z.; Yang, C. Deformation of Linfen-Yuncheng Basin (China) and Its Mechanisms Revealed by Π-RATE InSAR Technique. Remote Sens. Environ. 2018, 218, 221–230. [Google Scholar] [CrossRef]
- Hung, W.C.; Hwang, C.; Liou, J.C.; Lin, Y.S.; Yang, H.L. Modeling Aquifer-System Compaction and Predicting Land Subsidence in Central Taiwan. Eng. Geol. 2012, 147–148, 78–90. [Google Scholar] [CrossRef]
- Blachowski, J.; Jiránková, E.; Lazecký, M.; Kadlečík, P.; Milczarek, W. Application of Satellite Radar Interferometry (PSInSAR) in Analysis of Secondary Surface Deformations in Mining Areas. Case Studies from Czech Republic and Poland. Acta Geodyn. Geomater. 2018, 173–185. [Google Scholar] [CrossRef]
- Hejmanowski, R.; Sopata, P.; Stoch, T.; Wójcik, A.; Witkowski, W.T. Wpływ Odwodnienia Górotworu Węglowego Na Osiadanie Powierzchni Terenu. Przegląd Górniczy 2013, 69, 38–43. [Google Scholar]
- OpenStreetMap Contributors. Planet Dump. 2021. Available online: https://Planet.Osm.Org (accessed on 20 June 2021).
- Central Statistical Office of Poland. Available online: https://stat.gov.pl/en/ (accessed on 26 May 2021).
- Kisielewski, F. Polish Geological Institute—National Research Institute. Available online: https://www.pgi.gov.pl/en/ (accessed on 14 March 2020).
- The Main Office of Geodesy and Cartography of Poland. Available online: http://www.gugik.gov.pl/ (accessed on 26 May 2021).
- Kucharczyk, M.; Bzowski, Z.; Kot, J.; Dawidowski, A.; Niewęgłowski, P.; Dybkowski, K.; Góra, S.; Zawiślak, M.; Bernat, A.; Zarębski, K.; et al. Report on the Environmental Impact of Hard Coal Mining by Lubelski Węgiel “Bogdanka” S.A. in the Planned Mining Area (Including the Lublin K-6-7 Field and the Lublin K-3 Field)—The Stage of Obtaining a License to Exploit. the Field; Lubelski Węgiel "Bogdanka" S.A.: Lublin, Poland, 2013. (In Polish) [Google Scholar]
- Lubelski Węgiel “Bogdanka” S.A.—Official Webpage of the Bogdanka Coal Mine. Available online: https://www.lw.com.pl/ (accessed on 25 May 2021).
- Porzycki, J. The State of Geological Knowledge of Black Coal Deposits in the Lubin Coal Basin. Przegląd Geol. 1982, 30, 526–530. [Google Scholar]
- Wilk, Z.; Bocheńska, T. Hydrogeology of Polish Mineral. Deposit and Mining Water Problems. 2; AGH Uczelniane Wydawnictwa Naukowo-Dydaktyczne: Krakow, Poland, 2003. [Google Scholar]
- Stochlak, J.; Zarębski, K. On the Development in Hydrogeological Surveys in the Central Coal Region, Lublin Coal Basin in the Years 1964–1981. Przegląd Geol. 1982, 30, 541–548. [Google Scholar]
- Stachowicz, S. Aktualne Problemy Eksploatacji Złoża LZW Przez Lubelski Węgiel “Bogdanka” S. A. WUG Bezpieczeństwo Pracy Ochrona Środowiska Górnictwie 2005, 6, 3–7. [Google Scholar]
- Michalczyk, Z.; Chmiel, S.; Chmielewski, J.; Turczyński, M. Hydrological Consequences of the Exploitation of the Hard Coal Deposit in the Bogdanka Region. Biul. Państwowego Inst. Geol. 2007, 422, 113–125. (In Polish) [Google Scholar]
- Michalczyk, Z.; Mięsiak-Wójcik, K.; Sposób, J.; Turczyński, M. The Condition and Changes in Water Reservoirs in the Łęczyńsko-Włodawskie Lakeland. Prz. Geogr. 2017, 89, 9–28. [Google Scholar] [CrossRef]
- Jaworski, L.; Swiatek, A.; Zdunek, R.; Zielinski, J.B. Integration of the ASG-EUPOS Permanent Stations with First Order National Geodetic Networks-Measurements and Results. Artif. Satell. 2011, 46, 165–174. [Google Scholar] [CrossRef]
- IT System of Country Protection—Poland. Available online: https://www.isok.gov.pl/ (accessed on 27 May 2021).
- Philpott, K.D. Evaluation of the Bogdanka Mine, Poland. In Proceedings of the IV European Coal Conference, Ustron, Poland, 26–28 September 2000; pp. 199–206. [Google Scholar]
- Doskocz, A. The Current State of the Creation and Modernization of National Geodetic and Cartographic Resources in Poland. Open Geosci. 2016, 8, 589–592. [Google Scholar] [CrossRef]
- Łyszkowicz, A.; Dąbrowski, W.; Dąbrowska, D. Modern Geodetic Network and Datum in Poland. Laws Use Law Zoo Dig. 2002, 28, 113–116. [Google Scholar] [CrossRef]
- Knothe, S. Equation of the Subsidence Profile. Arch. Min. Metall. 1953, 1, 22–38. [Google Scholar]
- Knothe, S. Observations of Surface Movements under Influence of Mining and Their Theoretical Interpretation. In Proceedings of the European Congress on Ground Movement, Leeds, UK, 9–12 April 1957; pp. 210–218. [Google Scholar]
- Zhang, M.; Burbey, T.J. Inverse Modelling Using PS-InSAR Data for Improved Land Subsidence Simulation in Las Vegas Valley, Nevada. Hydrol. Process. 2016, 30, 4494–4516. [Google Scholar] [CrossRef]
- Wong, T.F.; Baud, P. Mechanical Compaction of Porous Sandstone. Oil Gas. Sci. Technol. 1999, 54, 715–727. [Google Scholar] [CrossRef]
- Pettersen, Ø. Sandstone Compaction, Grain Packing and Critical State Theory. Pet. Geosci. 2007, 13, 63–67. [Google Scholar] [CrossRef]
- Doornhof, D. Compaction and Subsidence. Oilf. Rev. 2006, 18, 50–68. [Google Scholar]
- Sroka, A.; Hejmanowski, R. Subsidence Prediction Caused by the Oil and Gas Development. In Proceedings of the 3rd IAG/12th FIG Symposium, Baden, Austria, 22–24 May 2006. [Google Scholar]
- ArcGIS Pro, Version 2.5.0; Environmental Systems Research Institute: West Redlans, CA, USA, 2021.
- Anderson, M.G. Modelling Geomorphological Systems; Wiley: Chichester, UK, 1988. [Google Scholar] [CrossRef]
- Greenlee, D.D. Raster and Vector Processing for Scanned Linework. Photogramm. Eng. Remote Sens. 1987, 53, 1383–1387. [Google Scholar]
- Jenson, S.K.; Domingue, J.O. Extracting Topographic Structure from Digital Elevation Data for Geographic Information System Analysis. Photogramm. Eng. Remote Sensing 1988, 54, 1593–1600. [Google Scholar]
- Tarboton, D.G.; Bras, R.L.; Rodriguez-Iturbe, I. On the Extraction of Channel Networks from Digital Elevation Data. Hydrol. Process. 1991, 5, 81–100. [Google Scholar] [CrossRef]


| Type | Era | Unit | Depth [m] | ||
|---|---|---|---|---|---|
| B1 | B2 | B3 | |||
| Geologic Time | Cenozoic | Quaternary | 55 | 64 | 71 |
| Mesozoic | Cretaceous | 55–578 | 64–496 | 71–725 | |
| Jurassic | 578–698 | 496–586 | 725–901 | ||
| Westphalian | 698–1268 | 586–1103 | 901–1163 | ||
| Paleozoic | Namur C | 1268–1672 | 1103–1457 | 1163–1322 | |
| Namur B | 1672–1731 | 1457–1511 | 1322–1380 | ||
| Namur A | 1731- | 1511- | 1380- | ||
| Aquifer | Cenozoic—Mesozoic | Quaternary—Upper Cretaceous | 2–12 | 3–9 | 3–15 |
| Mesozoic | Lower Cretaceous—Upper Jurassic | 577–579 | 495–497 | 724–727 | |
| Mesozoic | Middle Jurassic | 631–692 | 537–584 | 798–872 | |
| Paleozoic | Carboniferous | 755~770 | 649~665 | 965~980 | |
| Benchmark | ΔH Observed [mm] | ΔH Modelled [mm] | Difference between Observed and Modelled Change in the Elevation [mm] |
|---|---|---|---|
| 1 | −374.0 | −266.5 | −107.5 |
| 2 | −240.0 | −152.3 | −87.7 |
| 3 | −269.0 | −181.7 | −87.3 |
| 4 | −295.0 | −234.4 | −60.6 |
| 5 | −211.0 | −162.4 | −48.6 |
| 6 | −163.0 | −133.0 | −30.0 |
Publisher’s Note: MDPI stays neutral with regard to jurisdictional claims in published maps and institutional affiliations. |
© 2021 by the authors. Licensee MDPI, Basel, Switzerland. This article is an open access article distributed under the terms and conditions of the Creative Commons Attribution (CC BY) license (https://creativecommons.org/licenses/by/4.0/).
Share and Cite
Guzy, A.; Witkowski, W.T. Land Subsidence Estimation for Aquifer Drainage Induced by Underground Mining. Energies 2021, 14, 4658. https://doi.org/10.3390/en14154658
Guzy A, Witkowski WT. Land Subsidence Estimation for Aquifer Drainage Induced by Underground Mining. Energies. 2021; 14(15):4658. https://doi.org/10.3390/en14154658
Chicago/Turabian StyleGuzy, Artur, and Wojciech T. Witkowski. 2021. "Land Subsidence Estimation for Aquifer Drainage Induced by Underground Mining" Energies 14, no. 15: 4658. https://doi.org/10.3390/en14154658
APA StyleGuzy, A., & Witkowski, W. T. (2021). Land Subsidence Estimation for Aquifer Drainage Induced by Underground Mining. Energies, 14(15), 4658. https://doi.org/10.3390/en14154658