
Seasonal Analysis Comparison of Three Air-Cooling Systems in Terms of Thermal Comfort, Air Quality and Energy Consumption for School Buildings in Mediterranean Climates


Abstract
:1. Introduction
2. Methodology
2.1. Description of Air-Cooling Systems
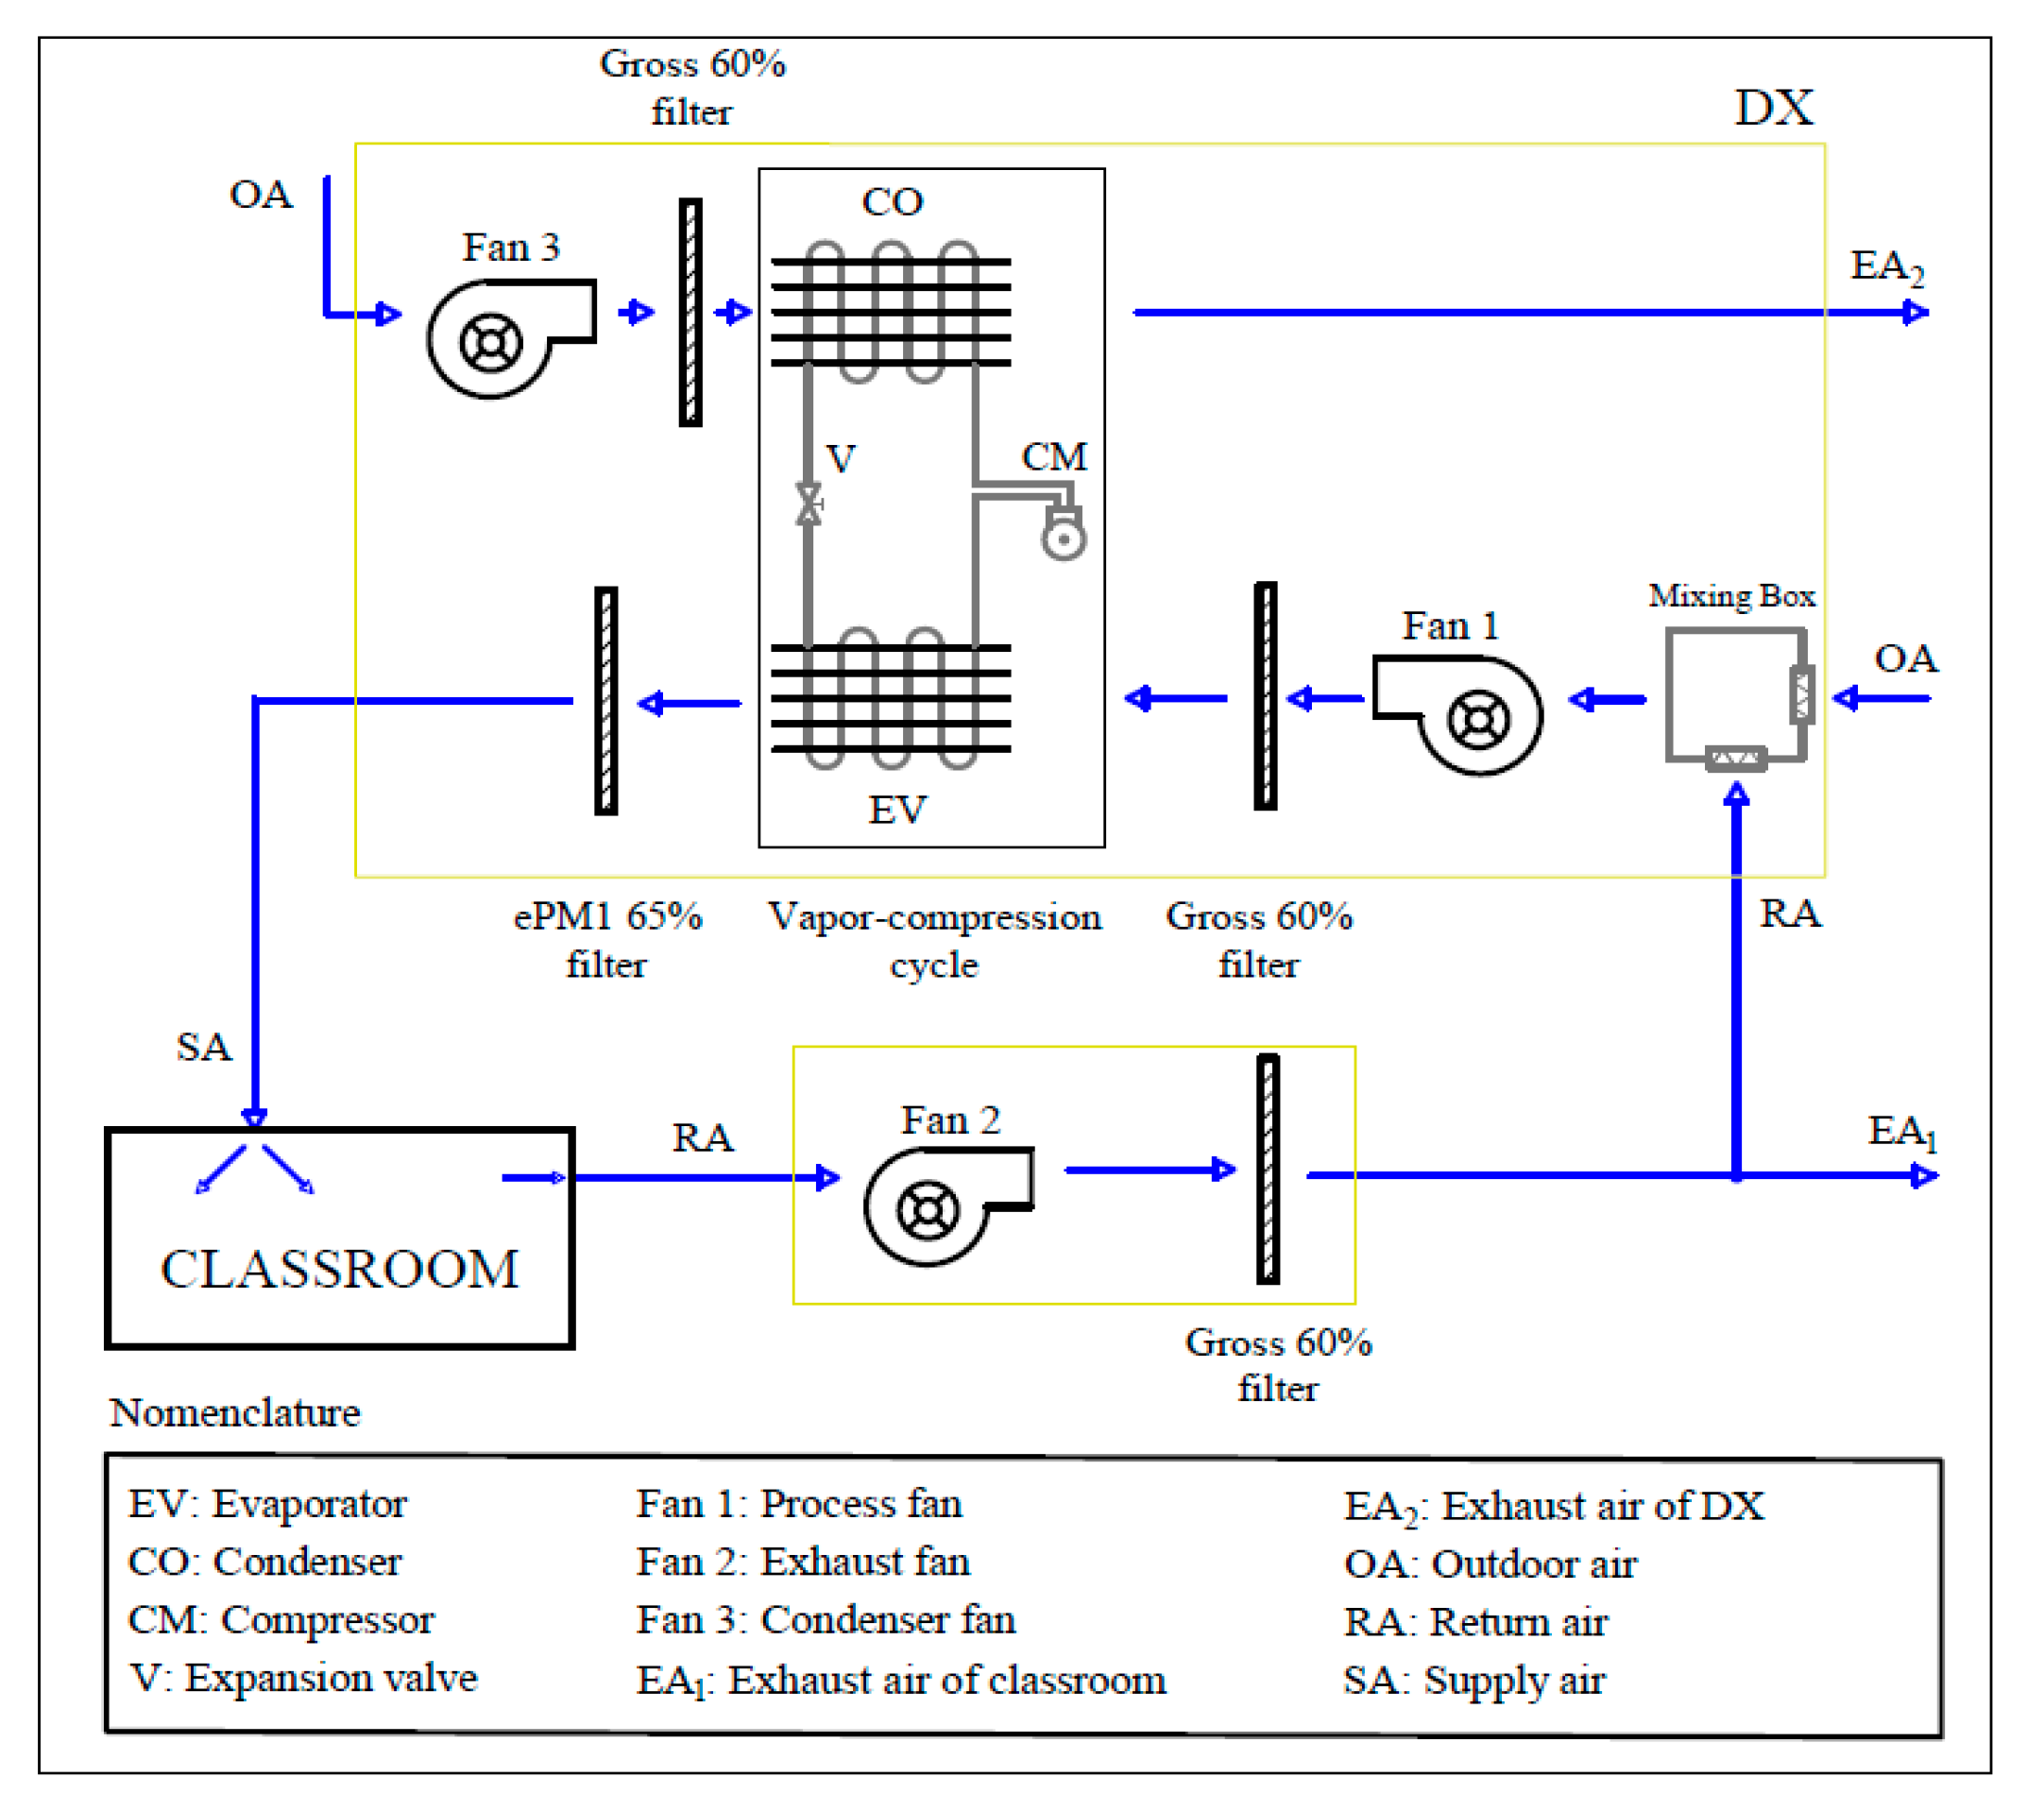
2.1.1. DX System
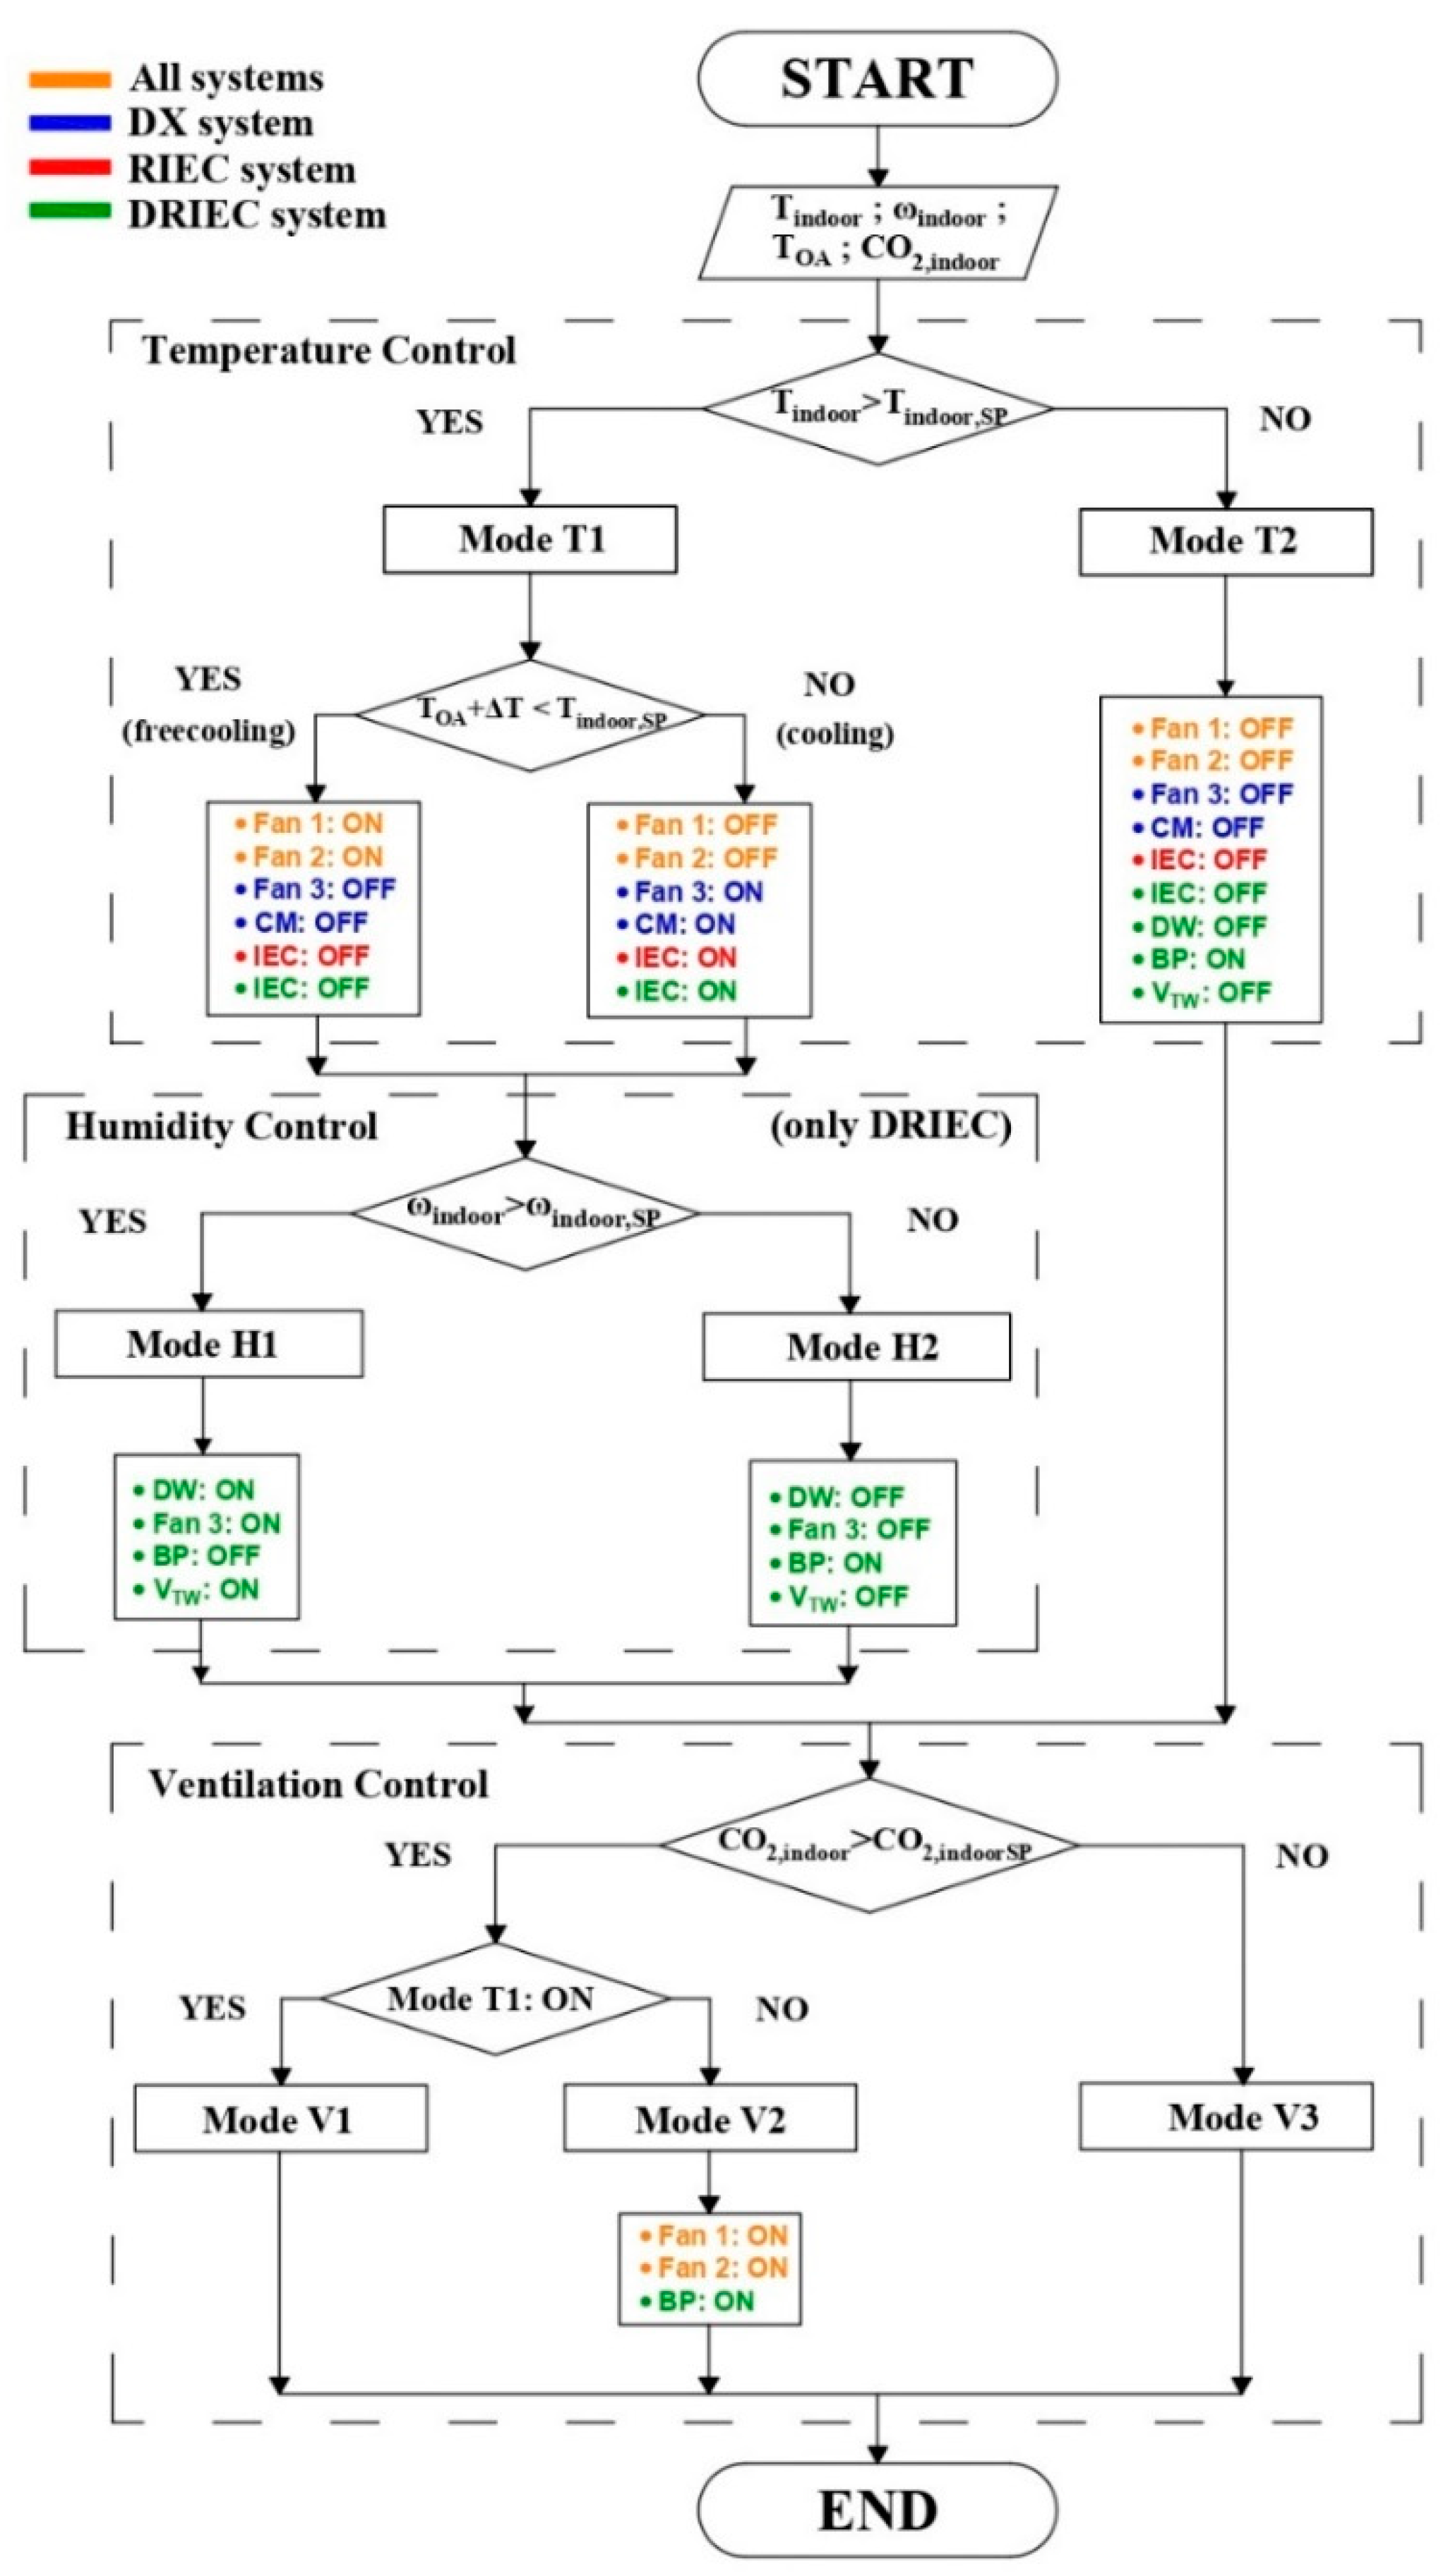
- Operation modes of DX
- 1.
- Temperature control
- 2.
- Ventilation control
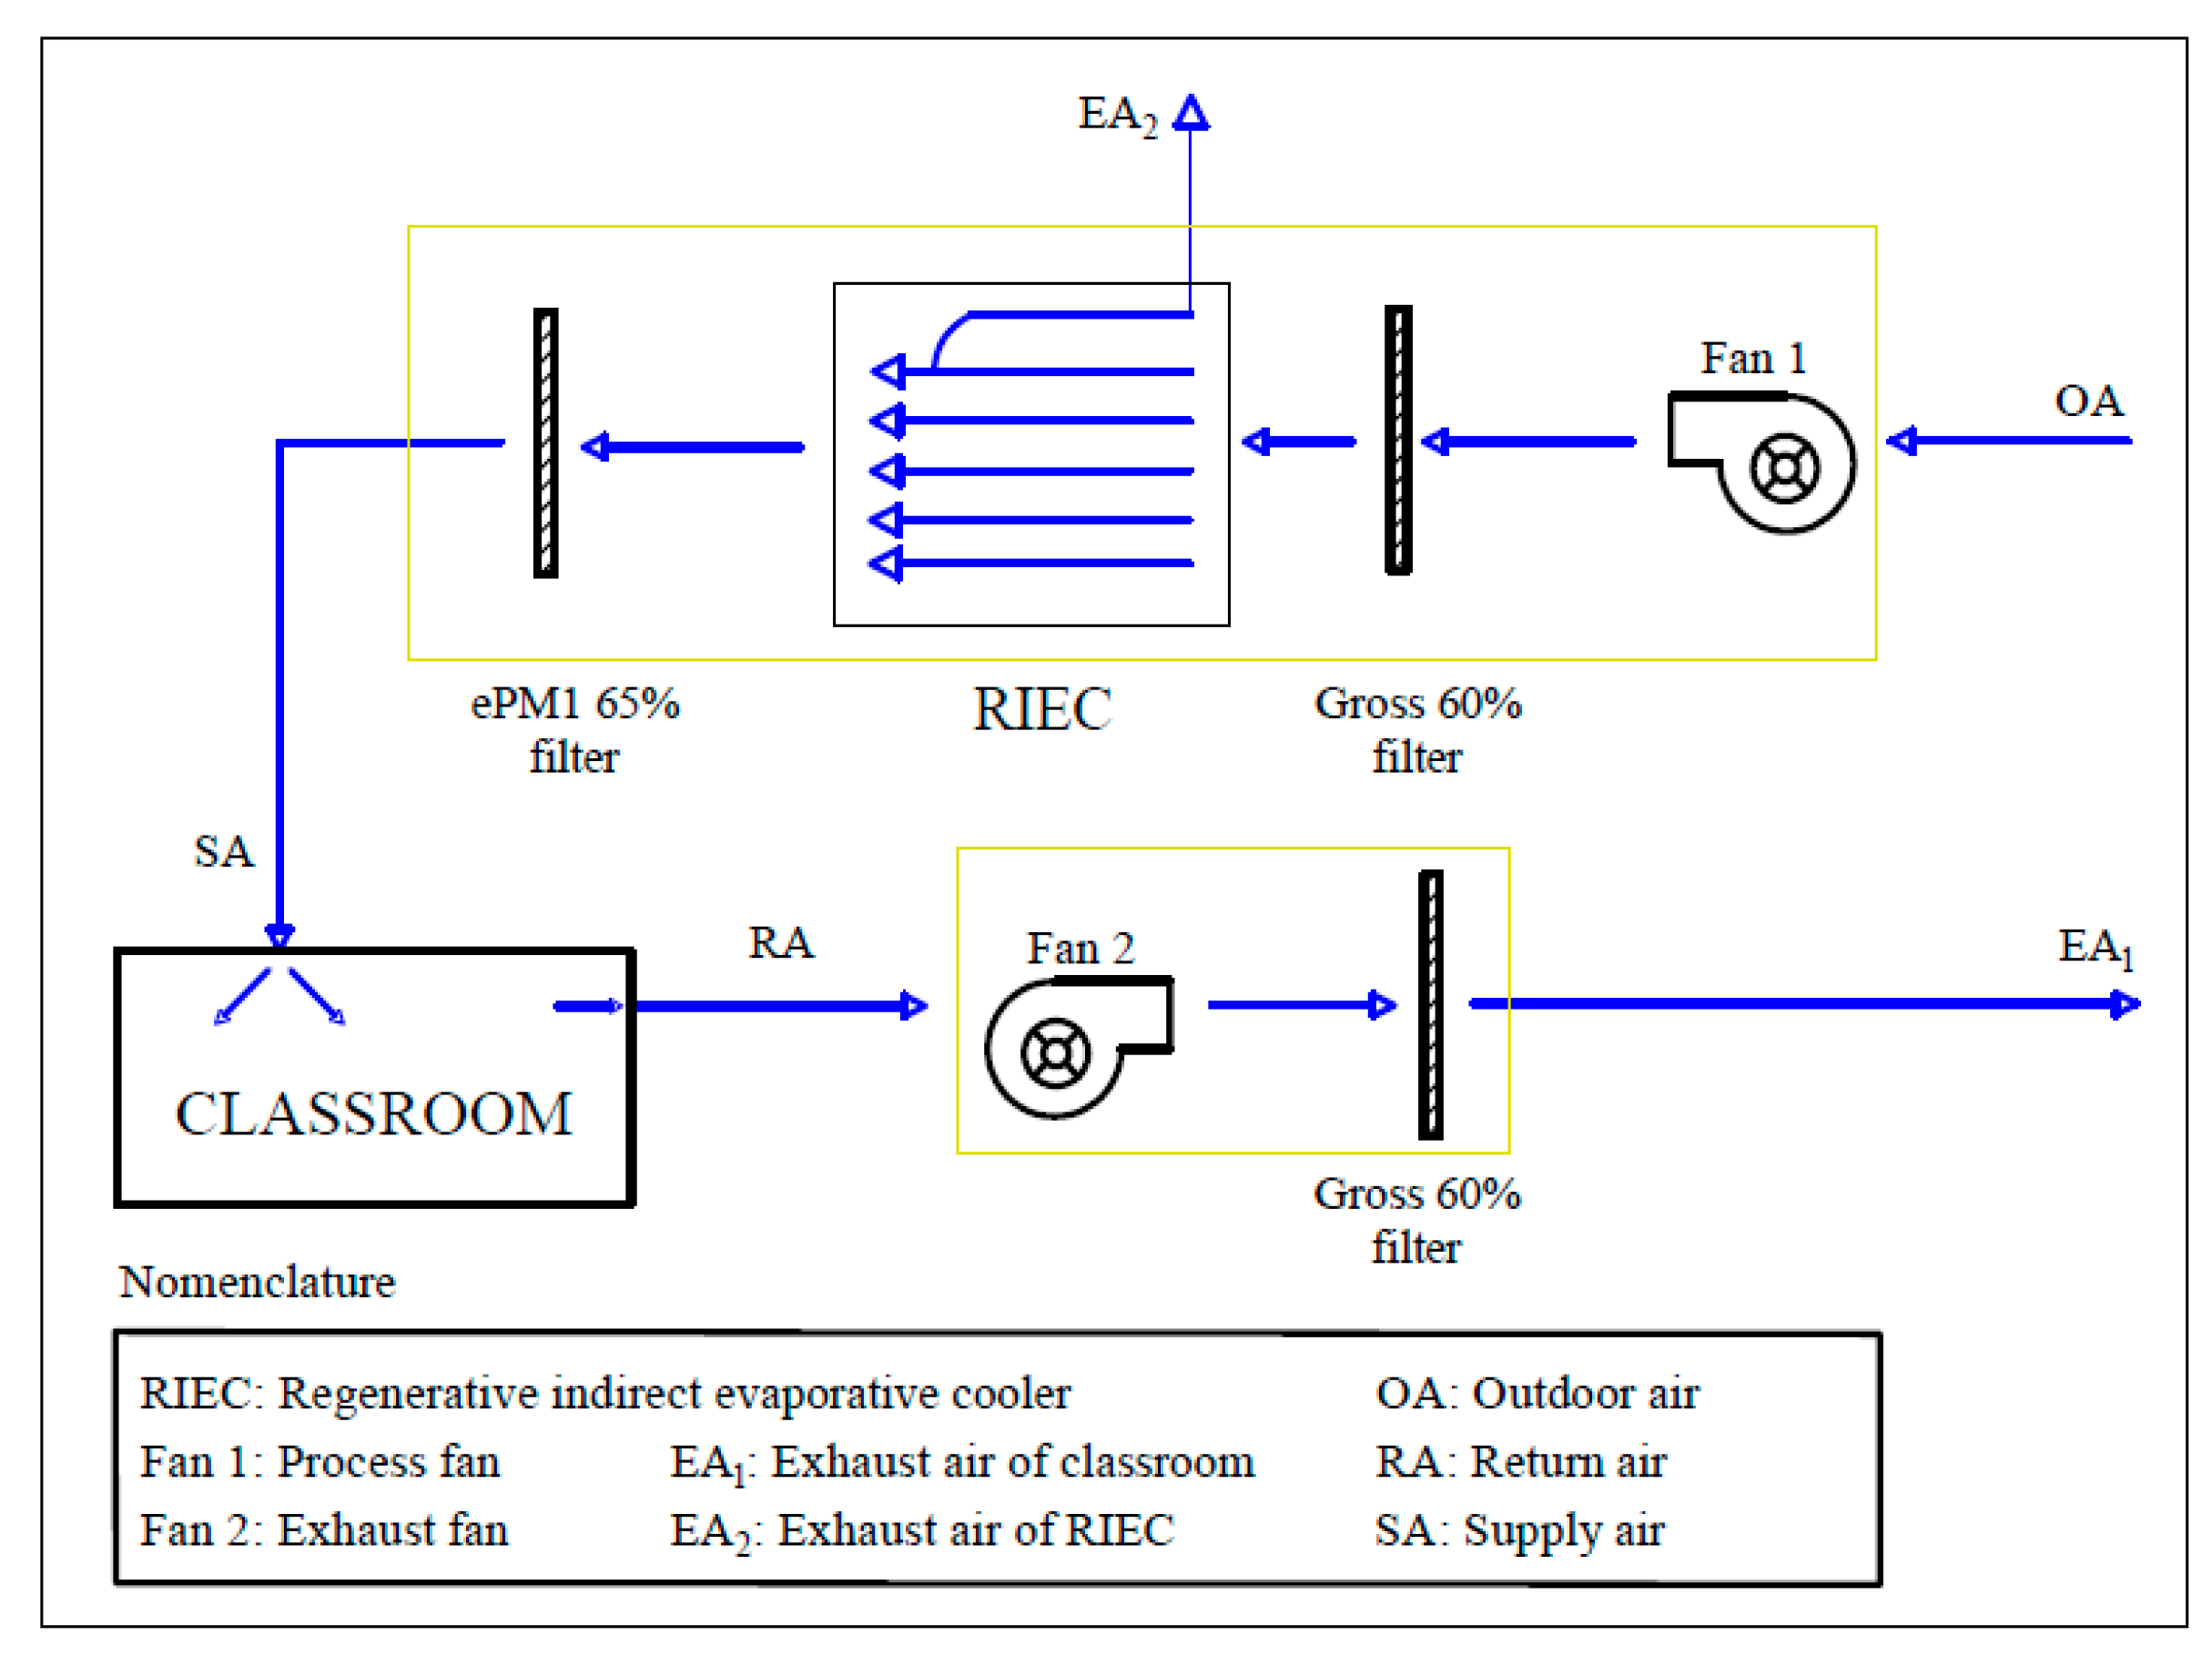
2.1.2. RIEC System
- Operation modes of RIEC
- 1.
- Temperature control
- 2.
- Ventilation control
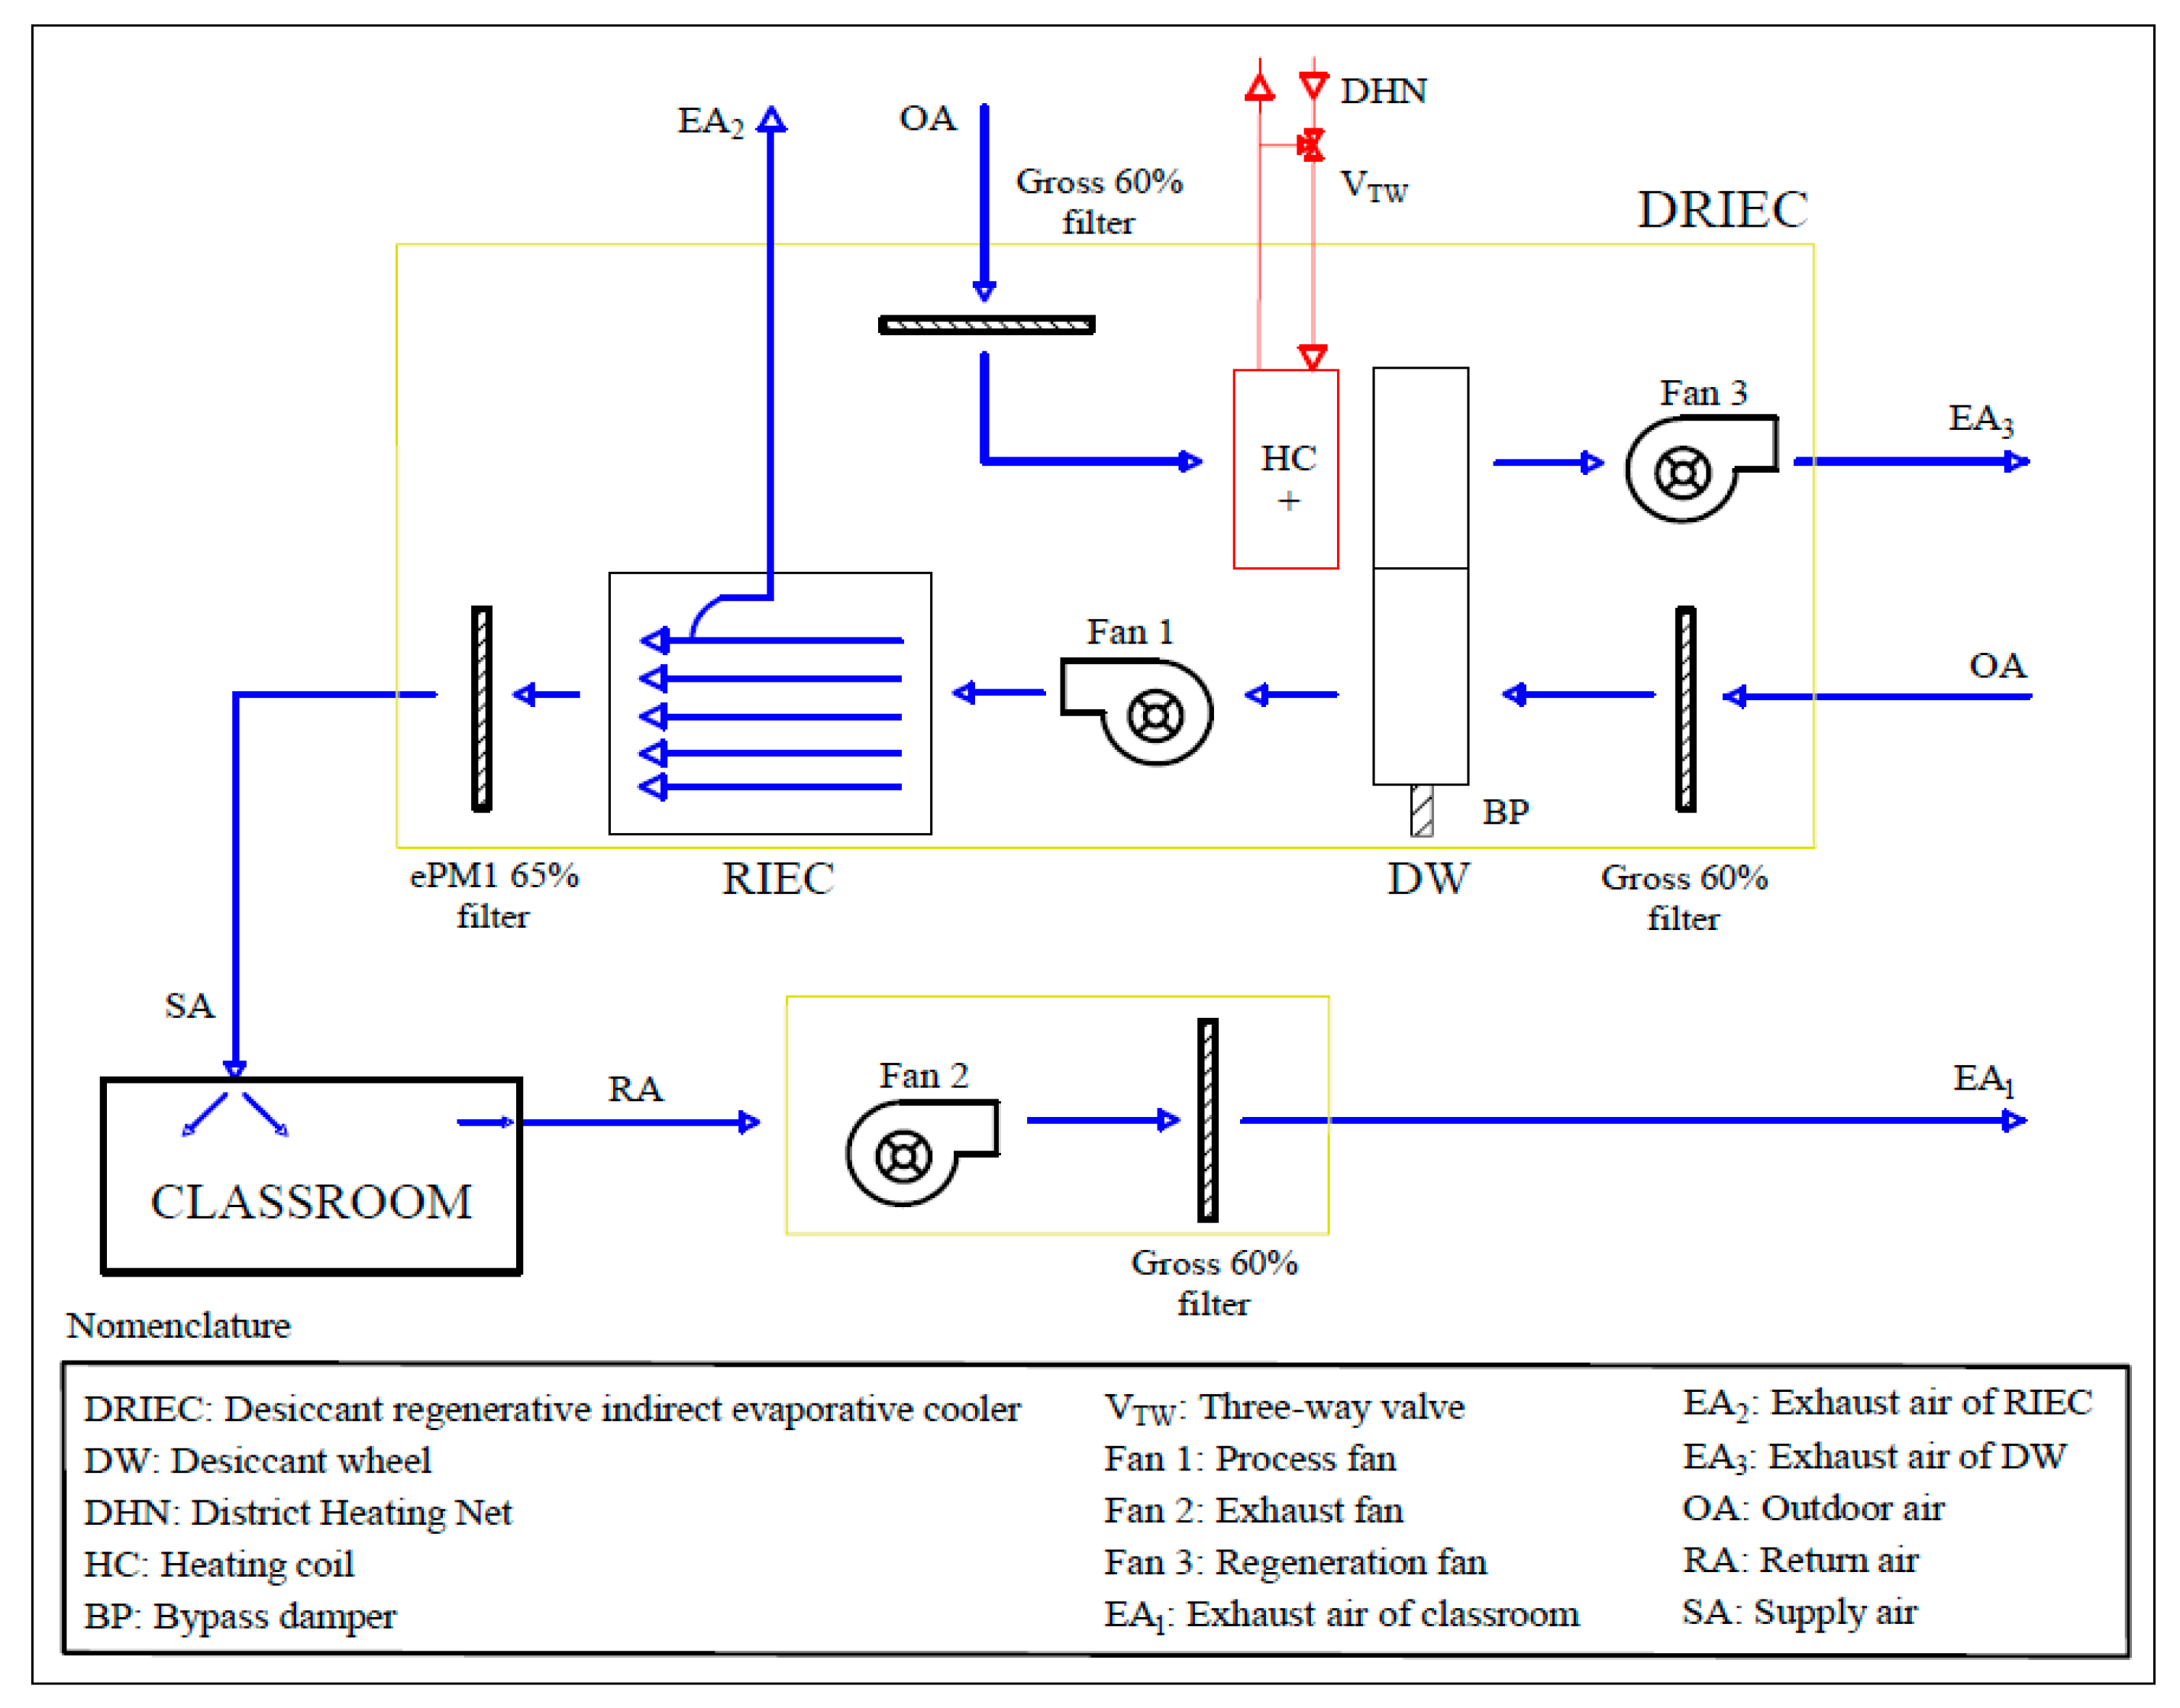
2.1.3. DRIEC System
- Operation modes of DRIEC
- 1.
- Humidity control
2.2. Building Model
2.3. Components Modelling
2.3.1. Refrigeration Vapour Compression Unit Model
2.3.2. Regenerative Indirect Evaporative Cooler Model
2.3.3. Desiccant Wheel Model
2.3.4. Heating Coil Model
2.3.5. Filter Model
2.3.6. Fan Model
2.4. Climate Zones
2.5. Systems Evaluation
2.5.1. Thermal Comfort
− 1.7·10−5·M·(5867 − pa) − 0.0014·M·(34 − ta) − 3.96·10−8·fcl·[(tcl + 273)4 − (tr + 273)4] − fcl·hc·(tcl − ta)}
1.05 + 0.645·Icl for Icl > 0.078 m2·K/W
2.5.2. Air Quality
2.5.3. Energy Consumption and CO2 Emission
3. Results and Analysis
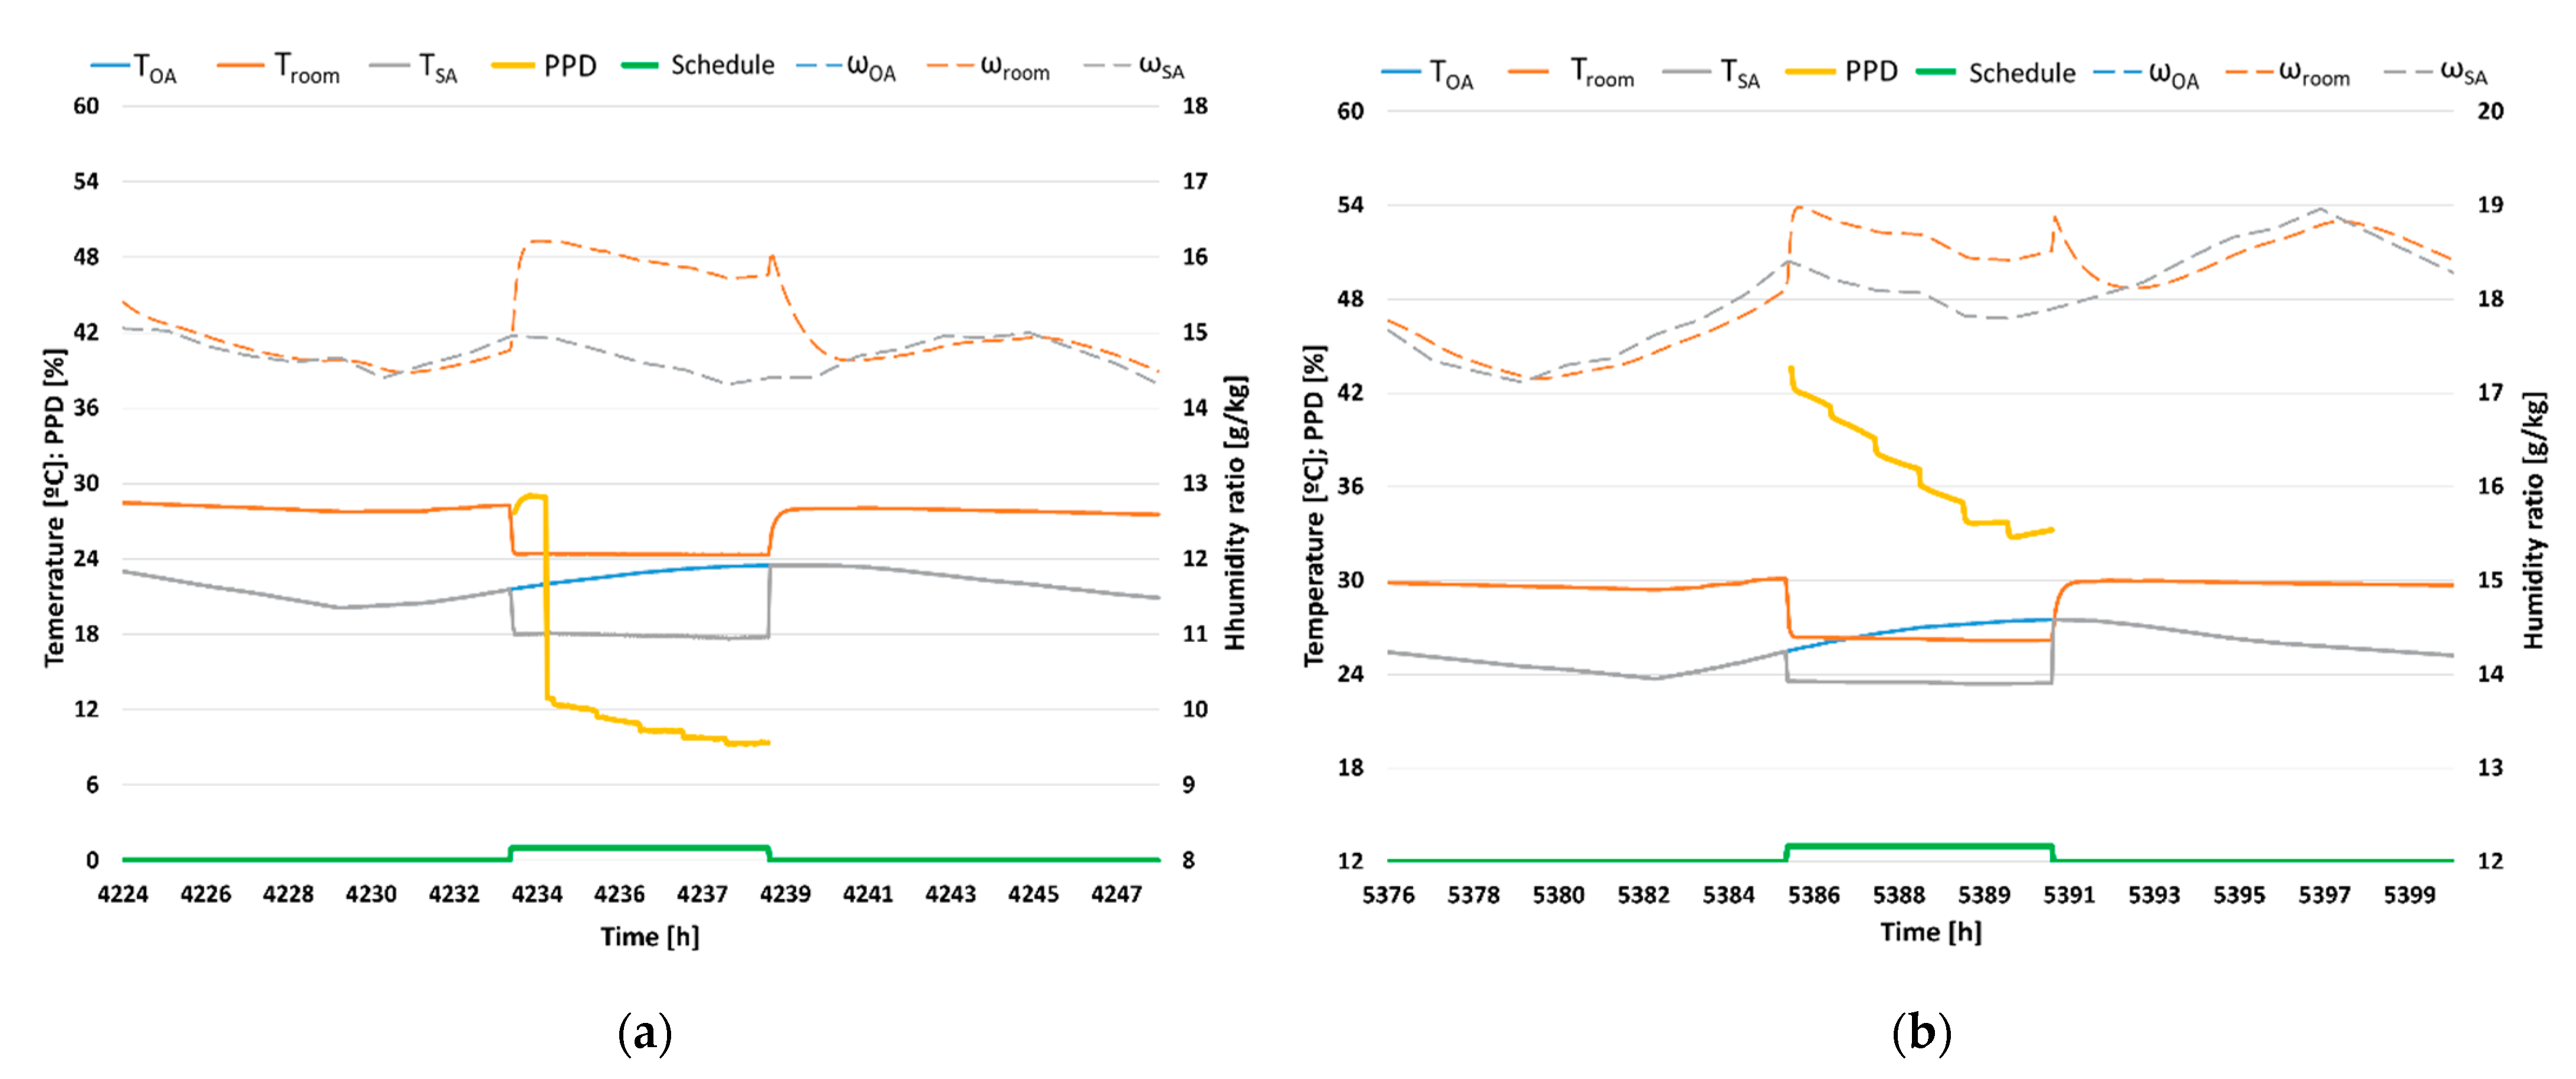
3.1. Thermal Comfort
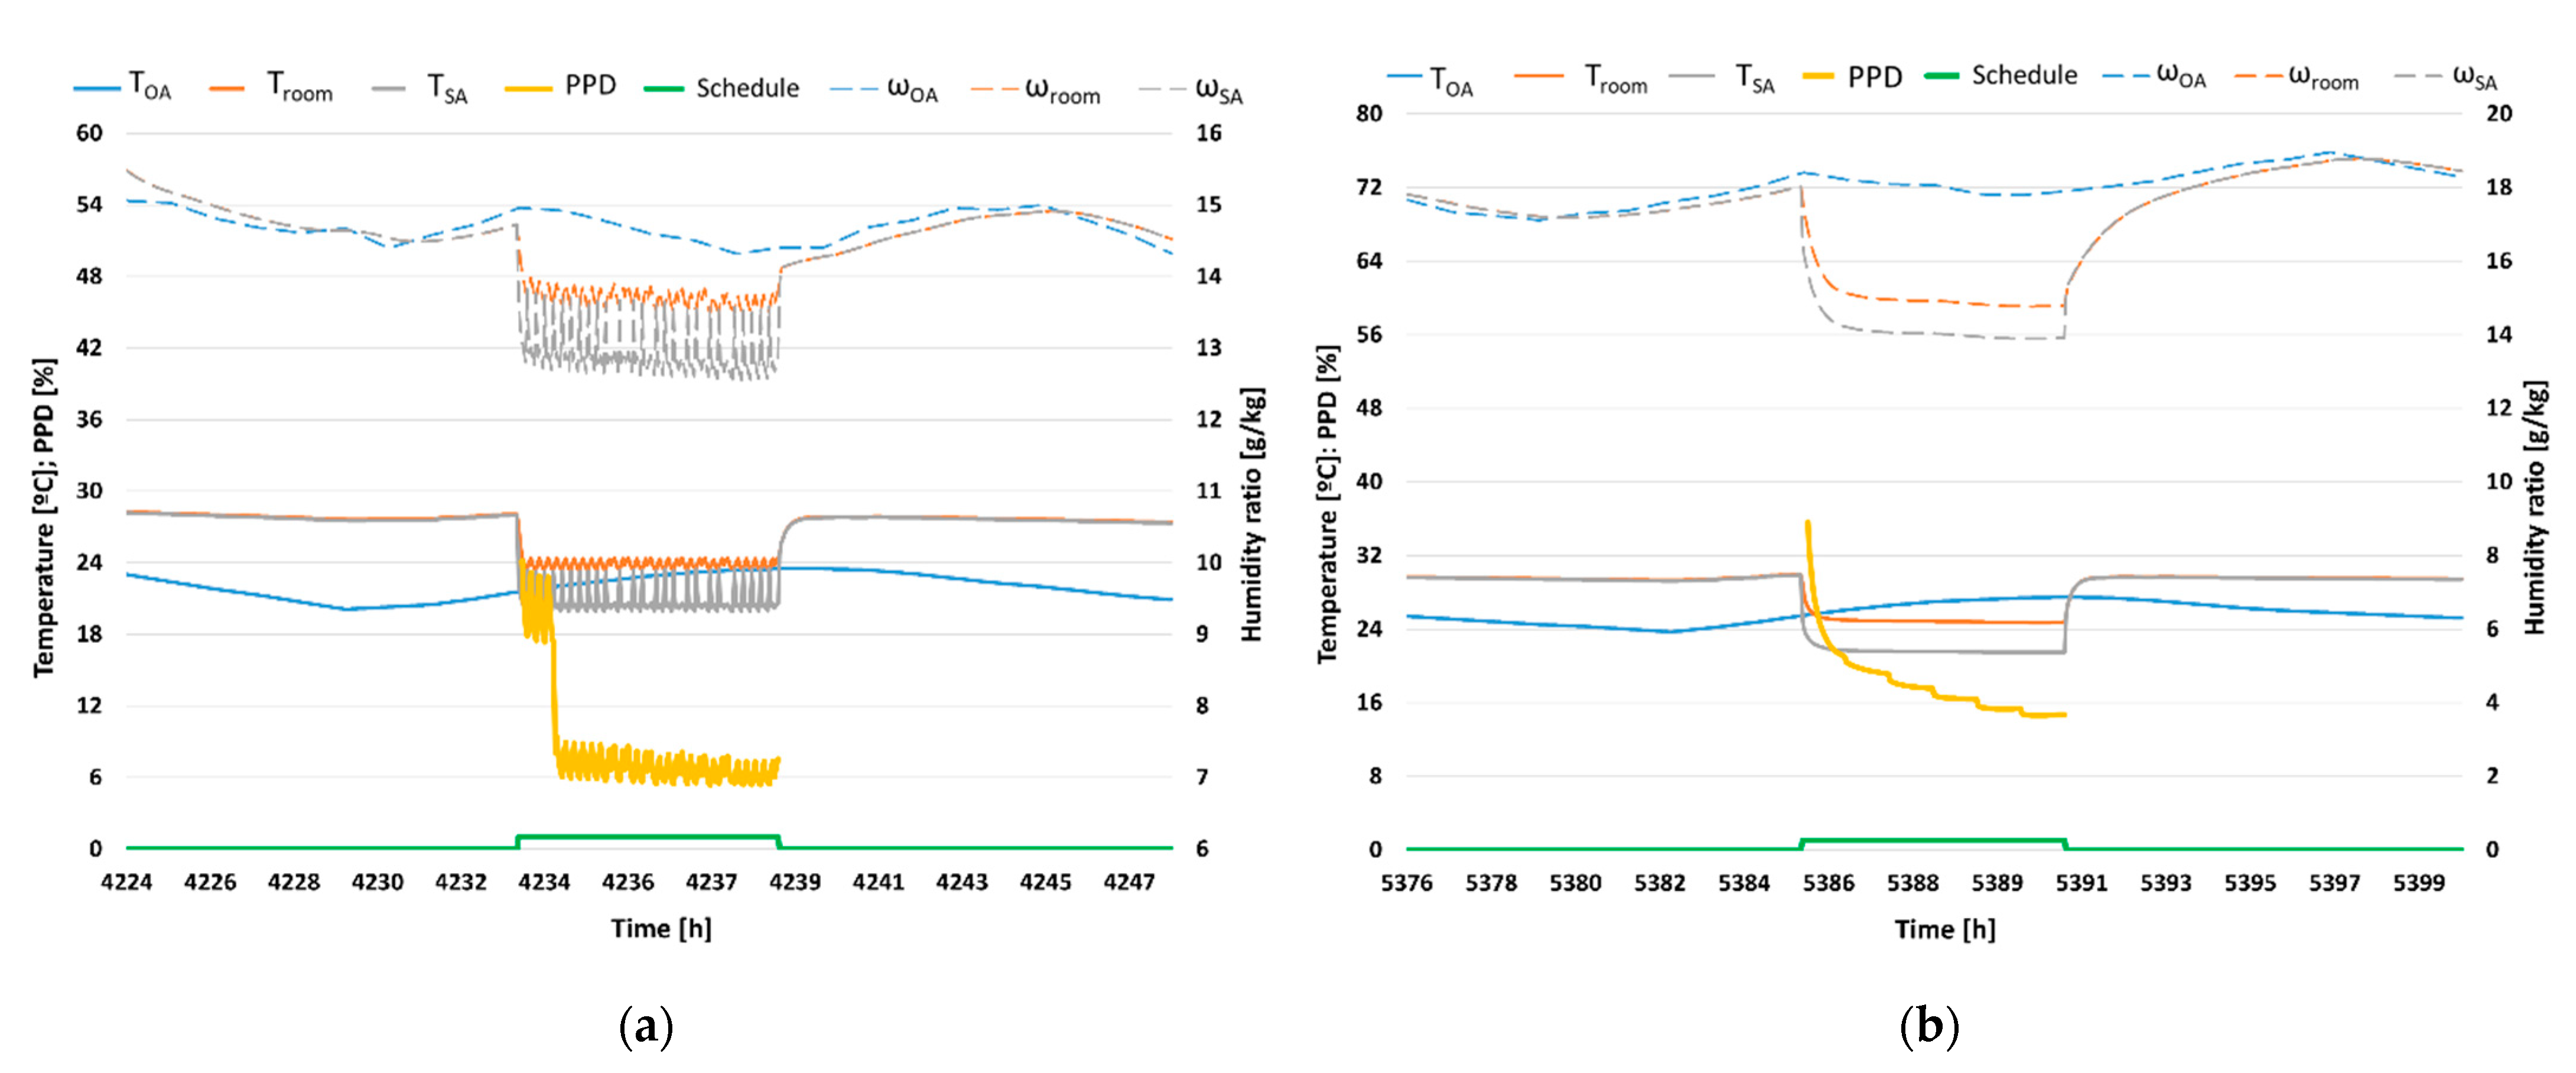
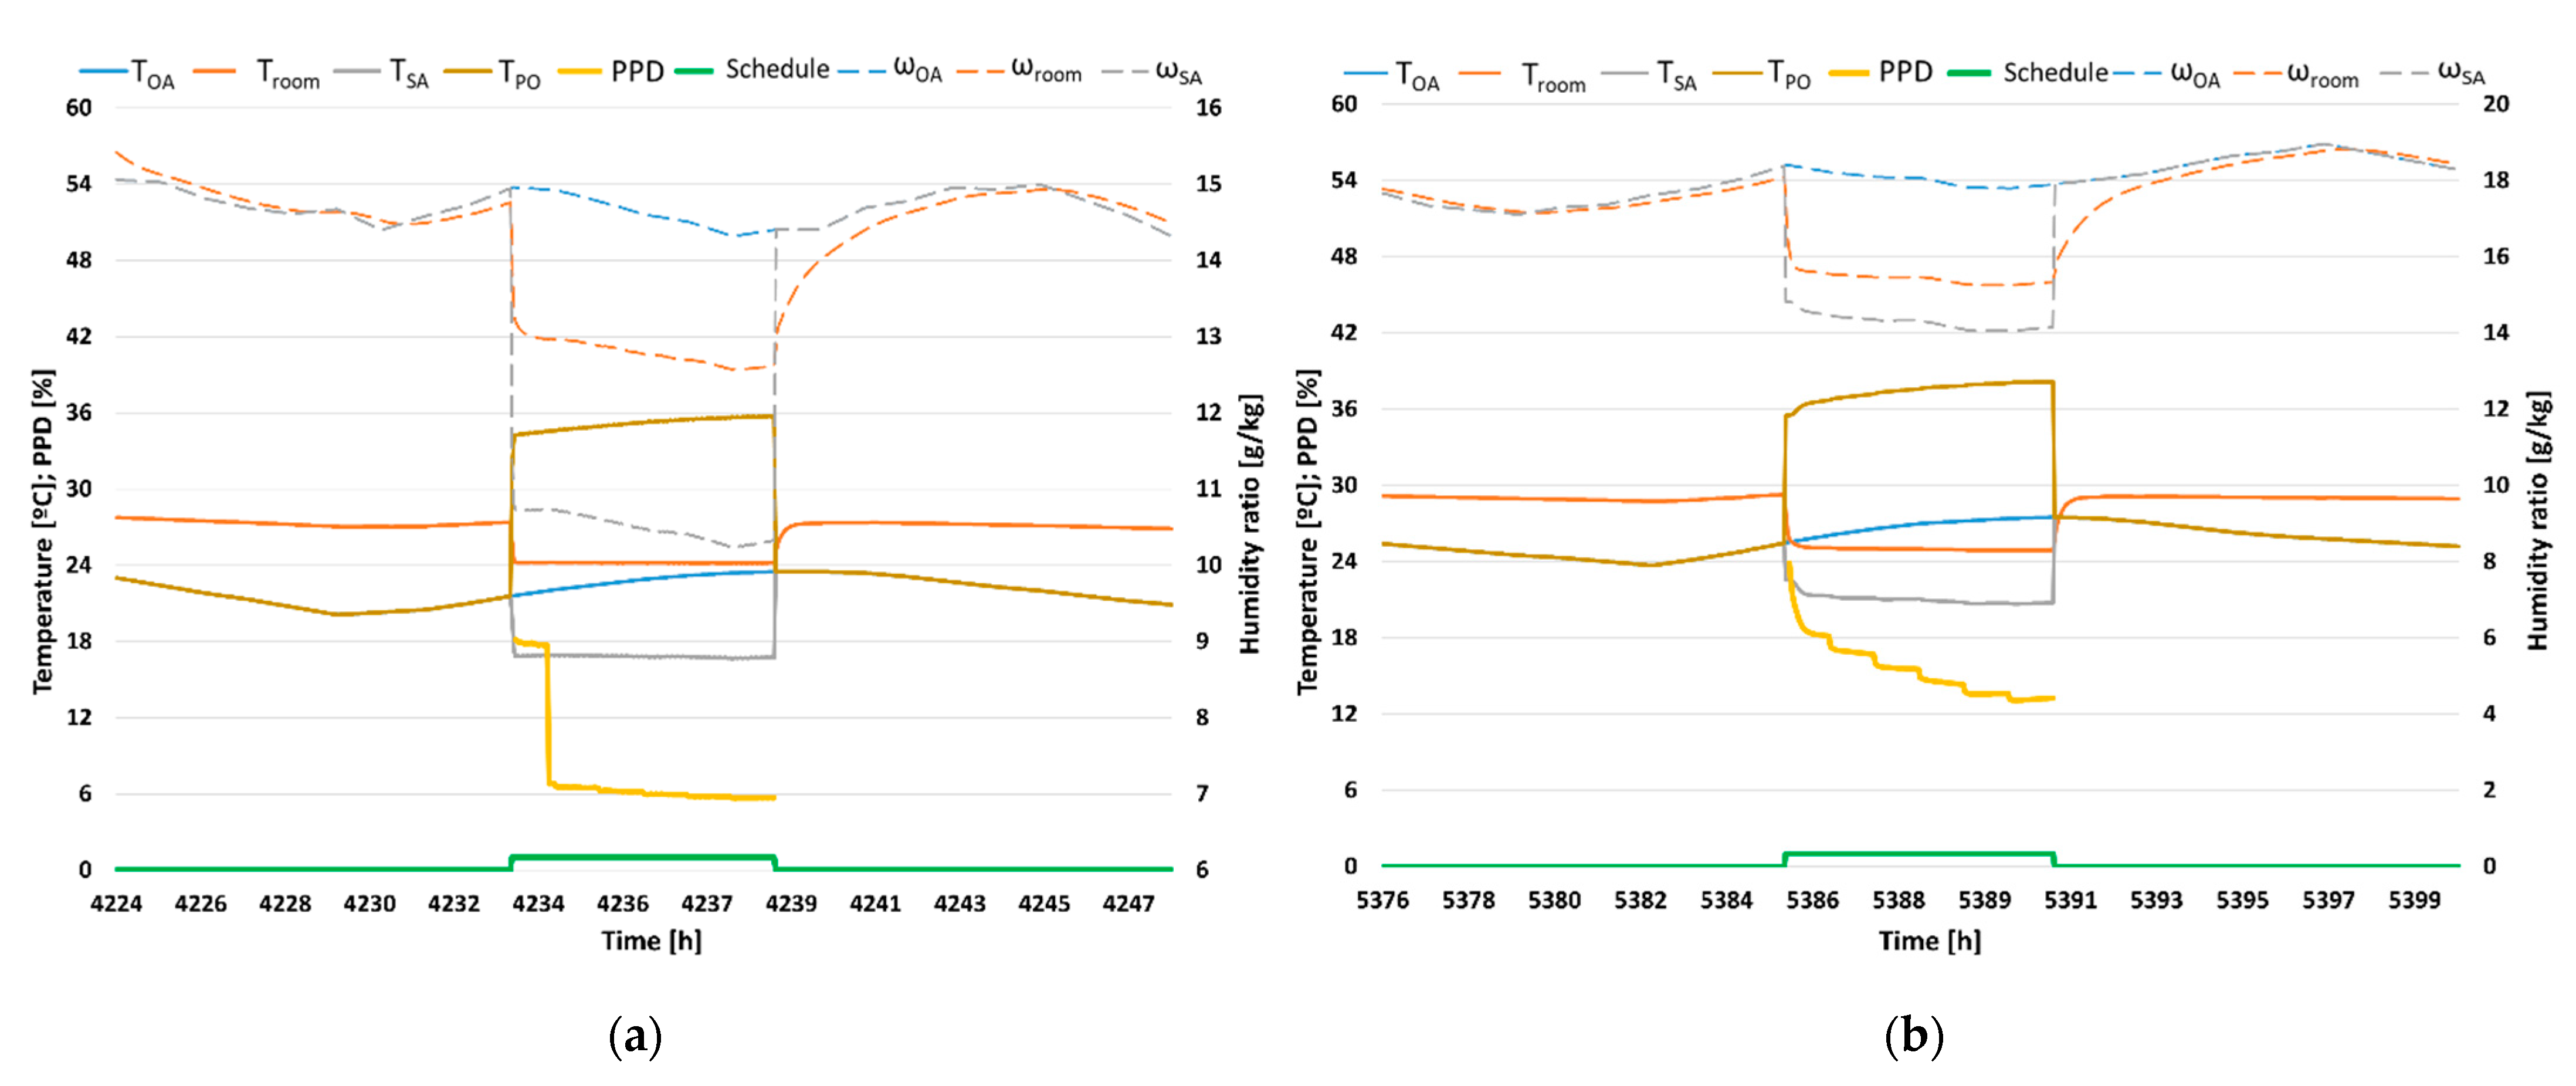
3.1.1. Daily Analysis of the Air-Cooling Systems
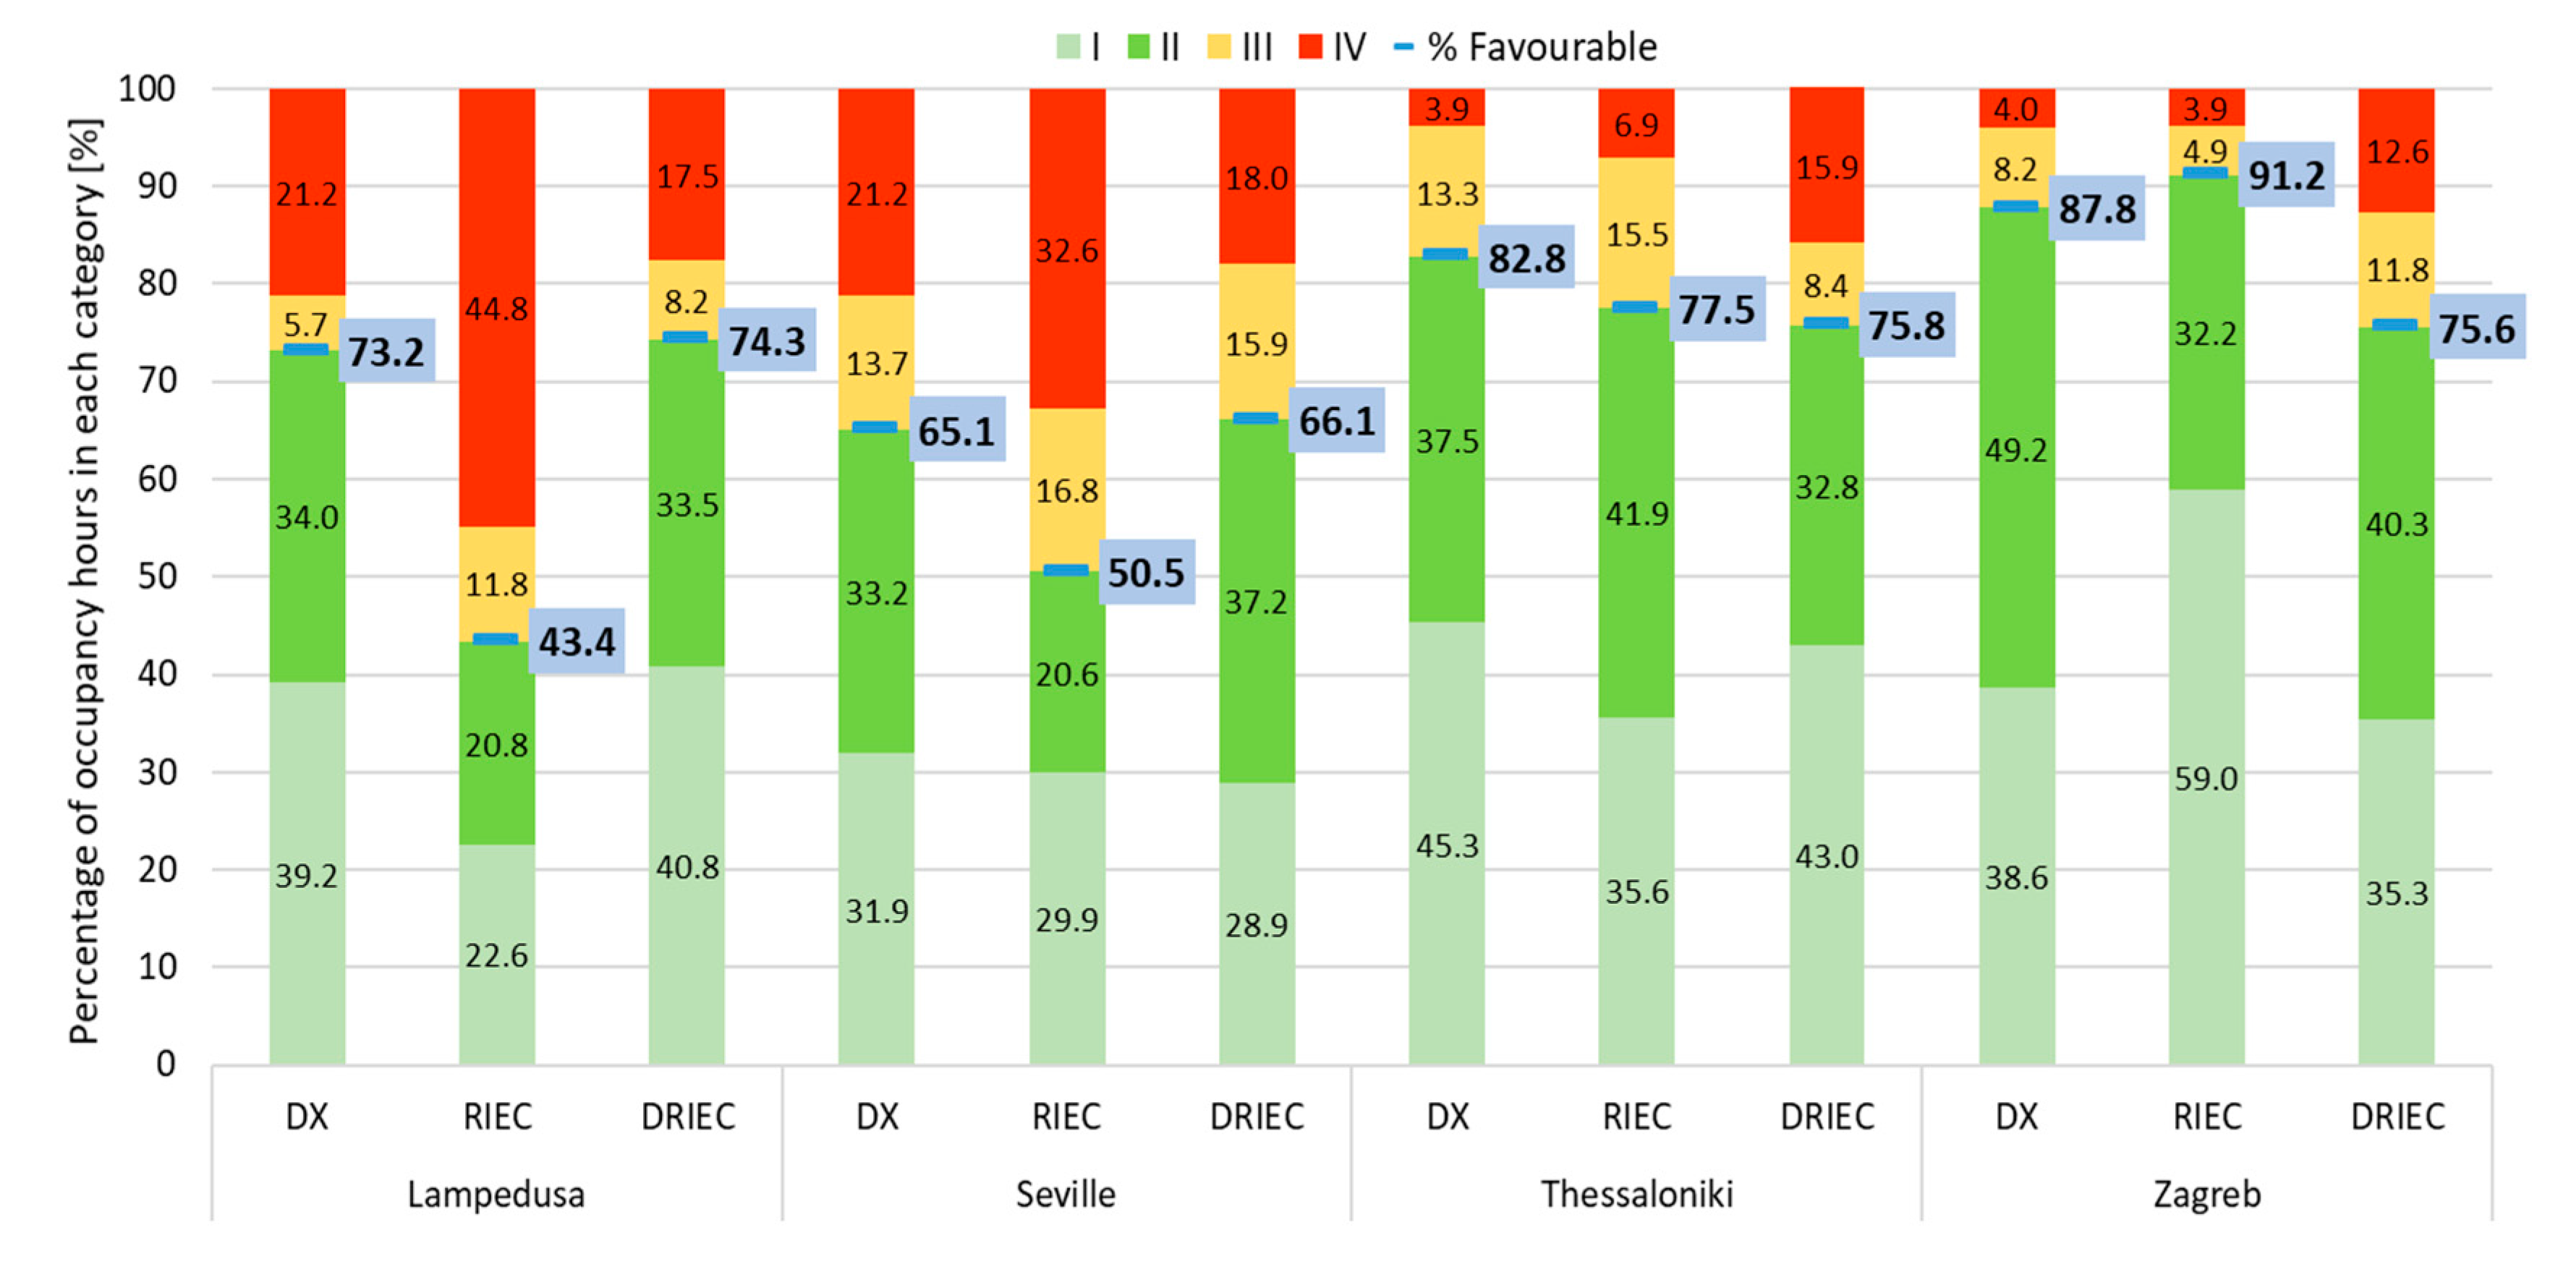
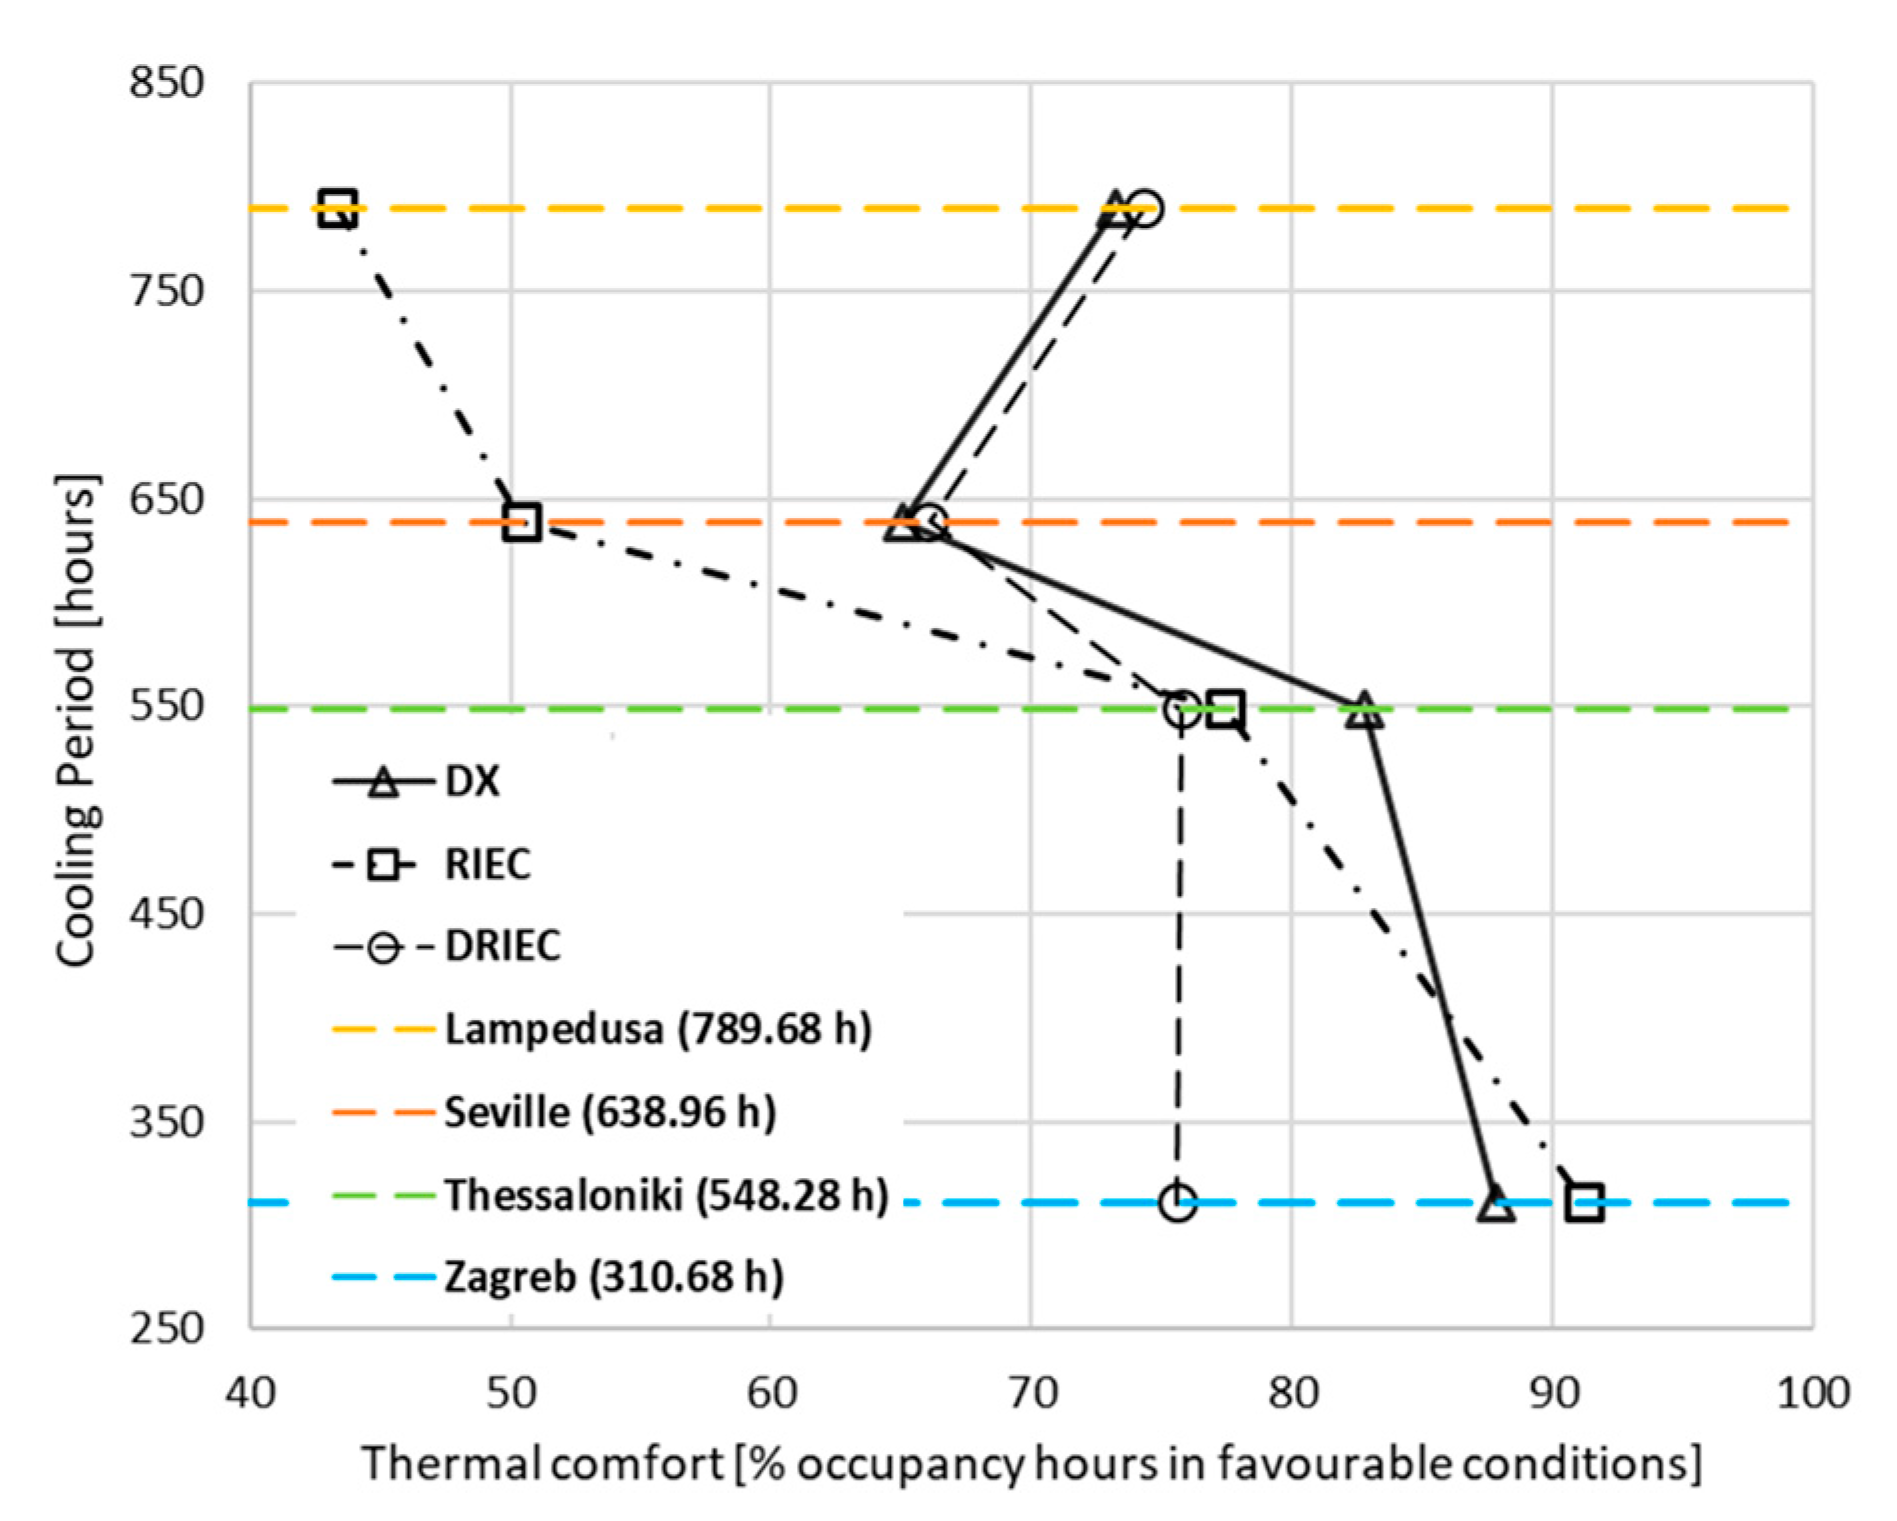
3.1.2. Annual Thermal Comfort Results
3.2. Air Quality
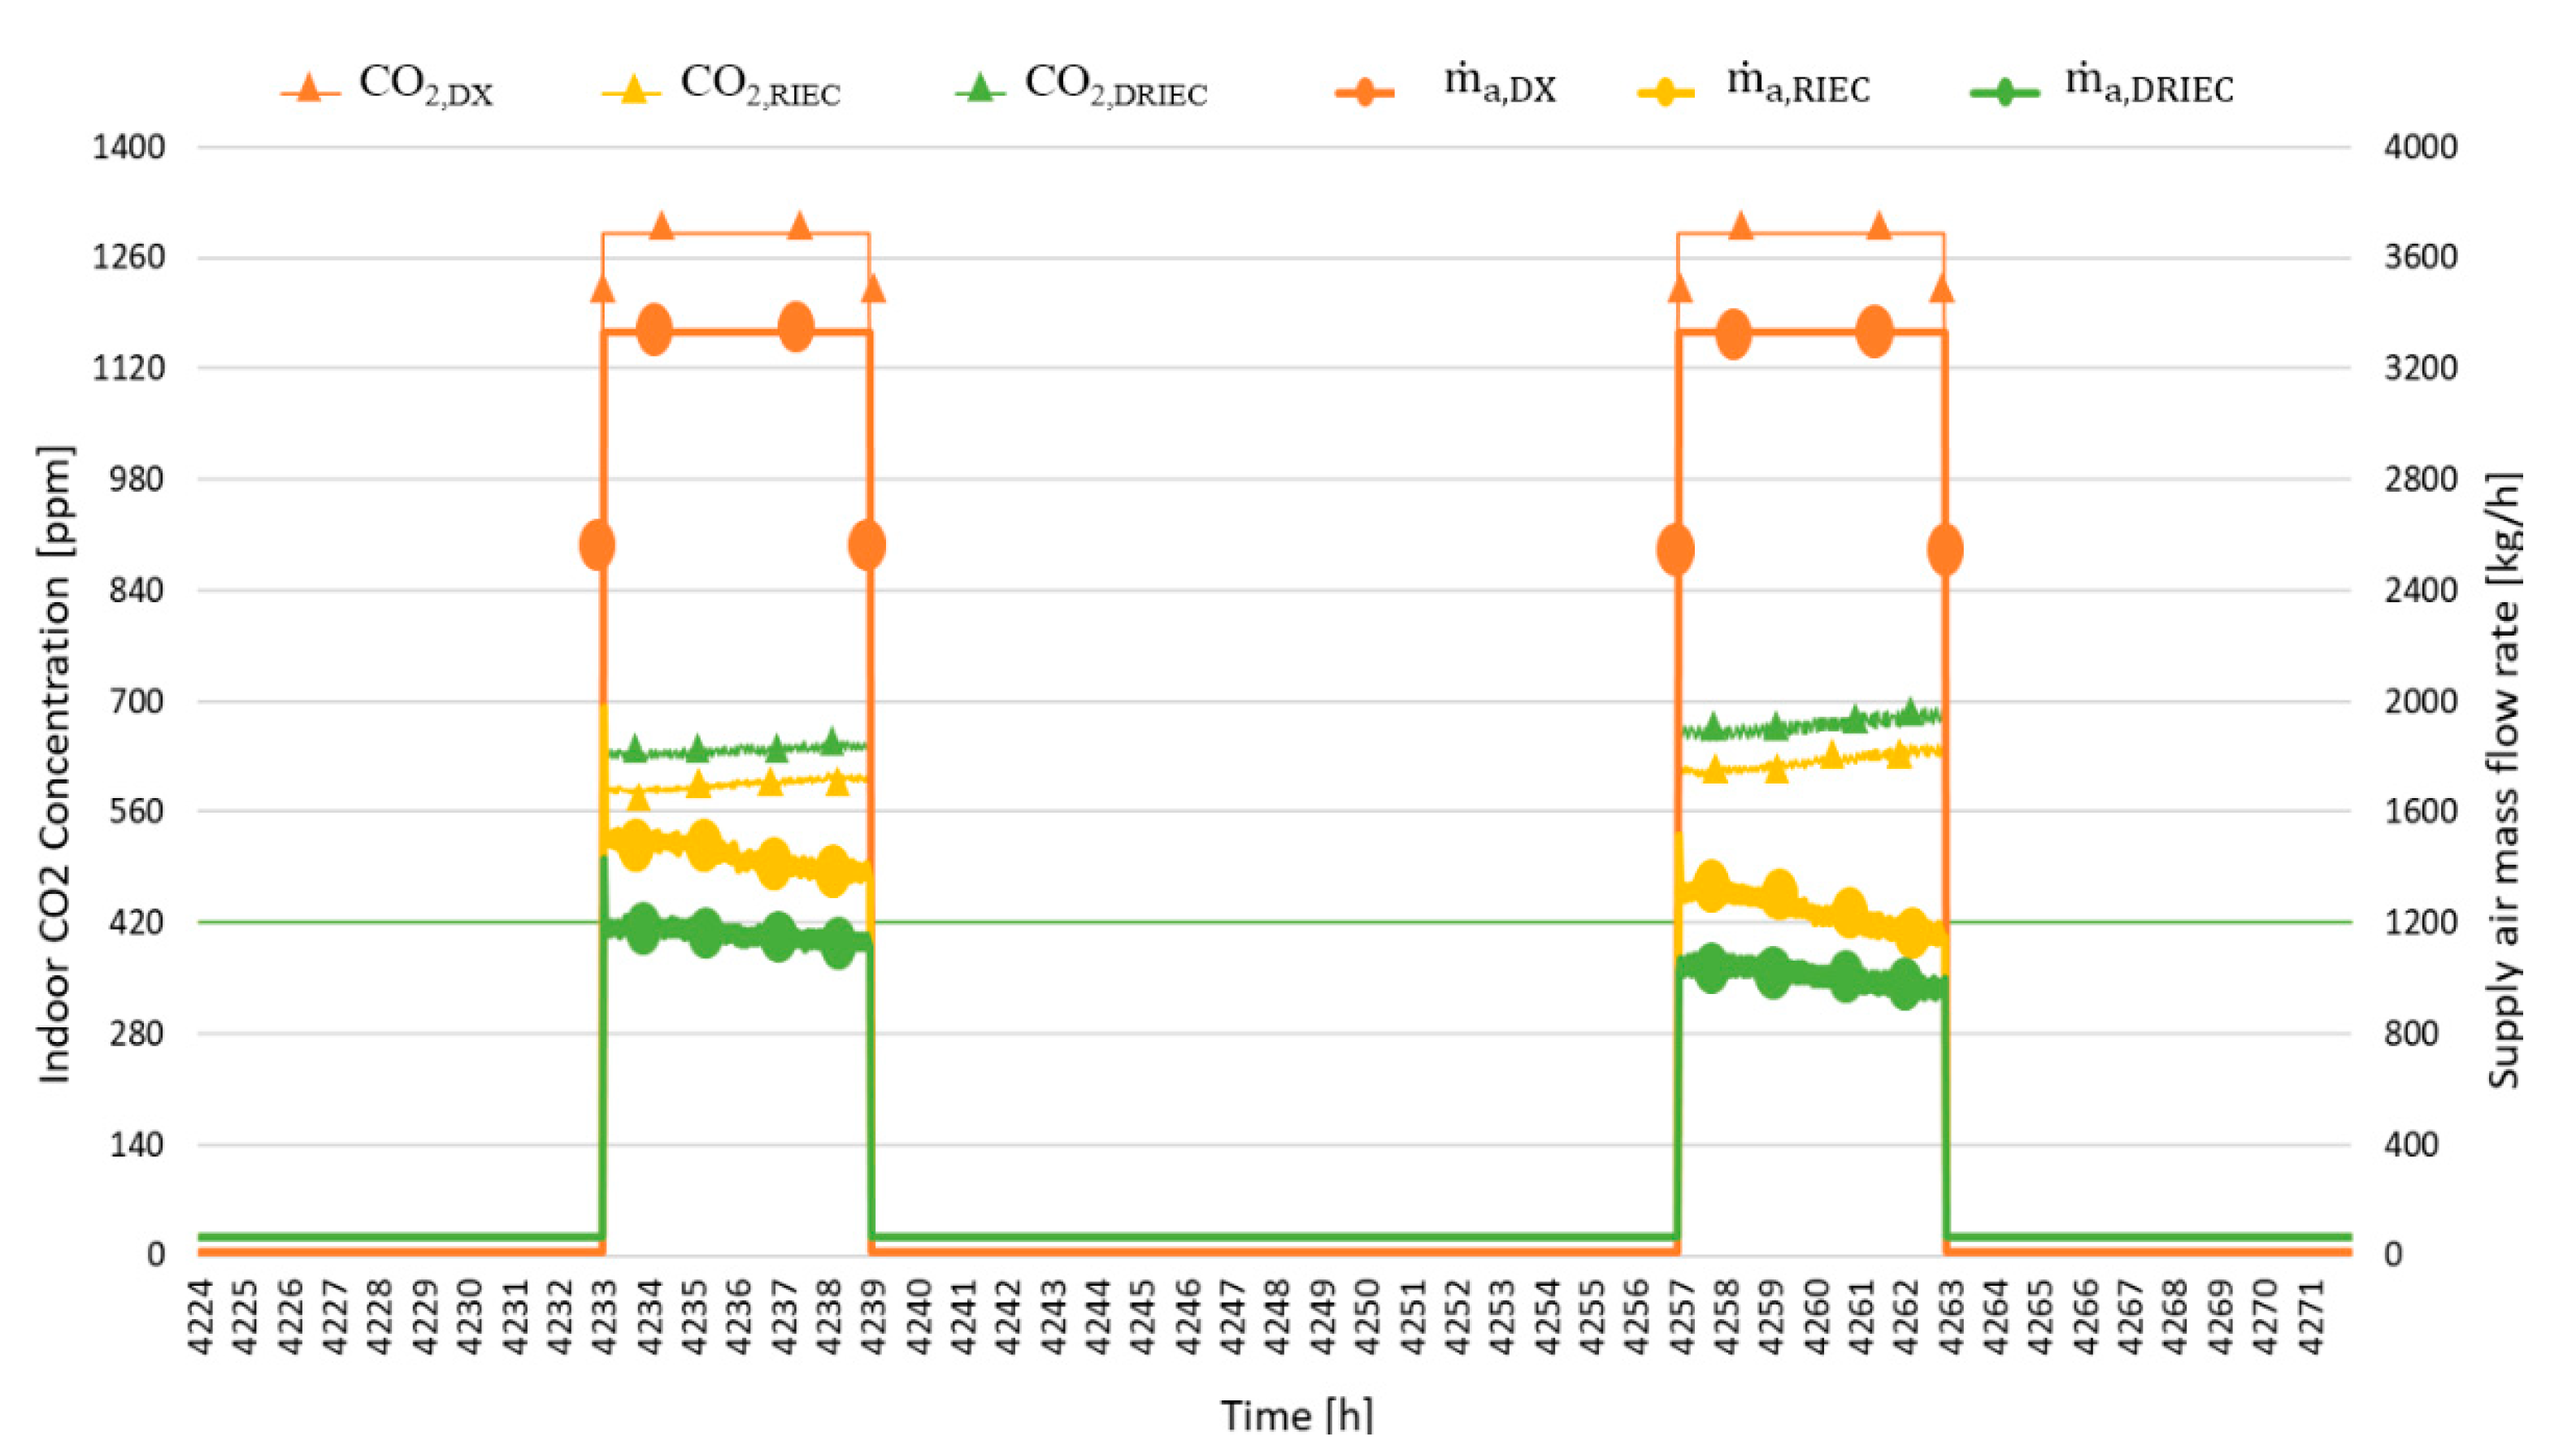
3.2.1. Daily Analysis of the Air-Cooling Systems
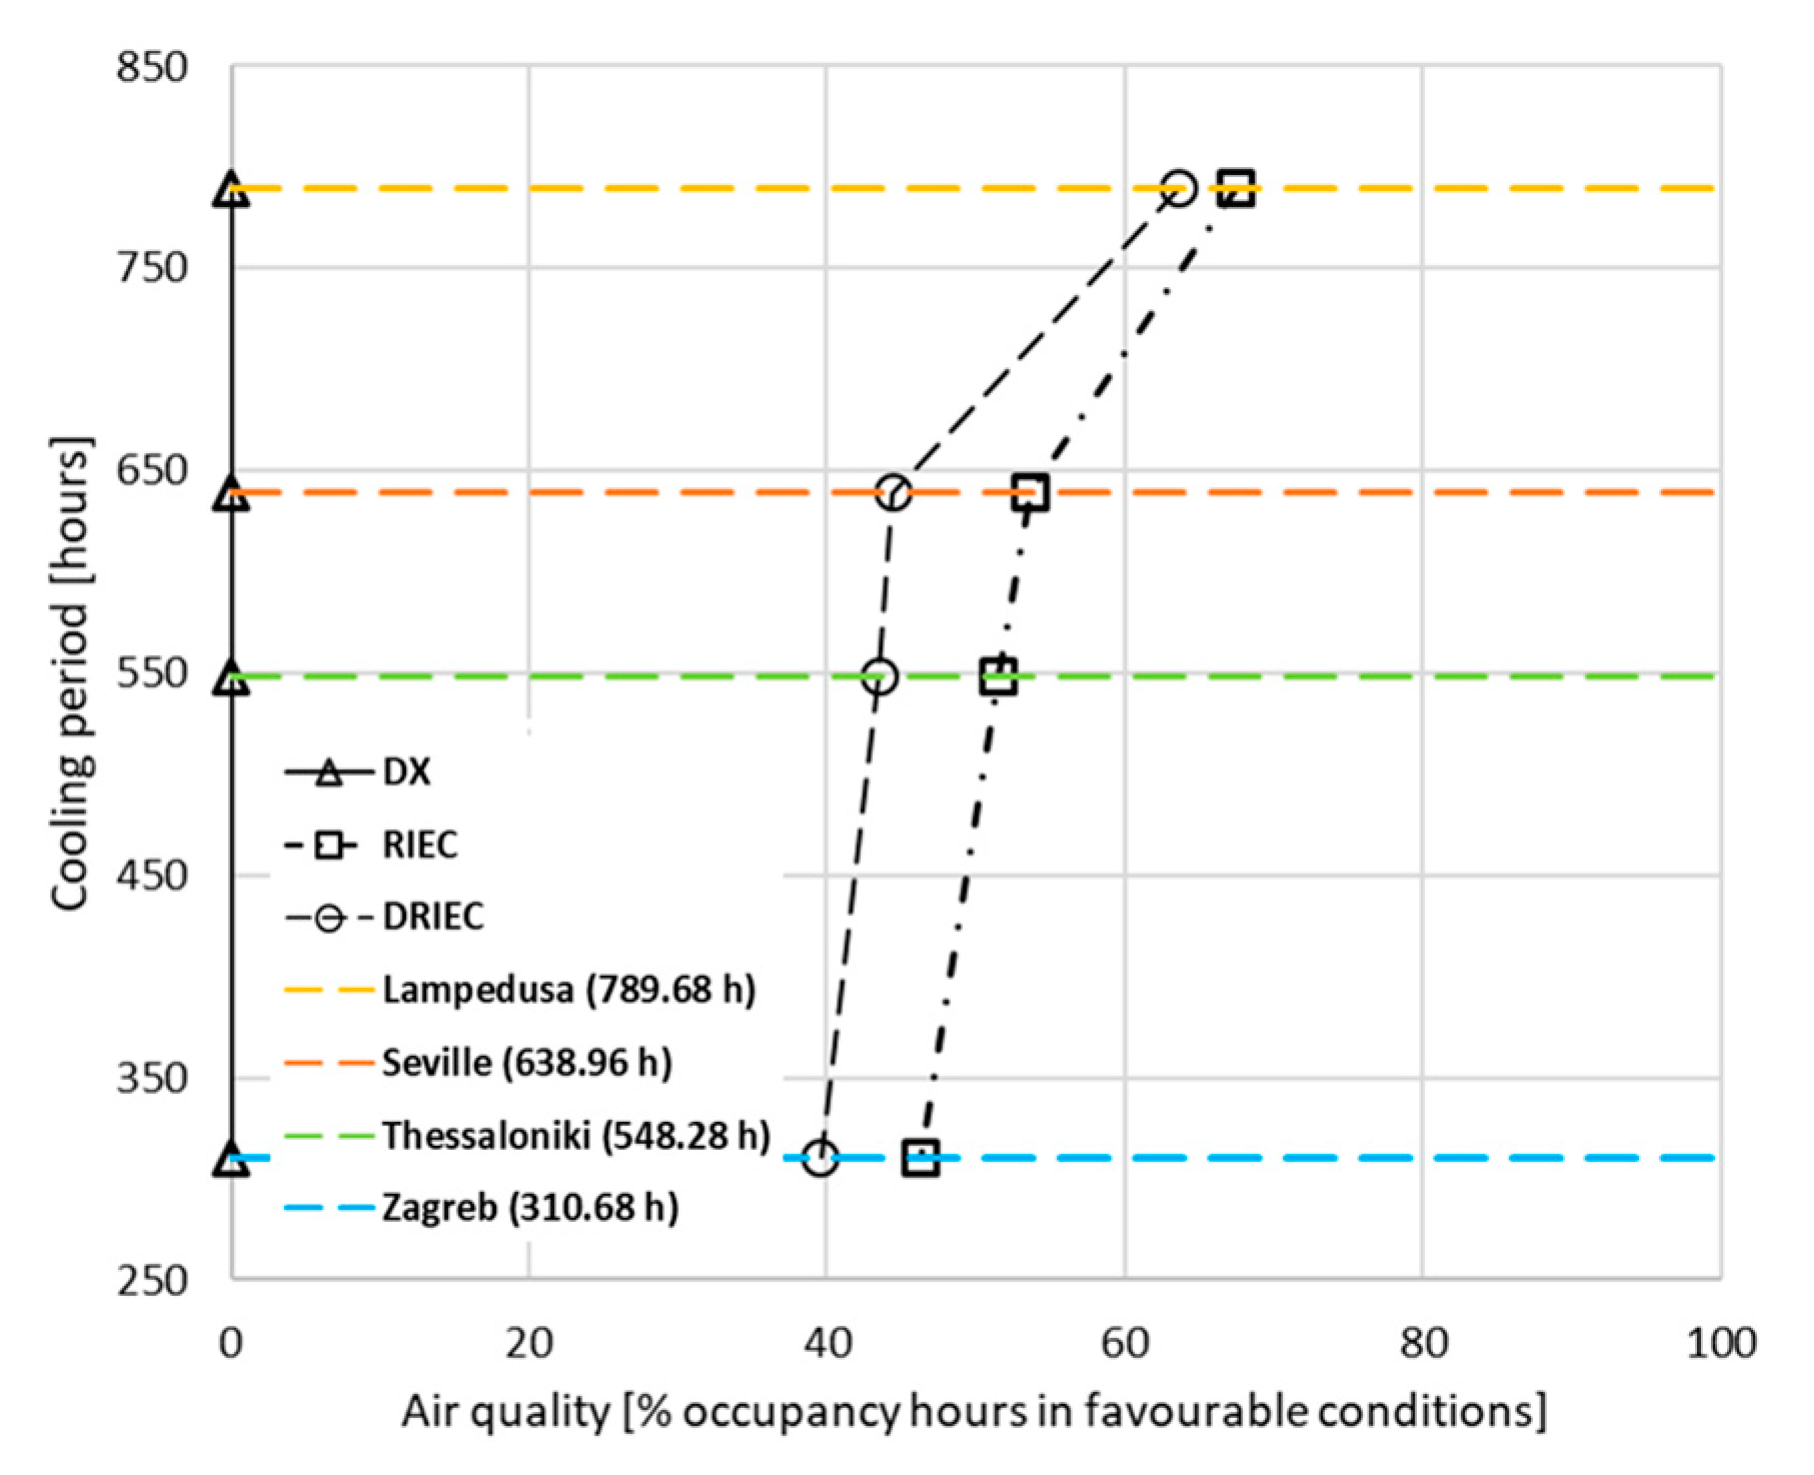
3.2.2. Annual Air Quality Results
3.3. Energy Consumption
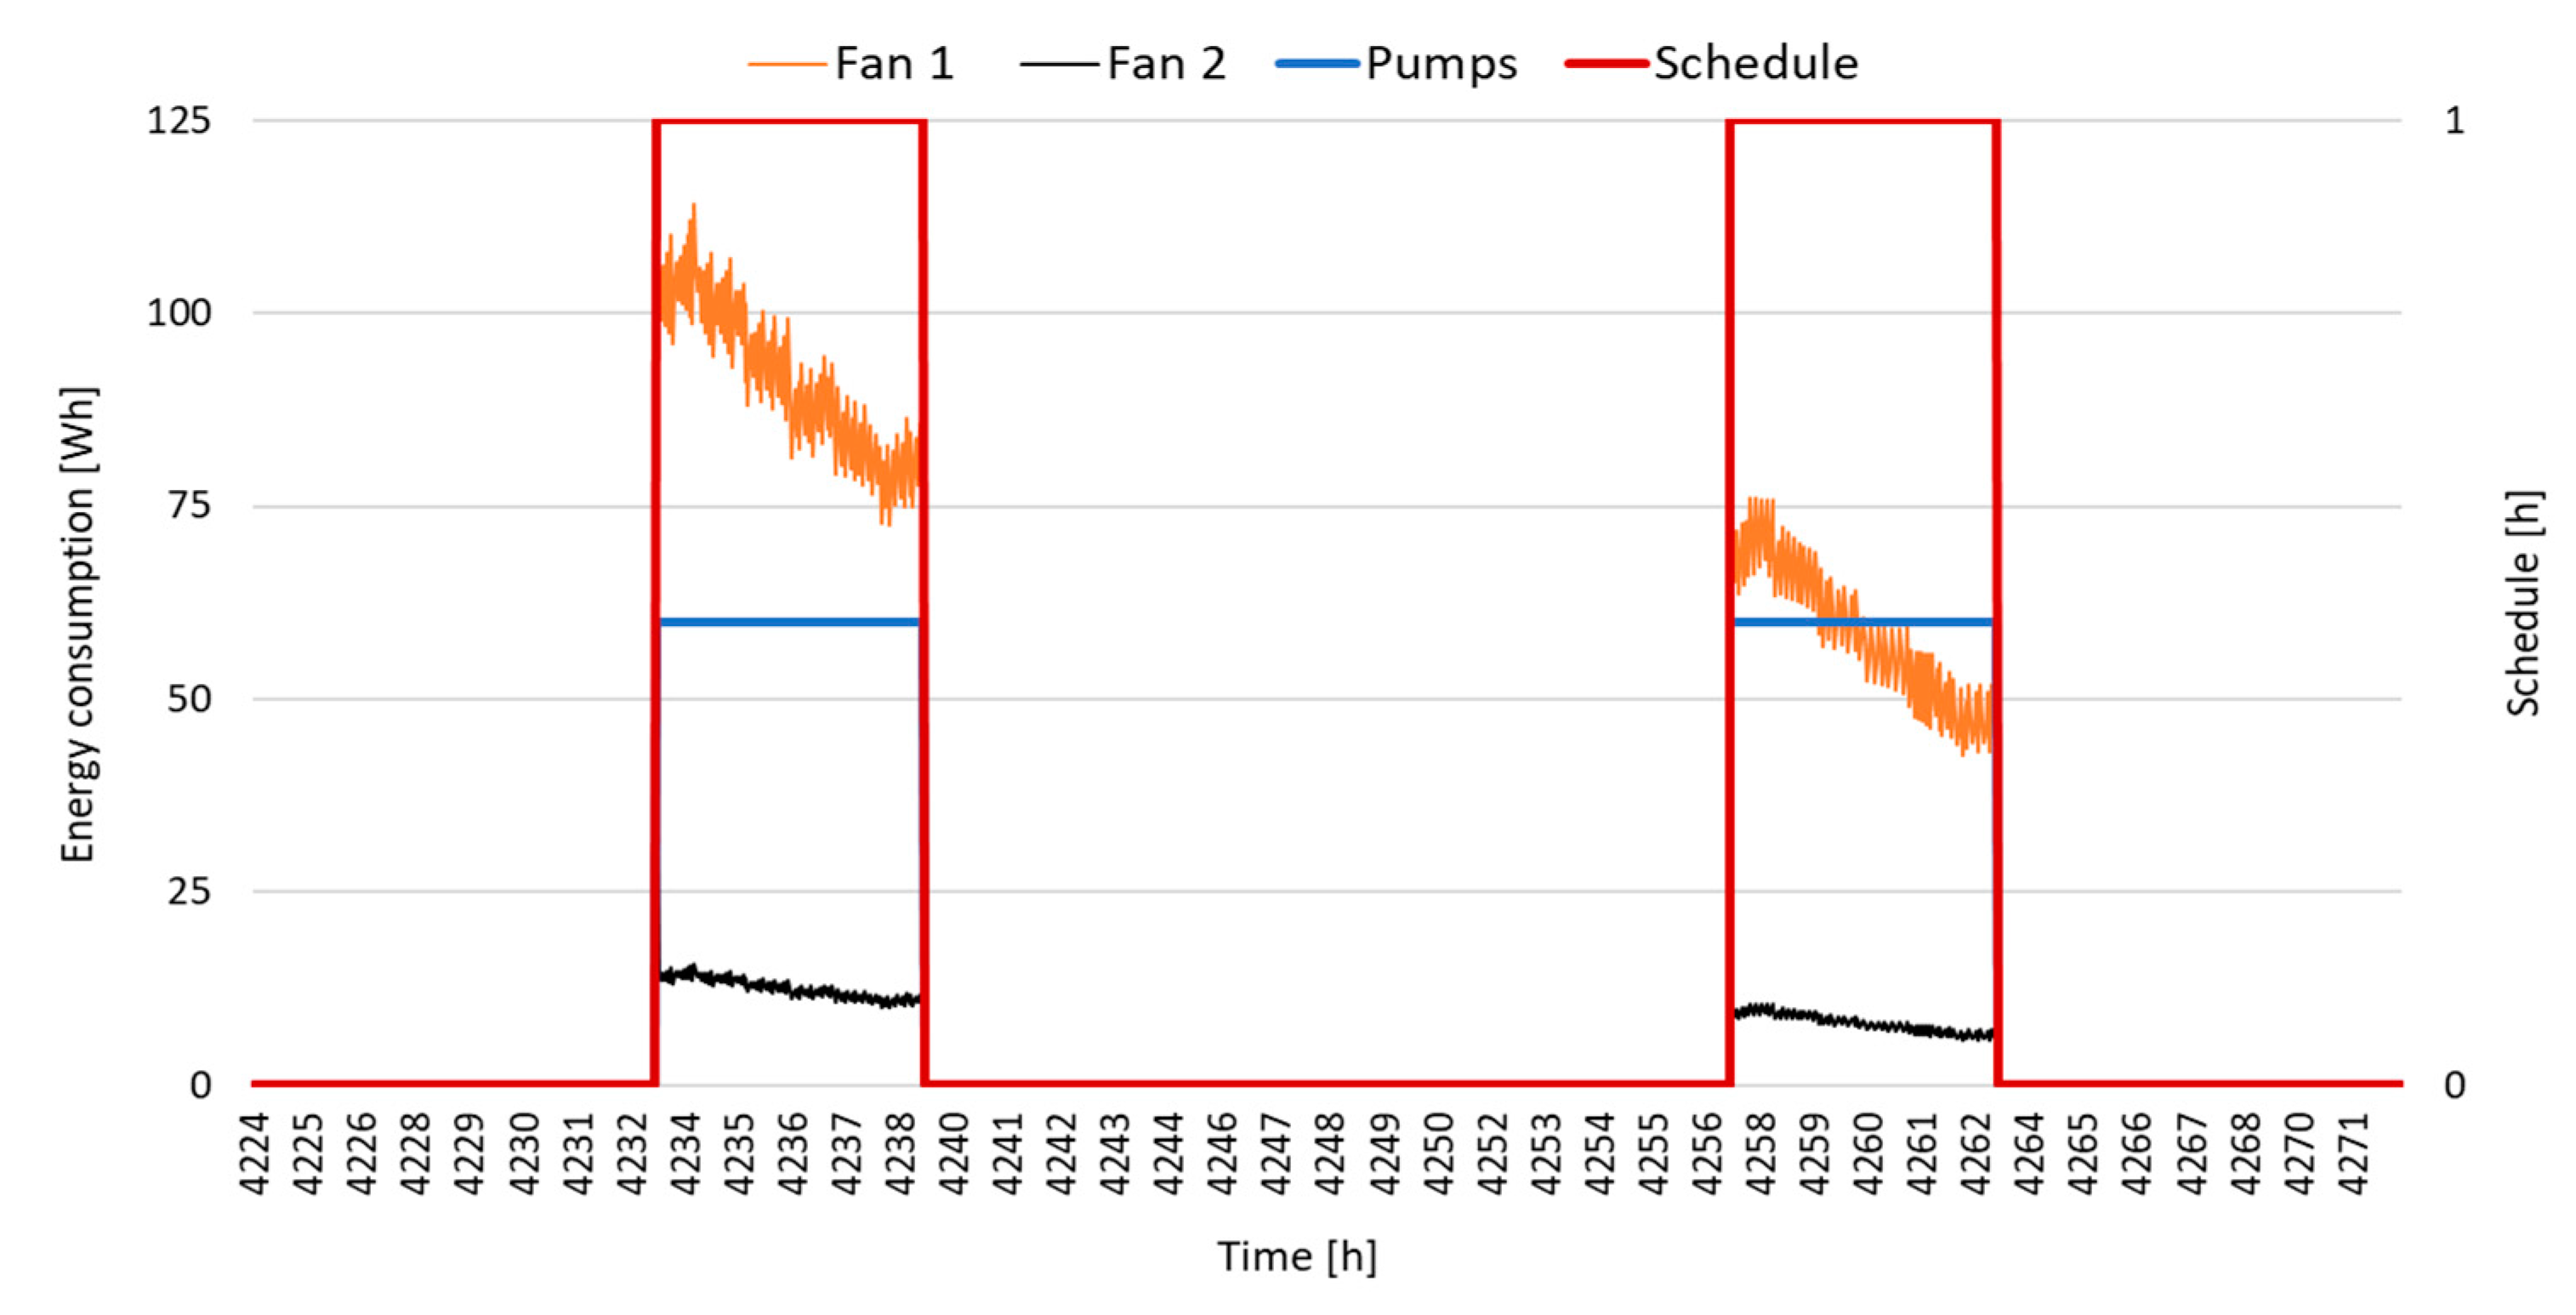
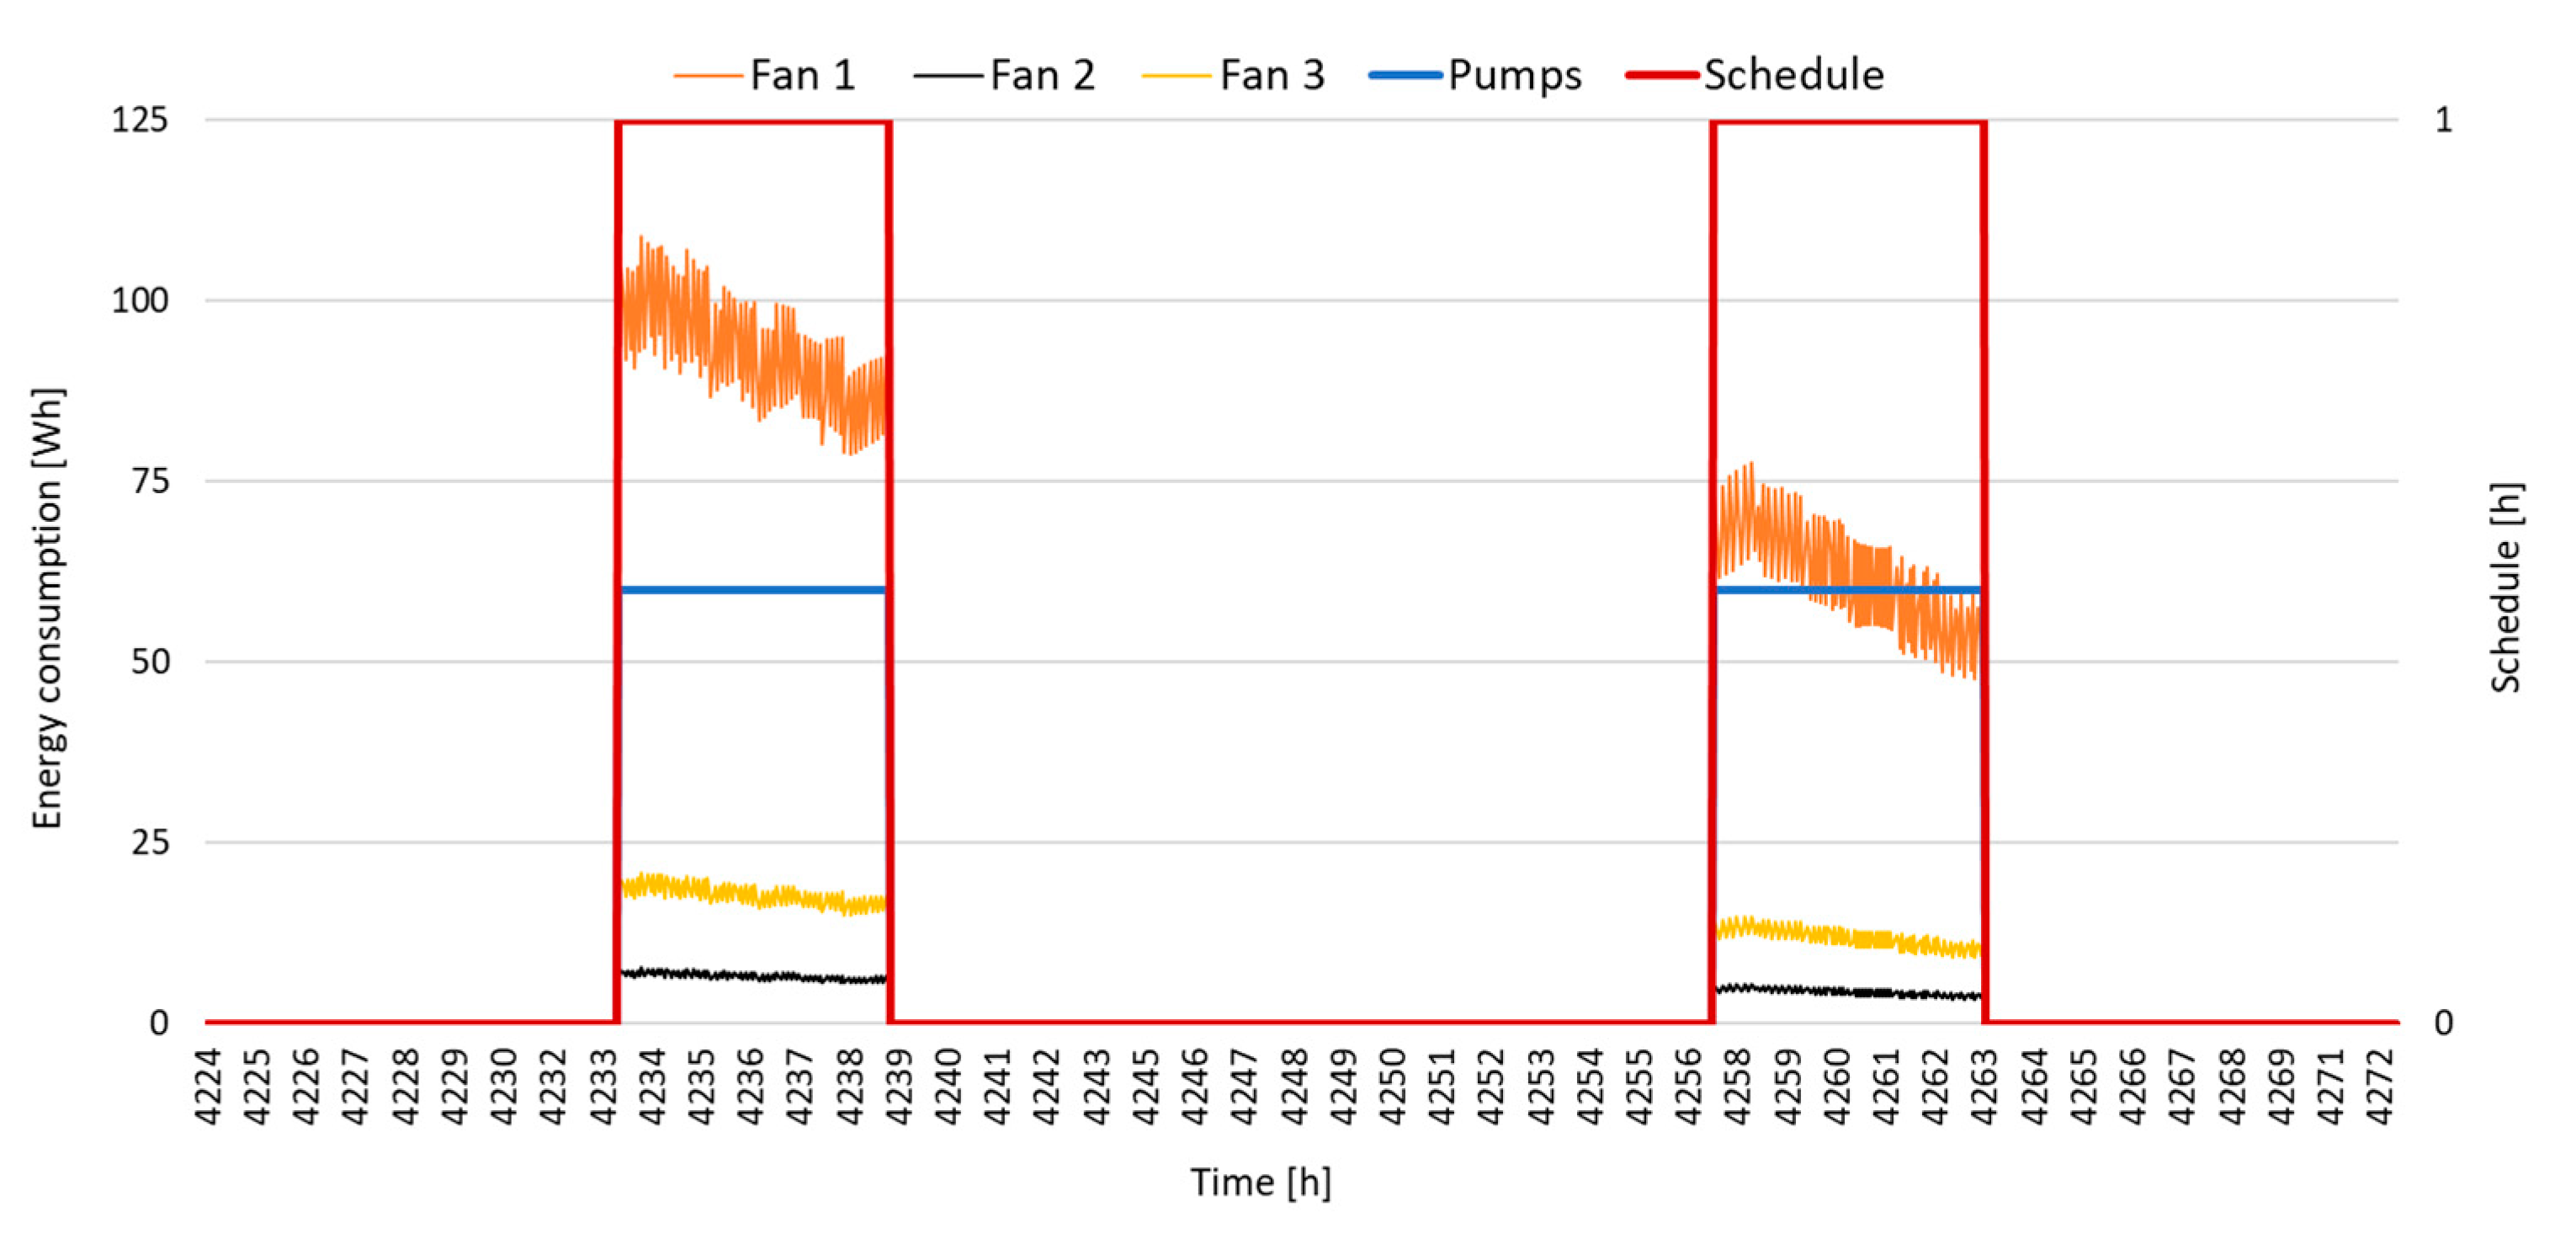
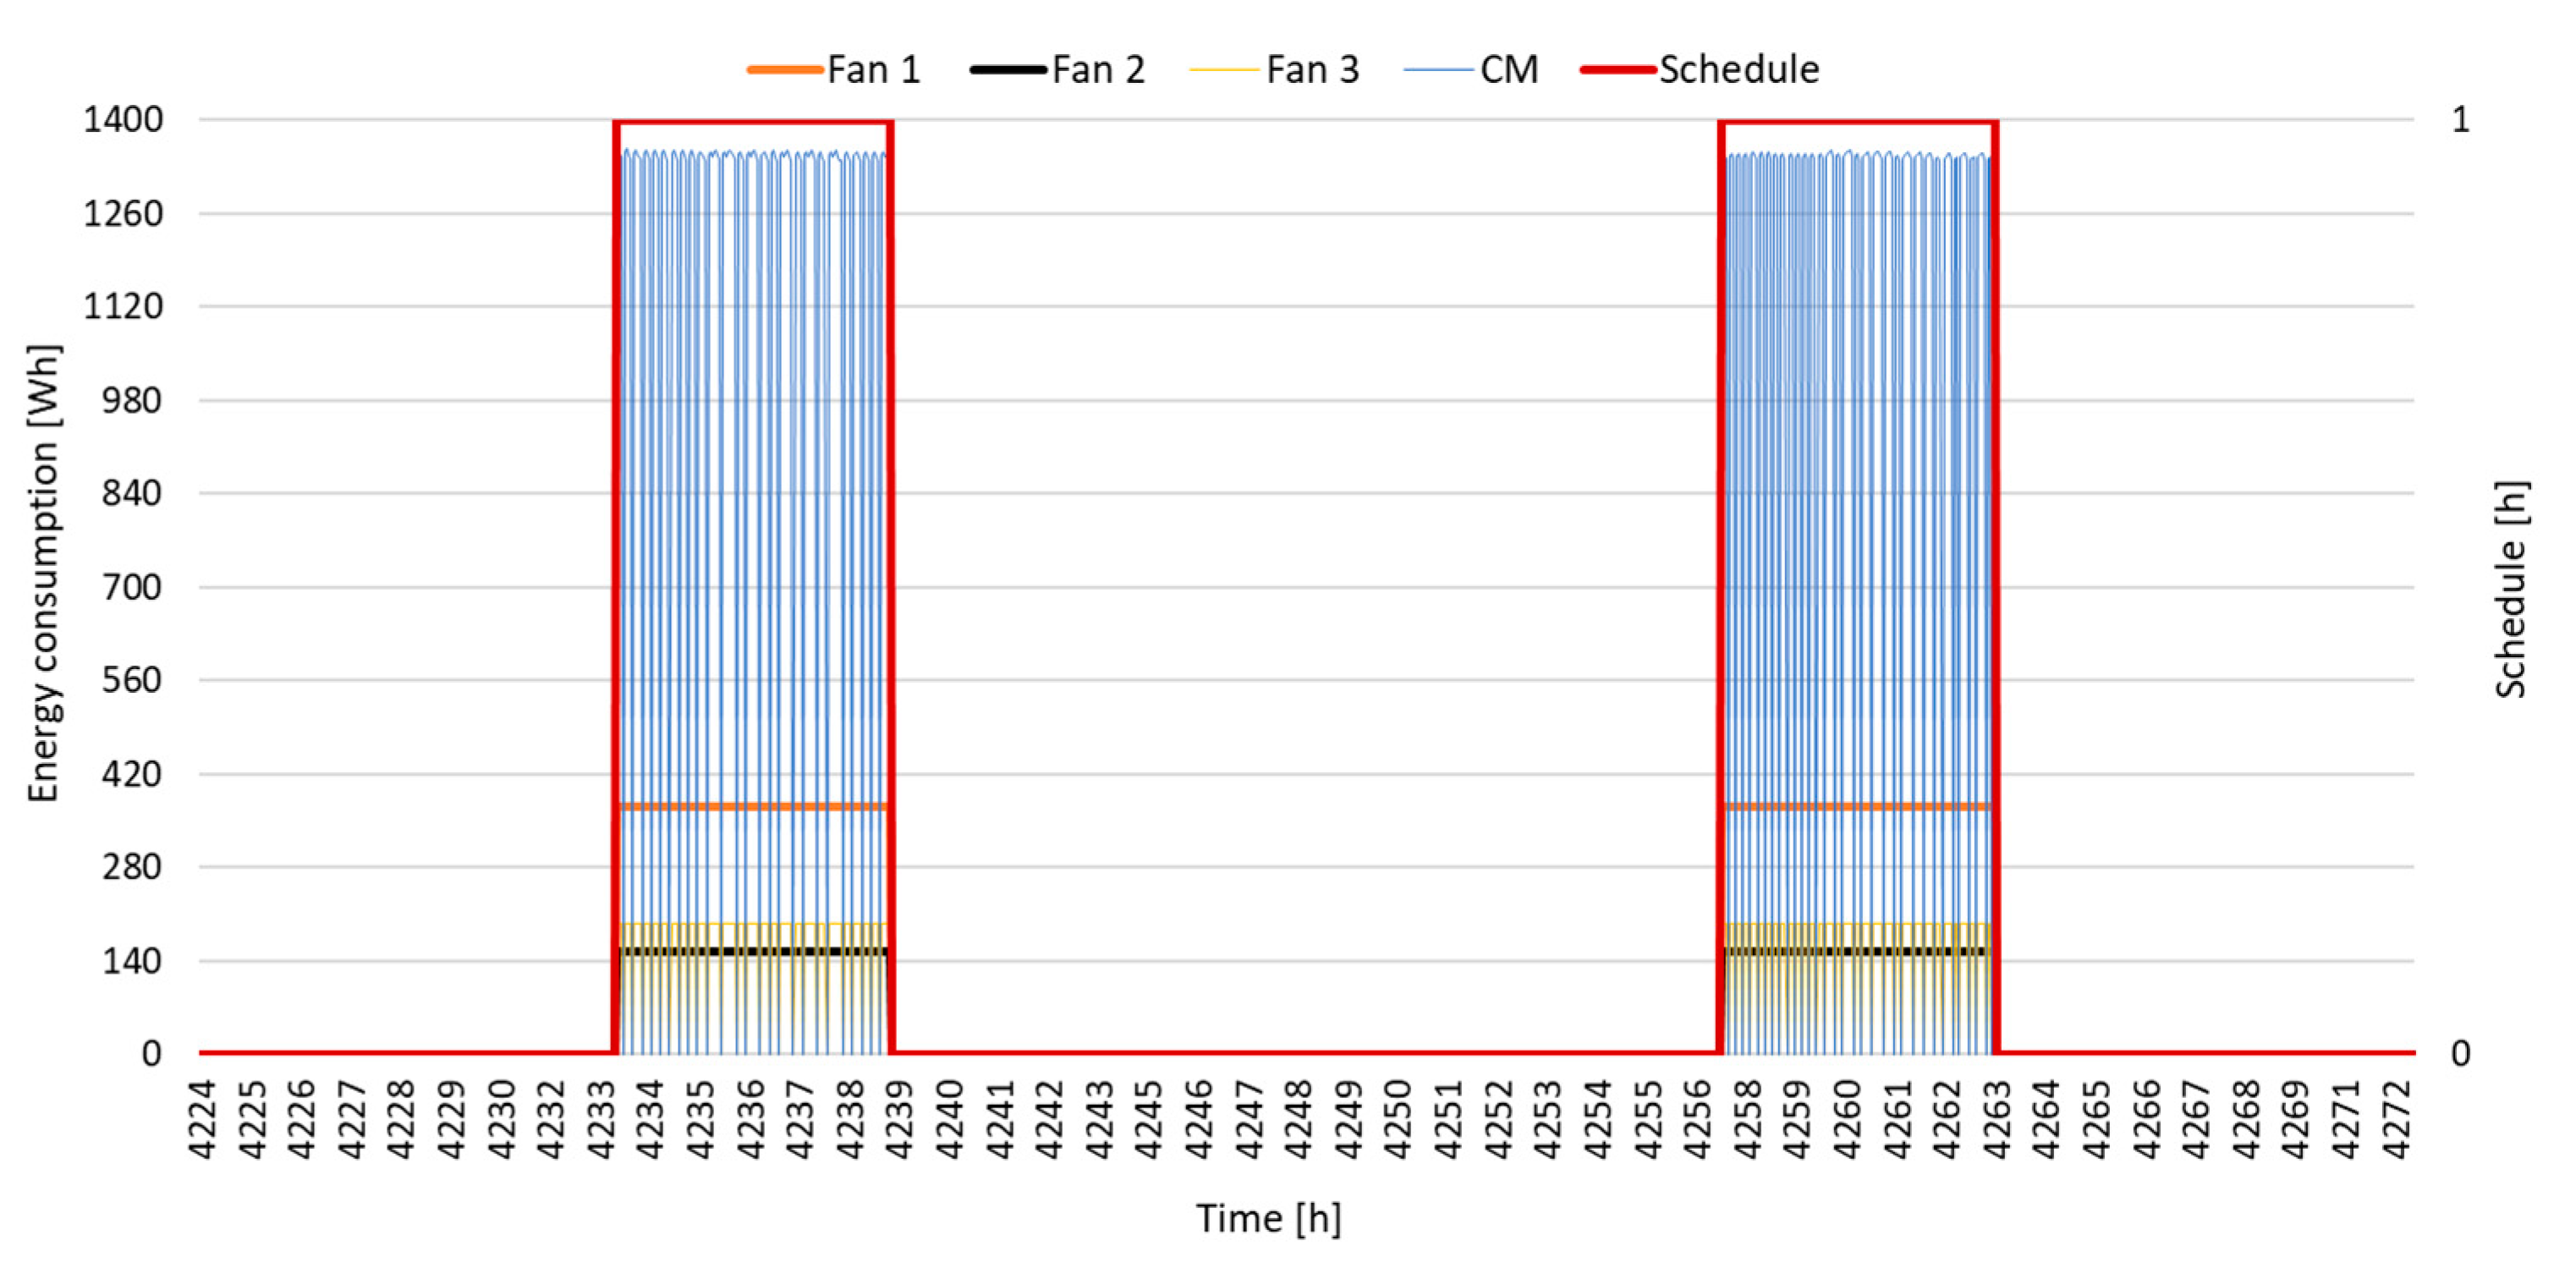
3.3.1. Daily Analysis of the Air-Cooling Systems
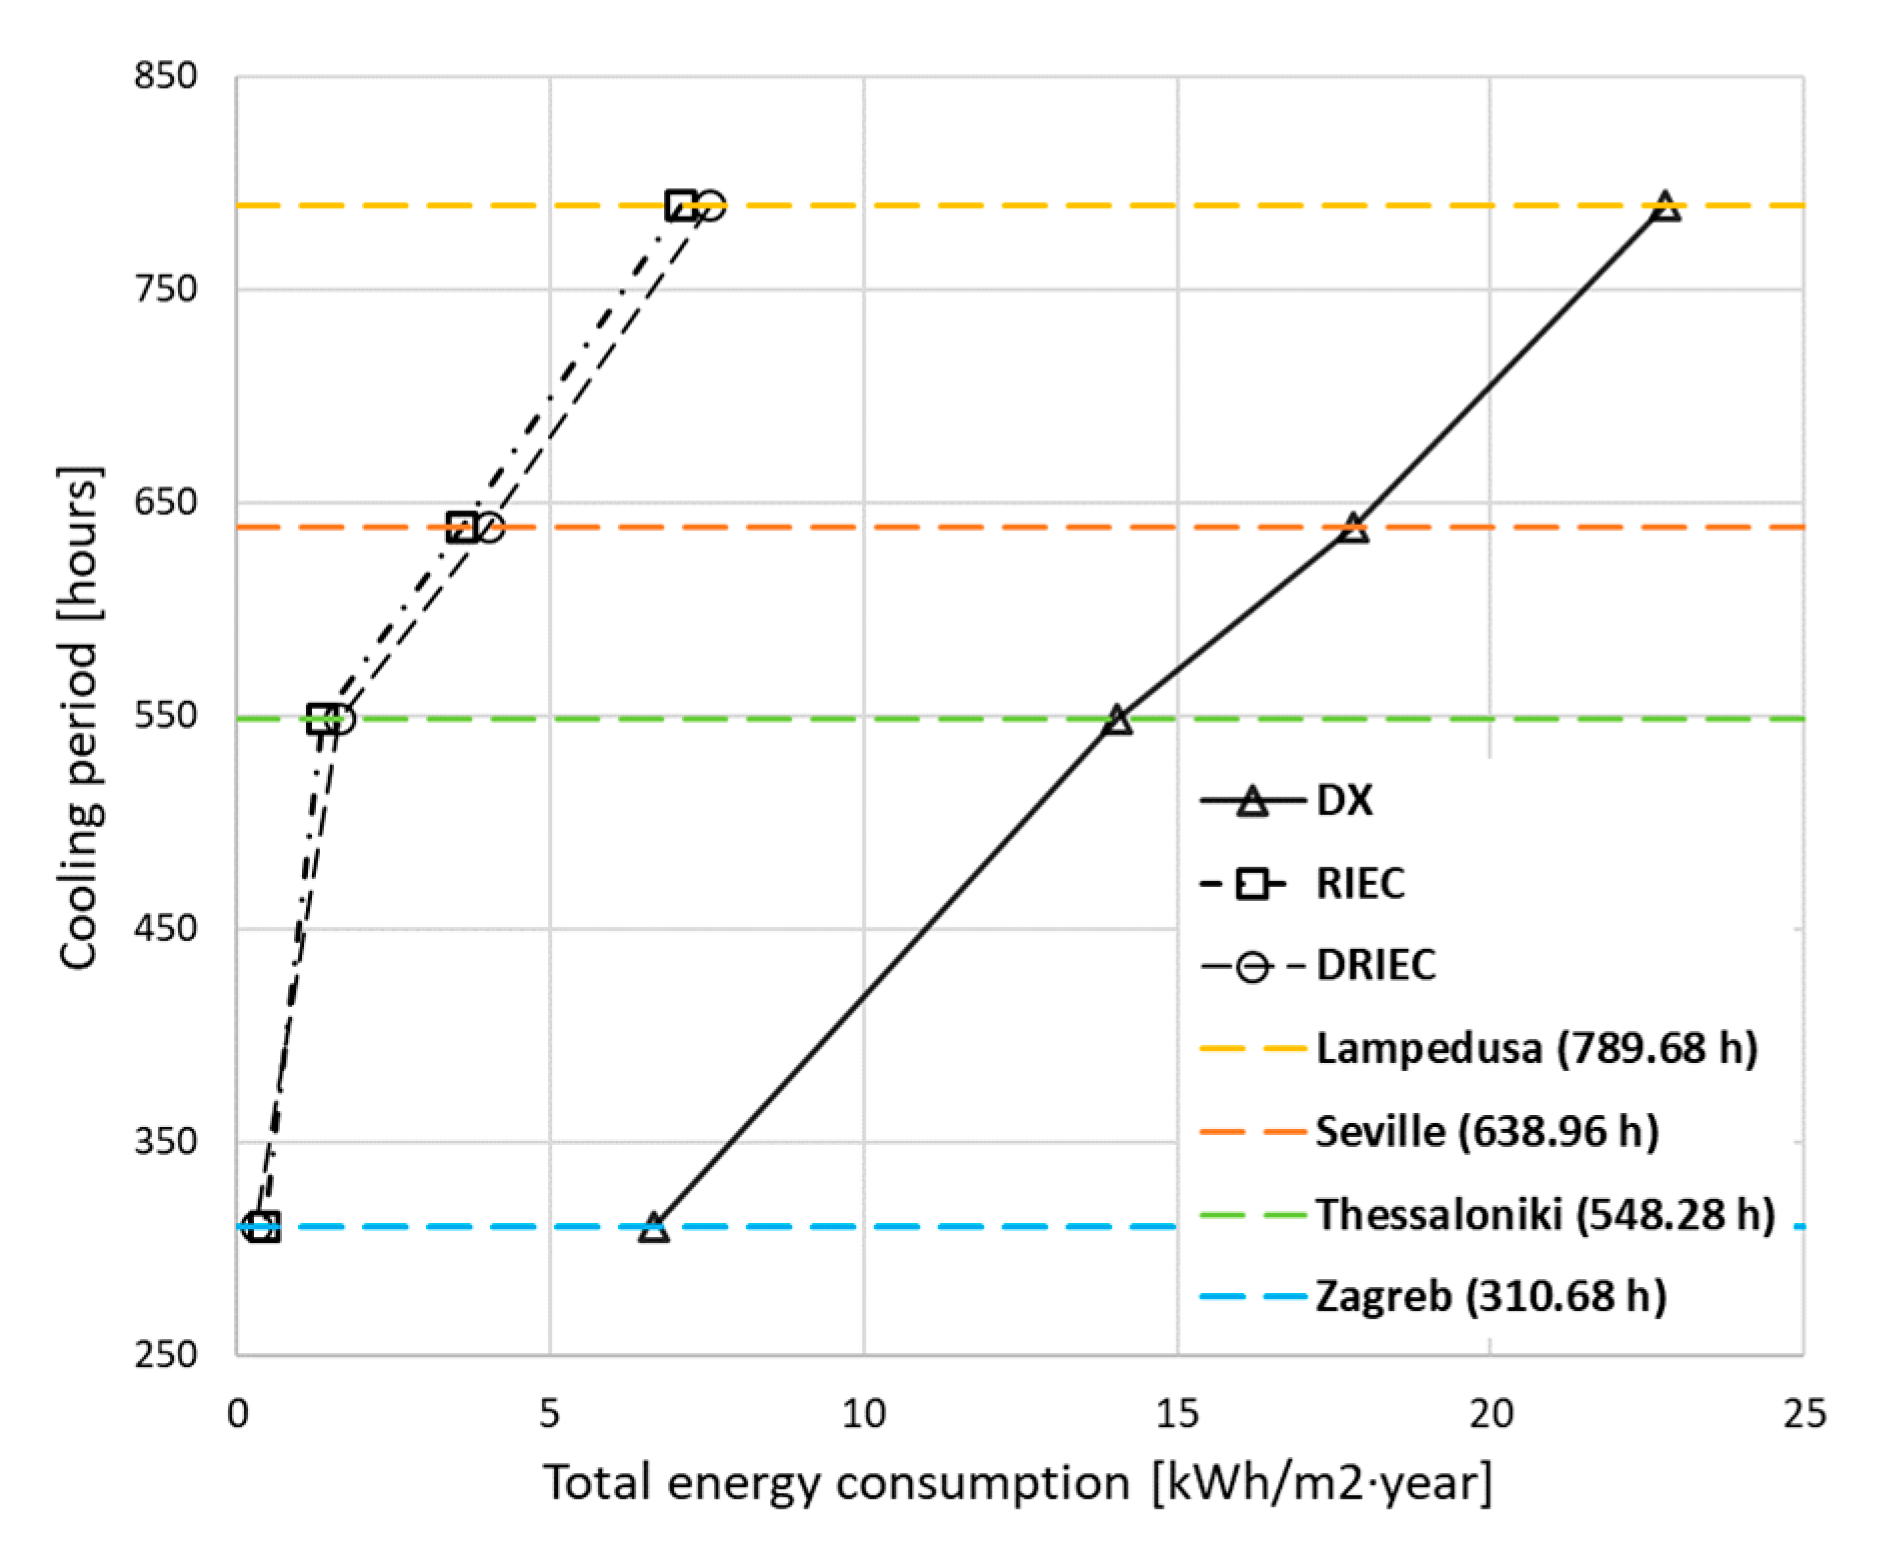
3.3.2. Annual Energy Consumption Results
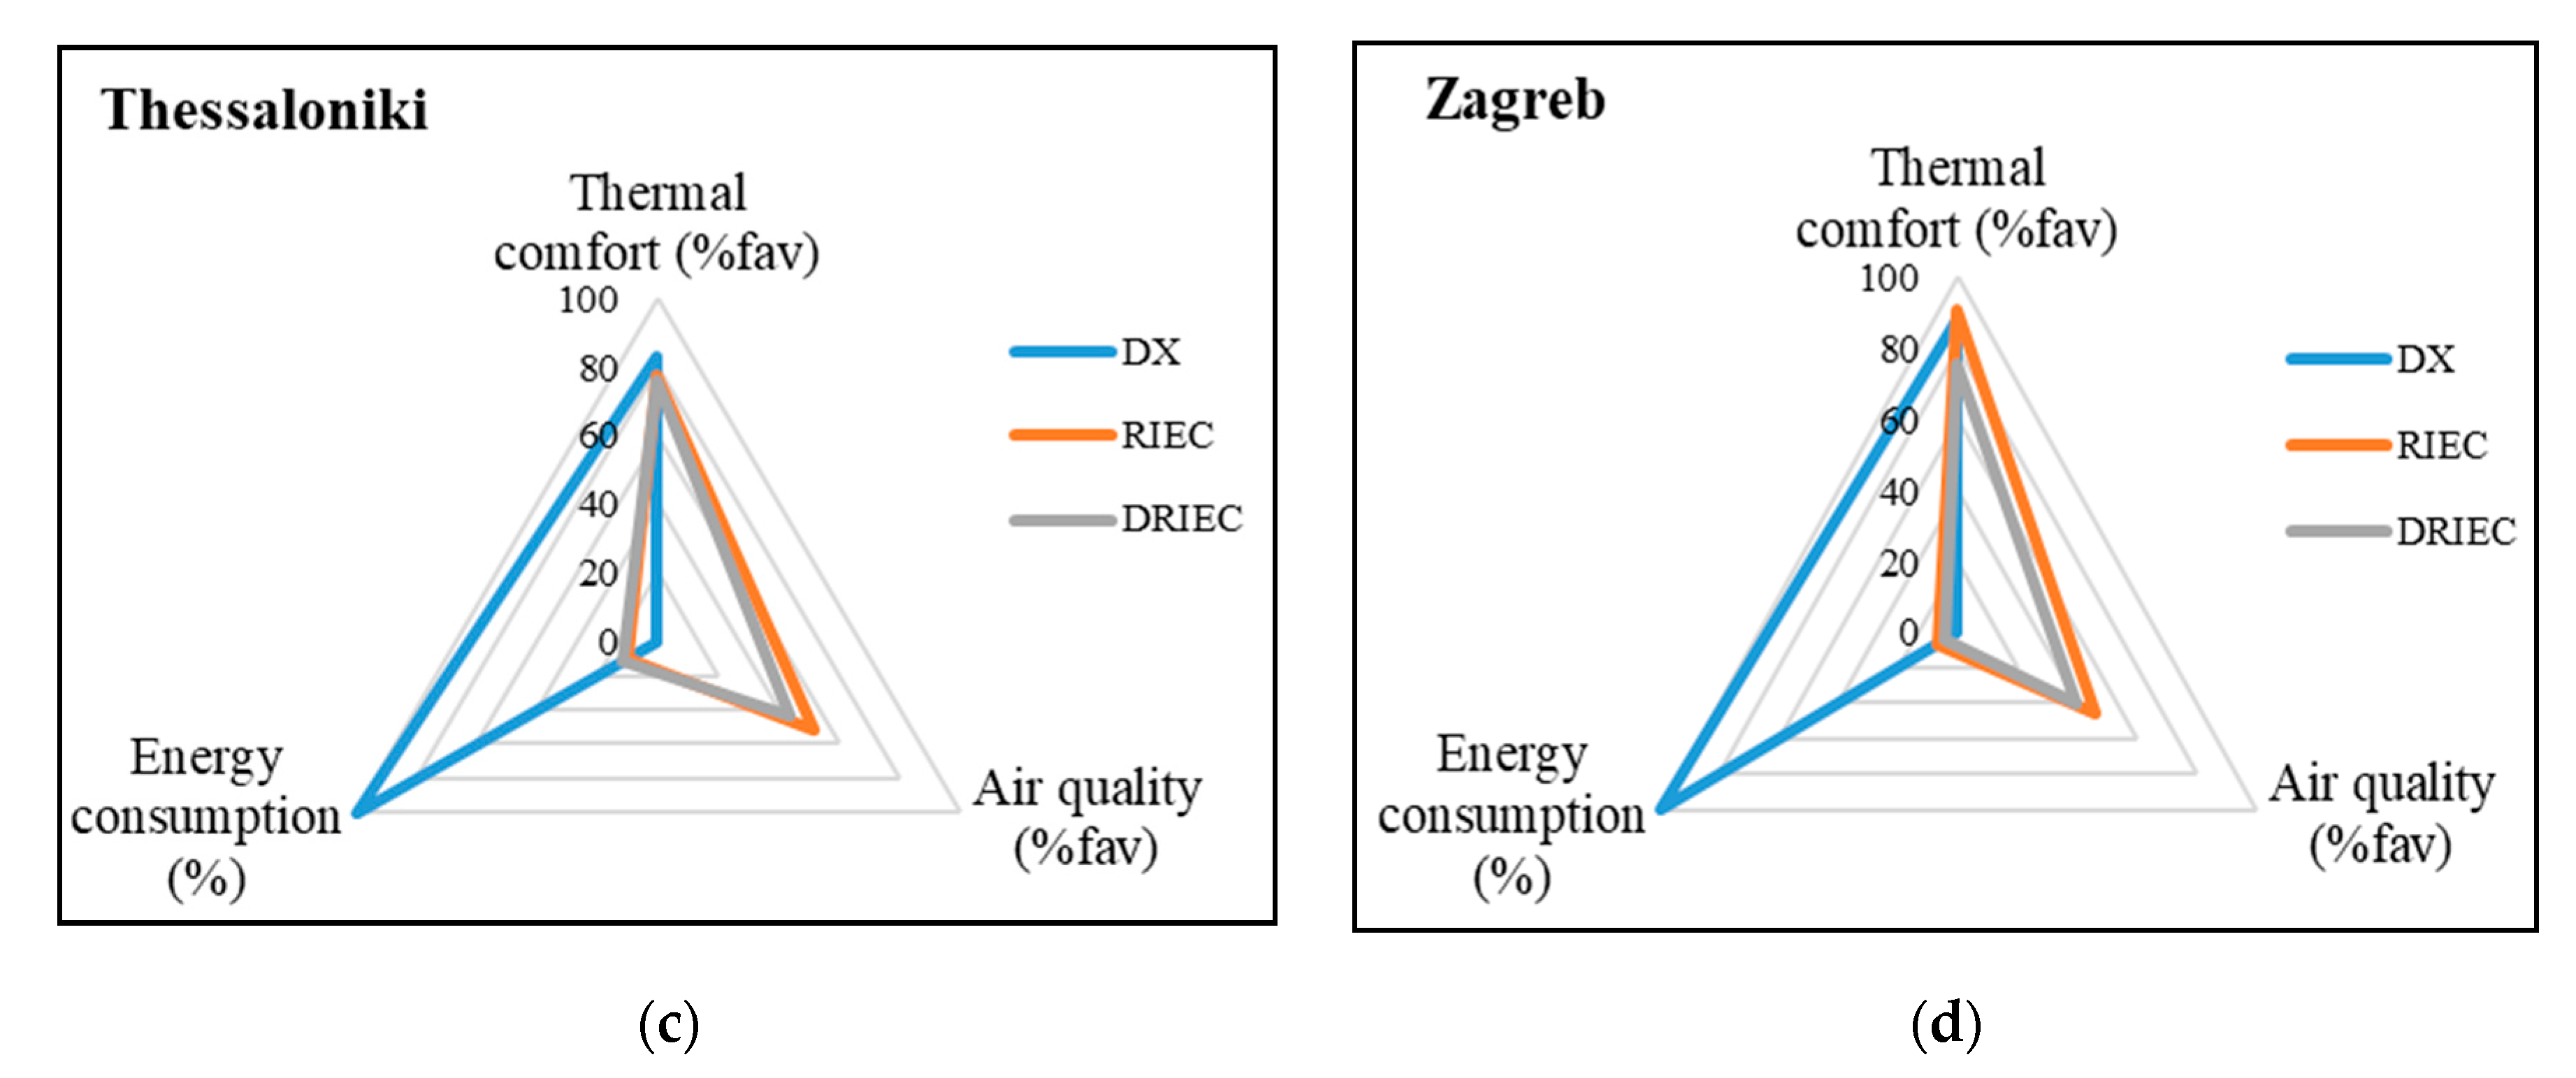
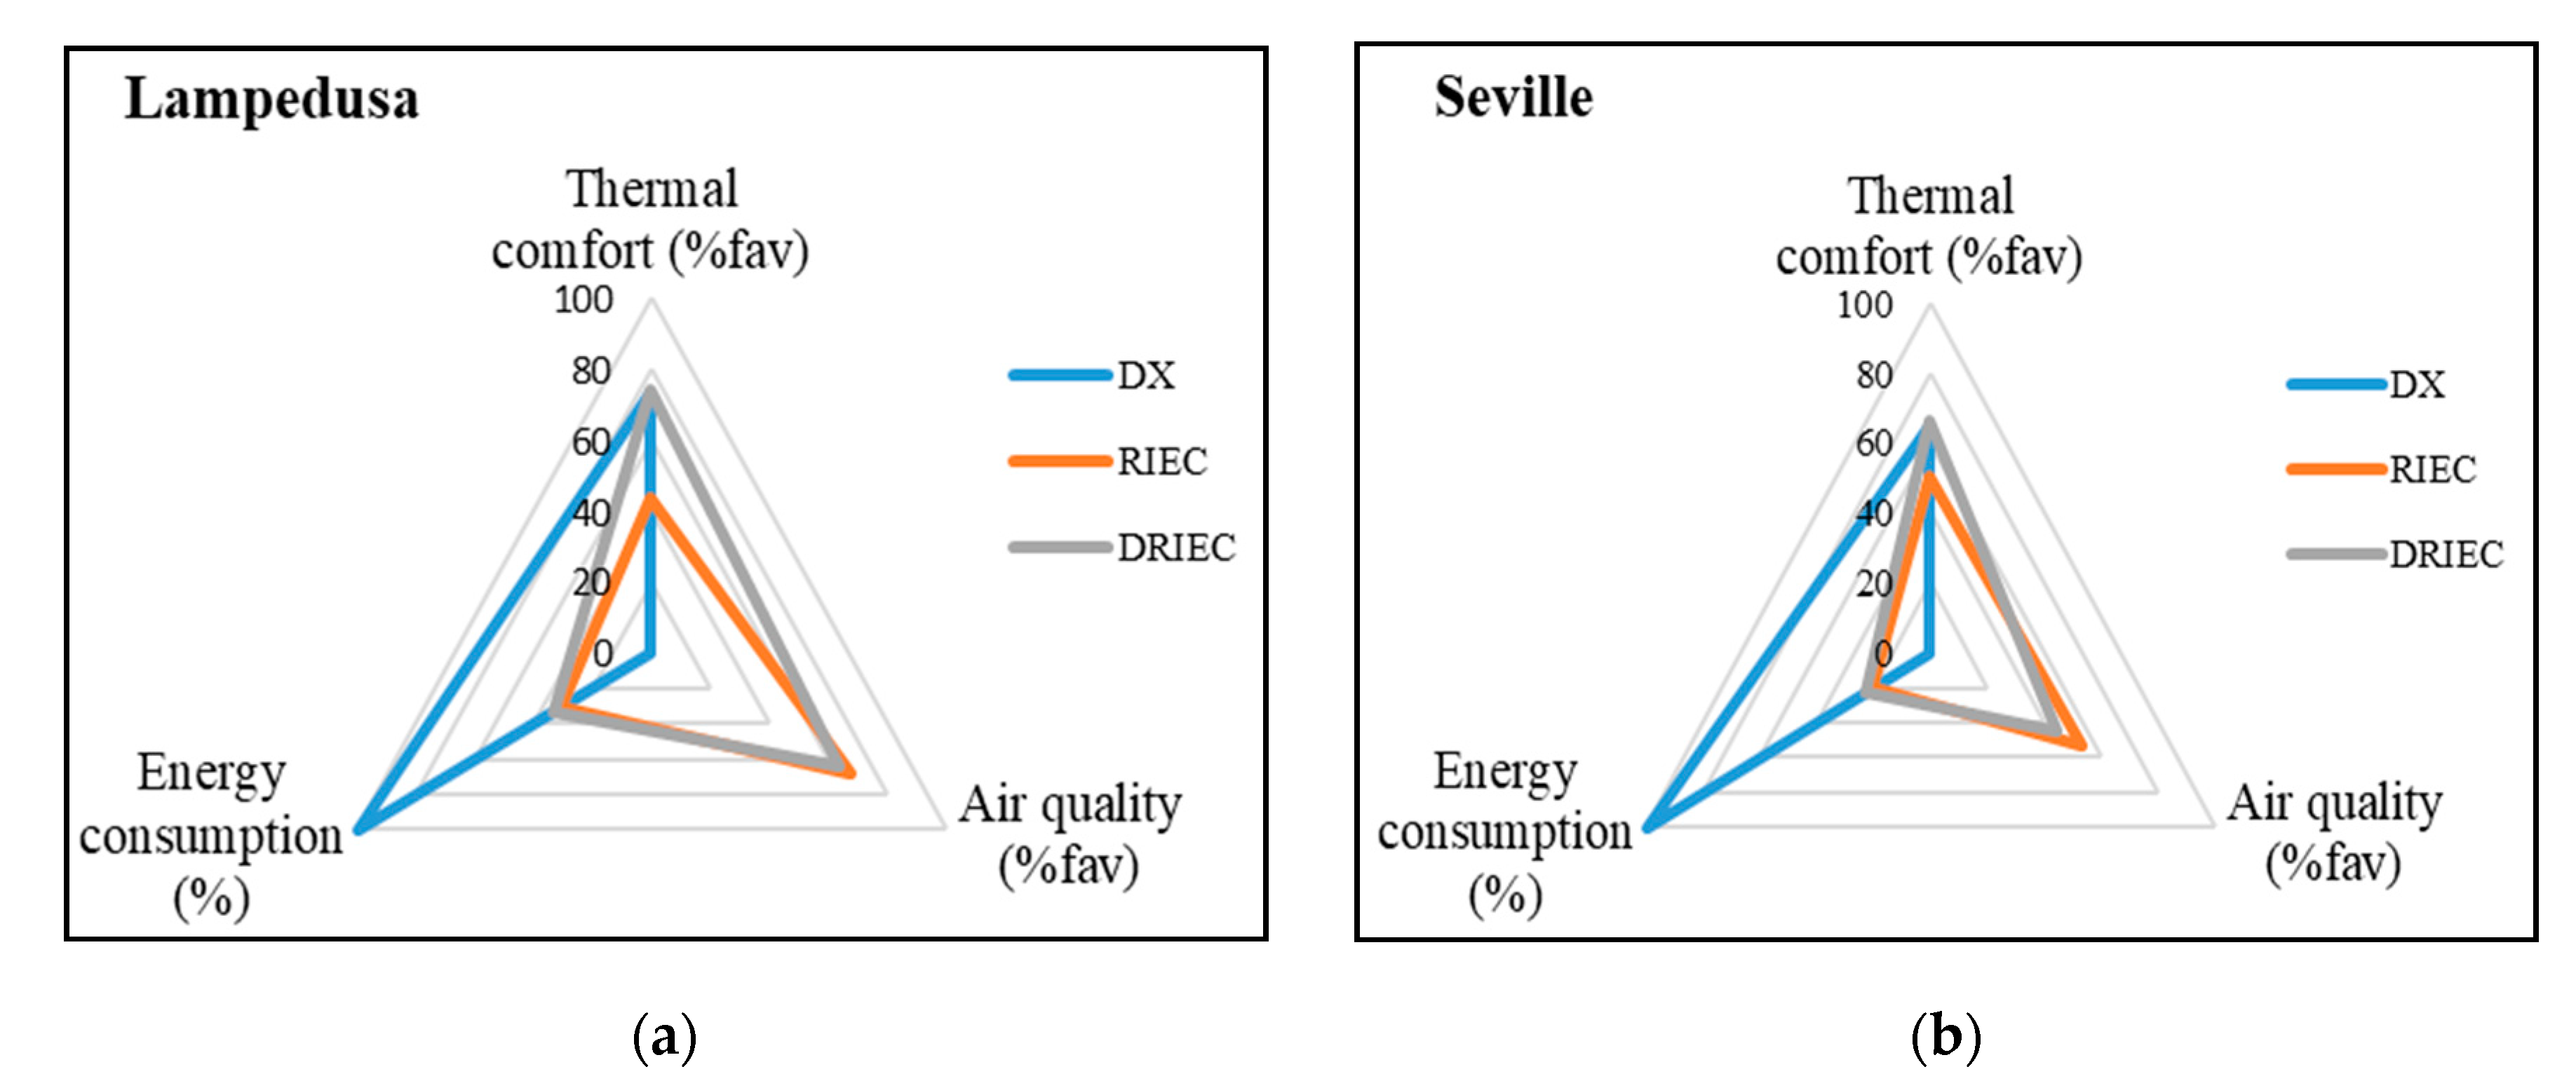
3.4. Comparative Analysis of Air-Cooling Systems and Climate Zones
4. Conclusions
- Thermal comfort: the most favorable conditions were obtained with the DX and DRIEC systems to serve a standard classroom in Lampedusa and Seville climates, with 74.3% and 66.1% of cooling period in favorable thermal comfort conditions, respectively. The RIEC system achieved more unfavorable comfort conditions since the air supply humidity was no controlled. Due to the less climatic severity, the highest thermal comfort values were presented by the DX and RIEC for the climates of Thessaloniki and Zagreb, with percentages of 82.8% and 91.2%, respectively.
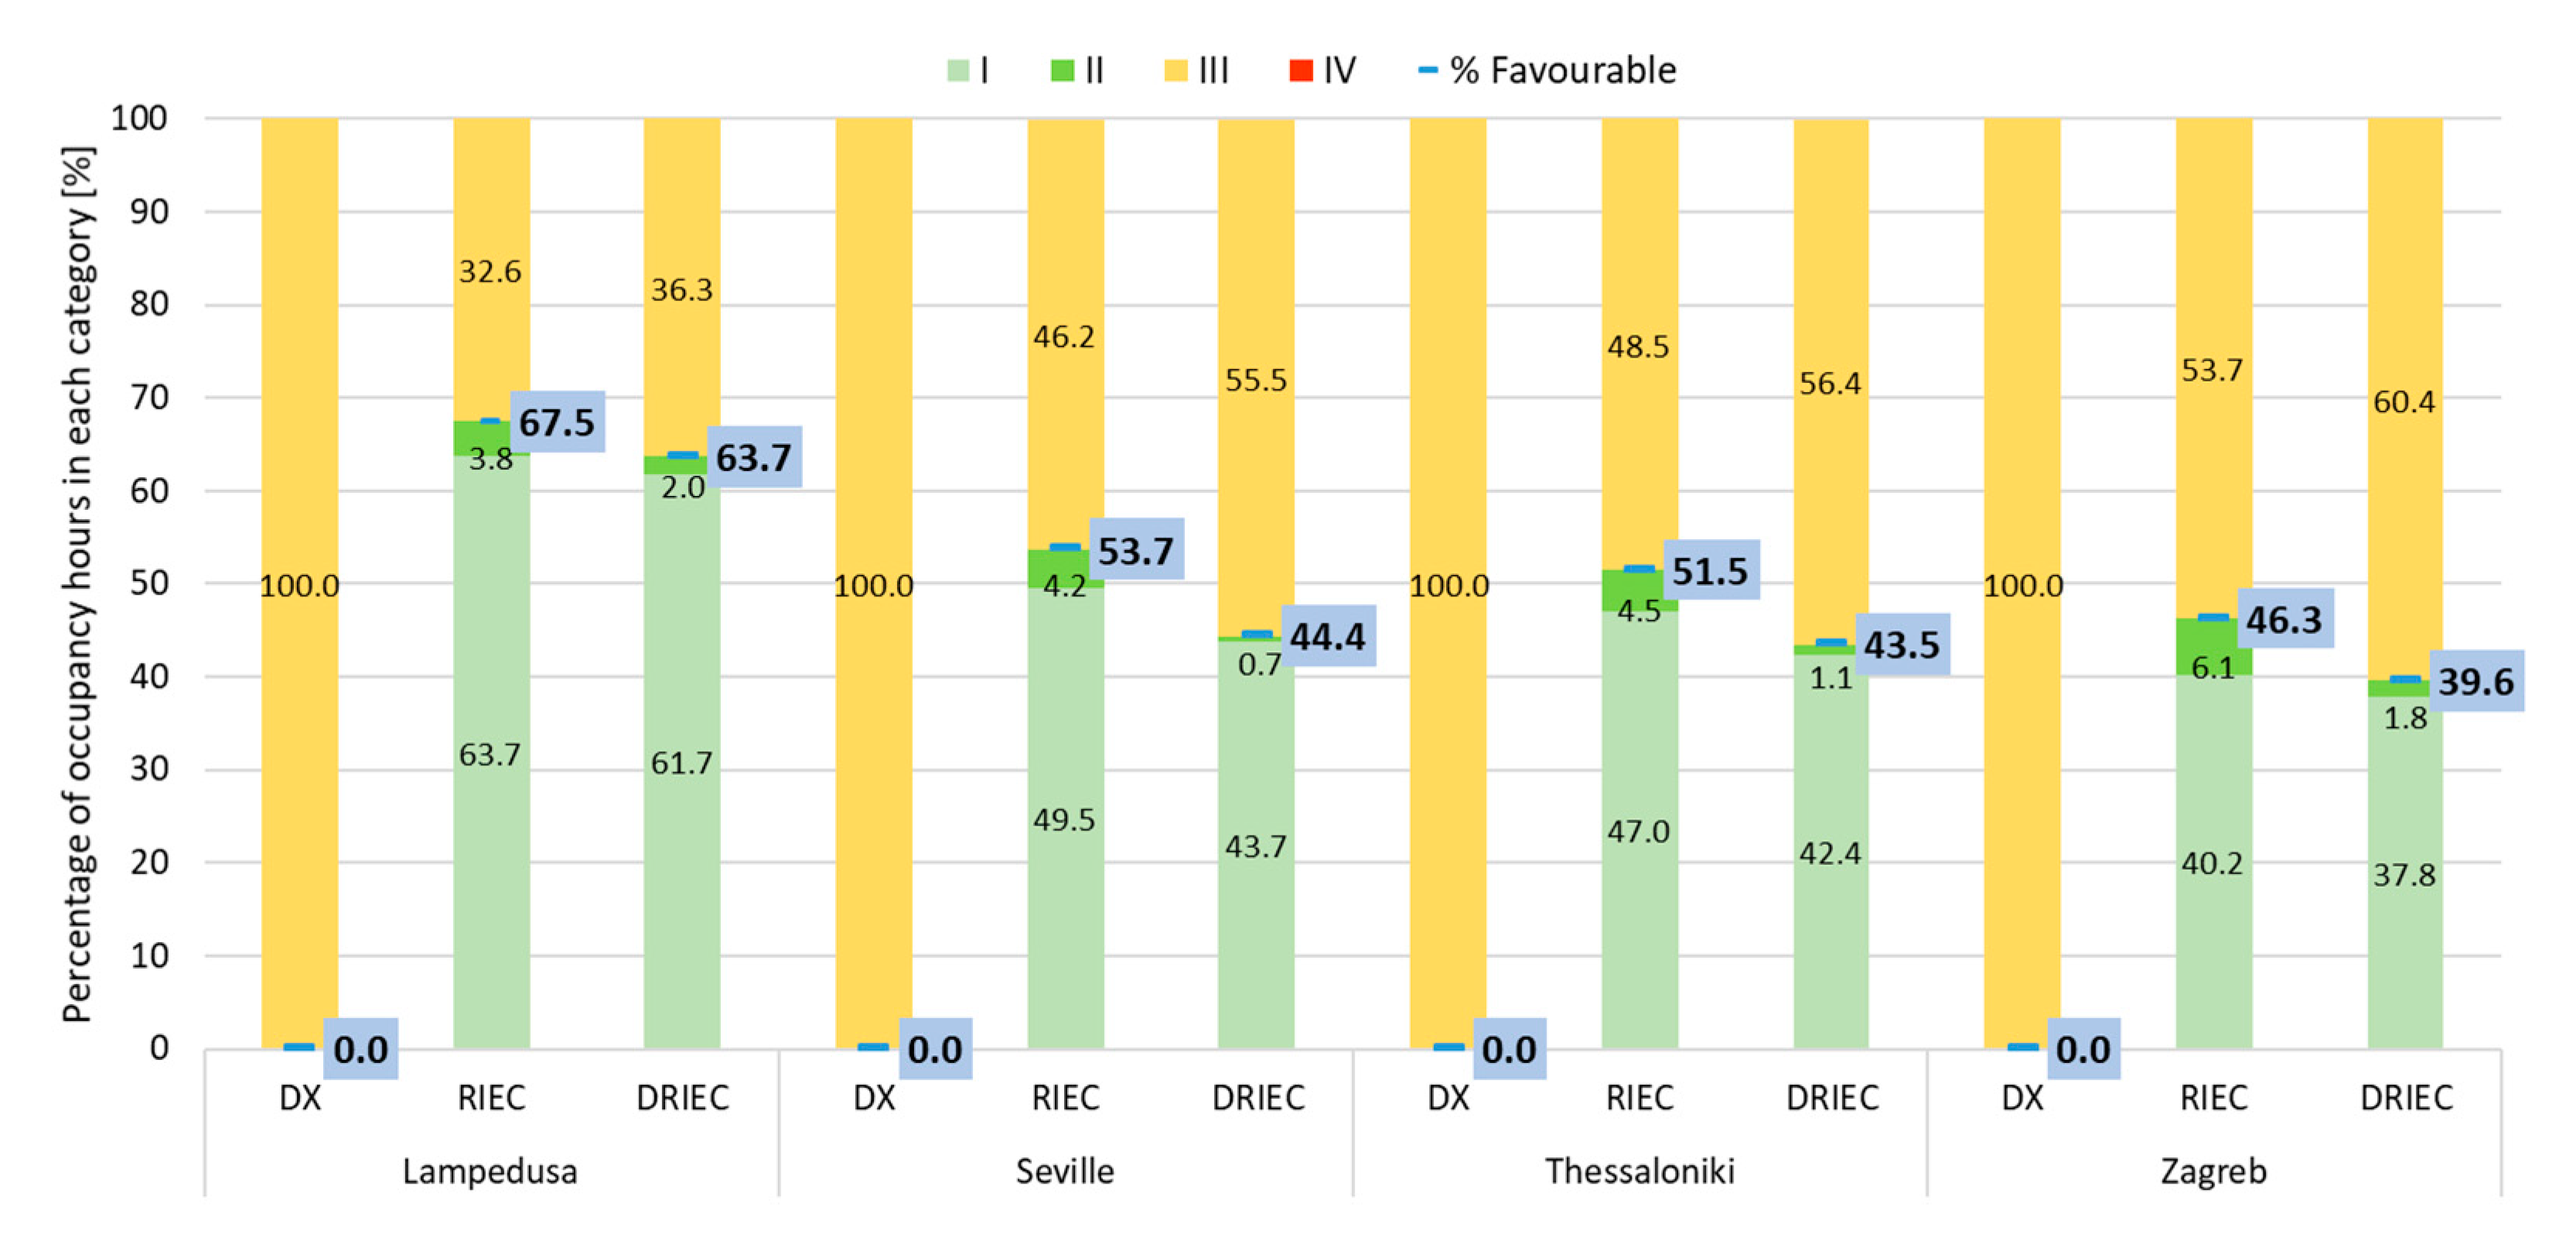
- Air quality: the air-cooling system with the longest period in favorable air quality conditions was the RIEC system for all climatic zones, due to the high outside air flow rates that was supplied to the classroom. Seville and Thessaloniki showed very similar values, 53.7% and 51.5%, respectively. The indoor conditions obtained with the DX system always were in category III, unfavorable category.
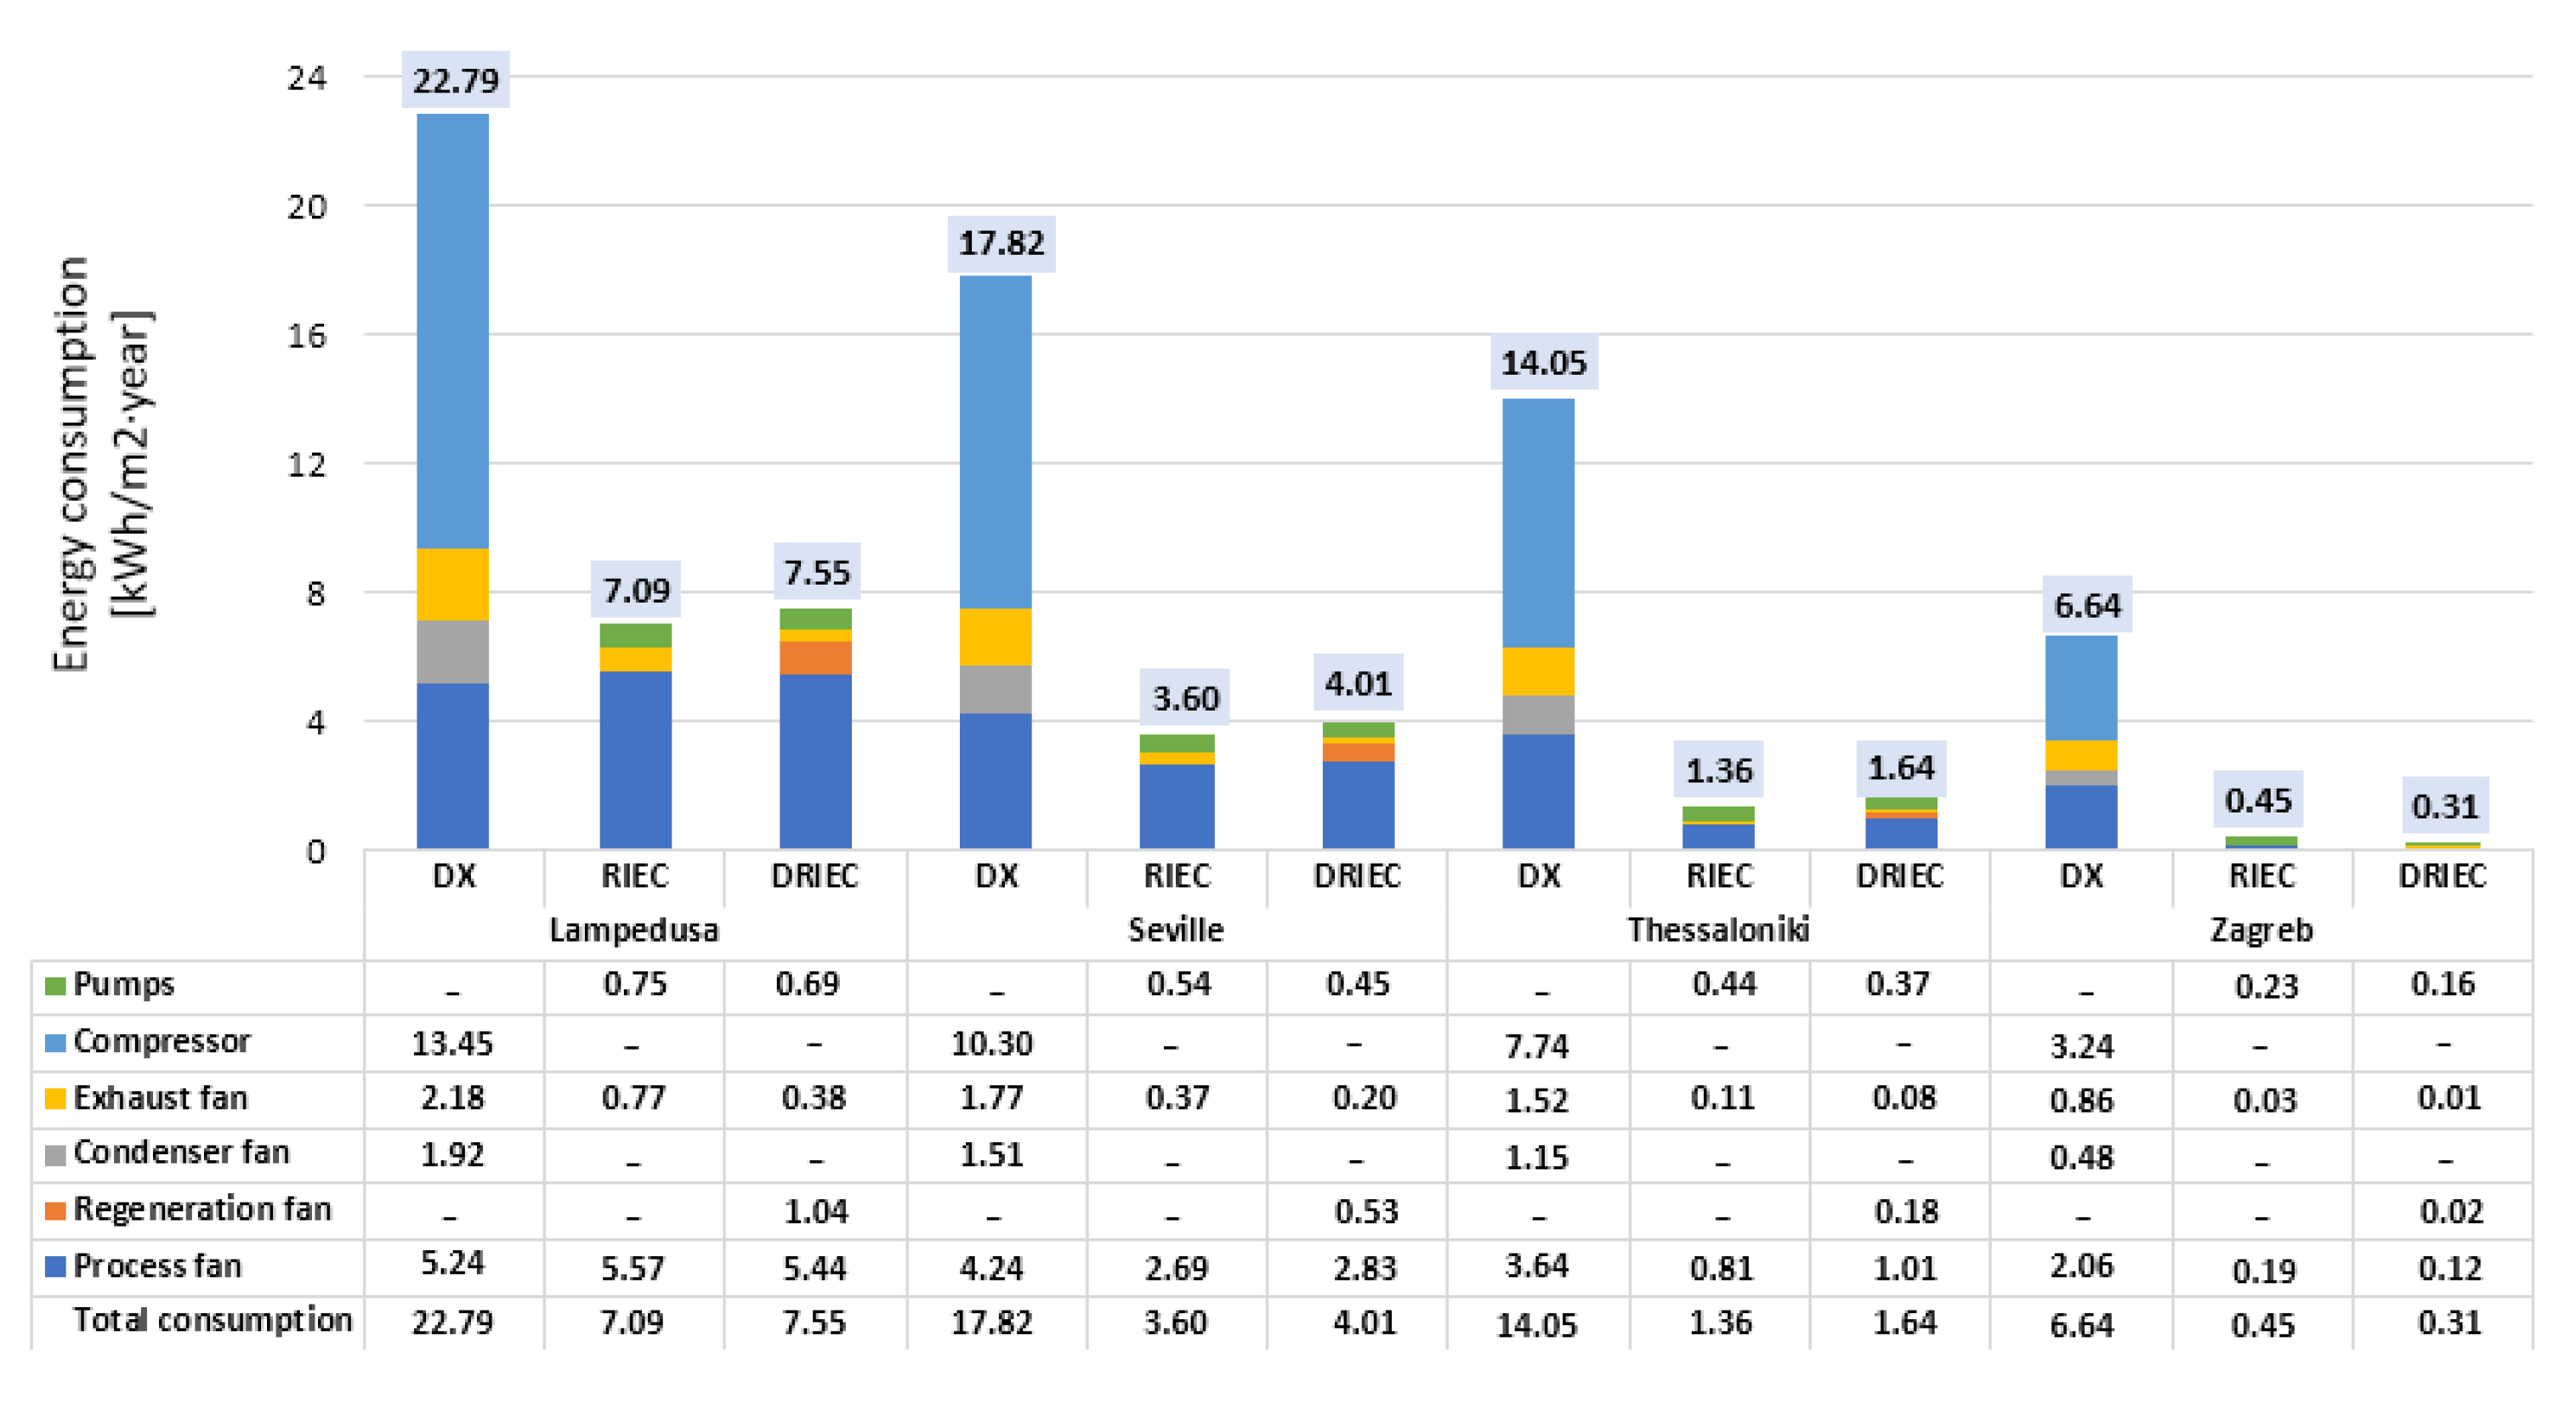
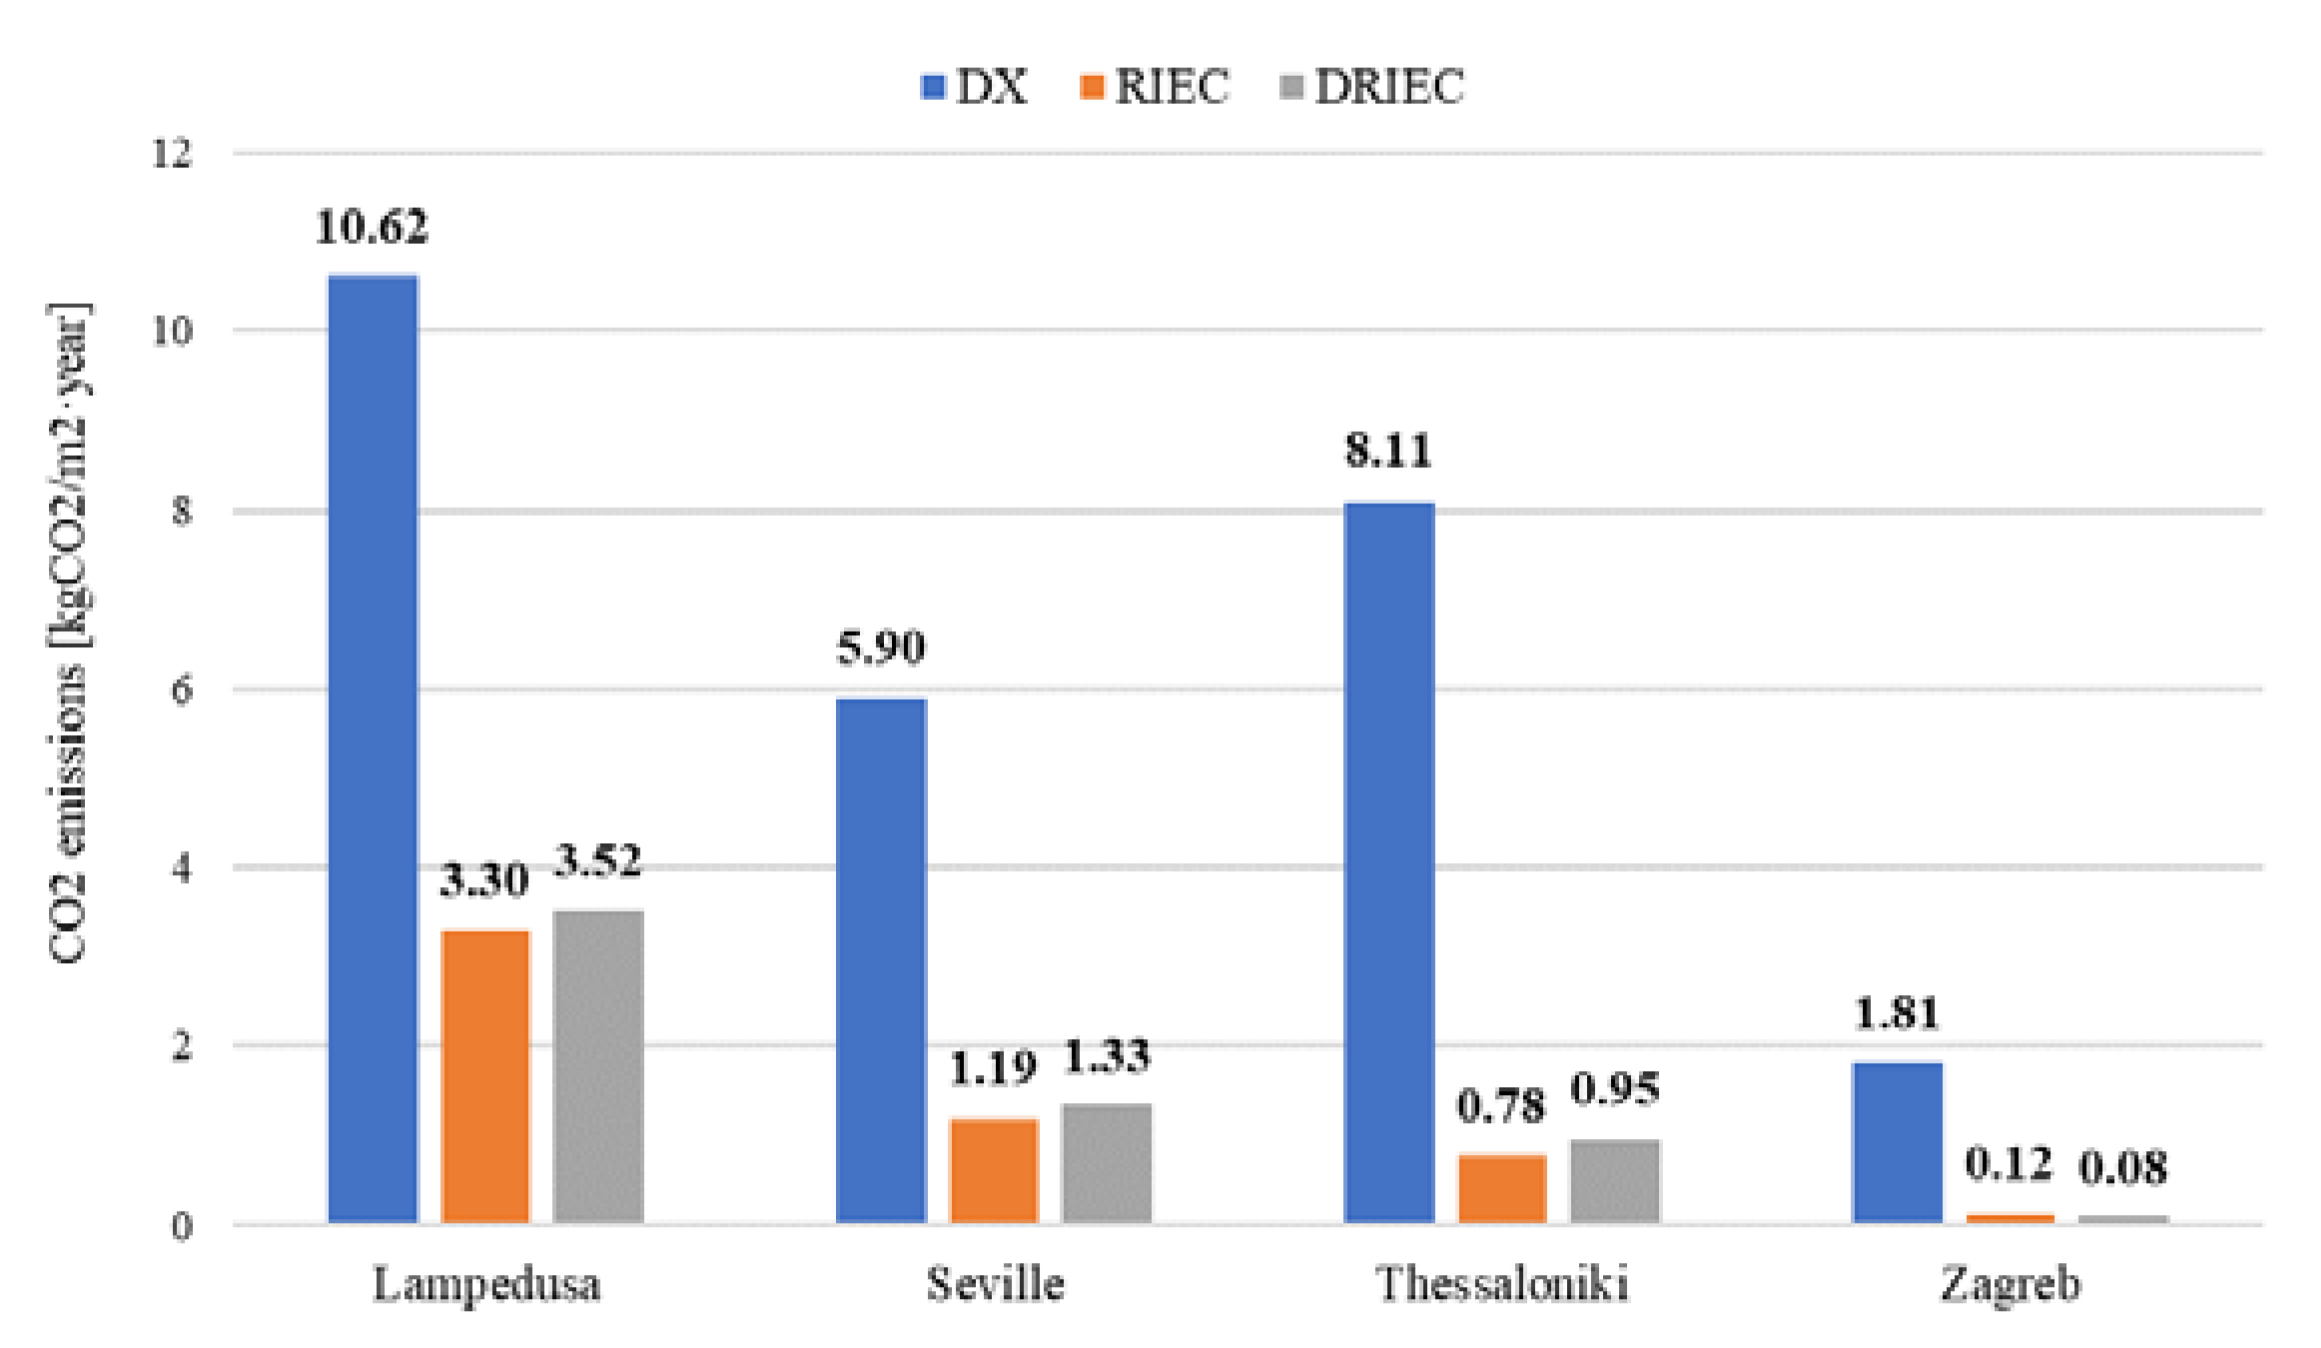
- Energy consumption: the systems with the lowest energy consumption were RIEC and DRIEC. These systems consumed up to three, four, ten and fifteen times less than the DX system, in Lampedusa, Seville, Thessaloniki and Zagreb, respectively. RIEC and DRIEC systems obtained very similar energy consumption values for each climate zone. The highest energy consumption of the DX system was mainly due to the energy consumption of the compressor. Regarding environmental impact, the RIEC and DRIEC innovative air-cooling systems could be an alternative to DX systems to reduce CO2 emissions by 68% and 78.8% in the warmest zones, Lampedusa and Seville, respectively.
Author Contributions
Funding
Acknowledgments
Conflicts of Interest
Nomenclature
| b | estimated parameter |
| BP | bypass damper |
| CM | compressor |
| CO | condenser |
| CTE | technical building code |
| DRIEC | desiccant regenerative indirect evaporative cooler |
| DX | direct expansion |
| DW | desiccant wheel |
| EA | exhaust air |
| EEC | electric energy consumption (cooling period) (kWh m−2 year−1) |
| EV | evaporator |
| f | factor |
| F | fan |
| h | heat transfer coefficient (W m−2 K−1) |
| HC | heating coil |
| HVAC | heating, ventilating and air conditioning |
| IEC | indirect evaporative cooler |
| I | insulation (m2 K W−1) |
| k | number of parameters |
| M | metabolic rate (W m−2) |
| MB | mixing box |
| mass flow (kg s−1) | |
| nZEB | nearly zero energy buildings |
| OA | outdoor air |
| P | static pressure (Pa) |
| PPD | predicted percentage dissatisfied (%) |
| PMV | predicted mean vote (-) |
| capacity (kW) | |
| RA | return air |
| RIEC | regenerative indirect evaporative cooler |
| S | area (m2) |
| SA | supply air |
| T | dry bulb temperature (°C) |
| U | heat transfer coefficient (W m−2 K−1) |
| v | air velocity (m s−1) |
| V | expansion valve; valve |
| volumetric air flow rate (m3 h−1) | |
| W | effective mechanical power (W m−2) |
| electric power consumption (kW) | |
| wfTC | thermal comfort indicator (%) |
| wfAQ | air quality indicator (%) |
| X | input variable |
| estimated variable | |
| Greek letters | |
| Δ | increase |
| ∑ | sum |
| Ω | specific mass air flow rate (kg s−1 m−3) |
| ε | efficiency (-) |
| ρ | density (kg m−3) |
| ω | humidity ratio (g kg−1) |
| Subscripts | |
| a | air |
| abs | absorbed |
| avg | average |
| c | convection |
| cl | clothing surface |
| e | evaporator |
| i | inlet |
| l | latent |
| N | nominal |
| o | outlet |
| OA | outdoor air |
| p | process air |
| r | regeneration |
| s | sensible |
| SP | set-point |
| TW | three-way |
| w | water |
| wb | wet bulb |
| Superscripts | |
| ‘ | dimensionless value |
References
- Directive 2010/31/EU. European Parliament and of the Council of 19 May 2010 on the Energy Performance of Buildings (Recast); OJ L 153, 18.6.2010, p. 13 - 35 (BG, ES, CS, DA, DE, ET, EL, EN, FR, IT, LV, HU, MT, NL, PL, PT, RO, SK, SL, FI, SV) Special edition in Croatian; EUR-Lex: Brussels, Belgium, 2010; Chapter 12; Volume 003, pp. 124–146. [Google Scholar]
- Congedo, P.M.; Baglivo, C.; D’Agostino, D.; Zacà, I. Cost-optimal design for nearly zero energy office buildings located in warm climates. Energy 2015, 91, 967–982. [Google Scholar] [CrossRef]
- Andriamamonjy, A.; Klein, R. A modular, open system for testing ventilation and cooling strategies in extremely low energy lecture rooms. Eff. Ventil. High Perf. Build. 2015, 2015, 416–425. [Google Scholar]
- Enteria, N.; Cuartero-Enteria, O.; Sawachi, T. Review of the advances and applications of variable refrigerant flow heating, ventilating, and air-conditioning systems for improving indoor thermal comfort and air quality. Int. J. Energy Environ. Eng. 2020, 11, 459–483. [Google Scholar] [CrossRef]
- Selamat, H.; Haniff, M.F.; Sharif, Z.M.; Attaran, S.M.; Sakri, F.M.; Al’Hapis Bin Abdul Razak, M. Review on HVAC system optimization towards energy saving building operation. Int. Energy J. 2020, 20, 345–357. [Google Scholar]
- Chen, W.; Fang, G.; Wang, C.; Weng, W.; Ming-Yin, C.; Deng, S.; Liu, X.; Yan, H. An experimental study on a novel direct expansion based temperature and humidity independent control air conditioning system. Energy Procedia 2019, 158, 2237–2243. [Google Scholar] [CrossRef]
- Yang, L.; Deng, S.; Fang, G.; Li, W. Improved indoor air temperature and humidity control using a novel direct-expansion-based air conditioning system. J. Build. Eng. 2021, 43, 102920. [Google Scholar] [CrossRef]
- Almeida, R.M.S.F.; De Freitas, V.P. Indoor environmental quality of classrooms in Southern European climate. Energy Build. 2014, 81, 127–140. [Google Scholar] [CrossRef]
- Soto Francés, V.M.; Serrano Lanzarote, A.B.; Valero Escribano, V.; Navarro Escudero, M. Improving schools performance based on SHERPA project outcomes: Valencia case (Spain). Energy Build. 2020, 225. [Google Scholar] [CrossRef]
- Rambhad, K.S.; Walke, P.V.; Tidke, D.J. Solid desiccant dehumidification and regeneration methods—A review. Renew. Sustain. Energy Rev. 2016, 59, 73–83. [Google Scholar] [CrossRef]
- Jani, D.B.; Mishra, M.; Sahoo, P.K. Solid desiccant air conditioning—A state of the art review. Renew. Sustain. Energy Rev. 2016, 60, 1451–1469. [Google Scholar] [CrossRef]
- Delfani, S.; Karami, M. Transient simulation of solar desiccant/M-Cycle cooling systems in three different climatic conditions. J. Build. Eng. 2020, 29, 101152. [Google Scholar] [CrossRef]
- Sudhakar, K.; Jenkins, M.S.; Mangal, S.; Priya, S.S. Modelling of a solar desiccant cooling system using a TRNSYS-MATLAB co-simulator: A review. J. Build. Eng. 2019, 24, 100749. [Google Scholar] [CrossRef]
- El-Maghlany, W.M.; ElHefni, A.A.; ElHelw, M.; Attia, A. Novel air conditioning system configuration combining sensible and desiccant enthalpy wheels. Appl. Therm. Eng. 2017, 127, 1–15. [Google Scholar] [CrossRef]
- Angrisani, G.; Minichiello, F.; Roselli, C.; Sasso, M. Experimental analysis on the dehumidification and thermal performance of a desiccant wheel. Appl. Energy 2012, 92, 563–572. [Google Scholar] [CrossRef]
- Comino, F.; Ruiz de Adana, M.; Peci, F. Experimetal study of the moisture removal capacity of a desiccant wheel activated at low and high temperature. In Proceedings of the ClLIMA, 12th REHVA World Congress; Aalborg University, Department of Civil Engineering, Aalborg, Denmark, 22–25 May 2016. [Google Scholar]
- White, S.D.; Kohlenbach, P.; Bongs, C. Indoor temperature variations resulting from solar desiccant cooling in a building without thermal backup. Int. J. Refrig. 2009, 32, 695–704. [Google Scholar] [CrossRef]
- Goldsworthy, M.; White, S. Optimisation of a desiccant cooling system design with indirect evaporative cooler. Int. J. Refrig. 2011, 34, 148–158. [Google Scholar] [CrossRef]
- Elgendy, E.; Mostafa, A.; Fatouh, M. Performance enhancement of a desiccant evaporative cooling system using direct/indirect evaporative cooler. Int. J. Refrig. 2015, 51, 77–87. [Google Scholar] [CrossRef]
- Mumovic, D.; Davies, M.; Pearson, C.; Pilmoor, G.; Ridley, I.; Altamirano-Medina, H.; Oreszczyn, T. A comparative analysis of the indoor air quality and thermal comfort in schools with natural, hybrid and mechanical ventilation strategies. Proc. Clima WellBeing Indoors 2007, 2007, 8. [Google Scholar]
- Breesch, H.; Merema, B.; Versele, A. Ventilative cooling in a school building: Evaluation of the measured performances. Fluids 2018, 3, 68. [Google Scholar] [CrossRef] [Green Version]
- Heracleous, C.; Michael, A. Thermal comfort models and perception of users in free-running school buildings of East-Mediterranean region. Energy Build. 2020, 215, 109912. [Google Scholar] [CrossRef]
- Cellura, M.; Guarino, F.; Longo, S.; Mistretta, M. Natural Ventilative Cooling in School Buildings in Sicily. 2016, pp. 12–16. Available online: https://www.rehva.eu/fileadmin/REHVA_Journal/REHVA_Journal_2016/RJ_issue_1/P.12/12-16_RJ1601_WEB.pdf (accessed on 19 July 2021).
- Bienvenido-Huertas, D.; Pulido-Arcas, J.A.; Rubio-Bellido, C.; Pérez-Fargallo, A. Feasibility of adaptive thermal comfort for energy savings in cooling and heating: A study on Europe and the Mediterranean basin. Urban Clim. 2021, 36. [Google Scholar] [CrossRef]
- EN 16798-1:2019 Energy Performance of Buildings—Ventilation for Buildings—Part 1: Indoor Environmental Input Parameters for Design and Assessment of Energy Performance of Buildings Addressing Indoor Air Quality, Thermal Environment, Lighting and Acoustics—Module M1. 2020, pp. 1–87. Available online: https://standards.iteh.ai/catalog/standards/cen/b4f68755-2204-4796-854a-56643dfcfe89/en-16798-1-2019 (accessed on 30 October 2020).
- CEN/TR 16798-2:2019 Energy Performance of Buildings—Ventilation for Buildings—Part 2: Interpretation of the Requirements in EN 16798-1—Indoor Environmental Input Parameters for Design and Assessment of Energy Performance of Buildings Addressing Indoor Air Quality, ther. 2019, p. 88. Available online: https://standards.iteh.ai/catalog/standards/cen/554e05d6-df03-4e67-8907-52a8dbd298f5/cen-tr-16798-2-2019 (accessed on 30 October 2020).
- Comino, F.; Ruiz de Adana, M.; Peci, F. Energy saving potential of a hybrid HVAC system with a desiccant wheel activated at low temperatures and an indirect evaporative cooler in handling air in buildings with high latent loads. Appl. Therm. Eng. 2018, 131, 412–427. [Google Scholar] [CrossRef]
- Comino, F.; Castillo González, J.; Navas-Martos, F.J.; Ruiz de Adana, M. Experimental energy performance assessment of a solar desiccant cooling system in Southern Europe climates. Appl. Therm. Eng. 2020, 165, 114579. [Google Scholar] [CrossRef]
- Peng, Y.; Rysanek, A.; Nagy, Z.; Schlüter, A. Using machine learning techniques for occupancy-prediction-based cooling control in office buildings. Appl. Energy 2018, 211, 1343–1358. [Google Scholar] [CrossRef]
- Kim, J.; Hong, T.; Koo, C.W. Economic and environmental evaluation model for selecting the optimum design of green roof systems in elementary schools. Environ. Sci. Technol. 2012, 46, 8475–8483. [Google Scholar] [CrossRef] [PubMed]
- Congedo, P.M.; D’Agostino, D.; Baglivo, C.; Tornese, G.; Zacà, I. Efficient solutions and cost-optimal analysis for existing school buildings. Energies 2016, 9, 851. [Google Scholar] [CrossRef] [Green Version]
- Chan, W.R.; Li, X.; Singer, B.C.; Pistochini, T.; Vernon, D.; Outcault, S.; Sanguinetti, A.; Modera, M. Ventilation rates in California classrooms: Why many recent HVAC retrofits are not delivering sufficient ventilation. Build. Environ. 2020, 167, 106426. [Google Scholar] [CrossRef]
- Fisk, W.J. The ventilation problem in schools: Literature review. Indoor Air 2017, 27, 1039–1051. [Google Scholar] [CrossRef] [Green Version]
- Klein, S.A. TRNSYS 17: A Transient System Simulation Program. 2006. Available online: https://ci.nii.ac.jp/naid/10003777297/ (accessed on 2 November 2020).
- Ministerio de Industria Energía y Turismo RITE. Reglamento de Instalaciones Térmicas en los edificios. Versión Consolidada. Bol. Of. Estado 2013, 137. Available online: https://energia.gob.es/desarrollo/EficienciaEnergetica/RITE/Reglamento/RDecreto-1027-2007-Consolidado-9092013.pdf. (accessed on 8 November 2020).
- CIAT. Available online: http://www.grupociat.es/ (accessed on 16 November 2020).
- Seeley International. Climate Wizard. Available online: https://www.seeleyinternational.com/eu/commercial/brands/climate-wizard-emea/ (accessed on 10 December 2020).
- ProFlute Technology Leader. Available online: https://proflute.se/ (accessed on 14 December 2020).
- Society 8400. ASHRAE STANDARD 90.1 Energy Standard for Buildings Except Low-Rise Residential Buildings. 2007, pp. 358–417. Available online: https://ashrae.iwrapper.com/ASHRAE_PREVIEW_ONLY_STANDARDS/STD_90.1_2019 (accessed on 20 November 2020).
- Weather Data. Trnsys 17, vol. 8. Available online: http://www.trnsys.com/ (accessed on 5 December 2020).
- Comité técnico ISO/TC 159 UNE-EN ISO 7730. Ergonomía del ambiente térmico. 2006. Available online: https://www.une.org/encuentra-tu-norma/busca-tu-norma/norma?c=N0037517 (accessed on 15 December 2020).
- Ministerio de Fomento (España) Documento Básico HE Ahorro de Energía 2019. Código Técnico la Edif. 2019, 1–129.
- Carbon Footprint Carbon Footprint Country Specific Electricity Grid Greenhouse Gas Emission Factors. 2019, pp. 1–10. Available online: https://www.carbonfootprint.com/docs/2020_07_emissions_factors_sources_for_2020_electricity_v1_3.pdf (accessed on 14 December 2020).


| Building | Indoor temperature | 23.5 °C |
| Indoor relative humidity | 55% | |
| Exterior wall area | 43.9 m2 | |
| Height | 3 m | |
| Exterior roof area | 55.8 m2 | |
| Floor area | 55.8 m2 | |
| U-value | Window | 5.730 W m−2 K−1 |
| Floor | 0.612 W m−2 K−1 | |
| Roof | 0.512 W m−2 K−1 | |
| Exterior wall | 0.508 W m−2 K−1 | |
| Heat gain | People | 20 persons |
| Sensible: 60 W person−1 | ||
| Latent: 60 W person−1 | ||
| PMV value | Person metabolic rate, M | 60 W m2 (1 met) |
| Effective mechanical power, W | 0 W m2 | |
| Clothing insulation (TOA > 22 °C), Icl | 0.078 m2 K W−1 (0.5 clo) | |
| Clothing insulation (TOA < 22 °C), Icl | 0.124 m2 K W−1 (0.8 clo) | |
| Relative indoor air velocity, var | 0.1 m s−1 | |
| Rates | Occupation | 2.79 m2 person−1 |
| Ventilation—EN 16798-1:2020 | 7 l s−1 person−1 | |
| 0.7 l s−1 m−2 | ||
| Daily schedule | 09:00 a.m. to 15:00 p.m. | |
| Parameter | Value |
|---|---|
| Nominal volumetric flow | 2100 m3 h−1 |
| Nominal sensible cooling capacity | 3.5 kW |
| Nominal latent cooling capacity | 2.3 kW |
| Nominal absorbed capacity | 1.5 kW |
| Dehumidifying capacity | 7.1 kg h−1 |
| Power consumption | 3.4 kW |
| Estimated Parameters | Estimated Output Value | Input Variables | ||
|---|---|---|---|---|
| scooling,N × 10 (KW) | lcooling,N × 10 (KW) | abs,N × 10 (KW) | ||
| b0 | 4.8871 | −1.4512 | 6.0265 | - |
| b1 | 0.2908 | −0.4757 | 0.0341 | TOA |
| b2 | 2.9217 | 5.3178 | −3.3709 | |
| b3 | −0.3527 | 1.1192 | 0.2952 | Twb,OA |
| b4 | −0.0117 | 0.0224 | 0.0025 | TOA2 |
| b5 | −1.3324 | −3.3144 | 3.4649 | 2 |
| b6 | −0.0116 | 0.0182 | 0.0098 | Twb,OA2 |
| b7 | 0.7929 | −1.1042 | 0.0314 | TOA· |
| b8 | 0.0219 | 0.0456 | 0.0047 | TOA Twb,OA |
| b9 | −0.7636 | 1.3225 | −0.3012 | Twb,OA· |
| Parameters | Value | |
|---|---|---|
| Capacity | Air flow | 2880 m3 h−1 |
| Maximum external static pressure | 215 Pa | |
| Nominal cooling capacity | 18 kW | |
| COP | 12 | |
| Input power | 1.5 kW | |
| Water circuit | Supply | 20 l min−1 |
| Consumption | 44 l h−1 | |
| Pumps (2) | 13 l min−1 |
| Estimated Parameters | Estimated Output Value | Input Variables |
|---|---|---|
| Tsupply × 10 (°C) | ||
| b0 | −342.0980 | - |
| b1 | −0.8803 | TOA |
| b2 | 0.0128 | |
| b3 | 39.3320 | Twb,OA |
| b4 | 0.0048 | TOA2 |
| b5 | - | 2 |
| b6 | −0.6563 | Twb,OA2 |
| b7 | - | TOA· |
| b8 | 0.0277 | TOA·Twb,OA |
| b9 | - | Twb,OA· |
| Parameters | Value |
|---|---|
| Nominal air flow | 5000 m3 h−1 |
| Nominal capacity | 16 kg h−1 |
| Desiccant material | Silica gel |
| Rotor length | 200 mm |
| Rotor diameter | 770 mm |
| Channel shape | Honeycomb |
| Estimated Parameters | Estimated Output Value | Input Variables | |||
|---|---|---|---|---|---|
| Tp,o × 10 (°C) | ωp,o × 10 (g kg−1) | Tr,o × 10 (°C) | ωr,o × 10 (g kg−1) | ||
| b0 | 7.1818 | −8.1252 | −7.4204 | 10.5523 | - |
| b1 | 7.4091 | 0.8863 | 7.3727 | −2.2636 | TOA |
| b2 | −2.0000 | 11.2130 | 5.3636 | 6.9182 | wOA |
| b3 | 2.5811 | −0.7587 | 2.0715 | 2.3583 | Tr,i |
| b4 | 0.0018 | 0.0005 | −0.0039 | 0.0022 | |
| b5 | - | 0.0102 | −0.0068 | 0.0159 | TOA·wOA |
| b6 | 0.0068 | 0.0042 | 0.0261 | −0.0148 | TOA Tr.i |
| b7 | 0.0002 | - | −0.0004 | 0.0001 | TOA· |
| b8 | 0.0525 | 0.0261 | −0.1413 | 0.0738 | wOA Tr.i |
| b9 | - | - | - | - | wOA· |
| b10 | 0.0002 | - | −0.0005 | −0.0002 | Tr,i· |
| Element | Pressure (Pa) | Element | Pressure (Pa) |
|---|---|---|---|
| Evaporator | 40 | Heating coil | 35 |
| Condenser | 27 | DW Bypass | 40 |
| Mix | 40 | Duct | 40 |
| DW process | 385 | ePM1 65% filter | 100 |
| DW regeneration | 355 | Gross 60% filter | 60 |
| RIEC | 200 |
| Climate Zone | City | Thermal Criteria a (°C) | Cooling Period (h) |
|---|---|---|---|
| Hot (dry) | Lampedusa | 3500 < cooling degrees-day ≤ 5000 | 789.68 |
| Warm (humid) | Seville | 2500 < cooling degrees-day < 3500 | 638.96 |
| Warm (dry) | Thessaloniki | 2500 < cooling degrees-day < 3500 | 548.28 |
| Mixed (humid) | Zagreb | cooling degrees-day ≤2500 and heating degrees-day ≤3000 | 310.68 |
| Month | Lampedusa | Seville | Thessaloniki | Zagreb | ||||
|---|---|---|---|---|---|---|---|---|
| TOA,avg (°C) | ωOA,avg (g/kg) | TOA,avg (°C) | ωOA,avg (g/kg) | TOA,avg (°C) | ωOA,avg (g/kg) | TOA,avg (°C) | ωOA,avg (g/kg) | |
| January | 13.35 | 8.16 | 10.65 | 5.85 | 4.87 | 4.02 | 0.22 | 3.36 |
| February | 13.58 | 7.71 | 11.87 | 6.27 | 6.58 | 4.39 | 2.91 | 3.80 |
| March | 14.27 | 8.26 | 14.03 | 6.67 | 9.54 | 5.27 | 7.02 | 4.70 |
| April | 15.81 | 9.06 | 15.73 | 7.79 | 14.03 | 6.75 | 11.40 | 6.20 |
| May | 18.33 | 11.72 | 19.65 | 9.39 | 19.54 | 8.84 | 16.20 | 8.17 |
| June | 21.95 | 14.67 | 23.06 | 11.11 | 23.94 | 10.31 | 19.00 | 10.11 |
| July | 25.22 | 17.22 | 26.85 | 12.25 | 26.52 | 11.25 | 21.30 | 11.29 |
| August | 26.10 | 18.61 | 26.99 | 12.57 | 25.89 | 11.29 | 20.48 | 11.28 |
| September | 24.69 | 16.48 | 24.12 | 11.45 | 21.56 | 9.95 | 16.77 | 9.58 |
| October | 21.96 | 13.92 | 19.47 | 9.33 | 16.18 | 7.93 | 11.72 | 7.24 |
| November | 18.09 | 10.48 | 14.09 | 7.42 | 10.63 | 6.16 | 6.23 | 5.22 |
| December | 14.99 | 8.75 | 11.13 | 6.09 | 6.60 | 4.69 | 1.82 | 3.87 |
| Category | PPD (%) | PMV (-) |
|---|---|---|
| I | <6 | −0.2 < PMV < +0.2 |
| II | <10 | −0.5 < PMV < +0.5 |
| III | <15 | −0.7 < PMV < +0.7 |
| IV | <25 | −1.0 < PMV < +1.0 |
| Category | ΔCO2 (ppm) |
|---|---|
| I | <550 |
| II | <800 |
| III | <1350 |
| IV | >1350 |
| Climate Zone | Country | Factor (kgCO2 kWh−1) |
|---|---|---|
| Lampedusa | Italy | 0.466 |
| Seville | Spain | 0.331 |
| Thessaloniki | Greece | 0.577 |
| Zagreb | Croatia | 0.273 |
Publisher’s Note: MDPI stays neutral with regard to jurisdictional claims in published maps and institutional affiliations. |
© 2021 by the authors. Licensee MDPI, Basel, Switzerland. This article is an open access article distributed under the terms and conditions of the Creative Commons Attribution (CC BY) license (https://creativecommons.org/licenses/by/4.0/).
Share and Cite
Romero-Lara, M.J.; Comino, F.; Ruiz de Adana, M. Seasonal Analysis Comparison of Three Air-Cooling Systems in Terms of Thermal Comfort, Air Quality and Energy Consumption for School Buildings in Mediterranean Climates. Energies 2021, 14, 4436. https://doi.org/10.3390/en14154436
Romero-Lara MJ, Comino F, Ruiz de Adana M. Seasonal Analysis Comparison of Three Air-Cooling Systems in Terms of Thermal Comfort, Air Quality and Energy Consumption for School Buildings in Mediterranean Climates. Energies. 2021; 14(15):4436. https://doi.org/10.3390/en14154436
Chicago/Turabian StyleRomero-Lara, María Jesús, Francisco Comino, and Manuel Ruiz de Adana. 2021. "Seasonal Analysis Comparison of Three Air-Cooling Systems in Terms of Thermal Comfort, Air Quality and Energy Consumption for School Buildings in Mediterranean Climates" Energies 14, no. 15: 4436. https://doi.org/10.3390/en14154436
APA StyleRomero-Lara, M. J., Comino, F., & Ruiz de Adana, M. (2021). Seasonal Analysis Comparison of Three Air-Cooling Systems in Terms of Thermal Comfort, Air Quality and Energy Consumption for School Buildings in Mediterranean Climates. Energies, 14(15), 4436. https://doi.org/10.3390/en14154436