1. Introduction
Wind speeds off the Oregon coast are some of the strongest in the nation and hold a power potential of up to 62 GW [
1]. Despite a deep continental shelf, which dictates the need for nascent floating offshore wind (OSW) technology, several current policies contribute to a favorable policy environment for the development of Oregon’s strong resource. The Governor of Oregon issued Executive Order 20-04 in March 2020, instituting a cap-and-reduce program on fossil-fueled electric generating units currently operating in the state [
2]. Oregon has also adopted clean energy policies, such as mandated Renewable Portfolio Standard (RPS) requirements that apply to the state’s electric utilities, and clean energy targets calling for reductions of greenhouse gas emissions associated with electricity of 80% by 2030, 90% by 2035, and 100% by 2040 [
3]. Aggressive clean energy mandates in the form of RPS laws and others are also in place in Washington and California, including California’s pricing of carbon through a cap-and-trade program. These policies have combined to create a significant interest in renewable power across existing transmission networks up and down the West coast. Retiring coal plants within the Western Interconnection over the next 20 years will create a need for more energy resources across the West, including California and the Pacific Northwest (PNW). The time horizons under which any new Oregon clean energy policies and Western Interconnection coal retirements may come to fruition are likely to coincide with the projections for significant technical maturation in floating OSW technology. The endeavor to refresh prior Oregon legislative efforts to facilitate new transmission lines and large, grid-scale storage may also offer increased opportunities to optimize the costs of floating OSW and other forms of renewable energy and thus hasten the renewable energy transition [
4,
5,
6].
Additional power sector shifts are relevant. Trends towards increased vehicle and building electrification could shift the demand for electricity and create opportunities for floating OSW to contribute to increased capacity needs to serve loads. If large amounts of solar energy were developed to serve Oregon’s loads, a PNW “duck curve”—where large amounts of solar power are generated during the day and recede rapidly in the evening—could eventually occur. OSW could contribute to meeting these evening ramps.
The effects of climate change on the hydropower system may increase the Oregon OSW opportunity. Currently, much of the integration of variable renewables in the region is facilitated by the flexibility of the northwest hydropower system. That system, however, is expected to be increasingly impacted by climate change in future decades with a reduction of winter snowfall and changes in seasonal precipitation patterns making low flow conditions in summer more likely [
7]. Simultaneously, climate change may also bring load changes to the region, including potential reductions and shifts in winter peaks and a growing summer peak driven by cooling loads [
8]. These types of impacts underscore the value of a more diverse portfolio of Variable Renewable Energy (VRE) generation.
These opportunities point to the need for viable energy resources, which are correlated to load and also complementary to other sources of hydroelectric and VRE generation to maintain a robust grid with minimal additional transmission and energy storage investment. From this grid perspective, and under high-renewable energy futures, Levelized Cost of Energy can be a misleading metric in isolation. In addition to cost considerations, the temporal and spatial characteristics of a renewable energy resource should be reviewed in the grid context for implicit value. The consideration of values accrued across coastal and regional transmission systems provides a helpful mechanism for broadening the characterization. Several past studies have considered the costs of OSW energy production at project scale [
9,
10]. Few studies have broadly considered the impacts and benefits of VRE resulting from the electricity grid, and none concerning Oregon OSW [
11,
12,
13]. This study is the first to evaluate the ability of OSW to pair with other VRE resources to serve demand and the necessary modifications to the transmission system to do so, within the context of Oregon transmission networks. Additionally, the present work takes a systems approach to consider a range of potential contributions, such as those to firm capacity and ensure resilience, which may lead current market structures. Simulations of the dispatch of electricity generation resources across the region, within the constraints of the current transmission infrastructure, yield novel insights into the degree to which this broader value potential may be eroded or enhanced.
2. Materials and Methods
As a first-order proxy for wind power production timing, historical wind characteristics were used to investigate the degree to which OSW naturally complements PNW hydropower and other VRE resources. Wind speeds at 100 m above the surface were sourced from the techno-economic database of the WIND Toolkit, a compilation of seven years of wind data at 5-min resolution and 120,000 locations across the nation [
14]. The hub height was deemed to be representative of larger OSW turbines, which are characterized by rotor diameters in excess of 160 m. These hub heights have also been attained by land-based wind turbines. Various permitting restrictions, which may limit turbine location, tip height and hub height, were neglected. Power generation was not modeled. Wind direction, air density, temperature, humidity, and wind speed variations through the rotor plane were all neglected.
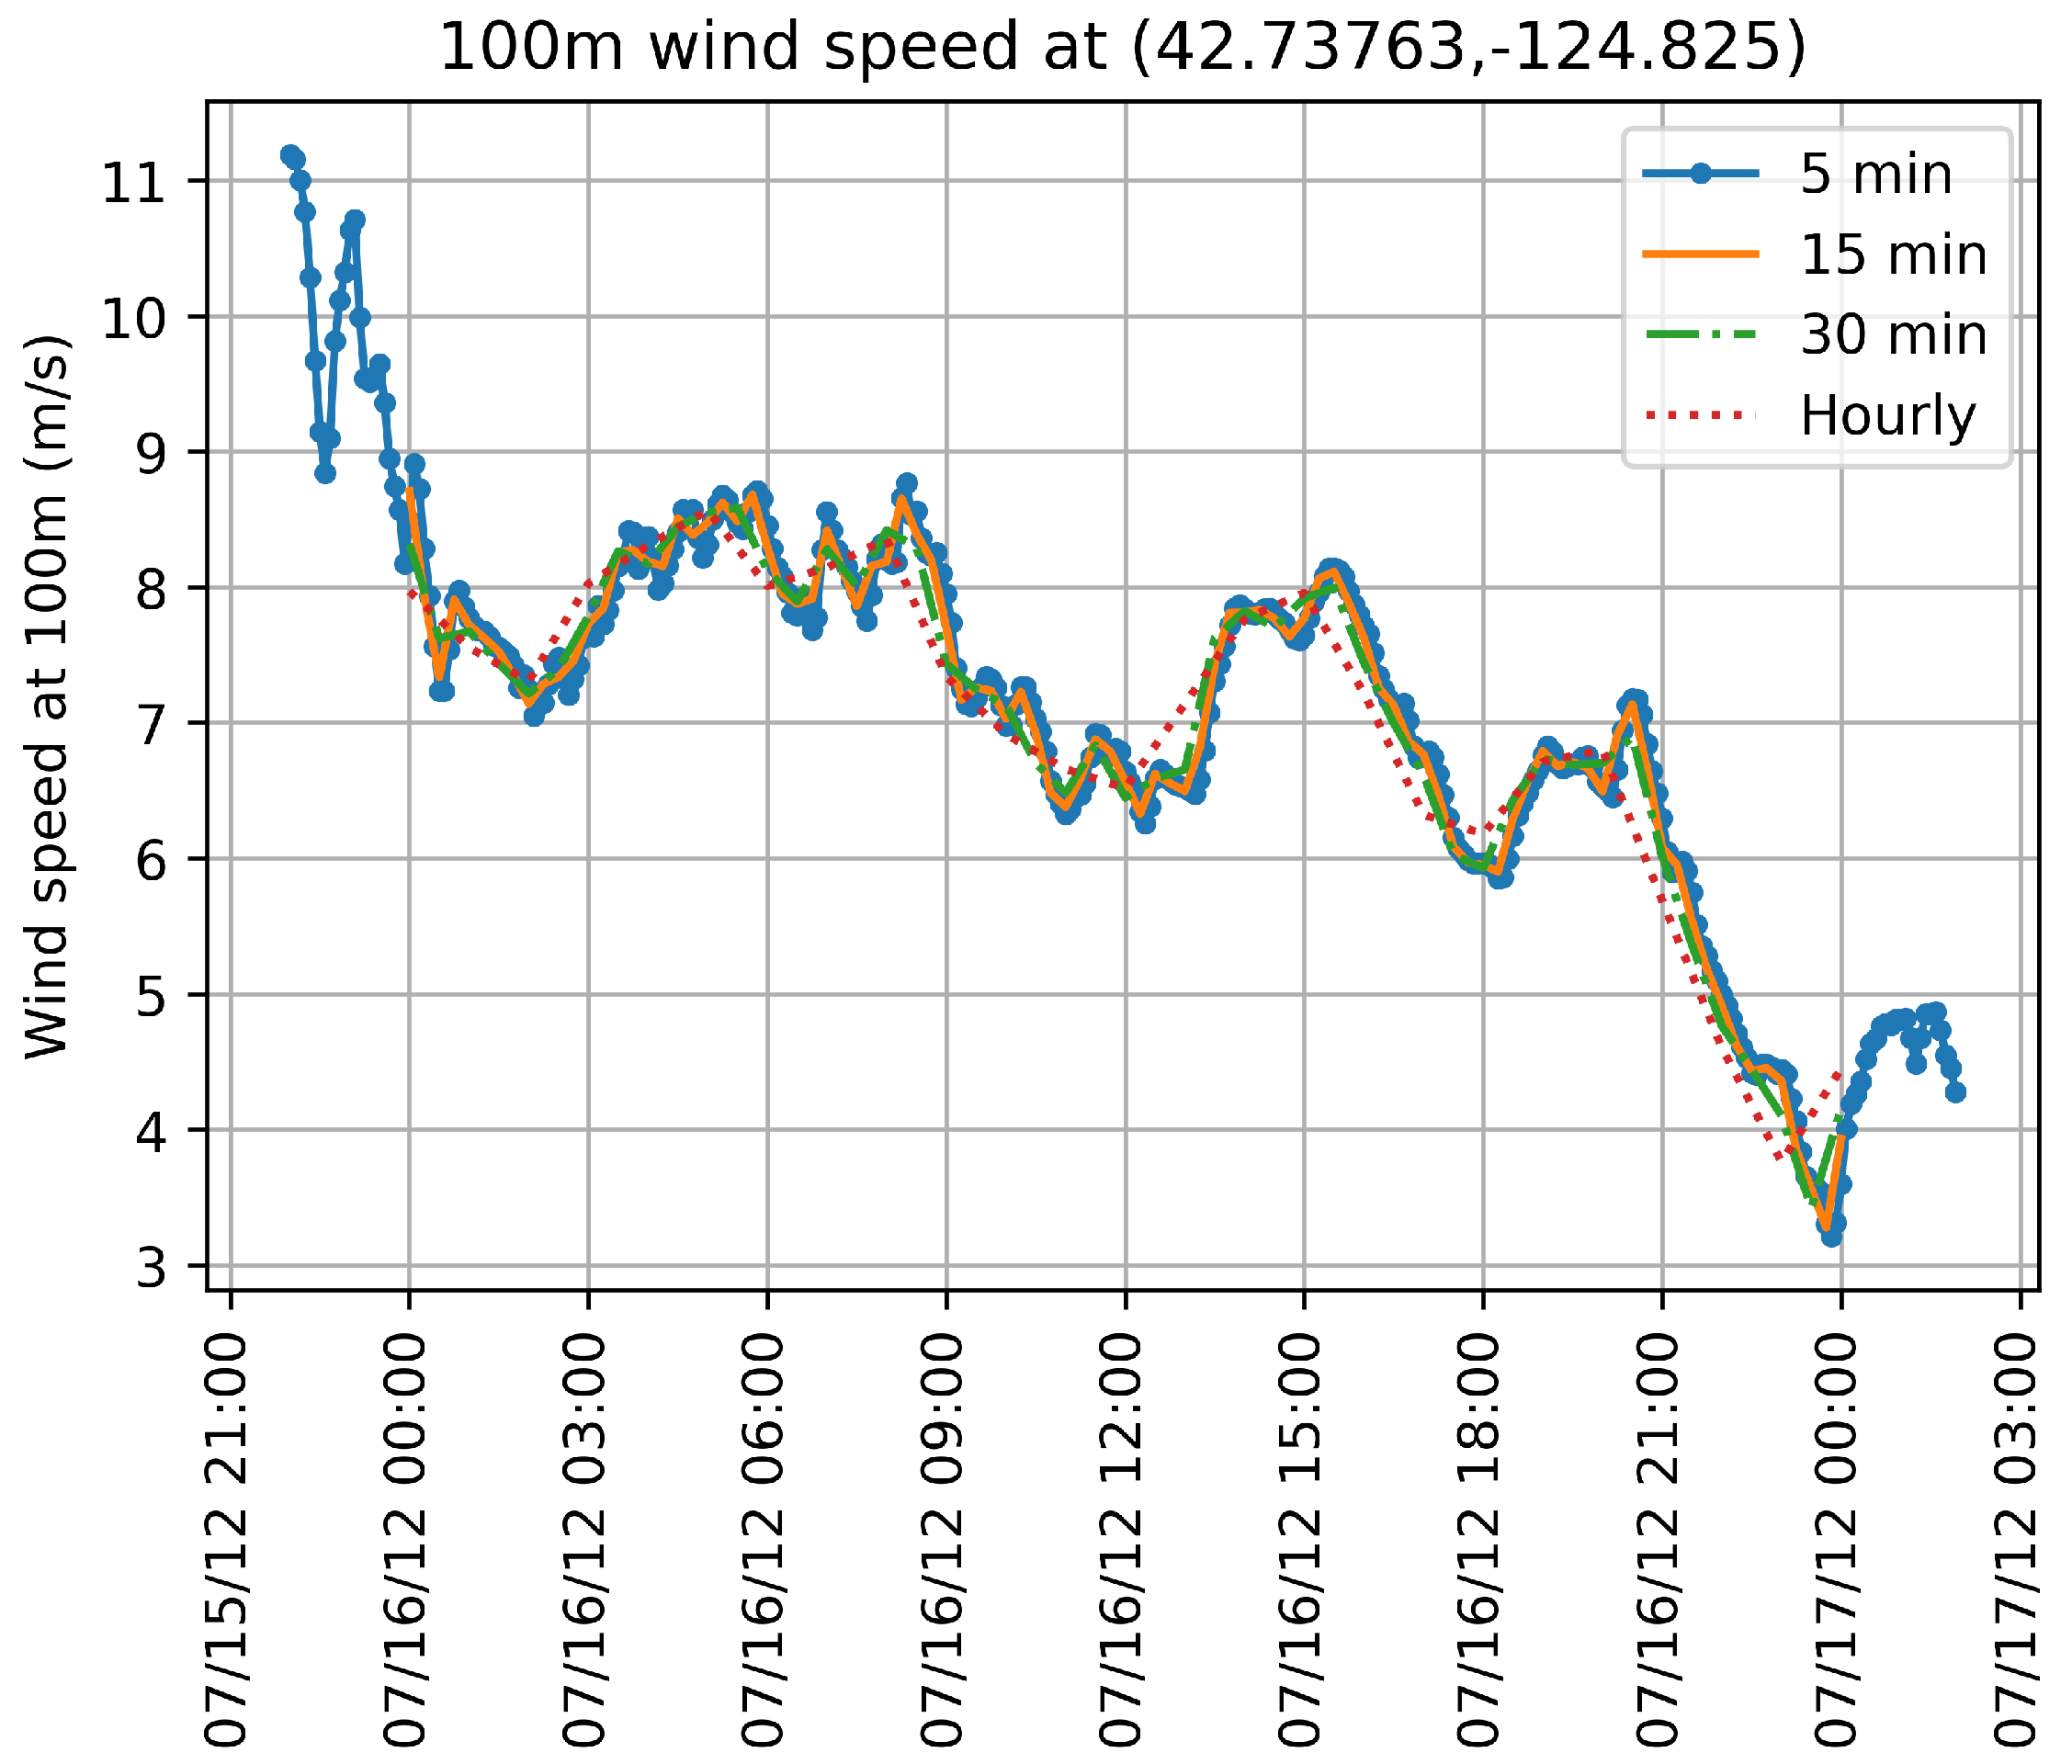
Figure 1 provides an example of the resolution available from the database, which is summed to match the intervals of other data sources, as needed. A head and tail of the 5-min data are shown without the time summations to indicate the richness of these data. Comparing hourly and half-hourly trends, the smoothing of the variability is clear, as expected. However, this excerpt qualitatively indicates that 15-min summations may capture the variability of the OSW resource.
The WIND Toolkit provides unique insights into OSW patterns, though it has been validated only at the ocean’s surface [
15]. Using the WIND Toolkit, data from 2007–2012 at the OSW locations shown in
Table 1 were analyzed and averaged on a monthly basis. These locations along the Oregon OCS were chosen to capture the variation in the OSW resource as well as to characterize impacts through a range of coastal entry points to the transmission system.
2.1. VRE Complementarity Study
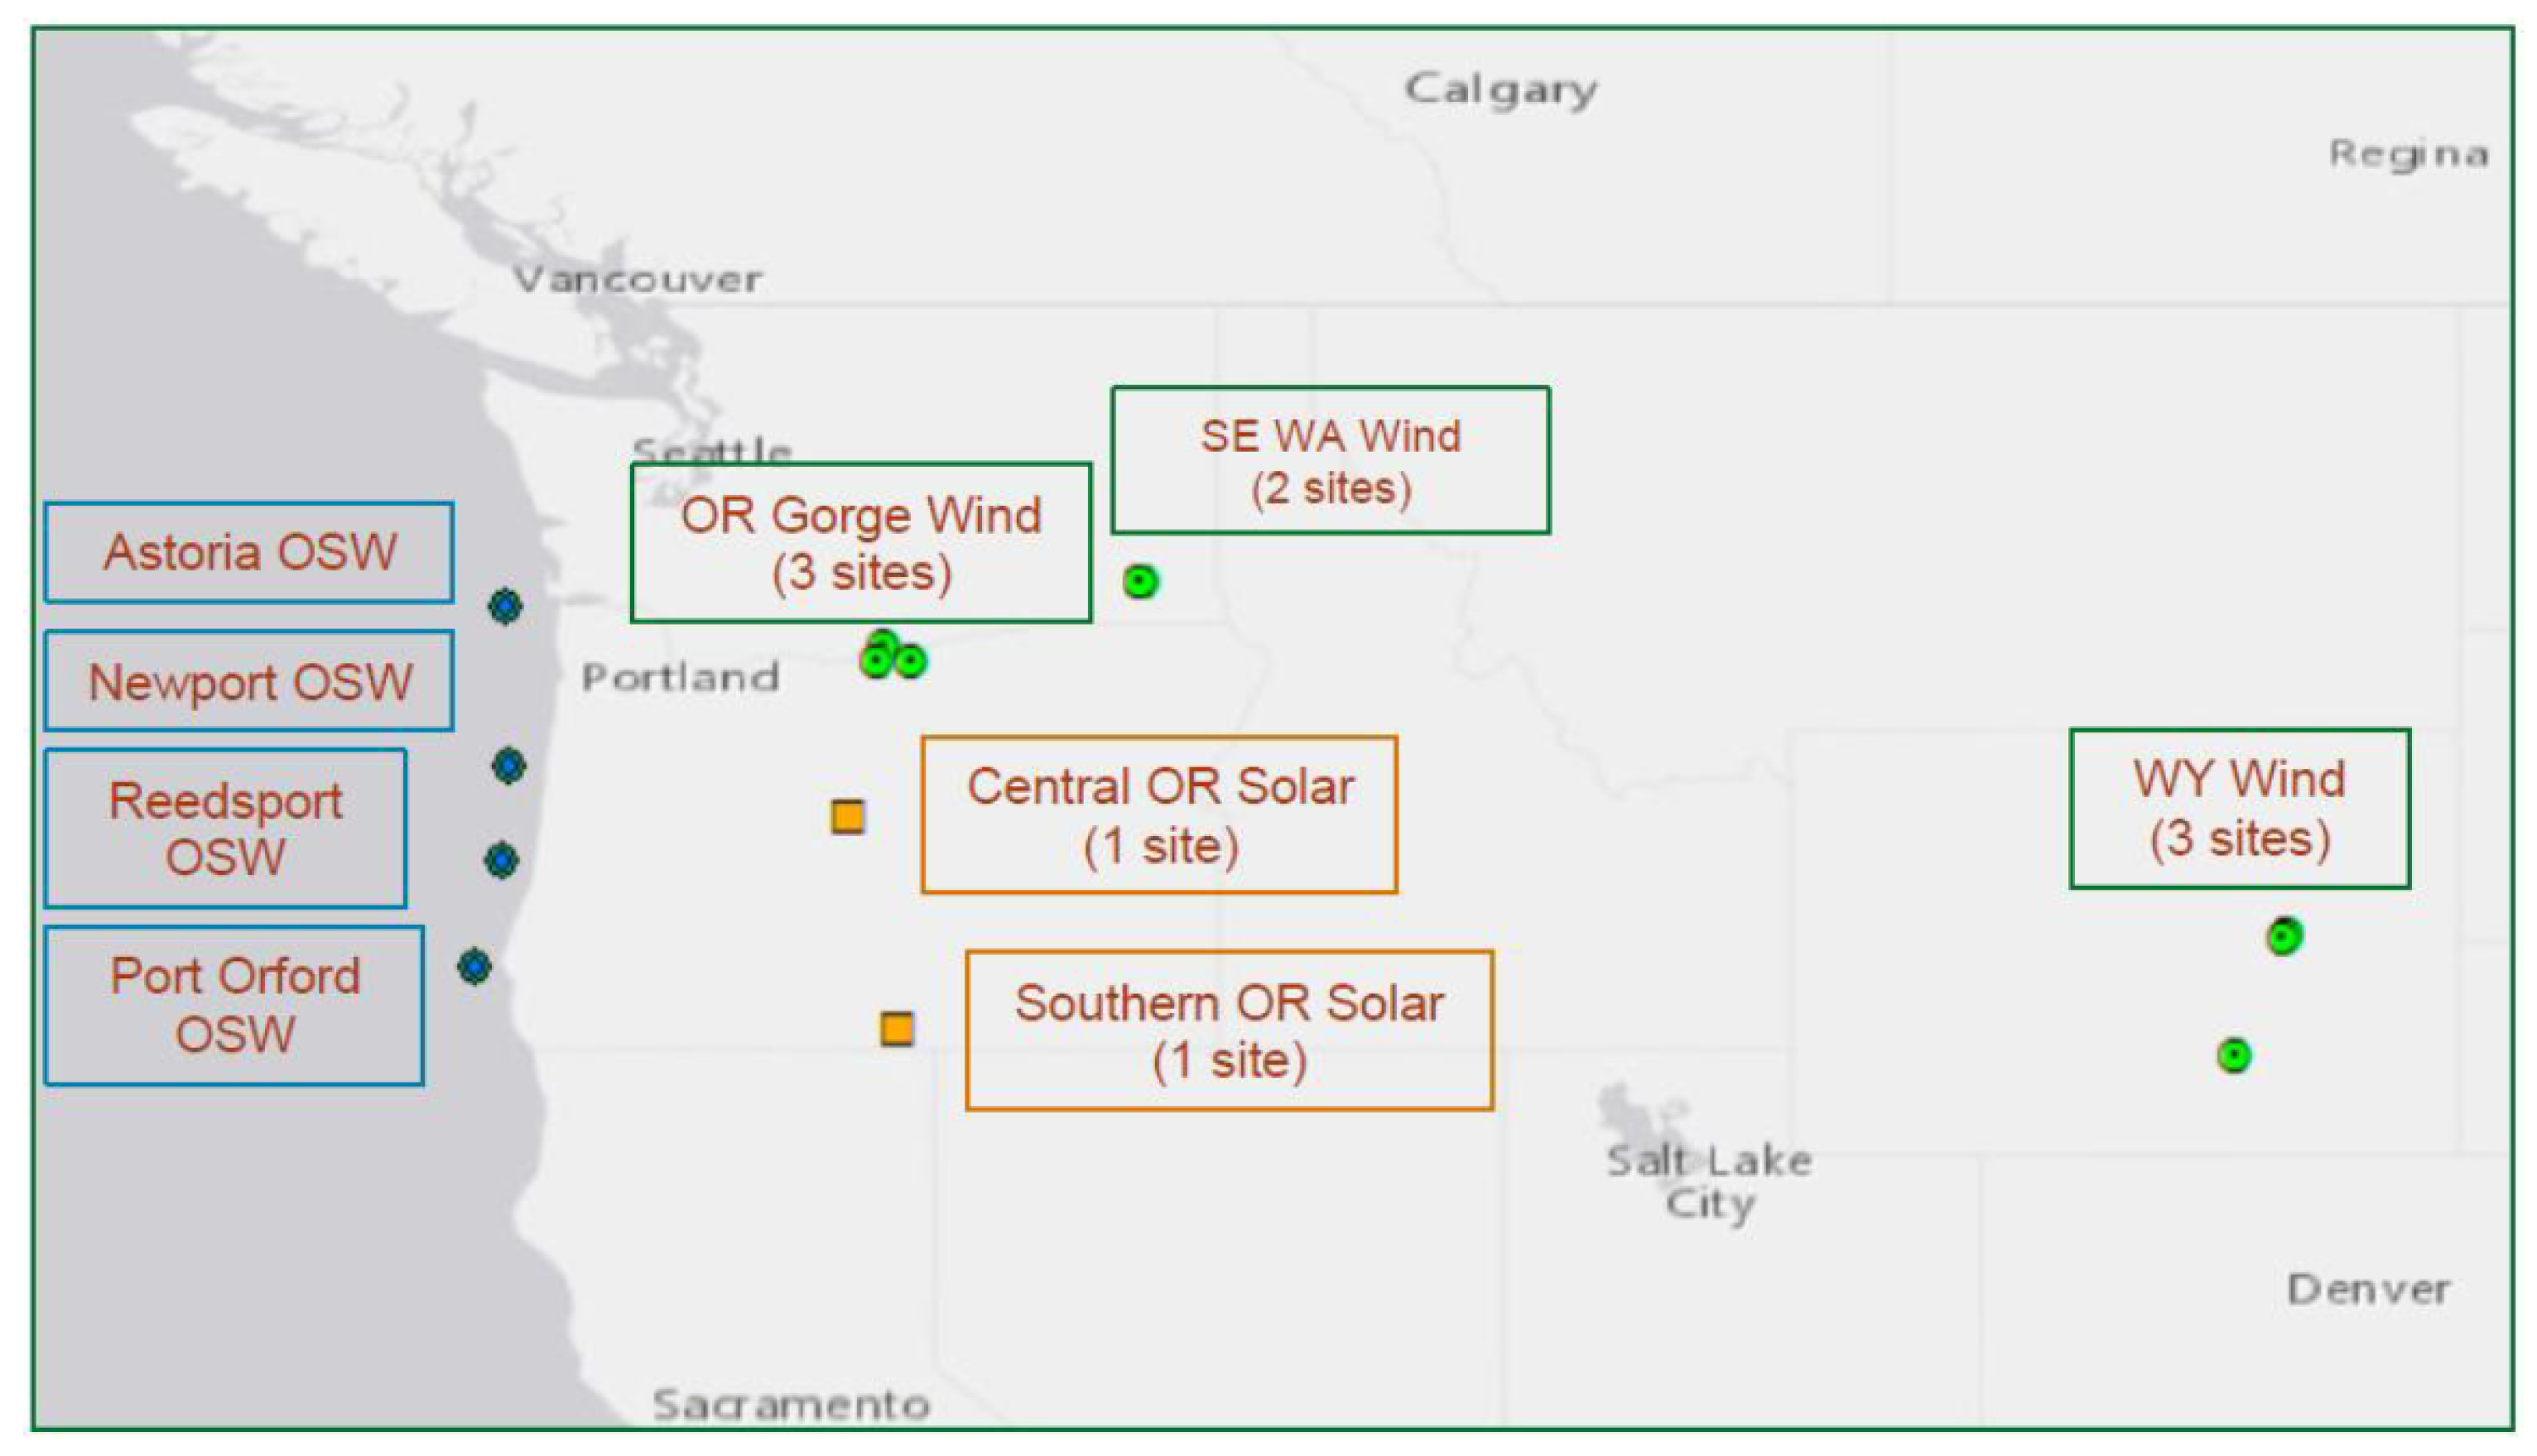
To investigate the potential of resource complementarity, additional renewable resources representative of significant present and emerging supply contributions within balancing authority areas in Oregon were compared with Oregon OSW resources. Though only wind speed and irradiance resources were scrutinized in this study, resource complementarity is expected to offer a reasonable proxy in time for generation complementarity across the conceptual locations and hub heights chosen. Onshore renewable resources were selected based on their scale to date or clear growth trends. Where significant development activity has been geographically concentrated, several locations were sampled. The Columbia River Gorge has seen significant wind energy development for more than 10 years and is home to more than 750 megawatts (MW) of rated capacity today.
Similarly, southeastern Washington represents a significant wind resource, with more than 1.5 gigawatts (GW) of nameplate capacity. Importantly, though benefitting from a similar wind resource, this cluster of locations is separated by approximately 150 miles from the selected Columbia River Gorge (“OR Gorge”) locations. Wind from Wyoming was also considered. Abundant wind speeds and higher Weibull wind distribution shape factors position wind farms in central and southern Wyoming with some of the lowest costs of wind energy in the nation. Furthermore, PacifiCorp wheels this power westward to PNW load, in contrast to strong wind potential in Montana, which lacks the transmission infrastructure to bring it to substantial loads in the PNW [
16]. Finally, utility-scale solar development in Oregon is on the rise [
17]. Two locations with the largest utility-scale solar farms in Oregon, one in Central Oregon and the other in Southern Oregon, were chosen to investigate complementarity. The OSW and onshore renewable resource locations are shown in
Figure 2.
Solar irradiance is quantified at hourly intervals in terms of direct normal irradiance (DNI) and global horizontal irradiance (GHI) in the National Solar Radiation Database (NSRDB) [
18]. As with wind, because it is the nature of the resource that drives correlations in the time dimension, the conversion to units of power was not pursued in this study. However, depending on the orientation of panels and/or tracking systems, both the DNI and GHI could be important. To account for both factors, a simple magnitude of the irradiance resource was calculated through the square root of the sum of the squared DNI with the squared GHI at every hour.
The quantification of complementarity on various time horizons offers a means to understand the degree of the capacity value, which may be available when combining these resources across the transmission system. Numerous studies have quantified the complementarity of renewable energy generation on various time horizons through the Pearson’s correlation coefficient,
r [
19,
20,
21,
22,
23,
24]. The correlation coefficient quantifies correlation as:
where
X and
Y correspond to the time series data of two signals, with means
and
of the number of samples,
n, in each series.
Snapshots of excellent correlation over eight-hour time excerpts are shown in
Figure 3 as an indicative example. While perfect or near-perfect negative correlation among generators is not a realistic expectation over a significant time horizon, the resource complementarity indicated by more negative
r values suggests firmer aggregate generation and potentially greater capacity value.
It is important to note that this quantification approach, focusing on VRE resource data only and not considering power production or transmission congestion, is idealized. The goal here is only to indicate the potential value of OSW and identify future investigations into value, inclusive of barriers to its achievement.
2.2. Production Cost Modelling
ABB’s GridView software was used to analyze bulk grid impacts of the addition of OSW to the Oregon electric system. GridView integrates engineering and economic analysis of the electric power grid to simulate security-constrained unit commitment and economic dispatch in large-scale transmission networks. It is a tool that is widely used to study the utilization of generators and transmission lines, the production cost of generation, locational marginal pricing, transmission congestion, and more [
25].
The Western Energy Coordinating Council (WECC) currently uses GridView as a tool for production cost modeling efforts in the Western Interconnection. Within WECC’s GridView production cost model (PCM), expected loads, resources and transmission topology ten years into the future are compiled and maintained. The WECC PCM used in this study was the 2028 ADS (Anchor Data Set) V2.0 PCM base case available as of July 2019. This case was the best available projection of new generation and transmission assets from the grid planning community within WECC at the time. The study used this case as-is and did not make any changes to the resources, transmission or topology contained within the case, aside from the addition of OSW resources.
Based on the data within the 2028 ADS V2.0 PCM, significant changes in the generation resource mix within WECC were projected. However, the changes to Oregon are limited to a small number of additional photovoltaic (PV) plants. Otherwise, there is a significant amount of additional capacity in California, Arizona, Colorado, Nevada and Utah that is expected to come online within the next ten years, and is reflected in the PCM. This new capacity is predominantly forecasted to be PV and wind. Transmission in the WECC 2028 PCM case provides the best representation of future topology and the transmission capacity available. It incorporates the addition of transmission projects into the ten-year planning horizon made publicly available to the grid planning community.
In the WECC PCM, hourly loads are modeled for the entire year by balancing authority. The load data within WECC’s PCM are based on annual Load and Resource (L&R) data submittals that contain monthly energy and peak forecast from one to ten years into the future. These data are then broken down from monthly to hourly data by applying the historical FERC Form 714 hourly load shape. The WECC 2028 PCM case currently uses a 2008 historic load shape to create the 2028 hourly load profile by applying the monthly peak load and total energy reported in the L&R. The historic 2008 load shape is an average load year with average weather conditions WECC-wide. For the purposes of this study, no changes were made to the load set by WECC in the model.
Although the model is WECC system wide, this study focused on the impacts of OSW resources added off the coast of Oregon, within Oregon’s state borders. The evaluation of results focused on the BPA, PGE and PACW balancing authority areas. IPTV was not considered through the PCM due to a lack of fossil generation within this balancing authority area inside of Oregon. Time-varying OSW production was approximated based on the 100-m WIND Toolkit wind speeds multiplied by a representative 15 MW power curve as employed in prior research [
9]. Total OSW generation was added in increments, from one to five gigawatts, distributed equally across the four locations, and interconnected to the nearest high voltage above a 230 kV transmission substation on land as listed in
Table 1.
The model runs of the different OSW deployment scenarios were for a one year duration, of the model year 2028. These runs were conducted using a model with load nodes within each balancing authority at an hourly resolution across the entire WECC system. The scenarios evaluated were based on a future scenario where all thermal plants are retired and five gigawatts of OSW provide 80% of the replacement generation [
9]. The study evaluated the integration of one to five gigawatts and also incorporated one scenario where three gigawatts of offshore wind were combined with projected electric vehicle (EV) loads [
26].
3. Results
The value proposition of offshore wind energy in Oregon was characterized through the frames of (i) complementarity with other emerging forms of VRE power generation; (ii) complementarity with system needs as represented through load profiles and peak load periods; and (iii) impacts to coastal and regional power flows.
3.1. Generation Resource Complementarity
In this section, the temporal and spatial characteristics of Oregon OSW are considered. As grids decarbonize, energy generation sources will become increasingly variable. Geographic and generator diversity may help smooth the variability at transmission system scale. Conversely, resources that pose dramatic ramps may not afford this inherent smoothing potential and instead require dedicated balancing reserves.
3.1.1. Complementarity with VRE Generation
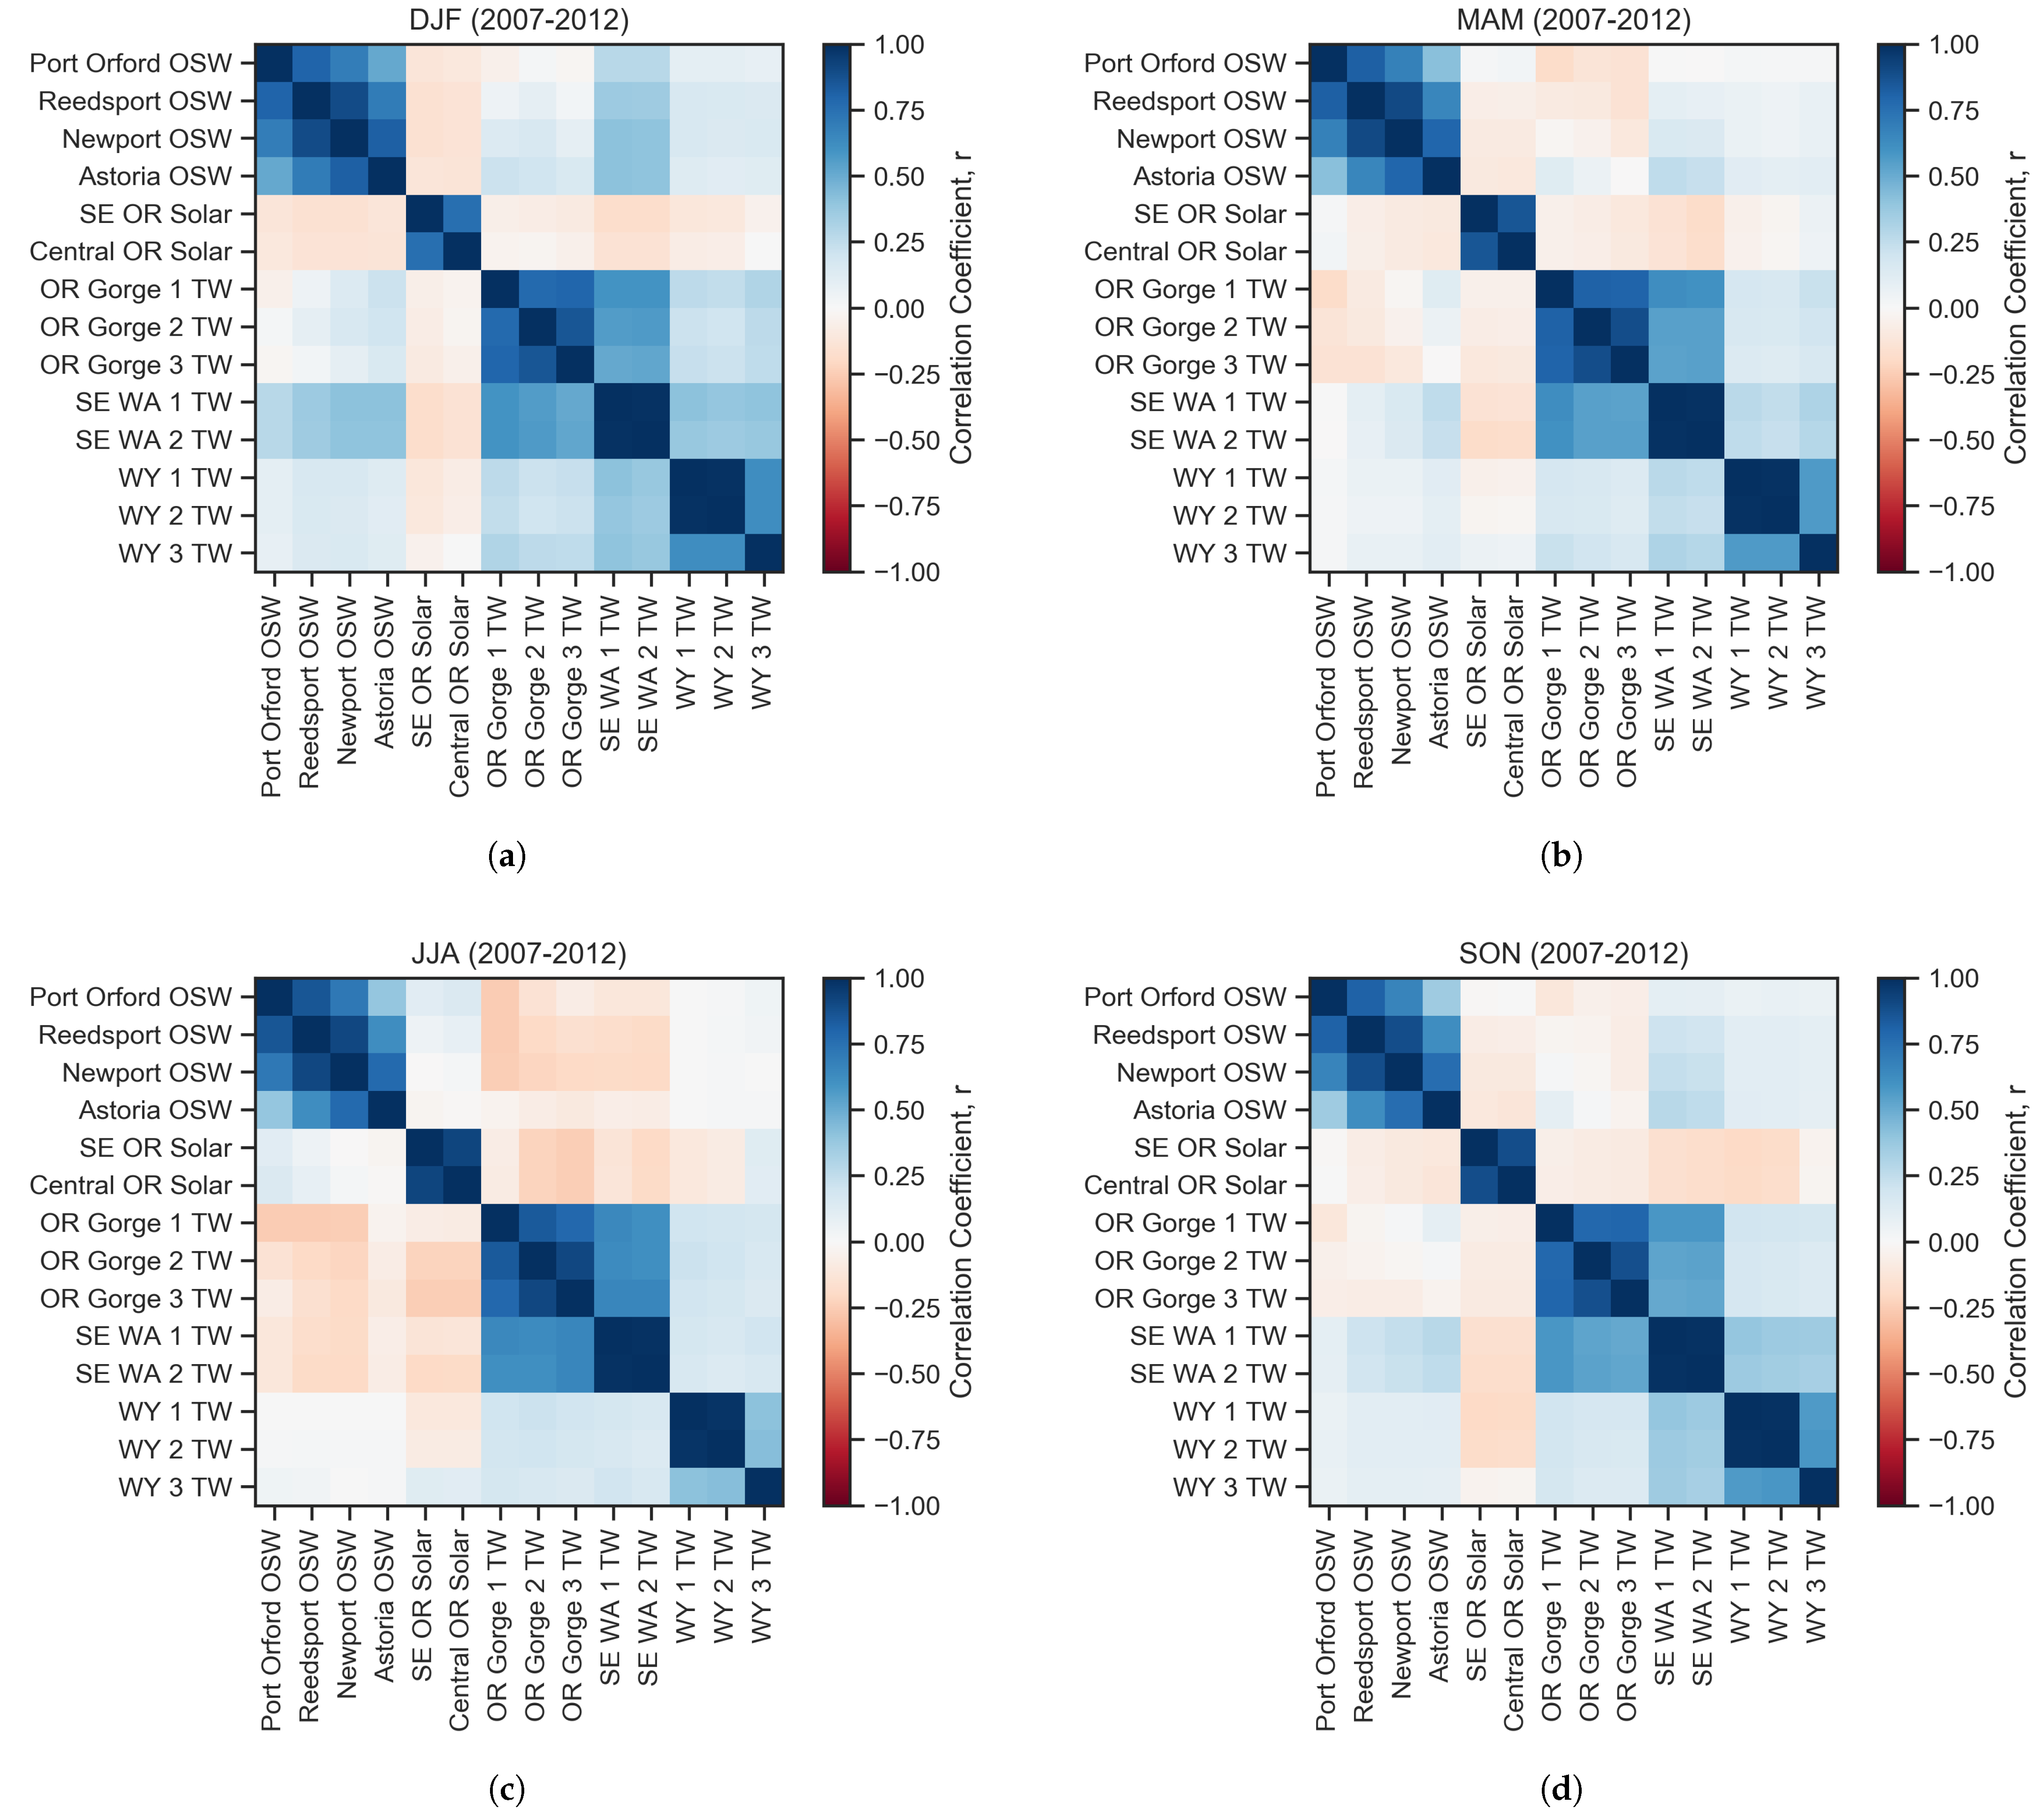
In
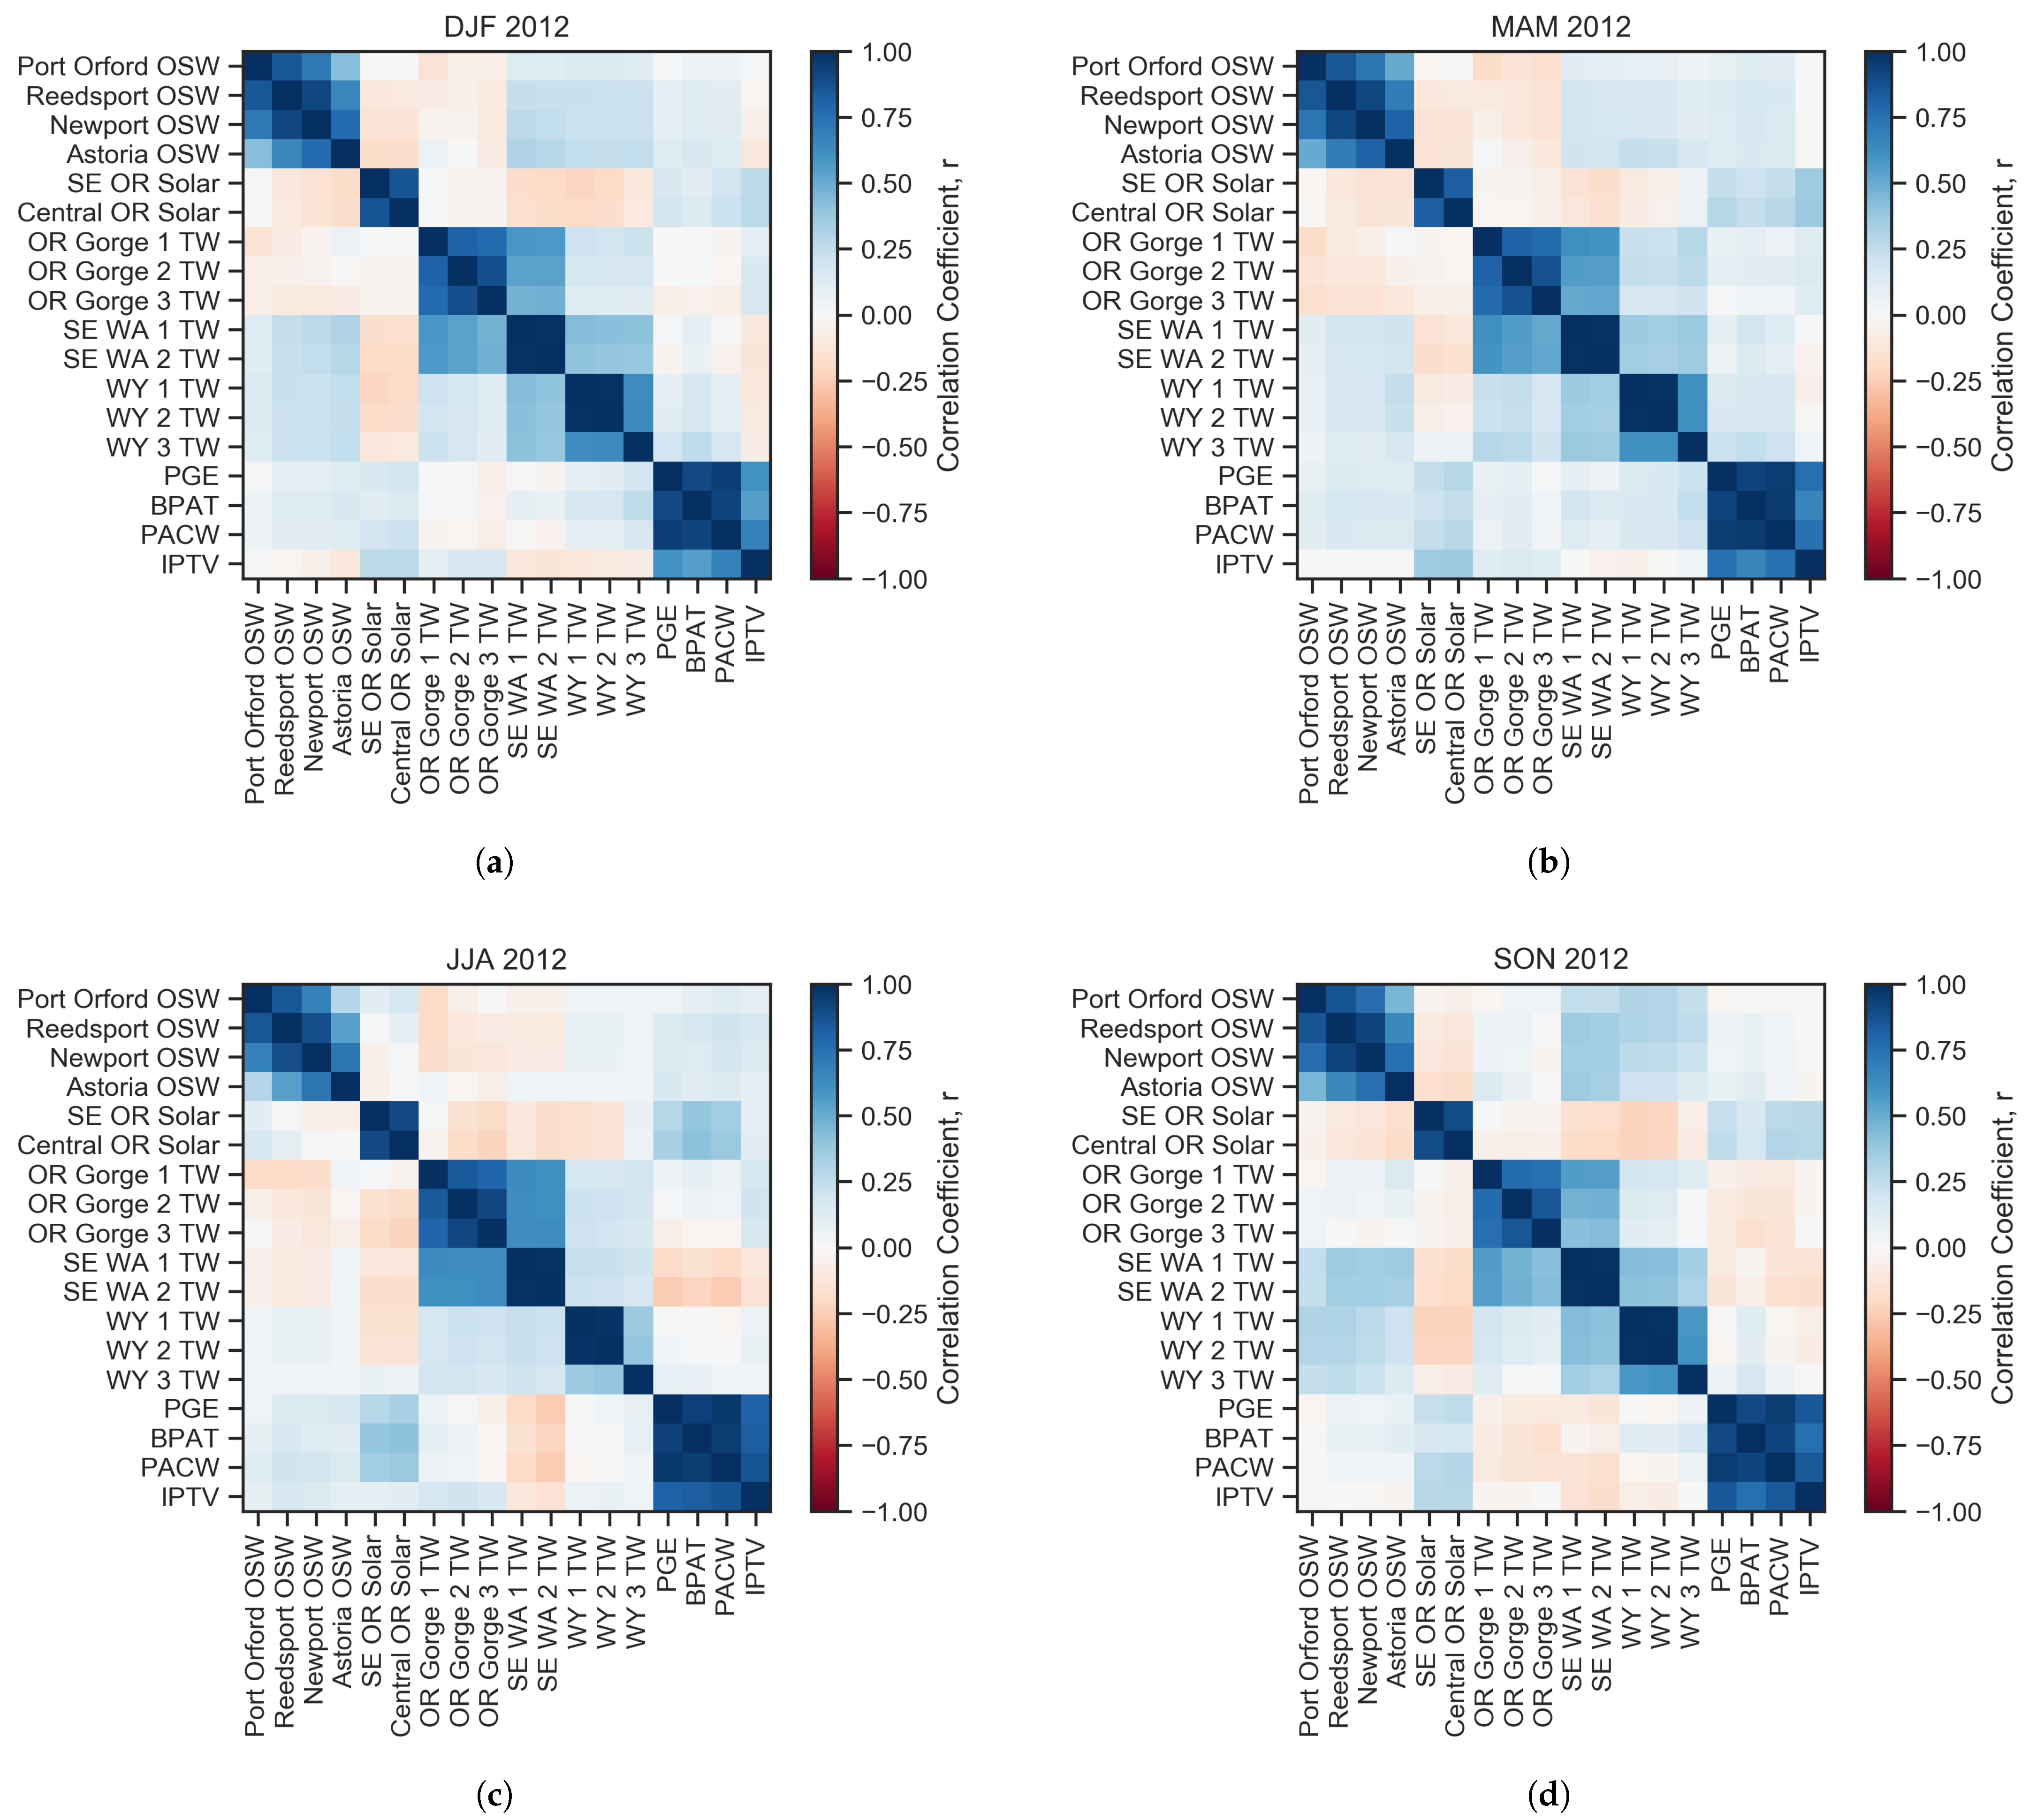
Figure 4, the calculated resource complementarity coefficients are summarized by season from 2007–2012. Seasonal perspectives are important due to the significant changes in solar and wind resources between the winter, spring, summer and fall. Seasonal dynamics drive important changes in load patterns as well, and generation capacity is planned around these trends. On a grid with significant penetration of VRE resources, this same level of scrutiny must be applied to resource and generation characteristics.
Just as there are clear seasonal trends, inter-annual variability in wind and solar resources can be significant. The consideration of multiple years yields several insights. The complementarity of Oregon OSW resources with the Gorge and SE Washington terrestrial wind in the summer (r ≈−0.20) and spring (r≈−0.13) indicates that OSW could help balance terrestrial wind in these periods. This may be particularly valuable in the late summer, which coincides with lower hydroelectric resources, and the effect is more pronounced in correlation with southern Oregon OSW in the spring months. OSW could complement Oregon solar generation in the winter (r≈−0.15) when loads peak in the PNW. Not all correlations are positive for Oregon OSW. Oregon OSW does not complement solar as well as terrestrial wind does in the summer. OSW is also largely uncorrelated or slightly positively correlated with Wyoming terrestrial wind.
3.1.2. Generation Resource Consistency
Another lens through which to evaluate the OSW grid value is resource consistency. The hypothesis of the consistency of OSW being superior to that of onshore winds remains unproven in most regions with significant OSW resources, including in the PNW, even though this consistency is often cited as a benefit of OSW resources.
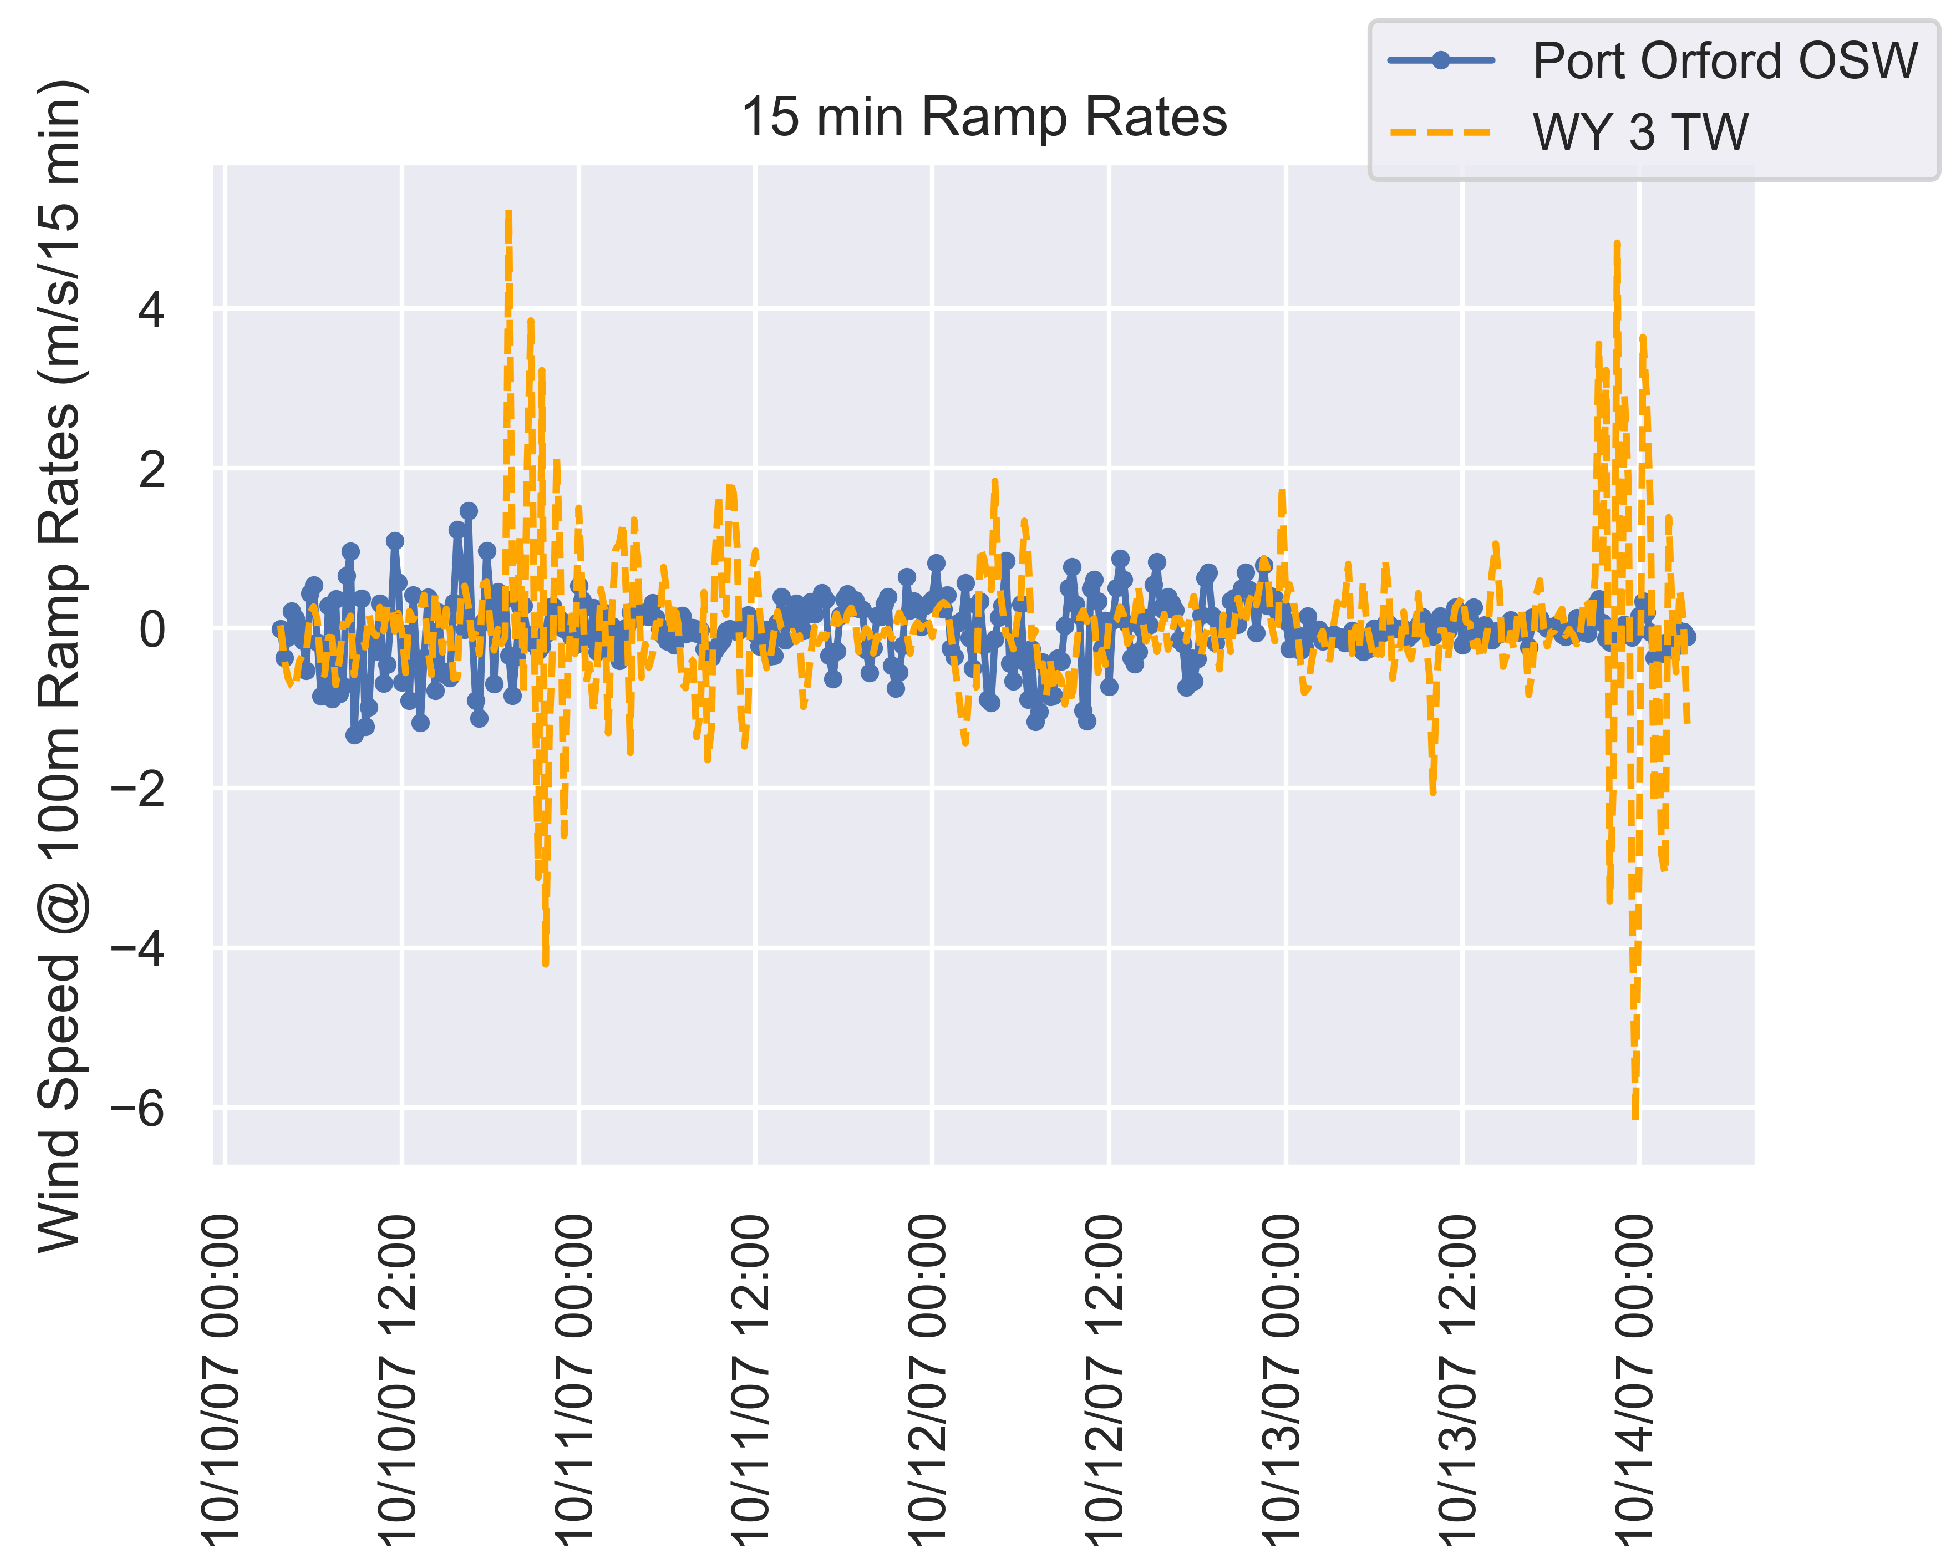
To further investigate the degree of Oregon OSW consistency, wind speed ramp rates were examined over hourly, 15-min and 5-min durations. Ramp rates were generally similar across the northwest, although a trend was spotted through random samples of the 5-min data, which was most clearly observed when aggregated over 15-min intervals.
Figure 5 provides one such sample, indicating a discrepancy in the scale of ramps between Port Orford OSW and the Wyoming 3 TW data.
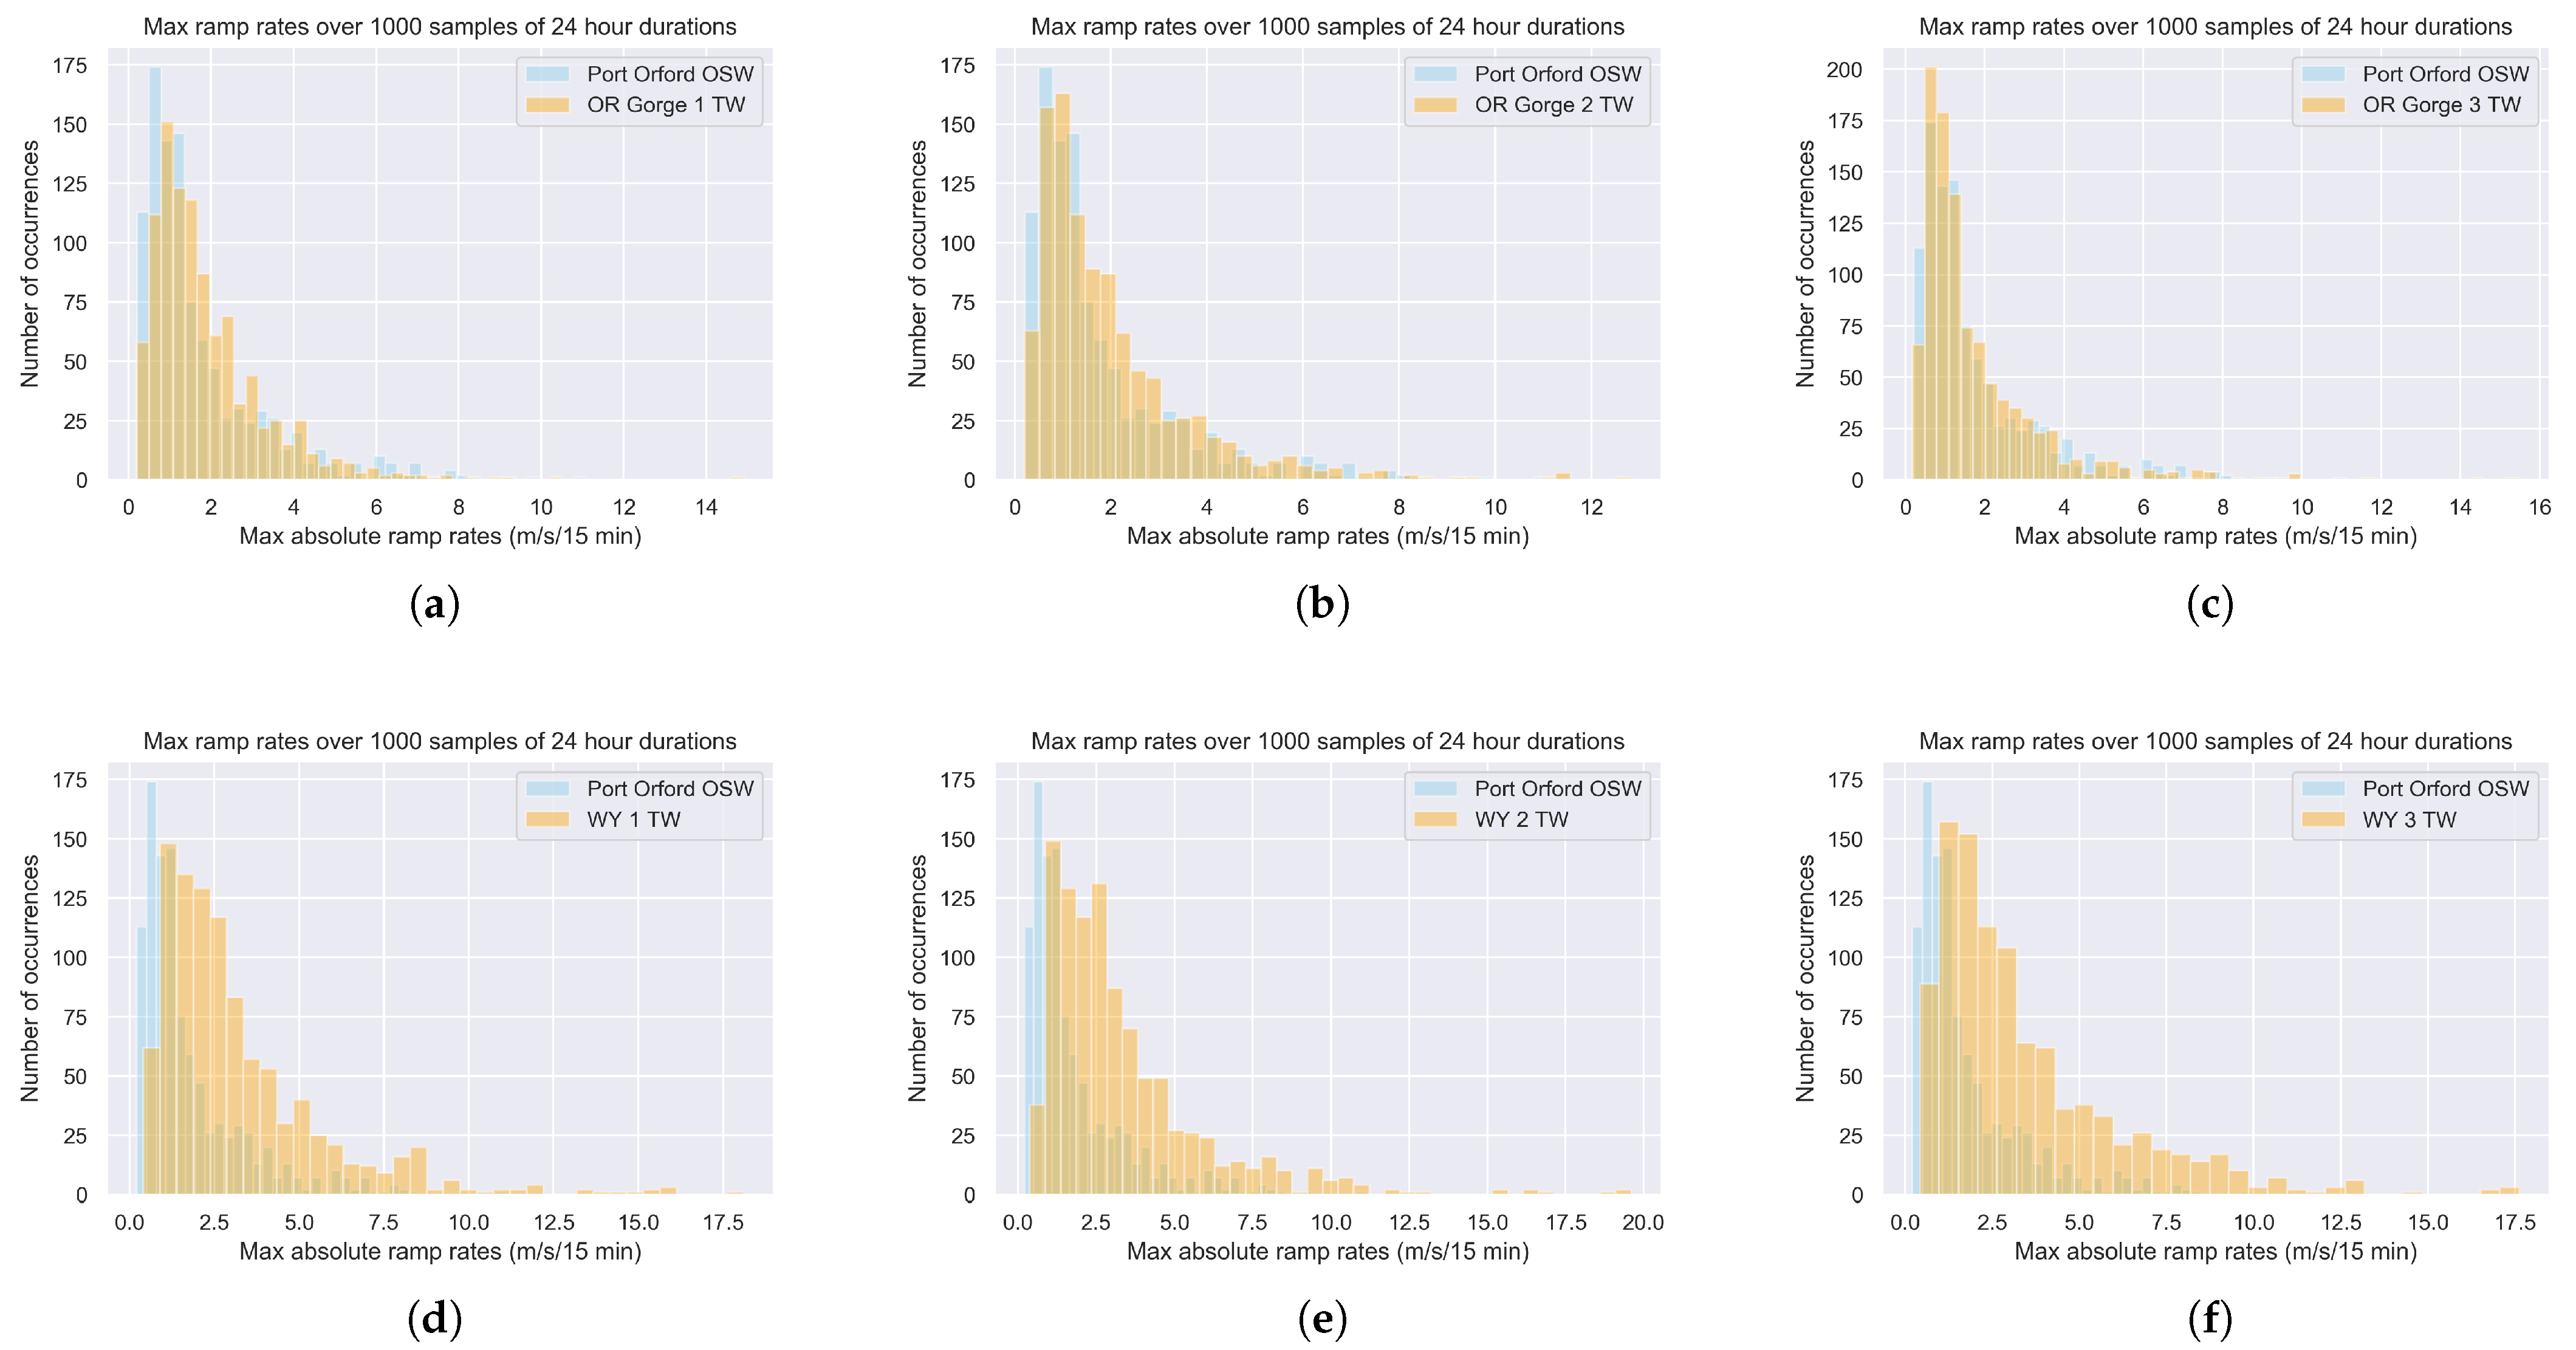
Figure 6 indicates that this effect is statistically significant. First, 1000 random samples of 24-h periods from 2007–2012 were selected. Next, the absolute value of the maximum and minimum 15-min ramp rates was computed. Finally, the maximum of these absolute values was extracted. These absolute maximum ramp rates were then plotted on a histogram across the 1000 samples for every terrestrial wind location versus the Port Orford OSW. As in several instances in the current study, Port Orford was chosen as a single location representative of the OSW resource and is used to indicate a trend. The ramp rates were consistently higher in the Wyoming locations, but not in all locations, such as the Columbia Gorge sites.
3.2. Load Complementarity
As with resource complementarity, an examination of how the wind and solar resources align with the need for power is insightful. Load time histories from 2012 in units of megawatts were sourced for the BPAT, PGE, PACW and IPTV balancing authorities from FERC Form 714 [
27]. Correlations with these time series were appended to the resource complementarity matrices, as shown in
Figure 7.
3.2.1. Hourly Correlations with Balance Authority Load Trends
In contrast to resource complementarity, positive correlation coefficients, r, between resource and load indicate complementary power generation when it is needed. Oregon solar shows the highest complementarity of all resources considered, particularly in the summer months (r ≈ 0.40) in the BPAT, PGE and PACW territories. However, OSW shows a positive correlation with load in the winter (r≈ 0.15), spring (r≈ 0.17) and summer (r≈ 0.18). This complementarity is similar and higher than the Gorge wind in the spring, and higher than SE Washington wind in the winter and summer. In the fall, OSW is largely uncorrelated with load.
3.2.2. Capacity Factors
Oregon balancing authority load profiles from 2012 indicate two peaks—one in the morning from 9 am to 11 am and one in the evening from 6 am to 9 am. At the WECC system scale, there is one peak in the afternoons from 3 pm to 7 pm. Other studies also identify the same trend [
9,
16].
Table 2 identifies the generator (gross) capacity factors associated with these hours across the year.
As measured during the 2012 peak periods previously identified, the gross capacity factors of Oregon OSW are higher in the south. Relative to the WECC peak, Reedsport OSW provides the lone exception to this trend, although the average over all sites is 44%. During Oregon’s morning and evening peaks, gross capacity factors averaged across all OSW locations are 51% and 55%, respectively.
3.3. System Impacts
System impacts have been considered in terms of displaced generation, curtailment of OSW at various levels of interconnection, and coastal and regional power flows.
3.3.1. Power Generation Shifts
Dispatch simulations through the PCM provide valuable insights into the potential impacts of Oregon OSW development. The introduction of offshore wind to Oregon coastal transmission grids satisfies coastal power needs and then propagates eastward to the large Oregon loads in the Willamette Valley. These flows disrupt the historical east–west power flows into these load centers, displacing combined cycle and combustion turbine natural gas generation and coal generation from the eastern side of the PNW region. In addition, the flow shifts free capacity on east–west transmission lines, such as those running through the Columbia River Gorge, which may be used by other renewable energy generation sources such as land-based solar and wind further east, where the resources are the strongest in the PNW and broader WECC regions. Hydropower generation is minimally effected in the PCM simulations within three gigawatts of offshore wind interconnection.
More significantly, PCM simulations indicate that the existing transmission networks maintain the technical capability to interconnect more than two gigawatts of OSW without significant curtailment, as shown in
Table 3. Generation cost savings remain significant through three gigawatts, where they reach
$86 million per year, even as curtailment begins to increase.
3.3.2. Spatial Value–Coast
Impacts to coastal stakeholders were also tracked.
Figure 8 depicts interconnection points, which were highlighted in southern Oregon and the key transmission corridors.
Transmission flows in southern Oregon are re-directed in accordance with the regional trends identified.
Table 4 provides mean and peak flow reversals at Reston, Dixonville and Wedson substations given three gigawatts of OSW interconnection.
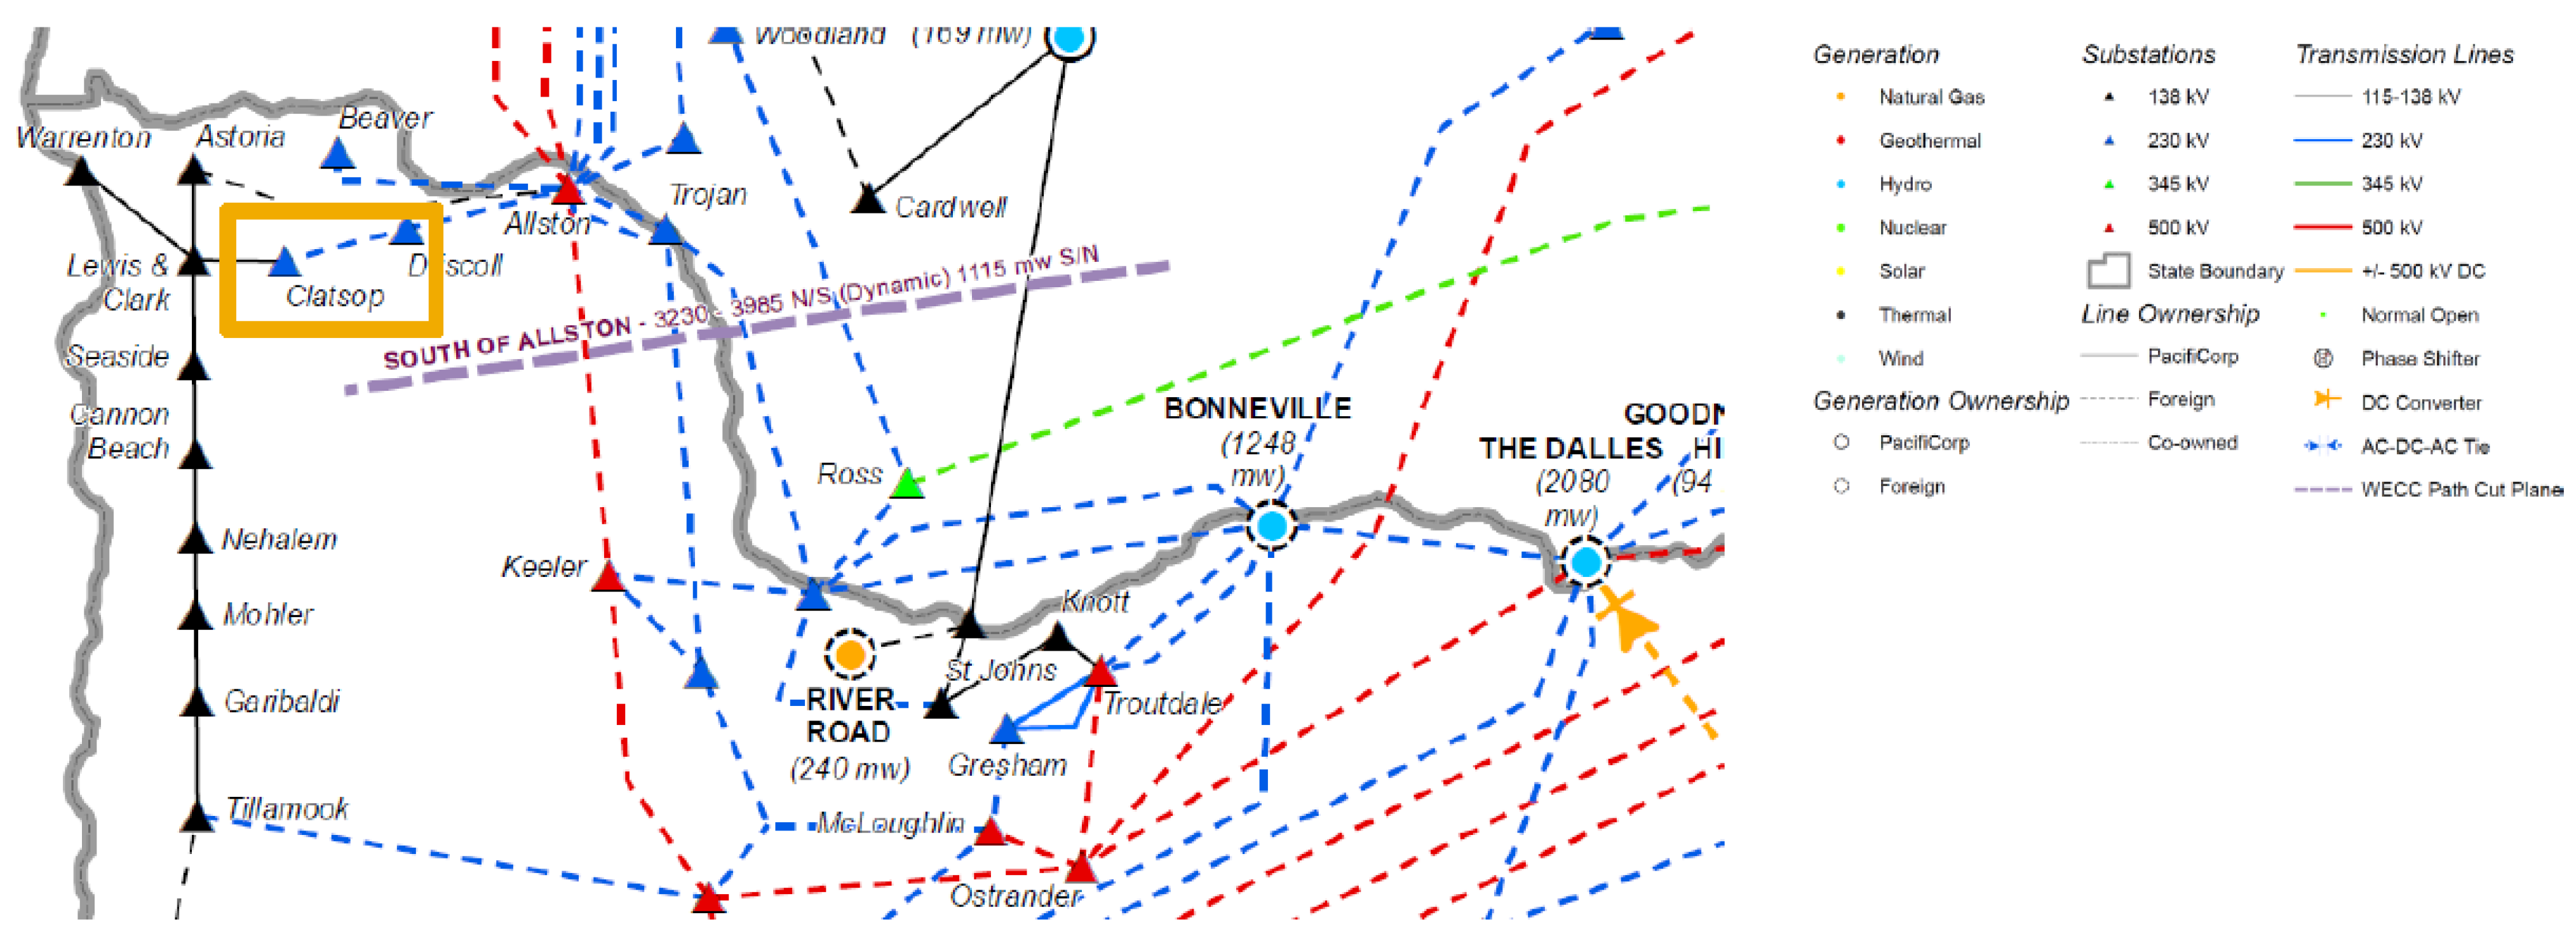
Trends are similar in northern Oregon.
Figure 9 represents the key transmission flows and
Table 5 indicates the flow reversals resulting from PCM dispatch simulations which correspond to the three gigawatt OSW scenario.
3.3.3. Spatial Value–Region
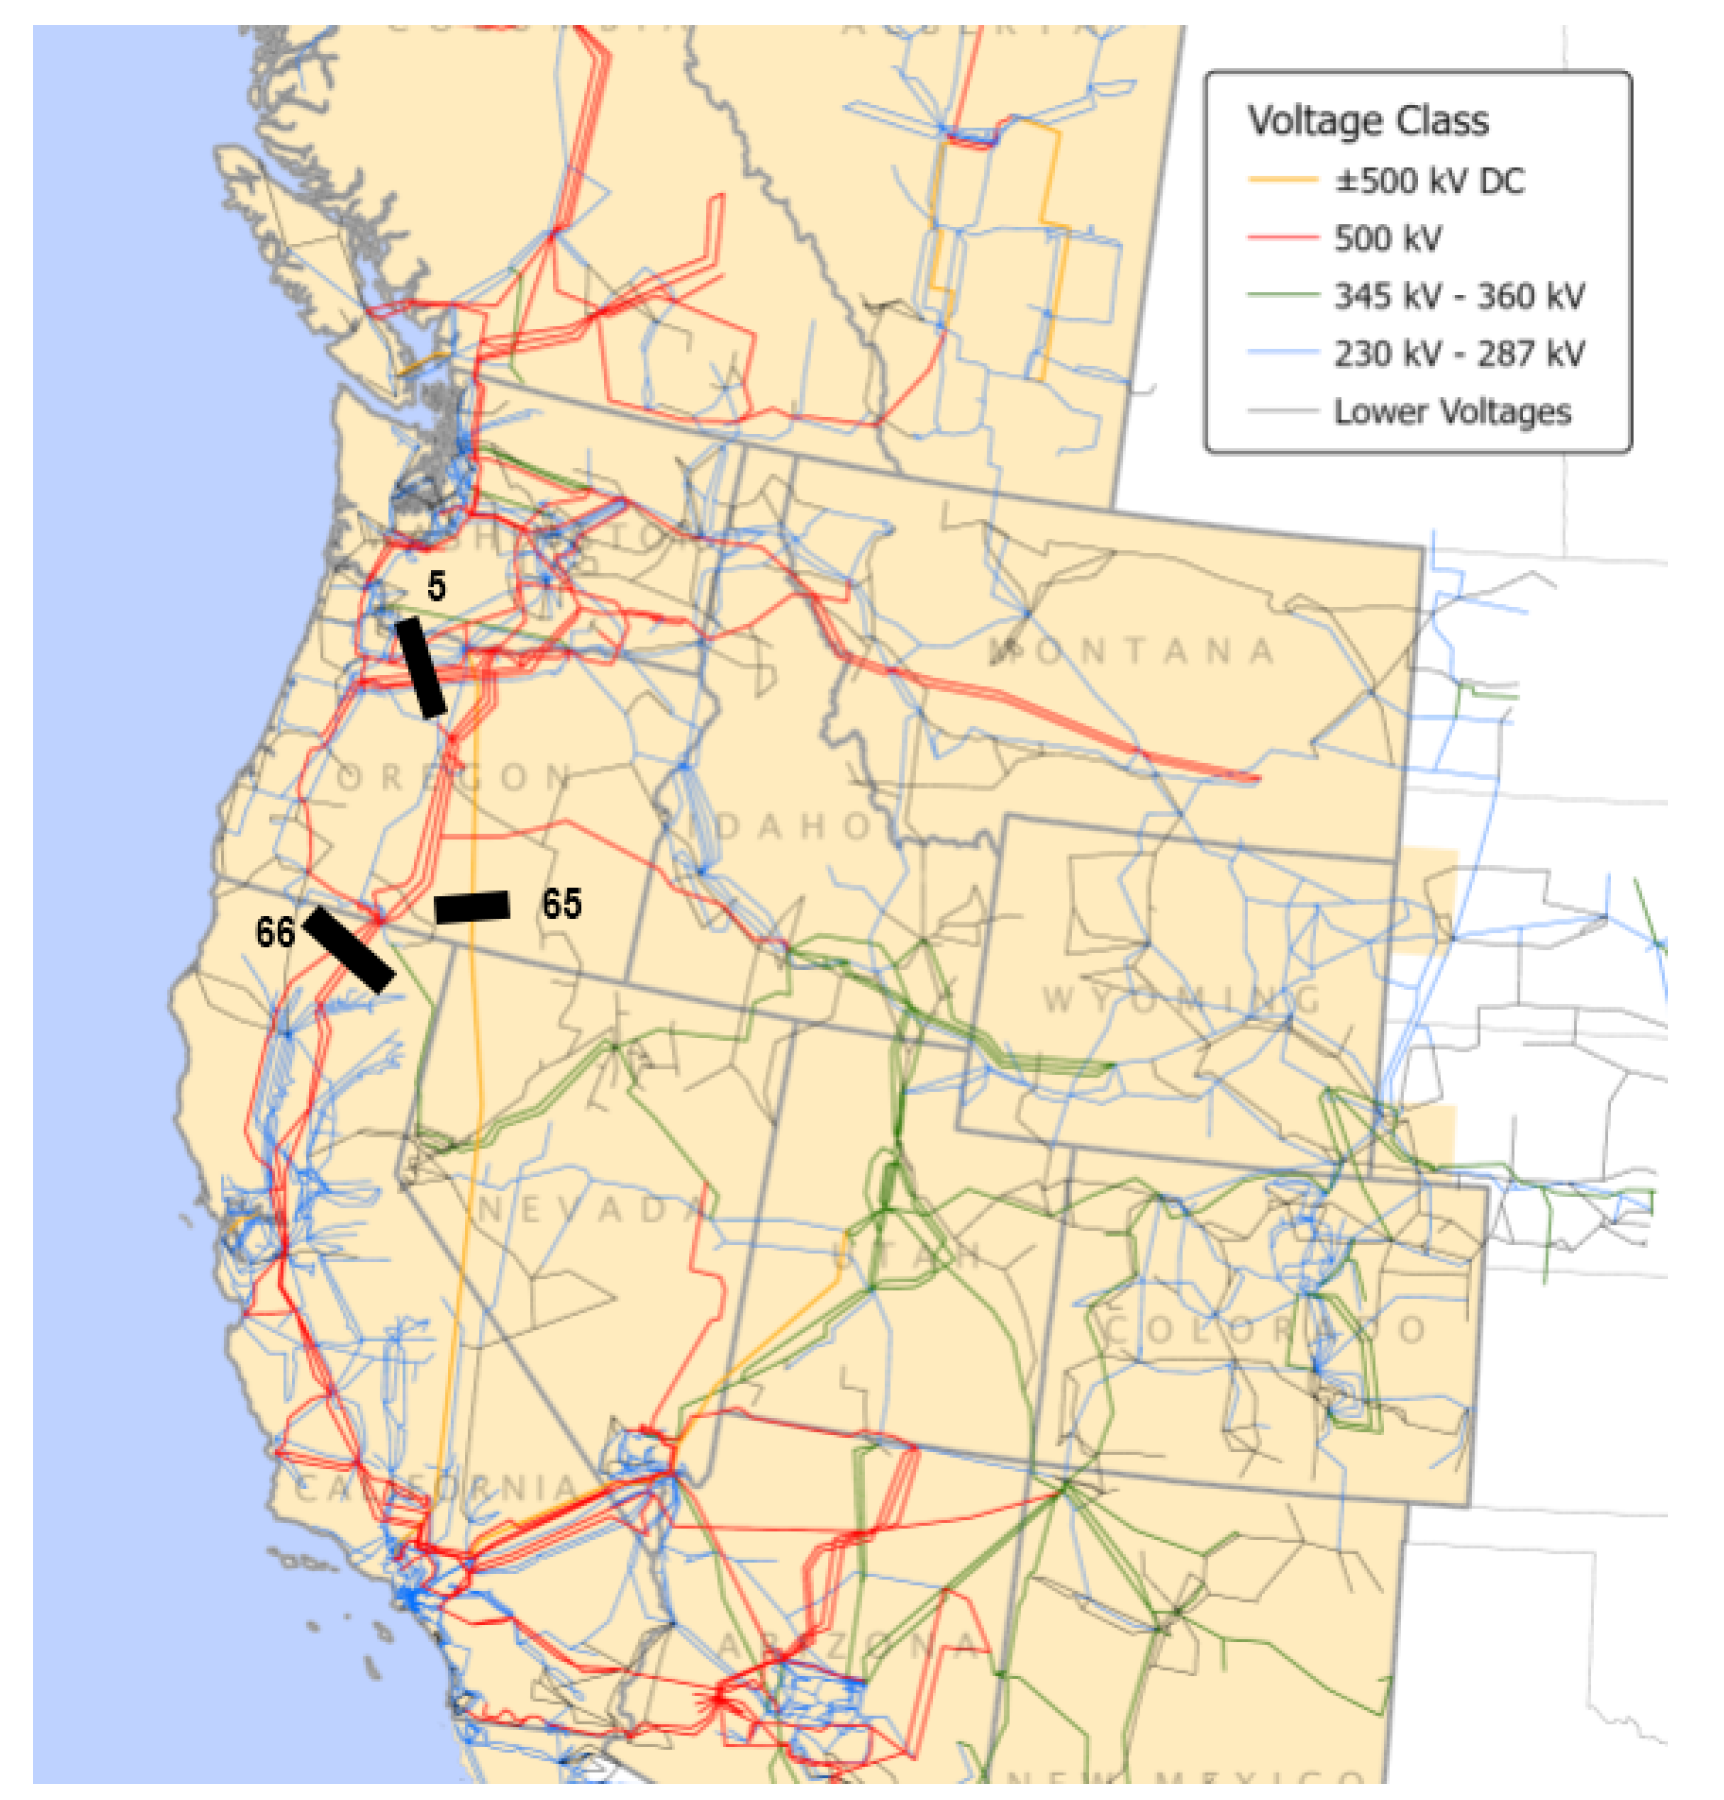
Given the potential of Oregon’s OSW resource, transmission flows were examined through key regional flow gates as indicated in
Figure 10.
One of the primary flow gates is path 5, which historically carries hydroelectric, natural gas, coal, and land-based wind energy generation from the east to the Willamette Valley load centers.
Figure 11 indicates the reductions of these average flows from a baseline, which peaks at around 4000 MW at noon to less than 3300 MW with five GW of OSW development.
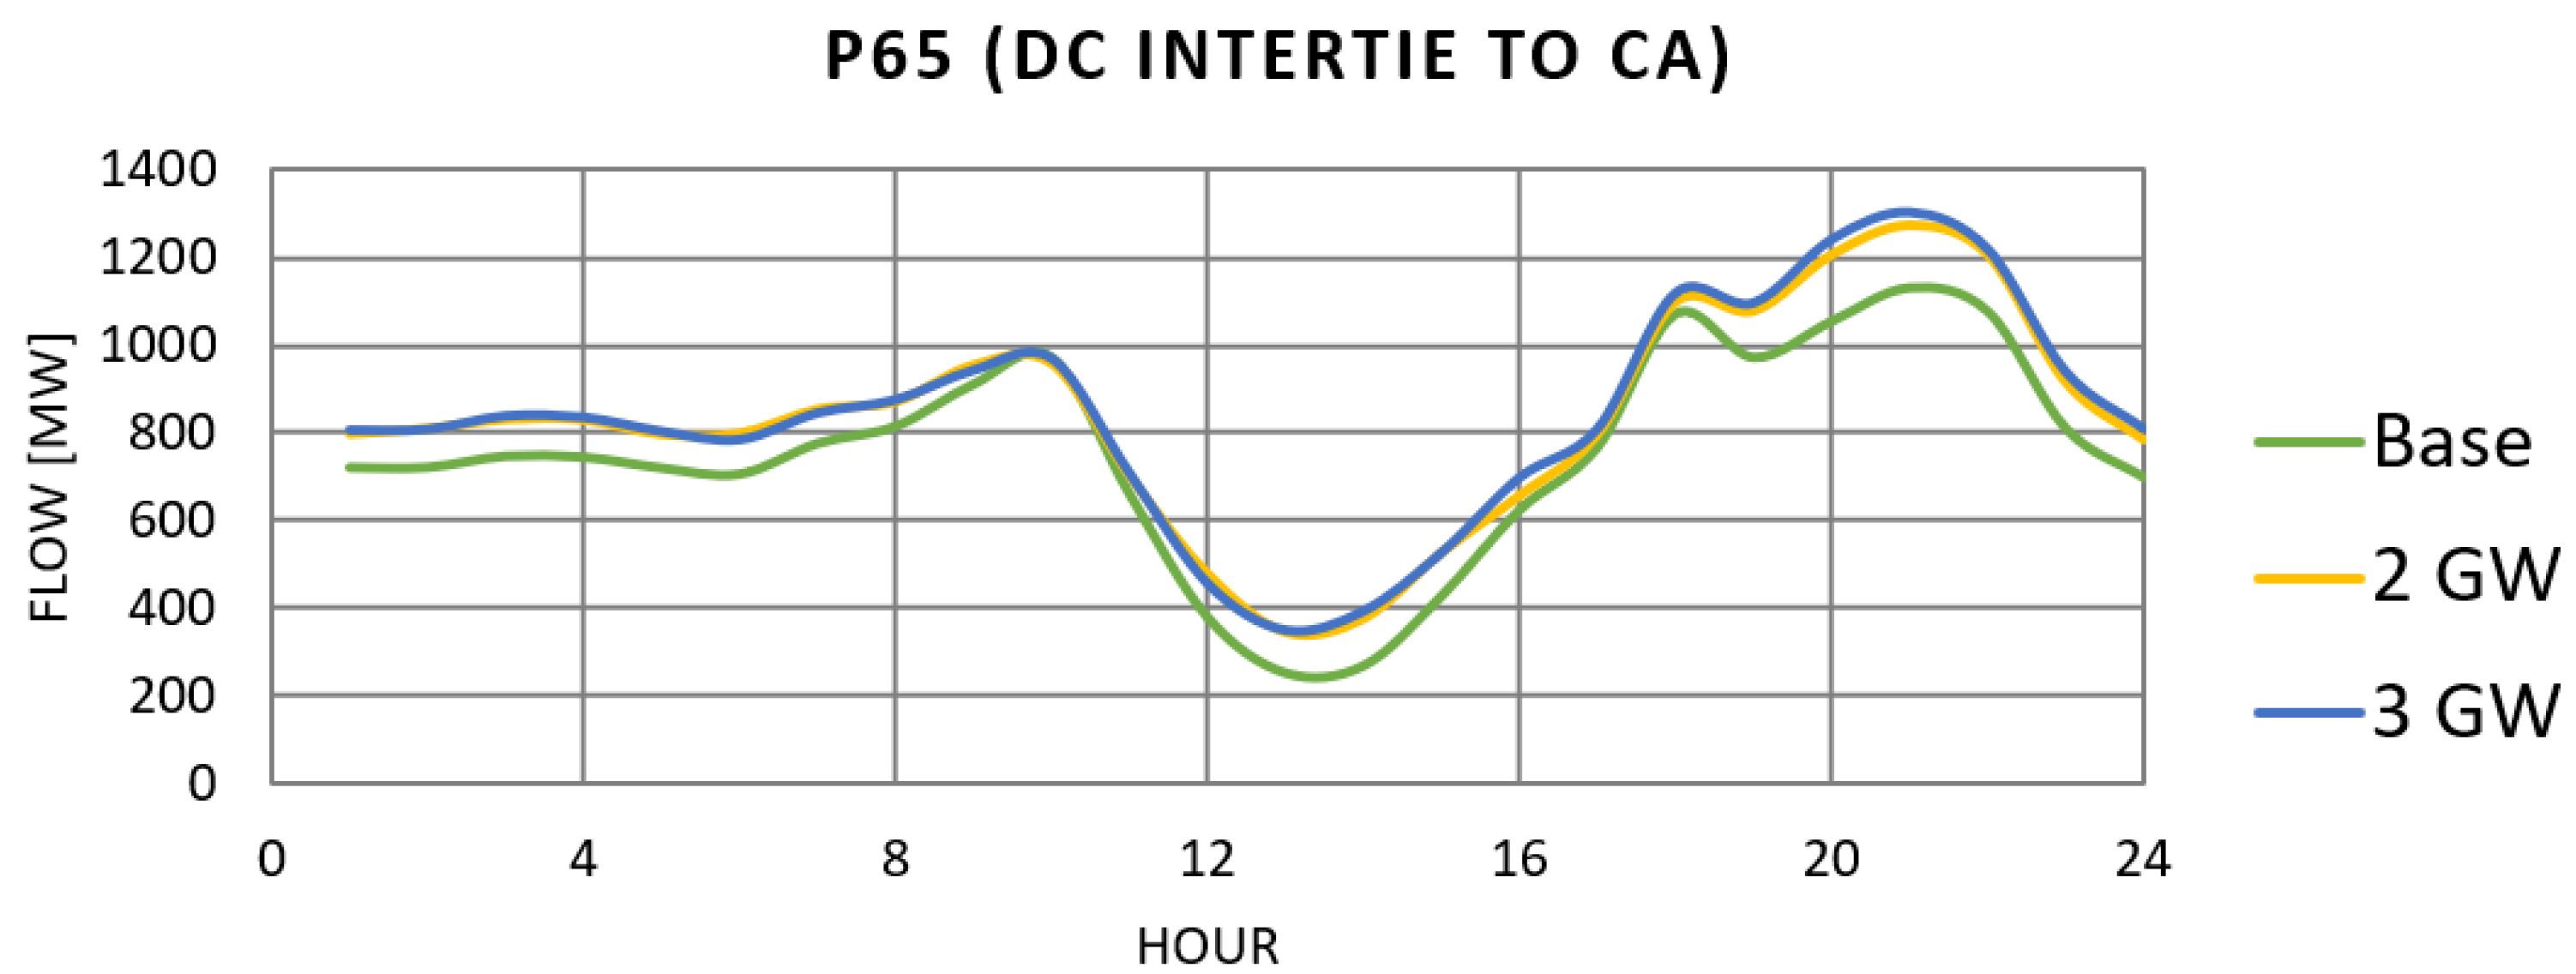
Power flows across state borders were also inspected. Path 65 corresponds to the high voltage DC intertie to serve loads in Southern California from Columbia River Gorge hydropower and wind.
Figure 12 indicates that less than 200 MW (18%) of additional power flows through the intertie during any hour of the day, as averaged over the year, for up to 3 GW of OSW interconnection. With only two gigawatts of development, the power exports are changed only minimally.
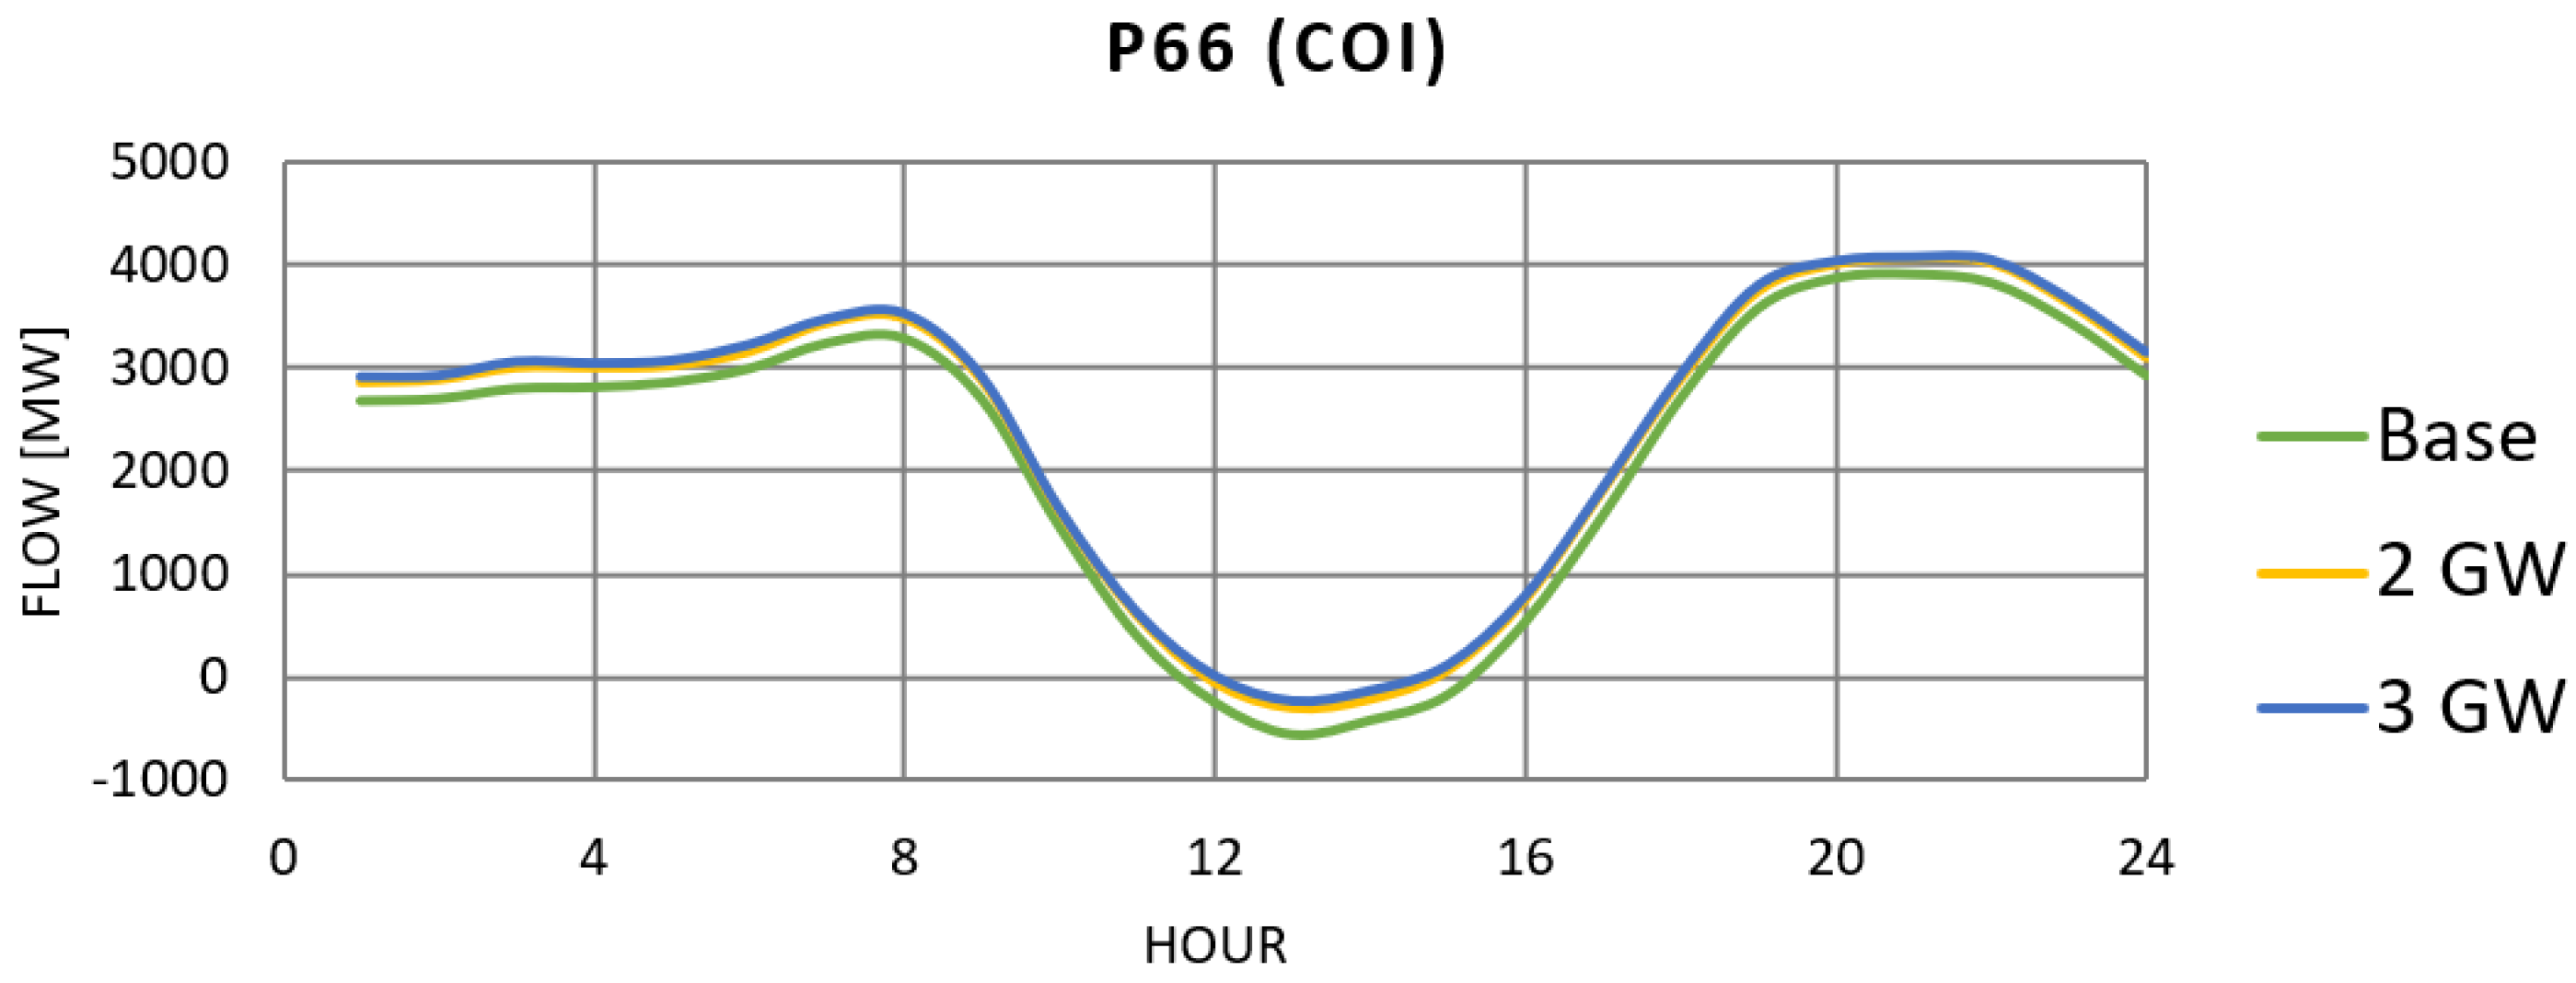
Finally, noting the market and regulatory factors which drive the likelihood of PNW OSW to serve California loads, flow gate 66 was surveyed. Given relatively limited coastal transmission and loads in the northern California and southern Oregon regions, and despite the larger California loads to the south, even 3 GW of OSW does not significantly increase southerly flows, as seen in
Figure 13.
4. Discussion and Conclusions
Based on generation deployment simulations of the Western Interconnection as tuned through industry feedback, approximately 2 GW of OSW could be interconnected and transmitted in Oregon today without additional infrastructure investment or significant OSW curtailment. Substantial generation cost savings and carbon dioxide emissions reductions extend to 3 GW of OSW integration even as curtailment increases. However, the lack of innovative market mechanisms or regulatory paradigms to fully recognize the value—inclusive of capacity and resilience contributions—that OSW could deliver to Oregon’s grid and its coastal communities may delay development. Additionally, the difficulties in expanding transmission over the coastal range and constructing new transmission to the central and southern Oregon coast present significant challenges to OSW development beyond 3 GW. These barriers may limit the benefits to Oregon’s power consumers.
An analysis of coastal and regional transmission flows indicates that the OSW energy would serve coastal loads. Further, the deployment of OSW opens up transmission capacity from eastern Oregon and the Columbia River Gorge into northwest and central Oregon. This frees the existing transmission corridor to provide additional generation from the Gorge, and locations to the north (SE Washington), east (Wyoming, Montana), or southeastern Oregon. This may be a particularly valuable attribute as Oregon and the region shift towards clean energy, as most of the best onshore renewable resources are located east of these transmission constraints.
Both complementarity with other generation resources, in a general sense, and with load are important facets of capacity value. Complementarity with Columbia Gorge and southeast Washington wind is demonstrated primarily in the summer but also in the spring. Barring transmission impediments, this relationship indicates that Gorge wind could rely more on OSW resources and less on the hydropower system for balancing, which may be particularly valuable in the late summer months when river flows are low. This effect is stronger for more southerly OSW resources in the spring, and the trend should be investigated further at locations south of Port Orford. OSW shows moderate complementarity with Oregon solar resources in winter, when the region sees the most significant loads due to heating, and to lesser extent in the spring and fall. However, in the summer, these resources do not align in a statistically significant way. Of all VRE considered and across all seasons, complementarity is strongest between OSW and PNW terrestrial wind in the summer. In general, OSW is largely uncorrelated with Wyoming terrestrial wind. However, wind speeds at hub height indicate a smoother power production profile for Oregon OSW than Wyoming wind, which may present avoided system balancing costs or greater potential for natural complementarity with other VREs and load.
Overall, the OSW resource has greater complementarity to load than terrestrial wind resources in the region. OSW shows a positive correlation with load in the winter, spring and summer. This complementarity is similar and higher than that of the Gorge wind and SE Washington wind in the spring, and in the winter and summer, respectively. In the fall, OSW is largely uncorrelated with load. The positive correlation results, particularly in the winter, point to the capacity value that the OSW resource may offer to the Oregon electric system: correlation with load indicates that the resource is available when electric demand is significant.
Gross capacity factors of OSW also speak to the promising capacity value of OSW to the Oregon and PNW regional electric system. These generator capacity factors indicate that OSW generation can be relied upon to deliver energy during peak hours relative to other renewables. This is notable, especially in the context of a changing hydrologic resource and the general trend across the western states to transition from firm fossil fuel generation to VRE generation.
Natural extensions of this work lie in temporal and spatial resolution of VRE power generation, loads and transmission flows at the coast and across key regional flow gates. Future work will investigate the complementarity of the hydropower system and OSW in the Western Interconnection in the context of climate shifts, multi-objective river management and power generation portfolio evolution. An in-depth capacity valuation of offshore wind, which incorporates interaction with the hydropower system and quantifies Effective Load Carrying Capacity and Loss of Load Probability, is needed. The evaluation of unit commitment and economic dispatch across the WECC and a consideration of the Energy Imbalance Market may be valuable, particularly for higher penetrations of OSW. Definitions of capacity value out of Oregon Public Utility Commission Docket UM 2011, an investigation into capacity, should also be incorporated.
Author Contributions
Conceptualization, T.C.D. and D.B.; methodology, T.C.D. and D.B.; software, T.C.D. and D.B.; validation, T.C.D. and D.B.; formal analysis, T.C.D. and D.B.; investigation, T.C.D. and D.B.; resources, T.C.D. and D.B.; data curation, T.C.D. and D.B.; writing—original draft preparation, T.C.D. and D.B.; writing—review and editing, T.C.D. and D.B.; visualization, T.C.D. and D.B.; supervision, T.C.D. and D.B.; project administration, T.C.D.; funding acquisition, T.C.D. Both authors have read and agreed to the published version of the manuscript.
Funding
This research was funded by the Bureau of Ocean Energy Management (BOEM) under an Interagency Agreement with the U.S. Department of Energy Contract DE-AC05-76RL01830/BOEM Interagency Agreement M17PG00047.
Data Availability Statement
Conflicts of Interest
The authors declare that they have no known competing financial interests or personal relationships that could have appeared to influence the work reported in this paper.
References
- Musial, W.; Heimiller, D.; Beiter, P.; Scott, G.; Draxl, C. Offshore Wind Energy Resource Assessment for the United States. Technical Report NREL/TP–5000-66599. 2016; p. 1324533. Available online: http://www.osti.gov/servlets/purl/1324533/ (accessed on 28 April 2020).
- State of Oregon, Office of the Governor. Executive Order No. 20-04; State of Oregon, Office of the Governor: Salem, OR, USA, 2020. [Google Scholar]
- OR HB 2021. 2021. Available online: https://olis.oregonlegislature.gov/liz/2021R1/Downloads/MeasureDocument/HB2021/Enrolled (accessed on 19 July 2021).
- OR HB 2502. 2017. Available online: https://olis.oregonlegislature.gov/liz/2017R1/Downloads/MeasureDocument/HB2502 (accessed on 12 May 2020).
- OR HB 2193. 2015. Available online: https://olis.oregonlegislature.gov/liz/2015R1/Downloads/MeasureDocument/HB2193 (accessed on 12 May 2020).
- OR HB 2187. 2015. Available online: https://olis.oregonlegislature.gov/liz/2015R1/Downloads/MeasureDocument/HB2187 (accessed on 12 May 2020).
- Pytlak, E.; Frans, C.; Duffy, K.; Johnson, J.; Nijssen, B.; Chegwidden, O.; Rupp, D. Climate and Hydrology Datasets for RMJOC Long-Term Planning Studies. Part I: Hydroclimate Projections and Analyses, 2nd ed.; RMJOC-II; Technical Report 2018. Available online: https://www.bpa.gov/p/Generation/Hydro/hydro/cc/RMJOC-II-Report-Part-I.pdf (accessed on 2 January 2021).
- Turner, S.W.D.; Voisin, N.; Fazio, J.; Hua, D.; Jourabchi, M. Compound climate events transform electrical power shortfall risk in the Pacific Northwest. Nat. Commun. 2019, 10, 8. [Google Scholar] [CrossRef] [PubMed]
- Musial, W.D.; Beiter, P.C.; Nunemaker, J.; Heimiller, D.M.; Ahmann, J.; Busch, J. Oregon Offshore Wind Site Feasibility and Cost Study. Technical Report NREL/TP-5000-74597. 2019; p. 1570430. Available online: http://www.osti.gov/servlets/purl/1570430/ (accessed on 15 May 2020).
- Musial, W.; Beiter, P.; Spitsen, P.; Nunemaker, J.; Gevorgian, V. Offshore Wind Technologies Market Report. 2018. Available online: https://www.energy.gov/sites/prod/files/2019/08/f65/2018%20Offshore%20Wind%20Market%20Report.pdf (accessed on 15 May 2020).
- Mills, A.D.; Millstein, D.; Jeong, S.; Lavin, L.; Wiser, R.; Bolinger, M. Estimating the value of offshore wind along the United States’ Eastern Coast. Environ. Res. Lett. 2018, 13, 094013. [Google Scholar] [CrossRef]
- Beiter, P.; Musial, W.; Kilcher, L.; Maness, M.; Smith, A. An Assessment of the Economic Potential of Offshore Wind in the United States from 2015 to 2030. Technical Report NREL/TP–6A20-67675. 2017; p. 1349721. Available online: https://www.nrel.gov/docs/fy17osti/67675.pdf?xid=PS_smithsonian (accessed on 15 May 2020).
- Tarroja, B.; Mueller, F.; Samuelsen, S. Solar power variability and spatial diversification: Implications from an electric grid load balancing perspective: Solar power variability: Characterization and implications. Int. J. Energy Res. 2013, 37, 1002–1016. [Google Scholar] [CrossRef]
- Draxl, C.; Hodge, B.; Clifton, A.; McCaa, J. The Wind Integration National Dataset (WIND) Toolkit. Appl. Energy 2015, 151, 355–366. [Google Scholar] [CrossRef] [Green Version]
- Wang, Y.H.; Walter, R.K.; White, C.; Farr, H.; Ruttenberg, B.I. Assessment of surface wind datasets for estimating offshore wind energy along the Central California Coast. Renew. Energy 2019, 133, 343–353. [Google Scholar] [CrossRef]
- NWPCC. Seventh Northwest Conservation and Electric Power Plan. Technical Report 2016-02. 2016. Available online: https://www.nwcouncil.org/reports/seventh-power-plan (accessed on 15 May 2020).
- ODOE. Oregon Solar Dashboard. 2020. Available online: https://www.oregon.gov/energy/energy-oregon/Pages/Oregon-Solar-Dashboard.aspx (accessed on 15 May 2020).
- NREL. National Solar Radiation Database. Available online: https://nsrdb.nrel.gov/ (accessed on 17 March 2020).
- Jurasz, J.; Canales, F.; Kies, A.; Guezgouz, M.; Beluco, A. A review on the complementarity of renewable energy sources: Concept, metrics, application and future research directions. Sol. Energy 2020, 195, 703–724. [Google Scholar] [CrossRef]
- Silva, A.R.; Pimenta, F.M.; Assireu, A.T.; Spyrides, M.H.C. Complementarity of Brazil’s hydro and offshore wind power. Renew. Sustain. Energy Rev. 2016, 56, 413–427. [Google Scholar] [CrossRef]
- Liu, Y.; Xiao, L.; Wang, H.; Dai, S.; Qi, Z. Analysis on the hourly spatiotemporal complementarities between China’s solar and wind energy resources spreading in a wide area. Sci. China Technol. Sci. 2013, 56, 683–692. [Google Scholar] [CrossRef]
- Monforti, F.; Huld, T.; Bódis, K.; Vitali, L.; D’Isidoro, M.; Lacal-Arántegui, R. Assessing complementarity of wind and solar resources for energy production in Italy. A Monte Carlo approach. Renew. Energy 2014, 63, 576–586. [Google Scholar] [CrossRef]
- Slusarewicz, J.H.; Cohan, D.S. Assessing solar and wind complementarity in Texas. Renew. Wind. Water Sol. 2018, 5, 7. [Google Scholar] [CrossRef] [Green Version]
- Katzenstein, W.; Fertig, E.; Apt, J. The variability of interconnected wind plants. Energy Policy 2010, 38, 4400–4410. [Google Scholar] [CrossRef]
- Anderson, D.; Samaan, N.; Nguyen, T.; Kintner-Meyer, M. North America Modeling Compendium and Analysis. Technical Report. 2016. Available online: https://www.energy.gov/sites/prod/files/2017/01/f34/North%20America%20Modeling%20Compendium%20and%20Analysis.pdf (accessed on 15 May 2020).
- Kintner-Meyer, M.; Sridhar, S.; Bhatnagar, D.; Mahserejian, S.; Davis, S.H.; Ghosal, M. Electric Vehicles at Scale—Phase I Analysis: High EV Adoption Impacts on the U.S. Power Grid. Technical Report PNNL-29894. 2020. Available online: https://www.pnnl.gov/sites/default/files/media/file/EV-AT-SCALE_1_IMPACTS_final.pdf (accessed on 15 May 2020).
- FERC Form 714—Annual Electric Balancing Authority Area and Planning Area Report. Available online: https://www.ferc.gov/industries-data/electric/general-information/electric-industry-forms/form-no-714-annual-electric/data (accessed on 28 April 2020).
- PacifiCorp. Transmission Network Diagram. 2016. Available online: http://www.oatioasis.com/PPW/PPWdocs/Transmission_Network_Diagram_WallSize_20161116_v4.pdf (accessed on 15 May 2020).
- WECC. State of the Interconnection. 2021. Available online: https://www.wecc.org/epubs/StateOfTheInterconnection/Pages/Western-Interconnection.aspx (accessed on 20 July 2021).
Figure 1.
Data extracted from the WIND Toolkit, summed at 15-, 30-, and 60-min intervals, and at a location corresponding to approximately 30 km west of Port Orford.
Figure 1.
Data extracted from the WIND Toolkit, summed at 15-, 30-, and 60-min intervals, and at a location corresponding to approximately 30 km west of Port Orford.
Figure 2.
Renewable energy resource locations for resource complementarity study.
Figure 2.
Renewable energy resource locations for resource complementarity study.
Figure 3.
Time series excerpts of high VRE complementarity over 8-h intervals: (a) Port Orford OSW increasing as Wyoming land-based, or terrestrial wind (TW), decreases, r = 0.978; (b) Washington terrestrial wind rising as production from Port Orford OSW decreases, r = 0.967.
Figure 3.
Time series excerpts of high VRE complementarity over 8-h intervals: (a) Port Orford OSW increasing as Wyoming land-based, or terrestrial wind (TW), decreases, r = 0.978; (b) Washington terrestrial wind rising as production from Port Orford OSW decreases, r = 0.967.
Figure 4.
Seasonal resource complementarity 2007–2012: (a) December, January, February (DJF); (b) March, April, May (MAM); (c) June, July, August (JJA); (d) September, October, November (SON). Red colors indicate resource complementarity.
Figure 4.
Seasonal resource complementarity 2007–2012: (a) December, January, February (DJF); (b) March, April, May (MAM); (c) June, July, August (JJA); (d) September, October, November (SON). Red colors indicate resource complementarity.
Figure 5.
Fifteen-min ramp rates over a 96-h excerpt at the Port Orford and Wyoming locations.
Figure 5.
Fifteen-min ramp rates over a 96-h excerpt at the Port Orford and Wyoming locations.
Figure 6.
Distributions of absolute, 15-min ramps over 24-h periods, 2007–2012, Port Orford OSW vs. (a–c) Columbia Gorge TW and (d–f) Wyoming TW locations.
Figure 6.
Distributions of absolute, 15-min ramps over 24-h periods, 2007–2012, Port Orford OSW vs. (a–c) Columbia Gorge TW and (d–f) Wyoming TW locations.
Figure 7.
Seasonal load and resource complementarity in 2012: (a) December, January, February (DJF); (b) March, April, May (MAM); (c) June, July, August (JJA); and (d) September, October, November (SON). Blue colors indicate desirable correlations with load.
Figure 7.
Seasonal load and resource complementarity in 2012: (a) December, January, February (DJF); (b) March, April, May (MAM); (c) June, July, August (JJA); and (d) September, October, November (SON). Blue colors indicate desirable correlations with load.
Figure 8.
Transmission map for Southern Oregon [
28]. OSW interconnection point, Rogue and Tahkenitch substations highlighted in yellow.
Figure 8.
Transmission map for Southern Oregon [
28]. OSW interconnection point, Rogue and Tahkenitch substations highlighted in yellow.
Figure 9.
Transmission map for Northern Oregon [
28]. OSW interconnection point, Clatsop substation highlighted in yellow.
Figure 9.
Transmission map for Northern Oregon [
28]. OSW interconnection point, Clatsop substation highlighted in yellow.
Figure 10.
Relevant WECC paths in Oregon [
29]. This analysis considers path 5, path 14 (not indicated on this map), path 65, and path 66.
Figure 10.
Relevant WECC paths in Oregon [
29]. This analysis considers path 5, path 14 (not indicated on this map), path 65, and path 66.
Figure 11.
Impacts on daily hourly average flows for each hour of the year from OSW integration on Path 05, the transmission path from the Cascades and the Columbia River Gorge southwest into north/central-west Oregon. Positive direction is flow west.
Figure 11.
Impacts on daily hourly average flows for each hour of the year from OSW integration on Path 05, the transmission path from the Cascades and the Columbia River Gorge southwest into north/central-west Oregon. Positive direction is flow west.
Figure 12.
Impacts to daily hourly average flows for each hour of the year from OSW integration on Path 65, the transmission path from the Columbia River Gorge area into Southern California (DC intertie). Positive direction is flow south into California.
Figure 12.
Impacts to daily hourly average flows for each hour of the year from OSW integration on Path 65, the transmission path from the Columbia River Gorge area into Southern California (DC intertie). Positive direction is flow south into California.
Figure 13.
Impacts to daily hourly average flows for each hour of the year from OSW integration on Path 66, the transmission path along the I-5 interstate flowgate path traversing Oregon into northern California. Positive direction is flow south into California.
Figure 13.
Impacts to daily hourly average flows for each hour of the year from OSW integration on Path 66, the transmission path along the I-5 interstate flowgate path traversing Oregon into northern California. Positive direction is flow south into California.
Table 1.
OSW resource locations and interconnections to 230 kV BPA transmission substations.
Table 1.
OSW resource locations and interconnections to 230 kV BPA transmission substations.
| Location | Distance Offshore (km) | Latitude, Longitude (NAD83) | BPA Substation Name (ID) |
|---|
| Port Orford | 27 | (42.73763, −124.825) | ROGUE (40895) |
| Reedsport | 30 | (43.76358, −124.561) | TAHKENITCH (41061) |
| Newport | 33 | (44.63749, −124.488) | TOLEDO (41083) |
| Astoria | 42 | (46.13978, −124.519) | CLATSOP (40243) |
Table 2.
OSW generation gross capacity factors during regional and system peak hours, averaged over 2012.
Table 2.
OSW generation gross capacity factors during regional and system peak hours, averaged over 2012.
| OSW Location | OR Morning Peak
(9 to 11 AM) | OR Evening Peak
(6 to 9 PM) | WECC System-Wide Peak
(3 to 7 PM) |
|---|
| Port Orford | 62% | 61% | 50% |
| Reedsport | 49% | 55% | 39% |
| Newport | 48% | 53% | 47% |
| Astoria | 46% | 51% | 42% |
| Average | 51% | 55% | 44% |
Table 3.
Wind curtailment associated with different penetration levels of OSW.
Table 3.
Wind curtailment associated with different penetration levels of OSW.
| OSW Penetration | Port Orford | Reedsport | Newport | Astoria |
|---|
| 1 GW | 0.2% | 0.1% | 0.0% | 0.1% |
| 2 GW | 2.0% | 7.2% | 0.2% | 3.1% |
| 3 GW | 20.5% | 28.1% | 10.3% | 14.6% |
| 4 GW | 36.8% | 42.2% | 26.1% | 30.1% |
| 5 GW | 47.3% | 51.5% | 37.3% | 40.9% |
| 3 GW + EV | 19.5% | 27.6% | 9.3% | 14.0% |
Table 4.
Coastal transmission loading for Southern Oregon.
Table 4.
Coastal transmission loading for Southern Oregon.
| | Fairview to Reston
(MW) | Reston to Dixonville
(MW) | Lane to Wendson
(MW) |
|---|
| Normal Loading | | | |
| Median | −79.8 | −43.4 | 46.3 |
| Peak | −199.2 | −128.6 | 90.6 |
| 3 GW OSW Loading | | | |
| Median | 370.9 | 253.9 | −246.4 |
| Peak | 636.7 | 407.7 | −476.8 |
| Positive Direction | east | east | west |
Table 5.
Coastal transmission loading for Northern Oregon.
Table 5.
Coastal transmission loading for Northern Oregon.
| | Clatsop to Driscoll
(MW) | Allston to Keeler
(MW) |
|---|
| Normal Loading | | |
| Median | −41.6 | 259.3 |
| Peak | −77.4 | 1121.5 |
| 3 GW OSW Loading | | |
| Median | 225.3 | 220.4 |
| Peak | 488.2 | 1197.1 |
| Positive Direction | east | south |
| Publisher’s Note: MDPI stays neutral with regard to jurisdictional claims in published maps and institutional affiliations. |
© 2021 by the authors. Licensee MDPI, Basel, Switzerland. This article is an open access article distributed under the terms and conditions of the Creative Commons Attribution (CC BY) license (https://creativecommons.org/licenses/by/4.0/).


