1. Introduction
In underground engineering, a large number of defects in the natural rock masses, such as faults, cavities, and joints, are discontinuous, heterogeneous, and anisotropic. The existence of these defects will have a significant effect on the physical and mechanical behavior of rock. The rock mass in underground engineering is in an environment of high stress, high temperature, and seepage. These factors easily lead to the occurrence of rock mass fractures and holes, which bring difficulties to engineering constructions and personnel safety. Therefore, it is necessary to research the mechanical laws and failure characteristics of rock with cracks and holes for understanding the properties of rock mass and serving engineering practice.
The evolution laws of cracks in the defective rock have been studied for a long time, and some achievements have been made. Many scholars have carried out uniaxial compression experiments and simulations of rock samples with prefabricated cracks, and analyzed the crack evolution and failure modes [
1,
2]. Li [
3] made uniaxial compression experiments on a through model with cracks and circular holes, and two new cracks were found. Lee et al. [
4] analyzed crack types and evolution laws of the double-flawed and single-flawed specimens in three different materials. Va´sa´rhelyi et al. [
5] placed two open or closed cracks in the gypsum samples. Through the displacement discontinuity surface method, the uniaxial compression simulation was carried out. Meanwhile, the three-dimensional fracture numerical models have attracted the attention of many scholars. Colombo et al. [
6] established numerical models based on the 3D non-planar extended Finite Element Method (X-FEM) to study the crack formation under high torsion. In addition to the research of crack failure of samples with the prefabricated cracks under the uniaxial compression, some progress has been made in the study of triaxial compression. Huang et al. [
7] conducted triaxial compression tests on two sandstone samples with closed non-overlapping defects, studied their deformation and strength characteristics, and carried out the numerical simulation with AUTODYN 2D. Generally, in order to study the correctness of numerical simulations, the results of physical experiments are compared with those of numerical simulations [
8,
9]. Many studies on physical experiments and numerical simulation of samples with hole defects [
10,
11]. For example, Liu et al. [
12] achieved some uniaxial compression experiments on sandstone specimens with elliptical holes and cracks. They determined four rock bridge breakthrough modes.
In order to explore the failure mechanism of rock samples with defects more deeply, many scholars have adopted many other methods to analyze the failure of rock samples in the process of experiment and numerical simulation. Acoustic emission (AE) and DIC technology [
13,
14] are used to monitor and record the crack process of the specimen in real time. Zhou et al. [
15] conducted uniaxial compression experiments on the samples of granite with dual and triple cracks, and monitored the fracture behavior in real-time by digital imaging and acoustic emission methods. To research the classification of fracture modes in the process of rock cracking, the uniaxial compression experiments were fulfilled on the intact and defective red sandstone samples. Wong et al. [
16] used the RFPA2D method to numerically study the splitting failure of compressed rock samples with fissured fractures. The problems of single-crack, three-crack, and multi-crack propagation are studied. The effects of crack angle, crack length, sample width, and crack location on crack growth and coalescence were analyzed. Using periodic dynamics [
17] to analyze the propagation and coalescence of cracks, the crack evolution analysis is pushed to a new height.
The above studies are either single fracture or multi fracture composite samples, or circular hole or multiple round holes composite samples, and the research on combined defect models of cracks and circular holes is relatively less. Moreover, previous studies have been less focused on the distribution of stress and displacement vector before and after specimen failure. In this paper, PFC 2D software is used to study the defect combination samples with a single circular hole and double cracks at different angles. The mechanical properties and stress distribution of the models are studied. The acoustic emission laws and the crack evolution of the samples with combined defects are analyzed. The distribution of the displacement vector in the samples is also investigated. The purpose of this paper is to understand the mechanical strength and failure mode of combined specimens with a single circular hole and different angle cracks.
2. The Establishment of Numerical Models
2.1. Introduction of PFC2D and Numerical Model
In this study, the numerical models are established by Particle Flow Code in 2 Dimensions (PFC2D). Cundall and Strack [
18] proposed the particle flow theory. When the geometric and mechanical parameters of particles and bonds are defined, the theory can reflect macroscopic problems through local contact. The contact bond model in PFC can move the force between particles, while the parallel bond model can move the force and moment [
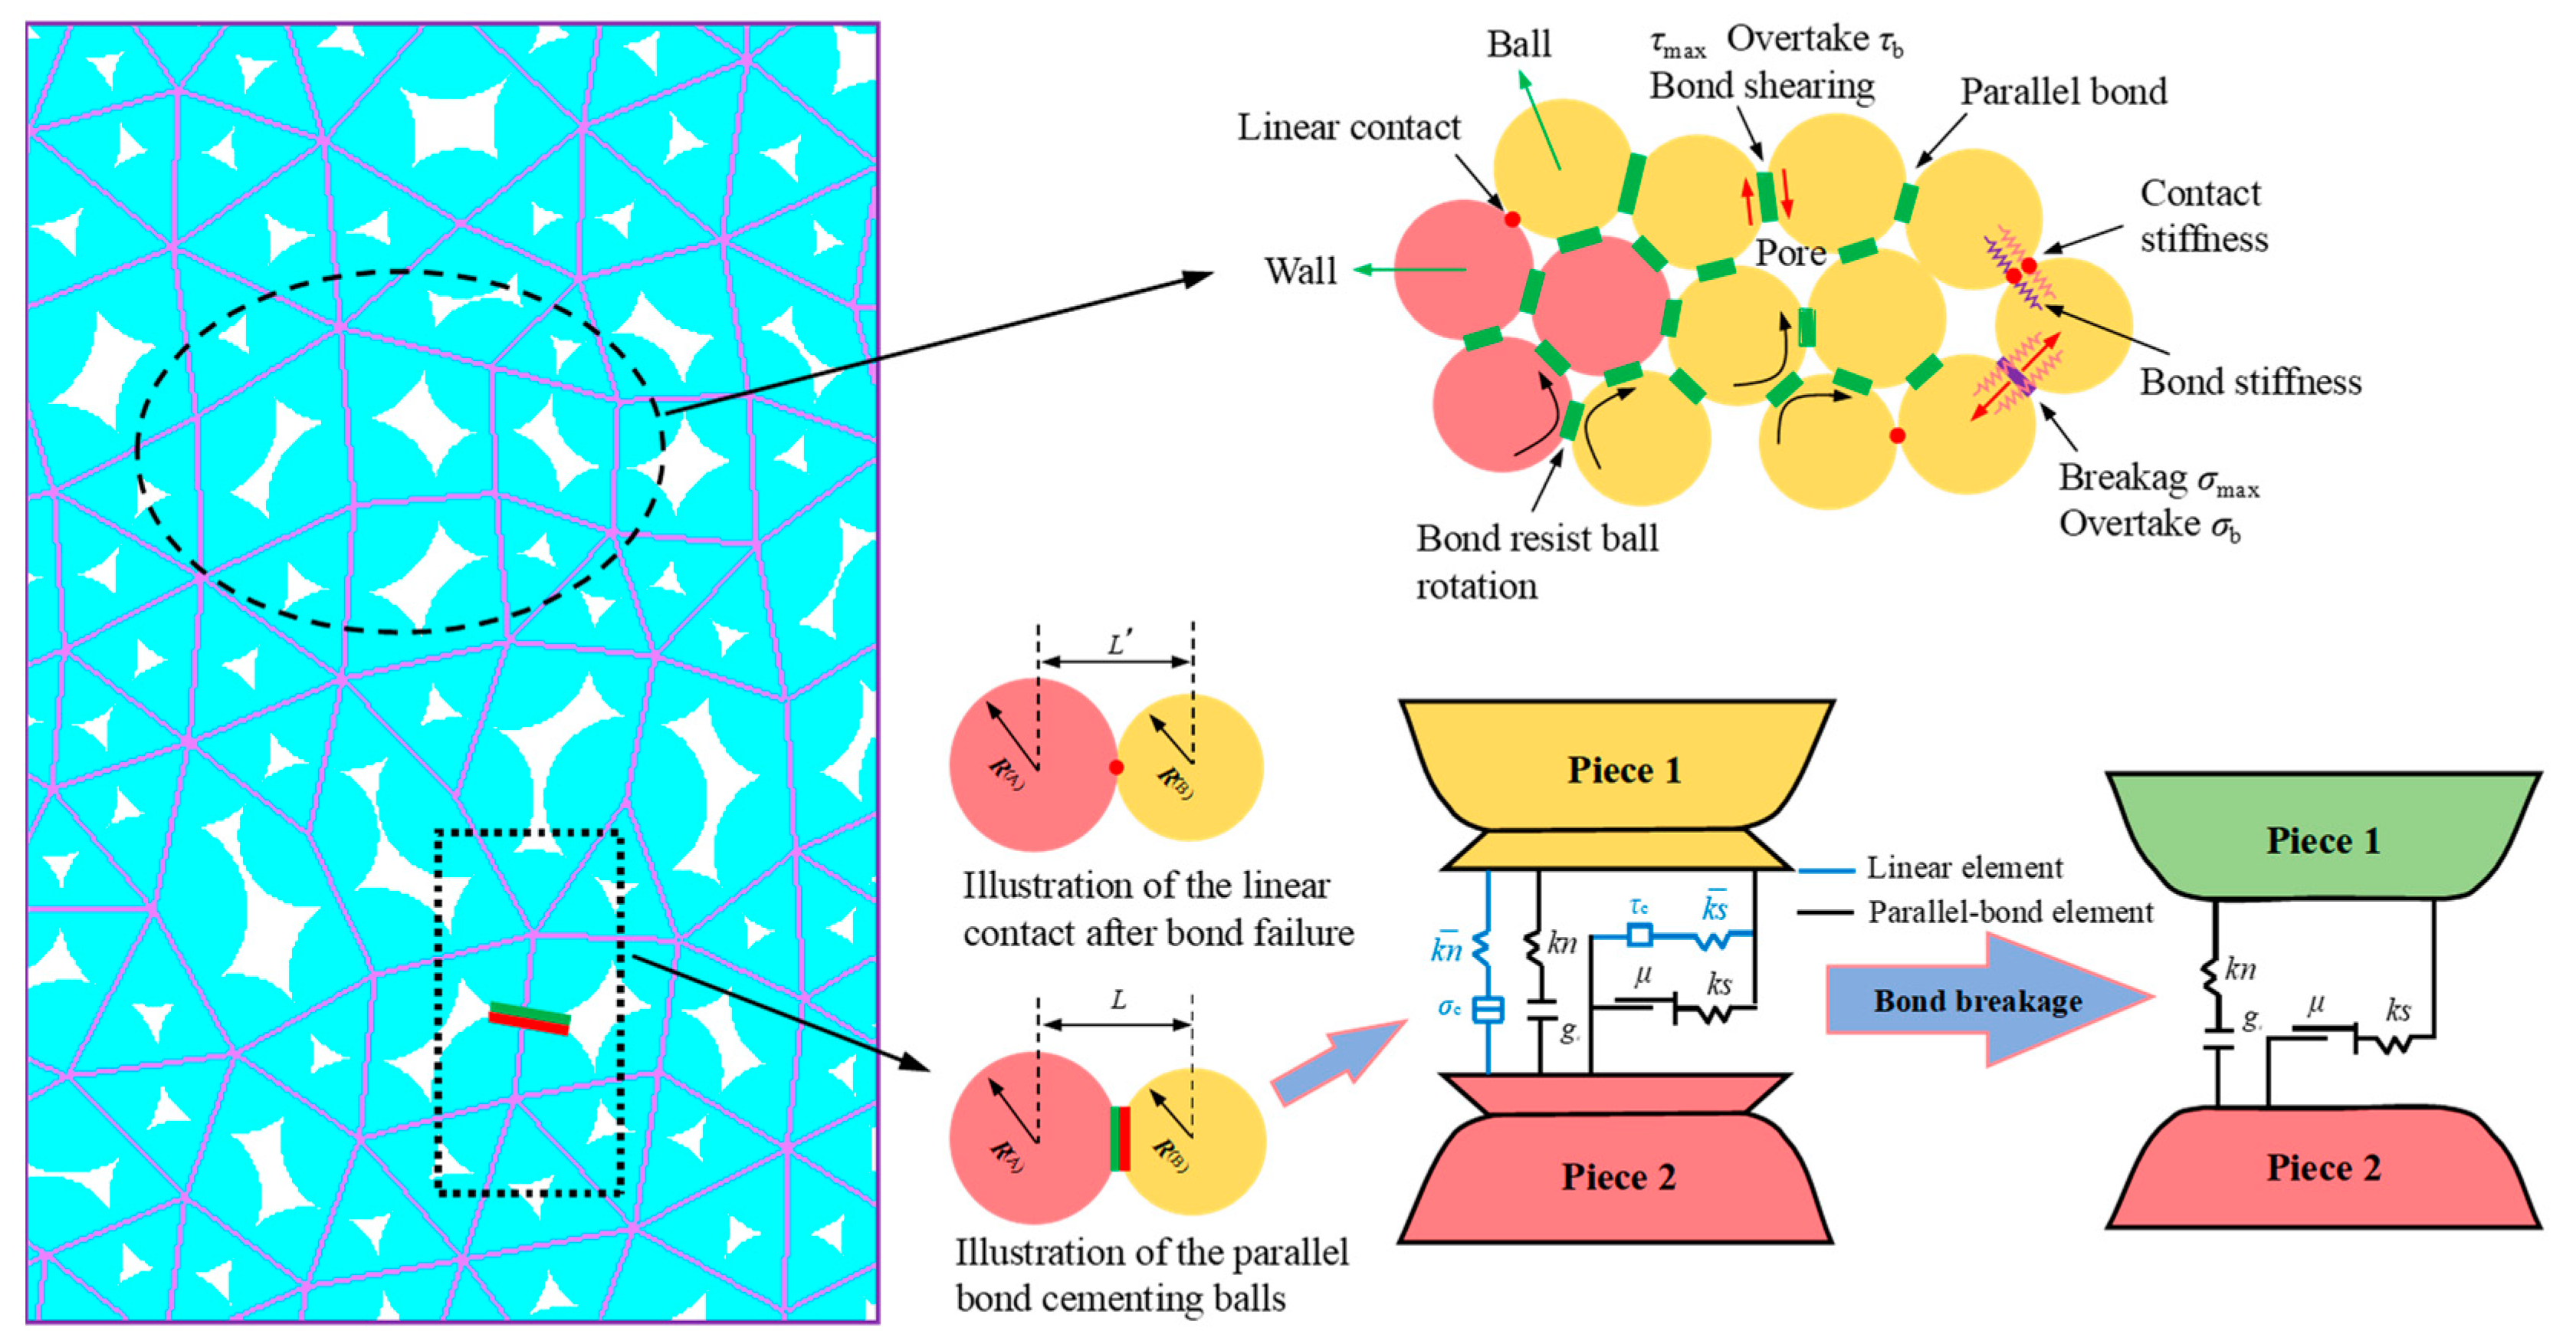
19]. Therefore, the parallel bond model is usually used to simulate the discontinuous deformation of the rock sample. The parallel bond model is shown in
Figure 1, where
kn is normal contact stiffness and
ks is tangential contact stiffness. If the maximum normal or tangential stress on the bond boundary exceeds the corresponding bond strength, the bond will break and produce a microcrack.
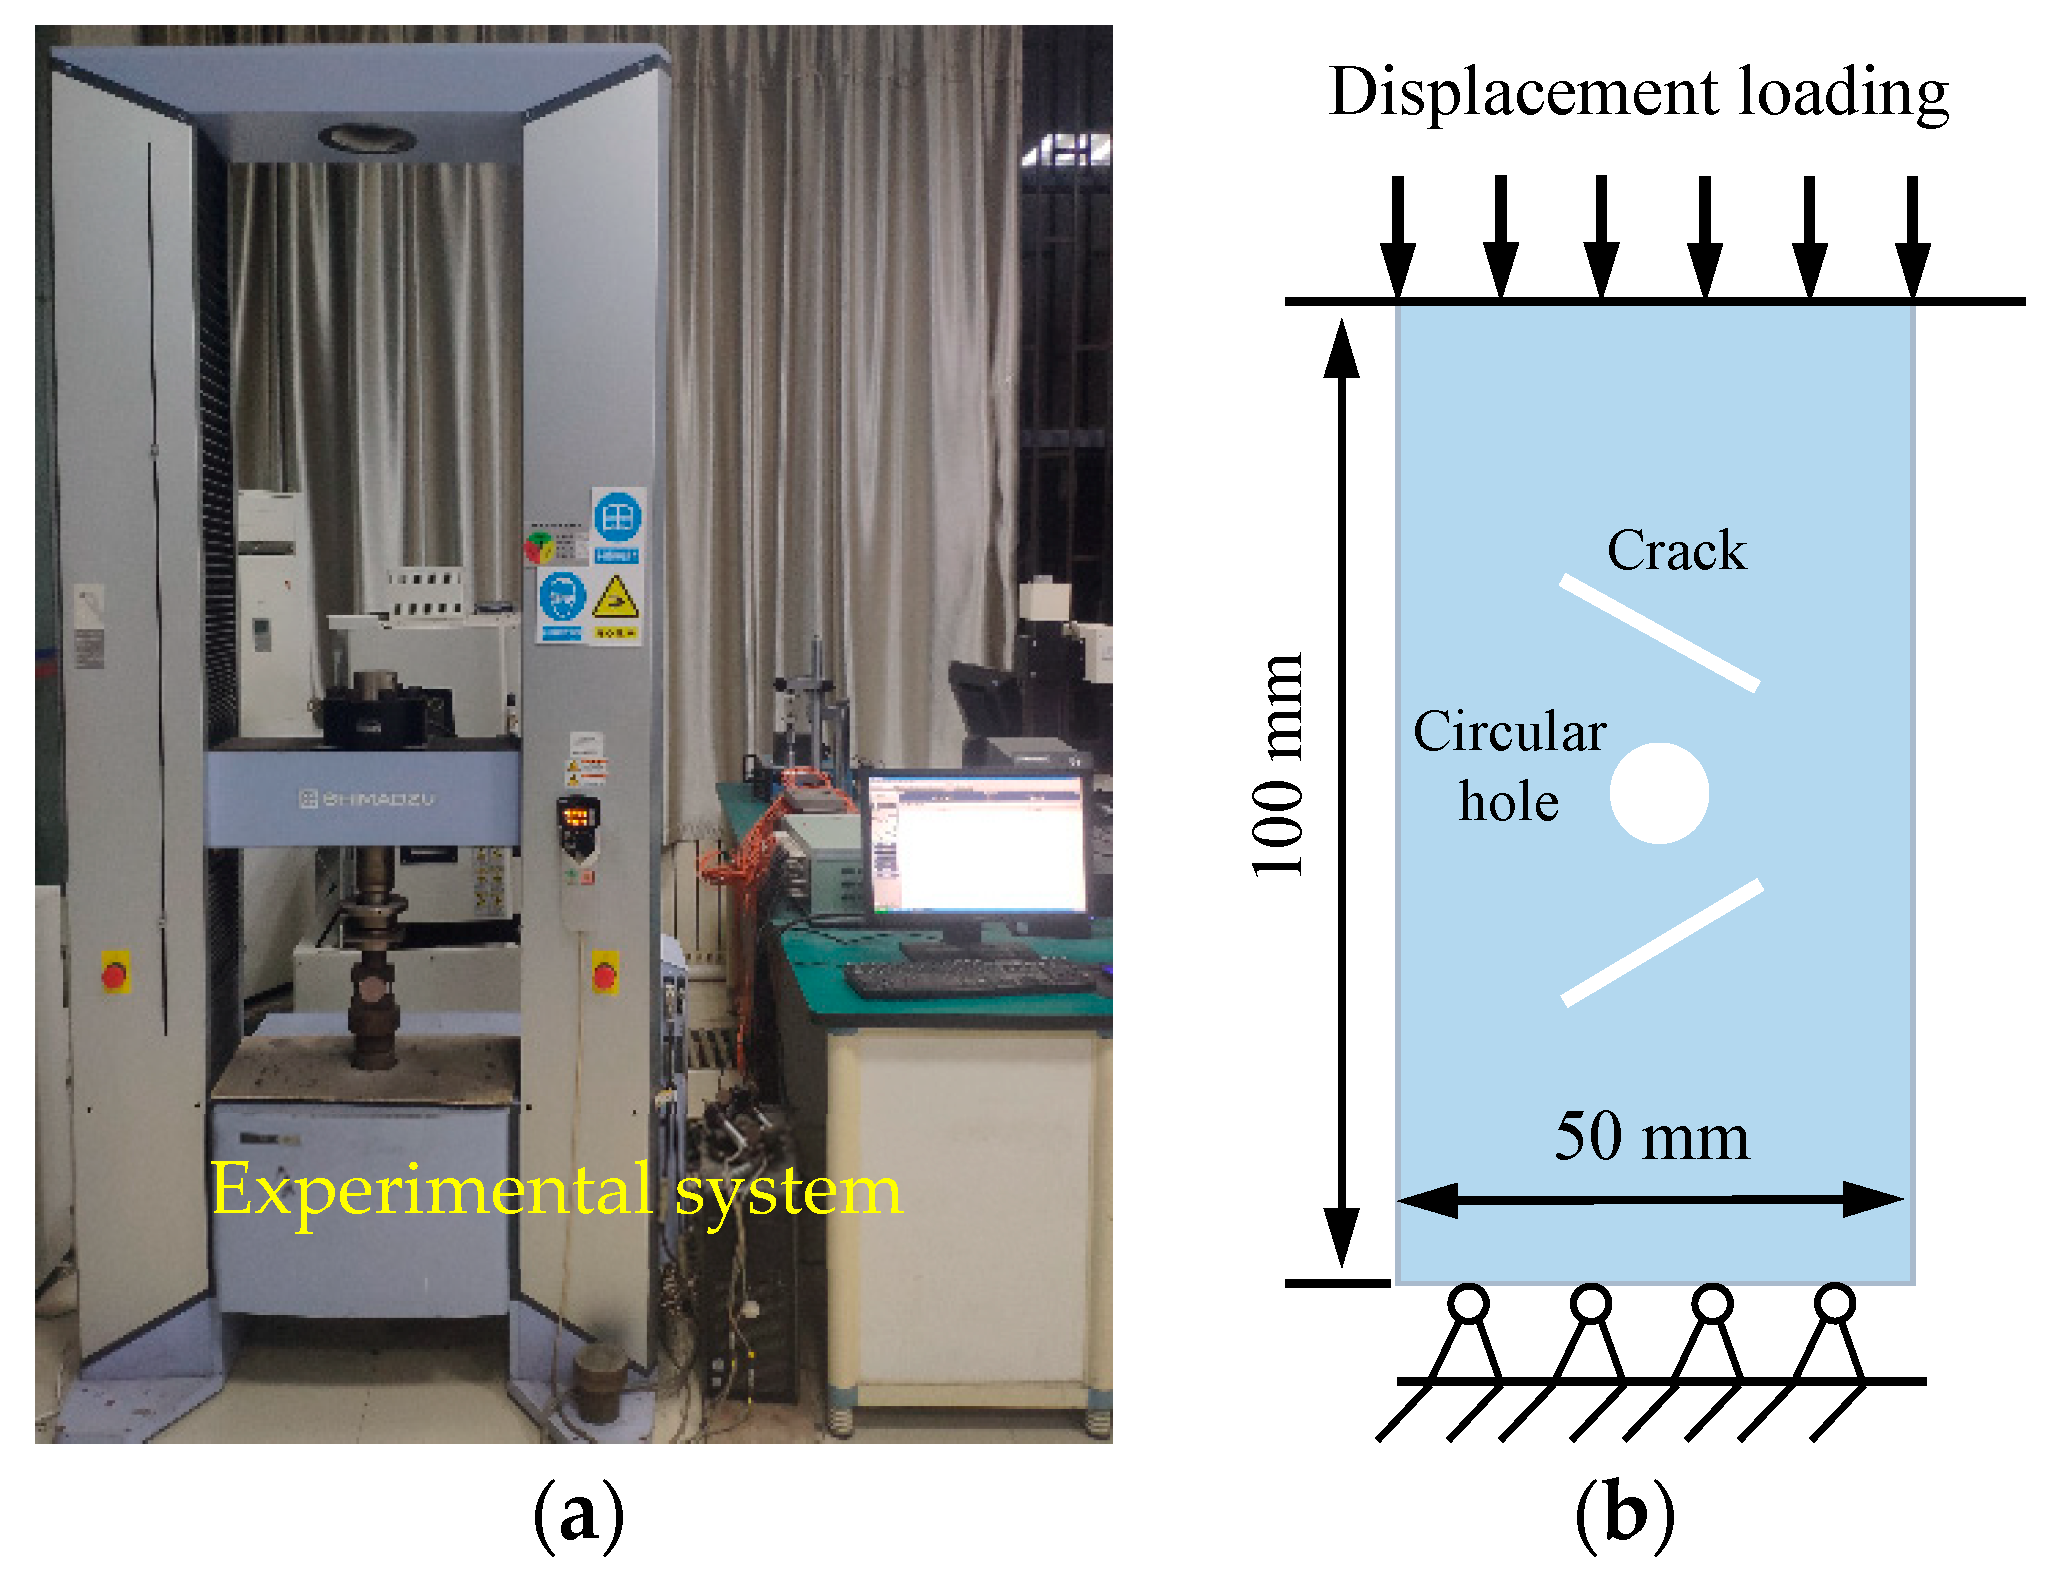
To research the effects of parallel double cracks with different dip angles and a single circular hole on the failure and mechanical behavior of rocks in the combined defect model of a crack and a circular hole, the combinatorial model of parallel double cracks with variable angles and a single circular hole is established; the model diagram and numerical model diagram are shown in
Figure 2. For the combined defect models with cracks and circular holes in laboratory test and numerical simulation, α is the dip angle of crack and d is the diameter of the circular hole. The numerical model is a two-dimensional model, and the cracks and round holes are realized by deleting particles. The specific dimensions of the models are shown in
Table 1. The circular and fractured particles are deleted to establish the numerical model, seven models with the angle α of 0°, 15°, 30°, 45°, 60°, 75° and 90° in the fracture and horizontal direction are established, as shown in
Figure 3.
2.2. Determination of Microscopic Parameters
When the particle flow theory is used to simulate the test, the micro physical and mechanical parameters and bond properties of the particles are needed. The determination of microscopic parameters is the crux to the establishment of the numerical models. The simulation results of the 0° model are compared with the experimental results of the 0° sample. The micro parameters in the numerical models are adjusted repeatedly through “trial and error” tests to make the numerical results fit the experimental results [
21].
Considering the discreteness and heterogeneity of rock, the red sandstone with good homogeneity is selected as the object in this study. The Shimadzu AG-X250 precision universal test machine was used in the experimental system. The cracks and holes in the experimental specimens are cut by a water knife. All tests were carried out according to the ISRM standard. The specimens are loaded by controlling the displacement on the top of the samples. The bottom of the samples is fixed, and no boundary conditions are imposed on the left and right sides. The displacement loading rate of the laboratory tests and the numerical simulations is 0.01 mm/s. The testing machine and numerical calculation model are shown in
Figure 4.
The percentage of compressive strength to tensile strength and friction angle of rock produced by the parallel bond model is low. The compression tension ratio obtained by using the bond model is generally 3~5. There is a certain gap between this situation and that of rock materials with a compression and tension ratio of about 10. In order to solve the problem of the low percentage of compressive strength to tensile strength and little friction angle, by modifying the failure criterion of parallel bond, the contribution of the moment to bond stress is reduced and the problem of overestimation of tensile strength is solved. The calibrated microscopic parameters are listed in
Table 2.
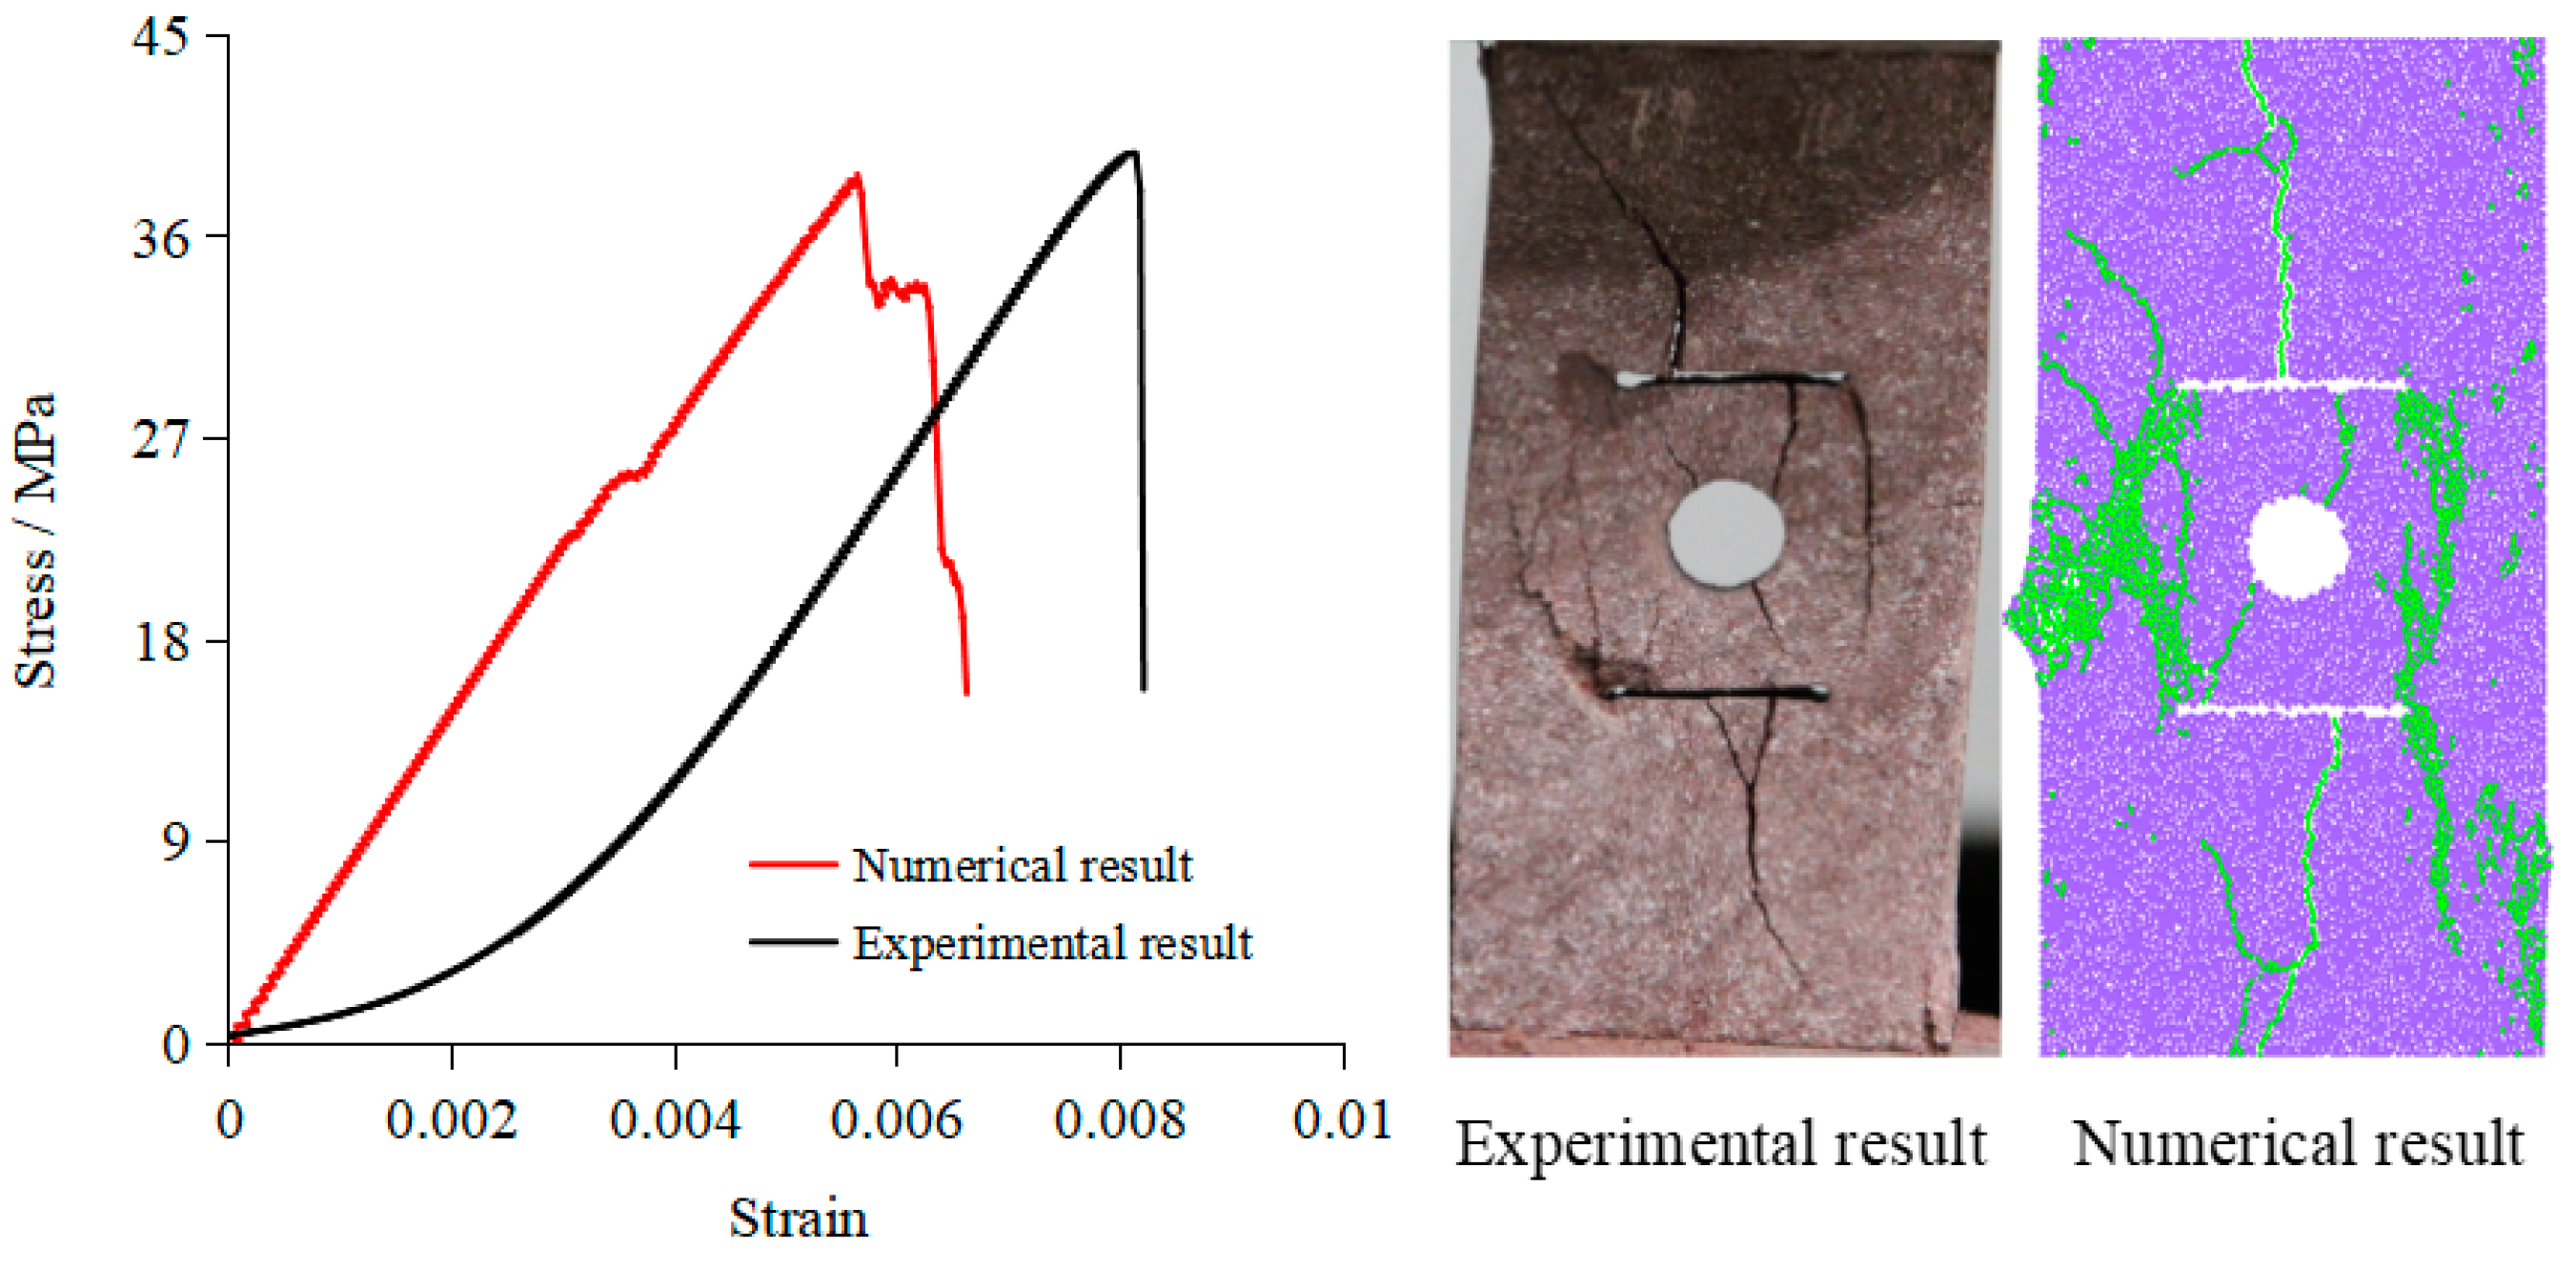
Figure 5 shows the contrast between the final calibration results of the laboratory experiment and those of the numerical model when α = 0°. The form of the stress–strain curve obtained by the numerical test is similar to that obtained by the laboratory experiment, and the samples show elastic-brittle behavior [
22] in both methods. The elastic modulus, peak strength, and peak strain of the two methods are basically the same, as shown in
Table 3, and the rationality of the calibration parameters is verified.
3. Numerical Results
3.1. Mechanical Behavior
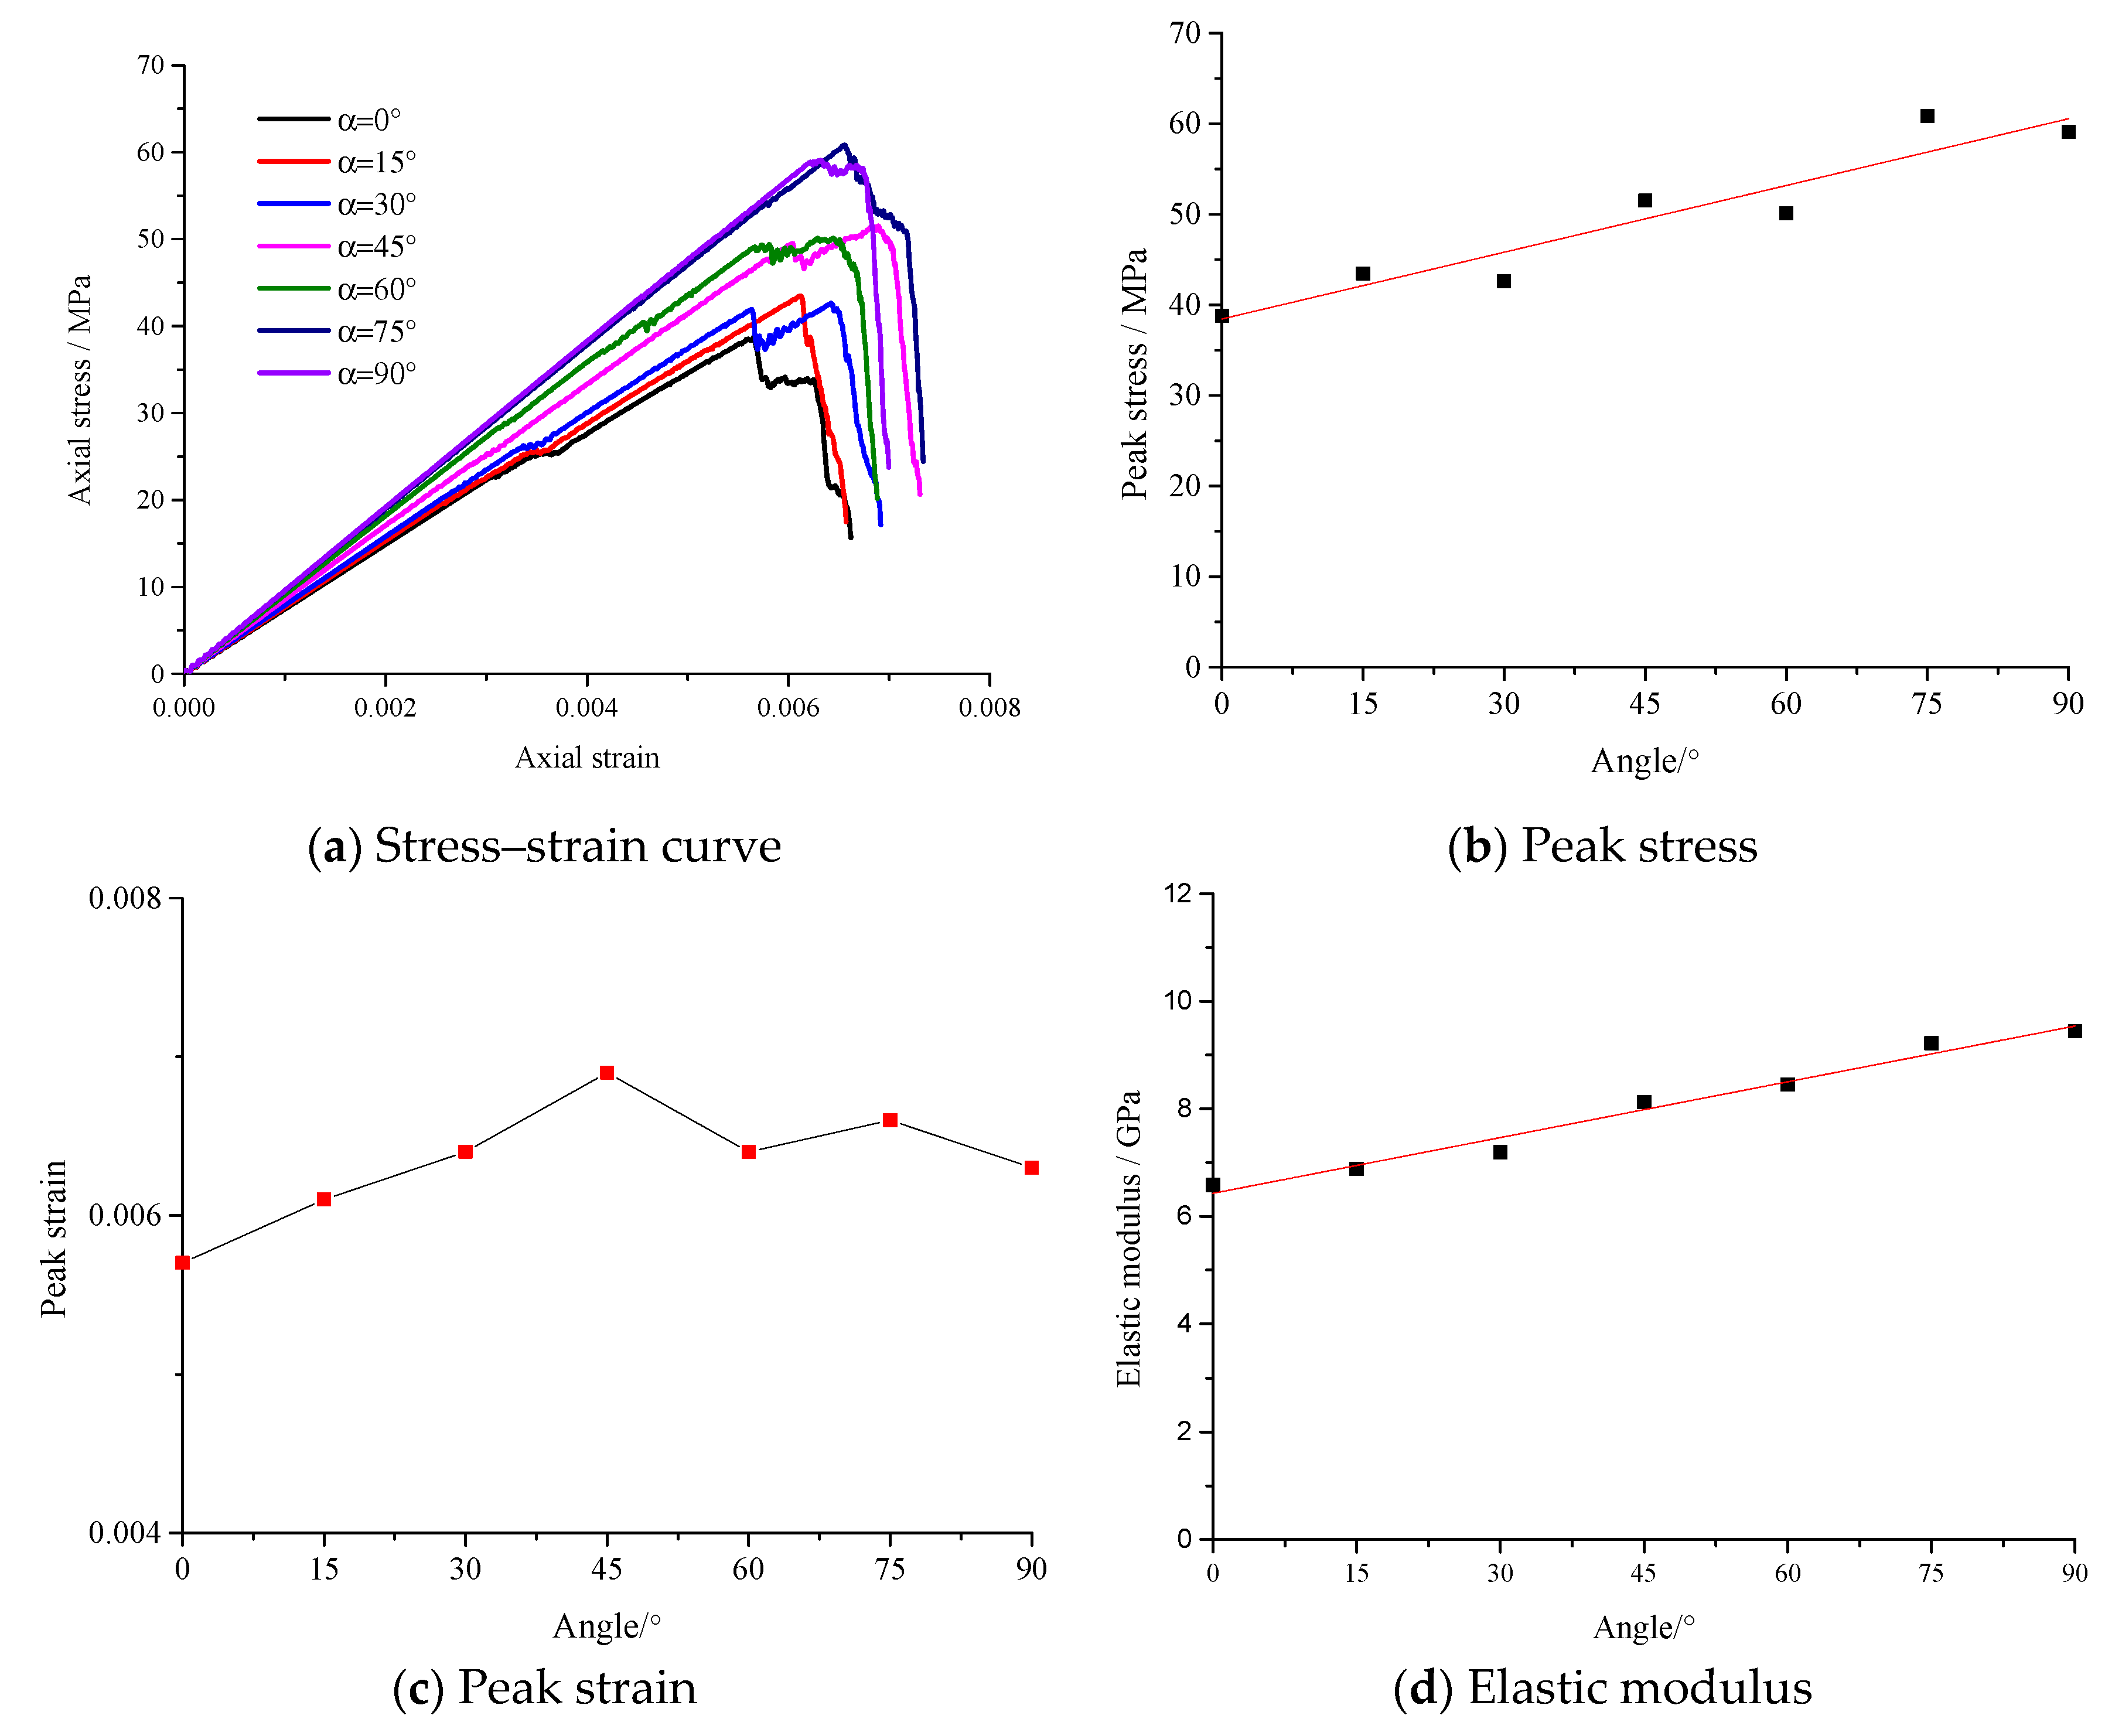
Figure 6 shows the stress–strain curves and mechanical properties of the combined model of cracks with different angles and a single circular hole.
Figure 6a shows that the stress–strain curves of the defect combination models include three stages: elastic stage, plastic stage and failure stage. Compared with the corresponding curve of actual rock, as shown in the experimental result of
Figure 5, since the particles in the numerical model are rigid bodies, in the initial loading stage, the model bond is not damaged, so there is no compaction stage. In the post-peak stage, the failure of the defect combination model basically turns into brittle failure. In addition, in the stress–strain curve of the numerical simulation, there are fluctuations before and after the peak. One reason for this may be that the prefabricated cracks and circular holes are formed by the method of deleting particles, and the boundary of cracks and circular holes is irregular when the particles are accidentally deleted. Due to the influence of the combined defects of cracks and circular holes, the stress–strain curves of fracture models with different fracture angles are not similar to the smooth curves of intact rock, and fluctuate in the elastic deformation stage and before and after the peak value. The numerical results show that the peak stress and elastic modulus of the seven defect combination models are linearly distributed with the fracture angle, and the linear fitting degrees are 87.70% and 97.29%, respectively. From 0° to 45°, the peak strain increases gradually and presents a linear distribution, while at 60°, 75°, and 90°, the peak strain decreases and fluctuates slightly. The peak strain changes little with the fracture dip angle; the difference between the maximum value and the minimum value is 0.0012. It shows that the change of fracture angle has a crucial impact on the peak stress and elastic modulus, but has little effect on the peak strain.
The mechanical parameters of numerical simulation of defect combination model with different fracture angles under uniaxial compression are shown in
Table 4. In the seven defect combination models, the maximum peak stress occurs in the 75° model, which is 60.84 MPa, the maximum peak strain occurs in the 45° model, with the minimum value of peak strain being 0.0069, and the maximum value of elastic modulus occurs in the 90° model, which is 9.44 GPa. Compared with intact rock, the peak stress, peak strain, and elastic modulus of each defect combination model are smaller than those of intact rock. The reduction percentages of these mechanical parameters are 19.51%, 8.00%, and 8.34%, respectively. It can be clearly seen that the effects of the combined defects of different crack angles and a single circular hole on the mechanical behavior of rock are different, which indicates that the existence of cracks and holes has a noticeable effect on the mechanical behavior of rock.
3.2. Acoustic Emission Characteristics and Crack Evolution of Numerical Samples
When the applied external load increases gradually, microcracks [
23] occur in the sample, and the damage-dissipated energy [
24] is released rapidly in the form of sound waves [
25]. In the numerical simulation, the number of particle bond breaking can be calculated to simulate the events of acoustic emission [
26], while the failure mechanism can be better understood through the analysis of acoustic emission.
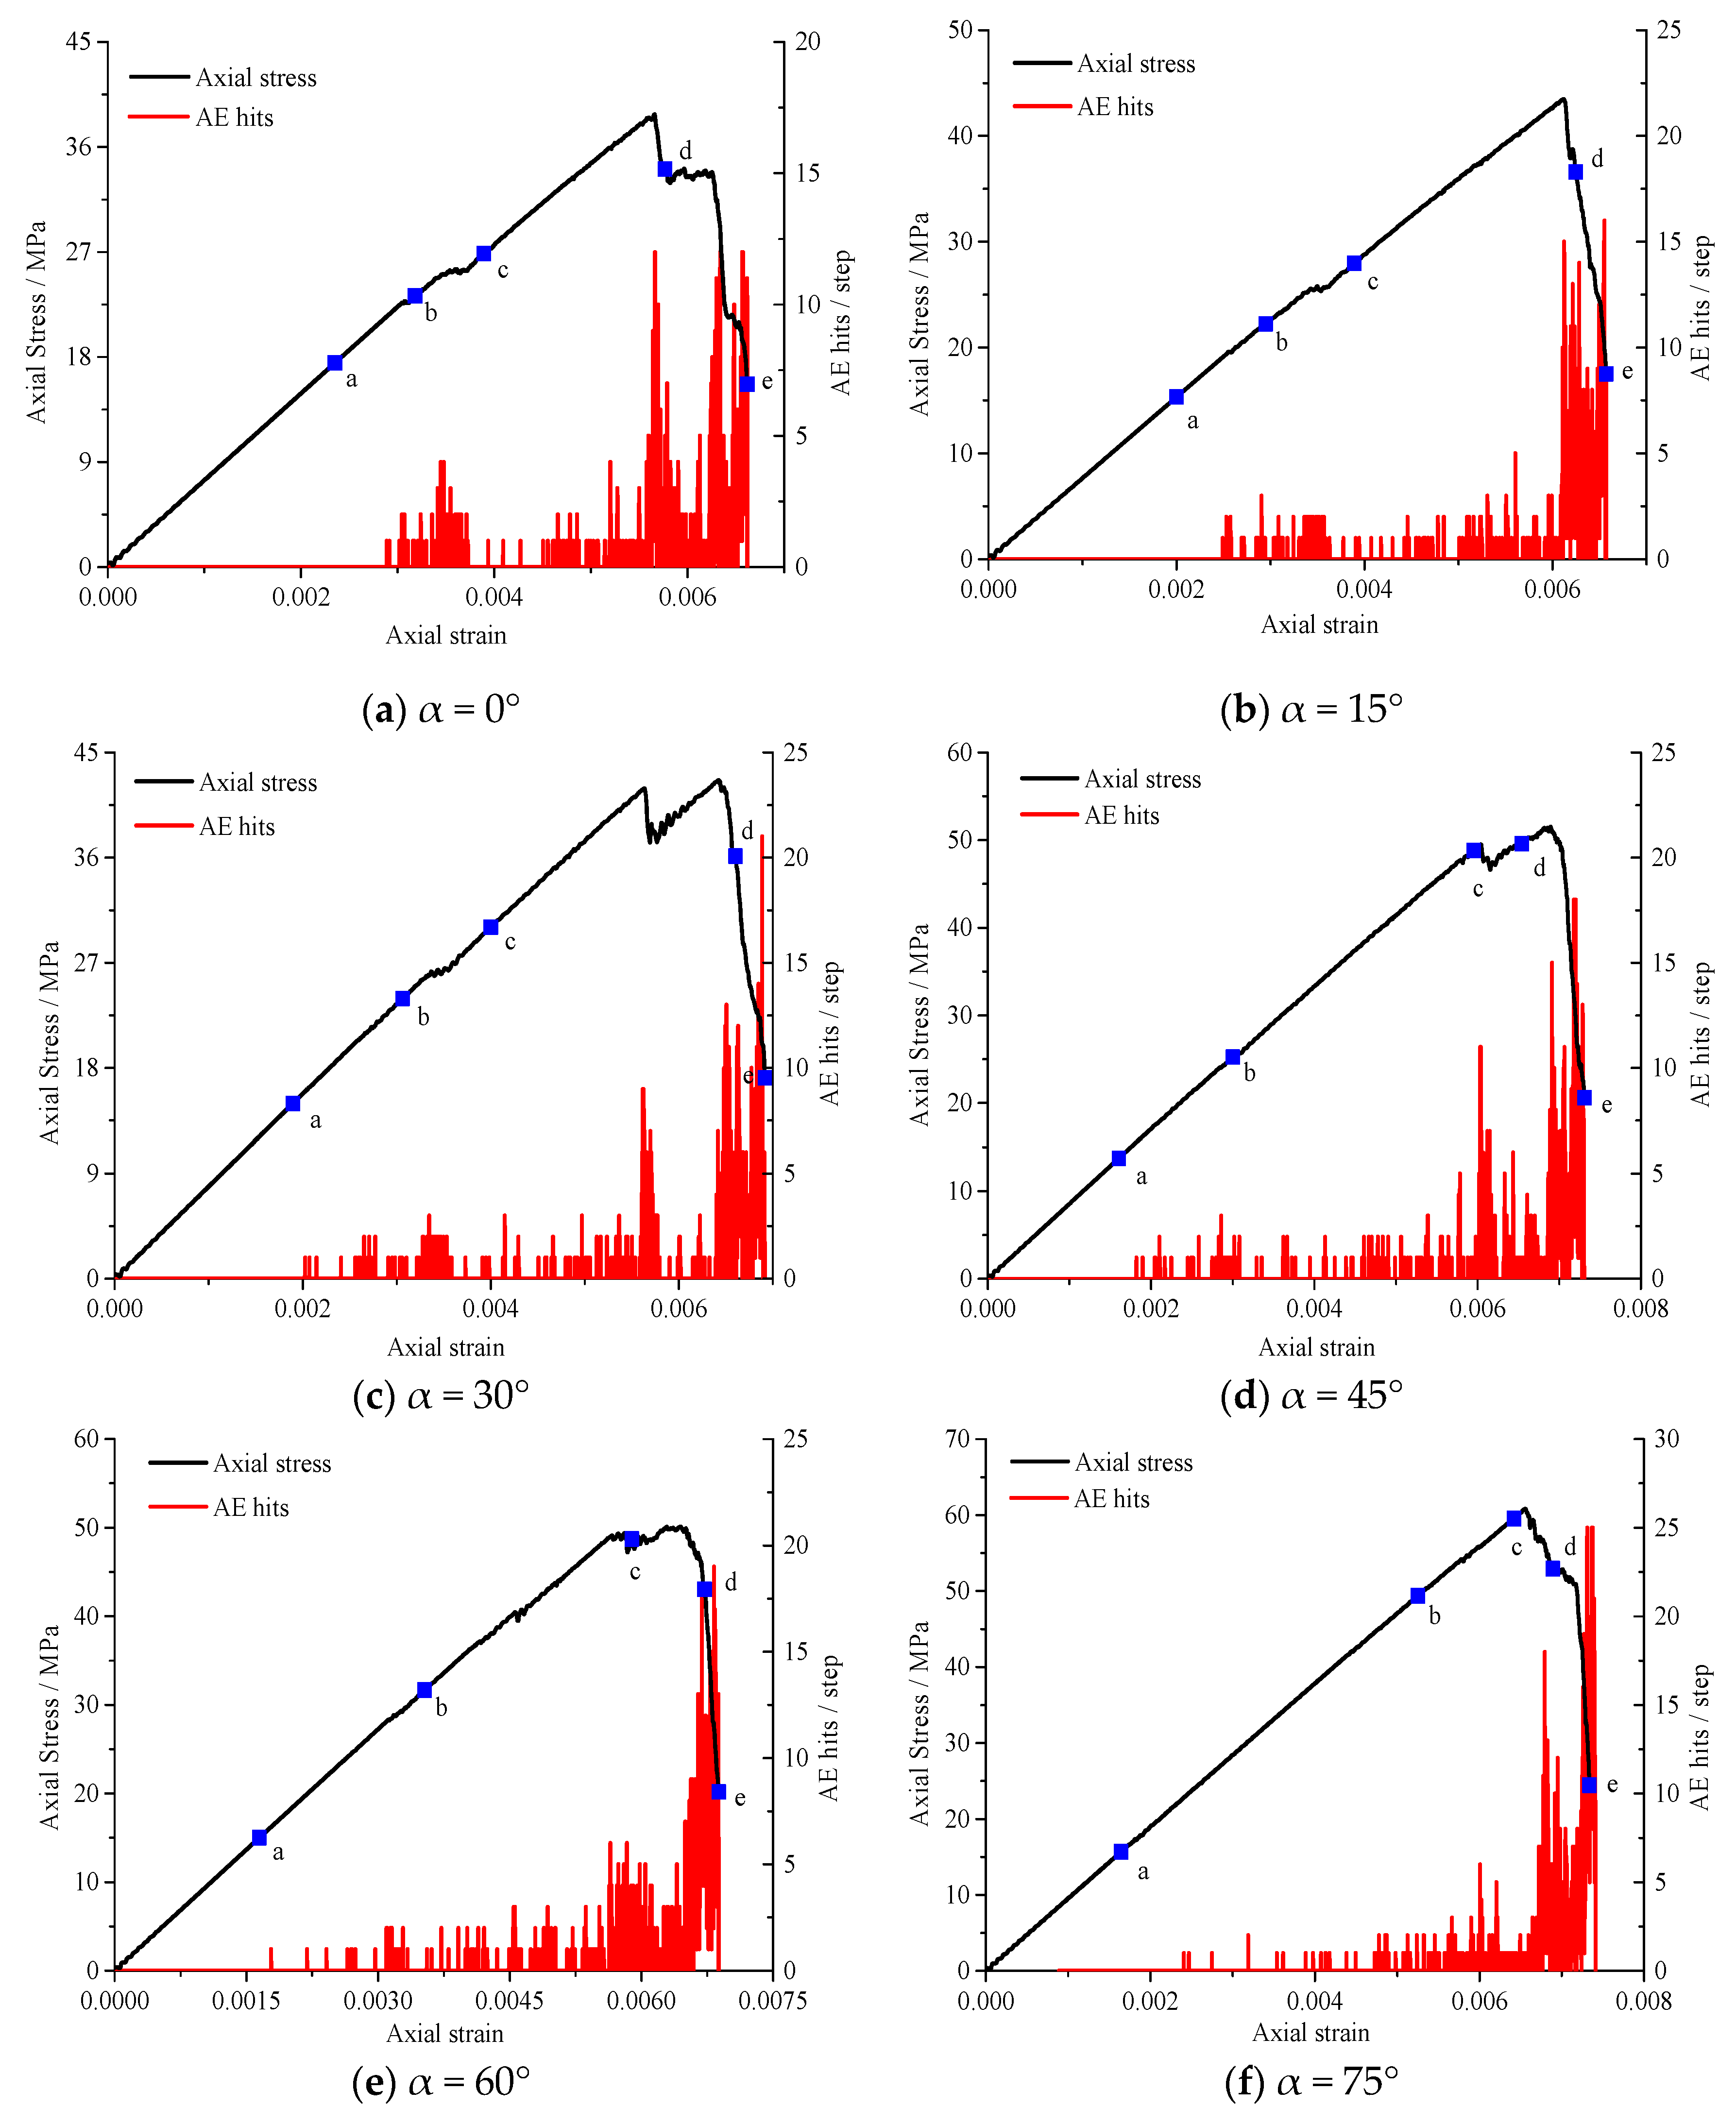
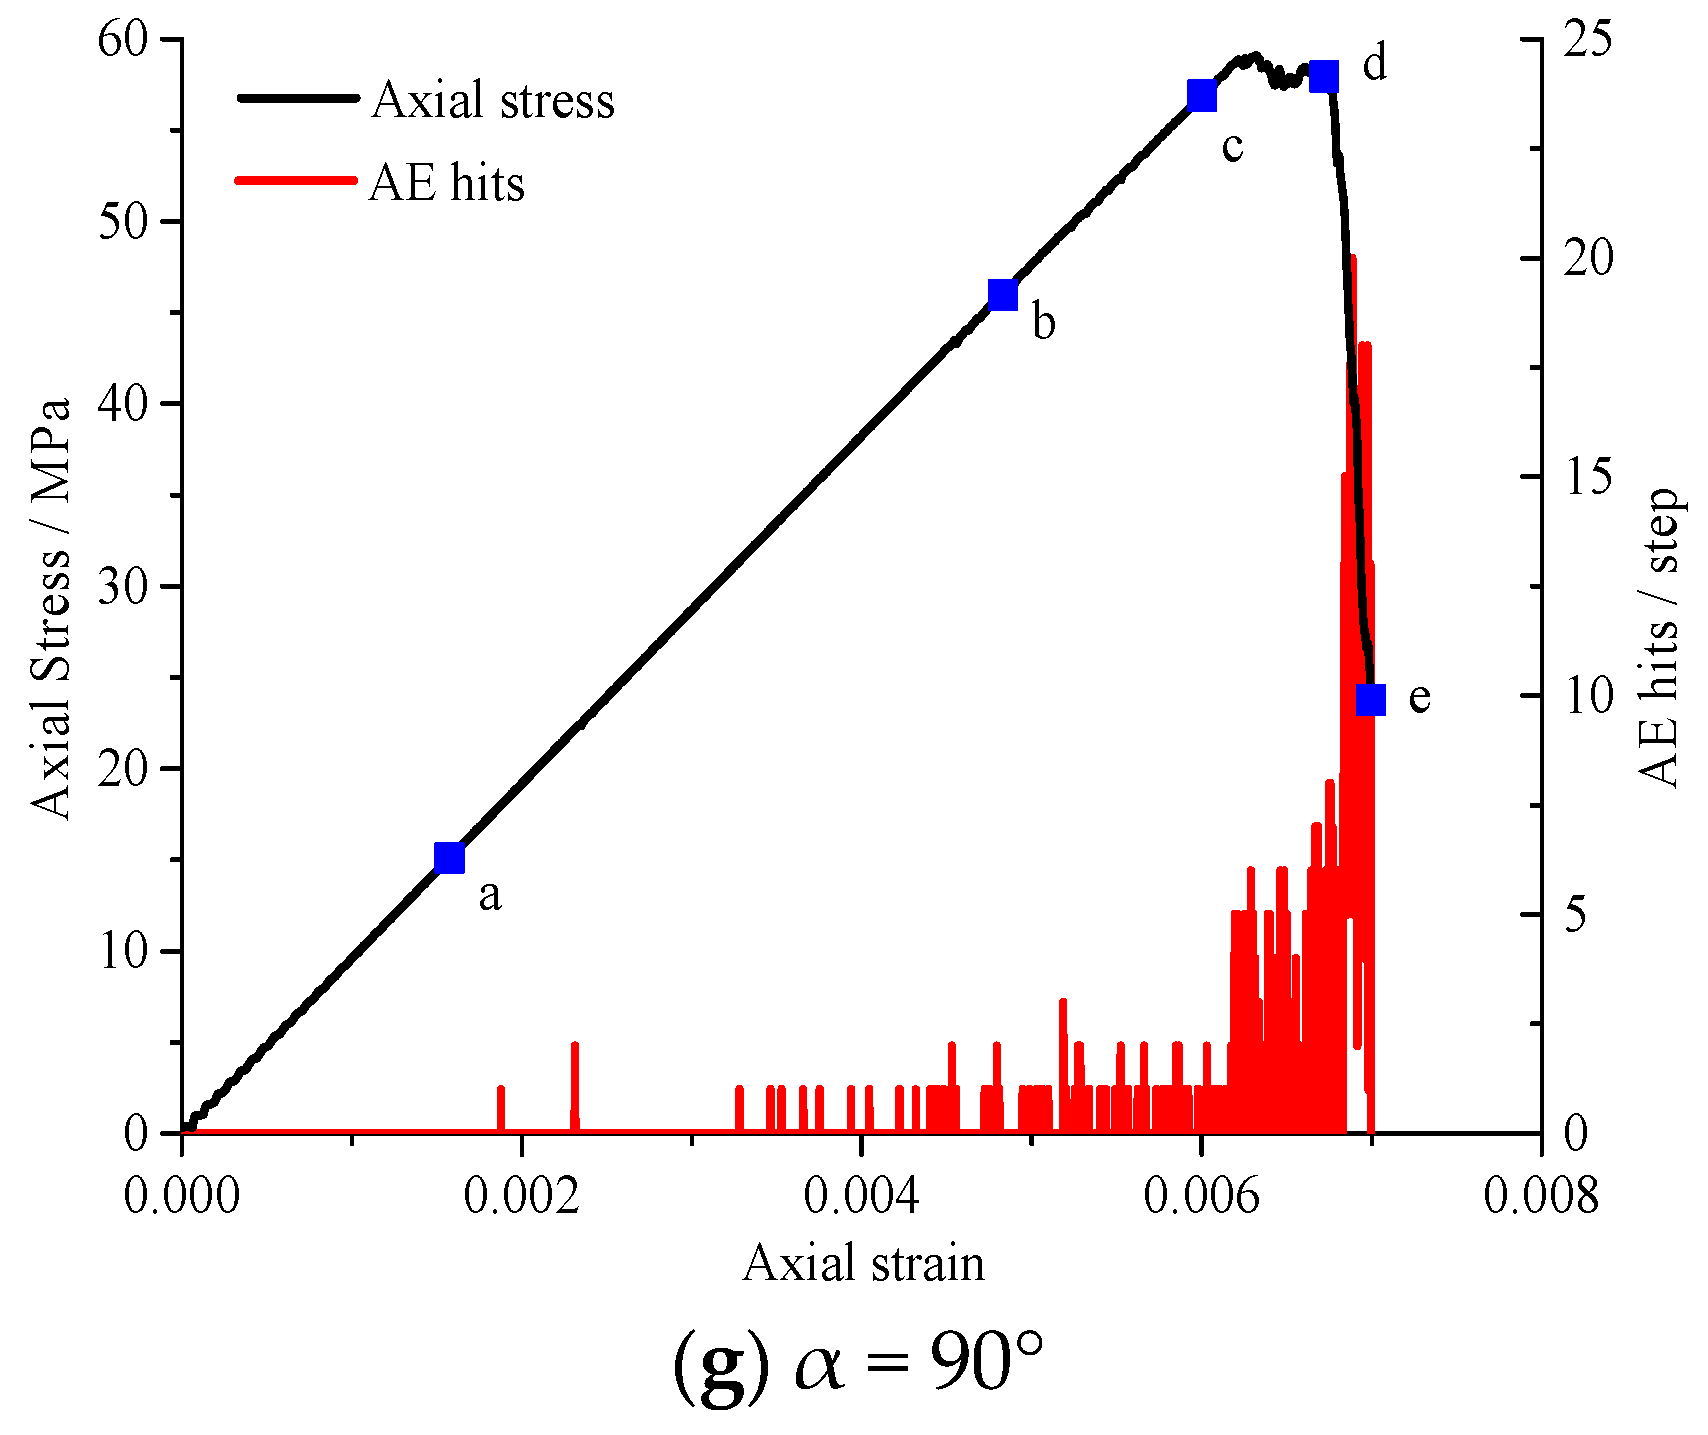
The stress–strain curve and strain–acoustic emission of the defect combination model of cracks with various angles and a single circular hole are shown in
Figure 7. The vertical axis on the right is the number of acoustic emissions in
Figure 7. In this paper, the acoustic emission of the sample is defined by using the cracks produced in PFC. In other words, the number of the bond fracture determines the number of acoustic emissions. Generally speaking, the acoustic emission of each sample has experienced three phases: the initial phase of acoustic emission, the steady growth phase of acoustic emission, and the rapid decline phase of acoustic emission. At the initial phase of the experiment, no acoustic emission signal was found in the sample, because the PFC particles in the sample are rigid bodies. At this moment, no damage occurs in the model. With the increase of load, the bond between particles begins to fracture, and the acoustic emission signal begins to appear, and continues to increase until it reaches the peak. At the post-peak phase, the number of bond breaks between particles decreases gradually, and the acoustic emission decreases gradually until zero; the model has been completely destroyed at this time.
Table 5 shows the crack evolution law of the defect combination model with different stress and strain states corresponding to the marked points shown in
Figure 7. The red line in
Figure 7 indicates the occurrence of cracks. As the external load is small in the early phase of uniaxial compression, the tensile strength and compressive strength around the defect are not reached, and crack initiation did not appear in the sample, in other words, no acoustic emission phenomenon is observed. The acoustic emission at this time corresponds to point a in
Figure 7. Because the tensile strength of the rock is less than the compressive strength of the rock, the tensile fracture initially appears at the top and bottom of the double fracture, and sporadic acoustic emission events will occur at this time, as shown in point b of
Figure 7. With the increase of the load, far-field cracks and local internal cracks appear in the end and inside the model. Because there are many compressive stress concentration regions (CSCRS), the cracks begin to gather along the diagonal of the sample, and the acoustic emission is relatively apparent in these stages, corresponding to points c and d in
Figure 7. As the loading continues, many cracks will appear on the diagonal line of the model, and the model will eventually fail along the diagonal direction of the sample. At this time, the acoustic emission corresponds to point e in
Figure 7.
With the increased dip angle of the prefabricated crack, the strain increases gradually when the acoustic emission quantity begins to appear. This may be due to the influence of the fracture dip angle on the amount of acoustic emission and the AE signal generation time. As shown in the final failure diagram of the defect combination sample in
Table 5, corresponding to point e in
Figure 7, from 0° to 45°, the cracks mainly occur on the left and right sides of the circular hole. From 60° to 90°, the main failure surface runs through the whole rock sample diagonally, and at 75°, a through crack similar to type X occurs. These rules show that the different initial crack angles may change the direction of subsequent cracks, and lead to different failures of the samples. It is necessary to study the crack evolution law to understand the mechanical properties of the composite samples.
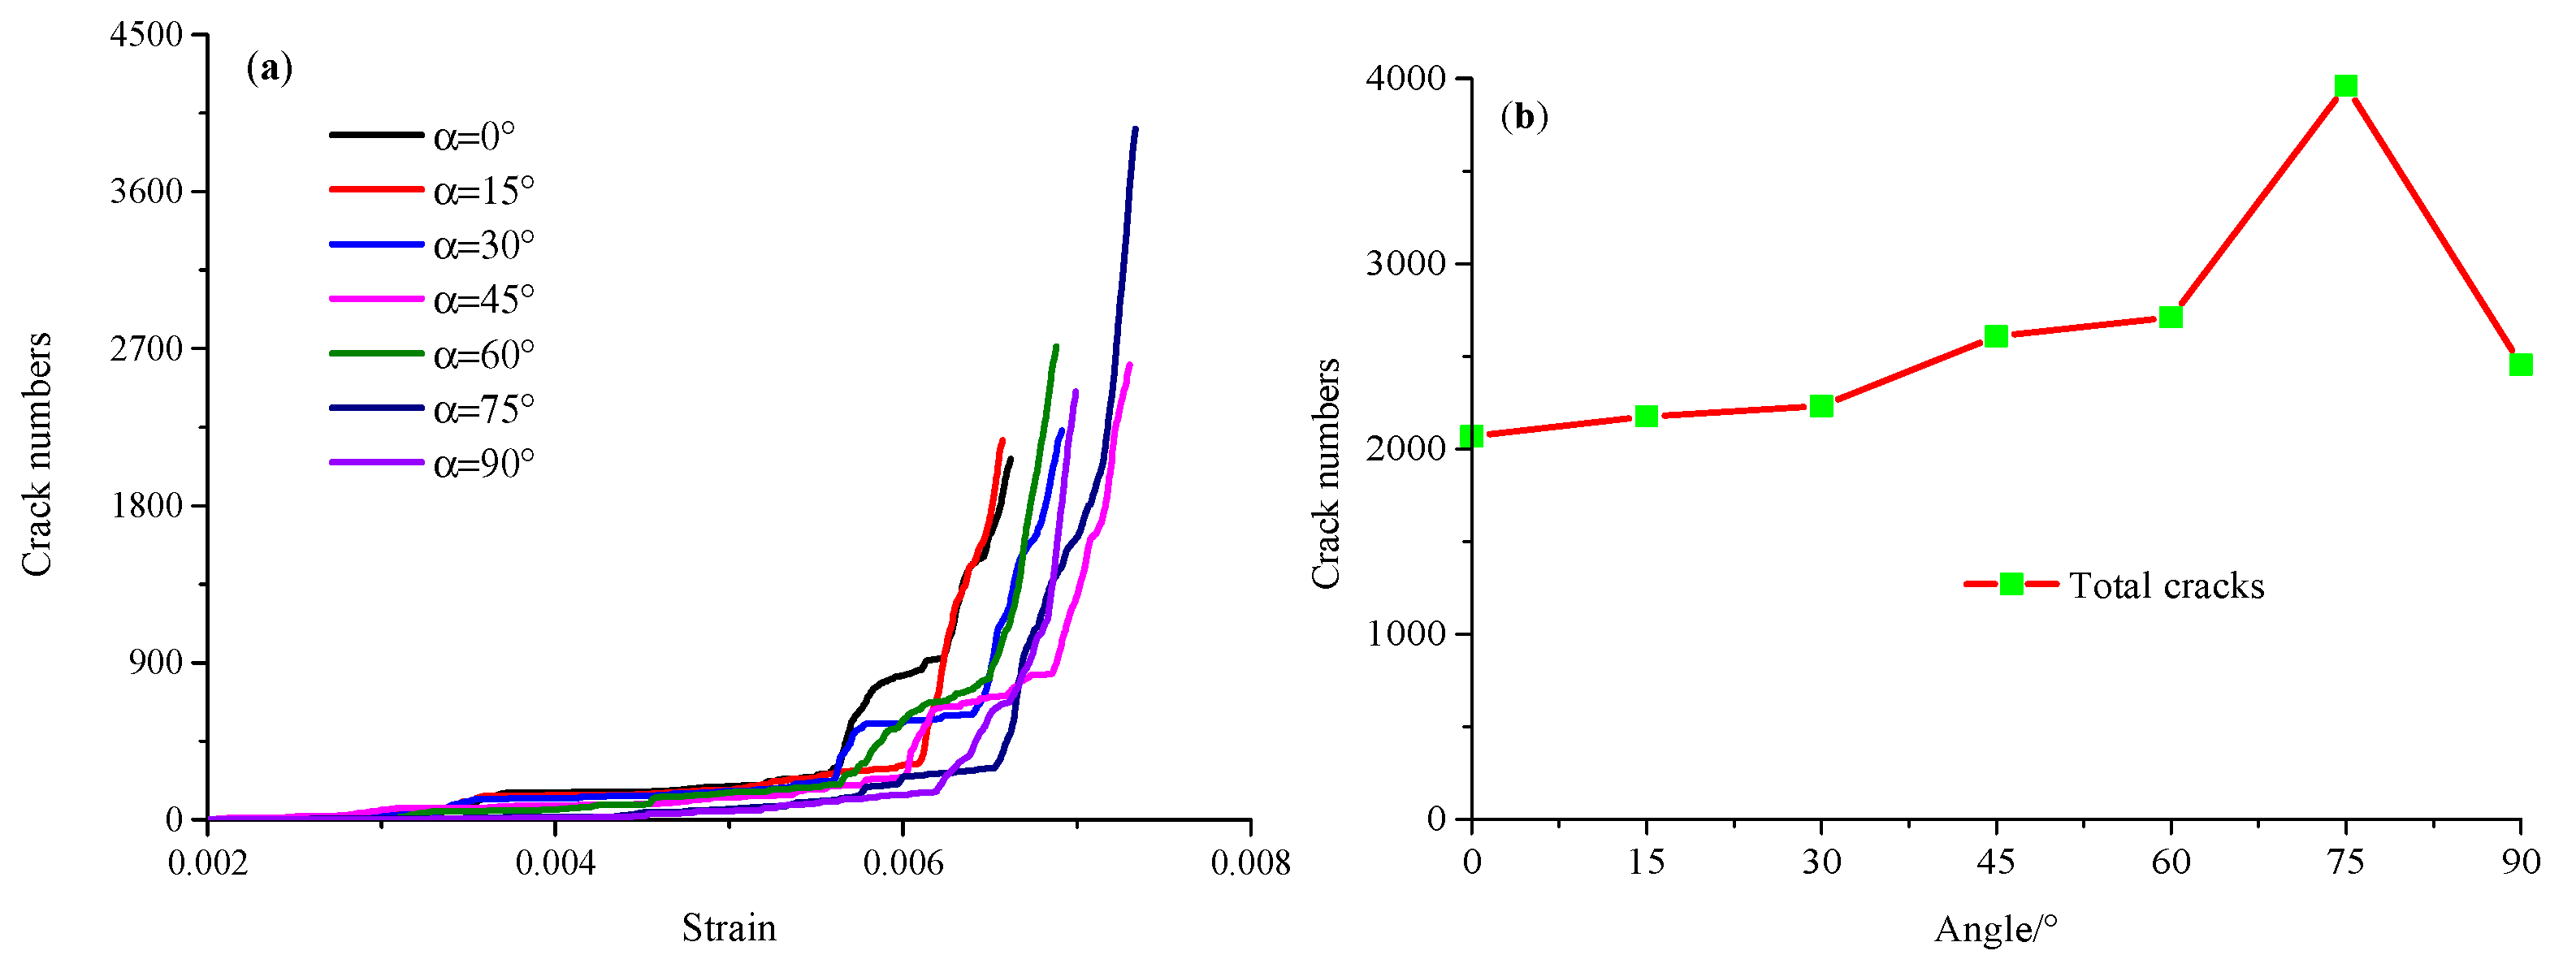
The numbers of strain cracks per model and total cracks in numerical models with different angles of prefabricated fractures are shown in
Figure 8. As a whole, the change trends of the numbers of strain cracks of the combined model with different fracture dip angles are consistent. The curves of crack numbers and acoustic emission show that the crack development of defect models with various crack angles can be divided into three phases: no crack phase, slow crack growth phase, and fast crack growth phase. At the initial displacement loading phase, since the magnitude of the displacement is low, no crack propagation occurs in the model. With the increase of external displacement, cracks appear gradually. Before the peak strength, cracks increase slowly, and after the peak-strength, the cracks develop rapidly. The total number of fractures increases when the crack angle of the defect combination sample is from 0° to 75°, the total number of fractures is the highest at 75°, and the total number of fractures decreases at 90°.
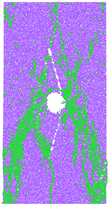
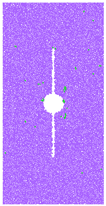
3.3. The Study of Contact Force Chains before Fracture Initiation and after Model Failure
To study the stress state before and after fracture of the composite samples with different dip angle cracks and a single circular hole defects, the contact force chain of defect combination model is analyzed; the distributions of contact force chains before fracture generation and after numerical model failure are shown in
Figure 9 and
Figure 10. The contact force appears, these contact forces are transmitted discretely along the contact surface and finally form force chain network. The red line represents tensile stress, the black line represents compressive stress, and the width and direction of the line represent the magnitude and direction of stress, respectively. The existence of combined defects changes the distribution of contact forces, resulting in compressive stress and tensile stress. The denser the contact force chains in
Figure 9 and
Figure 10, the darker the color.
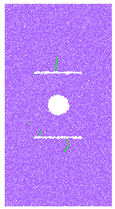
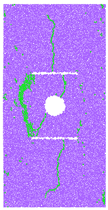
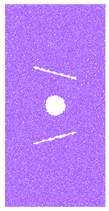
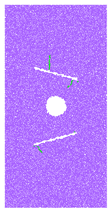
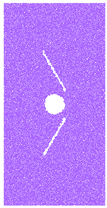
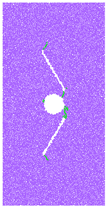
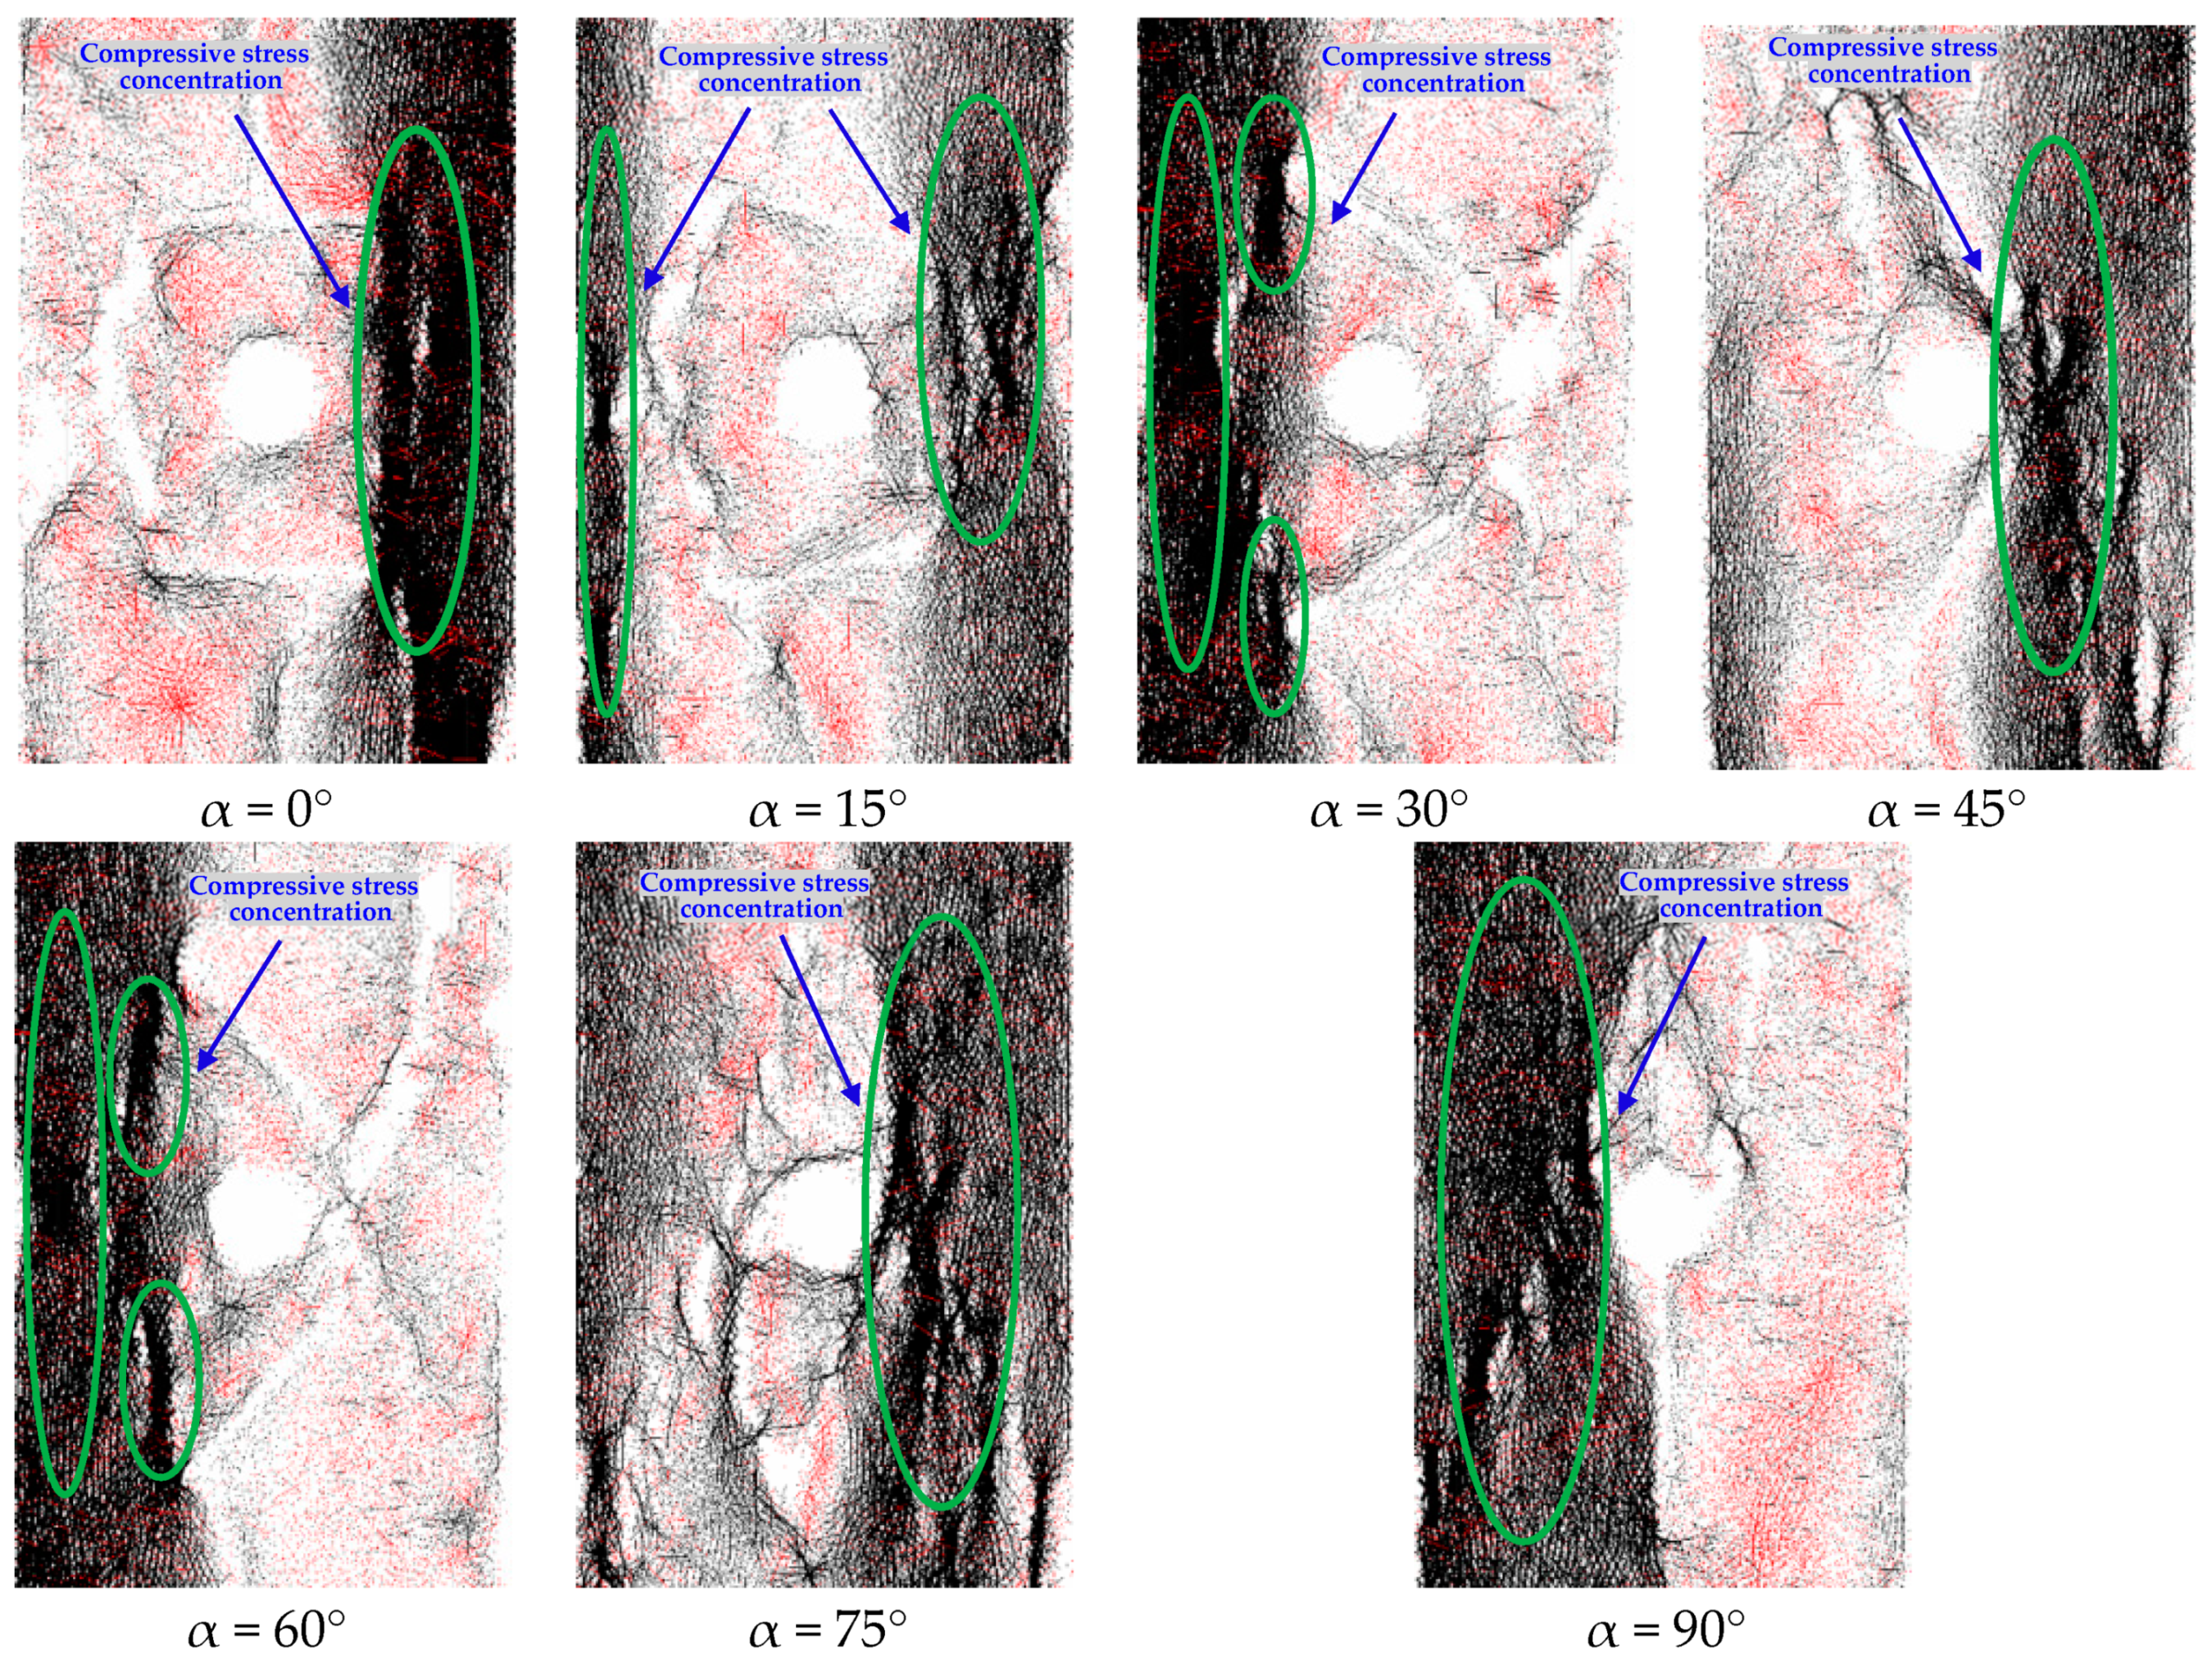
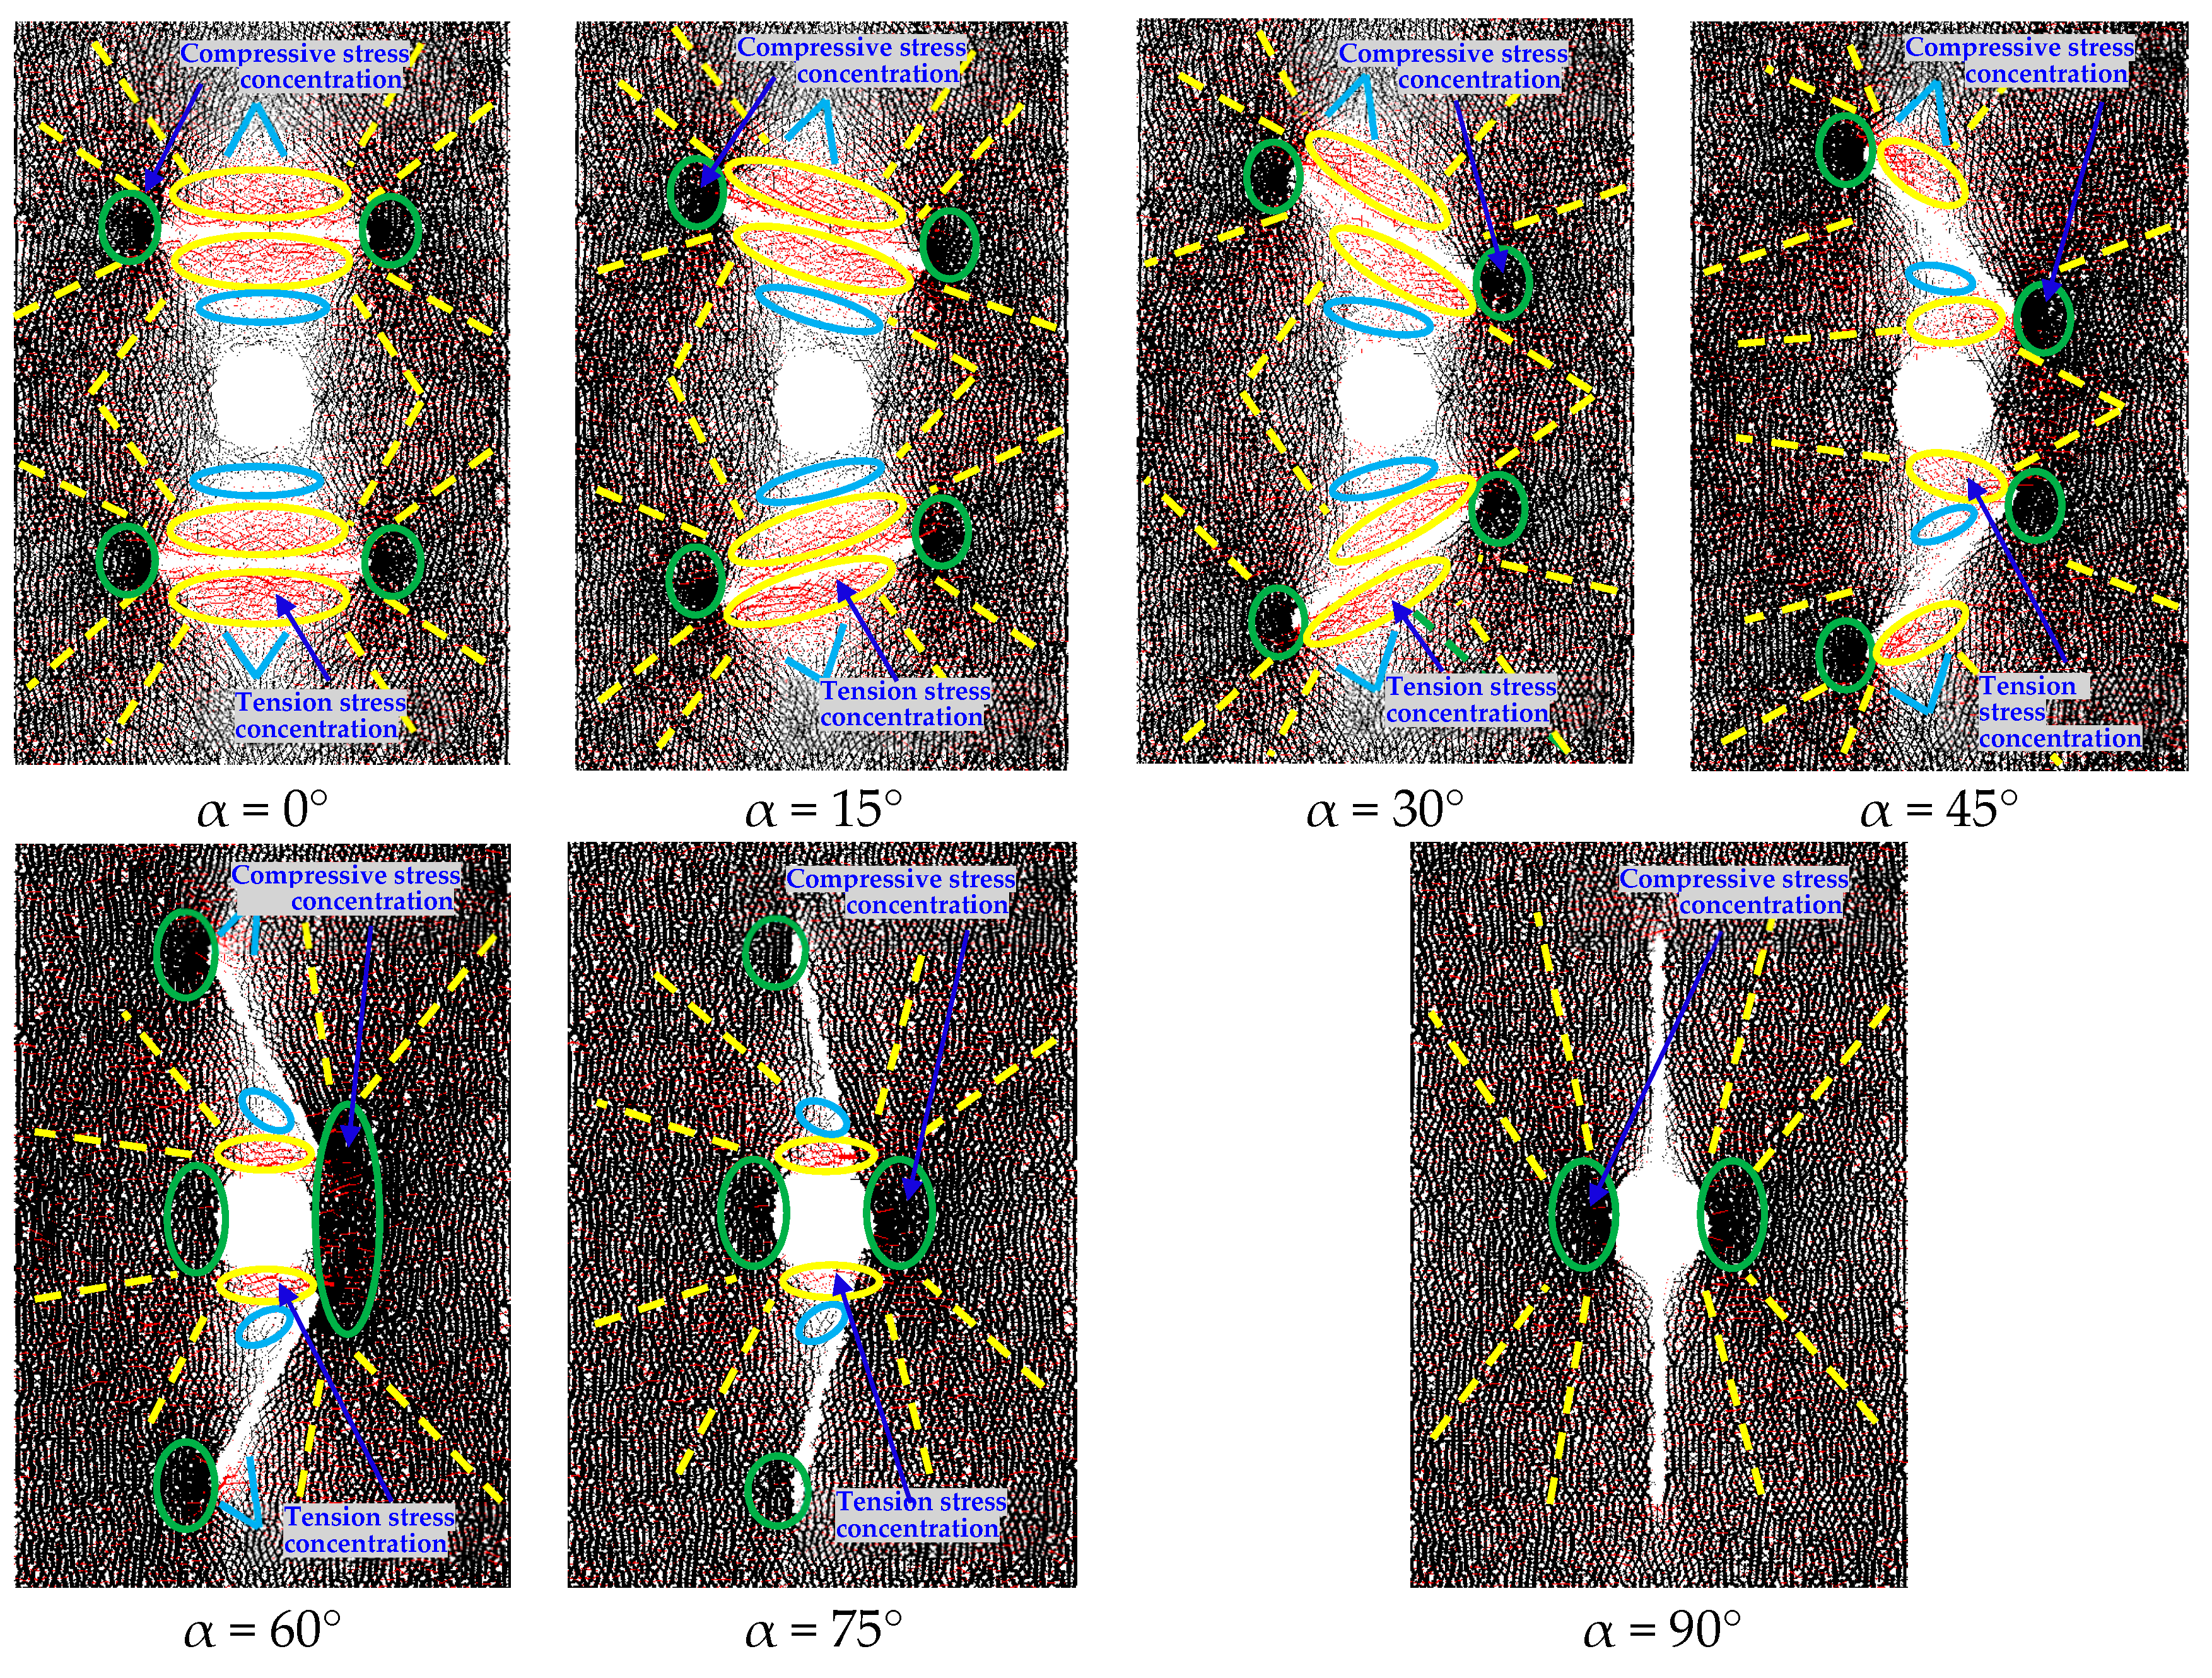
Figure 9 shows the dispersion status of the compressive and tensile stress concentration regions of the defect models before microcrack initiation. For double parallel prefabricated cracks, the compressive stress concentration regions (CSCRS) are mainly distributed at the prefabricated crack tip. With increased fracture angles, the CSCRS at the prefabricated crack tip change with the change of the prefabricated crack position. The CSCRS at the crack tip disappear when α = 90°; however, the CSCRS on the left and right sides of the circular hole appear when α = 60°, α = 75°, and α = 90°, as shown in the position of the green ellipse in
Figure 9. The tensile stress concentration regions (TSCRS) before microcrack initiation are mainly distributed in the upper and lower places of the prefabricated crack. The TSCRS of the two places above and below the crack change with the change of the prefabricated crack position. The TSCRS near both sides of the crack decrease gradually. The TSCRS in the upper and lower places of the circular hole increase gradually. However, when α = 90°, there is no tensile stress concentration in the upper and lower parts of the circular hole.
In addition to the TSCRS around cracks and round holes, under the influence of cracks and holes, there are also some TSCRS in the specimens; in
Figure 9, they are indicated by red areas surrounded by yellow dashes. There are stress reduction zones at two places above and below the cracks and circular holes. That is to say, the stress here is less than that in other parts, as shown in the position of the blue triangle and ellipse in
Figure 9. The distributions of CSCRS and TSCRS in the sample are changed by different dip angles of prefabricated cracks.
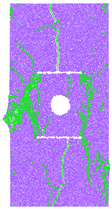
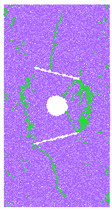
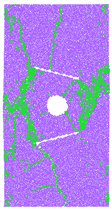
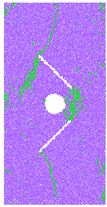
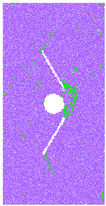
Figure 10 shows the dispersion status of the compressive and tensile stress concentration regions of the defect models after model failure. The CSCRS are indicated by a green ellipse in
Figure 10. After the failure of the model, when α = 30°, α = 60°, and α = 90°, the CSCRS appears on the left side of the models, the CSCRS of the models at other angles appear on the right side of the samples. The TSCRS is widely distributed in the model after model failure. The results show that the fracture dip angle also has an evident effect on the stress distribution when the models are destroyed; that is, different fracture dip angles affect the distribution of the bearing area when the model is finally destroyed.
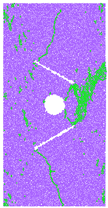
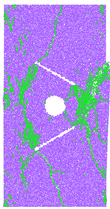
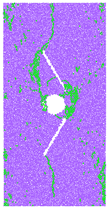
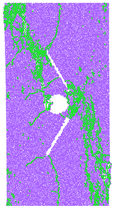
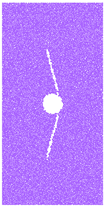
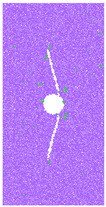
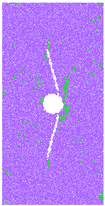
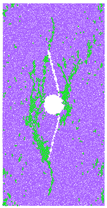
3.4. Displacement Vector Distribution of the Combined Defect Numerical Model
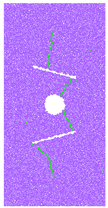
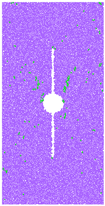
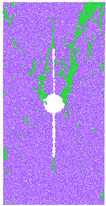
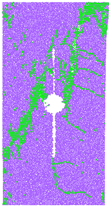
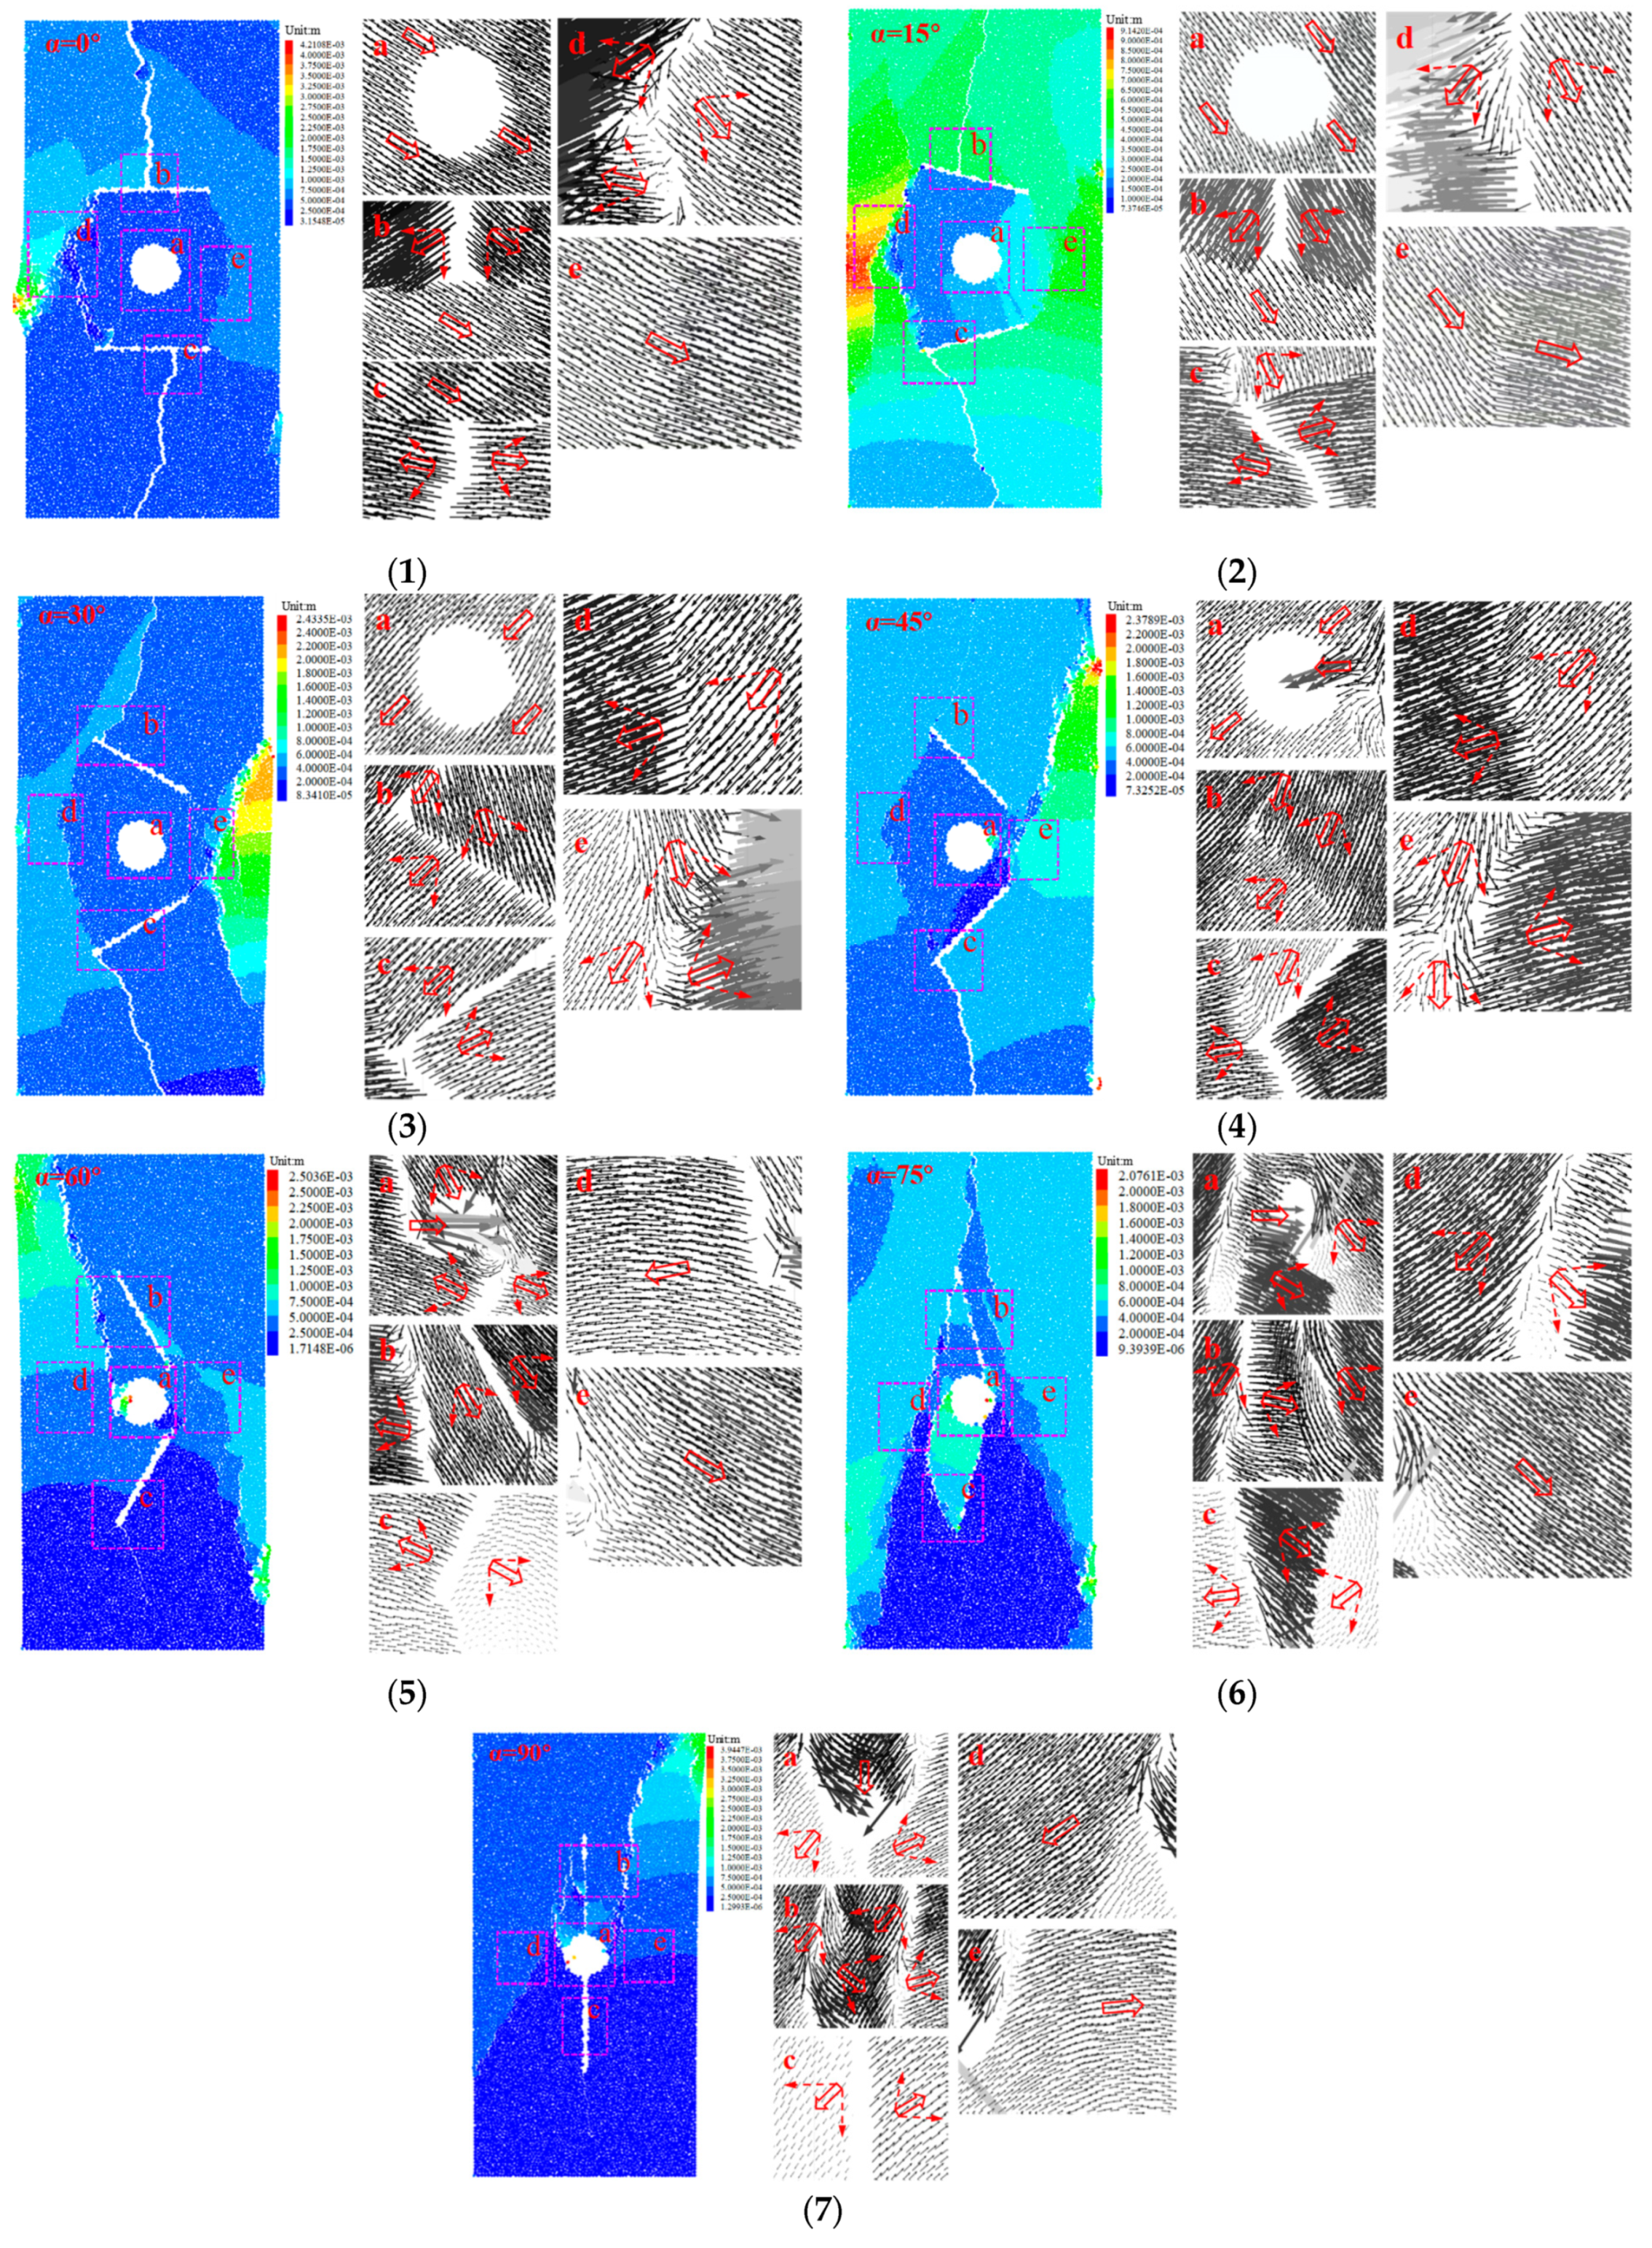
Under uniaxial compression, the displacement vector distribution of the particles after the failure of the sample with double cracks and the single circular hole is shown in
Figure 11. In this figure, (1)–(7) represent the displacement field of samples with fracture angles 0°–90°, respectively, while the areas (a)–(e) are partially enlarged drawings. The black arrow indicates the displacement direction of particles, and the length of the arrow indicates the magnitude of displacement. To describe the movement of particles more vividly, the movement trend of particles on both sides of macro cracks is plotted in the figure. This is indicated by the red solid line arrow. The red dashed arrow is the displacement component along the normal and tangential direction of the macro crack.
Under uniaxial compression, there are three primary forms of macro cracks in the samples. (i) Hole wall spalling. The particles at the edge of the circular hole are squeezed and move into the hole under the action of compressive stress. With the continuous increase of the applied displacement, the bonded particles fracture at the hole wall, the particles detached from the sample and peeled off into the hole.
Figure 11 (1)–(7) (a) shows particles movement and hole wall spalling near the circular hole. As a whole, due to the external force, the particles move downward. When α = 0°–30°, no prominent hole wall spalling was found, the particles near the hole wall tend to move downward to the right in
Figure 11 (1)–(2) (a), and the particles near hole wall move to the left and down for the specimen containing joints with α = 30°. When joints angle α = 45°, the hole wall was damaged from the side near the rock bridge, and the movement trend of the particles is similar to that of the sample with α = 30°.
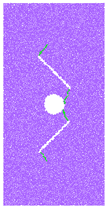
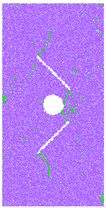
The cracks through the hole occurred from the upper left side of the specimen with α = 60°, and the cracks from the top to the middle of the sample with α = 75° penetrate into the round hole; the hole walls of the two models were destroyed on the left side. However, the failure behavior occurs above the hole wall in the sample with α = 90°. (ii) Tensile cracks. This part takes
Figure 11 (2) as an example; as shown in areas b, c, and d in
Figure 11 (2), the tensile cracks are mainly distributed in the upper and lower places of the crack and the left side of the circular hole. Under the action of external displacement, the particles in area b move towards the hole direction, the particles in area c move towards the edge of the sample, and the particles in area d move to the boundary and the lower right side of the model. Due to the tensile stress, the particles tend to deviate from each other. When the tensile stress exceeds the tensile strength, the rock sample breaks and produces tensile cracks. The existence of the initial crack leads to the crack penetrating to the outer margin of the model. (iii) Compressive shear cracks. As shown in area e in
Figure 11 (2), the cracks occur mainly in the right place of the circular hole. Under the action of external displacement, the sample is squeezed, the particles tend to move from the cavity to the outer edge of the sample, and the particles tend to move in the same direction on both sides of the compressive shear crack; this kind of crack is the main cause of macro failure. When the tangential shear stress surpasses the shear strength of the sample, the macro shear crack of the sample results in the macro failure of the sample.
4. Conclusions
In this paper, numerical simulation is used to study the mechanical properties and failure behavior of the combined defect models with double parallel prefabricated cracks and a single hole under uniaxial compression. The main conclusions are as follows:
(1) The combined defects with the prefabricated cracks and holes affect the mechanical properties of the rock samples; the macro failure modes of models with different fracture angles are different. The elastic modulus, peak stress, and peak strain are reduced compared with the sample without defect. From 0° to 45°, the peak strain increases gradually and presents a linear distribution, while at 60°, 75°, and 90°, the peak strain decreases and fluctuates slightly. Different crack angles have different impacts on the mechanical behavior of defect combination samples.
(2) The prefabricated cracks with different angles and hole combinations affect the microcrack growth trend. With the change of the crack angle from 0° to 75°, the total number of cracks in the defect combination sample shows an increase tendency. When α = 90°, the total number of cracks decreases compared with the sample with α = 75°. Moreover, the total number of fractures is the most at 75°.
(3) Before crack initiation, the CSCRS are mainly distributed in the crack tip. The TSCRS occur mainly in the upper and lower places of the fracture. With the change of the fracture dip angle, the CSCRS and TSCRS of the fracture tip change with the change of the fracture position. After model failure, when α = 30°, 60°, and 90°, the CSCRS occur on the left place of the sample, and the CSCRS at other fracture angles occur mainly on the right place of the sample.
(4) Through the numerical calculation of displacement field of different combination models, the displacement vector distribution of each model is obtained. The macro cracks in the main areas are studied; it is found that there are mainly three kinds of macro cracks. The distribution of stress and displacement in the model is influenced by the arrangement of cracks with different angles and the single circular hole. When α = 75°, it is unfavorable to the stability of the project, and grouting reinforcement should be carried out for larger holes and cracks. This can provide technical guidance for engineering design.


