Abstract
Printed circuit heat exchangers (PCHEs) have the characteristics of high temperature and high pressure resistance, as well as compact structure, so they are widely used in the supercritical carbon dioxide (S-CO2) Brayton cycle. In order to fully study the heat transfer process of the Z-type PCHE, a numerical model of traditional Z-type PCHE was established and the accuracy of the model was verified. On this basis, a new type of spiral PCHE (S-ZPCHE) is proposed in this paper. The segmental design method was used to compare the pressure changes under 5 different spiral angles, and it was found that increasing the spiral angle θ of the spiral structure will reduce the pressure drop of the fluid. The effects of different spiral angles on the thermal-hydraulic performance of S-ZPCHE were compared. The results show that the pressure loss of fluid is greatly reduced, while the heat transfer performance is slightly reduced, and it was concluded that the spiral angle of 20° is optimal. The local fluid flow states of the original structure and the optimal structure were compared to analyze the reason for the pressure drop reduction effect of the optimal structure. Finally, the performance of the optimal structure was analyzed under variable working conditions. The results show that the effect of reducing pressure loss of the new S-ZPCHE is more obvious in the low Reynolds number region.
1. Introduction
The supercritical carbon dioxide Brayton cycle is widely used in solar energy [1,2], nuclear energy [3,4], waste heat recovery [5], geothermal energy [6], and other fields for its compactness and high efficiency, and many scholars have studied it extensively. Ahn et al. [7] designed a S-CO2 Brayton cycle experimental loop to make it more efficient under higher pressure conditions. Milani et al. [8] proposed a model and control strategy of the re-compression S-CO2 Brayton cycle to compare the performance of two common solar input devices (direct and indirect). The results showed that the indirect cycle consumed 19.5% less fossil fuel than the direct cycle on a specific day.
As the working fluid of the S-CO2 Brayton cycle, the thermophysical properties of CO2 play a vital role in the efficiency of the entire system. CO2 is an environmentally friendly natural working fluid because of its inert chemical properties, security, and cheapness. In addition it has an ozone depleting potential (ODP) of 0 and a very low global warming potential (GWP) [9]. However, the thermophysical properties of S-CO2 are very severe [10], especially near the pseudo-critical point. The pseudo-critical point is the temperature corresponding to the peak value of the specific heat at constant pressure of S-CO2. Taking 8 MPa as an example, the specific heat at constant pressure of S-CO2 will rise rapidly near the pseudo-critical point and then decrease rapidly, and the density, dynamic viscosity, and thermal conductivity will also decrease to some extent. Additionally, the working conditions of high temperature and high pressure in the cycle require high quality heat exchange equipment.
Generally, a simple S-CO2 Brayton cycle system is mainly composed of compressor, turbine, generator, regenerator, precooler, and heat source as shown in Figure 1 [11]. In this cycle, about 60–70% of the total cycle heat transfer occurs in the regenerator [12]. Hence, it is necessary to study the thermal performance of the regenerator in the loop. The printed circuit heat exchanger is characterized by its compactness, high efficiency, and high resistance to temperature and pressure making it suitable for use in the S-CO2 Brayton cycle [13]. However, due to the complexity of the flow channel shape and the instability of the physical properties of the supercritical heat transfer medium, the heat transfer mechanism is not very clear.
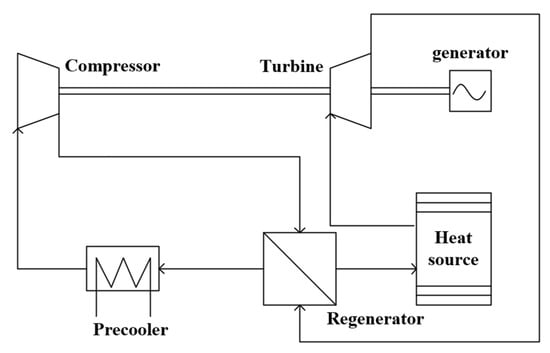
Figure 1.
Diagram of a simple Brayton cycle.
There are two main categories of PCHE: continuous and discontinuous. The former includes straight and Z-type channels, and the latter includes airfoil and S-type channels. The cross-sectional shapes of flow channel include circular, rectangular, semicircular, trapezoidal, and so on. After considering the thermal-hydraulic performance, pressure resistance, maturity, and manufacturing cost, the Z-type channel with semi-circular cross-section is the preferred channel for S-CO2 side of PCHE [14]. Nikitin et al. [15] experimentally investigated the pressure drop and thermal performance of Z-type PCHE in the S-CO2 cycle, obtained the total heat transfer coefficient of PCHE in the experimental loop, and proposed the empirical formula for local heat transfer coefficient and friction factor of Reynolds number. Meshram et al. [12] numerically compared the temperature, pressure drop, and Reynolds number along the length of PCHE with straight and Z-type channels, and considered the influence of straight channel diameter, Z-channel pitch, and bending angle on heat transfer performance. The results showed that the heat transfer coefficient increased with the decrease of the channel, but the pressure drop also increased. The total heat transfer coefficient in the Z-type channel was proportional to the bending angle and inversely proportional to the pitch. Lee et al. [16] combined RANS analysis and multi-objective genetic algorithm to optimize the shape of the flow channel of the Z-type PCHE, and studied the trade-off relationship between increasing heat transfer efficiency and reducing flow resistance, and finally obtained the optimal channel shape. Serrano et al. [17] used a numerical analysis method to explore the heat transfer in Z-type PCHE channel. The results showed that 30% of the heat transfer was released near the critical point of S-CO2, while 60% of the heat transfer used 80% of the length of the heat exchanger, which meant that a large part of the heat transfer area was not effectively utilized. Saeed et al. [18] proposed a new flow channel structure based on the Z-type flow channel through numerical analysis, and obtained the correlation formula between heat transfer and pressure drop of the optimized flow channel. The results showed that, compared to the traditional flow channel structure, the hydraulic performance of the new flow channel was improved by a factor of 2.5. Yang et al. [19] used multi-objective evolutionary algorithm (MOEA) to optimize PCHE. The results show that the pressure drop can be reduced by nearly 26% compared with the reference case if the temperature rises of the optimal solution and the reference case are the same. Jing et al. [20] proposed 8 different channel configurations of multi-channel PCHEs (MFP), and seven kinds of continuous and discontinuous arc ribs were introduced into the MFP channel. The results showed that the 90° bend and the circular rib enhanced the fluid disturbance by enhancing the collision and acceleration effect between the fluids, contributing to the augmentation of turbulence kinetic energy (TKE) and heat transfer level. The addition of flow channels can also improve the overall thermal performance. Tang et al. [21] analyzed the effect of the minimum transverse distance of a vortex generator (VG) on the thermal and hydraulic performance. The optimal minimum transverse distance of VG was obtained and the optimal arrangement of vortex generator and airfoil fin was proposed. Bennett et al. [22] studied the effects of geometric structure and fluid physical properties on the thermo-hydraulic performance of PCHE. The results show that the Z-type PCHE thermal performance parameters are most sensitive to the bending angle, curvature radius of bending angle, mass flow rate, and channel width. Aneesh et al. [23] studied PCHE by means of numerical simulation, and the results showed that the performance of PCHE with a single banking arrangement between hot and cold channels was better than that of double banking. A new type of flow channel with hemispherical grooves was proposed, and the authors proved that the new PCHE has better performance.
All of the abovementioned research indicates that it is urgent and necessary to study Z-type PCHE, but most of the studies mentioned were limited to the experimental and numerical analysis of the traditional Z-type PCHE, and no new PCHE forms have been created on this basis. In this work, based on the numerical simulation of the traditional Z-type PCHE, a new type of PCHE with spiral channels is proposed. In this paper we describe our analysis of the performance of the spiral Z-type PCHE from the perspectives of hydraulic and thermal performance, and the optimal structure we finally obtained, which provides a certain reference for the design and optimization of PCHE.
2. PCHE Model
2.1. Geometric Model
Nikitin et al. [15] obtained experimental data on Z-type PCHE in 2006. The size of the core area of PCHE was 71 × 76 × 896 mm3, the number of hot channels was 144, and the number of cold channels was 66. Therefore, the geometric model used in the simulation was designed based on this experiment data. The arrangement of hot and cold channel is double-banking type with two hot channels and one cold channel between them, as shown in Figure 2. To simplify the difficulty of modeling, the geometry size of the cold channel is identical to that of the hot channel, with a channel diameter of 1.9 mm and the length is shortened to 72 mm, and the specific dimensions are shown in Figure 3. The flow pattern between hot and cold fluids is counter flow.
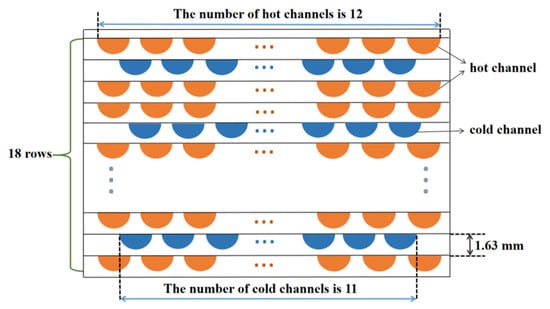
Figure 2.
Diagram of PCHE channel section.
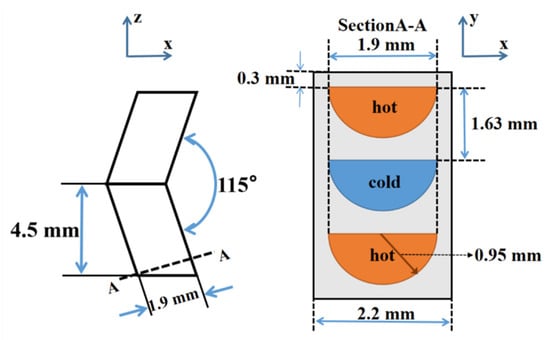
Figure 3.
Diagram of the dimensions of the channel.
2.2. Grid Generation and Parameter Setting
ANSYS ICEM was used to establish the PCHE grid, and the fluid and solid domains are divided by an unstructured grid. In order to fully obtain the flow information in the flow channel, the mesh is appropriately densified in the fluid domain. The velocity and pressure of viscous fluid in the region close to the wall change dramatically, and the meshes near the wall play a very important role in the simulation results, so it is necessary to set a boundary layer mesh in the area close to the wall. The final diagram is shown in Figure 4.
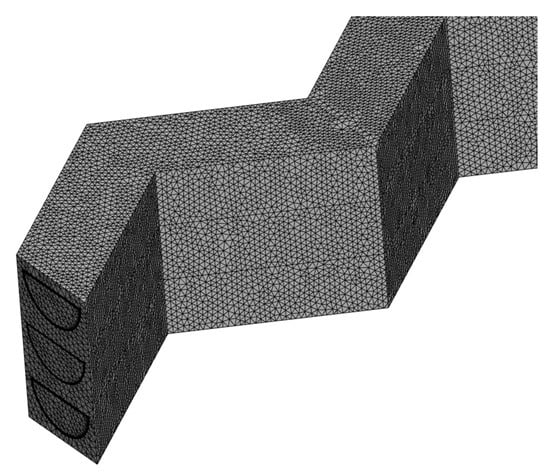
Figure 4.
The grid of PCHE.
Both the cold and hot side fluids are CO2. Since the working conditions involved in this paper are far from the pseudo-critical point of the S-CO2 and the changes of the physical properties of the fluid tend to be minor, the piecewise-polynomial forms of the physical properties of the fluid were introduced into the ANSYS FLUENT, with the goodness of fit R2 above 99.9%. The turbulence model is a standard k-ε model with standard wall function. The mass flow inlet and pressure outlet boundary conditions were adopted for both cold and hot fluids. The values of inlet temperature and outlet pressure refer to Ishizuka’s experiment [24] and Kim’s simulation [25], and the mass flow rate at the inlet varies from 40 kg/h to 75 kg/h. The specific boundary conditions are shown in Table 1. The upper and lower boundaries of the wall are periodic boundaries, and the front and rear, and left and right walls are adiabatic boundary conditions, as shown in Figure 5. The material of the solid domain is SS316L stainless steel, and the wall type of the interface between fluid domain and solid domain is coupled. The SIMPLEC algorithm is used to solve the coupling relationship between velocity and pressure, and the second-order upwind scheme is used to discretize all the equations. When the residuals of the equations are less than 10−6, the results are considered to be convergent.

Table 1.
Boundary condition.
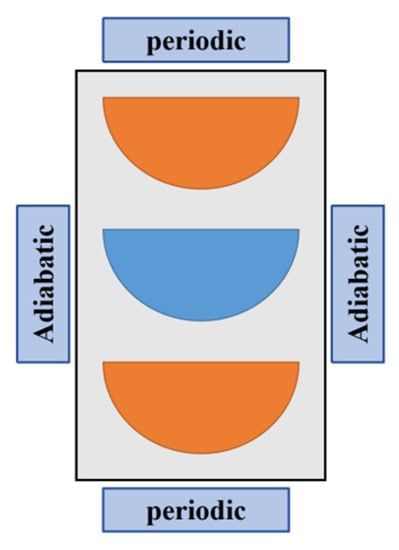
Figure 5.
Boundary conditions of the walls.
2.3. Model Verification
2.3.1. Grid Independence Verification
The number of grids plays a crucial role in the accuracy of simulation results. A large number of grids not only improves the accuracy of simulation results, but at the same time consumes a large number of computer resources and computation time. Therefore, when the computer resources are large enough and the simulation results are relatively stable, the number of grids that consumes the least computational resources is preferred. In this work, 6 groups of grids were selected for comparison, as shown in Figure 6. It can be observed in the figure that, after grid 5, even if the number of grids is increased, the total heat transfer coefficient of the cold and hot sides will not change significantly, so grid 5 (2,642,182) was determined to be the optimal one.
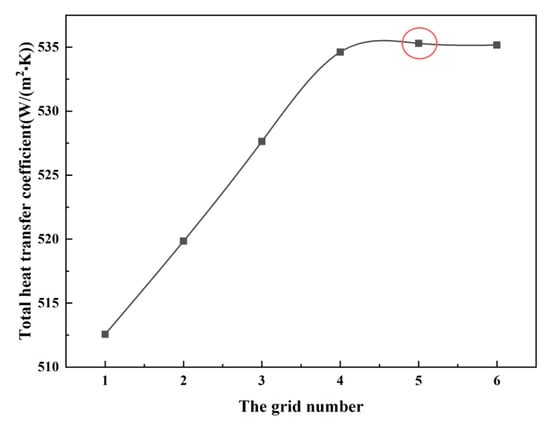
Figure 6.
Grid independence for PCHE.
2.3.2. Simulation Results Verified by Experiments
The thermal and hydraulic performance of PCHE are significant parameters for evaluating its performance. In order to verify the reliability of the simulation results, the simulation results were compared with the previous experimental results [15,24]. As mentioned above, to simplify the model, the shape of the cold side channel was simplified to the same form as the hot side. Hence, only the hot side pressure drop is used as the hydraulic performance parameter in the verification model, and the total heat transfer coefficient between the cold and hot sides is used as the parameter to verify the thermal performance of PCHE, as shown in Table 2. It is worth mentioning that the pressure drop at the hot side is the result of the PCHE, with a length of 72 mm converted to an experimental length of 846 mm. After comparing the pressure drop at the hot side with the experimental results, the relative error was found to be 5.668%. The change in the total heat transfer coefficient with the Reynolds number was compared with the experiment, as shown in Figure 7, and the relative error was found to be within ±10%. In conclusion, the errors of the simulation results were within the acceptable range, so the simulation results of PCHE can be considered reliable.
Table 2.
Comparison of simulation and experimental results.
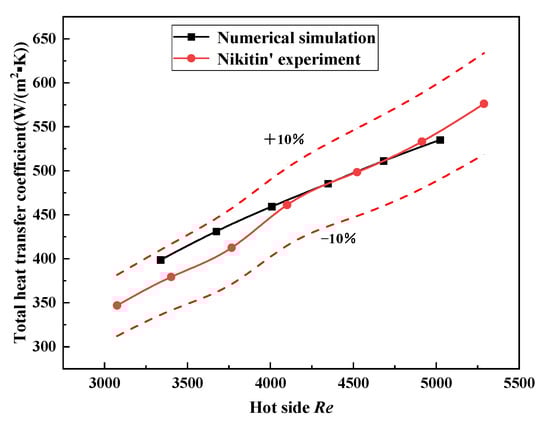
Figure 7.
Comparison of simulated and experimental values of total heat transfer coefficient with Reynolds number.
2.4. Mathematical Model
In this work, the fluid of the numerical model is in a steady state, and the same governing equations are used for hot and cold fluids. The governing equations used in the model are described by Equations (1)–(3):
Continuity equation:
Momentum equation:
The energy equation is expressed by Equation (3), where the Φ is the energy dissipation caused by the viscosity.
The whole channel of the cold and hot side is divided into N same semicircular plane perpendicular to the x-z plane by the method of segmental design [26], forming n equal length element segments, as shown in Figure 8.
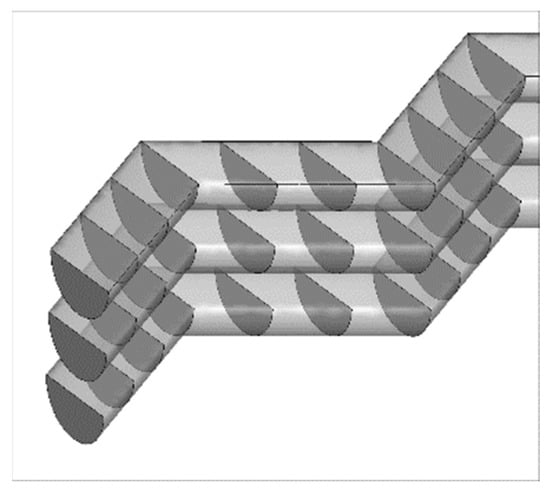
Figure 8.
Sectional design diagram.
Equation (4) is used to calculate the local heat load of the unit segment. e represents the enthalpy value of each inlet and outlet unit segment, and is the mass flow rate of the fluid.
The local heat transfer coefficient is described by Equation (5), where Tb,n is the average temperature of each unit segment, Twall,n is the average temperature of the wall of each unit segment, and An is the heat transfer area of each unit segment.
The local Nu number is calculated using Equation (6), where D is the hydraulic diameter of the flow channel and λ is the average thermal conductivity of the unit segment.
The average Nu number of hot and cold fluid are calculated by averaging the local Nu of each unit segment.
The total heat transfer coefficient of the fluid is described in Equation (8), where Q is the total heat load, A is the heat transfer area of the channel, and ∆Tm is the logarithmic average temperature difference calculated by using the inlet and outlet temperatures of the hot and cold fluids.
The local friction factor is described by Equation (9), where, Pin,n is the inlet pressure of the unit segment, Pout,n is the outlet pressure of the unit segment, ρn is the average density of the unit segment, and ln is the effective length of the flow channel of the unit segment.
The average friction factor of hot and cold fluid are calculated by averaging the local f factor of each unit segment.
3. A New Spiral Z-Type PCHE (S-ZPCHE)
Z-type PCHE has high efficiency and compact properties compared with traditional heat exchangers, but with the characteristics of high-pressure loss. Based on the traditional Z-type structure, an improved spiral Z-type PCHE is proposed in this section, which can significantly reduce the pressure loss of fluid, and provides a scheme and idea for the development and design of new PCHE in the future. For convenience, it is called SZ-type PCHE in the following context.
The flow resistance in PCHE is mainly composed of form loss and friction loss [27] as shown in Equation (11). Consequently, by changing the shape of the flow channel, the flow state of the fluid can be changed to some extent, and the formation of vortices and stagnant regions of the local flow can be alleviated, thus reducing the pressure loss. This is based on this idea that a SZ-type PCHE is designed as shown in Figure 9a. On the basis of the original Z-type structure, the semicircle at each turning point was rotated by an angle θ on the x-y section, and the rotation angles of two adjacent semicircles are equal in size and opposite in direction, as shown in Figure 9b. The same boundary conditions and governing equations were used for S-ZPCHE and the original structure. In order to explore the influence of different rotation angles on the spiral structure, the flow and heat transfer of five different cases, with θ of 0° (the original structure), 5°, 10°, 15°, and 20°, were simulated. After verification of grid independence, the number of grids with θ of 5°, 10°, 15°, and 20° was determined to be 2,493,684, 2,504,264, 2,629,618 and 2,532,347, respectively.
where, Pform is form loss, Pform is friction loss.

Figure 9.
Improved spiral Z-type structure diagram: (a) The mesh of S-ZPCHE; (b) The spiral angle θ of S-ZPCHE.
4. Results Analysis and Discussion
4.1. Effects of Different Spiral Angles
4.1.1. Changes of Pressure
The relationship between the pressure drop at the cold side and the angle θ of the spiral structure is shown in Figure 10. First of all, it is obvious that increasing the rotation angle θ of the spiral structure will reduce the total pressure drop of the cold fluid in varying degrees. Compared with θ = 0, the total pressure drop of the cold side fluid decreased by 7.32%, 10.65%, 11.16%, and 13.32% for every 5° increase of the rotation angle. The larger the rotation angle, the more obvious the reduction of the pressure drop of spiral structure. However, due to the limitation of the solid domain structure around the flow channel, the maximum rotation angle can only reach 20°, but the 13.32% pressure drop reduction value is very considerable. Secondly, the pressure distribution of the fluid in the PCHE is not linear, but in the form of fluctuating decline.
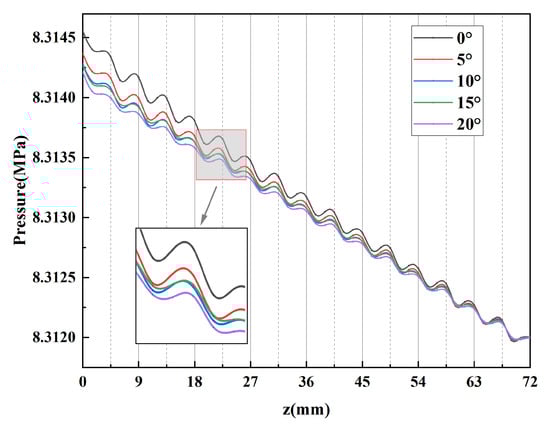
Figure 10.
Relationship between the cold side pressure drop and angle θ of spiral structure.
The pressure of the fluid fluctuates locally at each turning point. The flow direction of the fluid will change rapidly near the turning point, which will lead to the sharp change of the physical properties of the fluid, as well as the local vortices and backflow of the fluid. Local vortices and backflow of the hot fluid will lead to stagnant regions of the fluid at the turning point, as shown in Figure 11. The mutual transformation of kinetic energy and potential energy will occur in the stagnant regions, which causes local changes in pressure.
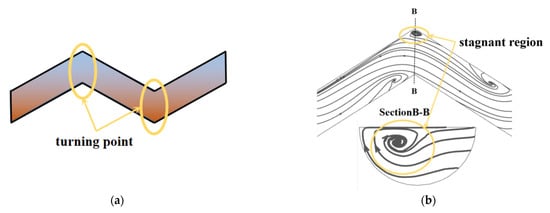
Figure 11.
Turning point and stagnant region: (a) Turning point; (b) Stagnant region.
The relationship between the pressure drop at the hot side and the angle θ of the spiral structure is shown in Figure 12. Like the cold side, increasing the rotation angle θ of the spiral structure will reduce the total pressure drop of the hot fluid. Compared with θ = 0°, the total pressure drop of hot side fluid decreases by 5.62%, 9.53%, 11.01%, and 12.67% respectively. The larger the rotation angle, the more obvious the degree of reduction in the pressure of the spiral structure. But the effect of reducing the pressure drop at the cold side is better than that at hot side, which is related to the different temperature distribution on the cold and hot sides.
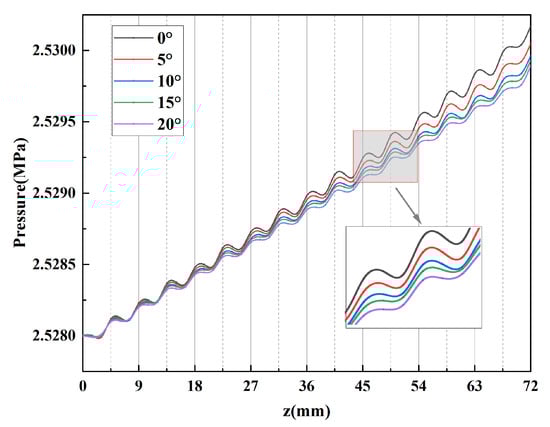
Figure 12.
Relationship between the hot side pressure drop and angle θ of spiral structure.
4.1.2. Changes of Nu Number and F Factor
Taking the spiral angle 0° (original structure) as the reference, the ratio of the average Nu number of different spiral angles θ to the average Nu number of the original structure is shown in Figure 13a. In the figure, the Nu at the cold side decreases gradually first and then almost unchanged and then decreases with the increase of the rotation angle θ of the spiral structure. Generally speaking, the increase of angle θ will inhibit the heat transfer of the fluid. For every 5° increase of angle θ, Nu number decreases by 1.65%, 3.12%, 0.29%, and 3.87%, respectively, compared with that at rotation angle 0°. The Nu number of the hot side gradually decreases with the increase of the rotation angle θ of the spiral structure. When the θ angle increases by every 5°, the Nu number decreases by 0.56%, 2.33%, 3.36%, 3.59%, respectively, compared with the rotation angle of 0°.
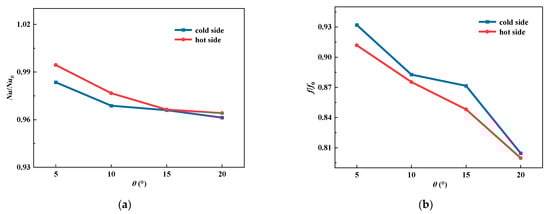
Figure 13.
Effects of angle θ of spiral structure on S-ZPCHE: (a) Relation between Nu number and angle θ of spiral structure; (b) Relation between f factor and angle θ of spiral structure.
Taking the spiral angle 0° (original structure) as the reference, the ratio of the average f factor of different spiral angles θ to the average f factor of the original structure is shown in Figure 13b. It can be clearly observed from the figure that with the increase of spiral angle, the value of the friction factor decreases gradually, that is to say, the pressure loss at the hot and cold sides decreases gradually. Compared with the average Nu number f factor at the cold and hot sides, it can be found that the f factor and Nu number at the cold side changes sharply, while the change at the hot side is gentle, which is due to the different physical properties of the cold and hot sides caused by the different boundary conditions of the cold and hot fluids.
4.1.3. Changes of PEC
As mentioned above, although the S-ZPCHE can reduce the value of the f factor and thus reduce the flow resistance, it will also slightly reduce the heat transfer coefficient, so the performance of S-ZPCHE can not be directly judged from the change of these two parameters. Therefore, performance evaluation criteria (PEC) [28] is used to comprehensively evaluate its performance from the perspectives of flow and heat transfer.
where, k is the k-th spiral structure, 0 is the spiral structure with a rotation angle of 0°.
The relationship between PEC and angle θ of the spiral structure is shown in Figure 14. The PEC of the new spiral structure is greater than that of the original structure, which proves that the comprehensive performance is better than that of the original structure, and the value of PEC is the largest when the spiral angle is 20°.
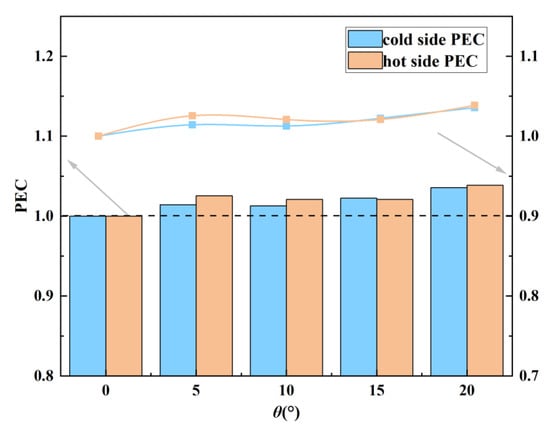
Figure 14.
Relation between PEC and angle θ of spiral structure.
In summary, considering the PEC at both sides of the cold and hot ends, the optimal structure is the one with a spiral angle of 20°. The pressure drops of the optimal structure at the cold and hot sides were found to be 13.32% and 12.67% lower than those of the original structure, respectively. In this case, the PEC at the cold and hot sides was found to be 1.036 and 1.038, respectively.
4.2. Analysis of Local Flow States between S-ZPCHE and Original Structure
According to the above analysis, an optimal spiral structure was obtained with a spiral angle of 20°. In order to further analyze the performance of the new structure, the local flow states of the original structure (0°) and the optimal structure (20°) were compared, so as to further study the reasons for the pressure loss reduction effect of the spiral structure.
The streamlines in the cross-sections perpendicular to the x-z plane at different distances from the cold fluid inlet are shown in Figure 15, where ①③⑤ are the turning sections, and ②④ are the non-turning sections. First, by comparison, the vortex and backflow at the turning point are more obvious, while the vortex at the non-turning point is very small or there is no vortex. Secondly, the positions of the vortices at the cold and hot sides are different through the longitudinal comparison, which is due to the counter-flow mode adopted by PCHE, and the initial flow direction of the fluid at the cold and hot sides is different. Finally, we see that the vortices are all in the non-high-speed zone.
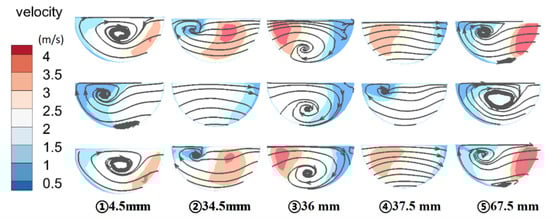
Figure 15.
Variation of streamlines in sections at different distances from the cold fluid inlet. (original structure: rotation angle θ = 0°).
To fully demonstrate the effect of the spiral structure on PCHE, the maximum rotation angle of 20° was taken as an example to show the streamline diagram of sections perpendicular to the x-z plane at different distances from the cold fluid inlet, as shown in Figure 16. In comparison with the rotation angle of 0°, as shown in Figure 15, the velocity contour with a rotation angle of 20° can be seen to have a more uniform distribution, with higher velocity in the low-speed area and smaller velocity span. Secondly, there is no vortex like that when it is 0° at the non-turning point ② and ④ of the pipe. It can be inferred from the above two points that the spiral structure can slow down the collision between fluids caused by vortices, so as to reduce the pressure loss.
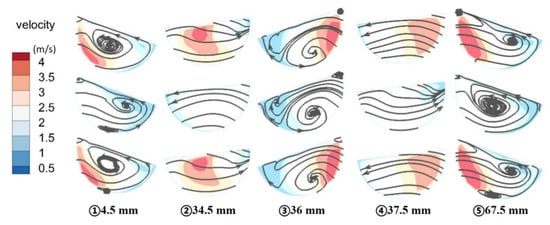
Figure 16.
Variation of streamlines on sections at different distances from the cold fluid inlet (optimum structure: rotation angle θ = 20°).
4.3. Effect of Mass Flow Rate on S-ZPCHE
To further study the thermal-hydraulic performance of the optimal S-ZPCHE under variable working conditions, the variation of f factor under different inlet Reynolds numbers was simulated, and the mass flow rate at hot and cold sides varied from 20 kg/h- to 100 kg/h.
The change of f factor with Reynolds number is shown in Figure 17. It can be seen in the figure that, with the increase of Reynolds number, the f factor presents a gradually increasing trend, with the change rates of the cold side being 262.80%, 114.27%, 72.09%, and 53.30% respectively, and the change rates of the hot side being 254.64%, 112.19%, 71.21%, and 52.11% respectively. The f factor of the new structure increases gradually with the Reynolds number, indicating that the effect of reducing pressure loss of the new S-ZPCHE is more obvious in the low Reynolds number regions.
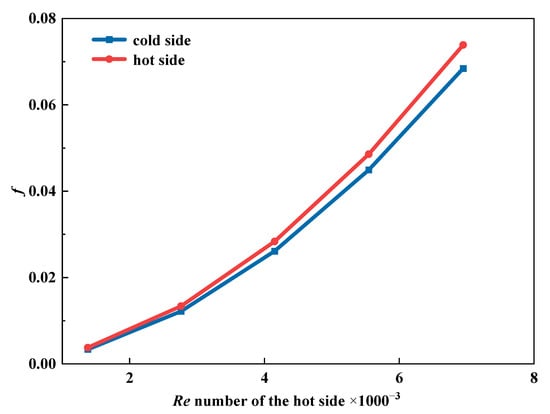
Figure 17.
The relationship between the f factor and Reynolds number of the hot side.
5. Conclusions
In this work, a new spiral Z-type PCHE is proposed based on the numerical simulation of the traditional Z-type PCHE. The contributions of this paper are as follows:
- (1)
- Based on the transformation of the traditional Z-type PCHE, a new spiral Z-type PCHE structure called S-ZPCHE was proposed, and five kinds of S-ZPCHE with different spiral angles were drawn.
- (2)
- The increase of the rotation angle θ of the spiral structure will reduce the total pressure drop in varying degrees, and the larger the rotation angle, the more obvious the reduction of pressure drop of spiral structure. The effect of reducing pressure drop at the cold side was found to be better than that at the hot side, and the pressure drops of the cold and hot sides were reduced by 10.62% and 9.71% on average, compared with the original structure. The pressure distribution of the fluid in the PCHE was found to not be linear, but in the form of fluctuating decline.
- (3)
- After considering the PEC at both the cold and hot sides, the comprehensive performance of PCHE with spiral rotation angle was found to be better than the original structure, and the optimal structure was found to be the one with a rotation angle of 20°. The hot and cold side pressure drops of the optimal structure decreased by 13.32% and 12.67% than the original structure, respectively. The hot and cold sides PEC of the optimal structure were found to be 1.038 and 1.036, respectively.
- (4)
- It was found that the spiral structure can inhibit the formation of vortices at the non turning point, thus reducing the pressure loss. However, the increase of the angle θ will inhibit the heat transfer of the fluid to a certain extent.
- (5)
- The performance of S-ZPCHE with the optimal rotation angle under variable conditions was studied. The f factor of the new structure was found to increase gradually with the Reynolds number, indicating that the effect of reducing pressure loss of the new S-ZPCHE is more obvious in the low Reynolds number regions.
Author Contributions
Conceptualization, T.X. and H.Z.; software, T.X., M.W. and J.Q.; data curation, T.X.; writing—original draft preparation, T.X.; writing—review and editing, T.X. and H.Z. All authors have read and agreed to the published version of the manuscript.
Funding
This research was funded by The National Natural Science Foundation of China, grant number 51776110.
Institutional Review Board Statement
Not applicable.
Informed Consent Statement
Not applicable.
Data Availability Statement
Not applicable.
Conflicts of Interest
The authors declare no conflict of interest.
Nomenclature
| A | Heat transfer area (m2) |
| cp | specific heat capacity (J kg−1 K−1) |
| D | hydraulic diameter (m) |
| e | enthalpy (J/kg) |
| f | friction factor |
| g | gravitational acceleration (m s−2) |
| h | heat transfer coefficient (W K−1 m−2) |
| mass flow rate (kg/s) | |
| N | N unit segments |
| Nu | Nusselt number |
| p | pressure (Pa) |
| Q | heat load (W) |
| T | temperature (K) |
| u | velocity vector (m s−1) |
| U | overall heat transfer coefficient (W K−1 m−2) |
| x | cartesian coordinate (mm) |
| Greek symbols | |
| ρ | density (kg/m3) |
| μ | dynamic viscosity (Pa·s) |
| λ | thermal conductivity (W m−1 K−1) |
| Φ | energy dissipation due to viscosity (J) |
| Subscript | |
| b | fluid |
| i, j | tensor indices |
| in | inlet of unit segment |
| m | logarithmic mean |
| t | turbulence |
| out | outlet of unit segment |
| wall | wall |
References
- Milani, D.; Luu, M.T.; Mcnaughton, R.; Abbas, A. Optimizing an advanced hybrid of solar-assisted supercritical CO2 Brayton cycle: A vital transition for low-carbon power generation industry. Energy Convers. Manag. 2017, 148, 1317–1331. [Google Scholar] [CrossRef]
- Garg, P. Supercritical carbon dioxide Brayton cycle for concentrated solar power. J. Supercrit. Fluids 2013, 76, 54–60. [Google Scholar] [CrossRef]
- Guo, Z.; Zhao, Y.; Zhu, Y.; Niu, F.; Lu, D. Optimal design of supercritical CO2 power cycle for next generation nuclear power conversion systems. Prog. Nucl. Energy 2018, 108, 111–121. [Google Scholar] [CrossRef]
- Hu, L.; Chen, D.; Huang, Y.; Li, L.; Cao, Y.; Yuan, D.; Wang, J.; Pan, L. Investigation on the performance of the supercritical Brayton cycle with CO2-based binary mixture as working fluid for an energy transportation system of a nuclear reactor. Energy 2015, 89, 874–886. [Google Scholar] [CrossRef]
- Manente, G.; Fortuna, F.M. Supercritical CO2 power cycles for waste heat recovery: A systematic comparison between traditional and novel layouts with dual expansion. Energy Convers. Manag. 2019, 197, 111777. [Google Scholar] [CrossRef]
- Isaka, B.A.; Ranjith, P.G.; Rathnaweera, T.D. The use of super-critical carbon dioxide as the working fluid in enhanced geothermal systems (EGSs): A review study. Sustain. Energy Technol. Assess. 2019, 36, 100547. [Google Scholar]
- Ahn, Y.; Lee, J.; Kim, S.G.; Lee, J.I.; Cha, J.E.; Lee, S.W. Design consideration of supercritical CO2 power cycle integral experiment loop. Energy 2015, 86, 115–127. [Google Scholar] [CrossRef]
- Milani, D.; Luu, M.T.; Mcnaughton, R.; Abbas, A. A comparative study of solar heliostat assisted supercritical CO2 recompression Brayton cycles: Dynamic modelling and control strategies. J. Supercrit. Fluids 2017, 120, 113–124. [Google Scholar] [CrossRef]
- Dong, A. Design analysis of printed circuit heat exchanger. Energy Conserv. Technol. 2019, 37, 76–79. [Google Scholar]
- Xu, X.; Ma, T.; Li, L.; Zeng, M.; Chen, Y.; Huang, Y.; Wang, Q. Optimization of fin arrangement and channel configuration in an airfoil fin PCHE for supercritical CO2 cycle. Appl. Therm. Eng. 2014, 70, 867–875. [Google Scholar] [CrossRef]
- Dostal, V. A Supercritical Carbon Dioxide Cycle for Next Generation Nuclear Reactors; Massachusetts Institute of Technology: Cambridge, UK, 2004; Volume 154, pp. 265–282. [Google Scholar]
- Meshram, A.; Jaiswal, A.K.; Khivsara, S.D.; Ortega, J.D.; Ho, C.; Bapat, R.; Dutta, P. Modeling and analysis of a printed circuit heat exchanger for supercritical CO2 power cycle applications. Appl. Therm. Eng. 2016, 109, 861–870. [Google Scholar] [CrossRef] [Green Version]
- Yang, Y.; Li, H.; Yao, M.; Gao, W.; Zhang, Y.; Zhang, L. Investigation on the effects of narrowed channel cross-sections on the heat transfer performance of a wavy-channeled PCHE. Int. J. Heat Mass Transf. 2019, 135, 33–43. [Google Scholar] [CrossRef]
- Liu, G.; Huang, Y.; Wang, J. A review on the thermal-hydraulic performance and optimization of printed circuit heat exchangers for supercritical CO2 in advanced nuclear power systems. Renew. Sustain. Energy Rev. 2020, 133, 110290. [Google Scholar] [CrossRef]
- Nikitin, K.; Kato, Y.; Ngo, L. Printed circuit heat exchanger thermal-hydraulic performance in supercritical CO2 experimental loop. Int. J. Refrig. 2006, 29, 807–814. [Google Scholar] [CrossRef]
- Lee, S.M.; Kim, K.Y. Optimization of zigzag flow channels of a printed circuit heat exchanger for nuclear power plant application. J. Nucl. Sci. Technol. 2012, 49, 343–351. [Google Scholar] [CrossRef] [Green Version]
- Serrano, I.P.; Cantizano, A.; Linares, J.I.; Moratilla, B.Y.; Fernandez-Berceruelo, I.; Sedano, L. Numerical modeling and design of supercritical CO2 pre-cooler for fusion nuclear reactors. Fusion Eng. Des. 2012, 87, 1329–1332. [Google Scholar] [CrossRef]
- Saeed, M.; Kim, M. Thermal–hydraulic analysis of sinusoidal fin-based printed circuit heat exchangers for supercritical CO2 Brayton cycle. Energy Convers. Manag. 2019, 193, 124–139. [Google Scholar] [CrossRef]
- Yang, Y.; Li, H.; Yao, M.; Zhang, Y.; Zhang, C.; Zhang, L.; Wu, S. Optimizing the size of a printed circuit heat exchanger by multi-objective genetic algorithm. Appl. Therm. Eng. 2020, 167, 114811. [Google Scholar] [CrossRef]
- Jing, Q.; Xie, Y.H.; Zhang, D. Thermal hydraulic performance of printed circuit heat exchanger with various channel confifigurations and arc ribs for SCO2 Brayton cycle. Int. J. Heat Mass Transf. 2020, 150, 119272. [Google Scholar] [CrossRef]
- Tang, H.; Cui, L.; Sunden, B. Optimization of fifin confifigurations and layouts in a printed circuit heat exchanger for supercritical liquefified natural gas near the pseudo-critical temperature. Appl. Therm. Eng. 2020, 172, 115131. [Google Scholar] [CrossRef]
- Bennett, K.; Chen, Y. A two-level Plackett-Burman non-geometric experimental design for main and two factor interaction sensitivity analysis of zigzag-channel PCHEs. Therm. Sci. Eng. Prog. 2019, 11, 167–194. [Google Scholar] [CrossRef]
- Aneesh, A.M.; Sharma, A.; Vyas, K.N.; Chaudhuri, P.; Srivastava, A. Thermal-hydraulic characteristics and performance of 3D straight channel based printed circuit heat exchanger. Appl. Therm. Eng. 2016, 98, 474–482. [Google Scholar] [CrossRef]
- Ishizuka, T. Thermal-hydraulic characteristics of a printed circuit heat exchanger in a supercritical CO2 loop. In Proceedings of the 11th International Topical Meeting on Nuclear Reactor Thermal-Hydraulic, Avignon, France, 2–6 October 2005; pp. 218–232. [Google Scholar]
- Kim, D.E.; Kim, M.H.; Cha, J.E.; Kim, S.O. Numerical investigation on thermal-hydraulic performance of new printed circuit heat exchanger model. Nucl. Eng. Des. 2008, 238, 3269–3276. [Google Scholar] [CrossRef]
- Nellis, G.K.S. Heat Transfer; Cambridge University Press: Cambridge, UK, 2008. [Google Scholar]
- Kim, I.H.; No, H.C. Thermal hydraulic performance analysis of a printed circuit heat exchanger using a helium-water test loop and numerical simulation. Appl. Therm. Eng. 2011, 31, 4064–4073. [Google Scholar] [CrossRef]
- Saeed, M.; Kim, M. Thermal and hydraulic performance of SCO2 PCHE with different fin configurations. Appl. Therm. Eng. 2017, 127, 975–985. [Google Scholar] [CrossRef]
Publisher’s Note: MDPI stays neutral with regard to jurisdictional claims in published maps and institutional affiliations. |
© 2021 by the authors. Licensee MDPI, Basel, Switzerland. This article is an open access article distributed under the terms and conditions of the Creative Commons Attribution (CC BY) license (https://creativecommons.org/licenses/by/4.0/).