
Parametric Study of a Long-Duration Energy Storage Using Pumped-Hydro and Carbon Dioxide Transcritical Cycles


Abstract
:1. Introduction
2. System Description
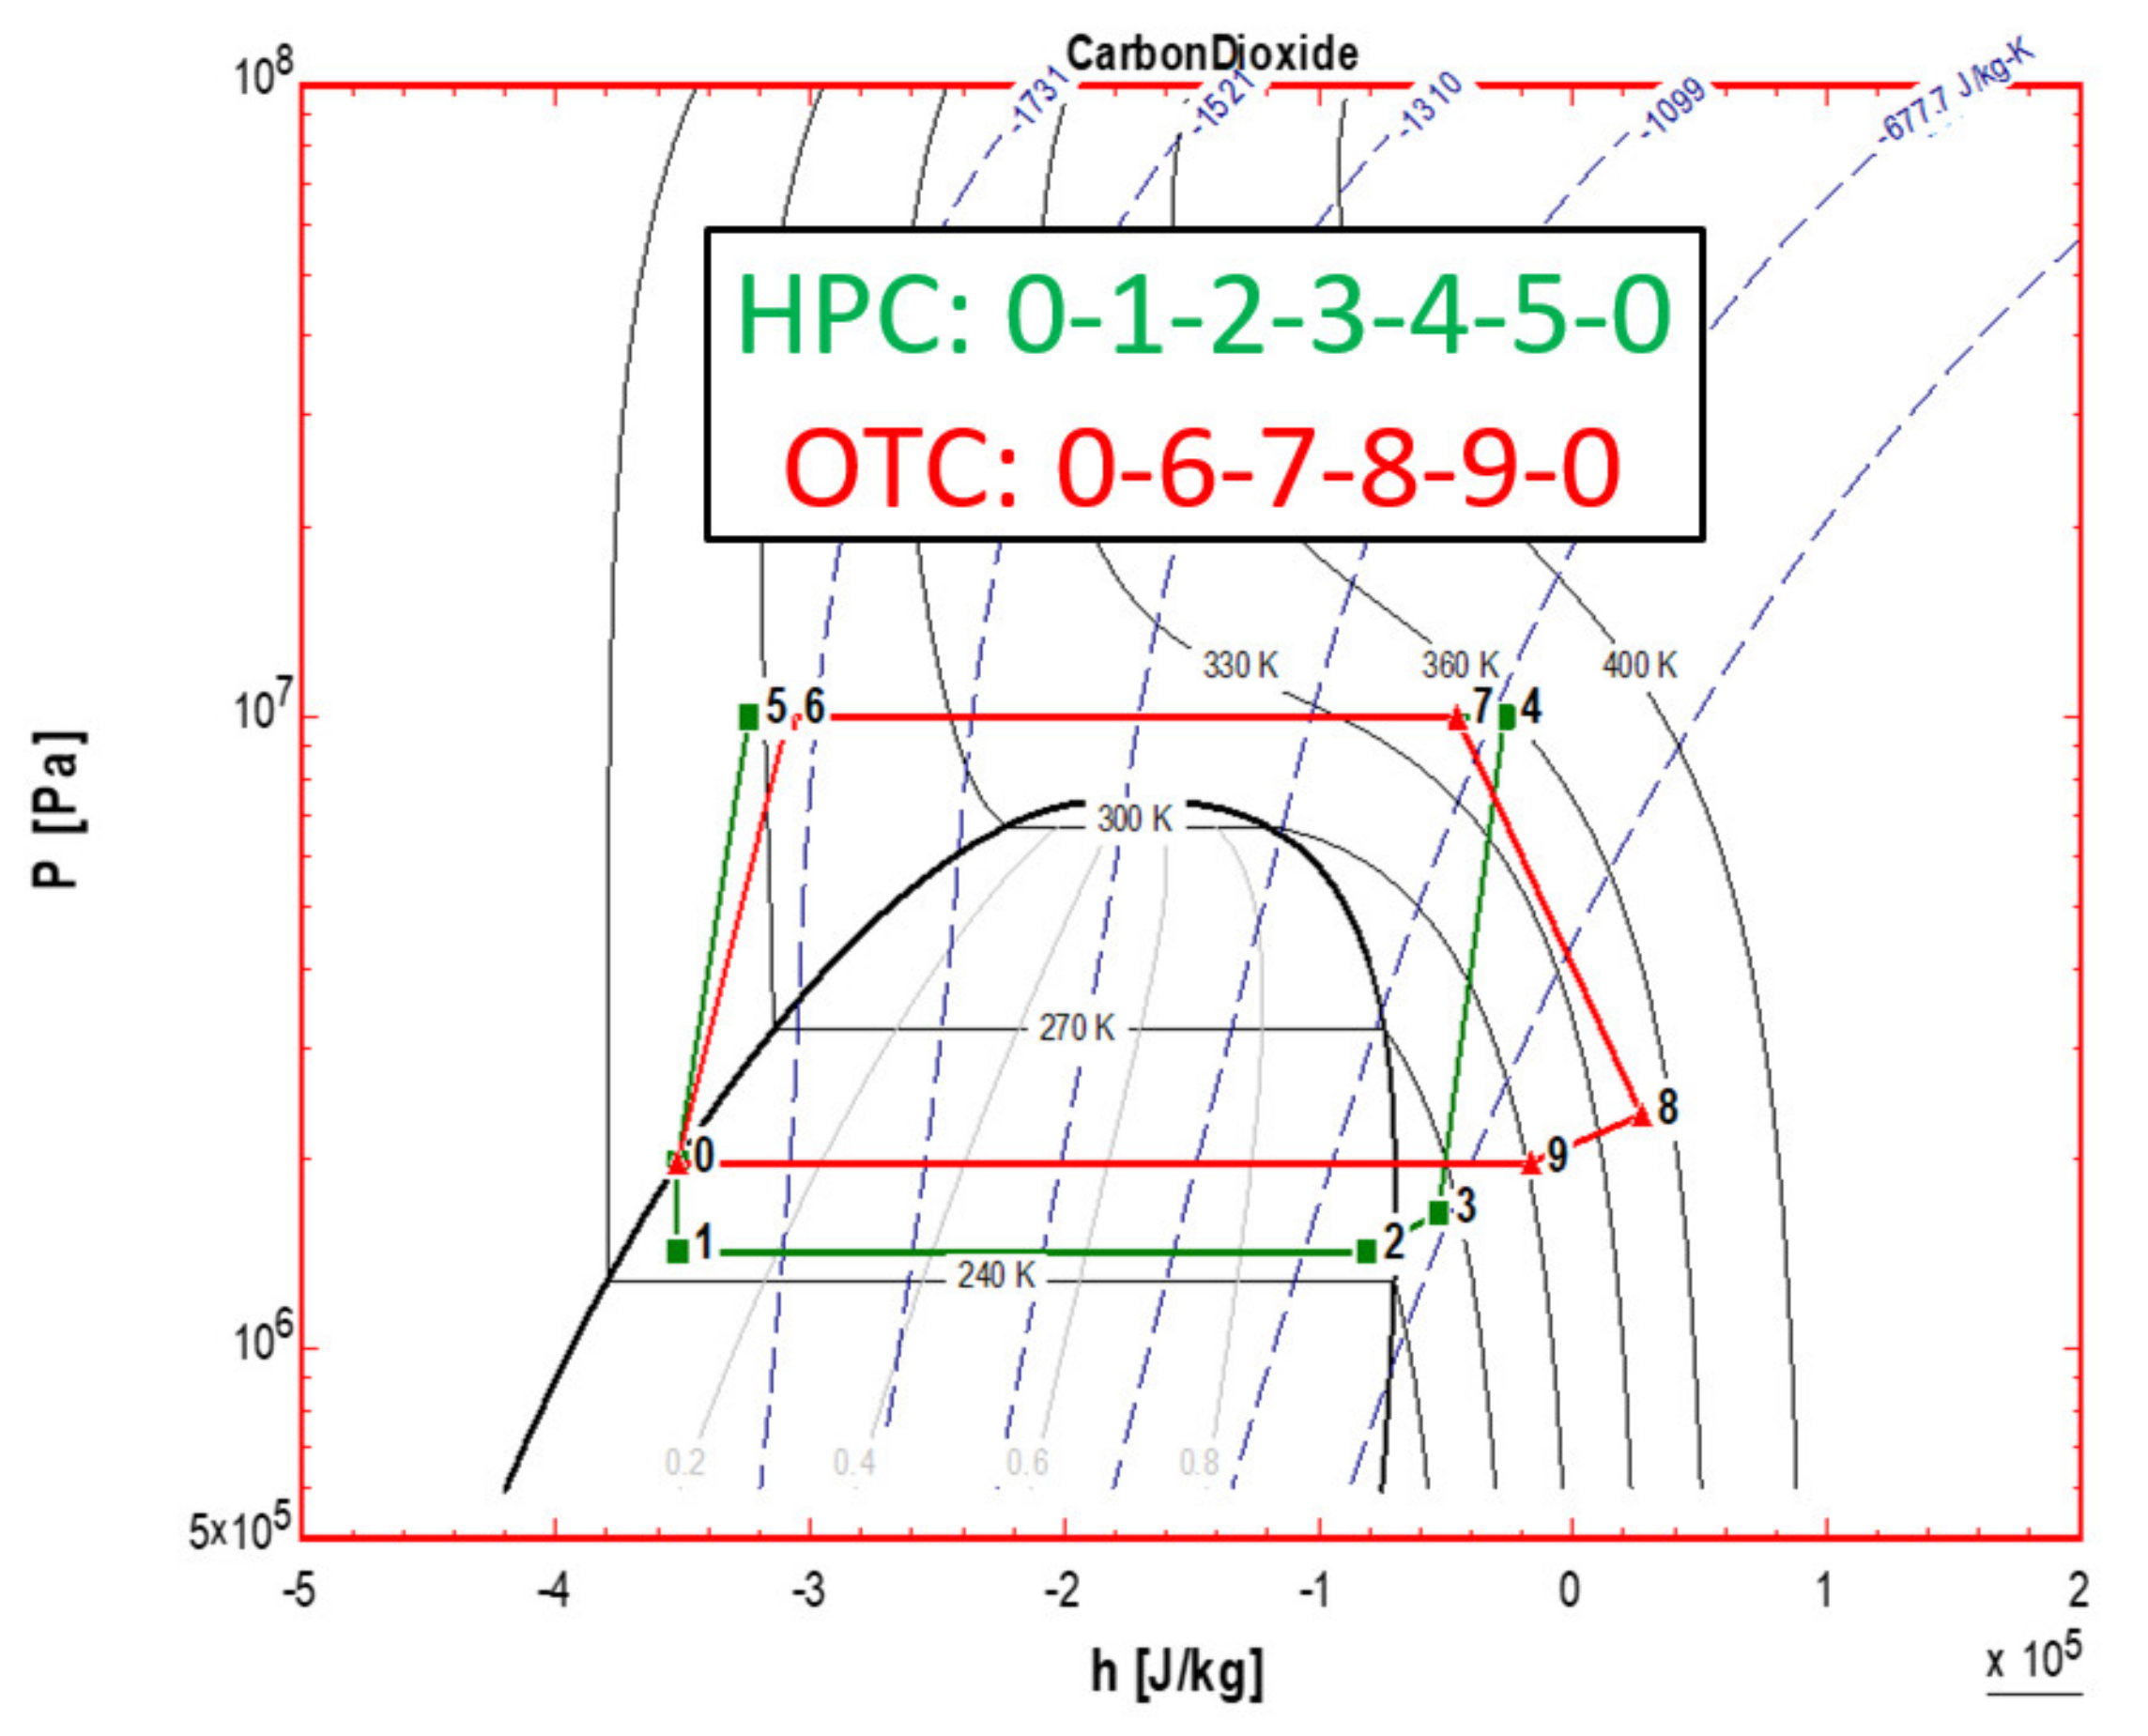
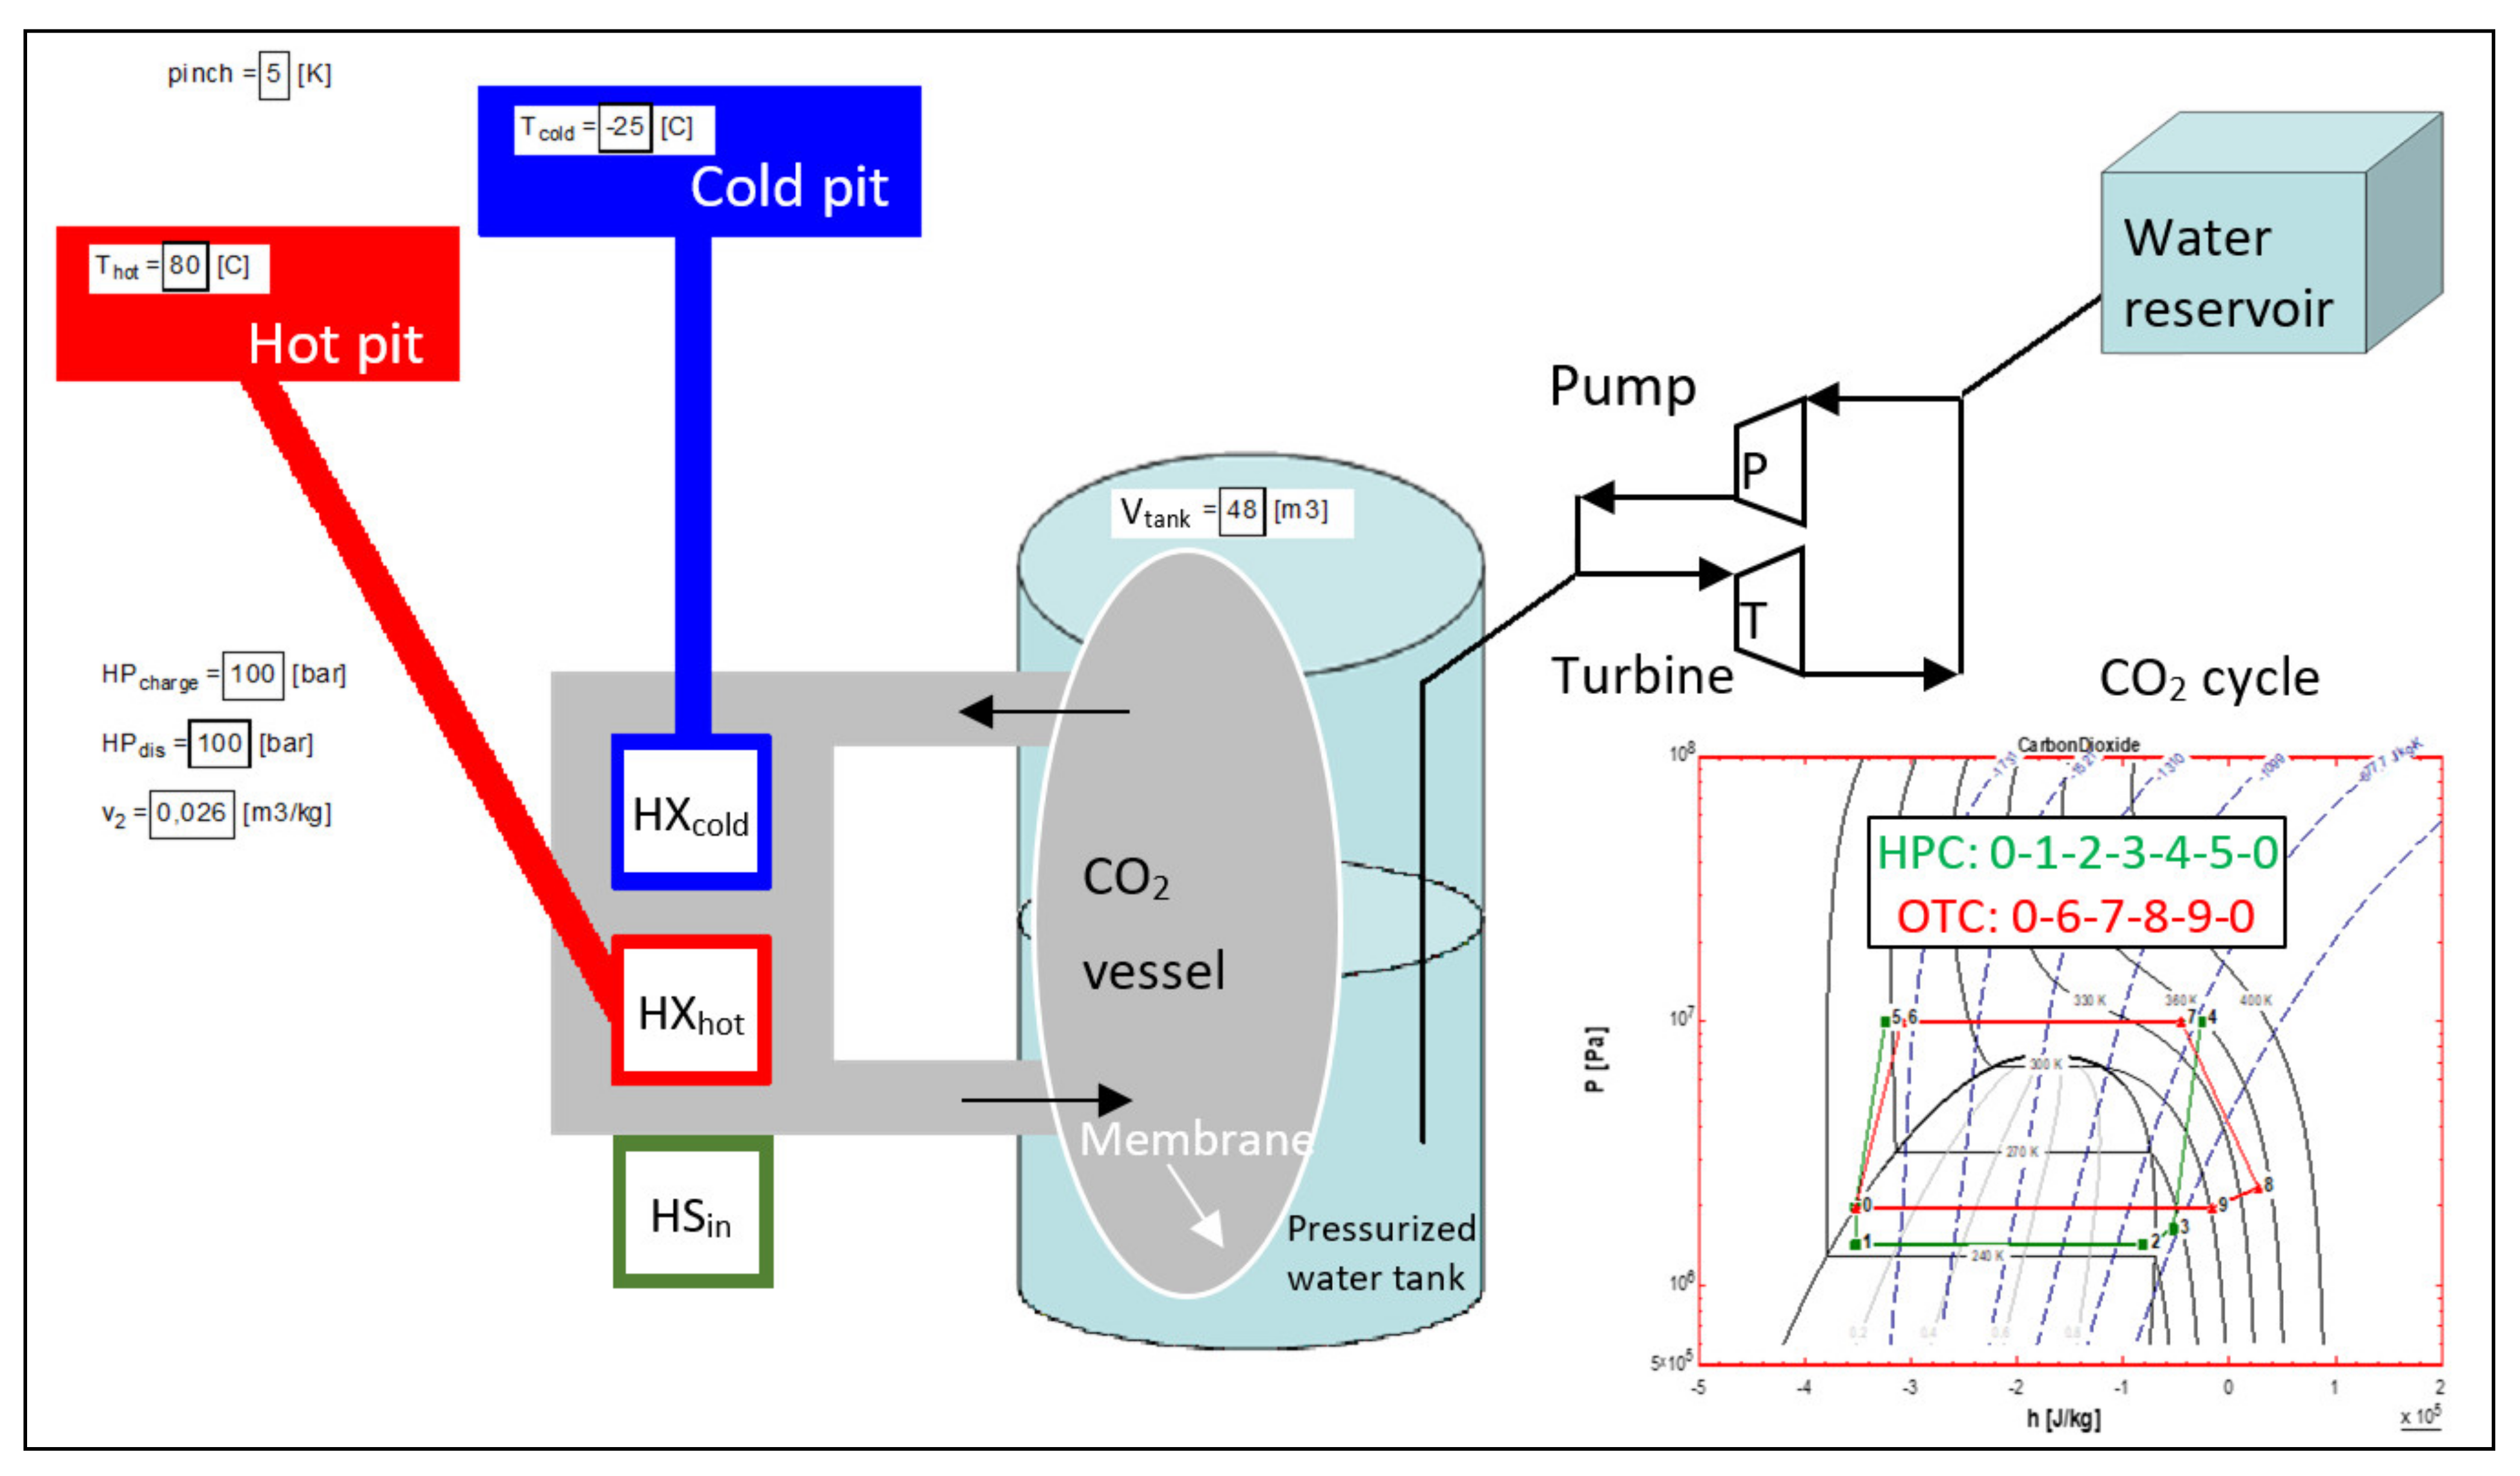
2.1. Heat Pump Cycle
- From point 0 to point 1, CO2 undergoes an isenthalpic expansion by letting water out of the pressurised water tank until the CO2 temperature reaches the cold pit temperature minus the temperature pinch;
- From point 1 to point 2, more water is expelled from the pressurised tank. CO2 is circulated in the cold heat exchanger to store cold energy in the cold pit until the membrane is completely inflated;
- From point 2 to point 3, CO2 recovers heat from the internal heat storage HSin;
- From point 3 to point 4, CO2 is compressed by using the water pump to fill up the pressurised water tank. The high pressure and a temperature equal to the one of the hot pit plus the temperature pinch define point 4;
- From point 4 to point 5, CO2 undergoes an isobaric compression thanks to the pressurised tank filling. The hot pit is designed as being thermally stratified. The heat produced during this compression is transferred to different heights of the hot pit depending on the evolution of the CO2 temperature;
- From point 5 to point 0, CO2 stores heat in the internal heat storage HSin.
2.2. Organic Transcritical Cycle
- From point 0 to point 6, heat is recovered from the ancillary internal heat storage;
- From point 6 to point 7, heat from the hot pit is gradually transferred to the CO2, undergoing an expansion. Water is ejected from the tank and flows through the electrical turbine, generating work. Point 7 is defined by a temperature equal to the one of the hot pit minus the temperature pinch;
- From point 7 to point 8, CO2 expansion continues until the maximum specific volume is reached;
- From point 8 to point 9, heat is stored in the ancillary internal heat storage;
- From point 9 to point 0, CO2 is condensed using cold energy from the cold pit.
2.3. Key Performance Indicators
2.4. System Pre-Sizing and Specifications
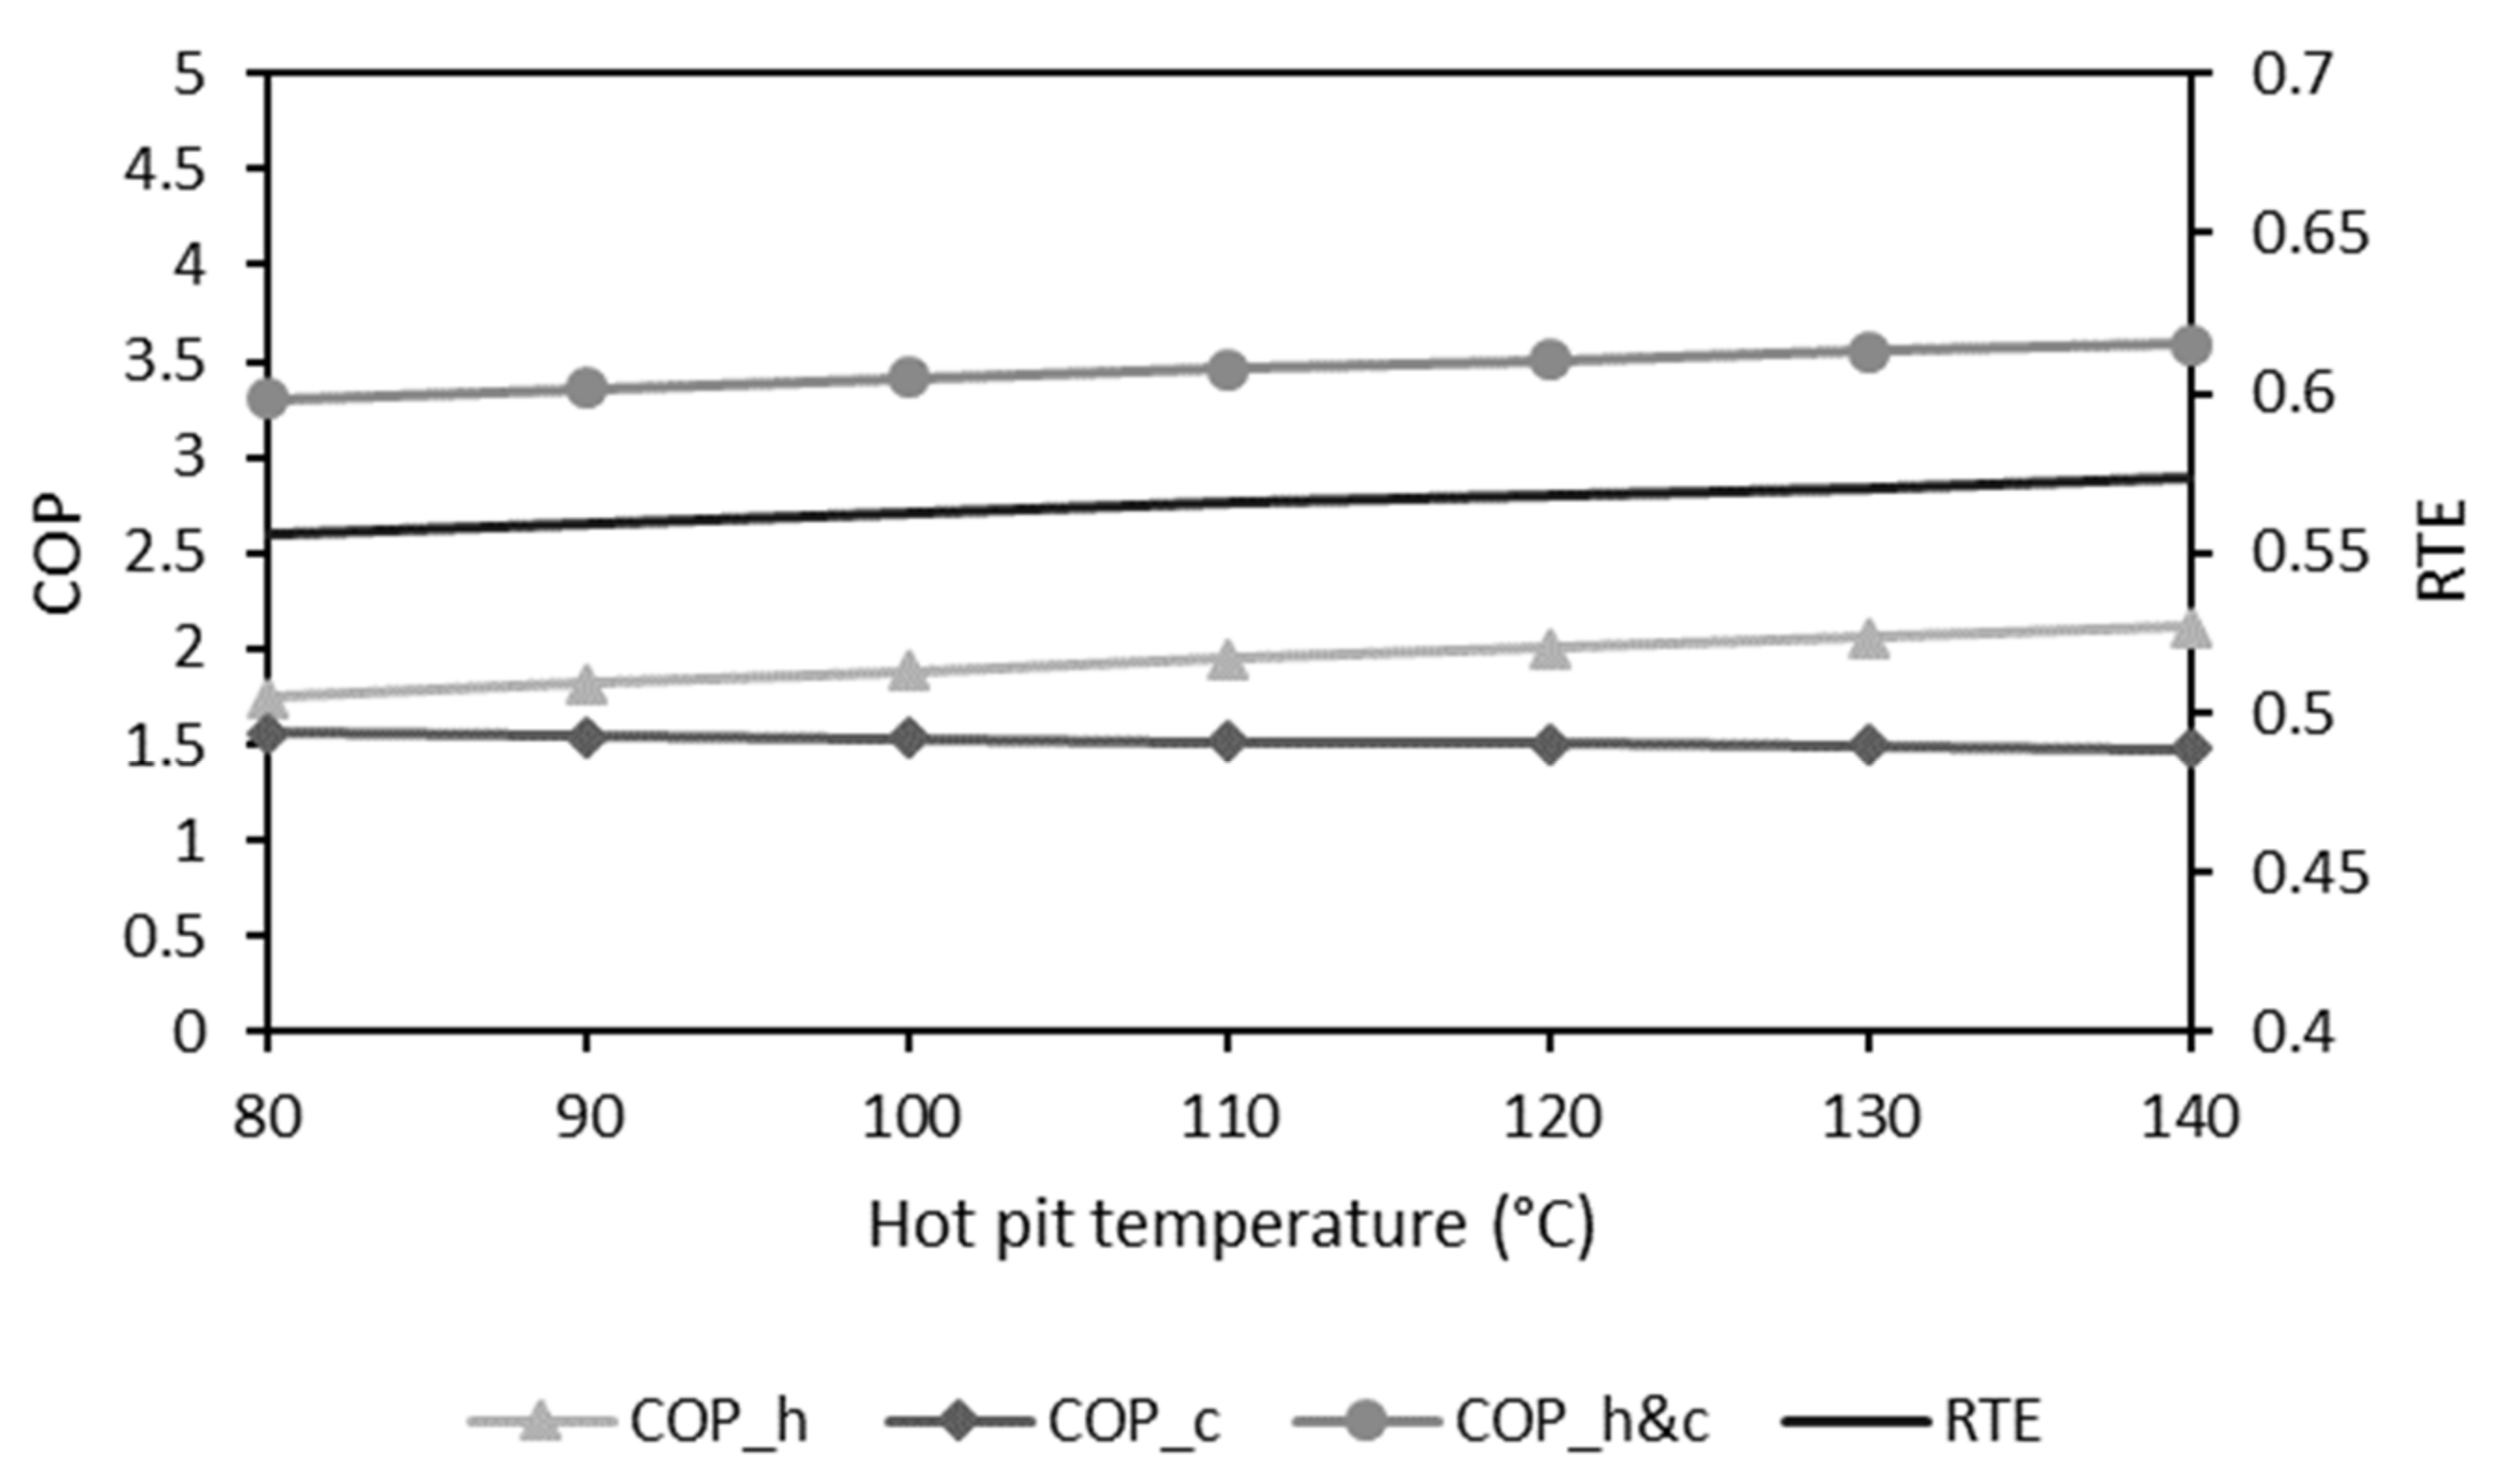
3. Results and Discussion
4. Conclusions
- Superheating or subcooling is unnecessary. There is no irreversibility linked to these transformations;
- An isothermal compression can be achieved thanks to the availability of significant heat exchanges during the CO2 multiphasic volume variation.
Author Contributions
Funding
Conflicts of Interest
Nomenclature
| Latin letters: | |
| COP | Coefficient of performance |
| H | Enthalpy (J) |
| Q | Thermal energy (J) |
| W | Work (J) |
| f | Factor |
| Greek letters: | |
| Δ | Variation |
| η | Efficiency |
| Subscripts: | |
| c | cooling |
| h | heating |
| h&c | simultaneous heating and cooling |
| ub | unbalance |
References
- Bellal, A. Environnement et Energie, Comprendre Pour Débattre et Agir; Le Temps Des Cerises: Montreuil, France, 2016; ISBN 9782370710925. [Google Scholar]
- Ram, M.; Bogdanov, D.; Aghahosseini, A.; Gulagi, A.; Oyewo, A.S.; Child, M.; Caldera, U.; Sadovskaia, K.; Farfan, J.; Barbosa, L.S.N.S.; et al. Global Energy System Based on 100% Renewable Energy–Energy Transition in Europe Across Power, Heat, Transport and Desalination Sectors; Lappeenranta University of Technology Research Reports 89; LUT University: Lappeenranta, Finland; Energy Watch Group: Berlin, Germany, 2018; ISBN 978-952-335-329-9. ISSN 2243-3376. [Google Scholar]
- International Energy Agency. The Future of Cooling; OECD: Paris, France, 2018. [Google Scholar]
- Rahman, M.M.; Gemechu, E.; Oni, A.O.; Kumar, A. The development of a techno-economic model for the assessment of the cost of flywheel energy storage systems for utility-scale stationary applications. Sustain. Energy Technol. Assess. 2021, 47, 101382. [Google Scholar]
- Barnhart, C.J.; Benson, S.M. On the importance of reducing the energetic and material demands of electrical energy storage. Energy Environ. Sci. 2013, 6, 1083–1092. [Google Scholar] [CrossRef]
- Hunt, J.D.; Zakeri, B.; Lopes, R.; Barbosa, P.S.F.; Nascimento, A.; Castro, N.J.D.; Brandão, R.; Schneider, P.S.; Wada, Y. Existing and new arrangements of pumped-hydro storage plants. Renew. Sustain. Energy Rev. 2020, 129, 109914. [Google Scholar] [CrossRef]
- Cavazzini, G.; Houdeline, J.B.; Pavesi, G.; Teller, O.; Ardizzon, G. Unstable behaviour of pump-turbines and its effects on power regulation capacity of pumped-hydro energy storage plants. Renew. Sustain. Energy Rev. 2018, 94, 399–409. [Google Scholar] [CrossRef]
- Pujades, E.; Willems, T.; Bodeux, S.; Orban, P.; Dassargues, A. Underground pumped storage hydroelectricity using abandoned works (deep mines or open pits) and the impact on groundwater flow. Hydrogeol. J. 2016, 24, 1531–1546. [Google Scholar] [CrossRef] [Green Version]
- Connolly, D.; Lund, H.; Finn, P.; Mathiesen, B.V.; Leahy, M. Practical operation strategies for pumped hydroelectric energy storage (PHES) utilising electricity price arbitrage. Energy Policy 2011, 39, 4189–4196. [Google Scholar] [CrossRef] [Green Version]
- Olabi, A.G.; Wilberforce, T.; Ramadan, M.; Abdelkareem, M.A.; Alami, A.H. Compressed air energy storage systems: Components and operating parameters–A review. J. Energy Storage 2021, 34, 102000. [Google Scholar] [CrossRef]
- Tallini, A.; Vallati, A.; Cedola, L. Applications of micro-CAES systems: Energy and economic analysis. Energy Procedia 2015, 82, 797–804. [Google Scholar] [CrossRef] [Green Version]
- Bi, J.; Jiang, T.; Chen, W.; Ma, X. Research on storage capacity of compressed air pumped hydro energy storage equipment. Energy Power Eng. 2013, 5, 26–30. [Google Scholar] [CrossRef]
- Odukomaiya, A.; Abu-Heiba, A.; Gluesenkamp, K.R.; Abdelaziz, O.; Jackson, R.K.; Daniel, C.; Graham, S.; Momen, A.M. Thermal analysis of near-isothermal compressed gas energy storage system. Appl. Energy 2016, 179, 948–960. [Google Scholar] [CrossRef]
- Dib, G.; Haberschill, P.; Rullière, R.; Perroit, Q.; Davies, S.; Revellin, R. Thermodynamic simulation of a micro advanced adiabatic compressed air energy storage for building application. Appl. Energy 2020, 260, 114248. [Google Scholar] [CrossRef]
- Kandezi, M.S.; Naeenian, S.M.M. Investigation of an efficient and green system based on liquid air energy storage (LAES) for district cooling and peak shaving: Energy and exergy analyses. Sustain. Energy Technol. Assess. 2021, 47, 101396. [Google Scholar]
- Steinmann, W.D.; Bauer, D.; Jockenhöfer, H.; Johnson, M. Pumped thermal energy storage (PTES) as smart sector-coupling technology for heat and electricity. Energy 2019, 183, 185–190. [Google Scholar] [CrossRef]
- Mercangöz, M.; Hemrle, J.; Kaufmann, L.; Z’Graggen, A.; Ohler, C. Electrothermal energy storage with transcritical CO2 cycles. Energy 2012, 45, 407–415. [Google Scholar] [CrossRef]
- McTigue, J.D.; White, A.J.; Markides, C.N. Parametric studies and optimisation of pumped thermal electricity storage. Appl. Energy 2015, 137, 800–811. [Google Scholar] [CrossRef] [Green Version]
- Georgiou, S.; Shah, N.; Markides, C.N. A thermo-economic analysis and comparison of pumped-thermal and liquid-air electricity storage systems. Appl. Energy 2018, 226, 1119–1133. [Google Scholar] [CrossRef]
- Siemens-Gamesa Electric Thermal Energy Storage. Available online: https://deepresource.wordpress.com/2019/06/17/siemens-gamesa-electric-thermal-energy-storage (accessed on 17 October 2020).
- Hu, G.; Chen, C.; Lu, H.T.; Wu, Y.; Liu, C.; Tao, L.; Men, Y.; He, G.; Li, K.G. A review of technical advances, barriers, and solutions in the Power to Hydrogen (P2H) roadmap. Engineering 2020, 6, 1364–1380. [Google Scholar] [CrossRef]
- Lalanne, P.; Byrne, P. Large-scale pumped thermal electricity storages—Converting energy using shallow lined rock caverns, carbon dioxide and underground pumped-hydro. Appl. Sci. 2019, 9, 4150. [Google Scholar] [CrossRef] [Green Version]
- Guddat, M. Chapter 140 Seasonal Heat Storage. In Technology Data-Energy Storage; Danish Energy Agency and Energinet: Copenhagen, Denmark, 2018. [Google Scholar]
- Klein, S.A. Engineering Equation Solver, @1992–2020; Academic Professional Version V10.834-3D; F-Chart Software, LLC: Madison, WI, USA, 2020. [Google Scholar]
- Sanz Garcia, L.; Jacquemoud, E.; Jenny, P. Thermo-economic heat exchanger optimization for electro-thermal energy storage based on transcritical CO2 cycles. In Proceedings of the 3rd European Supercritical CO2 Conference, Paris, France, 19–20 September 2019. [Google Scholar]
- Aghagoli, A.; Sorin, M. CFD modelling and exergy analysis of a heat pump cycle with Tesla turbine using CO2 as a working fluid. Appl. Therm. Eng. 2020, 178, 115587. [Google Scholar] [CrossRef]


| System | Article | Power | Energy Storage | RTE | Lifetime |
|---|---|---|---|---|---|
| Flywheel | Rahman et al. [4] | 20 MW | 5 MWh | 90% | 15–20 years |
| Batteries | Barnhart and Benson [5] | Not provided | 4–12 h | 75–90% | 3–7 years |
| Odukomaiya et al. [13] | kW–MW scale | 180–1800 MJ/m3 | 63–90% | 3–16 years | |
| Flow batteries | Barnhart and Benson [5] | Not provided | 4–12 h | 64–71% | 3–7 years |
| PHES | Hunt et al. [6] | 100 MW | 1 day-several years | Not provided | Not provided |
| Cavazzini [7] | Over 7400 MW cumulated in recent years | Not provided | 65–80% | Not provided | |
| Pujades et al. [8] | Not provided | Up to 2 days | Not provided | Not provided | |
| Connolly et al. [9] | 360 MW pump 300 MW turbine | 2 GWh | 85% (92% pumping 92% generating) | 40 years | |
| Odukomaiya et al. [13] | GW scale | 0.72–7.2 MJ/m3 | 65–87% | 30–50 years | |
| CAES | Olabi et al. [10] | 3 kW–1 GW | 100 kWh–1 GWh | 40–70% | 20–40 years |
| Odukomaiya et al. [13] | kW–GW scale | 7.221.6 + MJ/m3 | 30–70% | 20–40 years | |
| Tallini et al. [11] | 33–100 kW | Not provided | Not provided | Payback period of 5 years | |
| CAES-PHES | Bi et al. [12] | Not provided | Not provided | 21.7–22.6% | Long |
| Odukomaiya et al. [13] | 3 kW | 2.46–3.59 MJ/m3 | 66–82% | Not provided | |
| AA-CAES | Dib et al. [14] | 23.5 kW | 188 kWh 54.6 MJ/m3 | 33.7% | 20 years |
| LAES | Kandezi et al. [15] | 5300 kW | 762 MJ/m3 | 65.7% | 25 years |
| Georgiou et al. [19] | 12 MW | 50 MWh | 55% | 30 years | |
| PTES | Steinmann et al. [16] | Multi-MW | Up to 200,000 m3 | 70% | 20–30 years |
| Mercangöz et al. [17] | 50 MW | 1 MWh | 65% | Not provided | |
| McTigue et al. [18] | 2 MW | 200 MJ/m3 | 70% | Not provided | |
| Georgiou et al. [19] | 2 MW | 11.5 MWh | 75% | 30 years | |
| Siemens Gamesa [20] | 100 MW | 130 MWh | 50% | Not provided | |
| Hydrogen and synthesised fuels | Hu et al. [21] | 7 kW–1 MW | 2360–4600 MJ/m3 | 19–45% | 10 years fuel cell 50 years |
| Variable | Default Value | Interval |
|---|---|---|
| Hot pit temperature | 80 °C | 80 to 140 °C |
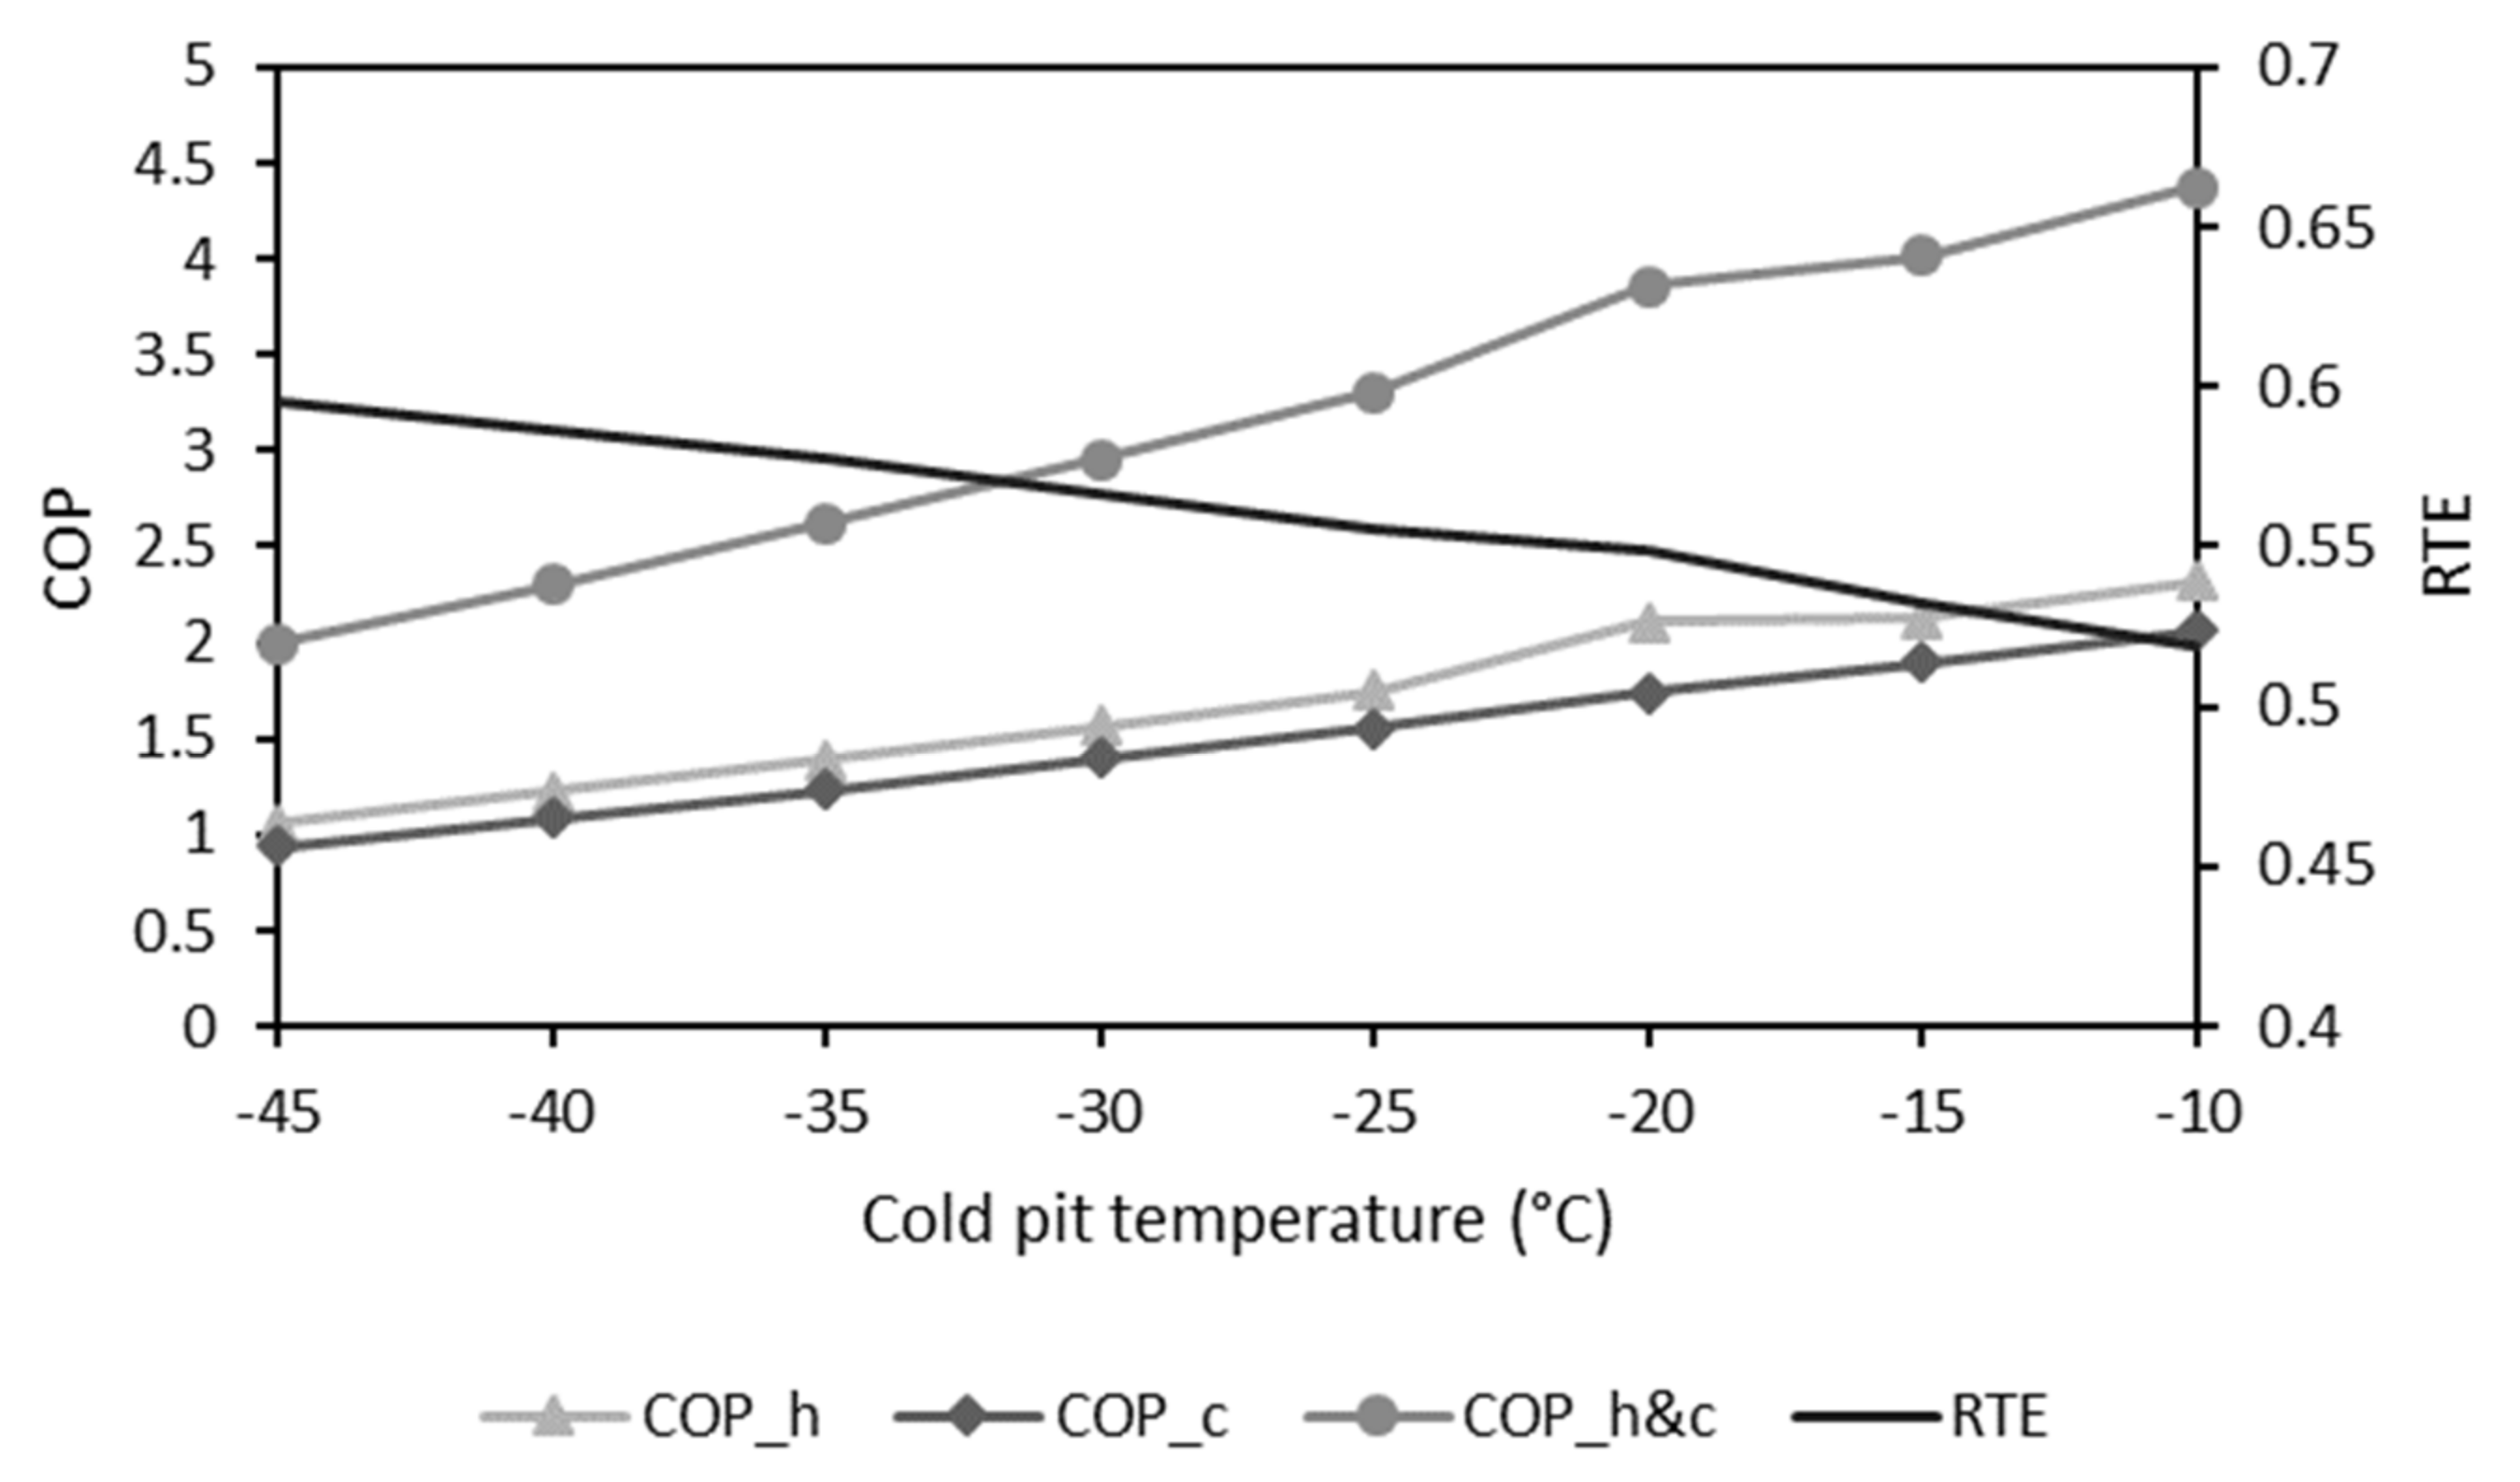
| Cold pit temperature | −25 °C | −45 to −10 °C |
| High-side pressure | 100 bar | 80 to 140 bar |
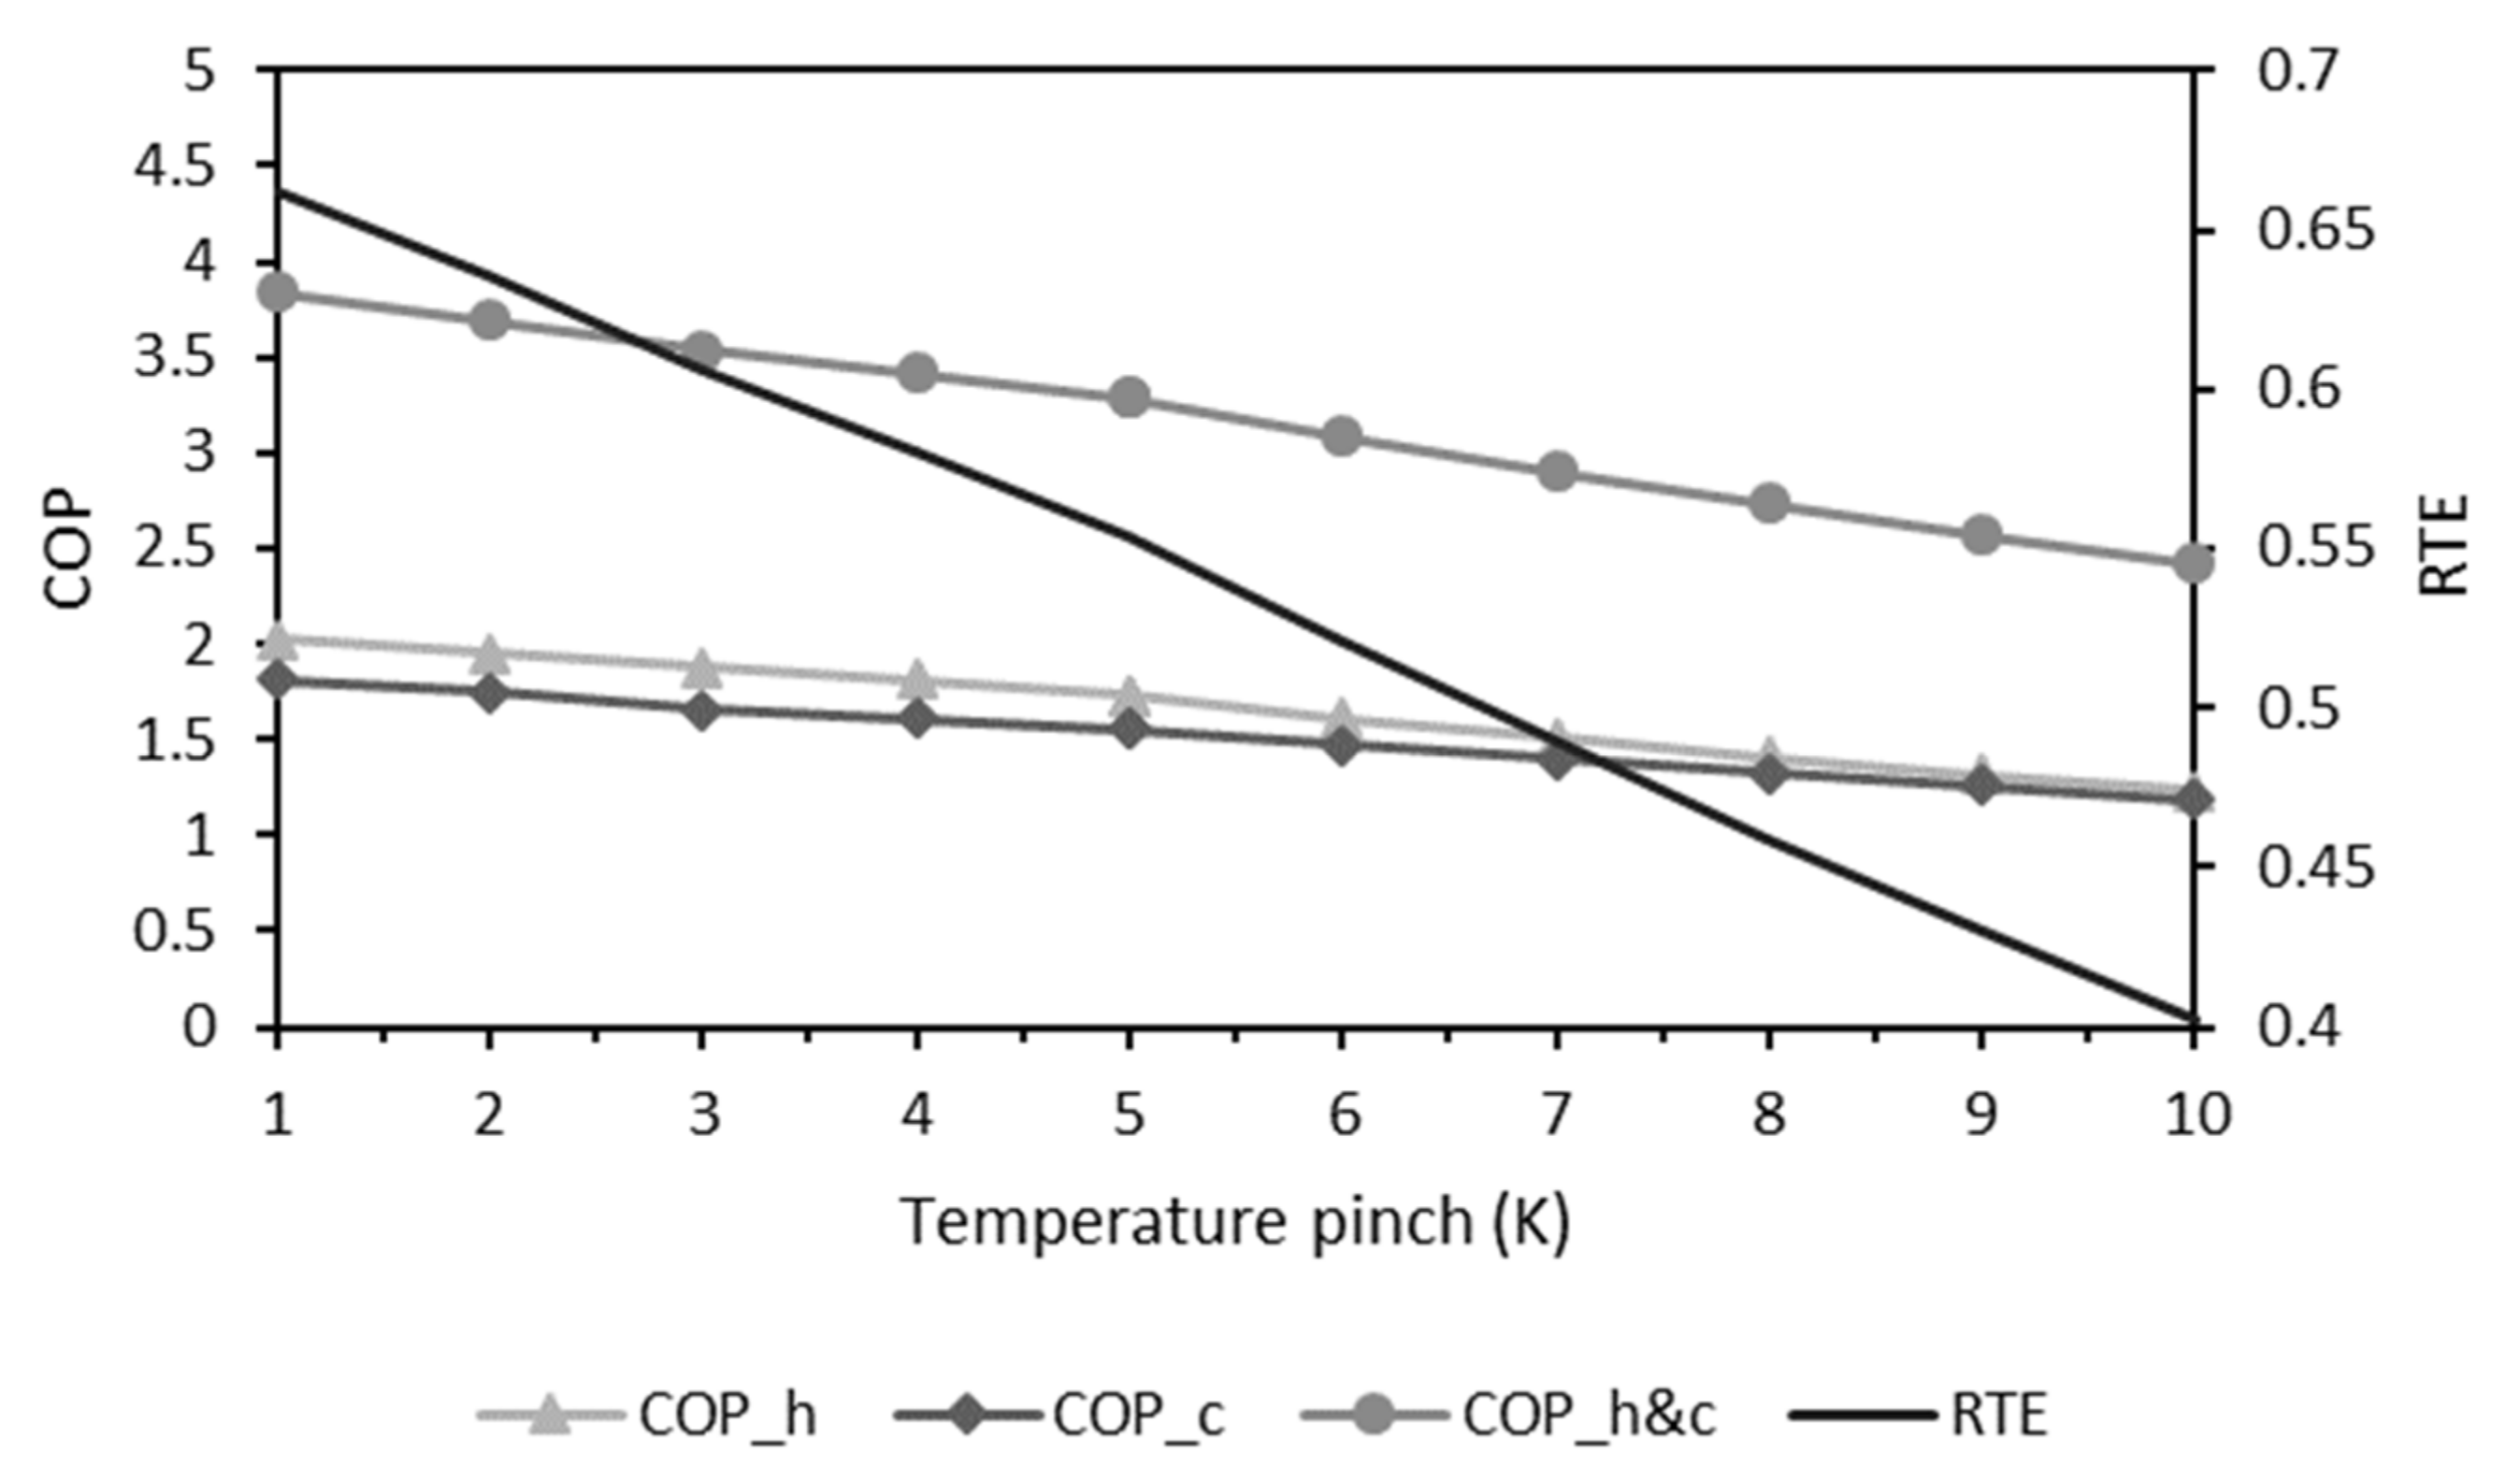
| Temperature pinch | 5 K | 2 to 10 K |
| Variable | Optimal Value for High COP | Optimal Value for High RTE |
|---|---|---|
| Hot pit temperature | 140 °C | 140 °C |
| Cold pit temperature | −10 °C | −45 °C |
| High-side pressure | 80 bar | 140 bar |
| Temperature pinch | 2 K | 2 K |
| Indicator | Default Configuration | Optimal Value for High COP | Optimal Value for High RTE |
|---|---|---|---|
| COPh | 1.746 | 3.138 | 1.027 |
| COPc | 1.559 | 2.136 | 0.775 |
| COPh&c | 3.305 | 5.274 | 1.803 |
| RTE | 0.556 | 0.610 | 0.712 |
| 40.3% | 18.1% | 7.4% |
Publisher’s Note: MDPI stays neutral with regard to jurisdictional claims in published maps and institutional affiliations. |
© 2021 by the authors. Licensee MDPI, Basel, Switzerland. This article is an open access article distributed under the terms and conditions of the Creative Commons Attribution (CC BY) license (https://creativecommons.org/licenses/by/4.0/).
Share and Cite
Byrne, P.; Lalanne, P. Parametric Study of a Long-Duration Energy Storage Using Pumped-Hydro and Carbon Dioxide Transcritical Cycles. Energies 2021, 14, 4401. https://doi.org/10.3390/en14154401
Byrne P, Lalanne P. Parametric Study of a Long-Duration Energy Storage Using Pumped-Hydro and Carbon Dioxide Transcritical Cycles. Energies. 2021; 14(15):4401. https://doi.org/10.3390/en14154401
Chicago/Turabian StyleByrne, Paul, and Pascal Lalanne. 2021. "Parametric Study of a Long-Duration Energy Storage Using Pumped-Hydro and Carbon Dioxide Transcritical Cycles" Energies 14, no. 15: 4401. https://doi.org/10.3390/en14154401
APA StyleByrne, P., & Lalanne, P. (2021). Parametric Study of a Long-Duration Energy Storage Using Pumped-Hydro and Carbon Dioxide Transcritical Cycles. Energies, 14(15), 4401. https://doi.org/10.3390/en14154401