1. Introduction
Environmental destruction and energy resource depletion are challenges faced by most countries in the world. Electric vehicles increase the use of electricity but reduce the demand for oil and help reduce greenhouse gas emissions. According to the International Energy Agency (IEA) 2020 report, in the next 10 years, the global electric vehicle inventory will increase by 36% annually, reaching 245 million units in 2030, which is 30 times the current level [
1]. As energy storage devices in most electric vehicles, lithium-ion batteries need to be kept in good condition to meet the safety, reliability, and long-range requirements of electric vehicles. Additionally, the secondary sale of electric vehicles as well as battery maintenance and recycling services also require effective evaluation of lithium-ion battery health. This brings challenges to the real-time diagnosis of lithium-ion batteries.
Lithium-ion batteries are rechargeable batteries that rely on lithium ions to move between the positive and negative electrodes to work. This kind of battery uses carbon material as the negative electrode and a lithium-containing compound as the positive electrode. During charge/discharge, the lithium ions can be intercalated/deintercalated in the electrode. The number of lithium ions in this process determines the capacity of the battery and obtaining battery capacity is a major goal of battery diagnostics. Vehicle battery real-time diagnosis is different from ordinary battery diagnosis in that it cannot be obtained by battery discharge capacity. Compared with the estimation by historical data, there is no accumulated error in the detection of battery internal parameters, which can better reflect the real-time nature of diagnosis. At present, there are two methods mainly used for battery real-time diagnosis: the DC resistance method and the AC impedance method. The DC resistance method uses the charge/discharge pulse current to trigger the battery voltage response, and the resistance value (R = ∆V/I) is obtained according to Ohm’s law. This method has a simple trigger signal and a short single test time, so it is widely used in commercial battery diagnosis. For instance, Hybrid Pulse Power Characterization tests are a conventional method for electric vehicle companies to diagnose battery systems, and are widely used for battery power performance testing [
2,
3]. The resistance obtained by the traditional DC resistance method includes various resistances inside the battery, such as the electrolyte resistance, the solid electrolyte interphase (SEI) resistance, the charge transfer resistance, the polarization resistance, etc. The effective acquisition of various resistance values is very important for battery health and safety diagnosis. For example, the charge transfer resistance can be used to characterize the battery health [
4,
5,
6], and the SEI structure resistance is closely related to the battery safety [
7,
8,
9]. However, it is difficult to separate each type of resistance from a single DC resistance value. Anup Barai et al. studied the relationship between the current pulse time and the DC resistance value, and tried to divide the resistance by the pulse time [
10]. In their work, the short pulse width (0.1 s) DC resistance value is regarded as a pure Ohmic resistance, and then the charge transfer resistance and polarization resistance are obtained from the middle pulse width (2 s) and the long pulse width (10 s) in turn. This resistance division method is highly dependent on the choice of pulse width. The polarization resistance value separated by this method is close to the low frequency (0.1 Hz) AC impedance result, while the pure ohmic resistance and the charge transfer resistance are quite different from the high frequency (251 Hz and 2 Hz) AC impedance result. As the battery’s safety and health status are more dependent on the internal high-frequency structure of the battery, this method of dividing the resistance by pulse time cannot meet the high-precision requirements of battery diagnosis.
The AC impedance method is also called the electrochemical impedance spectroscopy (EIS) method, which can use the frequency response difference to divide the internal resistance of the battery. Currently, EIS is considered to be one of the technologies most likely to be used for electric vehicle battery diagnosis, and many EIS-based technologies have been invented. Among the many EIS technologies, the single-sine EIS method is the most basic and the most commercially used offline technology [
11,
12]. This technology uses sinusoidal low-amplitude signal currents (or potentials) of different frequencies to trigger the response of the electrochemical system and simultaneously measures the output potential (or current) signals of the system in response to obtain the AC impedance (or admittance) of the system. Combined with the equivalent circuit model of the electrochemical system [
13,
14], the relevant model parameters of the system are calculated according to the impedance change with the excitation signal frequency. These parameters can be used to analyze the reaction mechanism of the electrochemical system. The single-sine EIS technology is widely used as an offline battery diagnostic technology, but it faces some problems in the online diagnosis of electric vehicle batteries. For example, EIS technology requires the device under test to maintain a linear state. However, the polarization produced by the working current of the car will make the battery enter a non-linear state. In order to study the impedance characteristics during charging/discharging, a dynamic EIS technique is proposed [
15,
16]. This technique superimposes the AC disturbance on the DC current/voltage offset to ensure that the impedance test (through the AC disturbance signal) itself still meets the linearity condition. However, the magnitude of the DC current will non-linearly affect the impedance value obtained [
17,
18]. Therefore, the instability of the system needs to be minimized in the dynamic EIS test.
In addition to the operating current, changes in battery status (the temperature and the state of charge) will also affect EIS test results [
19,
20]. The single-sine EIS takes a long time to obtain a complete impedance spectrum, and changes in the temperature and the state of charge (SOC) during the test will affect the measurement results. Therefore, it is not suitable for online testing requirements. In order to quickly obtain the impedance spectra of lithium-ion batteries, a multisine EIS technology is proposed. This technology uses the designed signal to detect the battery system. This signal is composed of multiple sine waves of different frequencies, and all sine waves have similar completion times [
21,
22]. In this way, the impedance values of multiple frequency points can be obtained through one test, which reduces the diagnosis time. However, in order to maintain good stability and linearity in the test, the overall amplitude of the signal composed of multiple sine waves is small, resulting in a smaller signal amplitude for each single sine wave. Therefore, compared with single-sine EIS, the signal-to-noise ratio of multisine technology is usually lower. In the multisine technology, it is also possible to directly use any time domain signal as the trigger signal, and measure the system’s response to this signal. Then, through the mathematical transformation (such as Fourier transform) of the signal function, the impedance spectroscopy can be obtained in the frequency domain [
23,
24]. This method (time domain signal + mathematical transformation + frequency domain impedance spectroscopy) can be extended to a variety of detection techniques. For example, passive impedance spectroscopy is a derived technology that is expected to be used for the online diagnosis of electric vehicles. This technology does not need to generate its own excitation source, but only samples the current and voltage signals of the running vehicle, and then calculates the impedance spectroscopy in the frequency domain through Fourier transform [
25].
In this paper, we proposed a new battery parameter diagnosis method: DC impedance spectroscopy (DCIS). In the electrochemical model, the internal structure of the battery can be simplified into multiple resistance–capacitance (RC) networks, each of which has its own time constant and frequency characteristics. The AC impedance spectroscopy method utilizes the different frequency characteristics of these RC networks to obtain the various parameters of the battery in the frequency domain. In DCIS, we obtain the various resistances of the battery by changing the current pulse width according to the different time constant characteristics of the RC network. When DC current pulse width changes around the time constant, the RC network voltage will have an obvious capacitor charging effect. Due to the limitation of the test equipment, the current pulse width used in the traditional DC resistance method is between 0.1 s and 30 s [
2,
10], which is much larger than the time constant of the high frequency RC network inside the battery. Therefore, even if the current pulse width in the traditional DC resistance method is adjusted, the high-frequency network characteristics cannot be obtained. Based on the previous short pulse DC resistance research [
26], we controlled the current pulse time from 0.25 ms to 400 ms in this study, covering the time constant range of the RC network of lithium-ion batteries. By collecting the DC resistance values of different pulse widths (near the time constant), and then fitting these values according to the time function of the RC network, the time constant and resistance value of the RC network can be obtained. DCIS has the convenience of the DC resistance method, and can also distinguish the various resistances inside the battery in the same way as the AC impedance method. In addition, DCIS is a complete battery time domain diagnosis method. Although EIS technology can trigger the battery response through various time-domain signals, these technologies must rely on Fourier, Laplace, or other changes to obtain impedance spectra from the response signal [
21,
23,
25]. Therefore, although these technologies use time domain detection technology, they need the help of another domain space (such as the frequency domain) to obtain the final diagnosis result of the battery during data processing. The DCIS method can not only measure time domain signals, but also directly obtain battery internal parameters according to the time function of the response signal. By avoiding the data cross-domain conversion of the time-domain EIS technology, the DCIS method reduces the difficulty of data processing and accelerates the speed of diagnostic processing. This is in line with the low-cost and high-speed requirements for the real-time battery diagnosis of electric vehicles.
This paper first compares the mathematical expressions of the DC resistance (time domain) and AC impedance (frequency domain) of the RC network, and proposes to use the time function of the DC resistance to form the DCIS. Secondly, the 18650 lithium-ion battery was tested with DCIS and EIS, respectively, and the validity of DCIS was verified with experimental results. Finally, through the improved fast DCIS, the relationship between battery aging and battery resistance was studied. The research results show that DCIS is a method that can be used for health and safety diagnosis of on-board battery packs.
2. EIS vs. DCIS
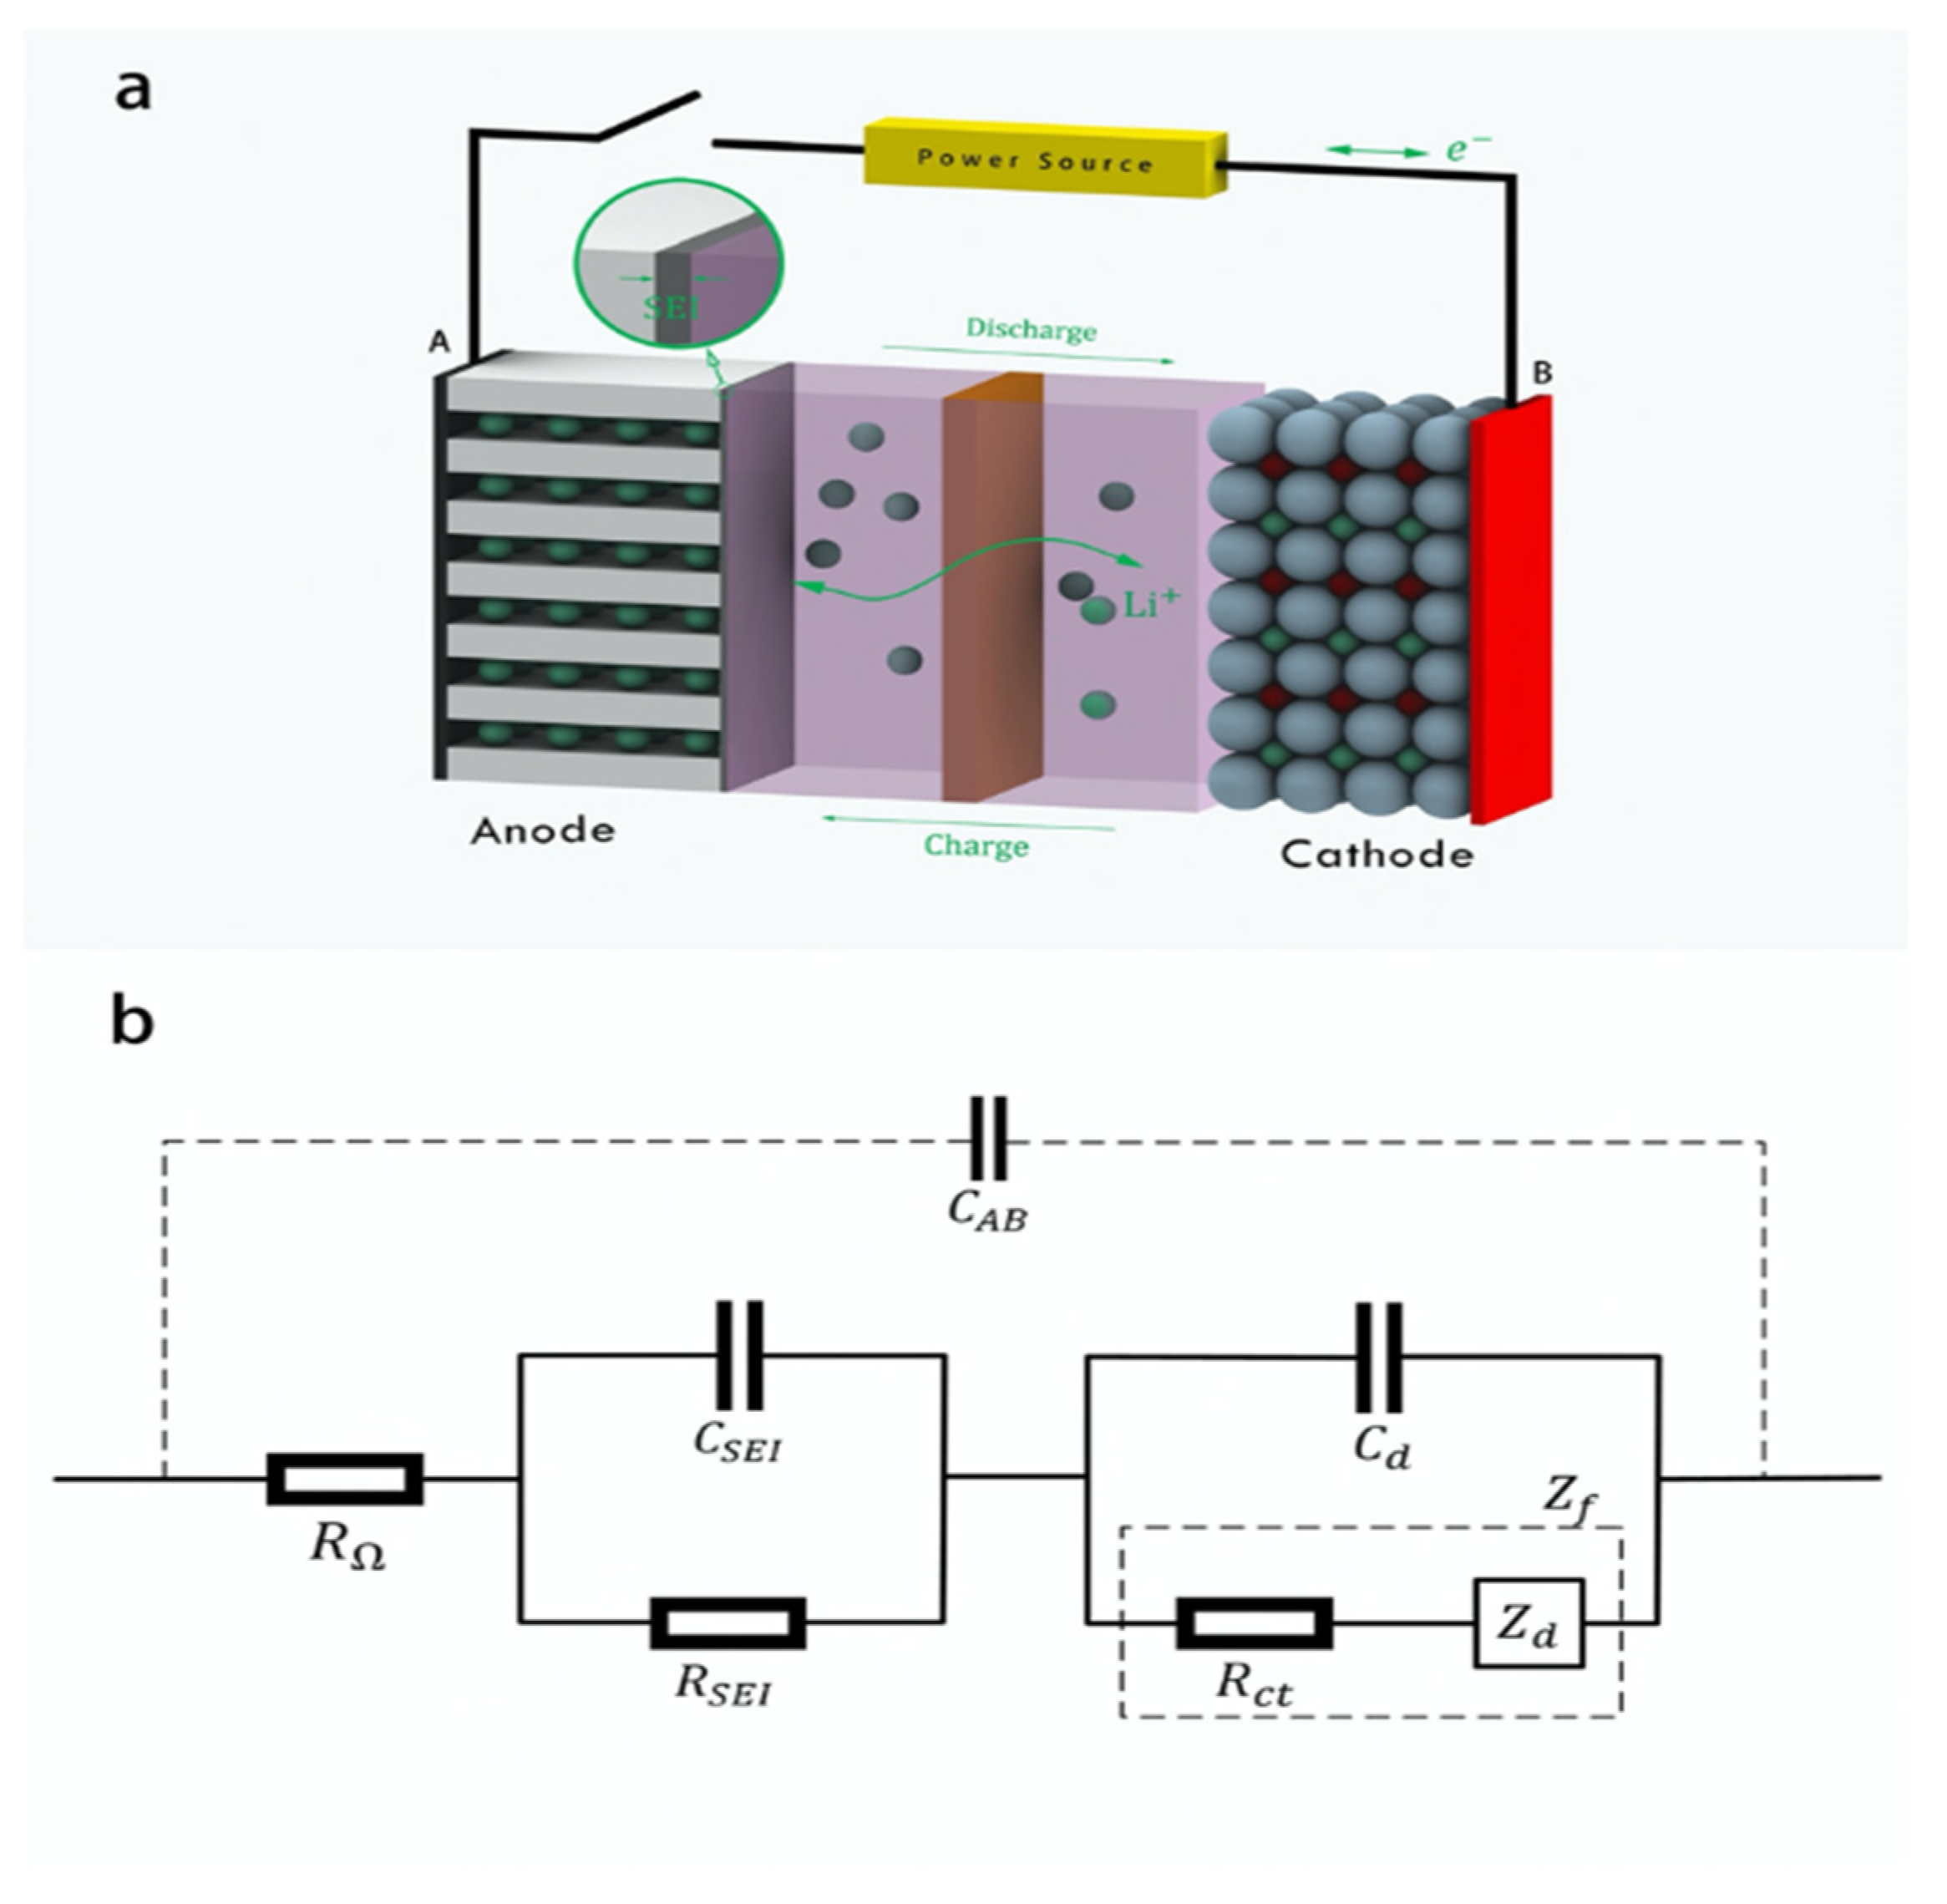
Lithium-ion batteries consist of two electrodes, a cathode and an anode, separated by an electrolyte. Lithium ions are conducted between the two electrodes through the electrolyte, and electrons are transferred through an external circuit, as shown in
Figure 1a. During the charge/discharge cycle, the chemical reaction between the electrode and the electrolyte and the electrode decomposition cause irreversible capacity loss [
27]. This loss of battery capacity is called cyclic aging of the battery. During this cyclic aging, the electrodes, electrolytes and their interface states will change accordingly. By detecting these internal state changes, battery aging information can be effectively obtained.
The lithium-ion battery, as an electrochemical system, has a common feature with ordinary circuits, that is, an external voltage signal will generate a corresponding current signal. Therefore, the equivalent circuit model is often used to describe the battery structure in battery analysis, and the equivalent circuit model parameters are used to obtain the relevant internal structure data of the battery [
28,
29]. As shown in
Figure 1b, the solution resistance (
RΩ) is a pure ohmic resistance. The SEI layer capacitance (
CSEI) and resistance (
RSEI) form an RC network. The electric double layer capacitance (
Cd) and Faradaic impedance (
Zf) form another RC network. Here, Faradaic impedance (
Zf) can be decomposed into the charge transfer resistance (
Rct) and diffusion impedance (
Zd), which represent the impedance behavior of electrochemical polarization and concentration polarization, respectively. The capacitance between battery electrodes (
CAB) is much smaller than the capacitance in these RC networks and is often ignored in electrochemical analysis. If the value of each equivalent circuit parameter in the model can be obtained through testing, the internal structural characteristics of the battery during the aging process can be obtained.
The capacity decay and the internal resistance increase occur simultaneously in the process of battery aging [
30,
31]. In most previous studies, the sum of all resistances in the battery model is often used as the internal resistance of the battery. Since the internal structure of the battery is inconsistent with aging, it is necessary to study the effect of aging on each internal parameter. Through internal parameters that are highly correlated with the degree of aging, a scale for battery aging detection can be established.
The EIS measurement method uses a small AC signal as the trigger source to measure the impedance of the electrochemical system to the AC signal. In the battery model, when the polarization potential change |∆
φ| caused by an external signal is less than 10 mV and the signal time is short enough, the effect of concentration polarization (
Zd in battery model) can be ignored. At this time, for a small signal of angular frequency
ω, according to the battery model in
Figure 1b, the impedance of the battery is
where,
τ1 and
τ2 are the time constants of the high-frequency and low-frequency RC networks, respectively. A Nyquist plot records the impedance values of different frequency signal responses on the impedance complex plane, as shown in
Figure 2a. Here, defines the x-axis value at
ZIm = 0 as
R0. There are two semicircles between
R0 and
Rd, where
Rd is close to the traditional battery internal resistance. The smaller semicircle at relatively high frequencies is generally considered to be caused by the SEI film at the anode. The larger semicircle at relatively low frequencies is generally considered to be related to the interface charge transfer reaction and double layer capacitance [
32,
33]. The half-dome point appears where the input signal resonates with the RC circuit. According to this input signal frequency, the time constant
τ of the RC circuit can be obtained. In addition, the value of
R can be obtained from the diameter of the semicircle.
Through the frequency difference of RC networks, the EIS method can distinguish the internal structure of the battery in the frequency domain. In addition to the frequency difference, RC networks also have a different time constant
τ. DCIS can use it to distinguish different internal parameters in the time domain. In this method, a square wave pulse current
I is used to discharge the battery. The pulse time width is
t. The battery voltage change Δ
V is measured at the end of the pulse signal. When the trigger signal is small enough, diffusion impedance
Zd can be ignored, and the equivalent DC resistance of the battery at this moment is
where,
τ1 and
τ2 are the time constants of RC networks. Owing to the internal structure of the battery,
is a function of time
t. When
t is long enough, this resistance is the sum of the resistances of all parts of the battery, which is the traditionally defined internal resistance of the battery. As
t decreases, the time-varying characteristics of this resistance will show up.
Figure 2b shows the
value of a single RC network structure at different
t values. When the time variable
t is close to the time constant
τ, the characteristics of the exponential function will be clearly demonstrated by
value. For lithium-ion batteries, as the time
t decreases, the time constants of the low-frequency and high-frequency RC networks will appear on the DCIS one after another. By exponentially fitting the data around these times, the RC network time constant
τ and the resistance value
R can be obtained. Furthermore, when
t drops to zero, the RC network is almost in a short-circuit state, and
approaches the value of the pure resistance
RΩ in the battery model.
Further research can establish a connection between the equivalent resistance
and the AC impedance
. When the pulse discharge current
I flows through the RC network in the equivalent circuit model, it is divided into the capacitor current
IC and the resistor current
IR. Due to the RC network,
IC decays exponentially with time. This leads to the end of the pulse discharge, the voltage across the RC network is a function of the pulse time
tp.
Here,
τ is the time constant of the RC network, which is the product of
R and
C. Through Ohm’s law, we define the equivalent DC resistance of the RC network. Its value is
where
u(
t) is the unit step function:
The Fourier transform of the integral internal function can be obtained as follows:
This is the impedance value of the RC network in the frequency domain. It proves that the equivalent DC resistance is actually the manifestation of impedance in the time domain. Therefore, by measuring in the time domain, we can theoretically obtain the same information as the frequency domain impedance measurement.
Further, the Fourier transform of the entire
function is:
Here,
is the initial term of the integration process. It is retained in the frequency domain through DCIS. Through this item, DCIS can detect the pure ohmic resistance value in the battery model, which cannot be tested by the EIS method. In EIS, as the signal frequency changes, the battery exhibits different capacitive and inductive reactance behaviors. In
Figure 2a, the inductive behavior is fully compensated by the capacitive behavior at
R0. Owing to the limited
ω, the impedance value at this point is actually the sum of pure ohmic resistance and some additional resistance [
4]. In addition, there is an electrode capacitance
CAB in parallel with the battery model. Owing to the small value, this capacitance is often ignored in EIS analysis. However, when
ω is large enough,
CAB and
RΩ will constitute the new RC network impedance, which is:
When
ω tends to infinite, this RC impedance value obtained by EIS is zero. At this time, the
RΩ signal in EIS will be short-circuited by
CAB. In DCIS,
RΩ is retained in the frequency domain as the initial value of the integration. It can be obtained through DCIS of a lower frequency RC network (such as the SEI layer). At this time, it is the intersection point of
function and the y-axis in the time domain in
Figure 2b.
3. Experiment Results
In this work, through continuous charge/discharge cycles of 48 commercial 18650 batteries, battery samples with different capacities can be obtained. The initial capacity of each battery was 3100 mAh, and the chemical composition was LiCoO2/graphite. Experimental sample preparation and testing were completed in a 25 °C temperature chamber. Each cycle included a 1C rate (3.2 A) of constant current-constant voltage (CC-CV) charging to 4.2 V and a 1C rate (3.2 A) of constant current (CC) discharge to 3 V. The battery capacity was obtained by the ampere-hour integration method with C/2 rate (1.6 A) CC discharge from 4.2 V to 3 V. EIS and DCIS tests were performed when the battery was fully charged. EIS used a 5 mA excitation current to test in the frequency range of 0.05–5 kHz. DCIS used a 0.25 A discharge current for testing. The high-frequency test pulse width was scanned from 0.25 ms to 10 ms in 0.25 ms steps, and the low-frequency test pulse width was scanned from 10 ms to 400 ms in 10 ms steps. In this way, the high-frequency and low-frequency DCIS lines each contain 40 test points. In order to allow the battery to have sufficient recovery time between the two test points, the interval between two test points was 10 s. The equivalent DC resistance was obtained by collecting the battery voltage twice and combining the discharge current value. The voltage measurement used a 16-bit commercial high-impedance input ADC chip. The first voltage acquisition was completed when the battery was at rest, and then the battery was immediately discharged with a t-width pulse. At the end of the discharge, the second voltage acquisition was performed. The equivalent DC resistance was calculated as the ratio of the two voltage differences to the discharge current.
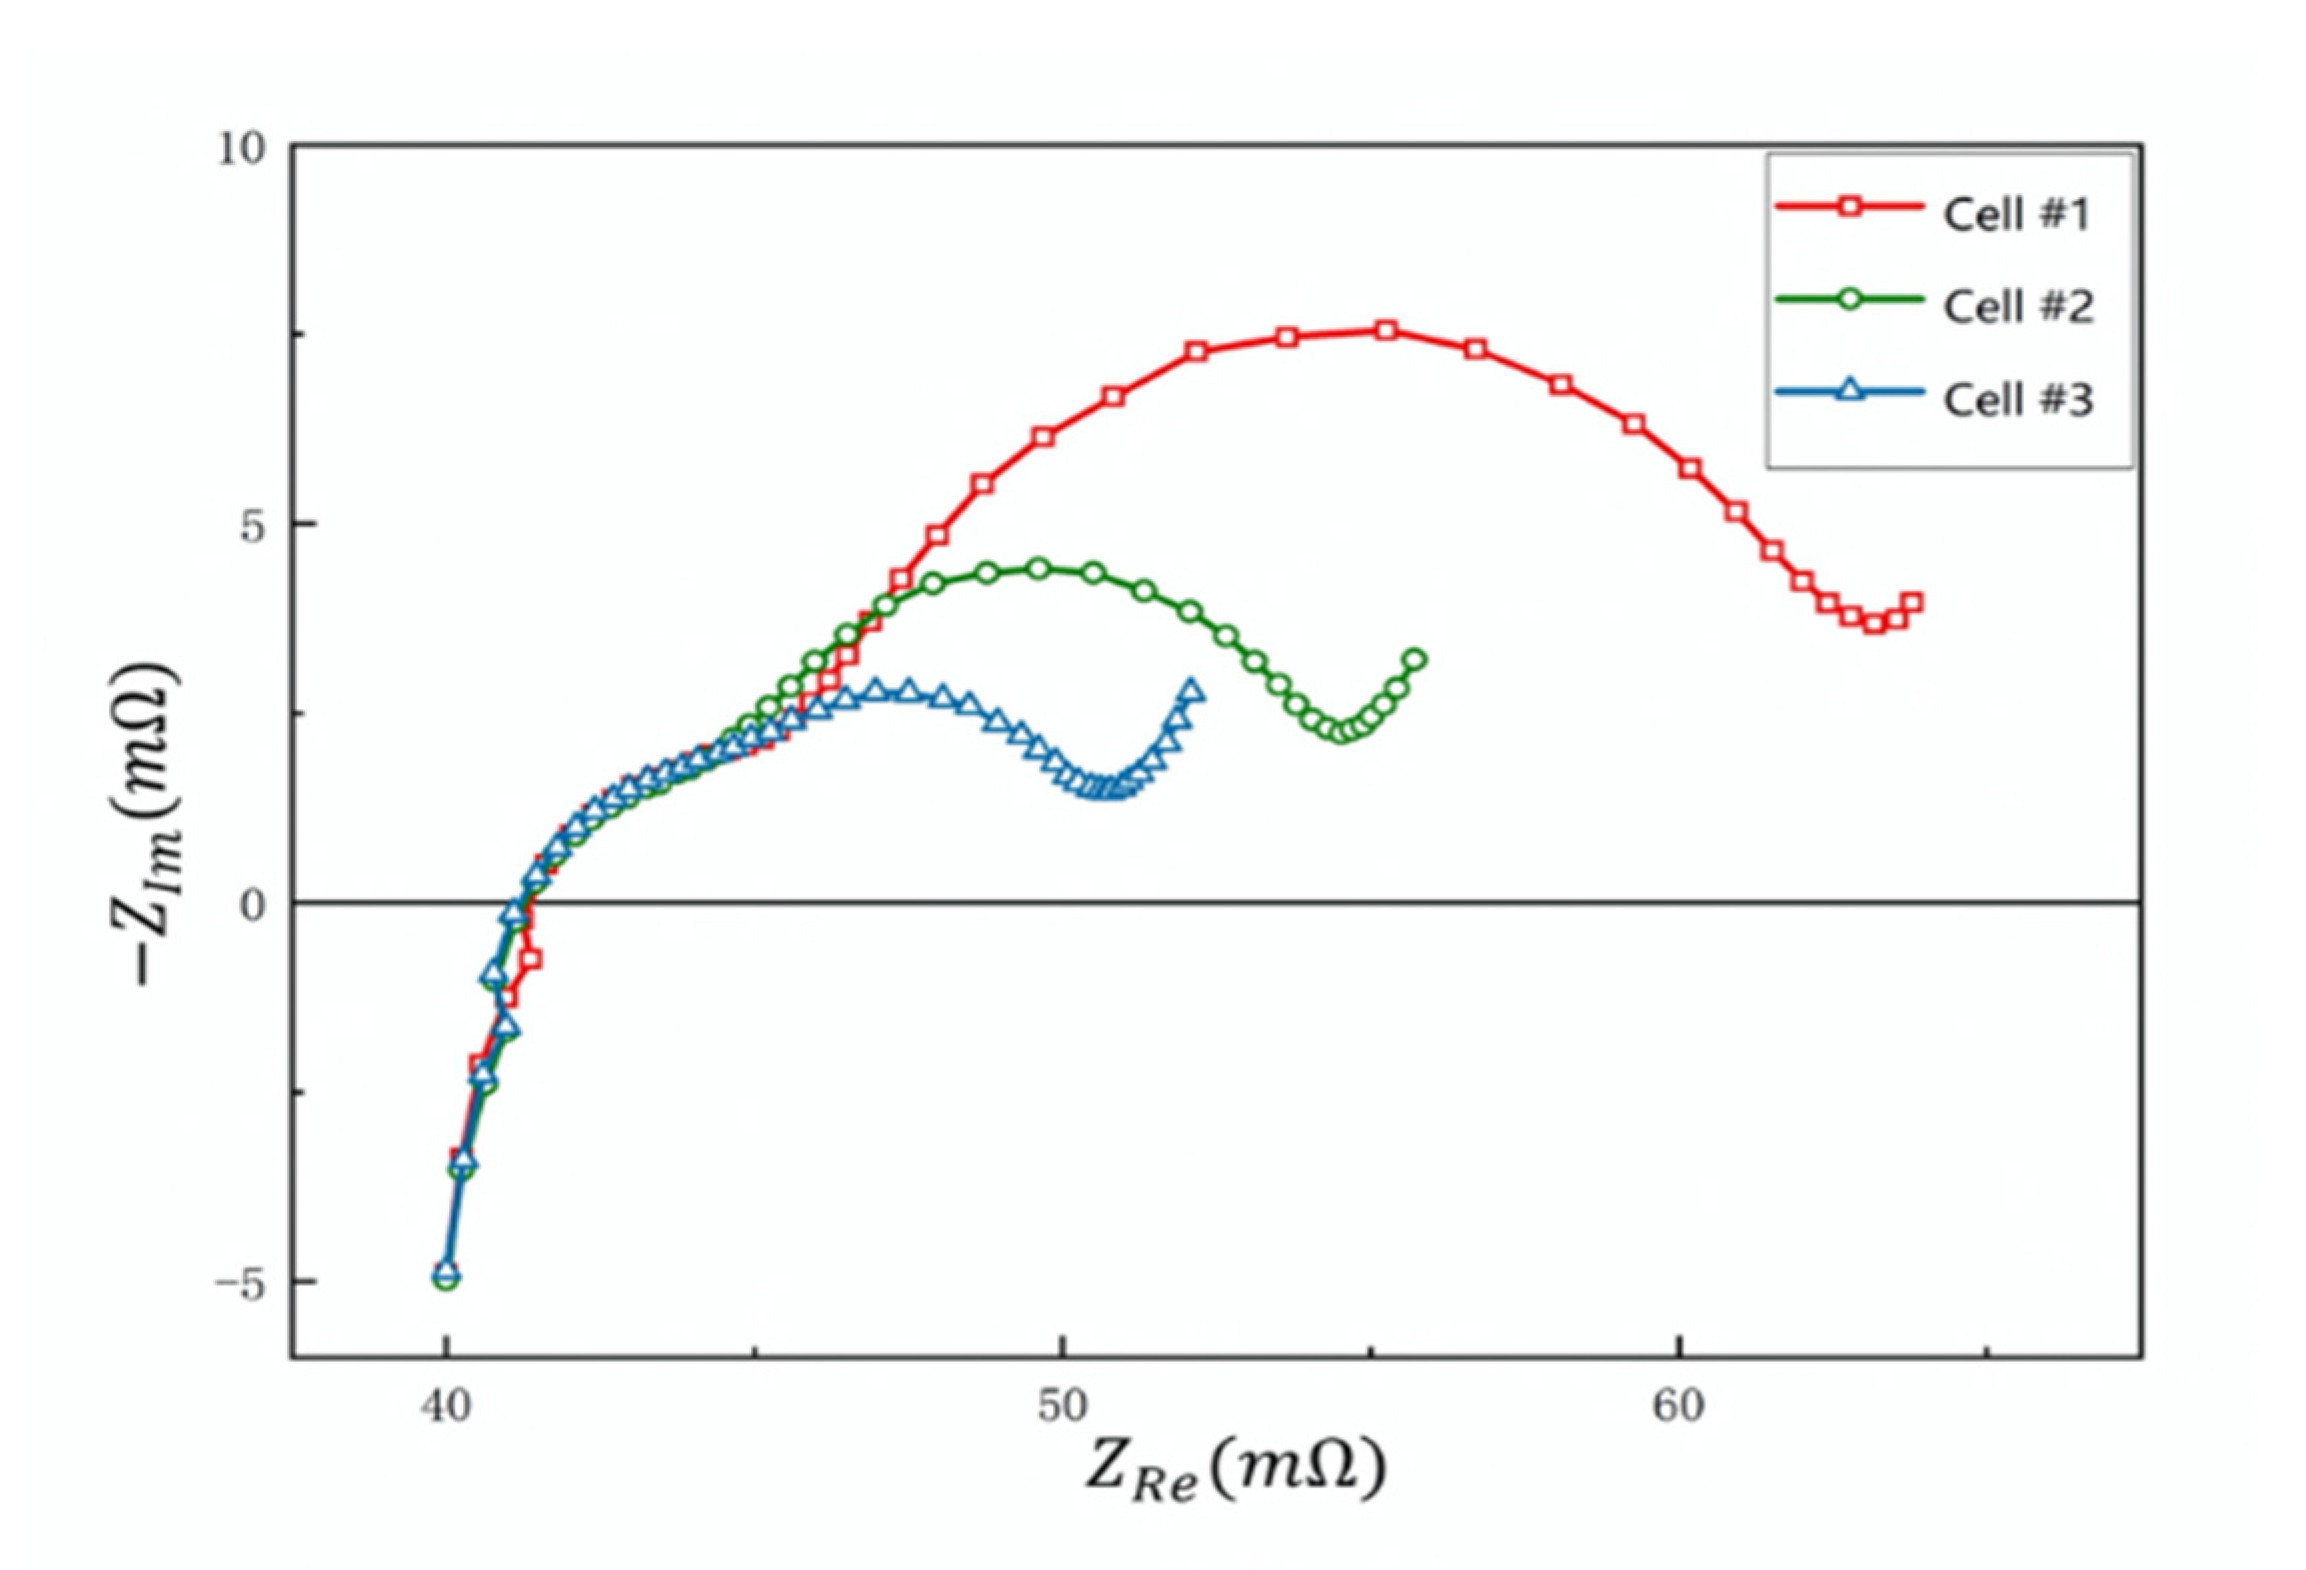
To verify the effectiveness of our battery diagnostic method, we performed EIS and DCIS measurements on a series of batteries and compared the test results. Three batteries of different capacities were used as a comparative measurement experiment, namely cell #1 (2650 mAh), cell #2 (2850 mAh) and cell #3 (3050 mAh).
Figure 3 is a Nyquist plot of three sample batteries. The two semicircles of high frequency and low frequency in the frequency domain are clearly visible. The diameter of the low-frequency semicircle increases significantly as the battery capacity decreases. According to the definition of EIS, this diameter corresponds to
Rct inside the battery. This shows that
Rct can be used to indicate the capacity change caused by the aging of the battery, which is consistent with the results reported in a large number of documents [
4,
5,
23]. From the EIS diagram, we can also ascertain that the time constant
τ1 of the high-frequency RC is approximately 2 ms, while the time constant
τ2 of the low-frequency RC changes from 20 ms to 80 ms. This provides a reference for the time range of the DCIS test. Here, we set the pulse time
t range between
τ/5 and 5
τ. Such time range selection can not only cover the function change around
τ, but also distinguish low-frequency RC and high-frequency RC in the time domain.
In the DCIS measurement, we tested the
value of three sample batteries at various time points, as shown in
Figure 4. The DCIS spectral line can be obtained by exponential fitting multiple resistance values according to the
time function. In the DCIS diagram, the measured resistance value is represented by dots, and the fitted spectrum is represented by lines. The low-frequency spectrum lines are mainly generated by the
Rct/Cd network. The time constant
τ2, resistance value [
Rct + RΩ + RSEI] (resistance value at
t = 5
τ2) and [
RΩ + RSEI] (resistance value at
t = 0) of the network can be obtained from low-frequency function
, as
Figure 4b. The high-frequency spectrum lines are mainly generated by the
RSEI/CSEI network. The time constant
τ1, resistance value [
RΩ + RSEI] (resistance value at
t = 5
τ1) and
RΩ (resistance value at
t = 0) of the network can be obtained from high-frequency function
, as
Figure 4a. Further, the value of
Rct is equal to [
−, the value of
RSEI is equal to
−, and the value of
RΩ is
. In this DCIS, as the battery capacity decreases,
Rct increases significantly while
RSEI remains unchanged. This result is consistent with the result of EIS measurement. Moreover, we quantitatively compare the test results of EIS and DCIS. In
Figure 5, we use a histogram to compare the values of
τ1,
τ2,
RSEI and
Rct obtained by the two test methods. The comparison results show that the battery parameters measured by the DCIS method are basically consistent with the results measured by the EIS method. Among them, the average deviations of
RSEI and
Rct are 3.2% and 4.2%, respectively, and the average deviations of
τ1 and
τ2 are 7.5% and 6.8%, respectively. Since both methods use the function fitting method when obtaining parameters, the deviation of this range is acceptable.
The difference between the two measurement results is caused by many factors. For example, in EIS measurement, a single trigger signal only contains a sine wave with a fixed frequency, whereas in DCIS measurement, each trigger square wave pulse is a collection of multiple frequency signals. This may cause the resonance point of the signal to shift. In addition, the discharge current (0.25 A) used in the DCIS method is much larger than the excitation current (5 mA) in EIS. This increases the risk of diffusion, resulting in a different time constant and different resistance. However, because the test pulse time is short, and the potential change caused by the polarization impedance in the DCIS experiment is less than 5 mV, this indicates that the charge transfer process still dominates the polarization and the static test conditions have not changed. Despite the above factors, the similar time constant range can strongly indicate that DCIS uses RC network to obtain battery parameters, which is an effective measurement method.
In addition to comparing the value of battery parameters, we also compared the impedance spectra of the two methods. By substituting the values of
τ and
R obtained by DCIS into Equation (1), the impedance value of each frequency point can be calculated. Since EIS cannot obtain pure ohmic resistance, we intentionally removed the pure ohmic resistance part of DCIS when comparing the frequency domain impedance of the two methods, and only compared the impedance value generated by the two-stage RC network inside the battery. At this time, the frequency points in the EIS test are brought into Equation (1), and the frequency domain impedance value of DCIS can be obtained.
Figure 6 shows the frequency domain impedance spectra of the two-order RC network of three battery samples. The solid dotted line is the EIS result, and the hollow dotted line is the DCIS result. In the figure, the DCIS spectral line approximately possesses the spectral line characteristics of EIS. The difference between the two mainly comes from the semicircle shape of the impedance spectrum. DCIS presents an ideal semicircle in the frequency domain, while EIS does not. This is because DCIS uses an ideal plate capacitor model, which has only one time constant
τ for each RC network. In EIS, the unevenness of the capacitor surface will be shown in the multifrequency point measurement, and it does not have the fixed
τ value of the ideal RC model.
4. Fast DCIS
According to the time constant of the RC network, the
function divides the internal resistance of the battery. For an RC network, when the pulse time is greater than
5τ, the
function reaches saturation. After entering the saturation state, the value of
will remain fixed, as in
Figure 2b. In actual measurement, the
value will continue to increase due to the influence of the low-frequency resistance (such as
Rct or the polarization resistance). However, due to the different
τ, the low-frequency function
has a limited impact on high-frequency function
value at the high-frequency RC saturation point. The resistance value at this point can still be regarded as the saturation value of
. According to the characteristics of the
function, the resistance value of the RC network can be obtained by directly measuring the saturation point resistance
and the near-zero-point resistance
.
For a two-stage RC lithium-ion battery, the values of RΩ, RSEI and Rct can be obtained by fast DCIS with three short pulse discharges. In the experiment, considering the time constants τ1 (≈2 ms) and τ2 (between 20 ms to 80 ms) of sample batteries, the three pulse widths were set as t1 (0.25 ms), t2 (10 ms) and t3 (400 ms), respectively. The interval between every two pulses was 250 ms and the discharge current was 0.25 A. Through the fast DCIS test, three equivalent DC resistances can be obtained in one second. They are , , and , respectively. Since t1 < τ1/5, the value of was close to RΩ. When t2 > 5τ1, was the high-frequency RC saturation resistance and was close to RSEI. When t3 > 5τ2, was the low-frequency RC saturation resistance and was close to Rct.
Due to the particularity of electric vehicle battery diagnosis, we propose a fast DCIS method that only measures resistance parameters. Through fast DCIS, we measured the internal resistance parameters of 48 lithium-ion batteries with different life spans, as shown in
Figure 7a–c. Through different times of battery cycle aging, the sample battery capacity is distributed between 2600 mAH and 3100 mAH. A low-aging battery has a high battery capacity, and a high-aging battery has a low battery capacity. The purpose of battery aging diagnosis is to obtain battery capacity by detecting changes in internal parameters caused by battery aging. In this way, the aging state of the battery can be obtained without fully discharging the battery.
The experimental results show that when the battery capacity drops from 3100 mAH to 2600 mAH due to aging, the value of
RΩ rises from 44 mΩ to 51 mΩ, the value of
Rct rises from 6 mΩ to 20 mΩ, and the value of
RSEI remains between 6 mΩ and 7 mΩ. Here, the change trend of
RΩ and
Rct with battery aging is consistent with the reports of related research [
4,
34]. In the electrochemical model, the
Rct value can be used to indicate the characteristics of the electrode–electrolyte interface layer during the aging process, while the solution resistance
RΩ value can indirectly indicate the decomposition of the electrode during the aging process. Although
Rct and
RΩ reflect the response of different battery structures to aging, they can both be used as cell aging indicators. In addition,
RSEI did not change significantly during the aging process, indicating that the SEI film on the graphite surface was relatively stable during the cyclic aging process. Although the results show that
RSEI has a low correlation with battery aging, it can be used to indicate battery safety performance and is also an important parameter for battery diagnosis.
Since the DCIS method is based on the battery equivalent circuit model, it has the same dynamic measurement problem as the EIS. When the car is working, the diffusion impedance Zd produced by the current cannot be ignored. This impedance that varies with current density makes the battery model complicated. In this case, it is very difficult to separate the charge transfer resistance Rct from Zd. Fortunately, in the battery model, Zd has a limited impact on RΩ and RSEI. These two resistances can, respectively, indicate the cycle life and safety of the battery. Therefore, in the dynamic DCIS battery diagnosis, the low-frequency RC can be ignored, and only the high-frequency RC is used as the test item. This further reduces the DCIS test time, making a single dynamic fast DCIS measurement time less than 20 ms. At this time, the influence of temperature and SOC changes during the measurement can be ignored.
In this study, a dynamic fast DCIS measurement produced two consecutive pulse discharges. The pulse widths were 0.25 ms and 10 ms, respectively. The pulse interval was 5 ms and the discharge current was 0.25 A. During the test, a dynamic fast DCIS measurement was performed on the battery every 2 s. In order to simulate the state of the battery under the working conditions of the car, the dynamic battery test adopted the IM240 automobile working condition, which is a kind of automobile inspection and maintenance driving schedule formulated by the United States Environmental Protection Agency [
35]. In the IM240 test, the output power of the car is changed according to the designed working conditions, and the entire test time is 240 s. In our experiment, because the battery voltage did not change much during the test time, the change in output power could be simulated by the change in discharge current. Here, the battery discharge current was set in the range of 0–3.2 A according to the IM240 standard, as shown in
Figure 8.
In the dynamic fast DCIS experiment, we collected
RΩ and
RSEI of three battery samples. Their capacities are 2650 mAh, 2850 mAh and 3050 mAh, respectively. In
Figure 8, the value of
RΩ increases as the battery capacity decreases, while the value of
RSEI does not change with battery capacity. This experimental result is the same as the result of static fast DCIS, indicating that the variation of the working current has little influence on
RΩ and
RSEI. This is consistent with the judgment obtained from the battery model. In summary, fast dynamic DCIS is an effective diagnostic method for battery health and safety in working conditions.

