Article

Applicability Study of a Sunken Vessel as an Artificial Reef in a High Wave Energy Zone

1
The World Association for Waterborne Transport Infrastructure (PIANC), 1000 Brussels, Belgium
2
Department of Civil Engineering, Catholic Kwandong University, Gangneun 64128, Korea
3
MiraeOcean Corporation, Anyang-si 14059, Korea
*
Authors to whom correspondence should be addressed.
Energies 2021, 14(14), 4374; https://doi.org/10.3390/en14144374
Submission received: 14 June 2021 / Revised: 9 July 2021 / Accepted: 16 July 2021 / Published: 20 July 2021

Abstract

:
The purpose of this study is to analyze the applicability of a sunken vessel as an artificial reef in a high wave energy area in a shallow water zone. Artificial reefs in general shapes are unlikely to be installed and maintained stably in high-energy wave zones. To solve this problem, a method for using a large 2000-ton class sunken vessel as an artificial reef was proposed in this study. Accordingly, we analyzed the applicability, including stability, of the sunken vessel as an artificial reef on the east coast of South Korea, where high-energy waves and swells are observed frequently. In the analysis process, various methods, such as numerical simulation and a hydraulic model experiment, were utilized. 2D and 3D numerical simulations were conducted to simulate the wave energy in the area where the sunken vessel was installed as an artificial reef to identify wave force applied to the vessel. Moreover, a hydraulic model experiment using a sunken vessel model as an artificial reef was performed to compare the stability and motion properties of the vessel model. The experimental results indicated that the stability and motion properties of the sunken vessel differed depending on the water depth. Additionally, the water depth that ensured the stability of the sunken vessel was identified.

1. Introduction

Artificial reefs are structures artificially installed in the sea, such as abandoned ships, concrete, steel, and ceramic structures, to establish marine environments in which various types of marine life can settle and grow. In this sense, these structures are also called apartments for fish. Moreover, they can provide places for enabling marine life to spawn and live, as well as hideouts for protecting sedentary species, and are thus used as a method to develop marine and fishery resources considering the environments and characteristics of marine life [1]. Around the world, there are a number of successfully installed artificial reefs. The usage of artificial reefs to promote marine lives started from the earliest made structure using natural tree branches or logs [2]. Among various types of artificial reefs, sunken vessels are considered as one of the most optimal artificial reef structures, as the environmental pollution that could occur in the process of dismantlement can be eliminated, vessel recycling is possible, and the cost and time of manufacturing and installing artificial reefs can be significantly reduced [3,4,5].
South Korea is a peninsular country. On the west and south coasts of South Korea, tidal energy tends to be higher than wave energy. Contrariwise, the east coast is characterized by significantly higher wave energy than tidal energy. Thus, a great frequency of high waves and high swells are observed regularly. Furthermore, the water depth increases rapidly a small distance away from the coast owing to the steep slope of the seafloor on the east coast. Various projects have been implemented in one of the most fascinating ocean environments in the east coast of Korea, Gangneung, to develop the east coast as a space for ocean leisure and carbon reduction because of the excellent ocean view and clean air. In this project, we plan to install an artificial reef to increase the number of seaweed and fish, establish a space for the submarine ecosystem, and provide a carbon reduction source. Nevertheless, artificial reefs in general shapes are unlikely to be installed and maintained on the east coast owing to the large water depth and wave energy in the shallow water zone, as mentioned above. The sunken vessel’s deployment location’s sediment type is pelitic and psammitic (muddy or sandy ground), which makes the structures above these sediment types significantly vulnerable to waves and water flows as the vessel is placed in a shallow water zone due to their fine-grained sediment property. For this reason, this sunken vessel artificial reef can encounter topographic changes such as scouring and stability issues. As the “Guidelines and Management Practice for Artificial Reef Siting, Use, Construction, and Anchoring in Southeast Florida” illustrates, artificial reef managers are encouraged to run a stability analysis using computer software programs for post-construction phase risks [6]. When a giant ship that has ended its lifespan comes to be used in the sea as an artificial reef, it is expected to create a fish farm as it has a lot of porosity, so algae will stick to the hull easily, and various fish will lay eggs and use it as a shelter. Before going ahead, a review on whether the sunken vessel is applicable to use as an artificial reef should be analyzed first.
Therefore, in this study, we analyzed the applicability of a sunken vessel as an artificial reef that can bear high wave energy using various methods. The study evaluated the structural stability of a sunken vessel artificial reef using the computer software program Simulating Waves Nearshore (SWAN) and REEF3D models to simulate the wave energy in the area where the vessel was installed. The SWAN model is utilized to characterize the waves for a 10-year return period and determine the sunken vessel artificial reef’s deployment position and direction. The SWAN model result data is computed for running REEF3D hydrodynamic simulation analysis and two-dimensional cross-sectional hydraulic model experiment. Thus, this study evaluates the structural stability of the sunken vessel artificial reef by calculating the marine physical forces, such as currents and waves, and measuring the wave pressure at the side of the sunken vessel artificial reef through a hydraulic model experiment. The topographic changes are also examined and predicted in the evaluation stage for applicability of this vessel as an artificial reef.

2. Materials and Methods

2.1. Numerical Model Experiment

2.1.1. SWAN Model—Design Wave Energy Experiment

A design wave energy experiment uses the Simulating Waves Nearshore (SWAN) model to review wave changes under the conditions of the approach of deep-water design waves to target waters and calculates the marine physical force directly affecting artificial reefs based on sunken ships. The analyses were conducted to find out the characteristics of the simulation of high-resolution coastal weather at the study site, i.e. sea surface wind, significant wave height, and significant wave period. The SWAN model is a third-generation wave model that computes random, short-crested wind-generated waves in coastal regions and inland waters [7]. The SWAN model is developed by the Delft University of Technology in the Netherlands. This third-generation numerical wave model estimates characteristic factors of waves in adjacent seas, lakes, and estuaries based on conditions of wind, water depth, and ocean currents. In this model, an equilibrium equation applied to waves is established as a governing equation [8,9]. The results of this experiment can be utilized as base data to evaluate the stability of such artificial reefs. As indicated in Table 1, the size of large and detailed regions is distinguished to generate grids. Moreover, deep-water design waves, as indicated in Table 2, are calculated based on data of the Estimated Report II on Deep-Water Design Waves at the Entire Seas in Korea [10]. The 10-year return period of waves was analyzed and used throughout the experiment, as we are analyzing the impacts of high wave energy for the applicability of sunken vessel.
Furthermore, this model is evaluated and found to be appropriate to calculate the marine physical forces affecting sunken vessel artificial reefs, given that diffraction effects on islands and structures are reflected. This model considers advection in spatial coordinates during diffusion, refraction due to water depth and flow, shoaling due to water depth and flow, wave blocking, reflection, and diffraction by obstacles, wave energy dissipation by wind, wave energy dissipation by white capping, wave breaking, and bottom friction, and energy exchange by non-linear interactions. Figure 1 shows the computational grid and topography of the sunken vessel deployment location and considered area for running the SWAN model.

2.1.2. REEF3D—Numerical Wave Flume Experiment

The REEF3D model was discretized based on the Reynolds-averaged Navier Stokes (RANS) equation, a convective term based on the fifth weighted essentially non-oscillatory (WENO) method applying the finite difference scheme, and a time term based on the third TVD Runge-Kutta method [11]. Free water surface displacement was analyzed based on the level set method [12], which was developed to examine multi-phase flow at the boundary surface between water and air. The tidal wave and the dissipation boundary were analyzed based on the relaxation method [13]. The governing equation included a continuity equation and a motion equation to solve problems of porous media in the case of the pore structure included. Moreover, the shear stress equation (wall function) was applied to calculate scouring and sedimentation. It was evaluated that this equation was appropriate to review the hydraulic characteristics of the artificial reef against the approaching wave in a three-dimensional way. Moreover, it was estimated that the effects of approaching waves would vary according to water depth due to a change in hydraulic characteristics which occur at the front part of the artificial reef during its installation and sectional sedimentation and erosion of drift sand. Thus, experiments were conducted according to water depths of 30 m and 40 m in this study. For the three-dimensional numerical analysis, the model area is composed of X(315 m), Y(95 m), and Z(60 m), and a variable grid of 0.5 m to 1.0 m is applied for a total of 1,795,500 grids. The experimental details are indicated in Table 3 with a schematic view of the calculation in Figure 2.
When a sunken vessel artificial reef is installed, a change in the flow direction, change in strength, or vortex occurs according to the type of cross-section due to the change in hydraulic characteristics generated at the size of the structure during its installation. To review the stability of structures that might be affected by such phenomena, the wave pressure on the side of the sunken vessel was measured at Lines 1, 2, and 3 during the simulation as shown in Figure 3.

2.2. Hydraulic Model Experiment

Ship motions are represented by six main components corresponding to the six degrees of freedom in the 3D space. Surge, sway, and heave correspond to the translation motions along the x, y, and z-axis respectively, while roll, pitch, and yaw are the rotation motions also in the x, y, and z respectively. Because numerical simulations do not compute the ship motions [14], a hydraulic model experiment is applied in this research to implement a hydraulic phenomenon consistent with the practical phenomenon such as ship’s movement. To this end, conditions similar to practical conditions are established in the model, and water is applied. When a hydraulic model reflecting the prototype conditions at a reduced scale is utilized to solve the problem provided in the experiment, a rule for clearly defining a relationship between the prototype and the model should be developed to predict values in prototype conditions based on experimental results. To satisfy similarity between the prototype and the model, geometric, kinematic, and dynamic similarity should be fulfilled [15].
Geometric similarity refers to the scale of the prototype being reduced by a certain ratio and implemented in a model. A model is called a normal model when the same scaling ratio is applied to both the vertical and horizontal dimensions. If not, it is called a tilted model. The length ratio is a factor serving as a standard in the geometric similarity law, and is expressed as follows:
L γ = L ρ   /   L m ,
Here, L is the length, and subscripts γ, ρ, m are the scaling ratio, prototype, and model, respectively.
Kinematic similarity means that an acceleration ratio should be maintained to be constant at the corresponding point between the prototype and the model. In other words, the velocity and acceleration of the prototype are represented at a certain scale in the model concerning form-related similarity. In the kinematic similarity law, a velocity ratio, acceleration ratio, and time ratio (Tγ) are expressed as:
U γ = L γ   /   T γ ,
a γ = U γ   /   T γ = L γ   /   T γ 2 ,
T γ = T ρ   /   T m ,
Dynamic similarity refers to the scale of the entire force applied to the prototype, including geometric similarity and kinematic similarity reduced at a certain ratio, which should be consistently applied to the model as well. Although it is desirable to satisfy dynamic similarity in a hydraulic model experiment, the entire force is unlikely to be implemented simultaneously in such experiments, excluding prototype-based experiments. Thus, the most essential force is determined in a process of experiment planning, and dynamic similarity is satisfied according to the force determined. Appropriate calibration is applied to the other types of force. In the dynamic similarity law, inertial force serves as a crucial factor when the force for accelerating fluid exists. Fluid acceleration does not occur as an exceptional case at uniform laminar flow. For this reason, inertial force does not serve as a crucial factor under this condition. The inertial force ratio is expressed as follows:
F γ = ρ γ   L γ 2   U γ 2 ,
Gravity dominates fluid movement under the conditions of waves, currents, or free surface flow, such as open-channel flow. The Froude similarity ratio is applied to the relationship of similarity between the prototype and the model. The scale of the Froude similarity law is as follows:
F γ r = F γ ρ   /   F γ m = U γ   /   Y γ = 1 ,
Here, subscripts ρ, m, and r refer to the model, prototype, and ratio of the prototype to the model, respectively. The entire quantities expressed with the subscript r indicate the quantities of the prototype divided by those of the model. When a scale is determined according to the Froude similarity, physical properties of the model, a possibility of production of the model, cost, and experimental flow that can be supplied are considered. If the scale is too minor, a similarity relationship between the model and prototype may not be established, owing to the scale effect. Therefore, it is important to set an appropriate scale. In this study, the Froude similarity law is applied, given the conditions that gravity dominates flow, turbulent flow is observed, and geometric, kinematic, and dynamic similarities between the prototype and the model are required.
The scale of a model is determined in consideration of targets to be observed in an experiment, experimental conditions, and scales that can ensure the efficiency of the similarity law. As the effects of forces dominating the flow in a prototype are directly applied to a model following the similarity law, the forces dominating the flow in both the prototype and model should be consistent. However, the scale of the model in which the state of flow is dominated by gravity is excessive, and the dominance of the viscous force becomes considerably strong due to the significant decrease in water depth. To avoid the undesirable scale effect, certain scales in the model should be calibrated to maintain the flow states in both the prototype and model under the same dominating force [
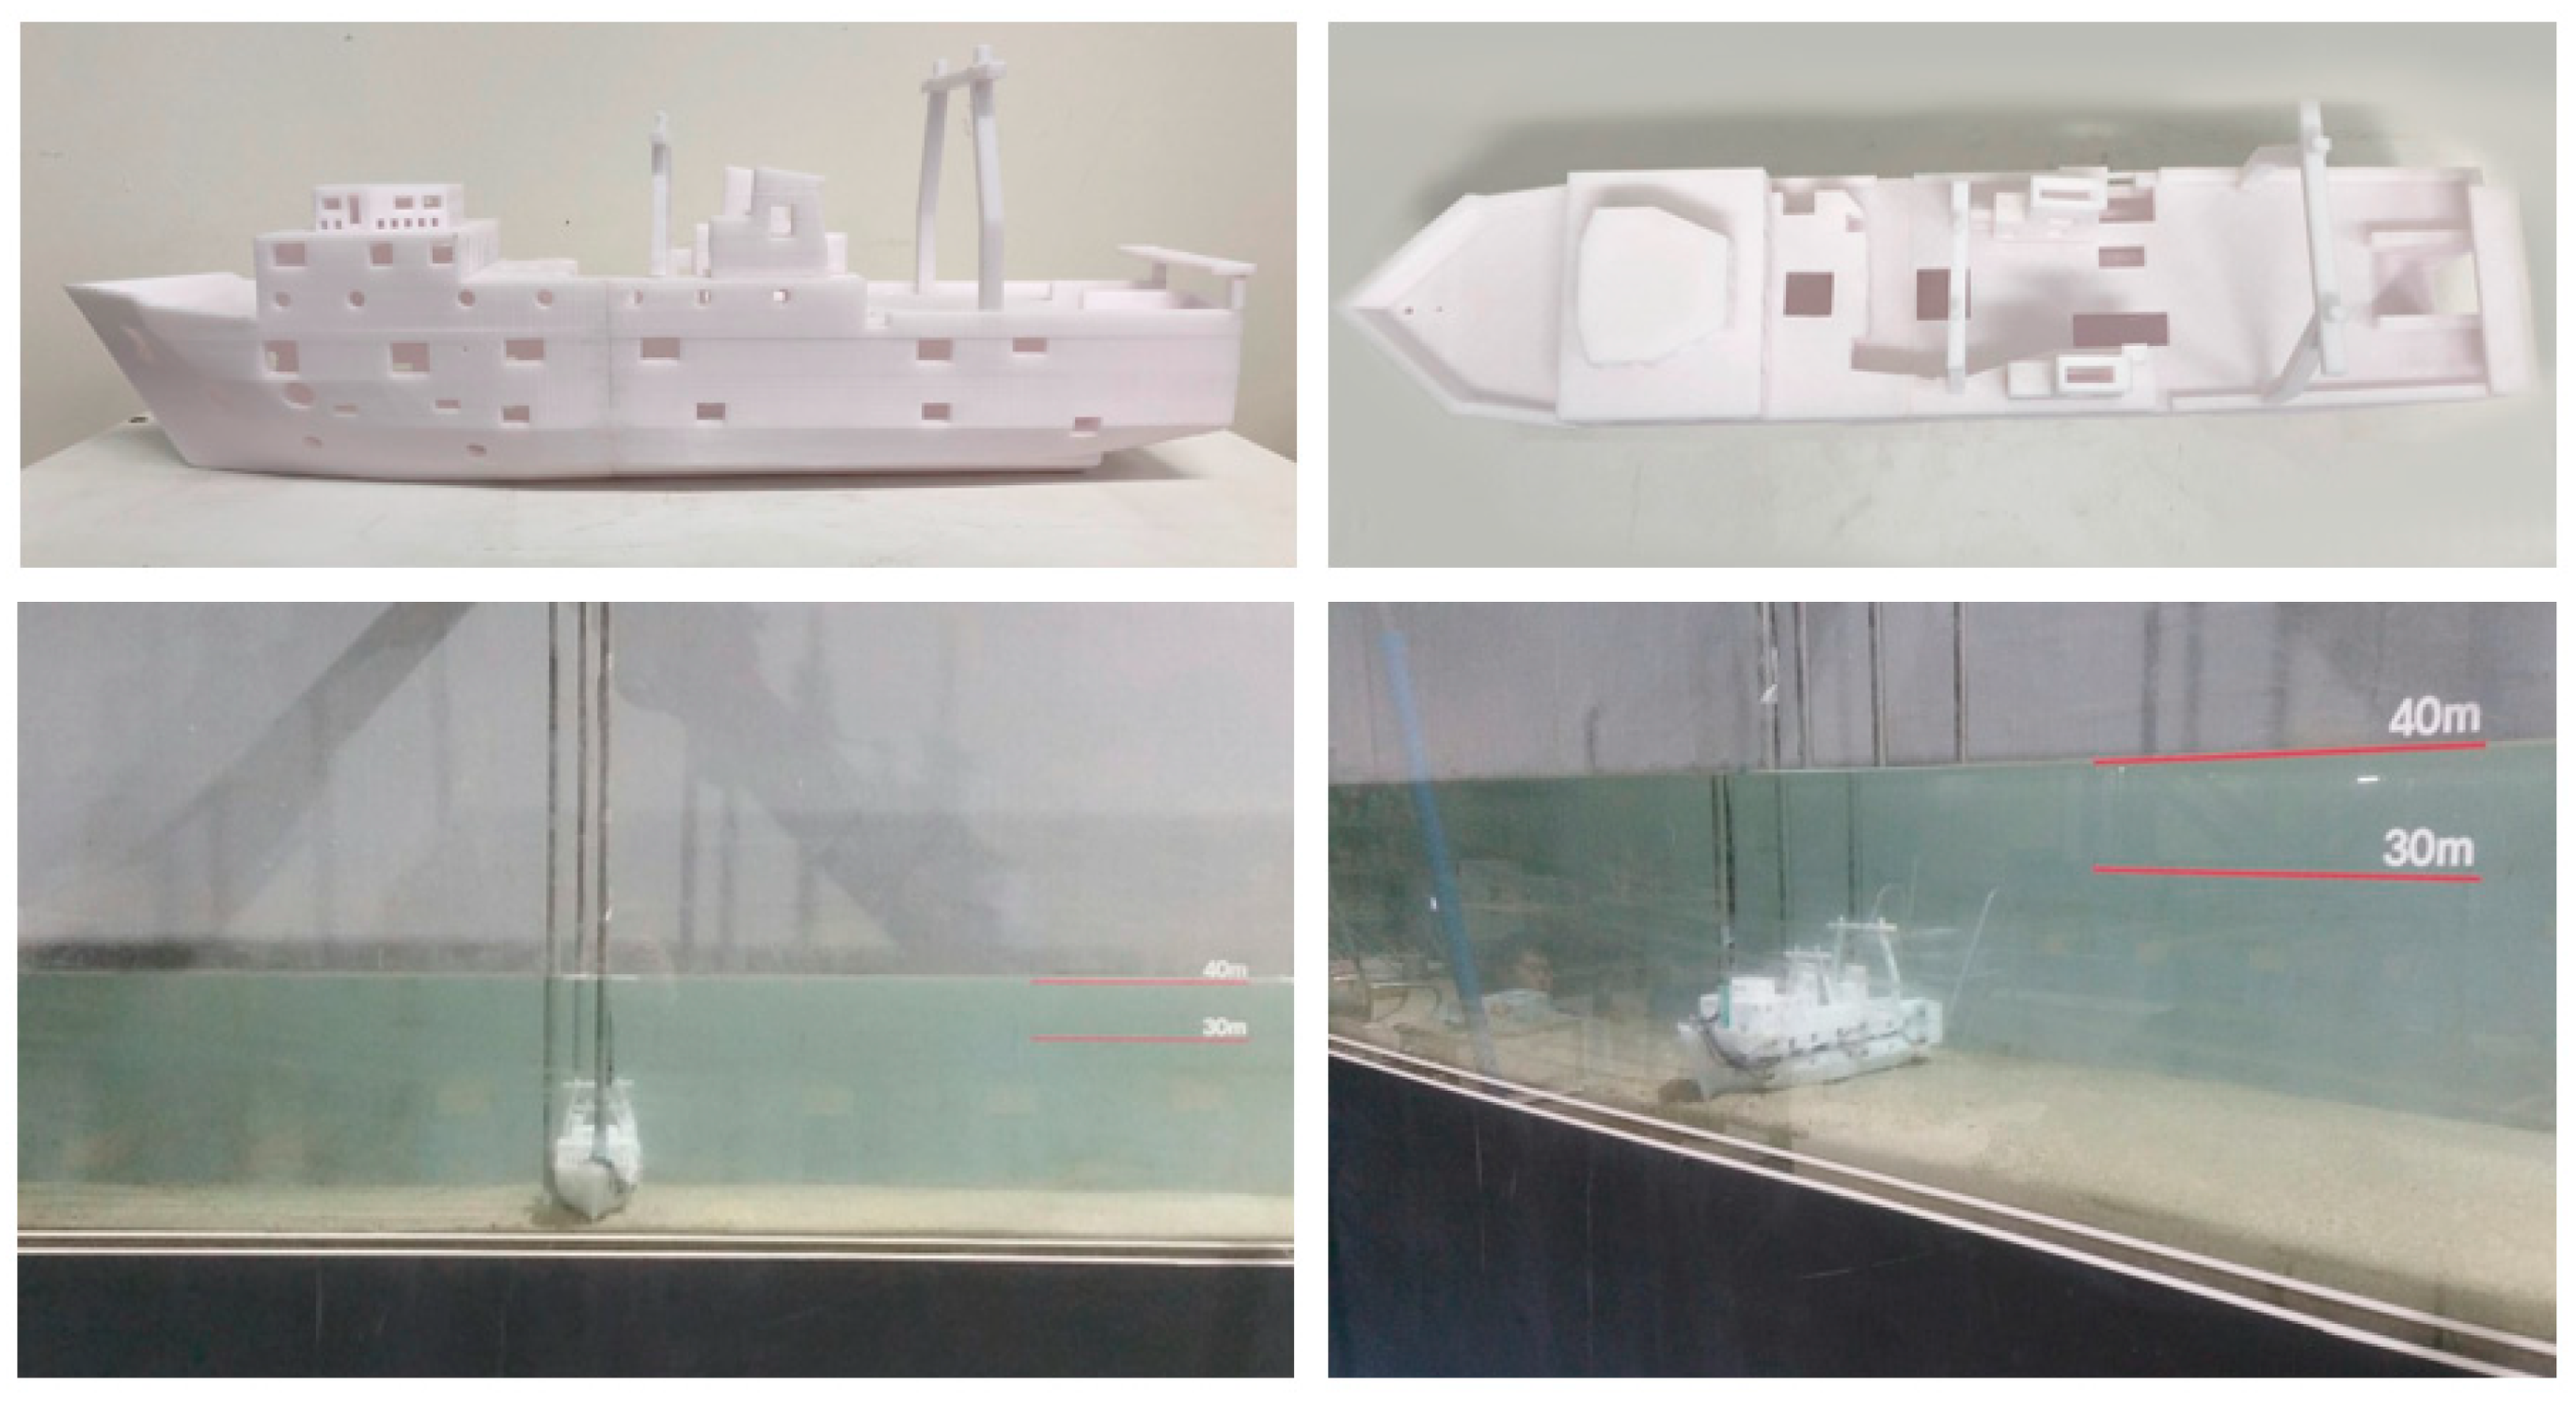
15]. Although it is desirable to produce a model with the maximum scales applied, conditions such as the degree of measurement, size of experimental instruments, and similarity related to phenomena should be practically considered. Thus, a vertical or perpendicular scale of 1/150 was applied in this study as shown in the sunken model in Figure 4. This scale model uses the actual blueprint of the vessel and was printed using a 3D printer considering the scale of 1/150.

Two-Dimensional Cross-Sectional Hydraulic Model Experiment

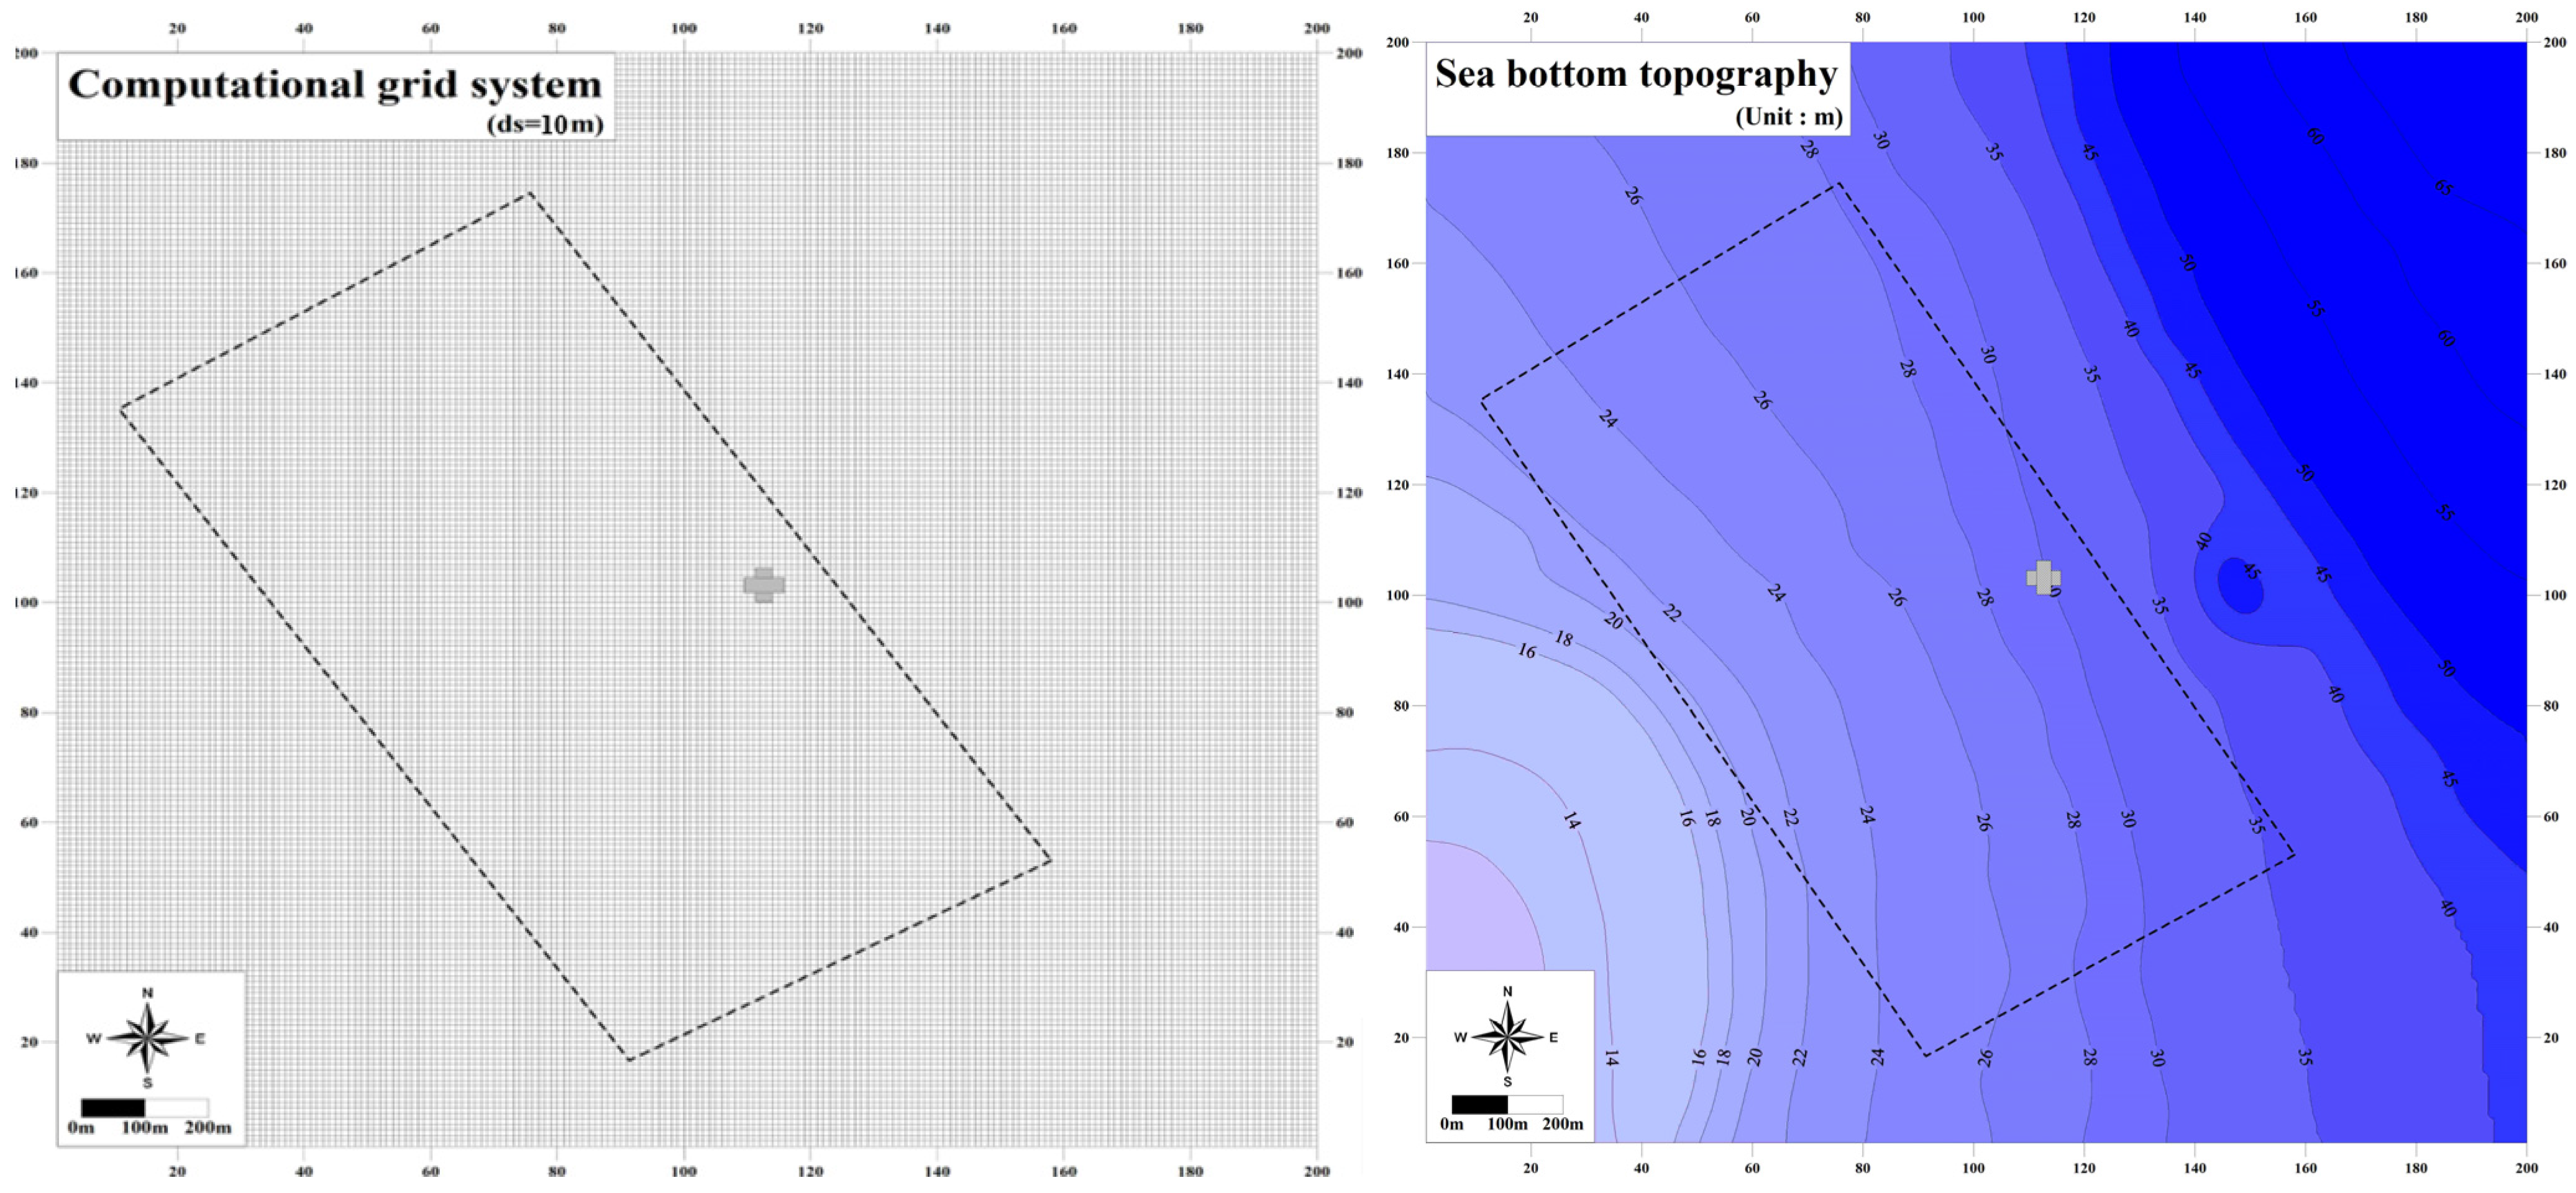
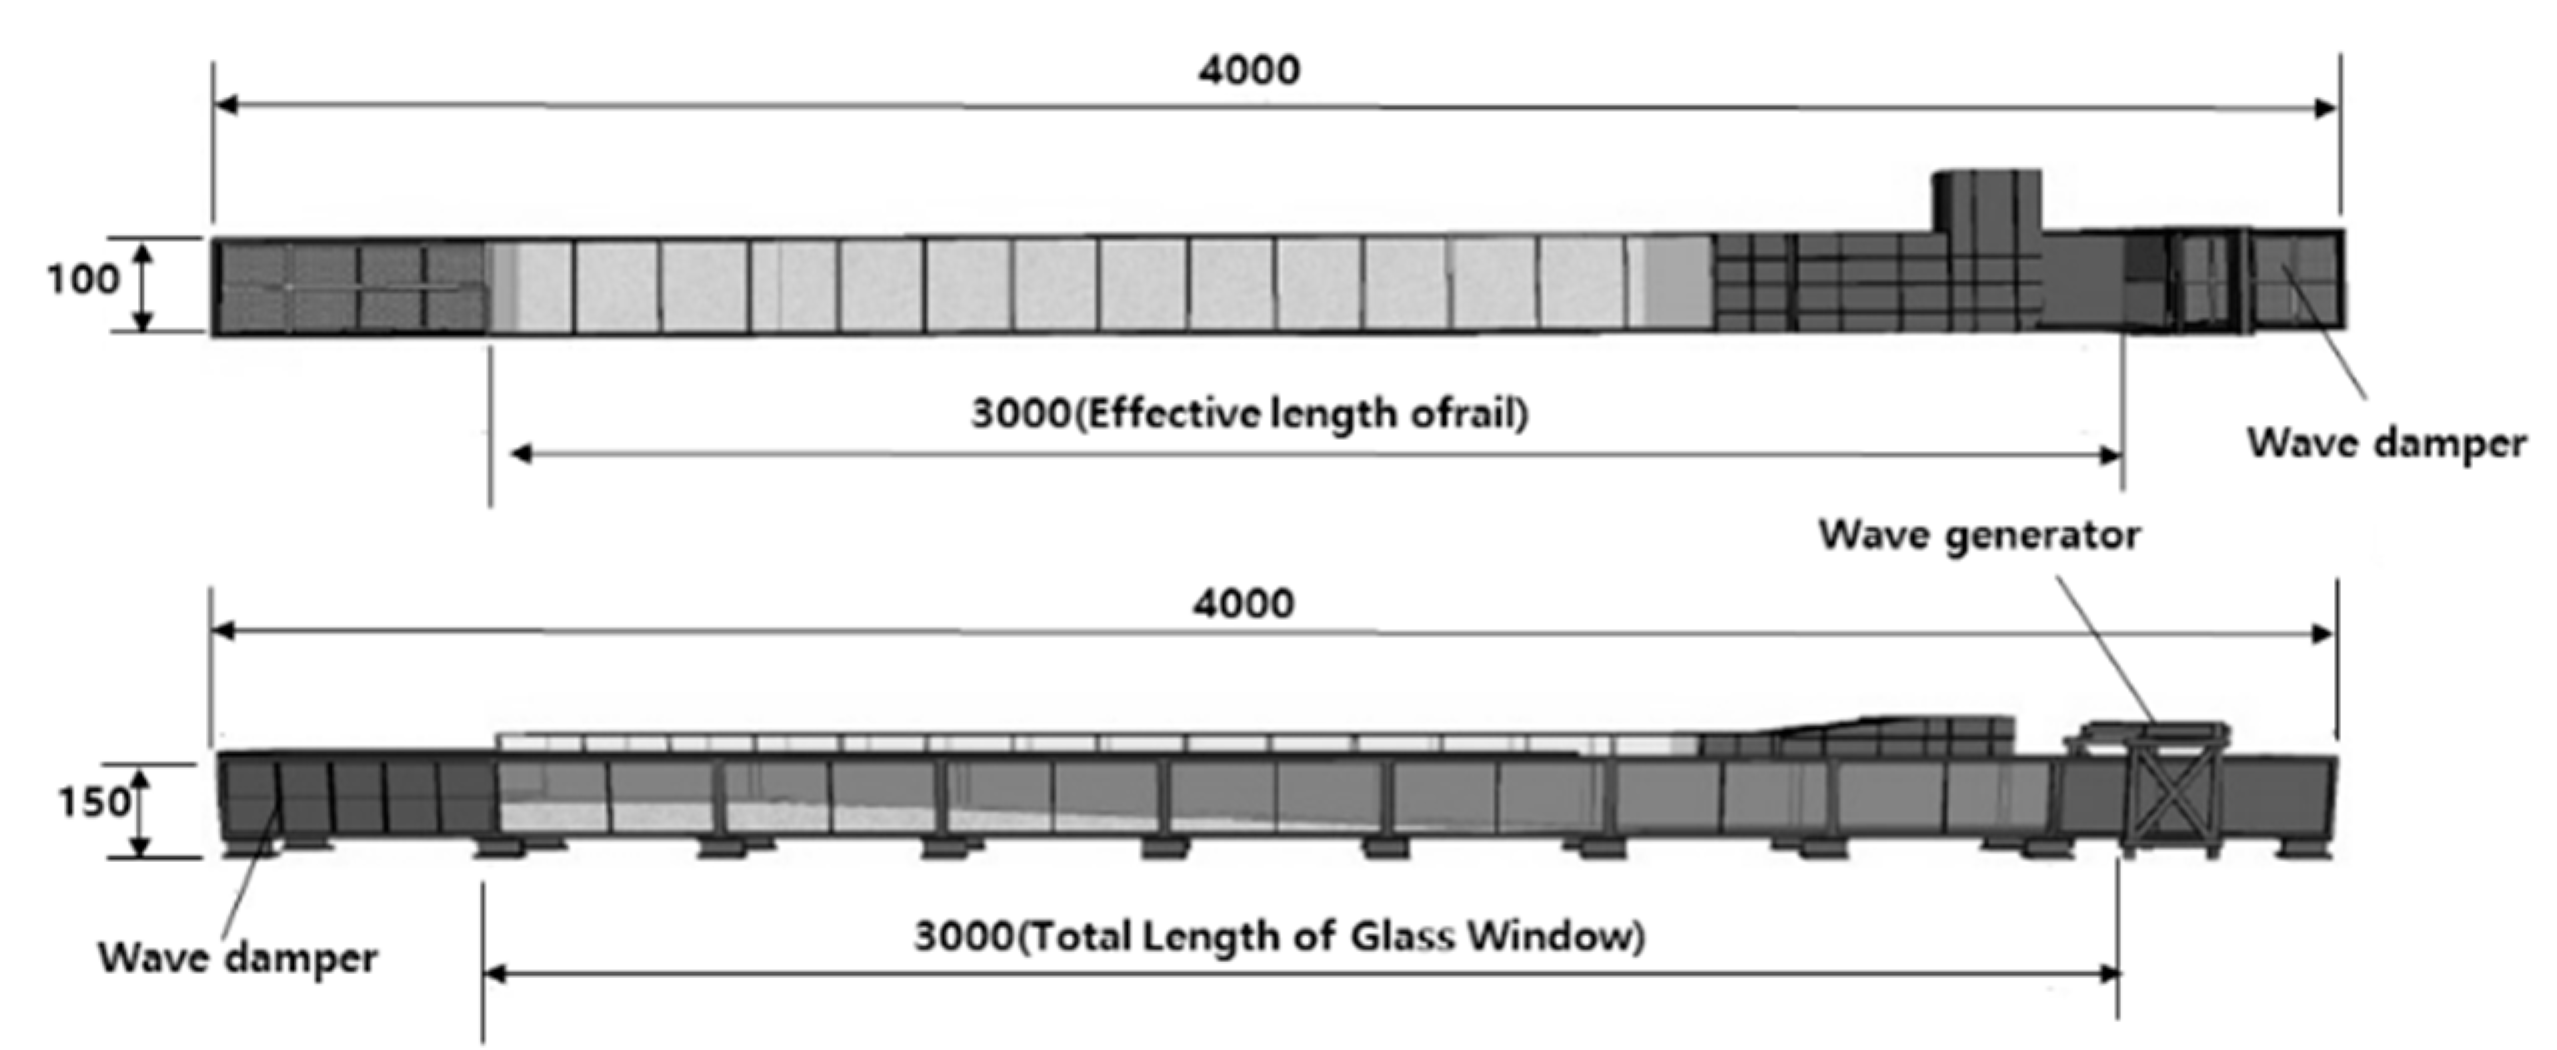
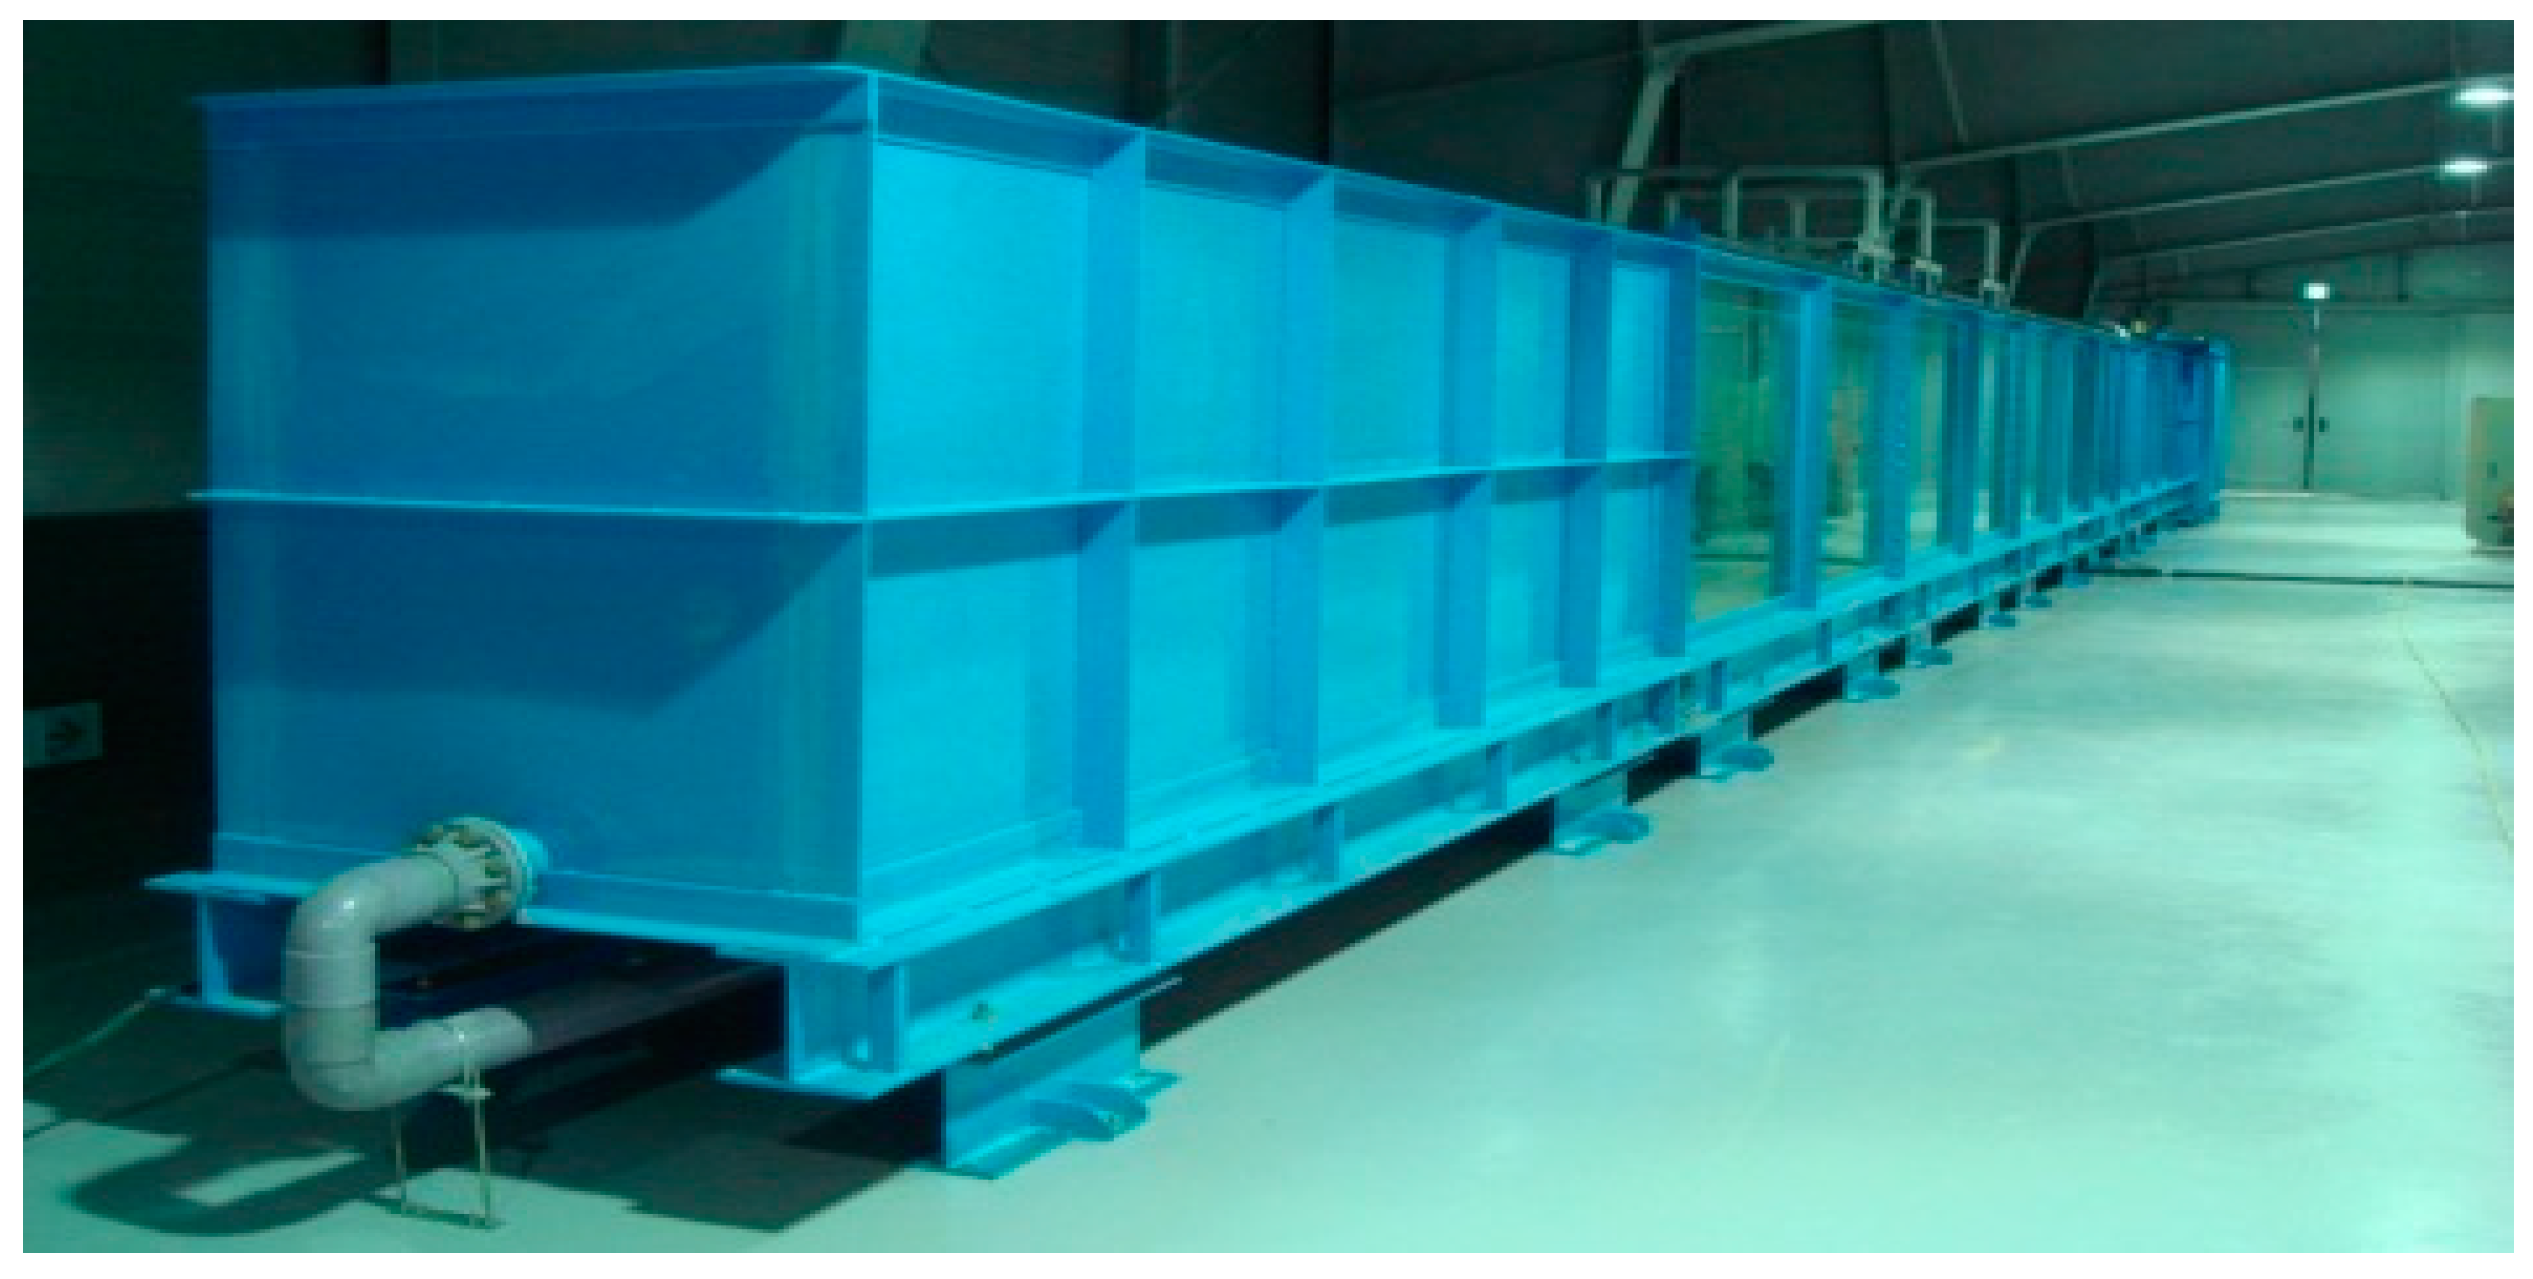
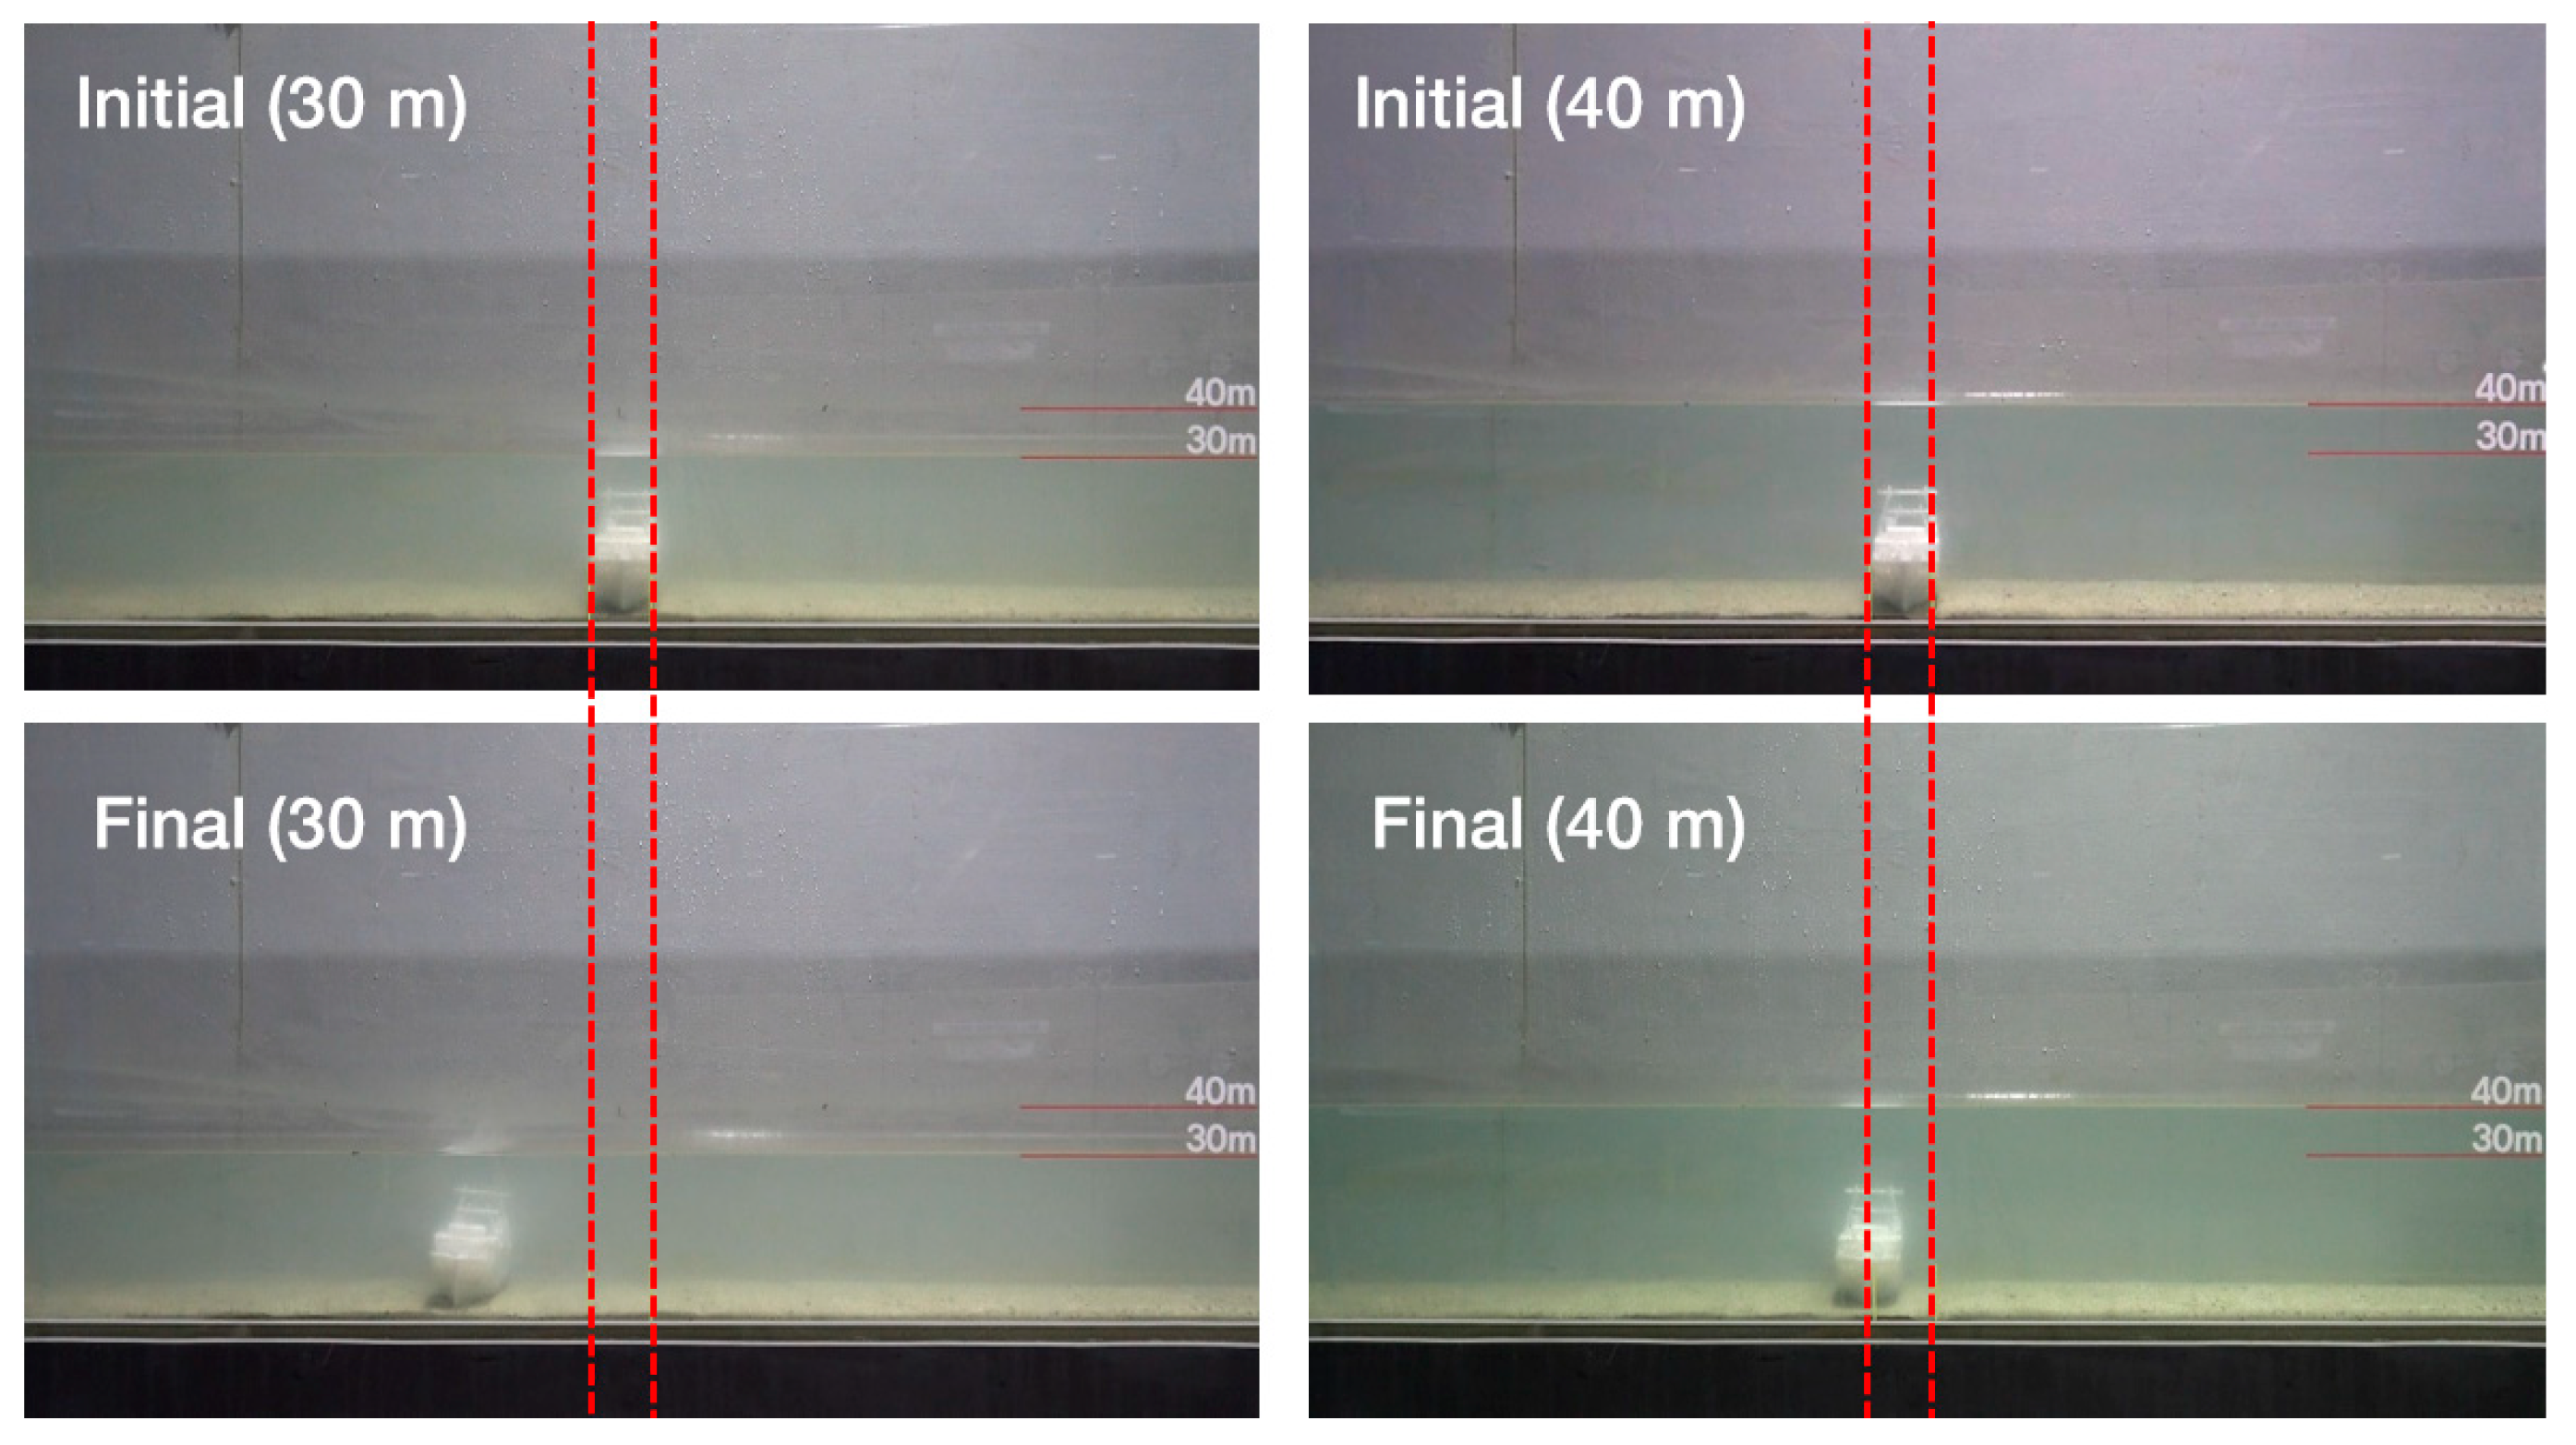
A hydraulic model experiment was performed to visually confirm the scour depth and wave pressure analyzed by the numerical model experiment, and to review the stability of the artificial reef. The two-dimensional cross-sectional tidal wave water tank used in this experiment generated waves by using a piston that was 45 m in length, 1.0 m in width, and 1.0 m in height as indicated in Table 4 and Figure 5. The maximum wave period generated was calculated to be 0.1–3.0 s, and the maximum wave height generated was 0.3 m. As mentioned earlier, the artificial reef model based on the sunken vessel was produced at the scale of 1/150 through 3D printing for use in the hydraulic model experiment. In addition, the weight of the structure was adjusted based on a mortar and a lead sinker, following the similarity law.
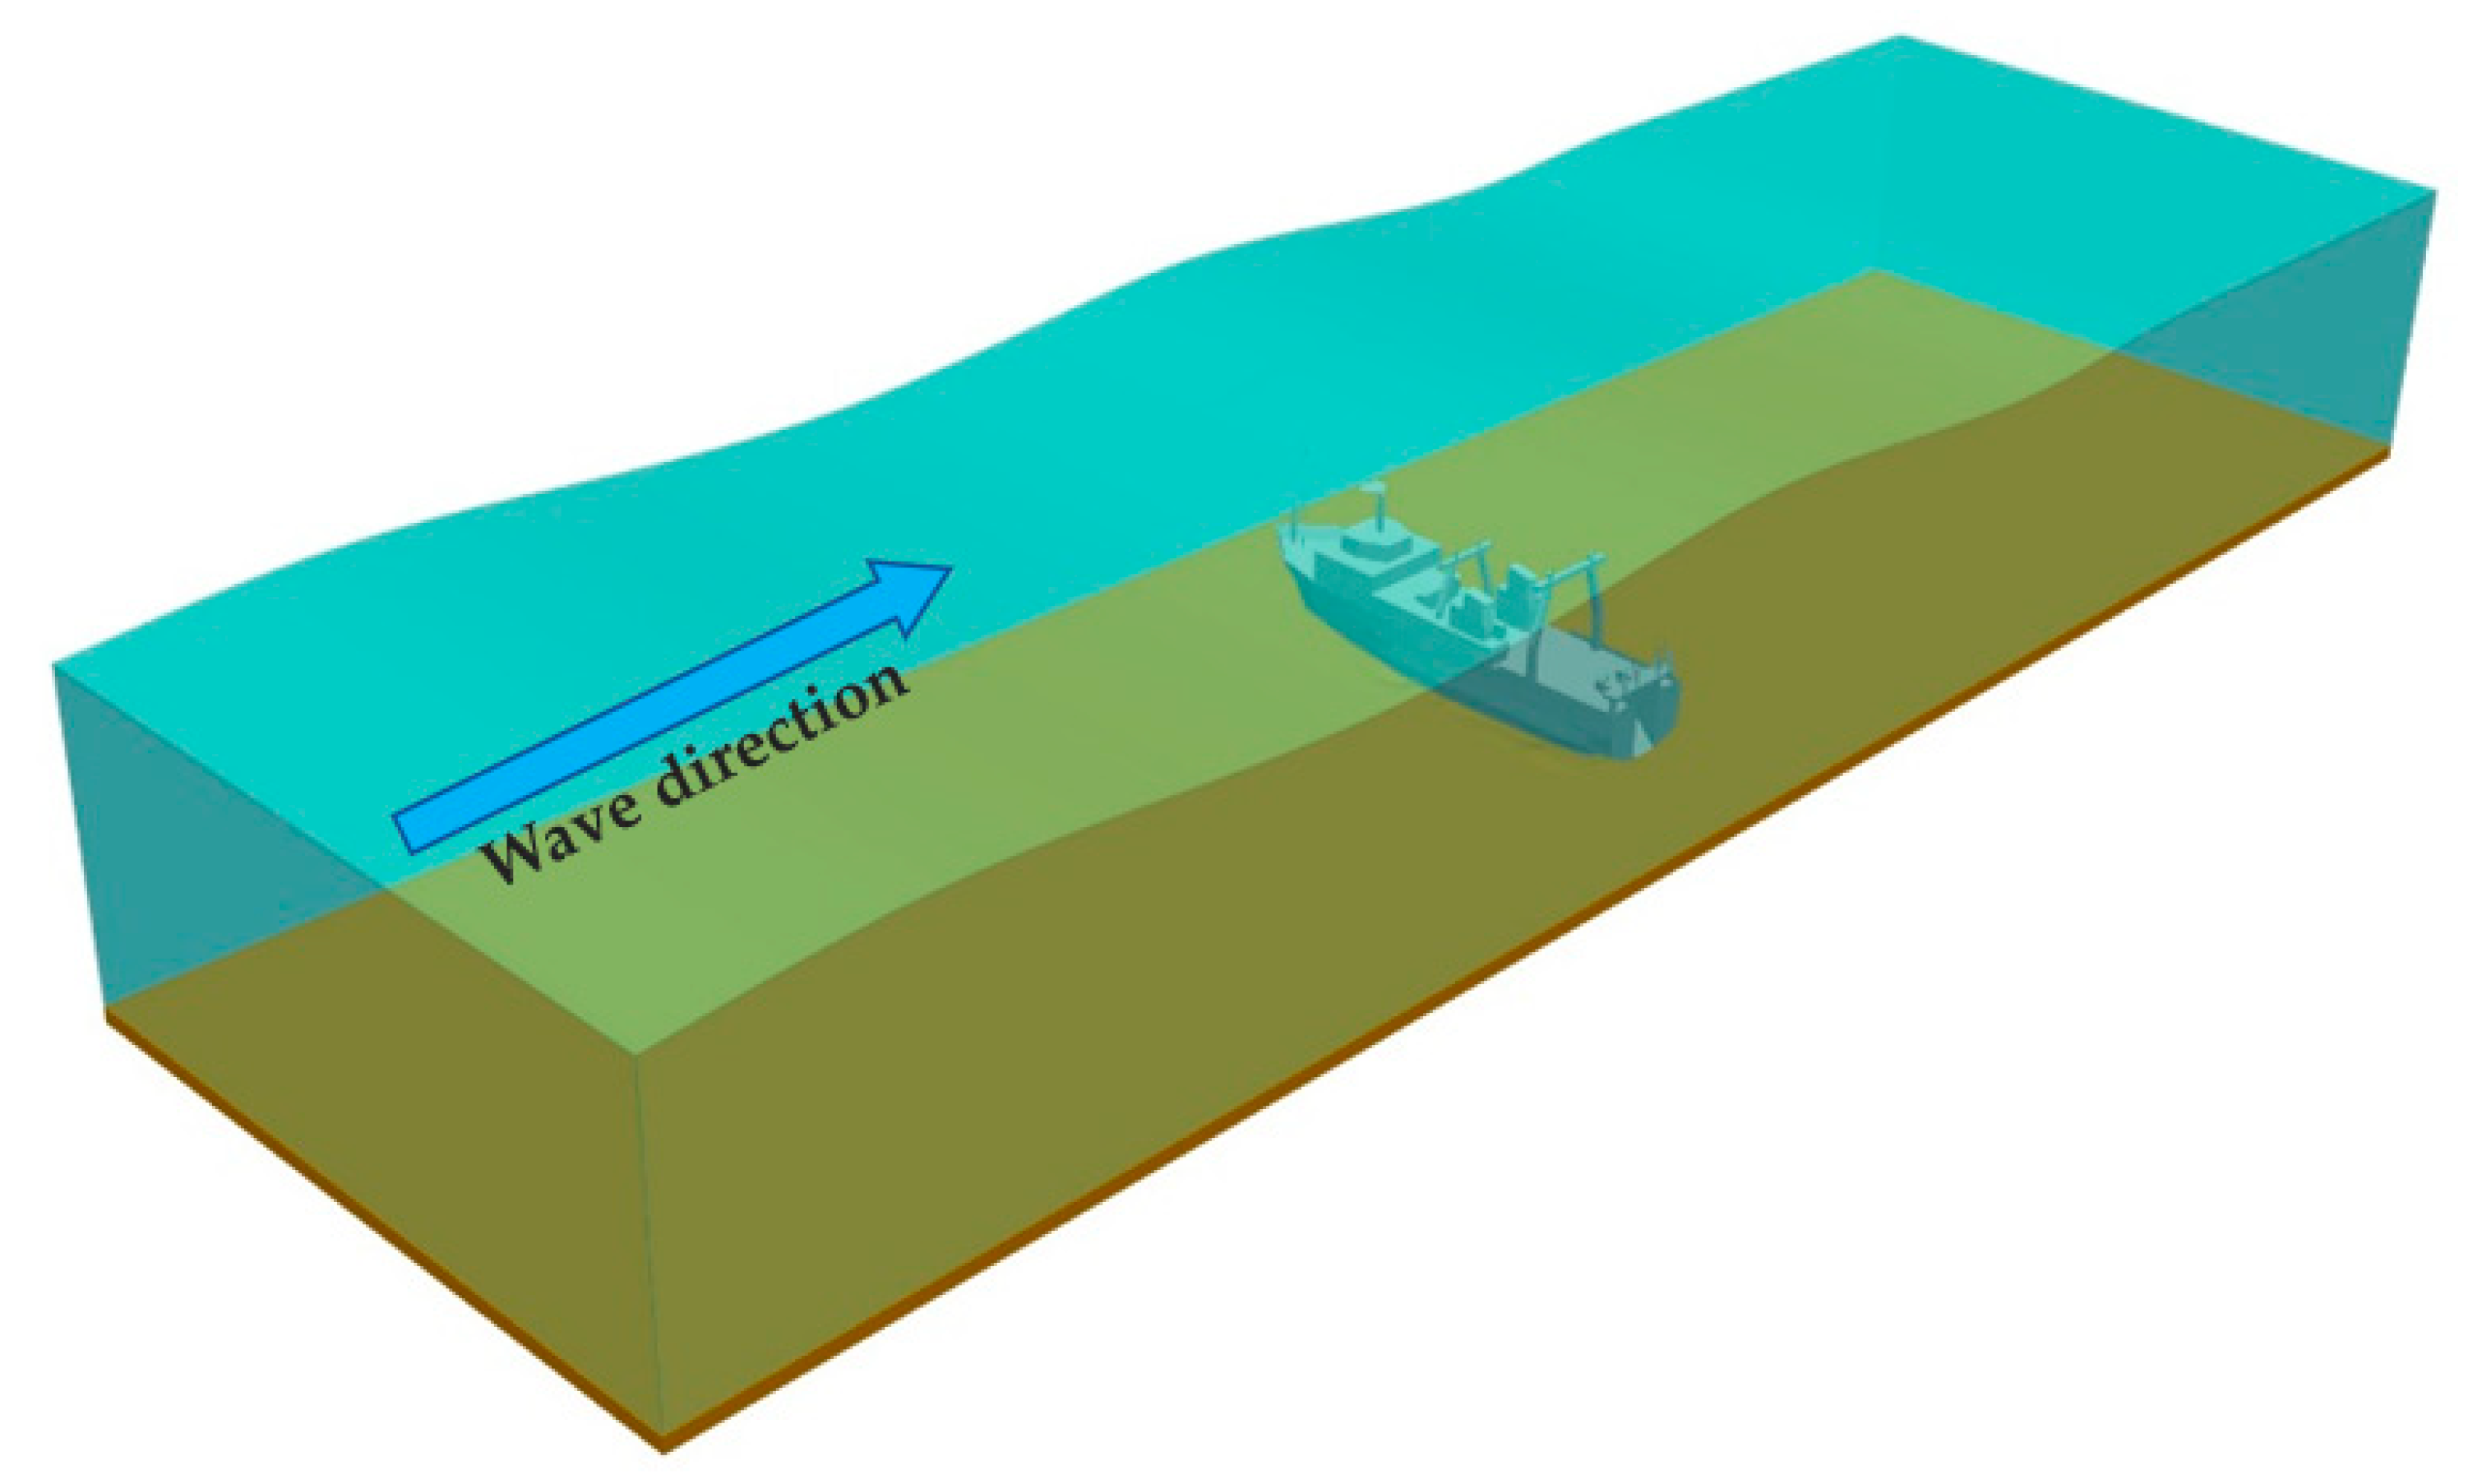
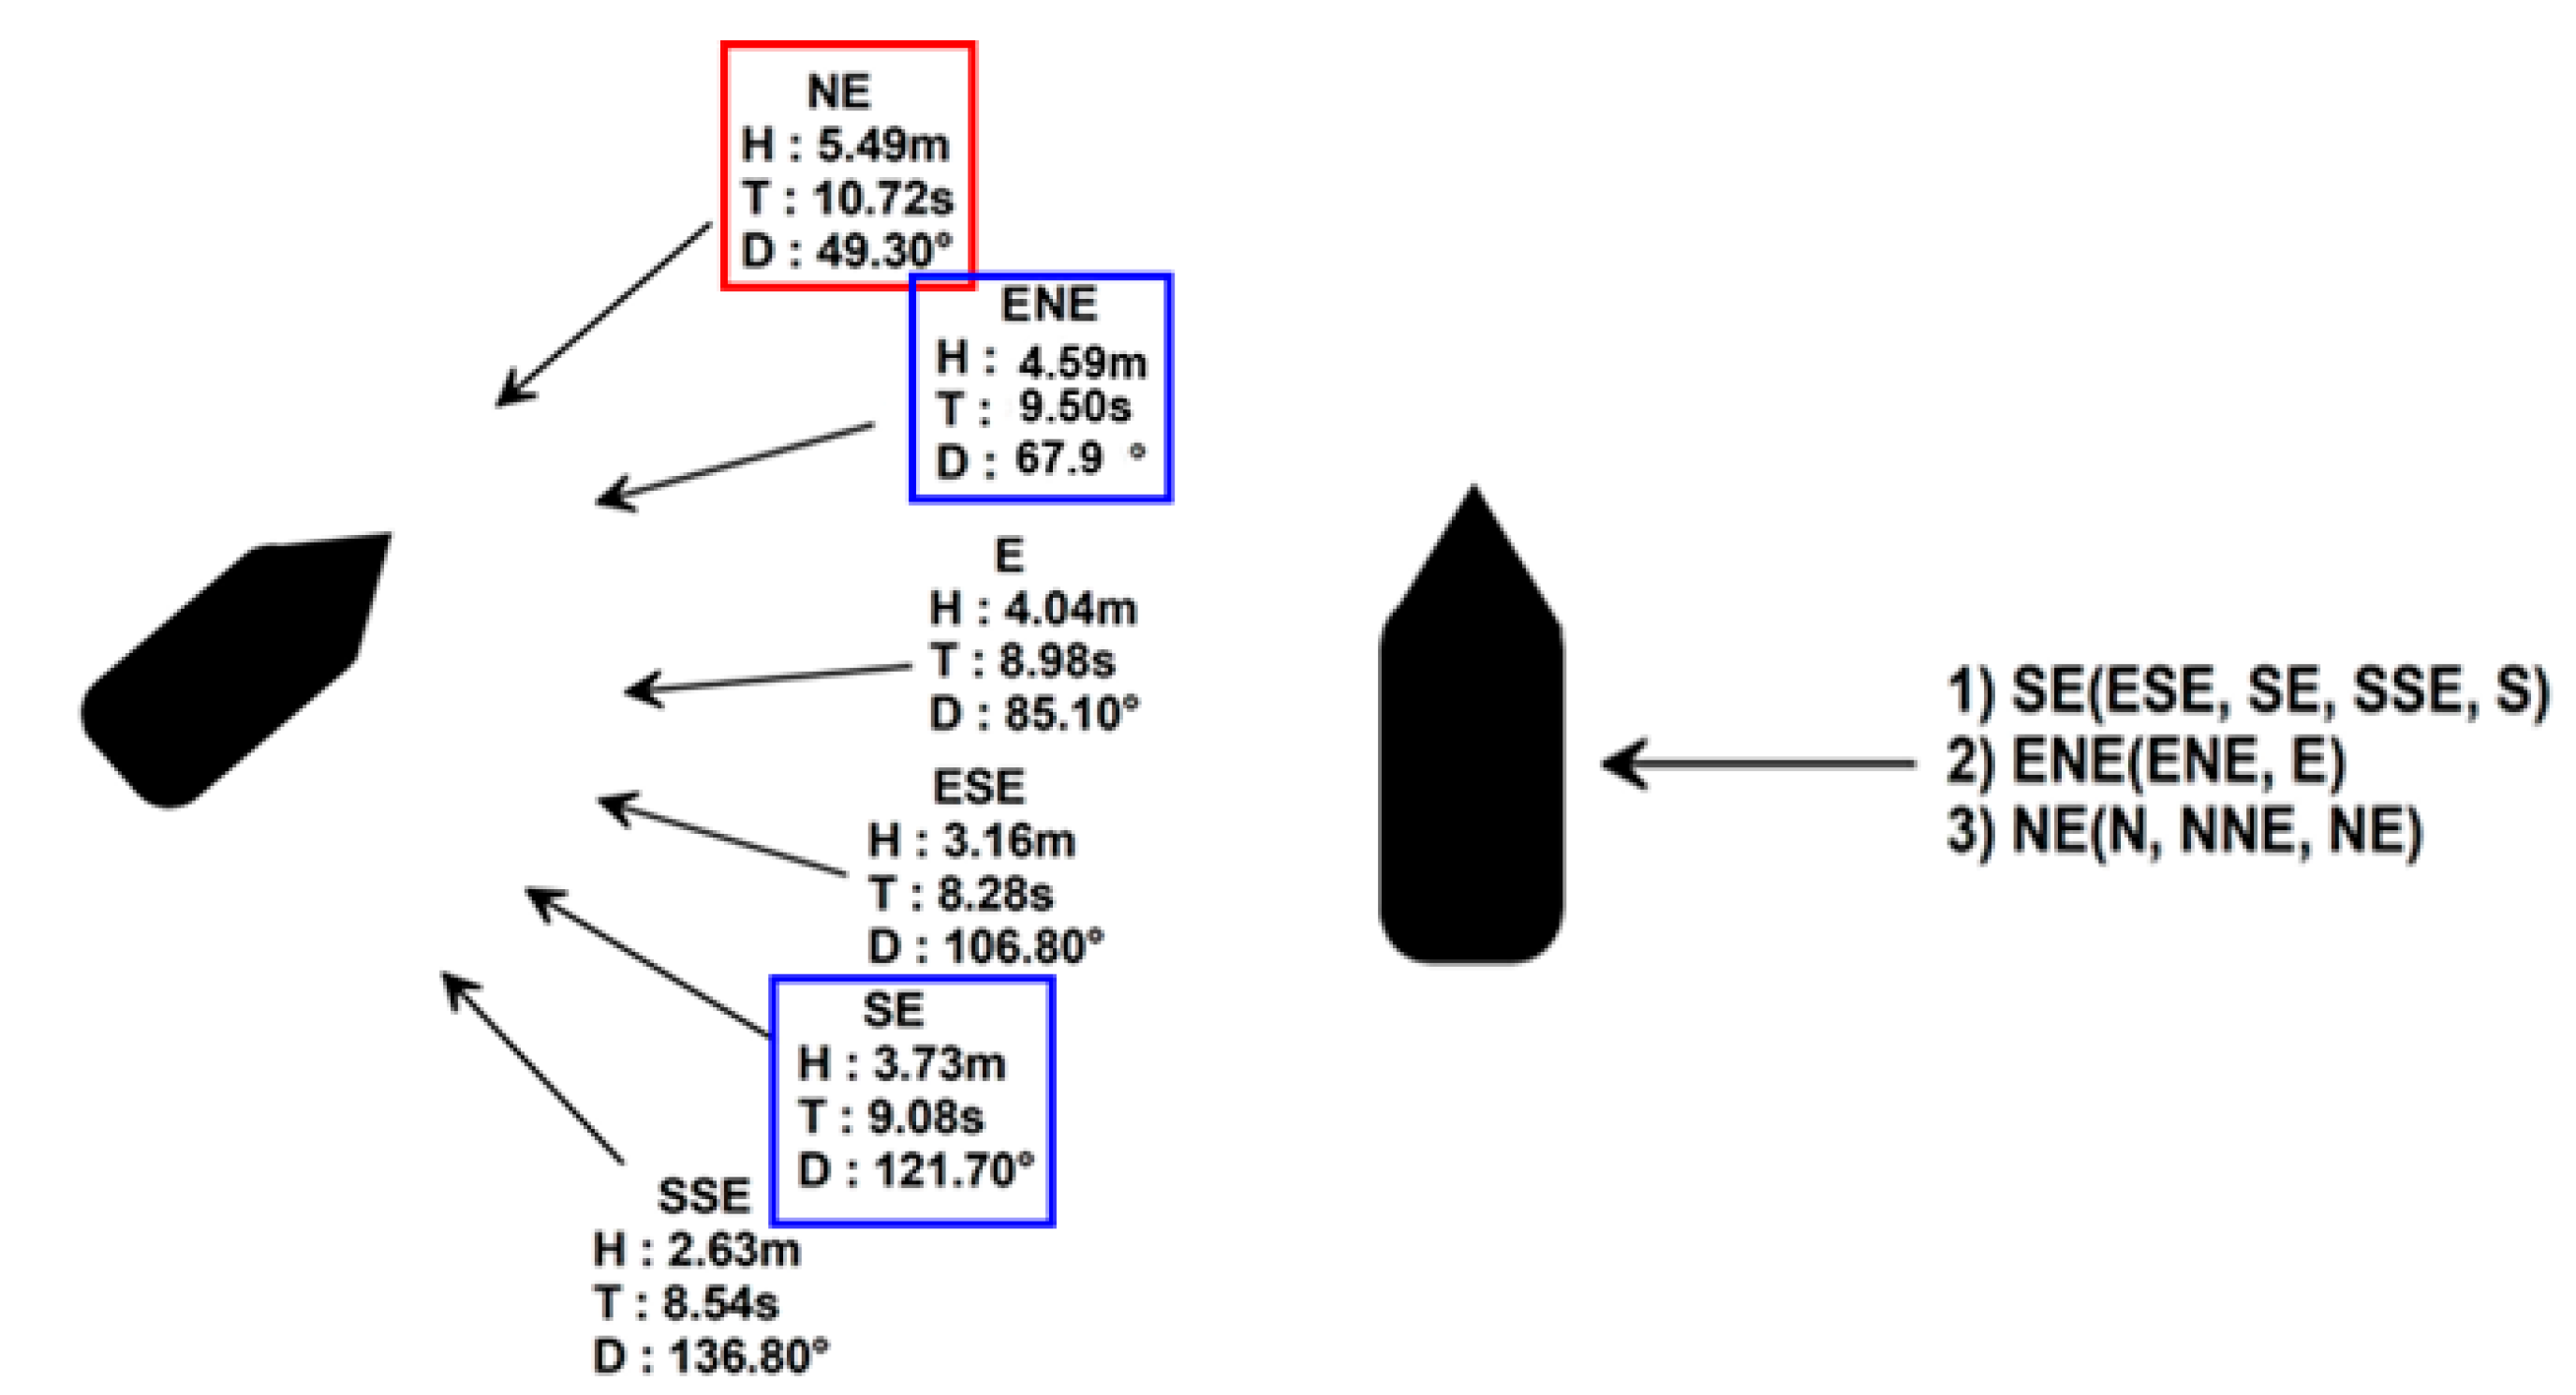
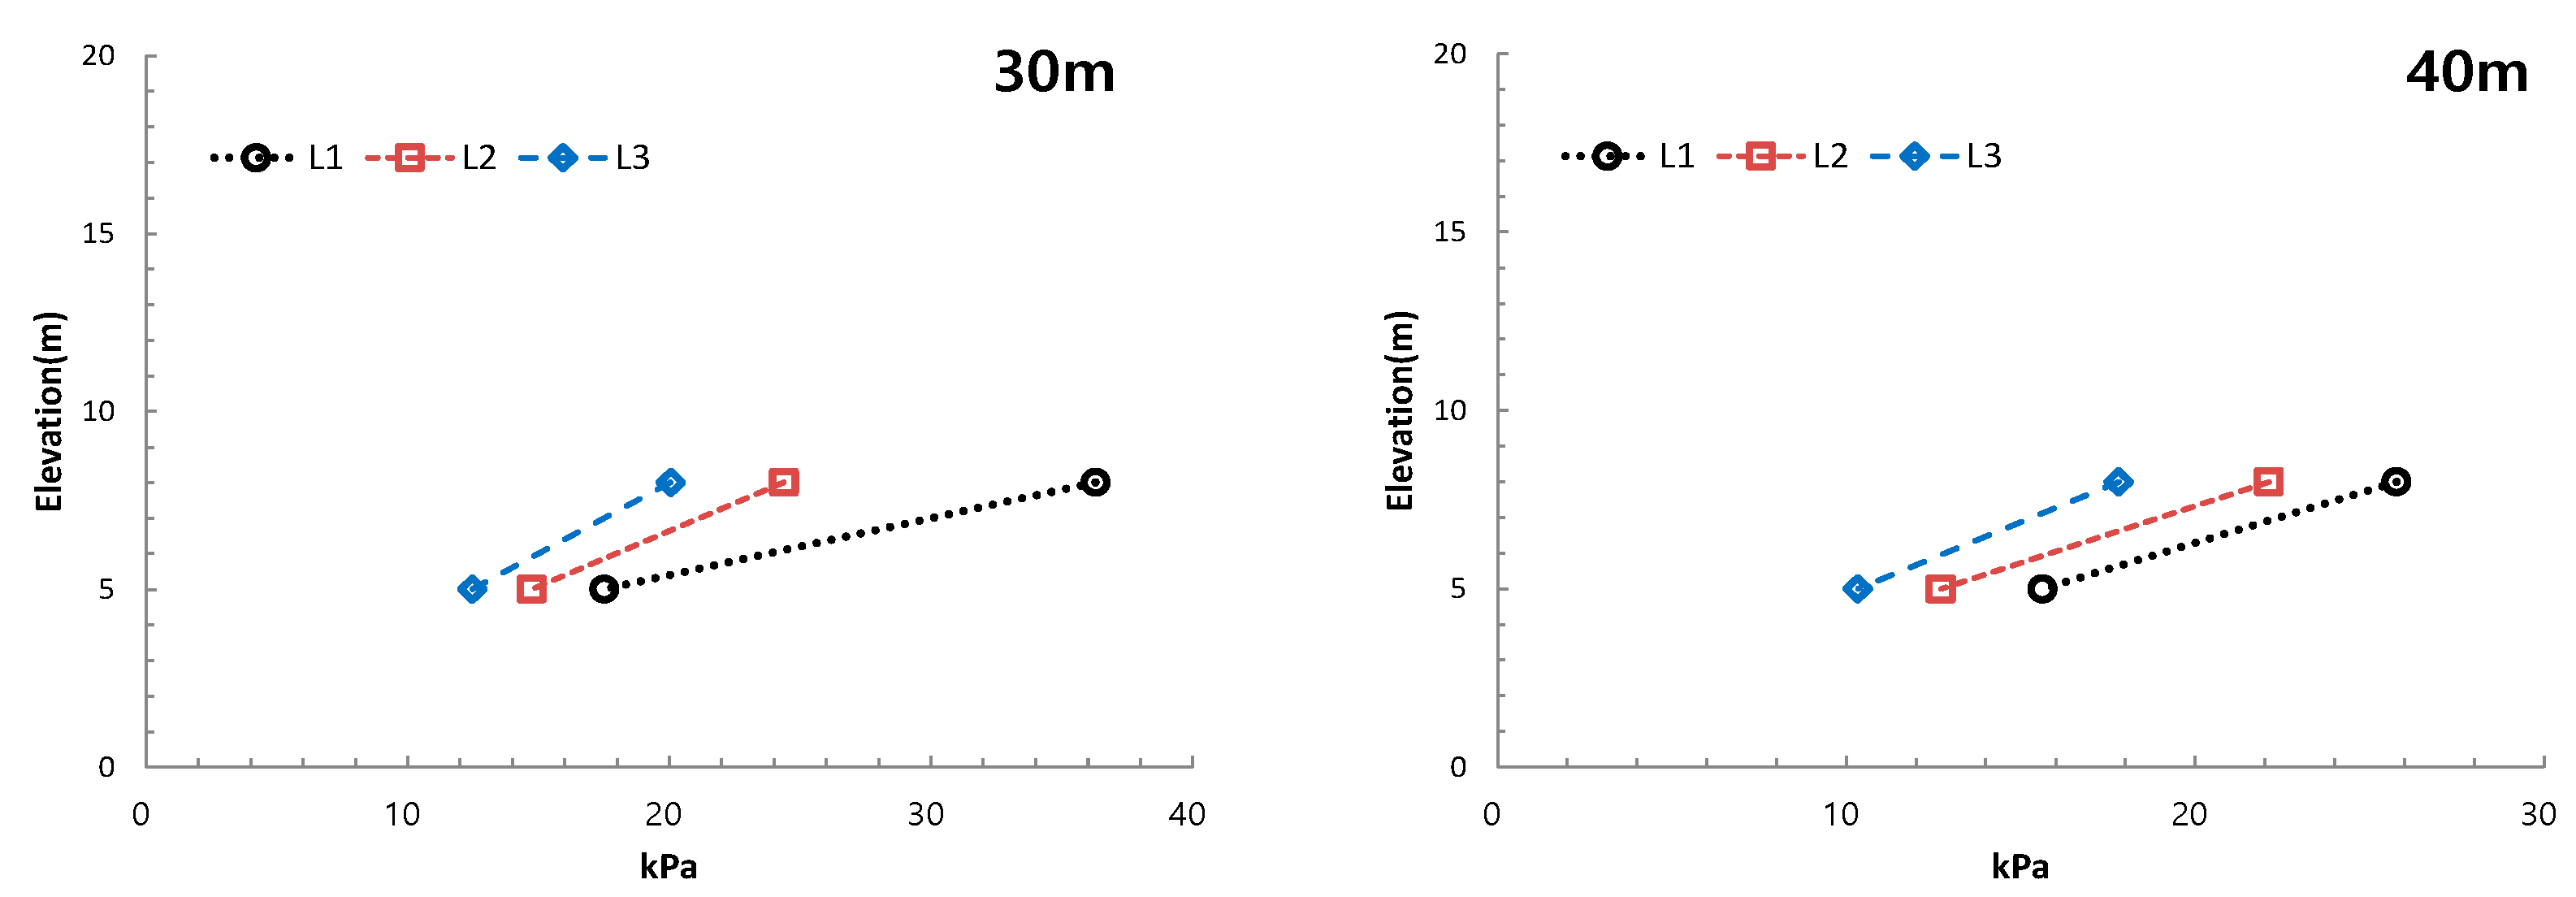
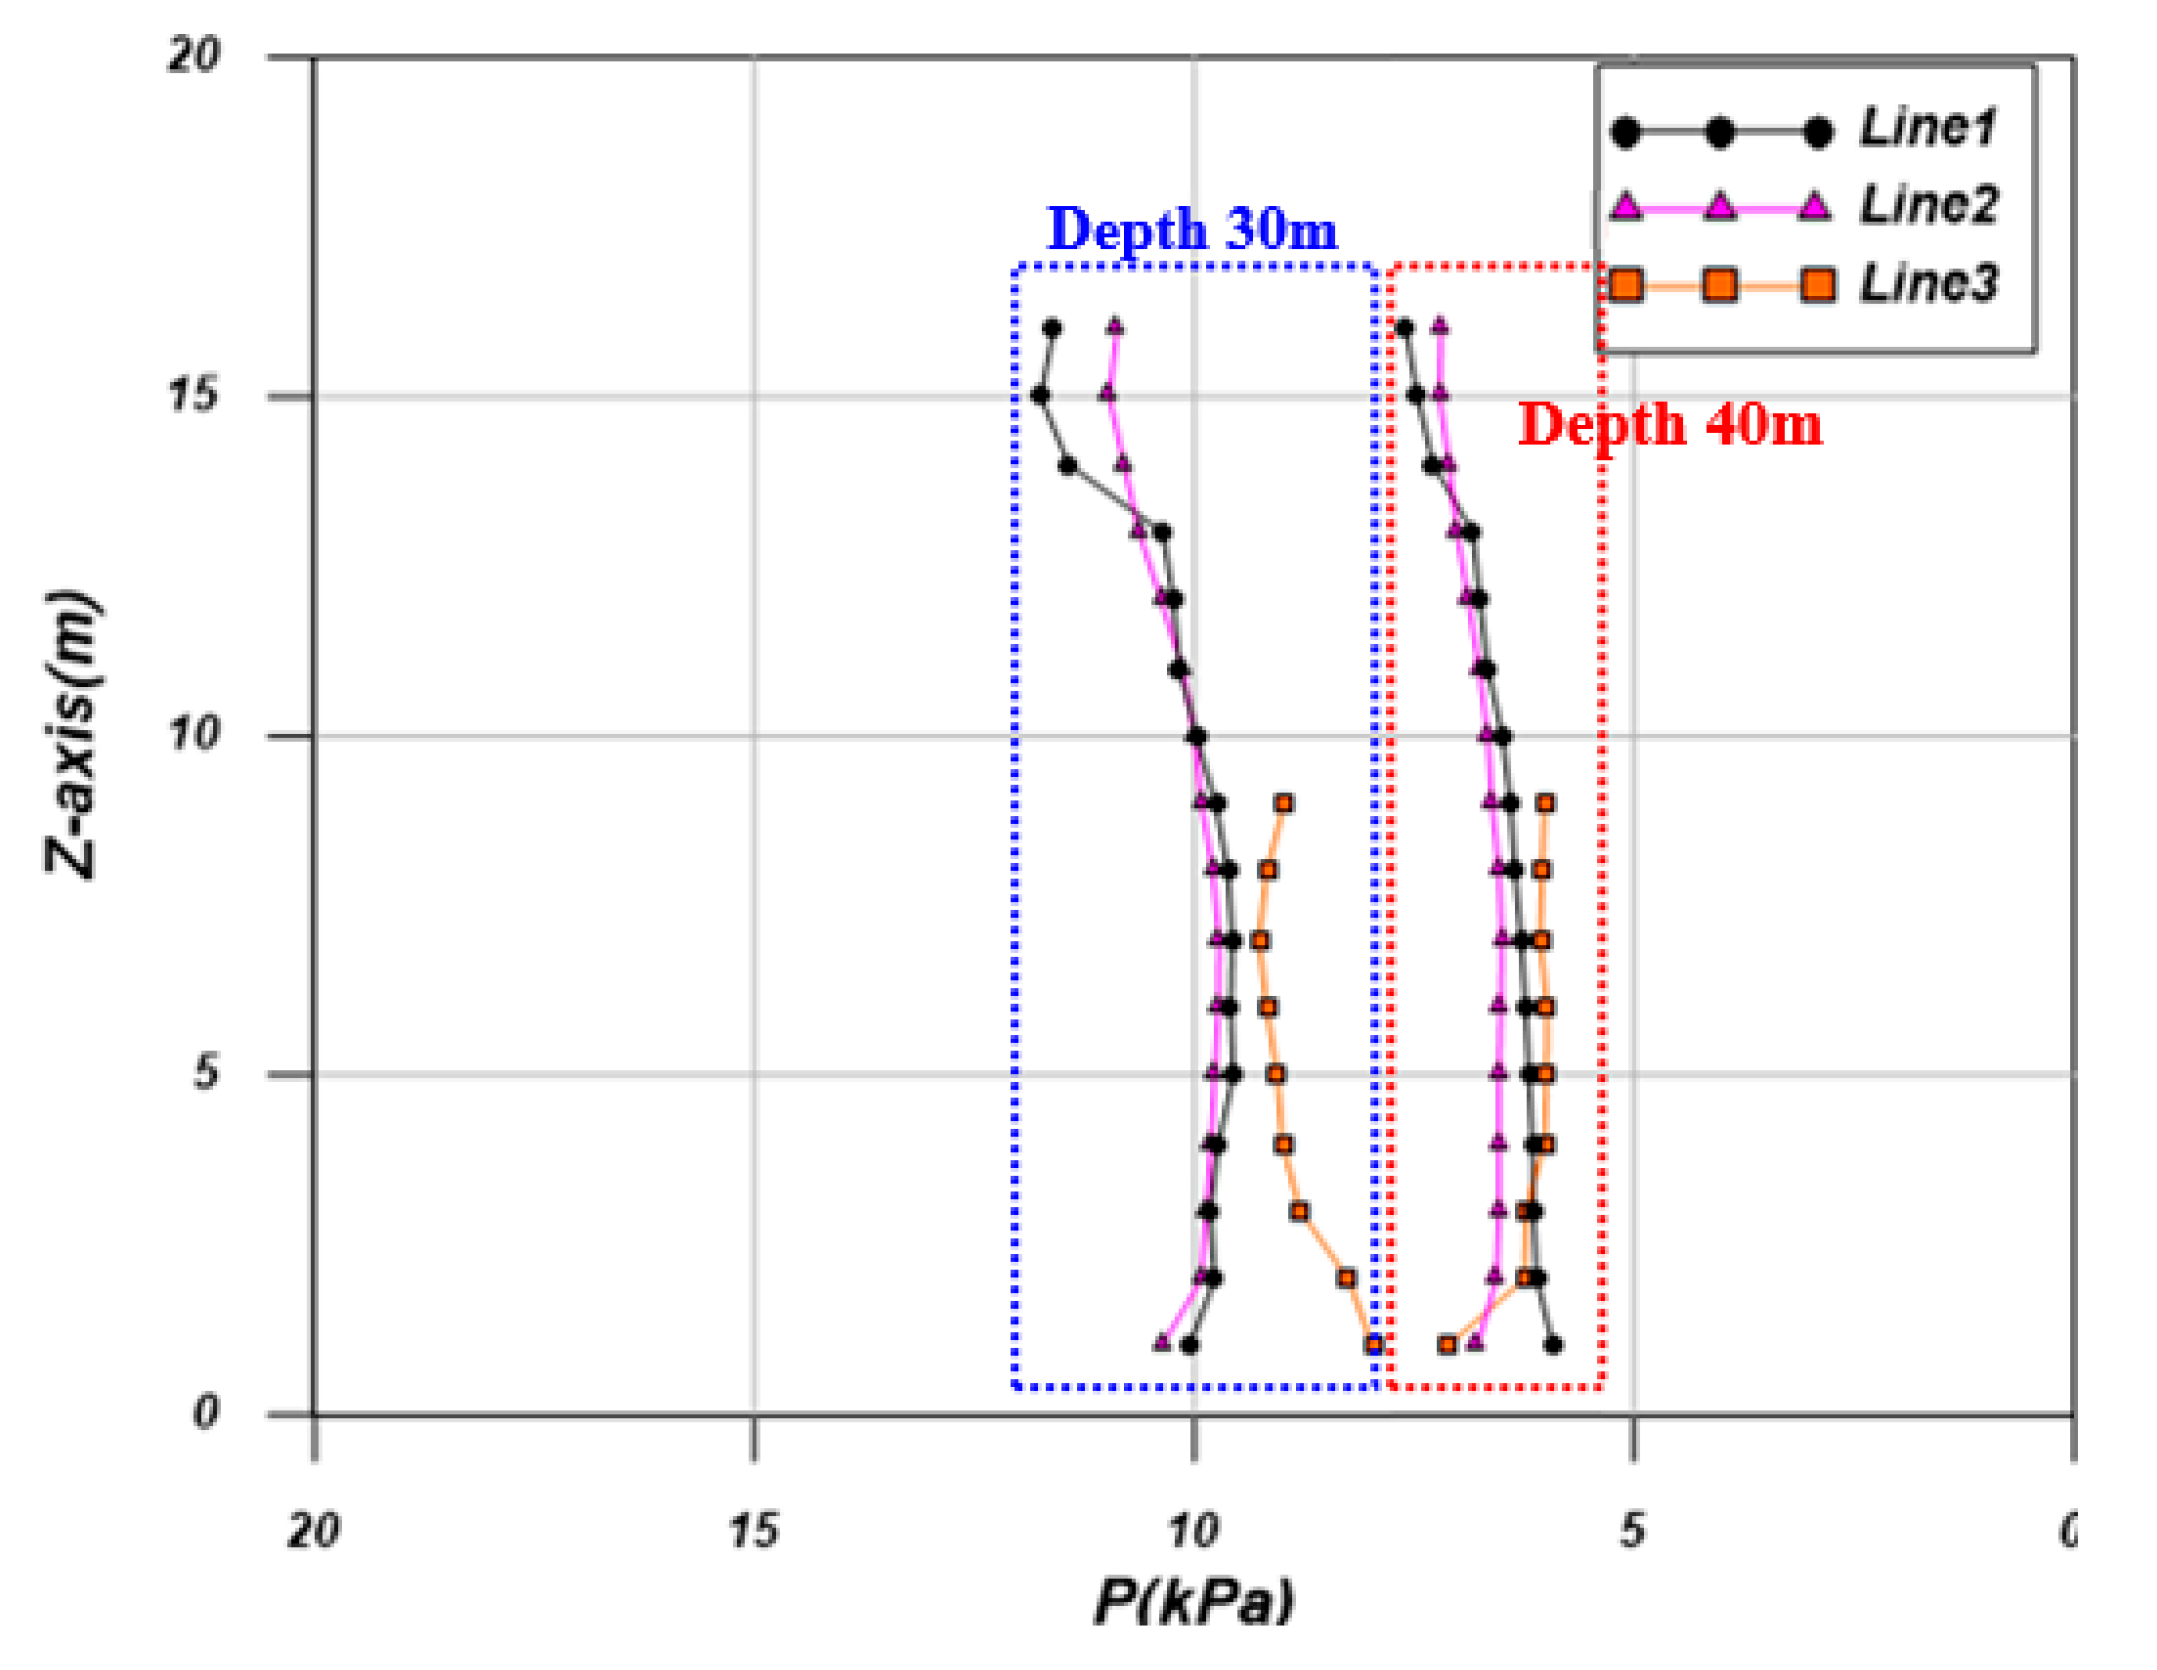
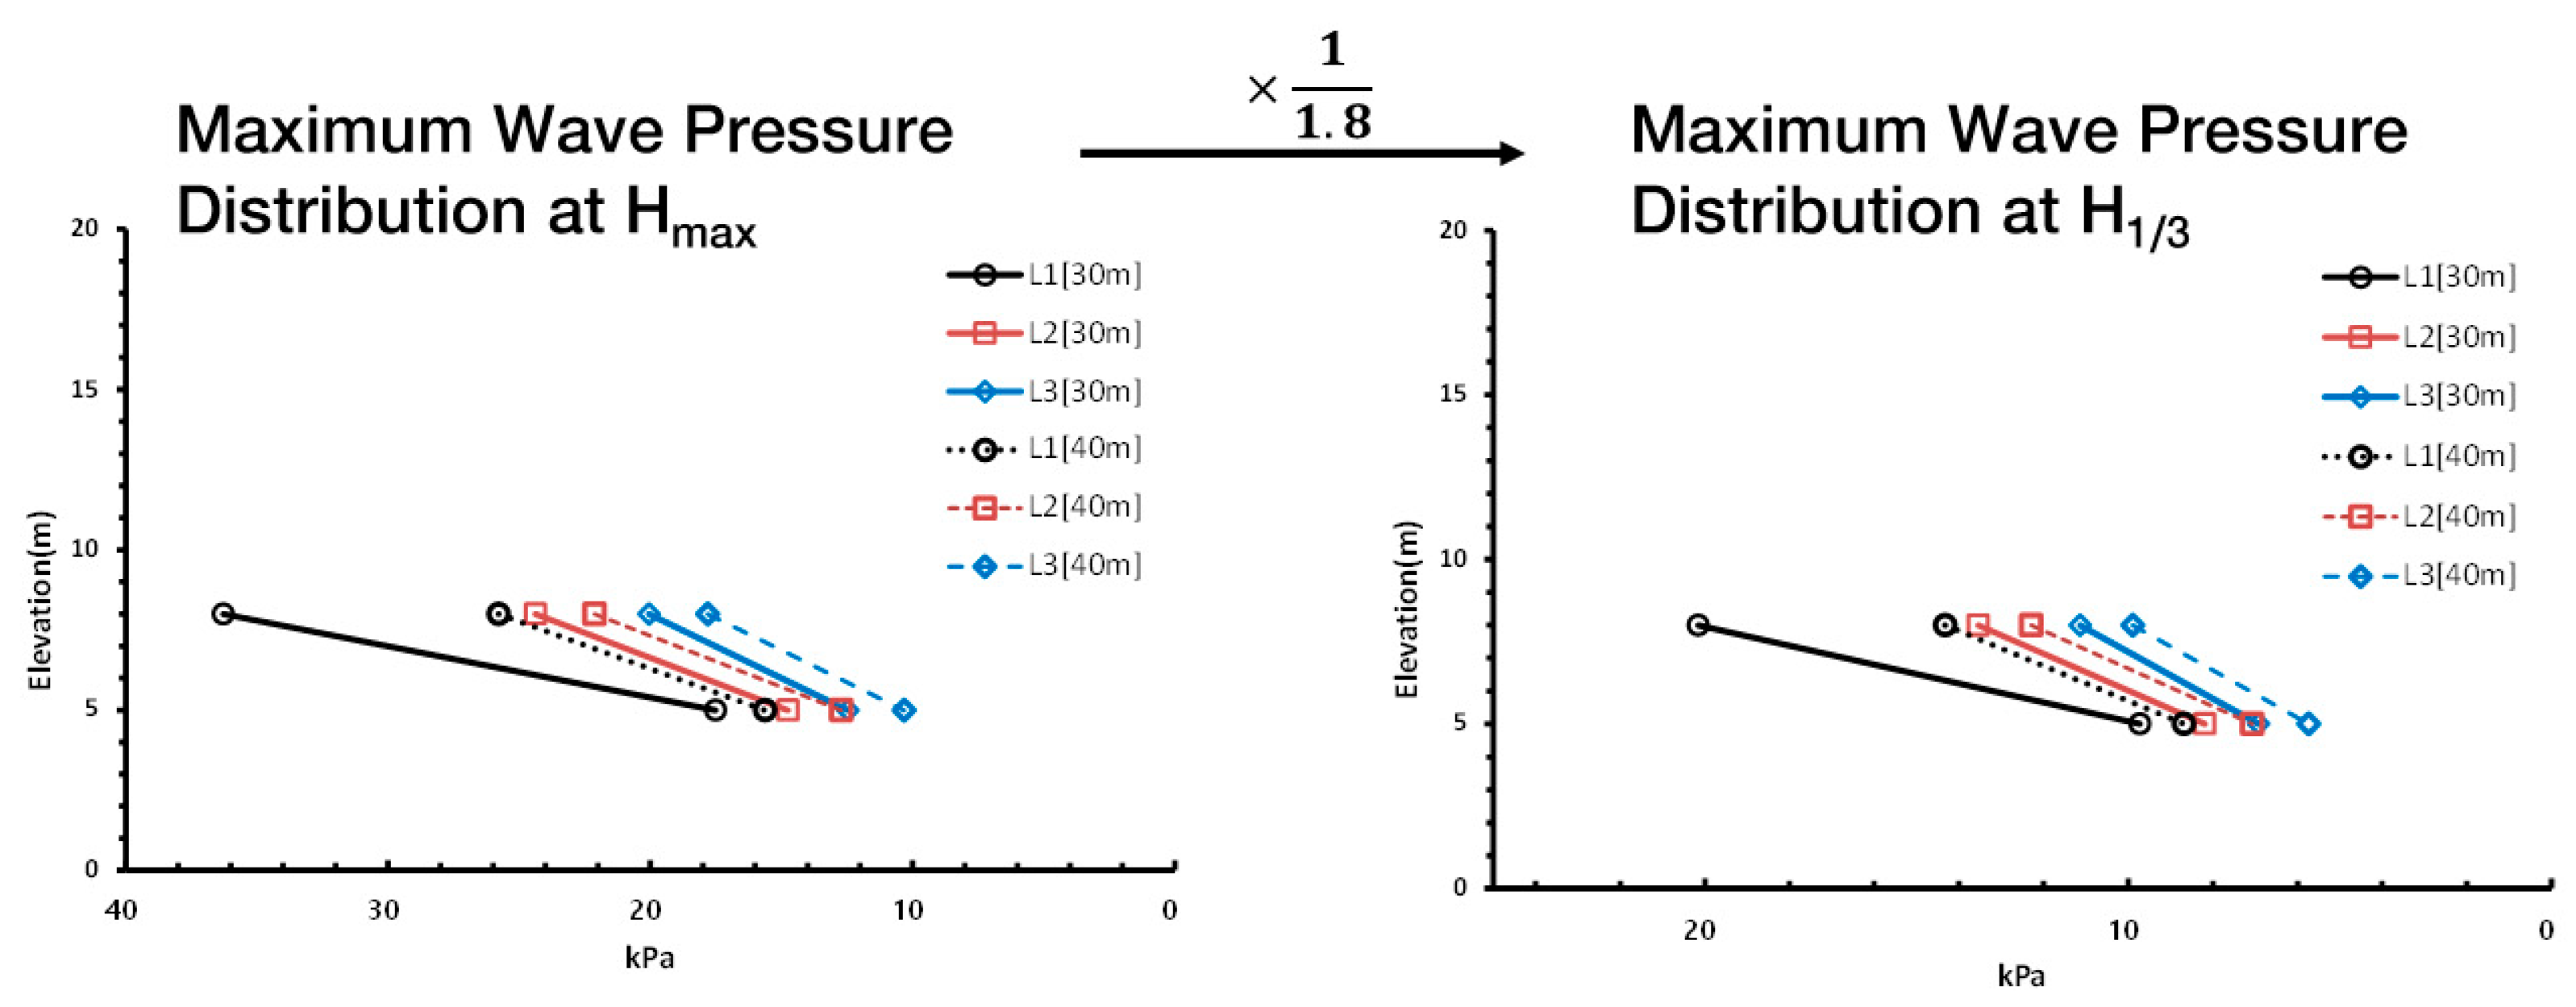
The wave pressure distribution affecting members of the artificial reef was examined to analyze the stability of the artificial reef against waves approaching from the side. The wave sign and tidal wave time were established as the approach time based on 1000 waves in the SE wave direction, which were consistent with the conditions applied in the numerical experiment. As for wave pressure measurement, data were obtained at intervals of 1000 Hz to analyze the maximum wave pressure affecting the artificial structure. Measurement was performed at six points, and the wave pressure gauge used in the experiment had a measurement range of 0.1 Pa, which allowed this device to measure minute pressure changes. The experiment details are listed in Table 5.

3. Results

3.1. SWAN Model—Design Wave Experiment

The bow direction of the sunken vessel artificial reef was adjusted to the west or north to select the installation direction of the sunken vessel during the wave experiment. It was found that the maximum wave height and wave direction according to the installation direction of the sunken vessel did not change. When the wave direction was NE (49.3°), wave height was calculated to be 5.49 m, being the highest, and when the wave direction was S (147.7°), wave height was calculated to be 1.44 m, is the lowest. Based on these results, the stern and stem parts of the sunken vessel need to be in the extreme NE direction to minimize wave effects. Accordingly, a numerical wave flume experiment was conducted under the conditions of a SE wave direction, wave height of 3.73 m, and period of 9.08 s. A cross-sectional hydraulic model experiment was applied under the same conditions; conditions of a NE wave direction, wave height of 5.49 m, and period of 10.72 s; and conditions of an ENE wave direction, wave height of 4.59 m, and period of 9.50 s as shown in Figure 6.

3.2. REEF3D—Numerical Wave Flume Experiment

In the design wave for numerical wave flume experiment, the direction of the stern or stem section of the sunken vessel artificial reef which was the least likely to be affected by waves was established as north. Accordingly, values of a wave approaching the side of the structure, being 3.73 m and 9.08 s, in the SE wave direction were applied to the REEF3D model to conduct the numerical wave flume. The measurement result indicated that a maximum wave pressure of 11.75 kPa and 7.76 kPa at Line 1 was generated when the water depth was 30 m and 40 m, respectively. As represented in Table 6, it was confirmed that the wave pressure increased as the water depth decreased. The wave pressure was greater when the water depth was 30 m in the cases of Lines 2 and 3, and this result was consistent with the results based on Line 3.
Sectional erosion occurs at the bottom of a structure installed on the pelitic and psammitic ground due to hydraulic external force conditions. For this reason, scour depth and sectional scouring patterns, which would be generated on the ground of the artificial reef installed, were examined in a numerical simulation experiment. The experimental result indicated that maximum scour depths of 0.61 m and 0.46 m were generated at a water depth of 30 m and 40 m, respectively as shown in Figure 7. Based on this result, it was confirmed that the effects of external force increased as the water depth decreased.

3.3. Two-Dimensional Cross Sectional Hydraulic Model Experiment

The wave pressure measurement result indicated that wave pressure strength increased as the water surface was approached more closely under the condition of a water depth of 30 m. A maximum wave pressure of 33.56 kPa was observed at P2 of Line 1. The wave pressure also increased as the water surface approached more closely under the condition of a water depth of 40 m. A wave pressure of 25.94 kPa was observed at the same point. It was observed that the wave pressure decreased by 2.5 kPa on average as the water depth changed from 30 m to 40 m. Table 7 and Figure 8 indicate such a decrease in wave pressure was analyzed to be affected by a change in wave depth.
When structures are installed at the seabed, the stability of structures affected by external force conditions should be examined. To analyze the movement of the structures, irregular waves were represented in the experiment according to the wave height and period in NE, ENE, and SE wave directions, which were significantly affected by such external force conditions. In addition, video recording data were utilized to examine the difference of conditions before and after waves more accurately. The experiment results indicated that the artificial reef moved backward at a water depth of 30 m. The movement distance was proportional to the scale of the approaching wave and was the greatest in Case 1, with the NE wave direction. The movement of the artificial reef was also confirmed at a water depth of 40 m, whereas the movement distance was less than that at a water depth of 30 m as shown in Figure 9.

4. Discussion

The values derived from the design wave experiment using the SWAN model were applied to the REEF3D model to conduct the numerical wave flume experiment. As shown in Figure 3, the computational sunken vessel artificial reef was generated to measure the wave pressure affecting the structure. Accordingly, the location of the wave pressure measurement was established. As indicated in Table 3, the design wave experiment was conducted based on a return frequency of 10 years. The numerical wave flume experiment was conducted based on values and regular waves obtained from the design wave experiment. As shown in Figure 10, the result of comparing the maximum dynamic wave pressure according to water depths of 30 m and 40 m in the numerical wave flume experiment indicates that the sunken vessel artificial reef is affected by greater wave pressures at a water depth of 30 m. Moreover, greater wave pressure was measured on Line 3 among the initially established wave pressure measurement lines in the experiment, regardless of water depth.
Figure 11 shows graphs of the maximum wave pressure values obtained through the two-dimensional cross-sectional hydraulic model experiment according to water depths of 30 m and 40 m. The values at 30 m and 40 m are expressed by solid and dotted lines, respectively. The sunken vessel artificial reef, which was produced by a 3D printer, was connected to a wave pressure gauge to extract each wave pressure value, as shown in Table 5. The regular waves were used in the REEF3D model experiment, whereas irregular waves were used in the cross-section hydraulic model experiment. Thus, the results were multiplied by 1/3 to compare the maximum wave pressure distribution obtained from the hydraulic model experiment with those obtained from the numerical model [16,17,18]. A wave pressure gauge was installed at the artificial reef model following the graph below, and the conditions were compared according to established lines. The comparison results indicated that wave pressure was greater at a water depth of 30 m than at 40 m. These results were consistent with those obtained from the numerical model experiment. The wave pressure according to water depth (30 m and 40 m) and the established lines were compared and analyzed based on numerical values obtained by the REEF3D model and the hydraulic model experiment. The analysis results indicated that the wave pressure was greater at a water depth of 30 m than at 40 m. Moreover, the wave pressure increased as the location of wave pressure measurement approached the surface of the water for the same applied water depth. This result is consistent with the result that pressure increases closer to the water surface when pressure is measured from the surface to the bottom of water, based on Stokes wave theory [19].
The scouring and sedimentation beside the sunken vessel were examined based on the shear stress equation (wall function) of the REEF3D model to evaluate the stability of the sunken vessel artificial reef after its installation. To this end, scouring at the location of the artificial reef installed was examined according to a water depth of 30 m and 40 m. The greatest score depth was calculated at a water depth of 30 m where greater wave pressure was generated than at 40 m, as shown in Table 8.
The values indicated in Table 8 were affected by a proportional relation between the wave pressure and scour depth. In other words, these values were affected by a mechanism in which greater pressure and physical force of waves result in more considerable effects of the horseshoe vortex due to the downward flow occurring after waves collide with the artificial reef upon the sunken ship [20]. The analysis result based on the hydraulic model experiment also indicated that the movement of the artificial reef based on the sunken ship moved further at a water depth of 30 m accompanying greater wave pressure than at 40 m, as shown in Table 8 and Figure 9. In experiments on the design wave, numerical wave flume, and two-dimensional cross-section numerical model, the installation direction of the artificial reef on the sunken ship was established according to the wave direction, wave height, and period. Accordingly, the wave pressure affecting the artificial reef was partially measured, and the scour depth and movement were calculated. Based on the analysis result, it was confirmed that the stability was proportional to the water depth at a place of the artificial reef installed.

5. Conclusions

The maximum wave height and period for each wave direction were summarized through the design wave experiment, and the stability and behavioral trends of the sunken vessel reef were confirmed by applying them to numerical and hydraulic model experiments. Wave deformation characteristics and scour patterns were reviewed through numerical model experiments. When the sunken vessel is installed, hydraulic characteristics change on the front of the surface. Due to this phenomenon, local sedimentation and scour occur due to the flow rate acting on the bottom surface of the front of a sunken vessel. The experimental result based on numerical values and the hydraulic model indicates that the stability of the sunken vessel artificial reef depends on the water depth at the area of the structure installed. The artificial reef based on the sunken decrepit ship planned by the Korean government is to be installed underwater in Gangneung, approximately 3600 m from the land in a straight line. The water depth at this place is approximately 30 m. The experimental result based on numerical values, and the hydraulic model, indicates that the stability increases at a water depth of 40 m compared to that at 30 m in terms of external force (wave pressure), submarine topography (scouring) changes, and the trend of structure movement. Nevertheless, the possibility of using the sunken vessel as an artificial reef was verified if only the water depth and installation location were properly analyzed in consideration of the wave energy. Thus, it is determined that just with additional reinforcement work such as anchoring, a sunken vessel can be installed as an artificial reef safely at the planned location.

Author Contributions

Conceptualization, H.-D.K. and K.-H.K.; methodology, K.-H.K. and K.-T.S.; software, H.-D.K. and K.-H.K.; validation, H.-D.K., K.-H.K.; formal analysis, H.-D.K. and K.-T.S.; investigation, H.-D.K. and K.-T.S.; resources, H.O.; data curation, H.-D.K.; writing—original draft preparation, H.-D.K.; writing—review and editing, K.-H.K. and K.-T.S.; visualization, H.-D.K.; supervision, K.-H.K.; project administration, H.O.; funding acquisition, H.-D.K. and H.O. All authors have read and agreed to the published version of the manuscript.

Funding

This research was partially supported by The World Association for Waterborne Transport Infrastructure of Korean National Section, Mirae Ocean Corporation, The Waterfront and Coastal Research Center, Korea, and Korea Fisheries Resources Agency.

Institutional Review Board Statement

Not applicable.

Informed Consent Statement

Not applicable.

Data Availability Statement

Not applicable.

Acknowledgments

These authors wish to thank Korea Fisheries Resources Agency.

Conflicts of Interest

The authors declare no conflict of interest.

References

  1. Yoon, H. Evaluation of Fishery Resource Enhancement by General Artificial Reefs in South Korea. J. Korean Soc. Mar. Environ. Energy 2018, 21, 116–129. [Google Scholar] [CrossRef]
  2. Seaman, W. Encyclopedia of Ocean Sciences. In Encyclopedia of Ocean Sciences, 3rd ed.; Cochran, J.K., Bokuniewicz, H.J., Yager, P.L., Eds.; Academic Press: Cambridge, MA, USA, 2019; Volume 1, pp. 662–670. [Google Scholar]
  3. Baine, M. Artificial Reefs: A Review of Their Design, Application, Management and Performance. Ocean Coast. Manag. 2001, 44, 241–259. [Google Scholar] [CrossRef]
  4. Lima, J.S.; Zalmon, I.R.; Love, M. Overview and Trends of Ecological and Socioeconomic Research on Artificial Reefs. Mar. Environ. Res. 2019, 145, 81–96. [Google Scholar] [CrossRef] [PubMed]
  5. Ilieva, I.; Jouvet, L.; Seidelin, L.; Best, B.D.; Aldabet, S.; Da Silva, R.; Conde, D.A. A Global Database of Intentionally Deployed Wrecks to Serve as Artificial Reefs. Data Brief 2019, 23, 103584. [Google Scholar] [CrossRef] [PubMed]
  6. Lindberg, W.K.; Seaman, W. Guidelines and Management Practices for Artificial Reef Siting, Use, Construction, and Anchoring in Southeast Florida. Florida Department of Environmental Protection, Miami, FL. Xi and 150 pages. 2011. Available online: https://nsgl.gso.uri.edu/flsgp/flsgph11003.pdf (accessed on 12 October 2019).
  7. Settelmaier, J.B.; Gibbs, A.; Santos, P.; Freeman, T.; Gaer, D.; Simulating Waves Nearshore (SWAN) Modeling Efforts at the National Weather Service (NWS) Southern Region (SR) Coastal Weather Forecast Offices (WFOs). 91th AMS Annual Meeting. 2011. Available online: https://www.semanticscholar.org/paper/SIMULATING-WAVES-NEARSHORE-(SWAN)-MODELING-EFFORTS-Settelmaier-Gibbs/f5f3455f6fc5e110a5f5a952270493854904f9b1 (accessed on 12 October 2019).
  8. Booij, N.; Ris, R.C.; Holthuijsen, L.H. A Third-Generation Wave Model for Coastal Regions 1. Model Description and Validation. J. Geophys. Res. 1999, 104, 7649–7666. [Google Scholar] [CrossRef] [Green Version]
  9. Ris, R.C.; Holthuijsen, L.H.; Booij, N. A Third-Generation Wave Model for Coastal Regions 2. Verification. J. Geophys. Res. 1999, 104, 7667–7681. [Google Scholar] [CrossRef]
  10. Korea Ocean Research & Development Institute. Estimated Report II on Deep-Water Design Waves at the Entire Seas in Korea; Korea Institute of Science and Technology: Seoul, Korea, 2005. [Google Scholar]
  11. Shu, C.-W.; Osher, S. Efficient Implementation of Essentially Non-Oscillatory Shock-Capturing Schemes. J. Comput. Phys. 1988, 77, 439–471. [Google Scholar] [CrossRef] [Green Version]
  12. Osher, S.; Sethian, J.A. Fronts Propagating with Curvature Dependent Speed: Algorithms Based on Hamilton-Jacobi Formulations. J. Comput. Phys. 1988, 79, 12–49. [Google Scholar] [CrossRef] [Green Version]
  13. Larsen, J.; Dancy, H. Open Boundaries in Short Wave Simulations—A New Approach. Coast. Eng. 1983, 7, 285–297. [Google Scholar] [CrossRef] [Green Version]
  14. Varela, J.M.; Soares, C.G. Interactive Simulation of Ship Motions in Random Seas Based on Real Wave Spectra; Scitepress—Science and Technology Publications: Vilamoura, Algarve, Portugal, 2011; pp. 235–244. [Google Scholar]
  15. Kim, H.; Aoki, S.-I. Artificial Intelligence Application on Sediment Transport. J. Mar. Sci. Eng. 2021, 9, 600. [Google Scholar] [CrossRef]
  16. Goda, Y. Random Seas and Design of Maritime Structures. In Random Seas and Design of Maritime Structures, 2nd ed.; Liu, P.L.-F., Ed.; World Scientific: Singapore, 2000; Volume 1–15, pp. 1–425. [Google Scholar]
  17. Son, B.K.; Ryu, C. Statistical Fluctuation Characteristics of Waves in the Main Sea Areas. J. Korean Soc. Coast. Ocean Eng. 2001, 15, 20–27. (In Korean) [Google Scholar]
  18. Jeon, Y.H.; Yoon, H.; Kim, D.H.; Kim, H.T. Characteristics of Ocean Waves that Invade Seaweed Farm in the Water Surrounding Geumil-Eup. Wando 2012, 15, 177–185. (In Korean) [Google Scholar]
  19. Umeyama, M. Dynamic-Pressure Distributions under Stokes Waves with and without a Current. Philos. Trans. R. Soc. A Math. Phys. Eng. Sci. 2017, 376, 20170103. [Google Scholar] [CrossRef] [PubMed] [Green Version]
  20. Abdalla, M.G. A Study on Scour for Irrigation Canals in Egypt, Case Study: The First Reach of Elibrachimeya Canal. Am. J. Eng. Technol. Manag. 2017, 1, 65–77. [Google Scholar]
Figure 1. Computational grid and topography of the deployment location.
Energies 14 04374 g001
Figure 2. The numerical wave flume test using REEF3D model: schematic view.
Energies 14 04374 g002
Figure 3. Location of the wave pressure gauge on the artificial vessel reef model.
Energies 14 04374 g003
Figure 4. Sunken vessel model produced by 3D printer.
Energies 14 04374 g004
Figure 5. Experiment setup for the two-dimensional cross-sectional wave flume test.
Energies 14 04374 g005aEnergies 14 04374 g005b
Figure 6. Wave height and periods according to the installation direction of the sunken vessel artificial reef and wave directions.
Energies 14 04374 g006
Figure 7. Sectional scouring patterns at the side of the sunken vessel artificial reef.
Energies 14 04374 g007
Figure 8. Distribution of the maximum wave pressure.
Energies 14 04374 g008
Figure 9. Experiment results at water depth of 30 m (wave height: 5.49 m, period: 10.72 s) and at water depth of 40m (wave height: 5.65 m, period: 10.72 s).
Energies 14 04374 g009
Figure 10. Comparison of the maximum dynamic wave pressure according to water depth in the numerical wave flume experiment.
Energies 14 04374 g010
Figure 11. Comparison of the maximum wave pressure at Hmax and H1/3 according to water depth in the two-dimensional cross-sectional hydraulic model experiment.
Energies 14 04374 g011
Table 1. An overview of the SWAN model experiment.
Experiment Content
Large ScaleDetailed Scale
Numerical ModelSWAN Model
Model CompositionGrid Scale50.0 km × 43.0 km2.0 km × 2.0 km
50.0 km × 29.0 km
Grid SizeDs = 50 mDs = 10 m
Grid Number1000 × 860200 × 200
1000 × 580
Sea Level DatumGangneung HHW DL.(+) 0.37 m
Table 2. The specifications of deep-water design wave for running the SWAN model.
Wave/Wind Direction (°)Wave Height (m)Period (s)
Incident Wave Data10-year Return PeriodN10.93.727.78
NNE28.84.399.60
NE48.3 (49.3)5.13 (5.49)10.41 (10.72)
ENE66.7 (67.9)4.59 (4.98)9.50 (9.92)
E85.14.048.98
ESE106.83.168.28
SE121.73.739.08
SSE136.82.638.54
S147.71.447.45
Table 3. An overview of the numerical wave flume test (REEF3D).
Content
ModelREEF3D
CompositionDomainXYZ
315 m95 m60 m
Spacing0.5 m–1.0 m changeable grid
ConditionNumber1,795,500
Experiment ConditionWave Input ConditionWavePeriod
3.73 m9.08 s
Experiment CasesDepth: 30 m, 40 m
Table 4. The specification of the 2D cross-sectional wave flume.
DivisionContent
Flume Information45 m × 1.0 m × 1.0 m
Wave TypePiston Type
Drive TypeElectric
Maximum Period0.1–3.0 s
Maximum Wave Height0.3 m
Table 5. Details of the wave pressure measurement experiment set-up.
Test Content
Scale1:150 (△X = △Y)
Wave Input ConditionWave HeightWave Period
3.73 m9.08 s
Examine Water Depth30 m, 40 m
Sampling Rate (avg. data)1000 Hz (1000 Hz × 2 ea)
Obtaining Data Number402,000 ea
Wave SignalModified Bretschneider-Mitsuyasu
Energies 14 04374 i001
Table 6. The maximum dynamic wave pressure according to water depth.
Pressure LocationMaximum Dynamic Wave Pressure Distribution
30 mLine 111.75 kPa Energies 14 04374 i002
Line 210.97 kPa
Line 39.27 kPa
40 mLine 17.76 kPa Energies 14 04374 i003
Line 27.38 kPa
Line 37.30 kPa
Table 7. Details of the wave pressure measurement experiment.
LocationMaximum PressureExamine LocationMaximum Pressure
30 mLine 1P119.95 kPa40 mLine 1P118.58 kPa
P233.56 kPaP225.94 kPa
Line 2P317.95 kPaLine 2P316.47 kPa
P424.93 kPaP423.29 kPa
Line 3P516.29 kPaLine 3P514.74 kPa
P621.79 kPaP620.16 kPa
Table 8. Details of the wave pressure measurement experiment.
Examined DepthNumerical Model ResultHydraulic Model ResultMaximum Scour Depth
30 m11.75 kPa20.16 kPa0.61 m
40 m7.76 kPa14.32 kPa0.46 m
Publisher’s Note: MDPI stays neutral with regard to jurisdictional claims in published maps and institutional affiliations.

