
A Phenomenological Model of a Downdraft Biomass Gasifier Flexible to the Feedstock Composition and the Reactor Design


Abstract
:1. Introduction
2. Materials and Methods
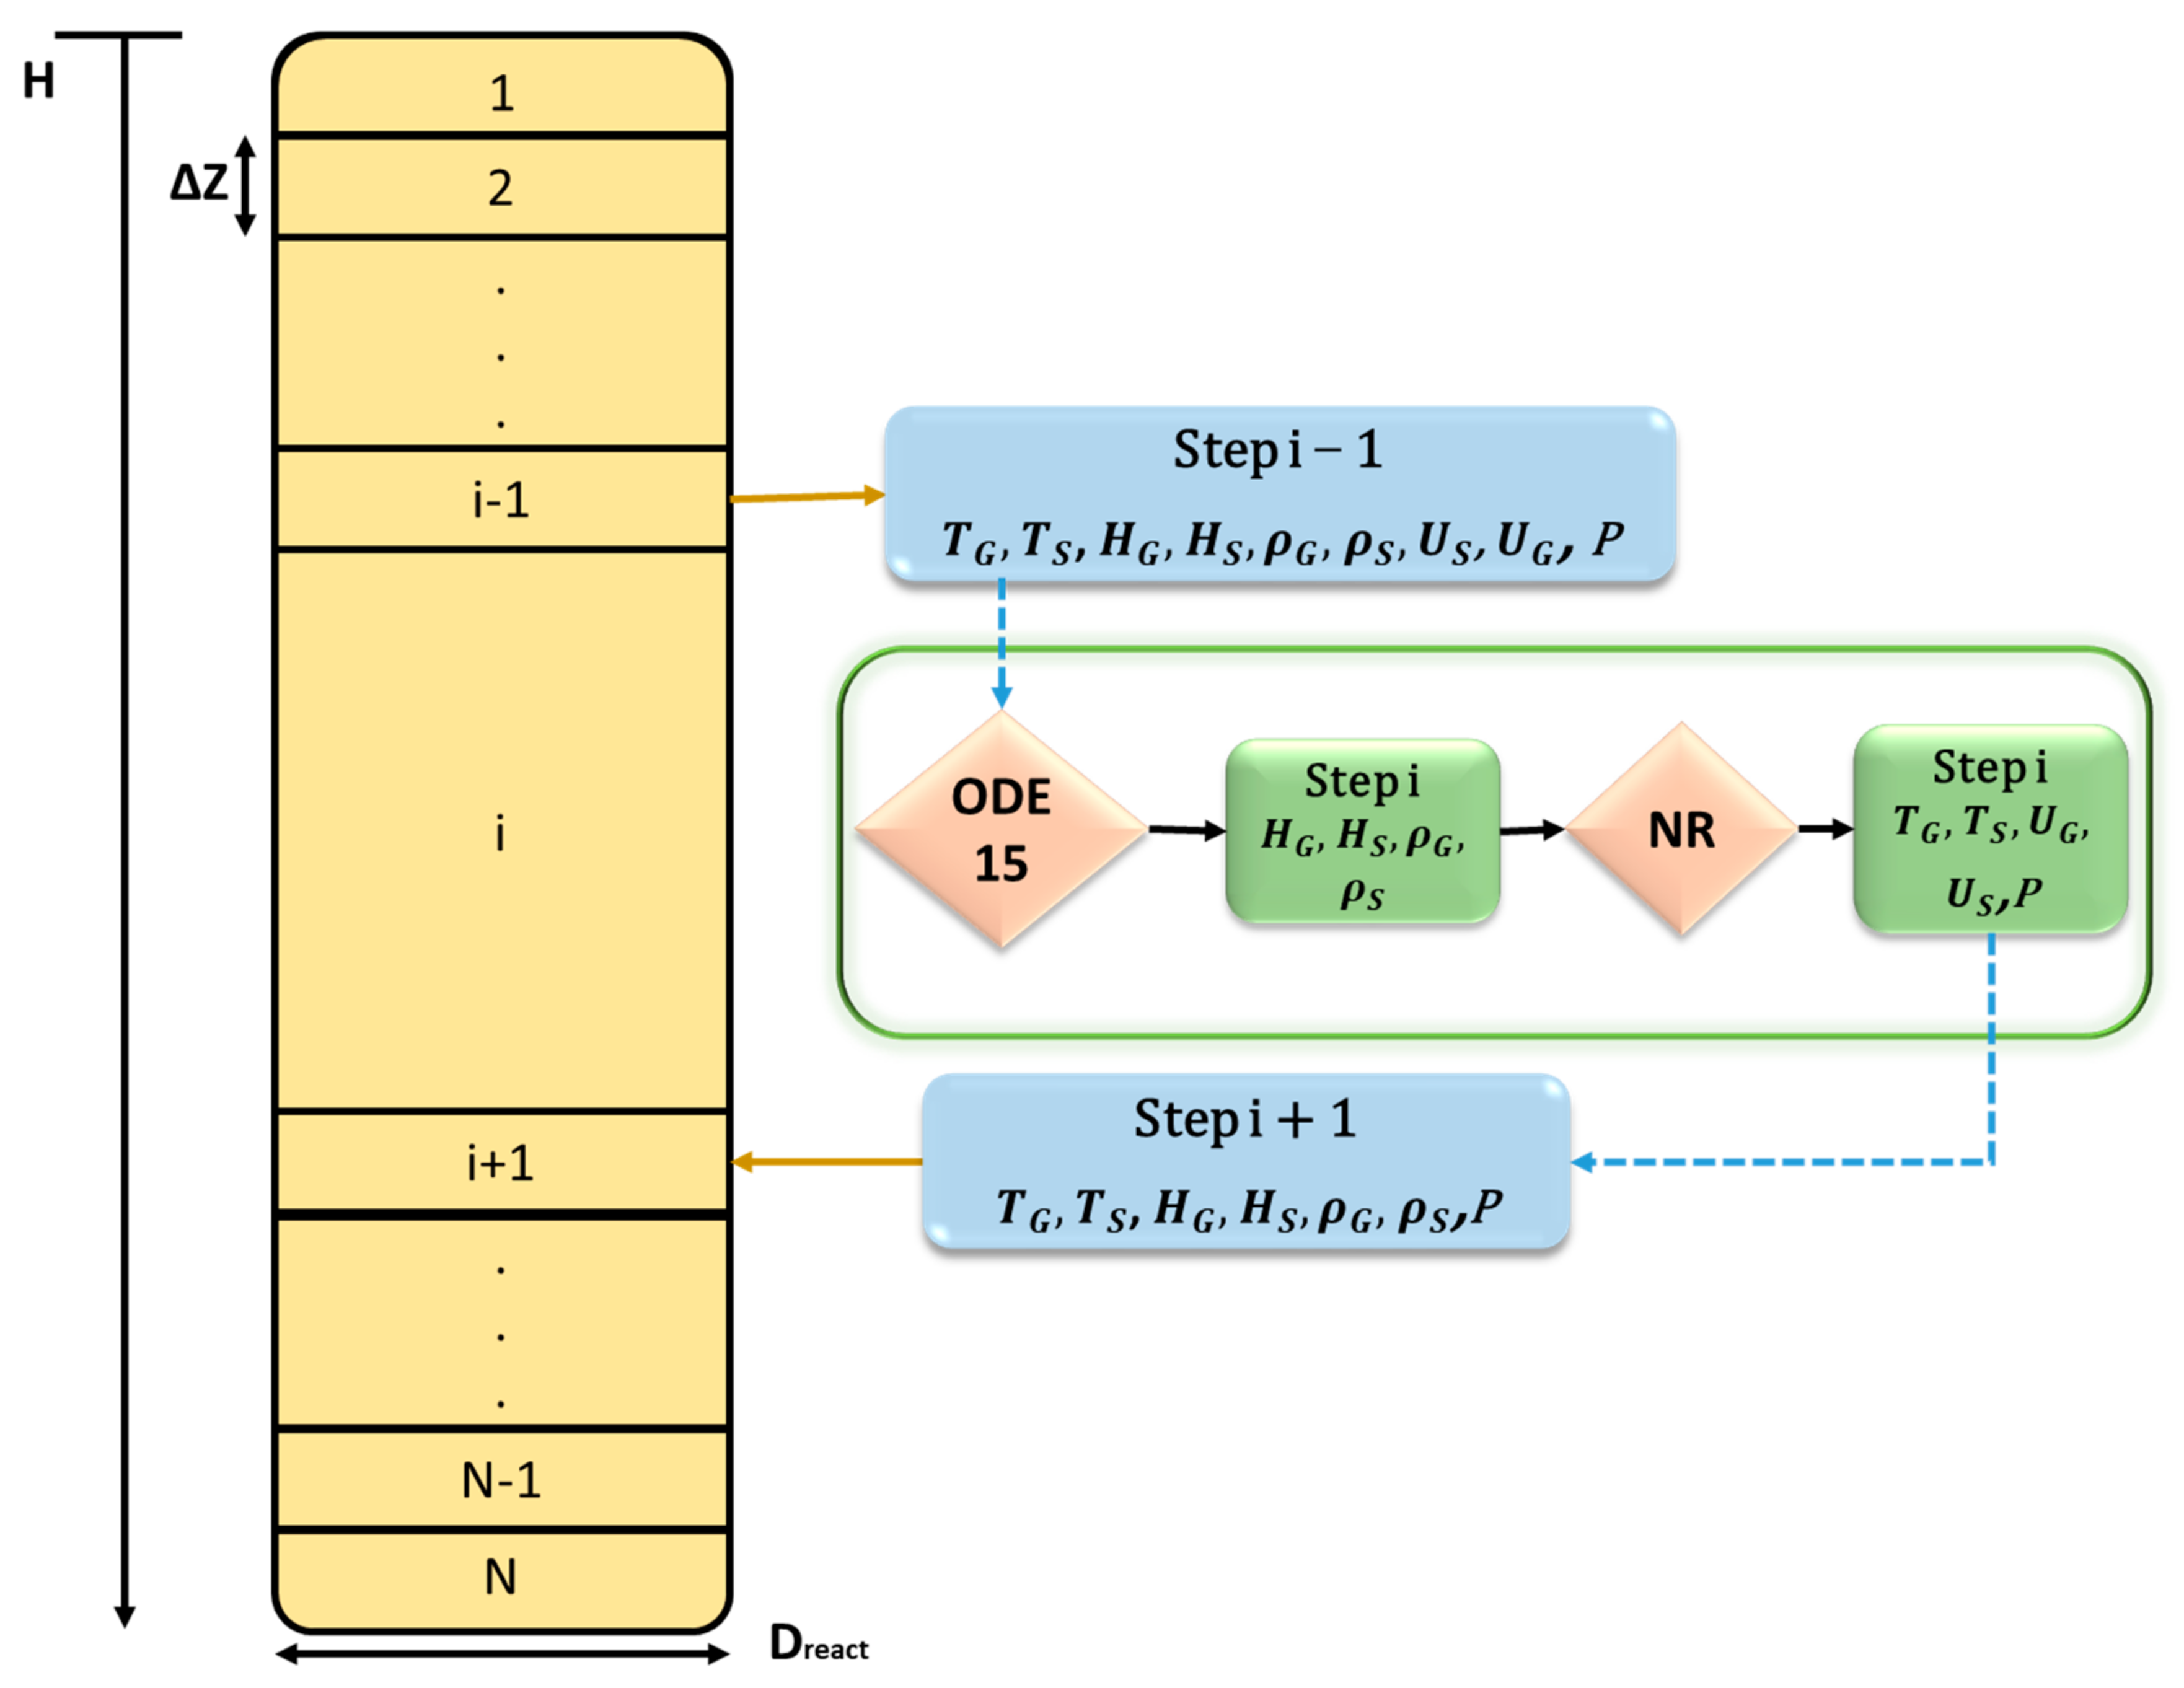
2.1. One-Dimensional Phenomenological Approach
- Moisture (M) evaporation by a 1st order kinetic equation;
- Biomass/residual material (W) devolatilization described by one-step global reaction;
- Char (C) gasification reactions;
- Combustion of volatile species.
- HS = cpS∙(TS − 298.15);
- HG = cpG∙(TG − 298.15);
- QSW = (4∙hSW/Dreact)∙(TS − Twall);
- QGW = (4∙hGW/Dreact)∙(TG − Twall);
- QSG = hSG∙ASG∙(TS − TG);
- ASG = 6∙(1 − ε)/dp.
2.2. Adopted Kinetic Rates
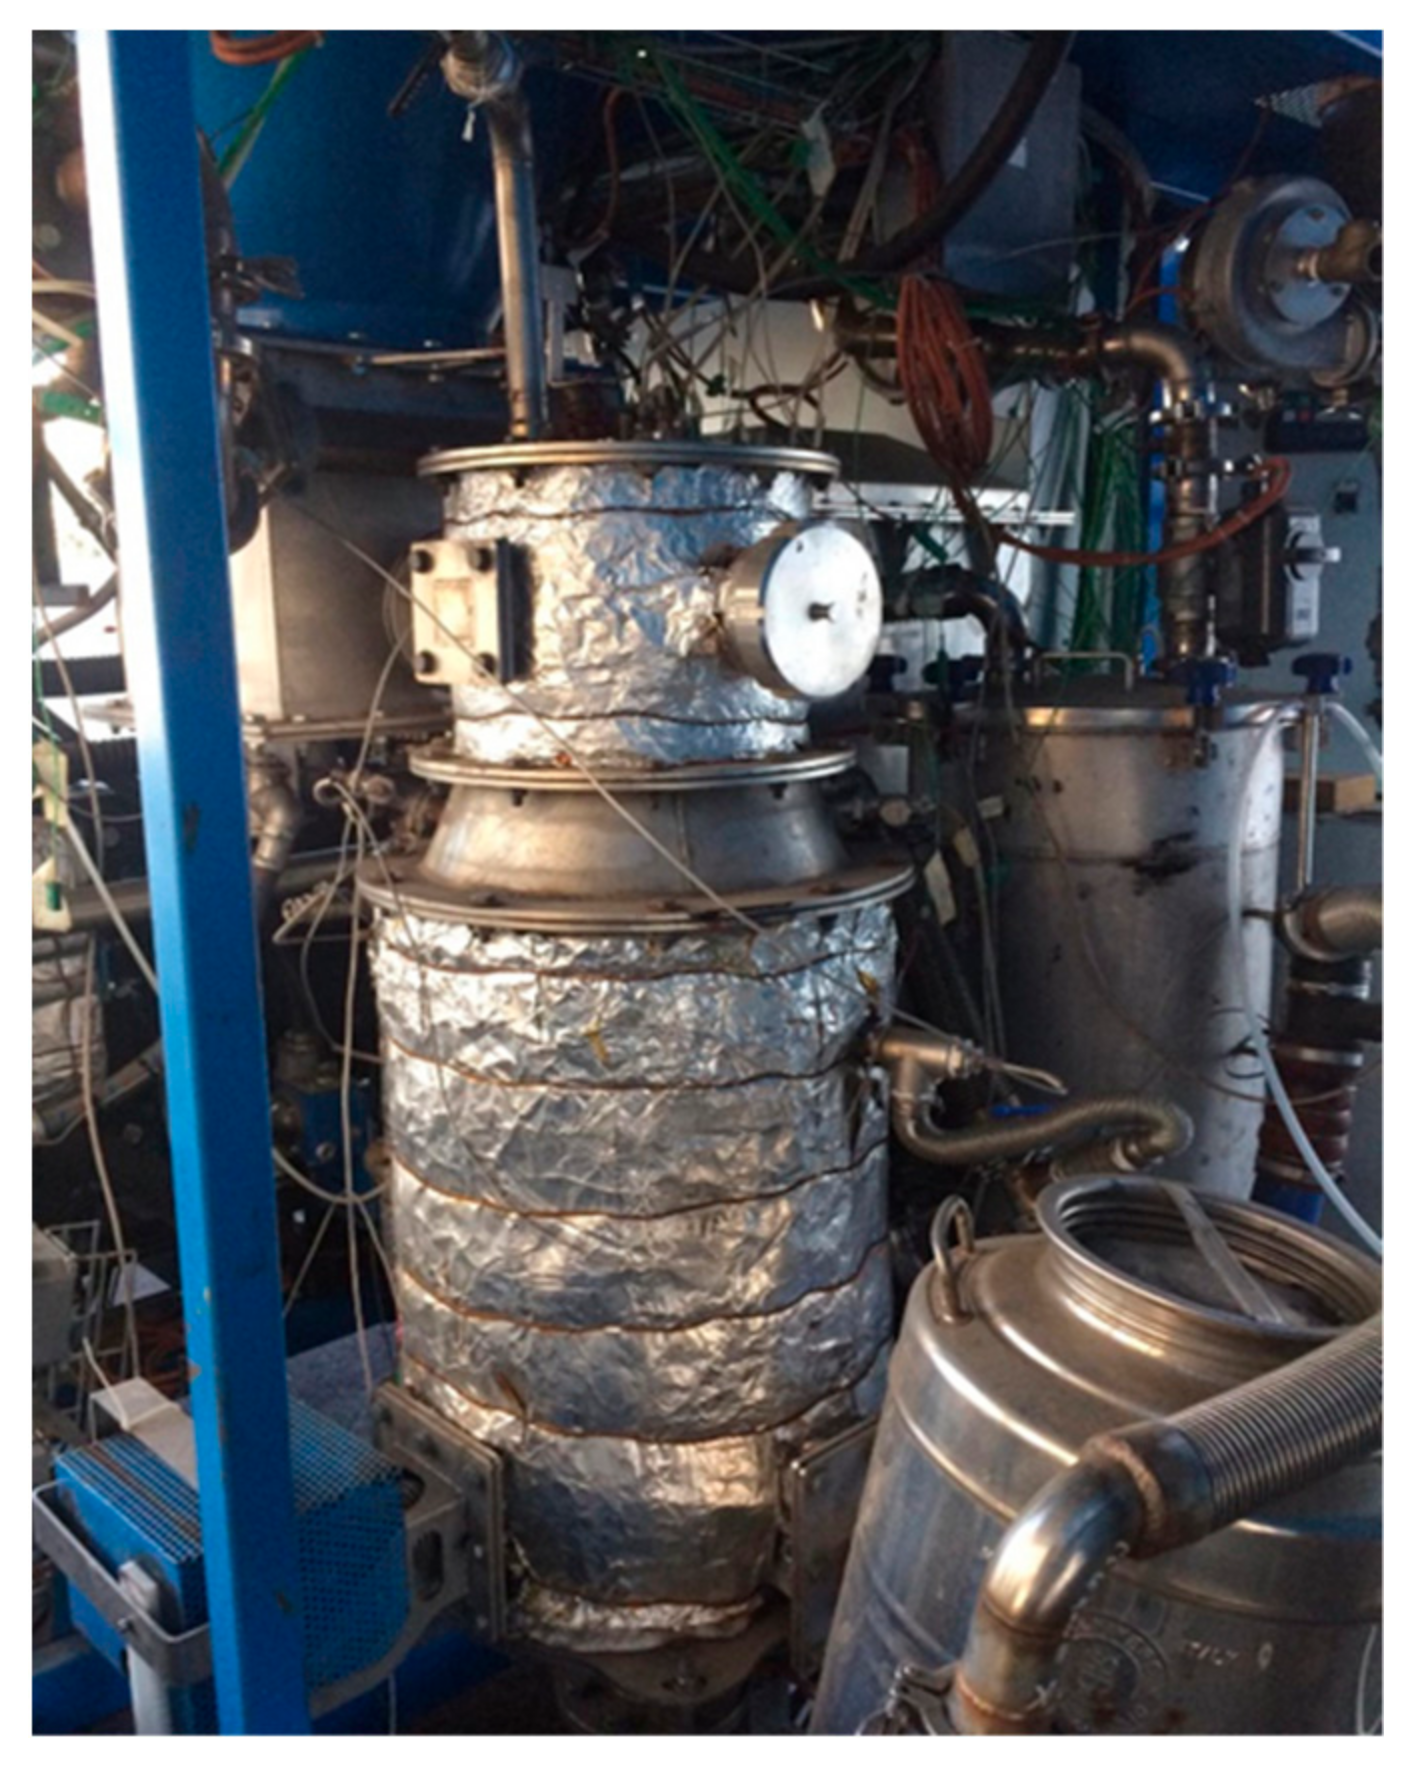
2.3. Experimental Characterization of Biomass Gasification System
- The biomass/residual material composition, flow rate and chemical features, the latter reported in Table 4 in terms of proximate analysis (expressed in dry basis, d.b.) defined using a LECO CHN-628 analyzer according to the ASTM D5373 procedure, ultimate analysis (expressed in dry-ash free basis, daf) using a TGA 701 LECO thermo-gravimetric analyzer according to the ASTM D5142 procedure, and calorific values—each measurement was performed five times. Table 4 reports the calculated mean values;
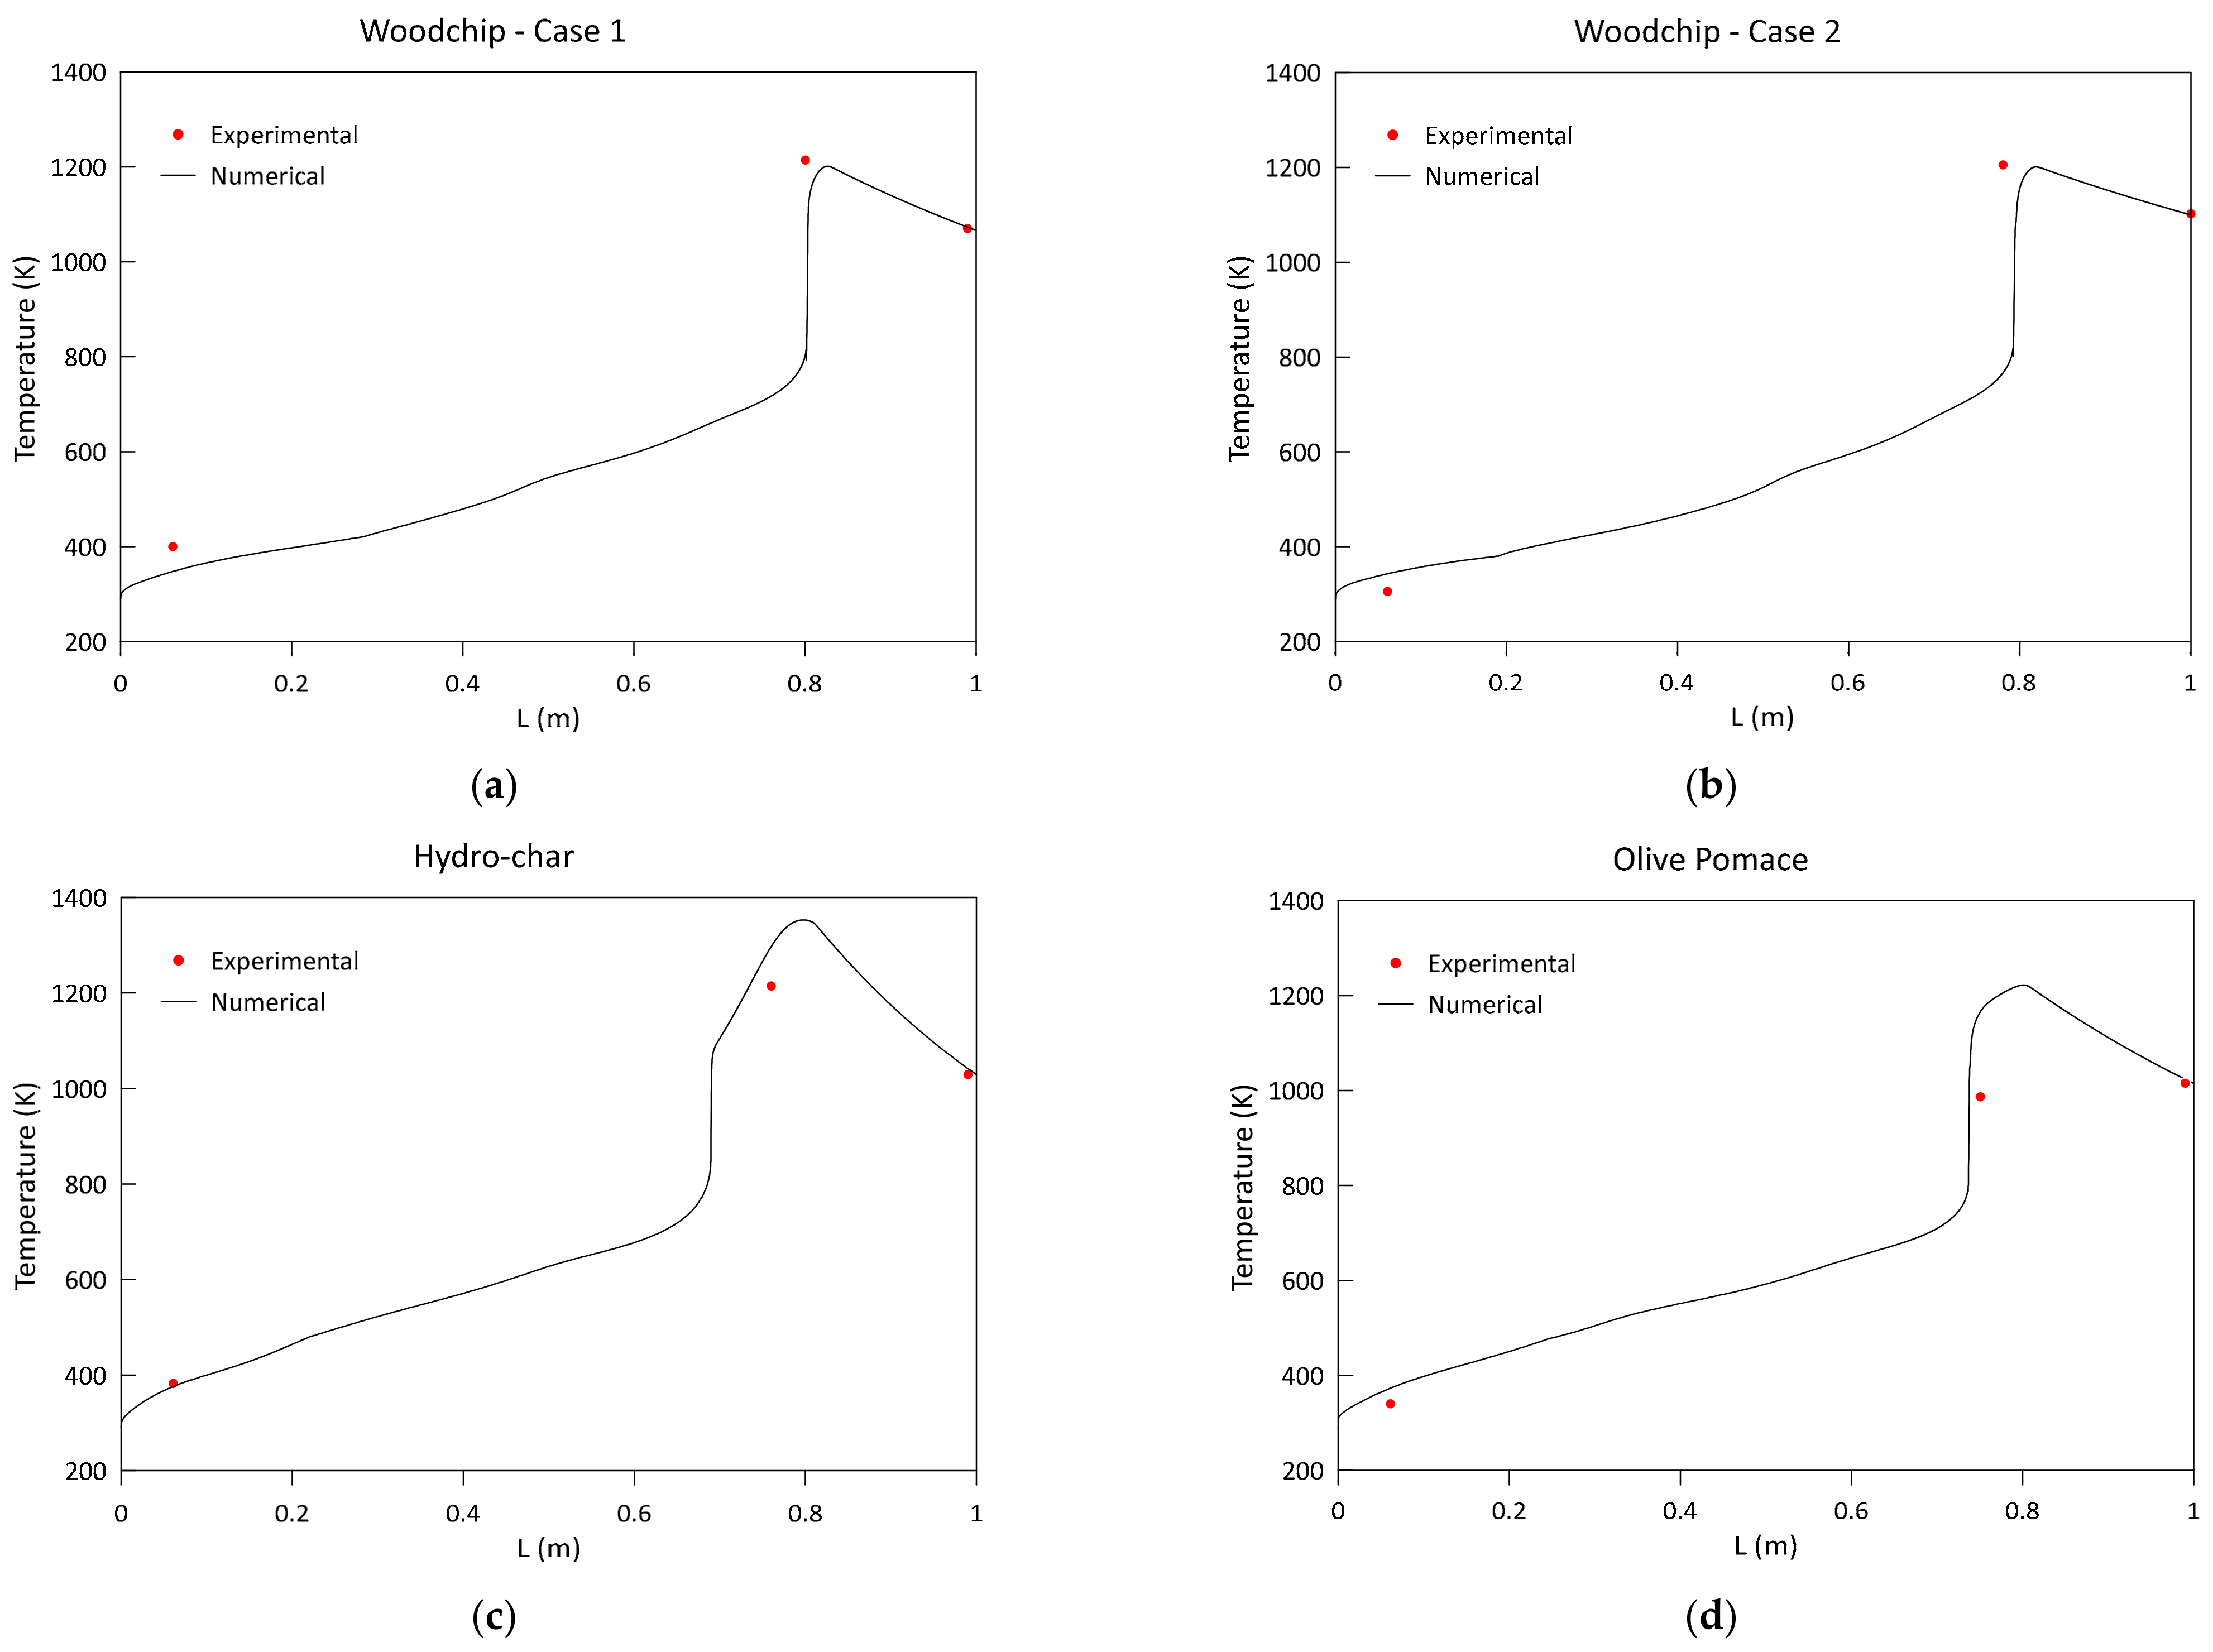
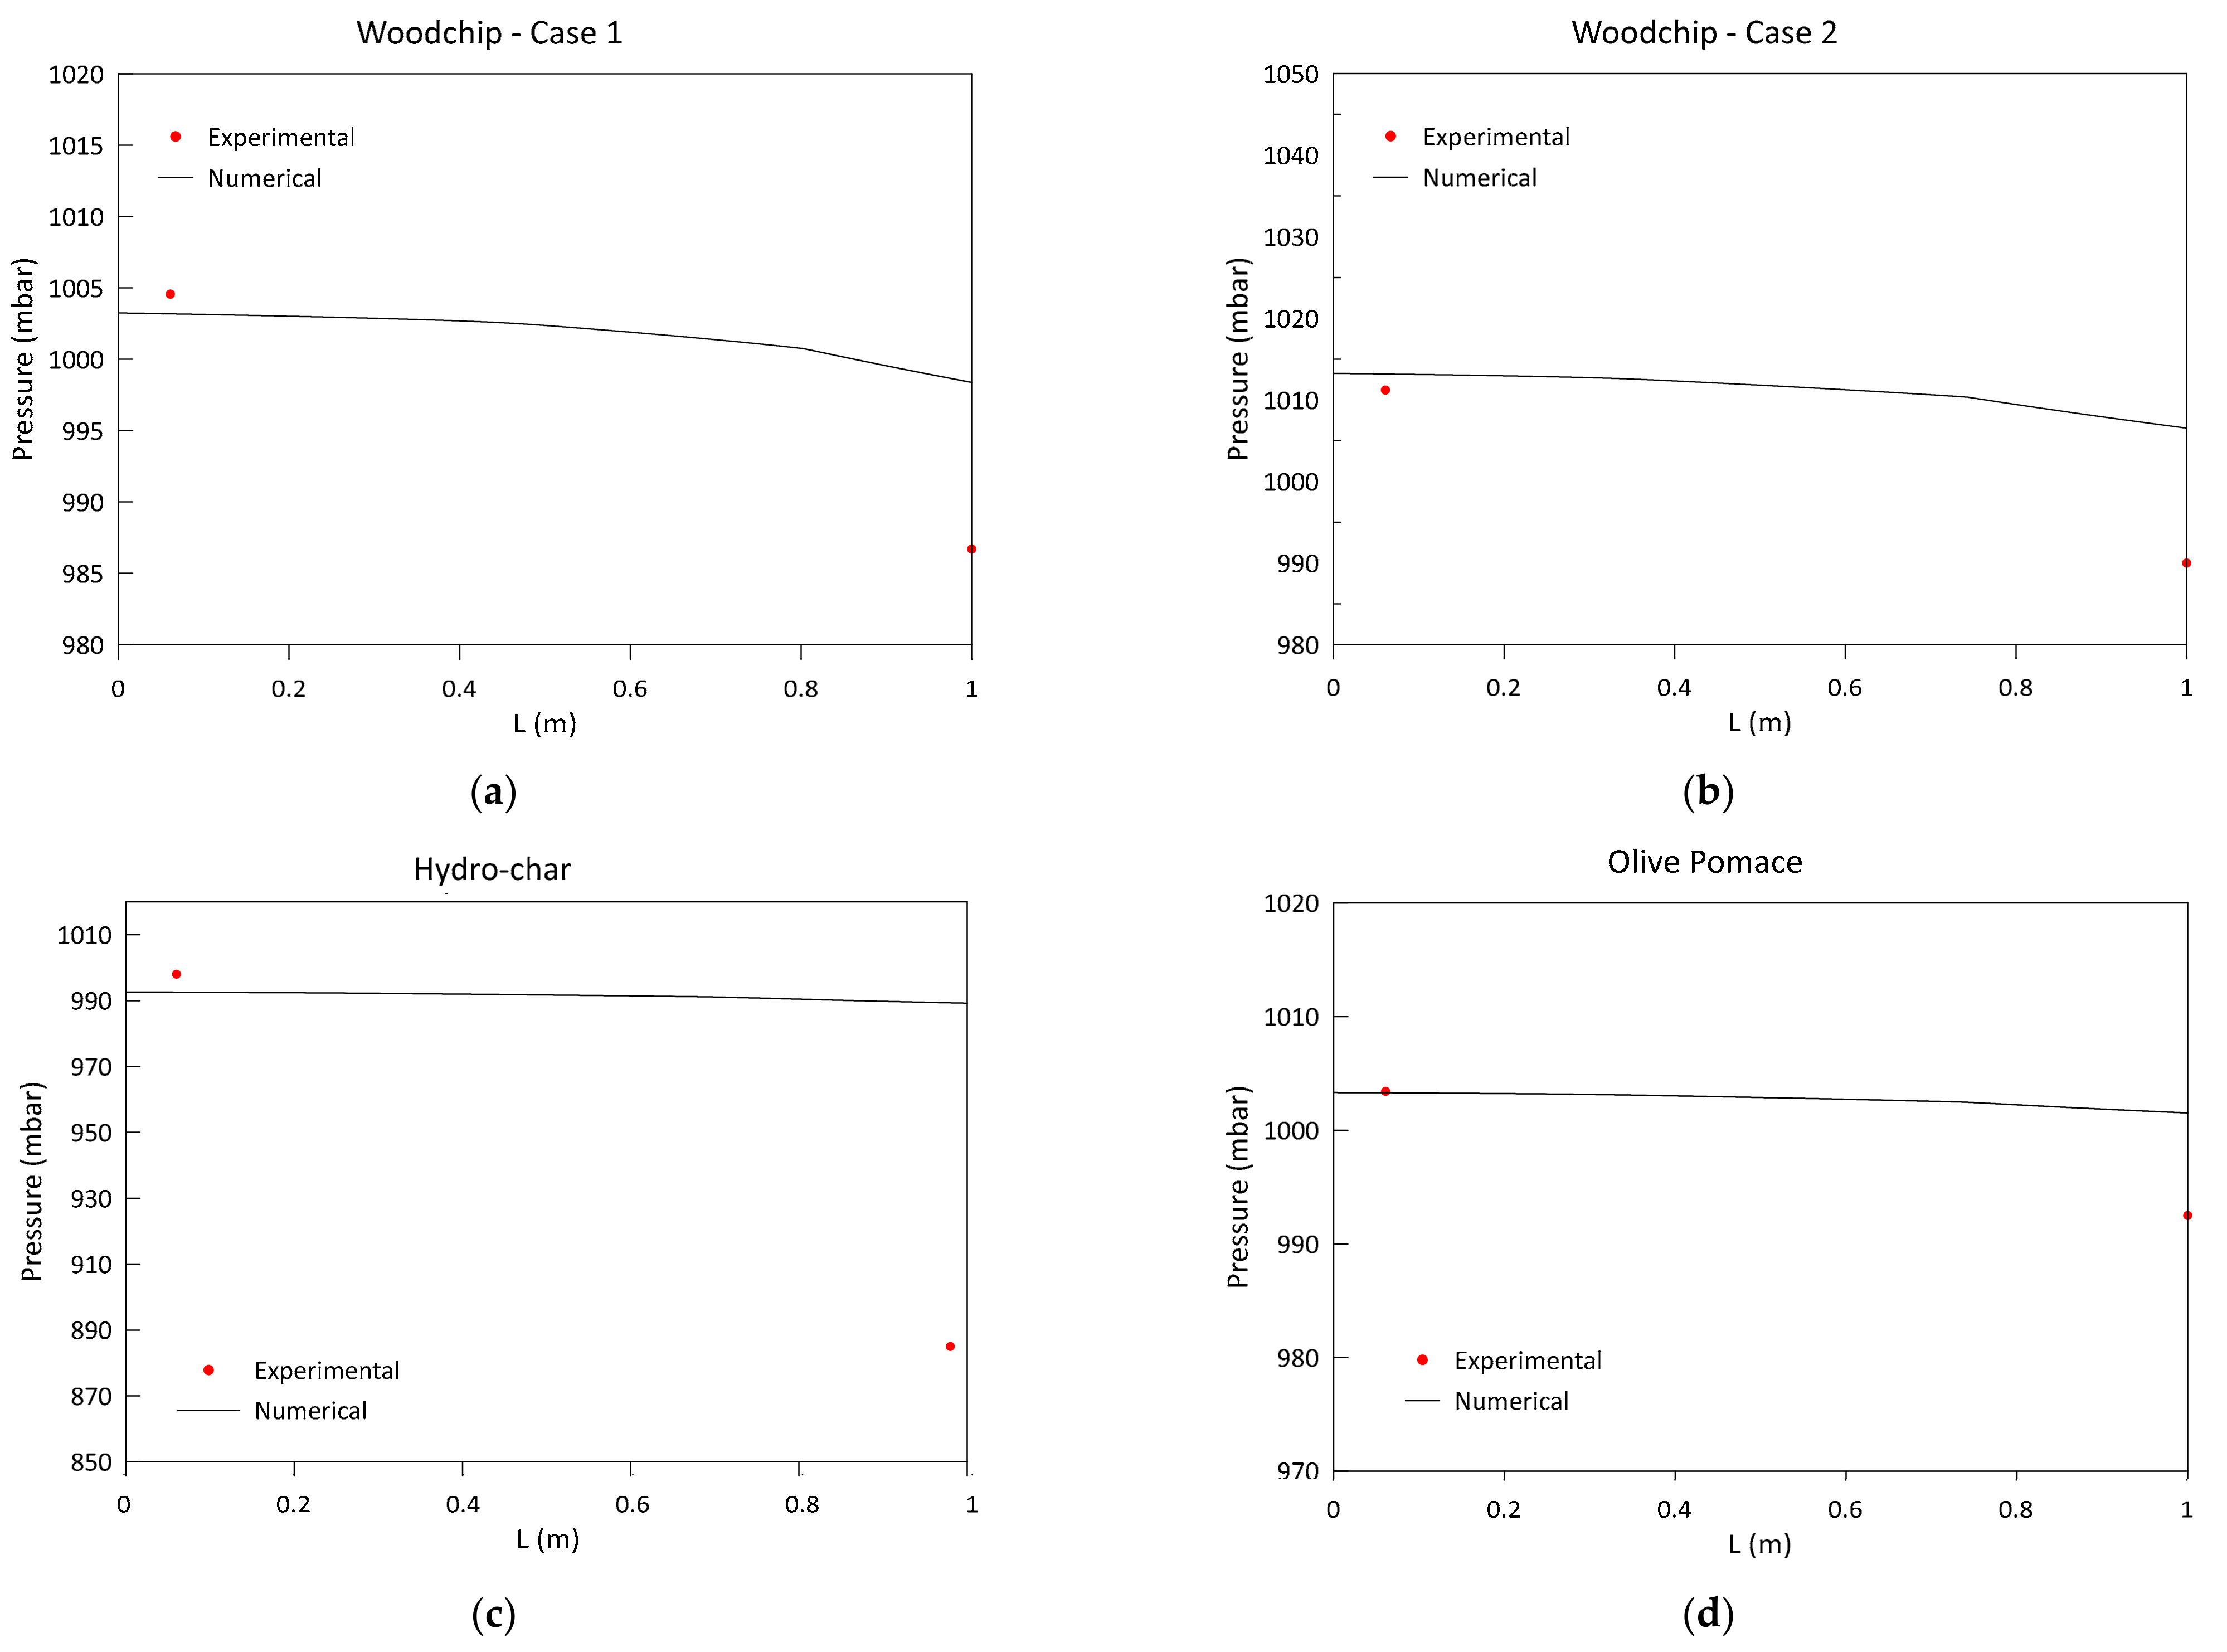
- Low-frequency pressure sensors and k-type thermocouples were mounted along the reactor axis, respectively, for the measurement of the gaseous pressure and temperature to be used for the validation of the model results. Table 5 reports the gasifier characteristics, together with the details about the position of each thermocouple and pressure sensor applied.
3. Results
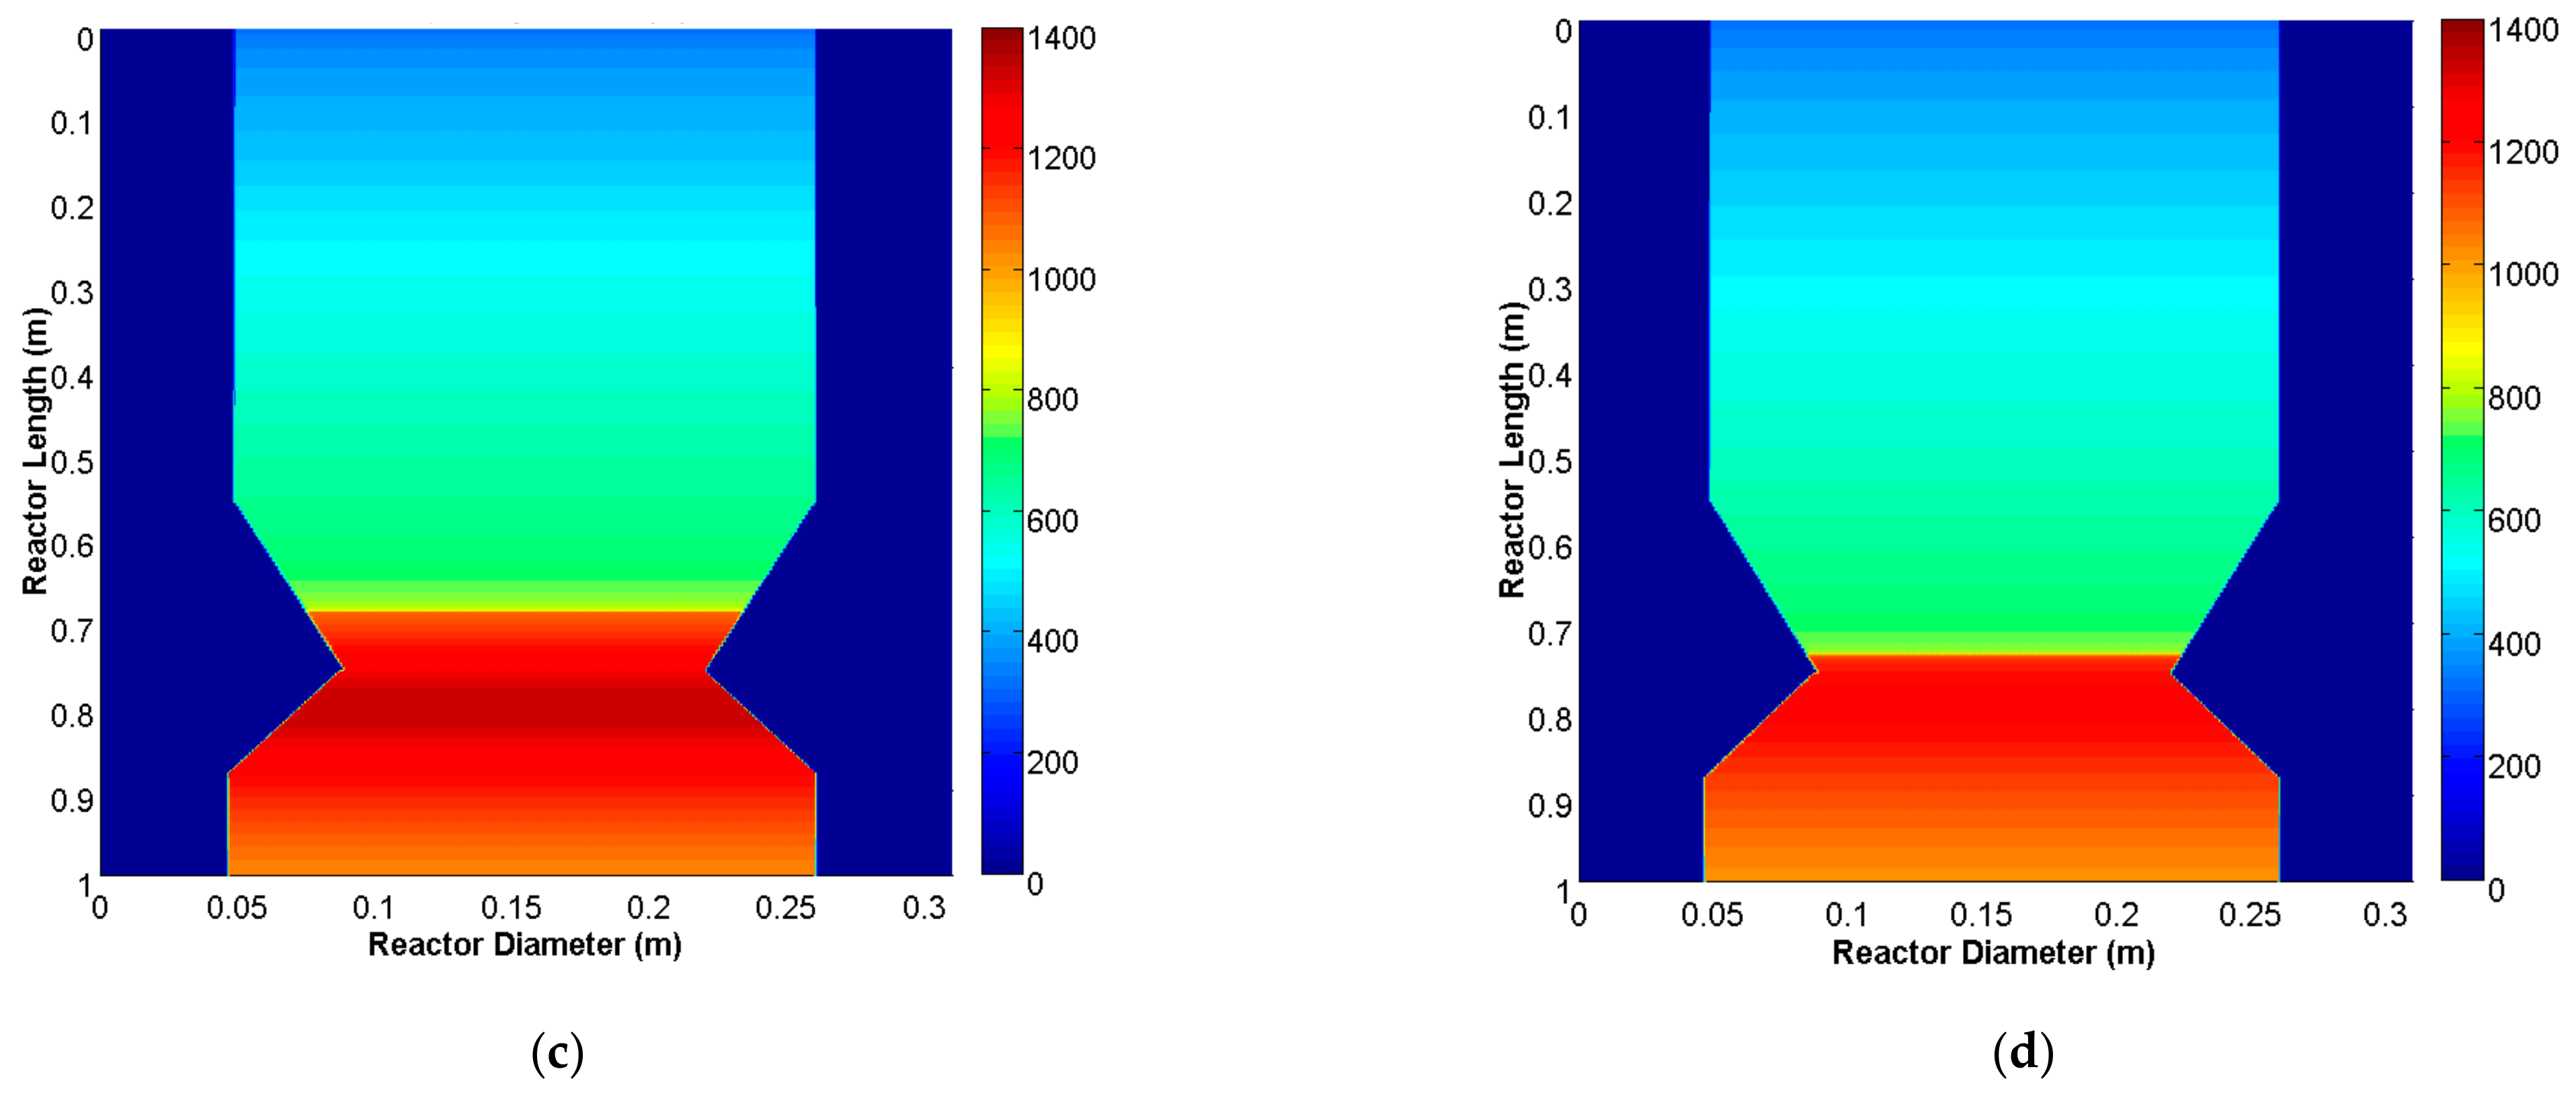
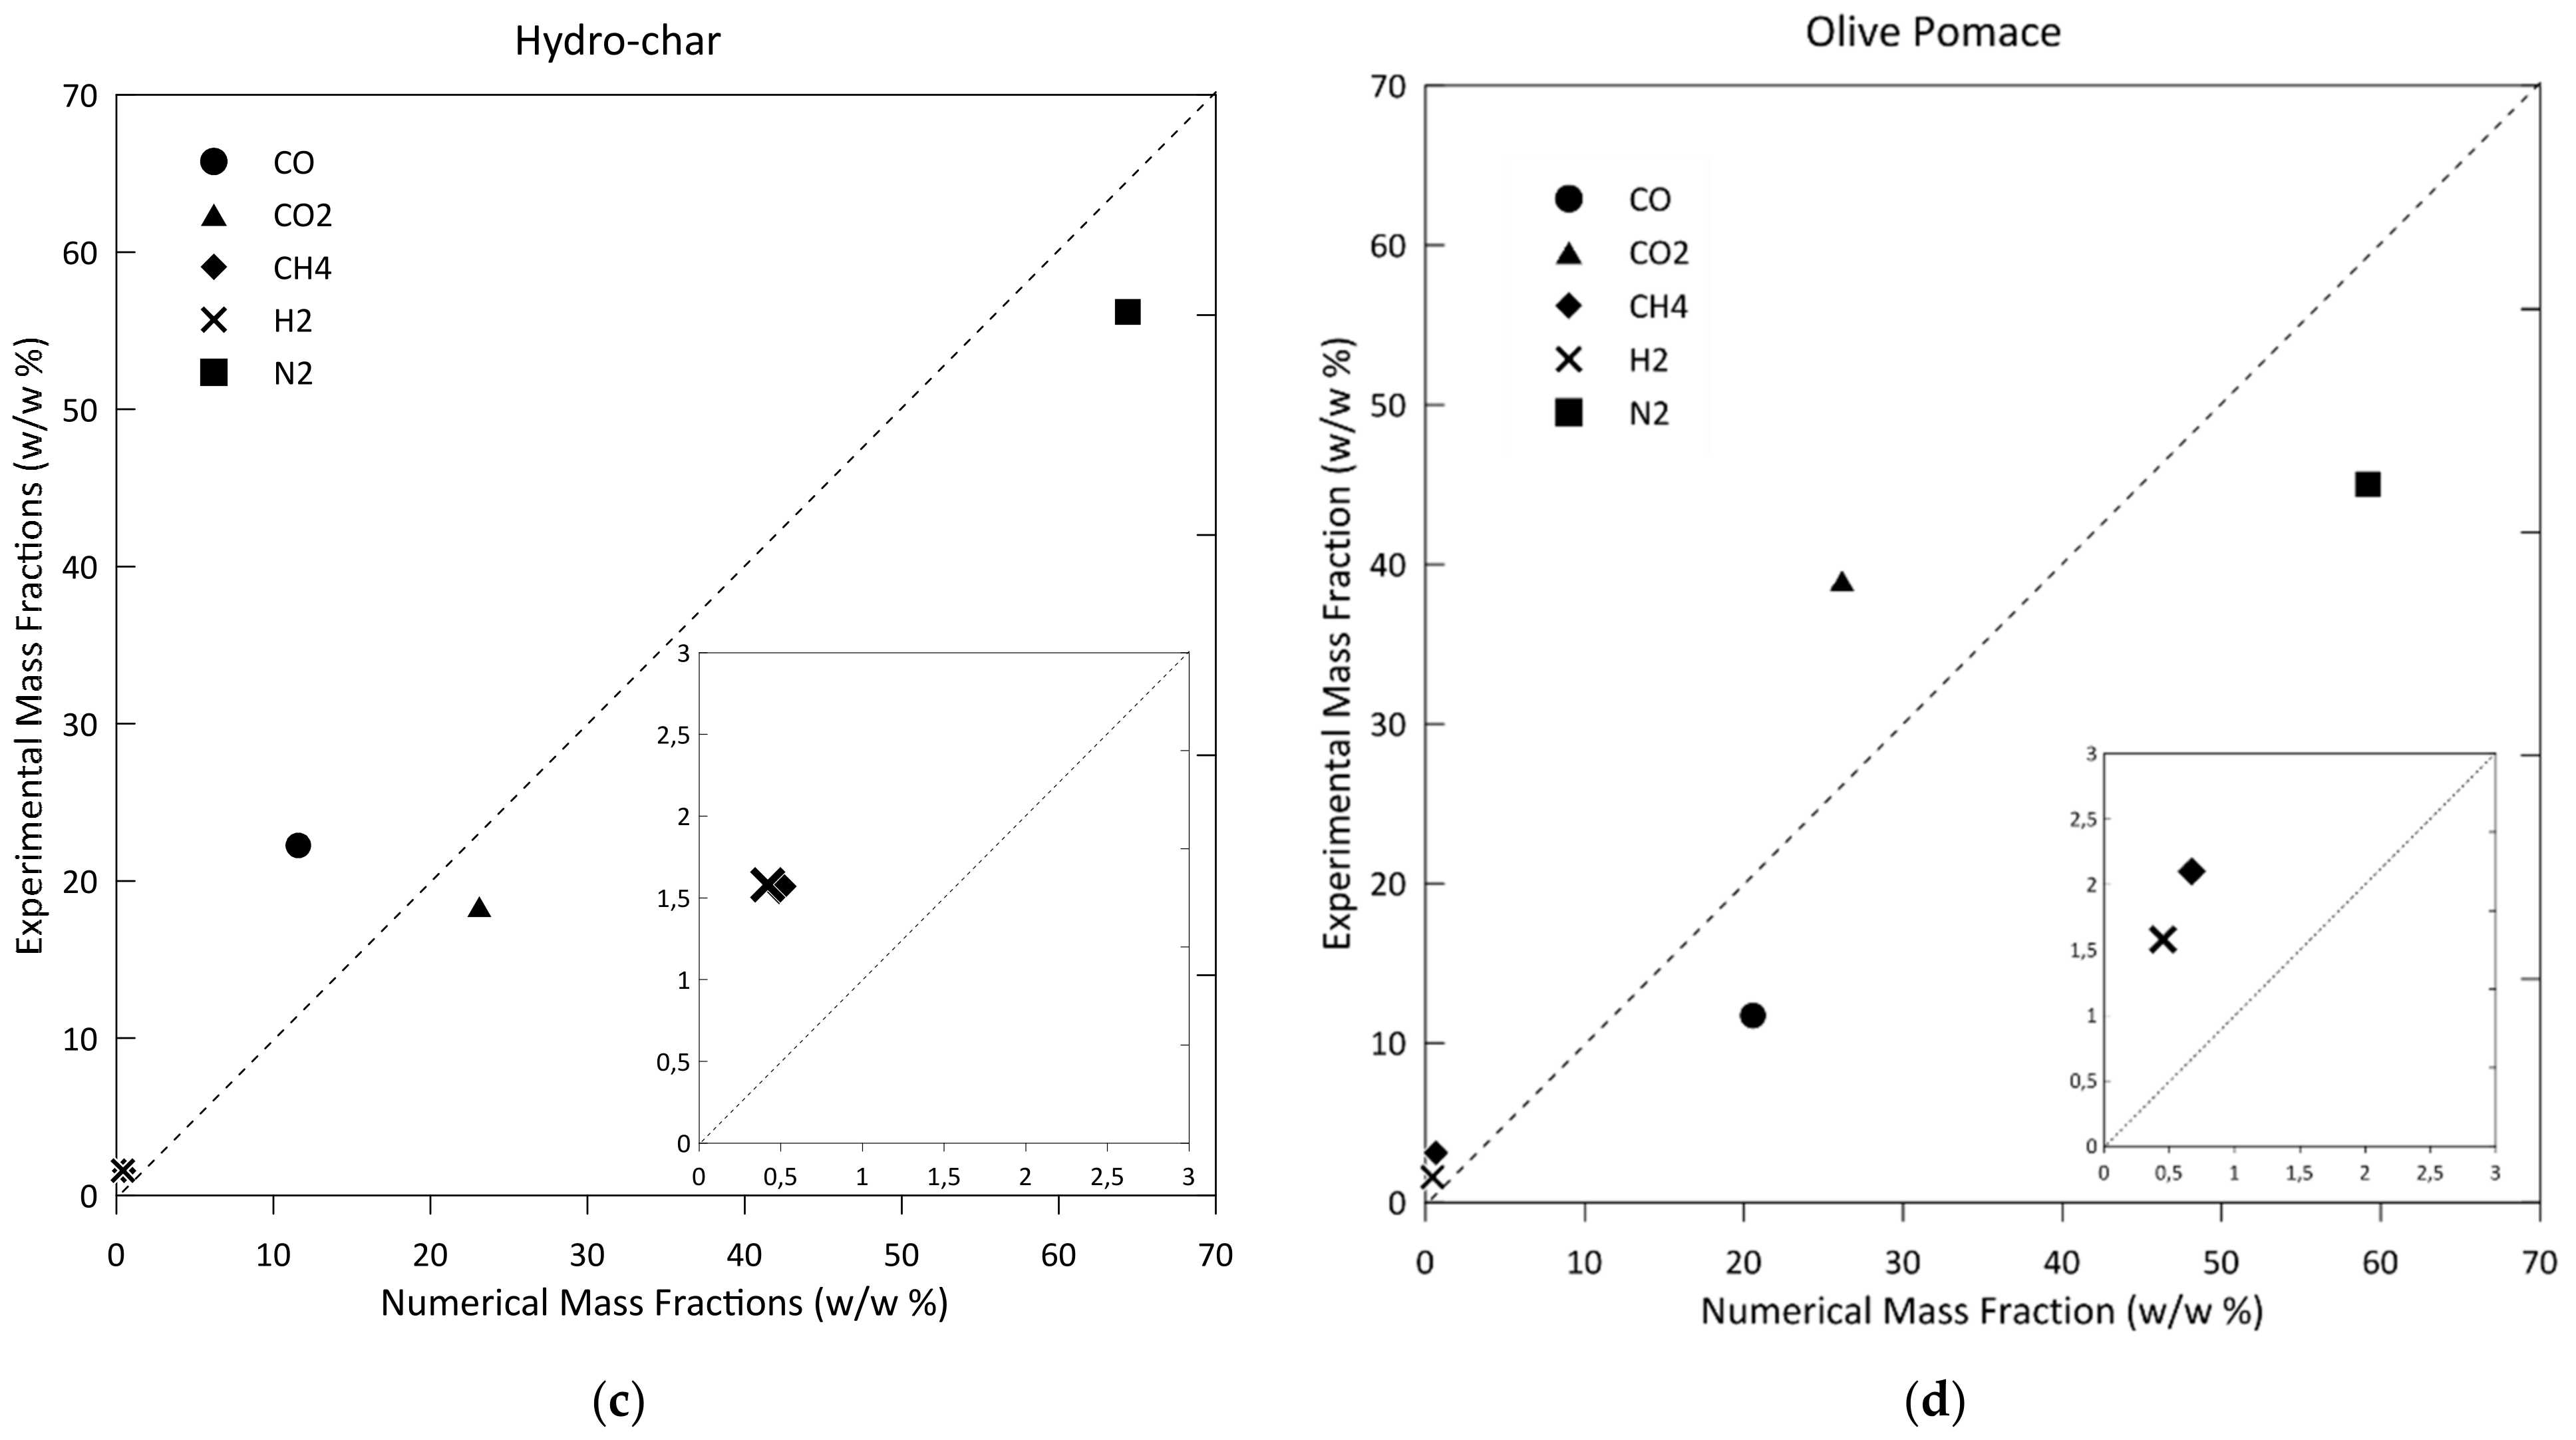
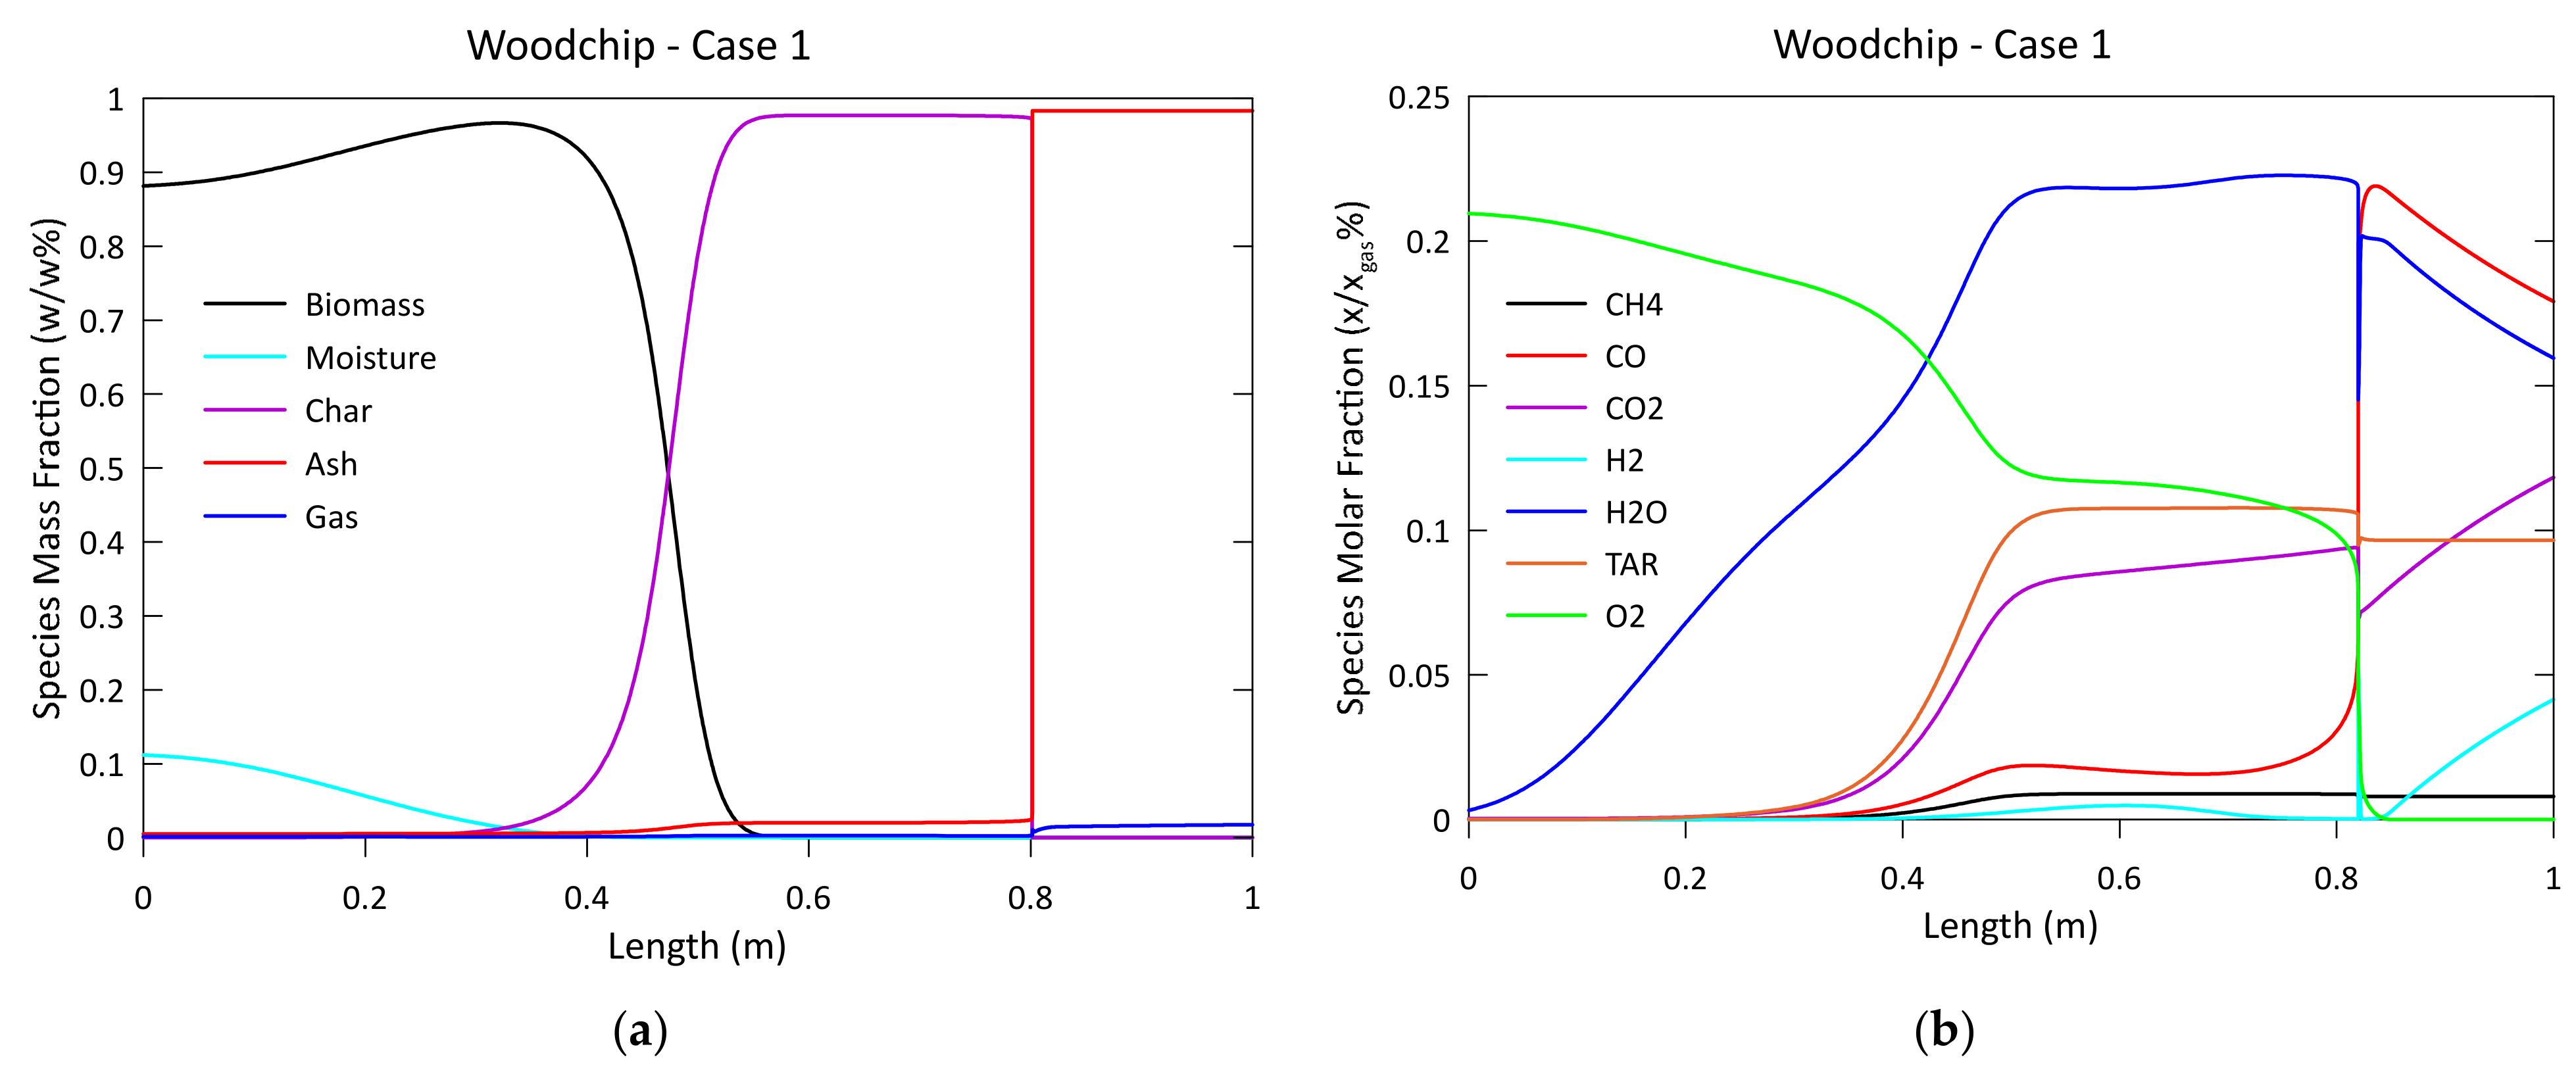
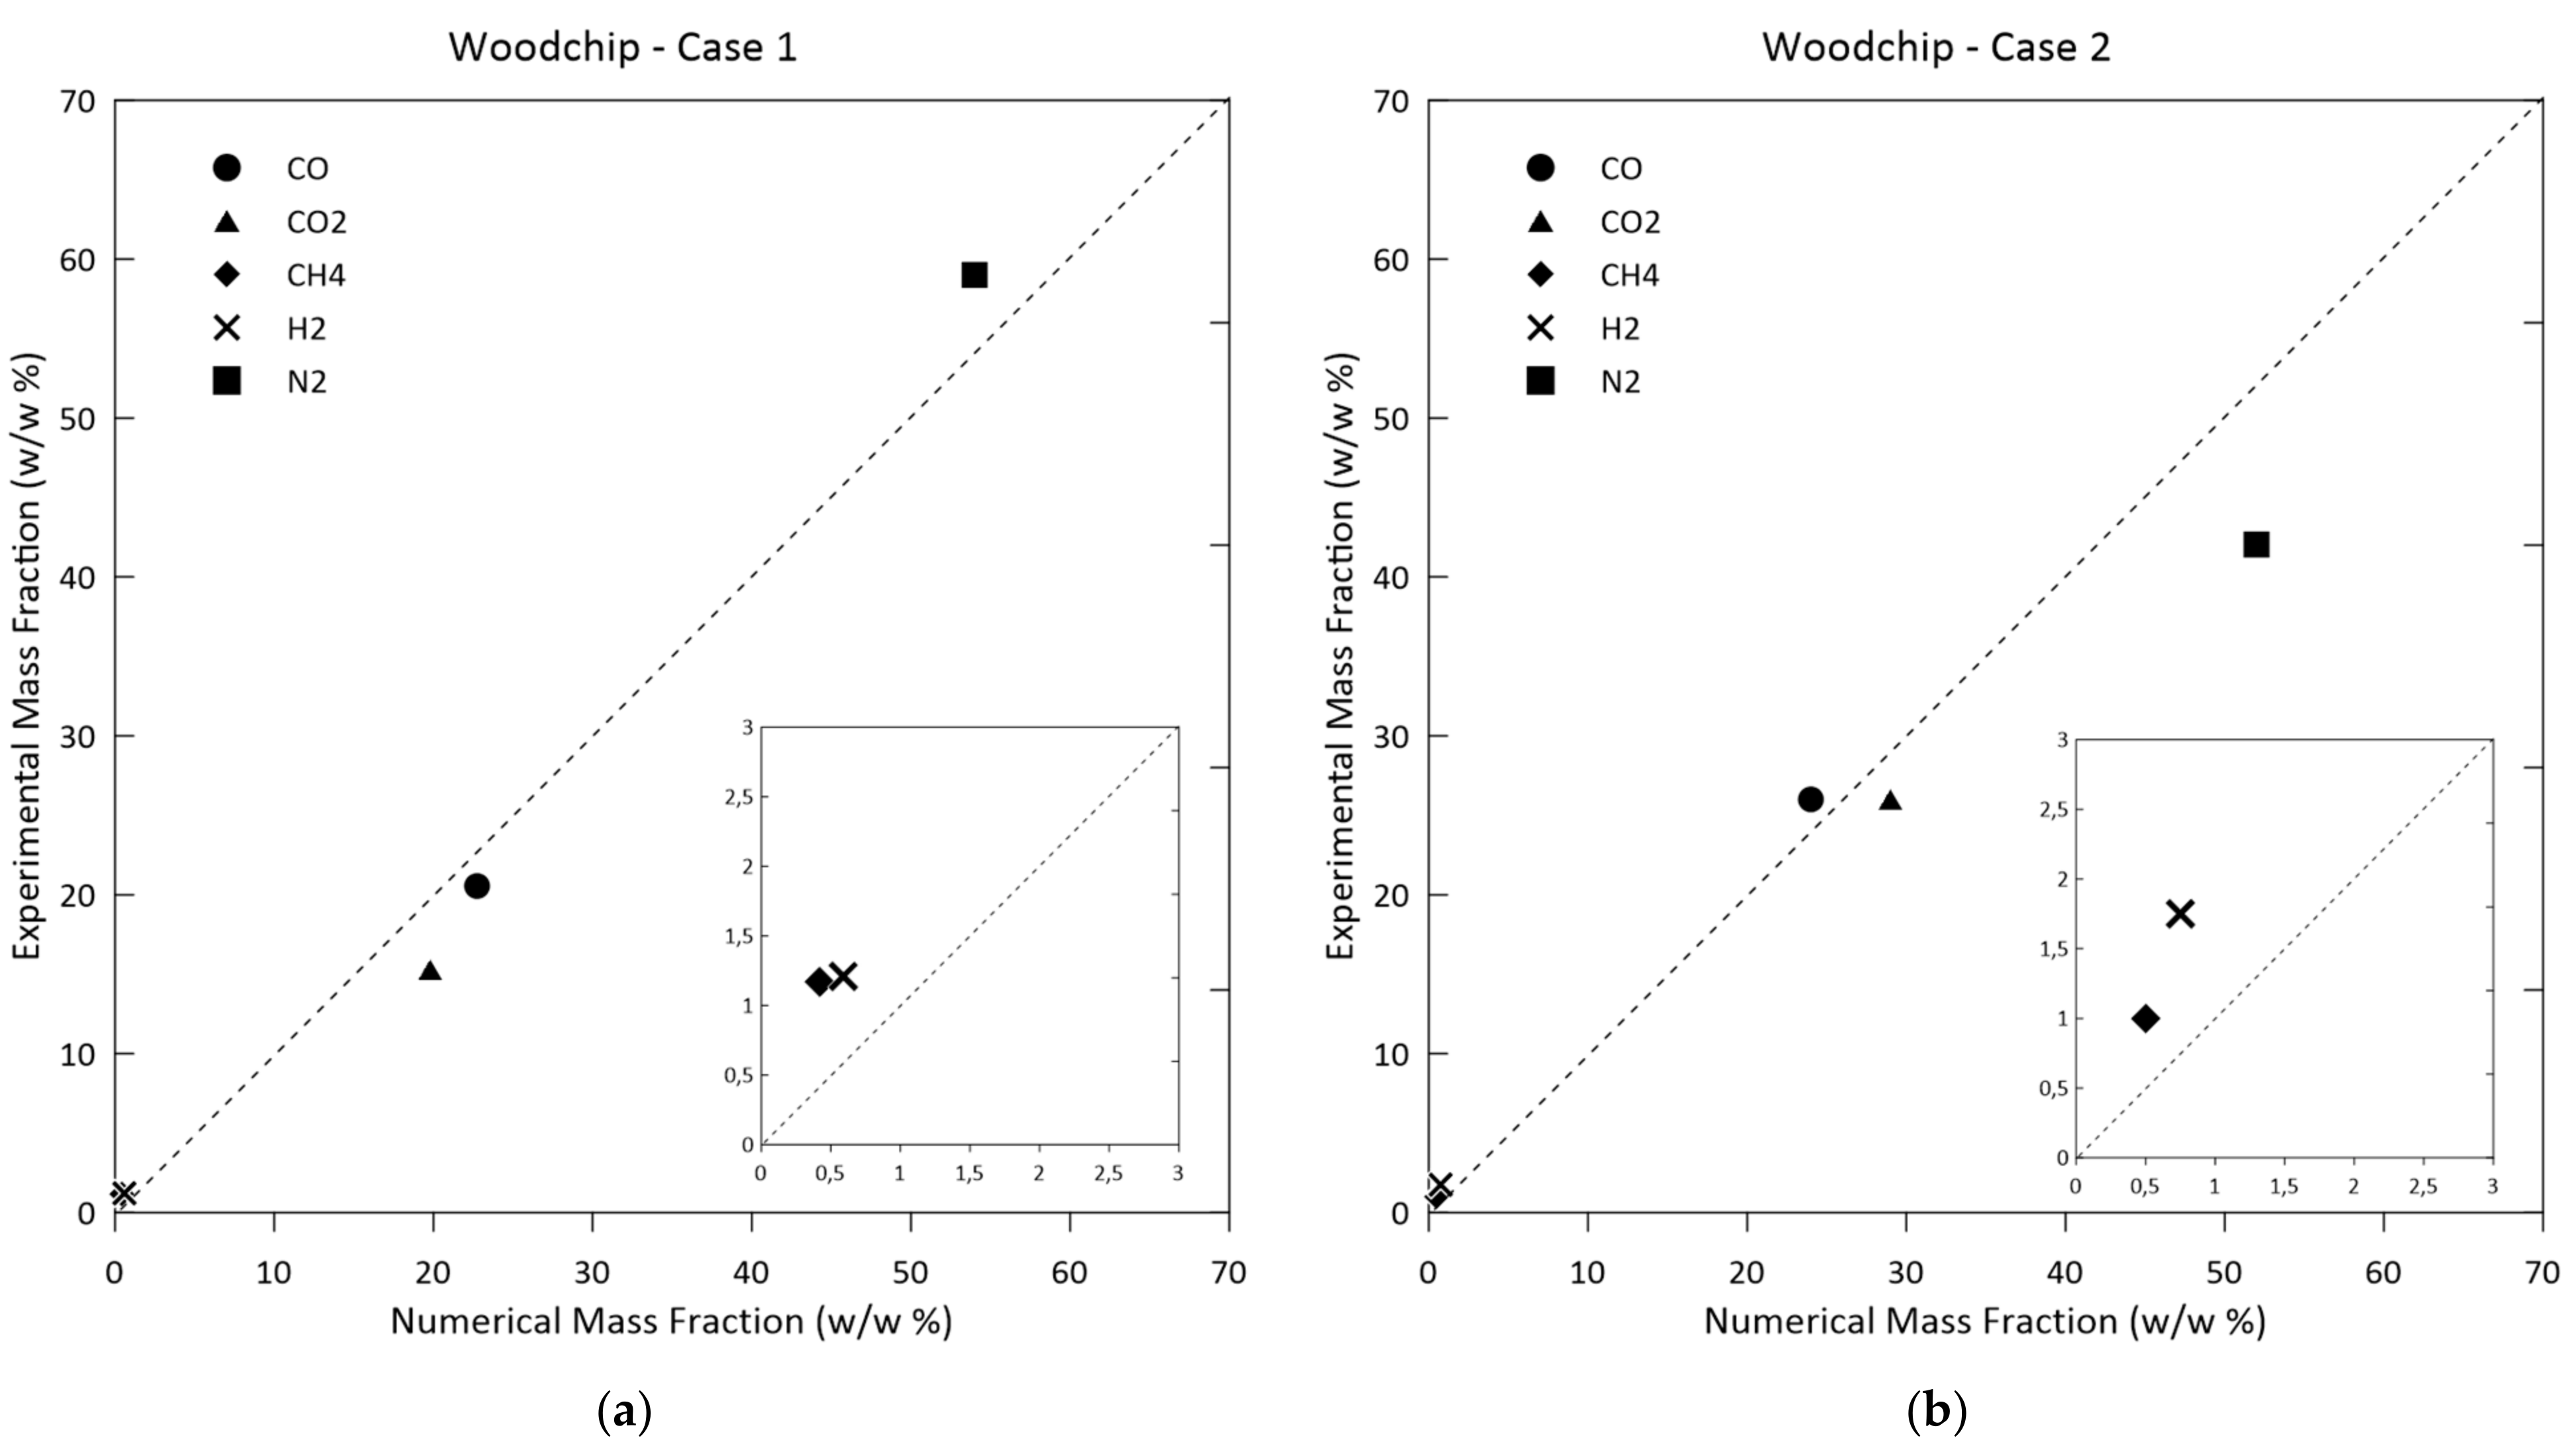
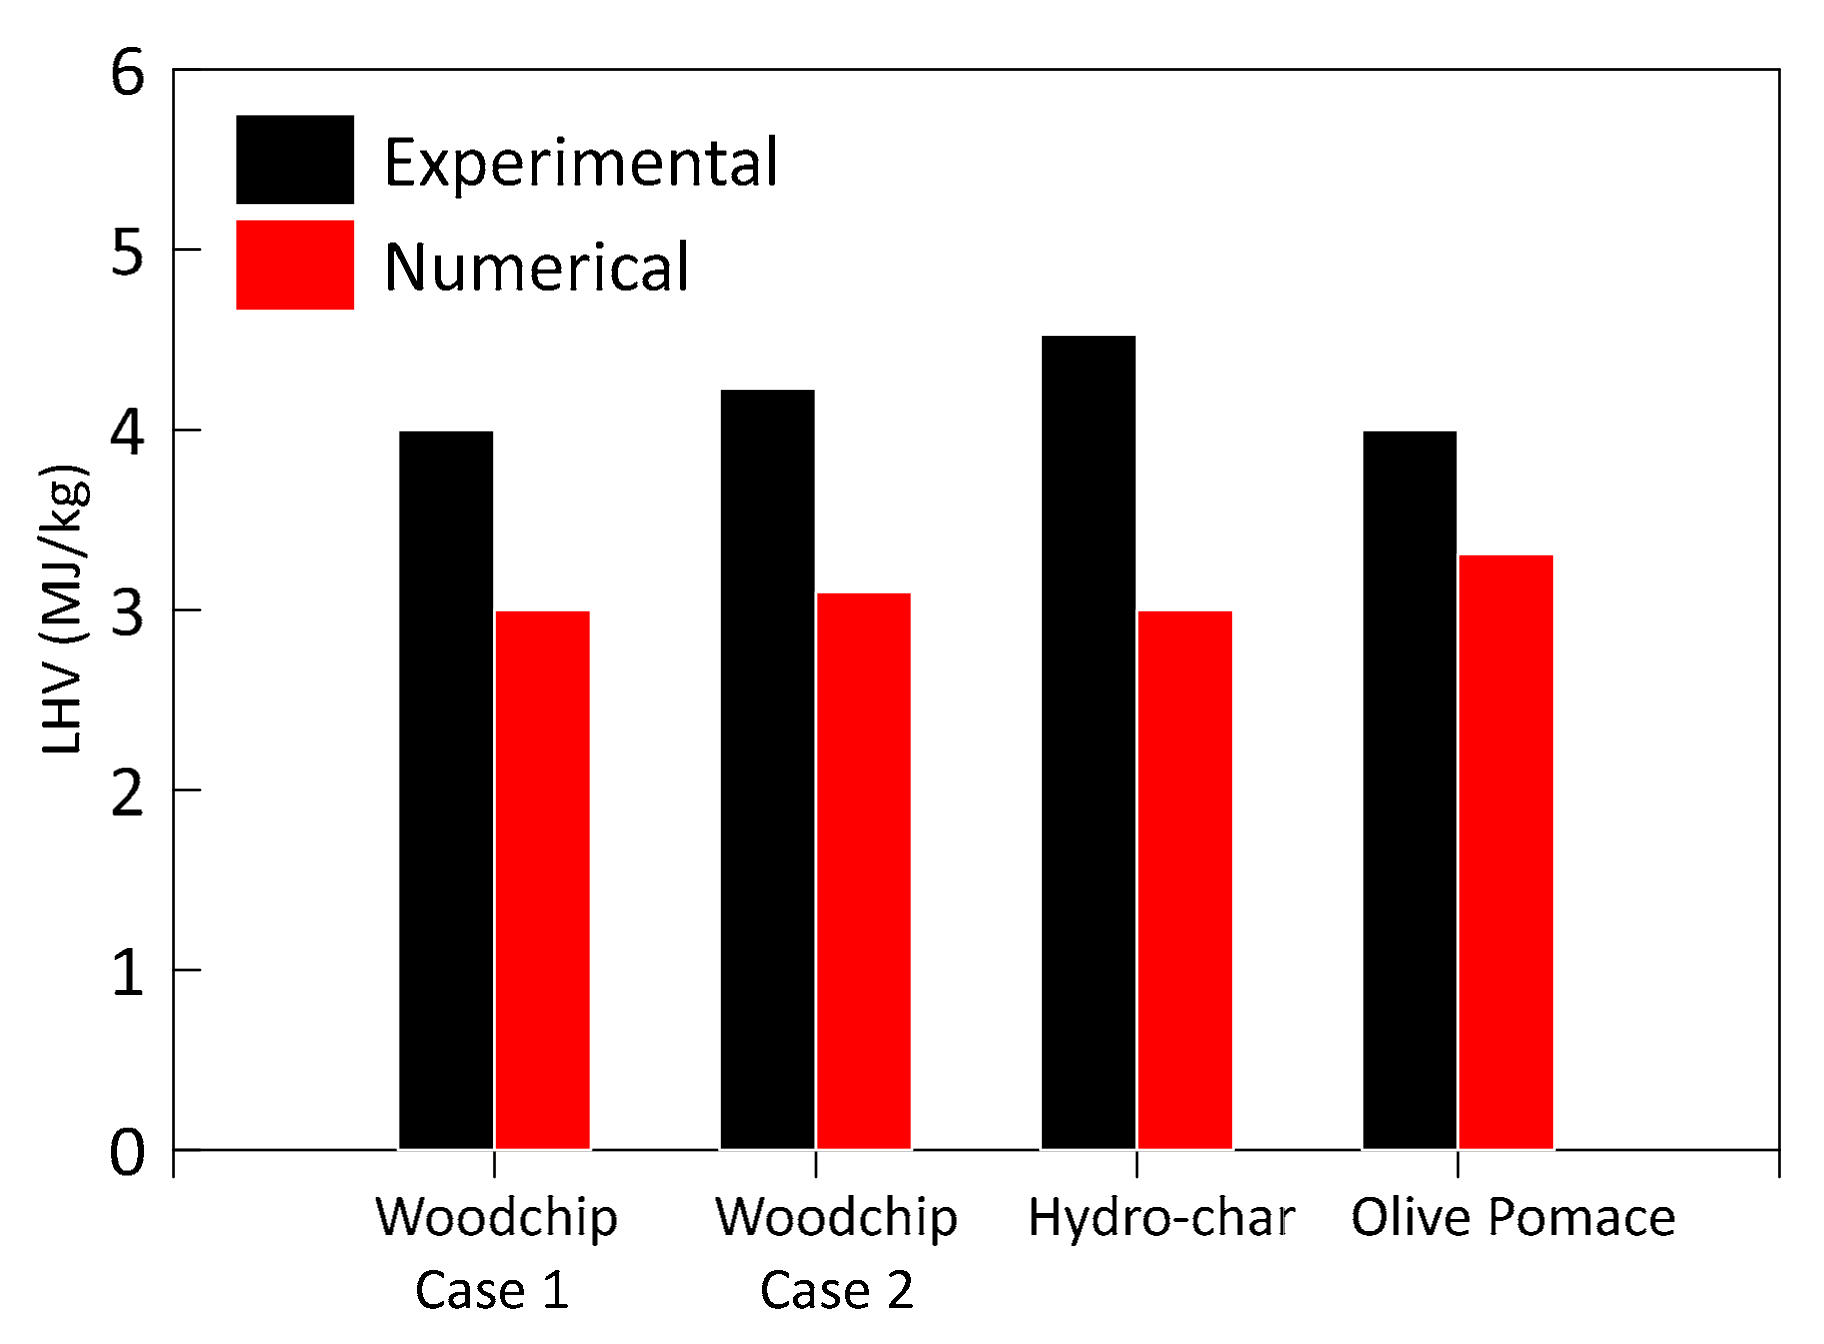
3.1. Model Validation and Results
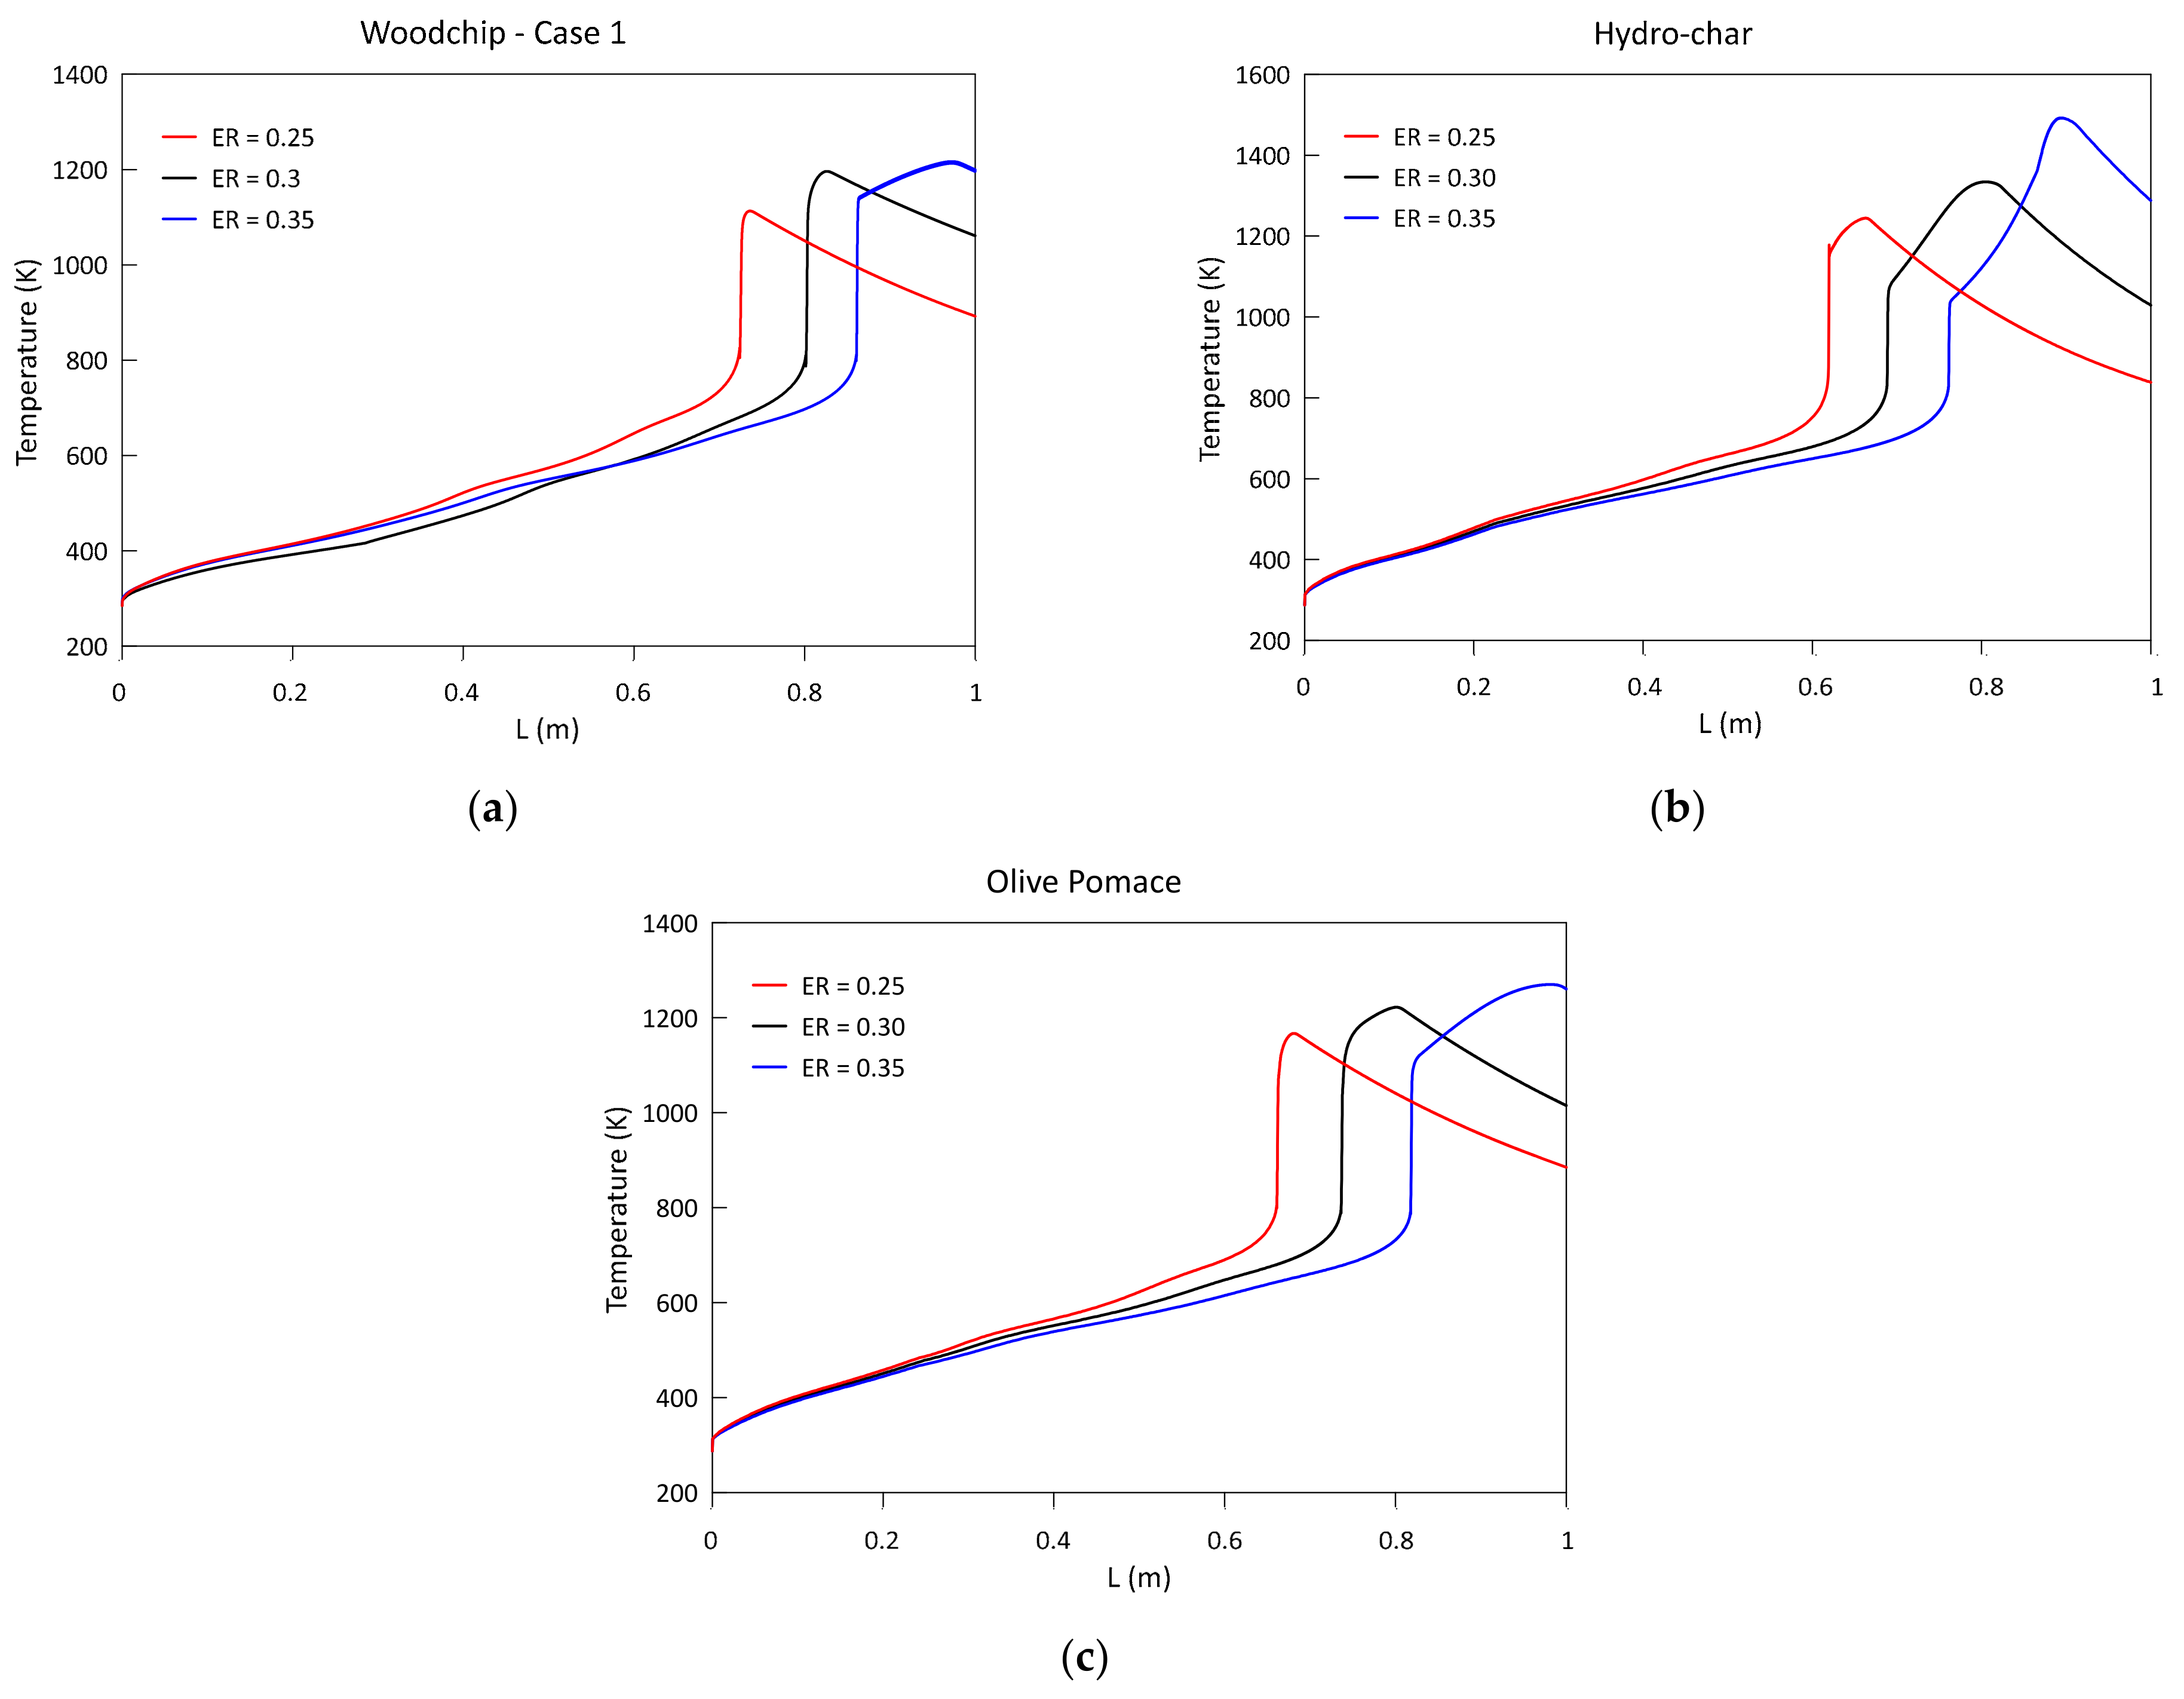
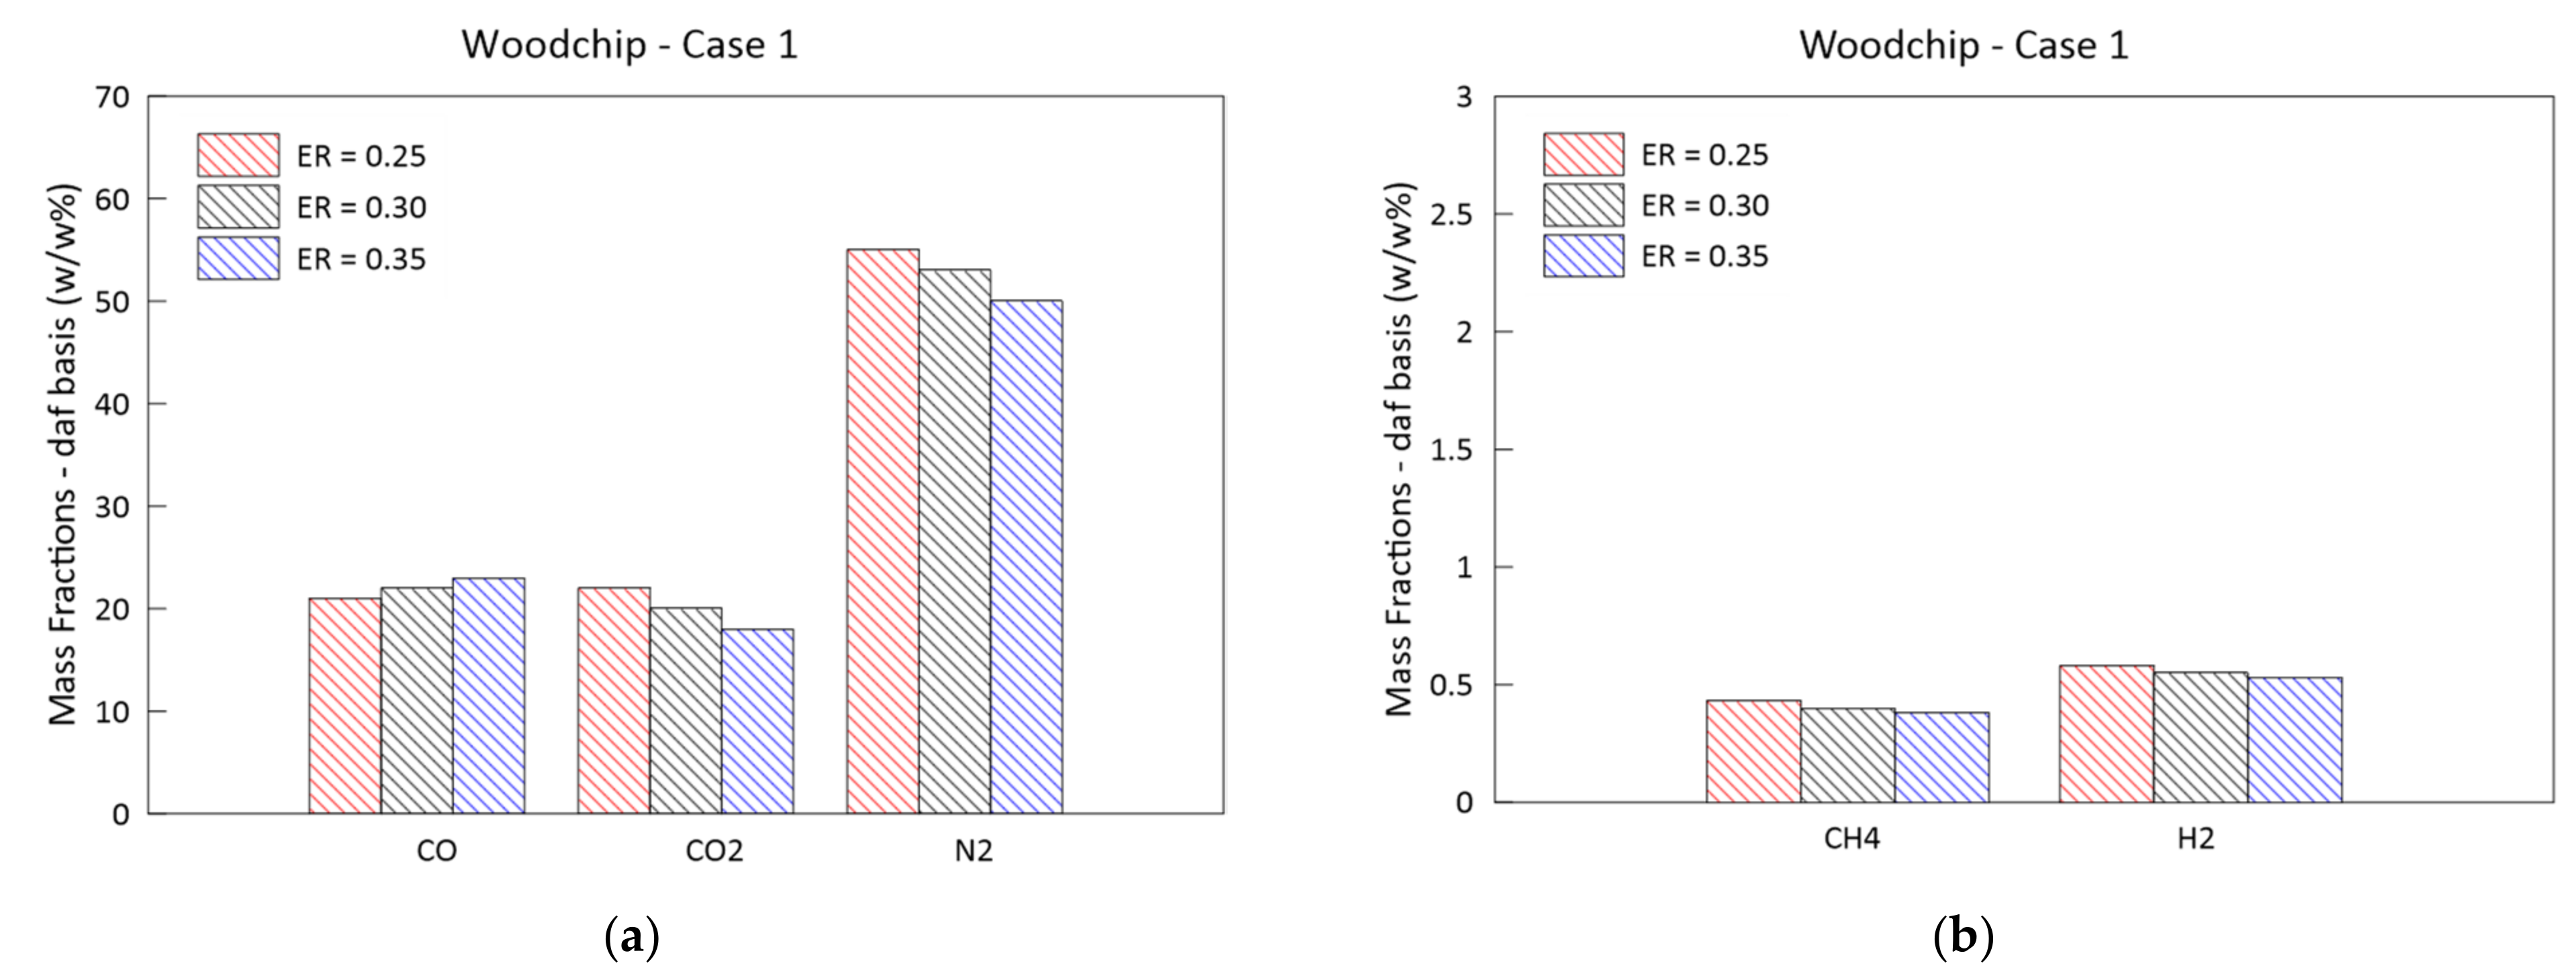
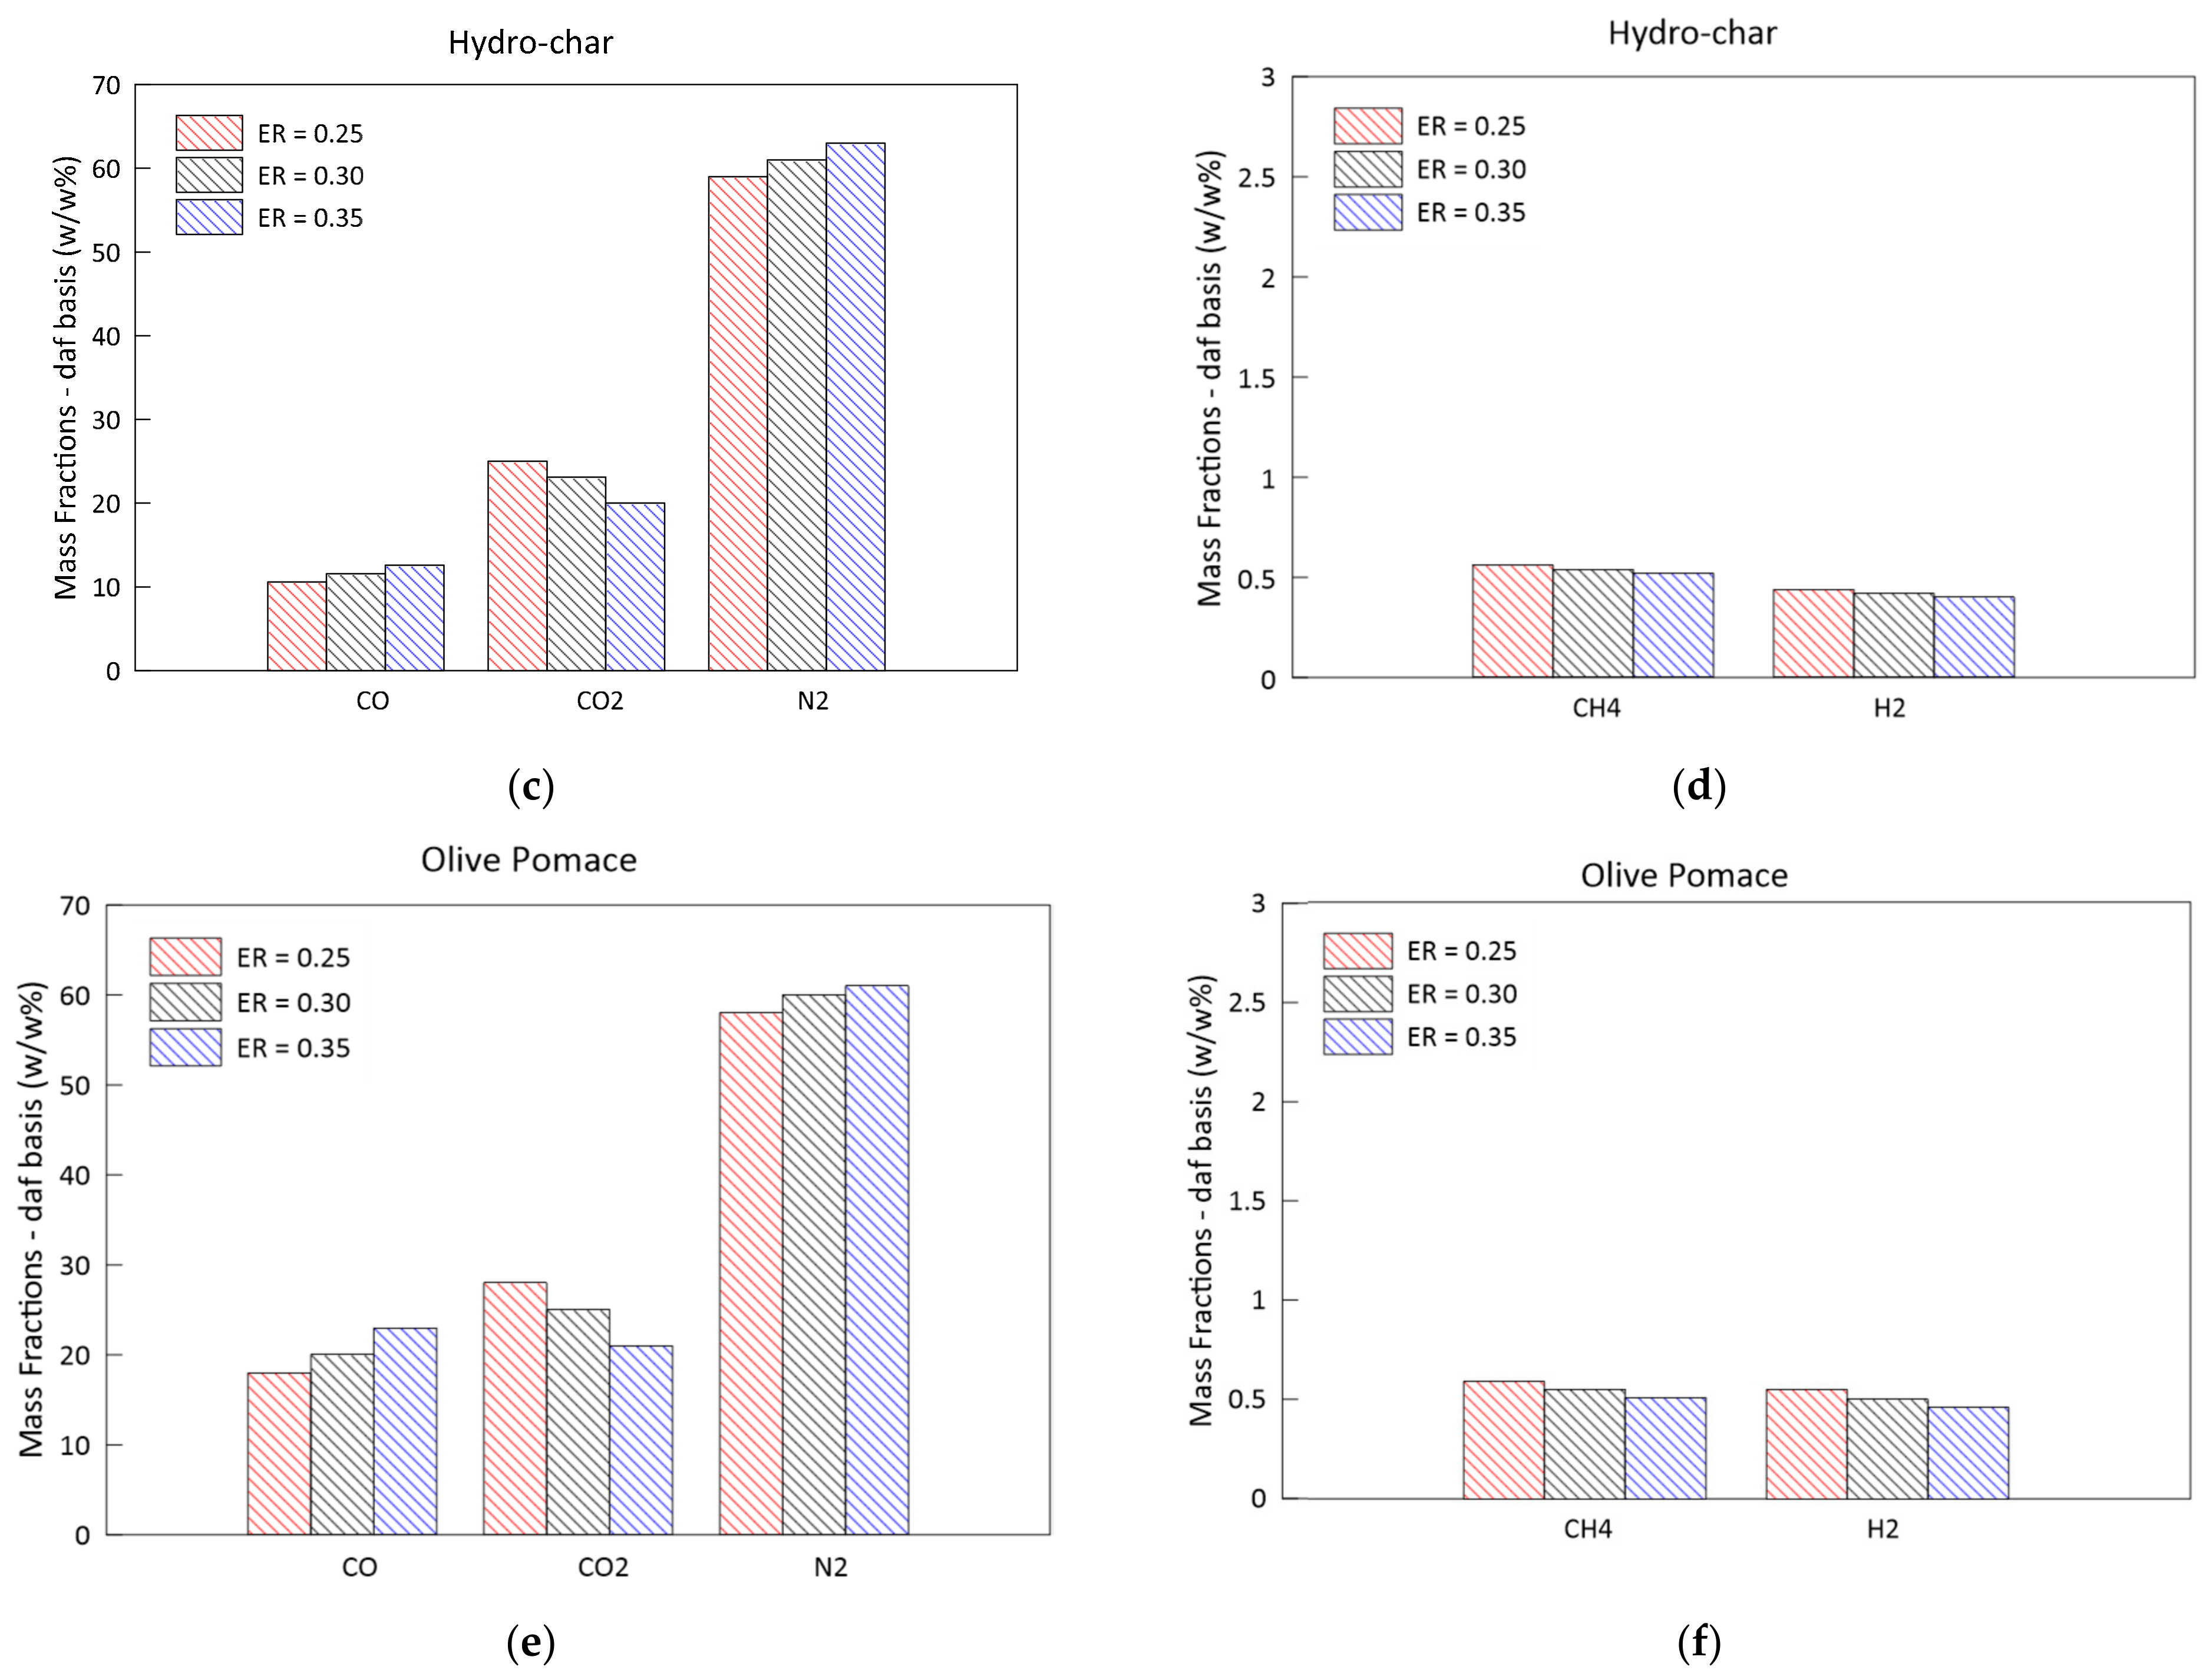
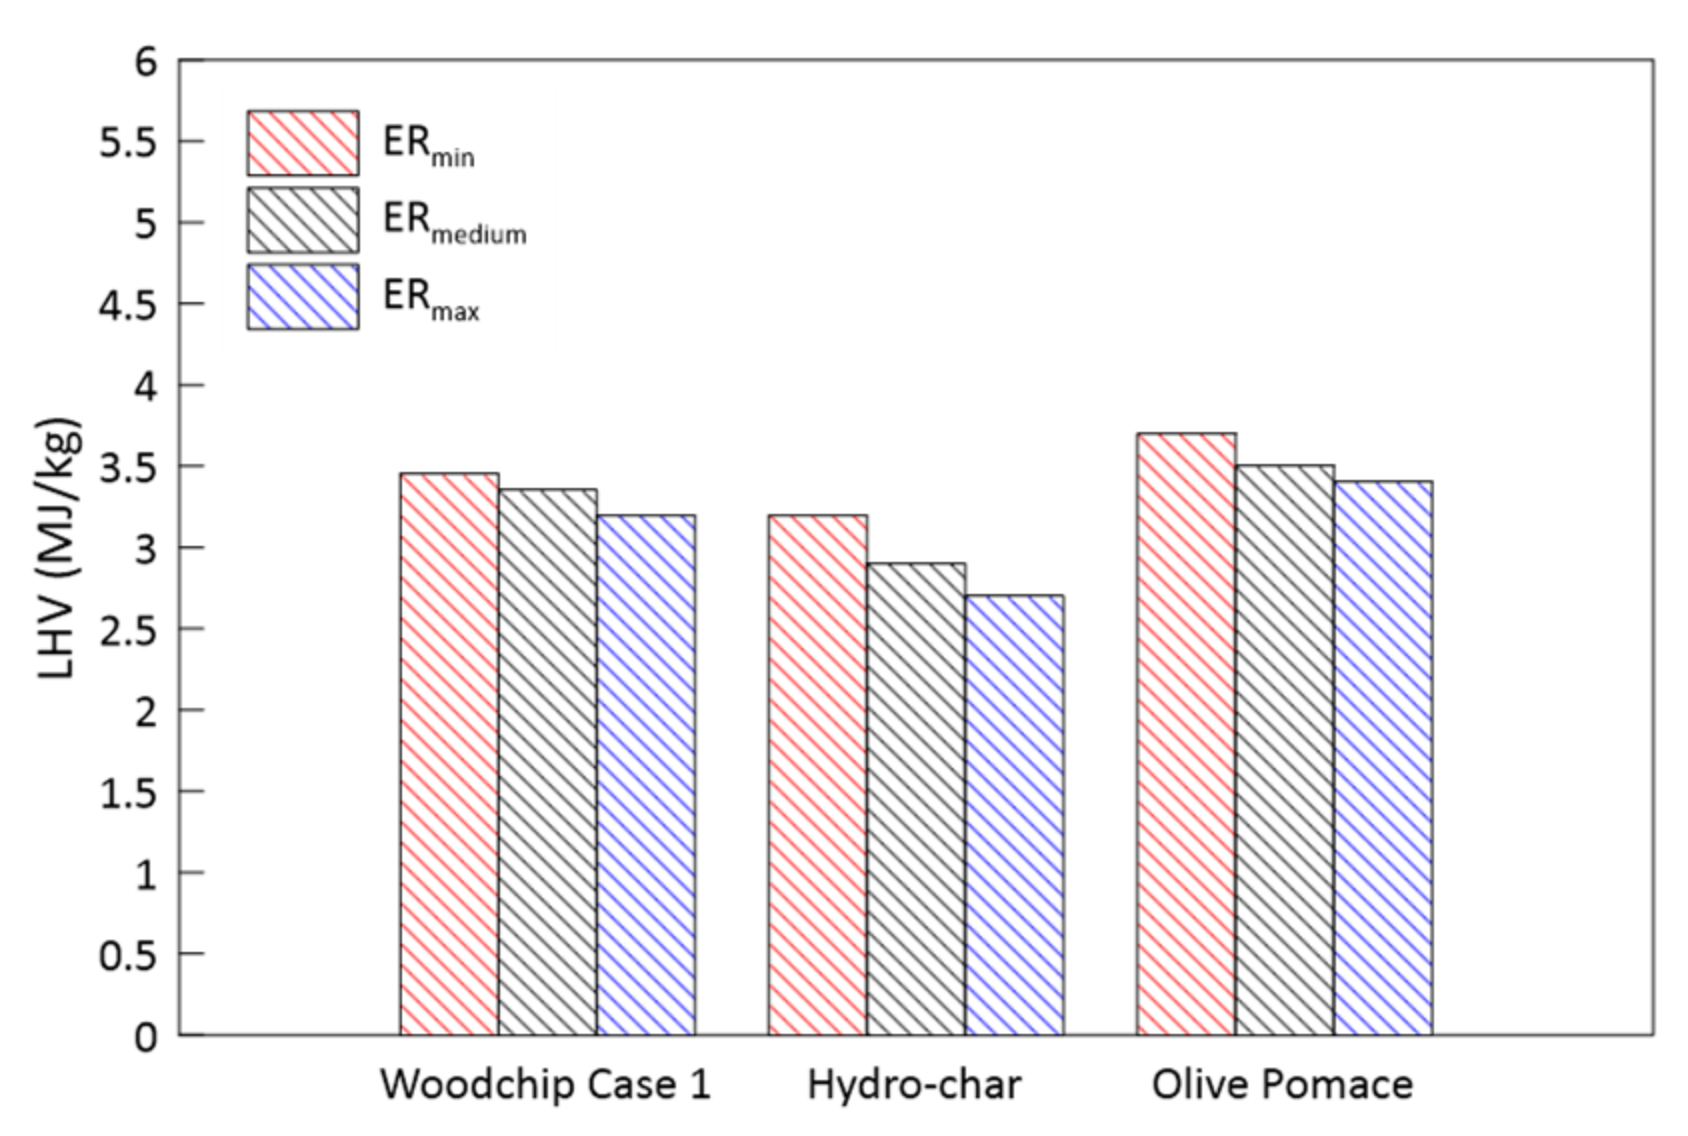
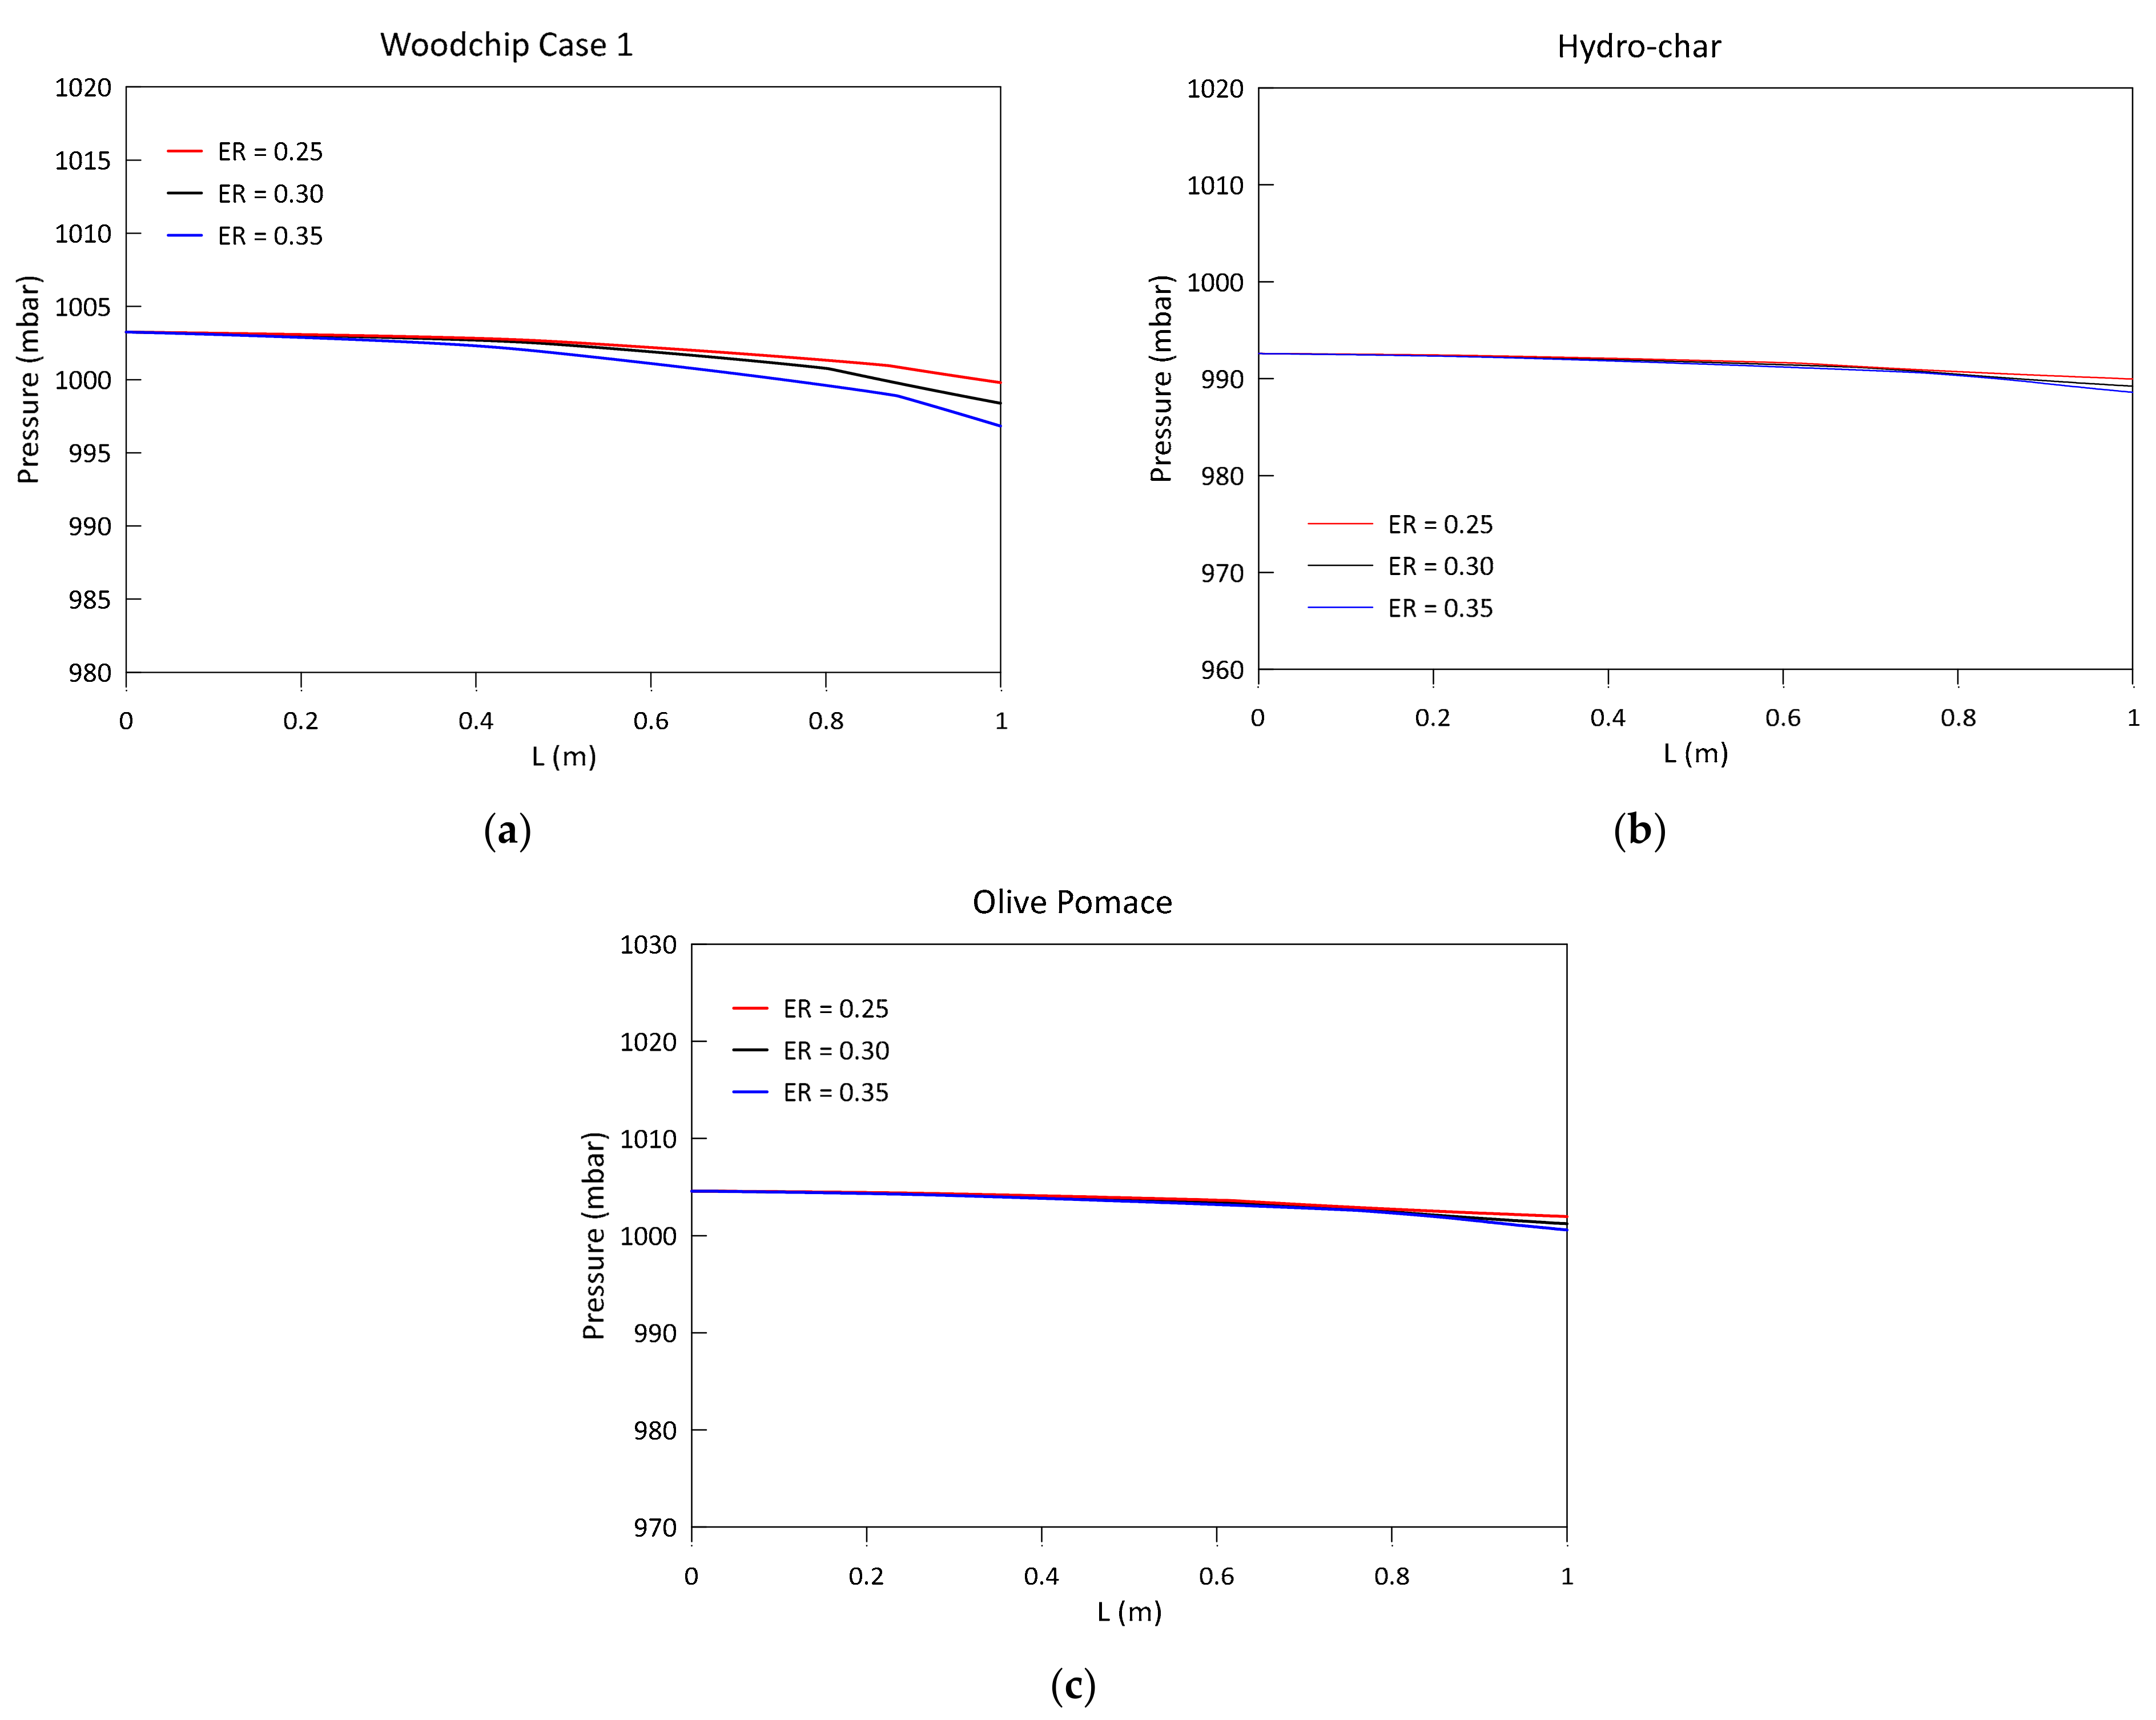
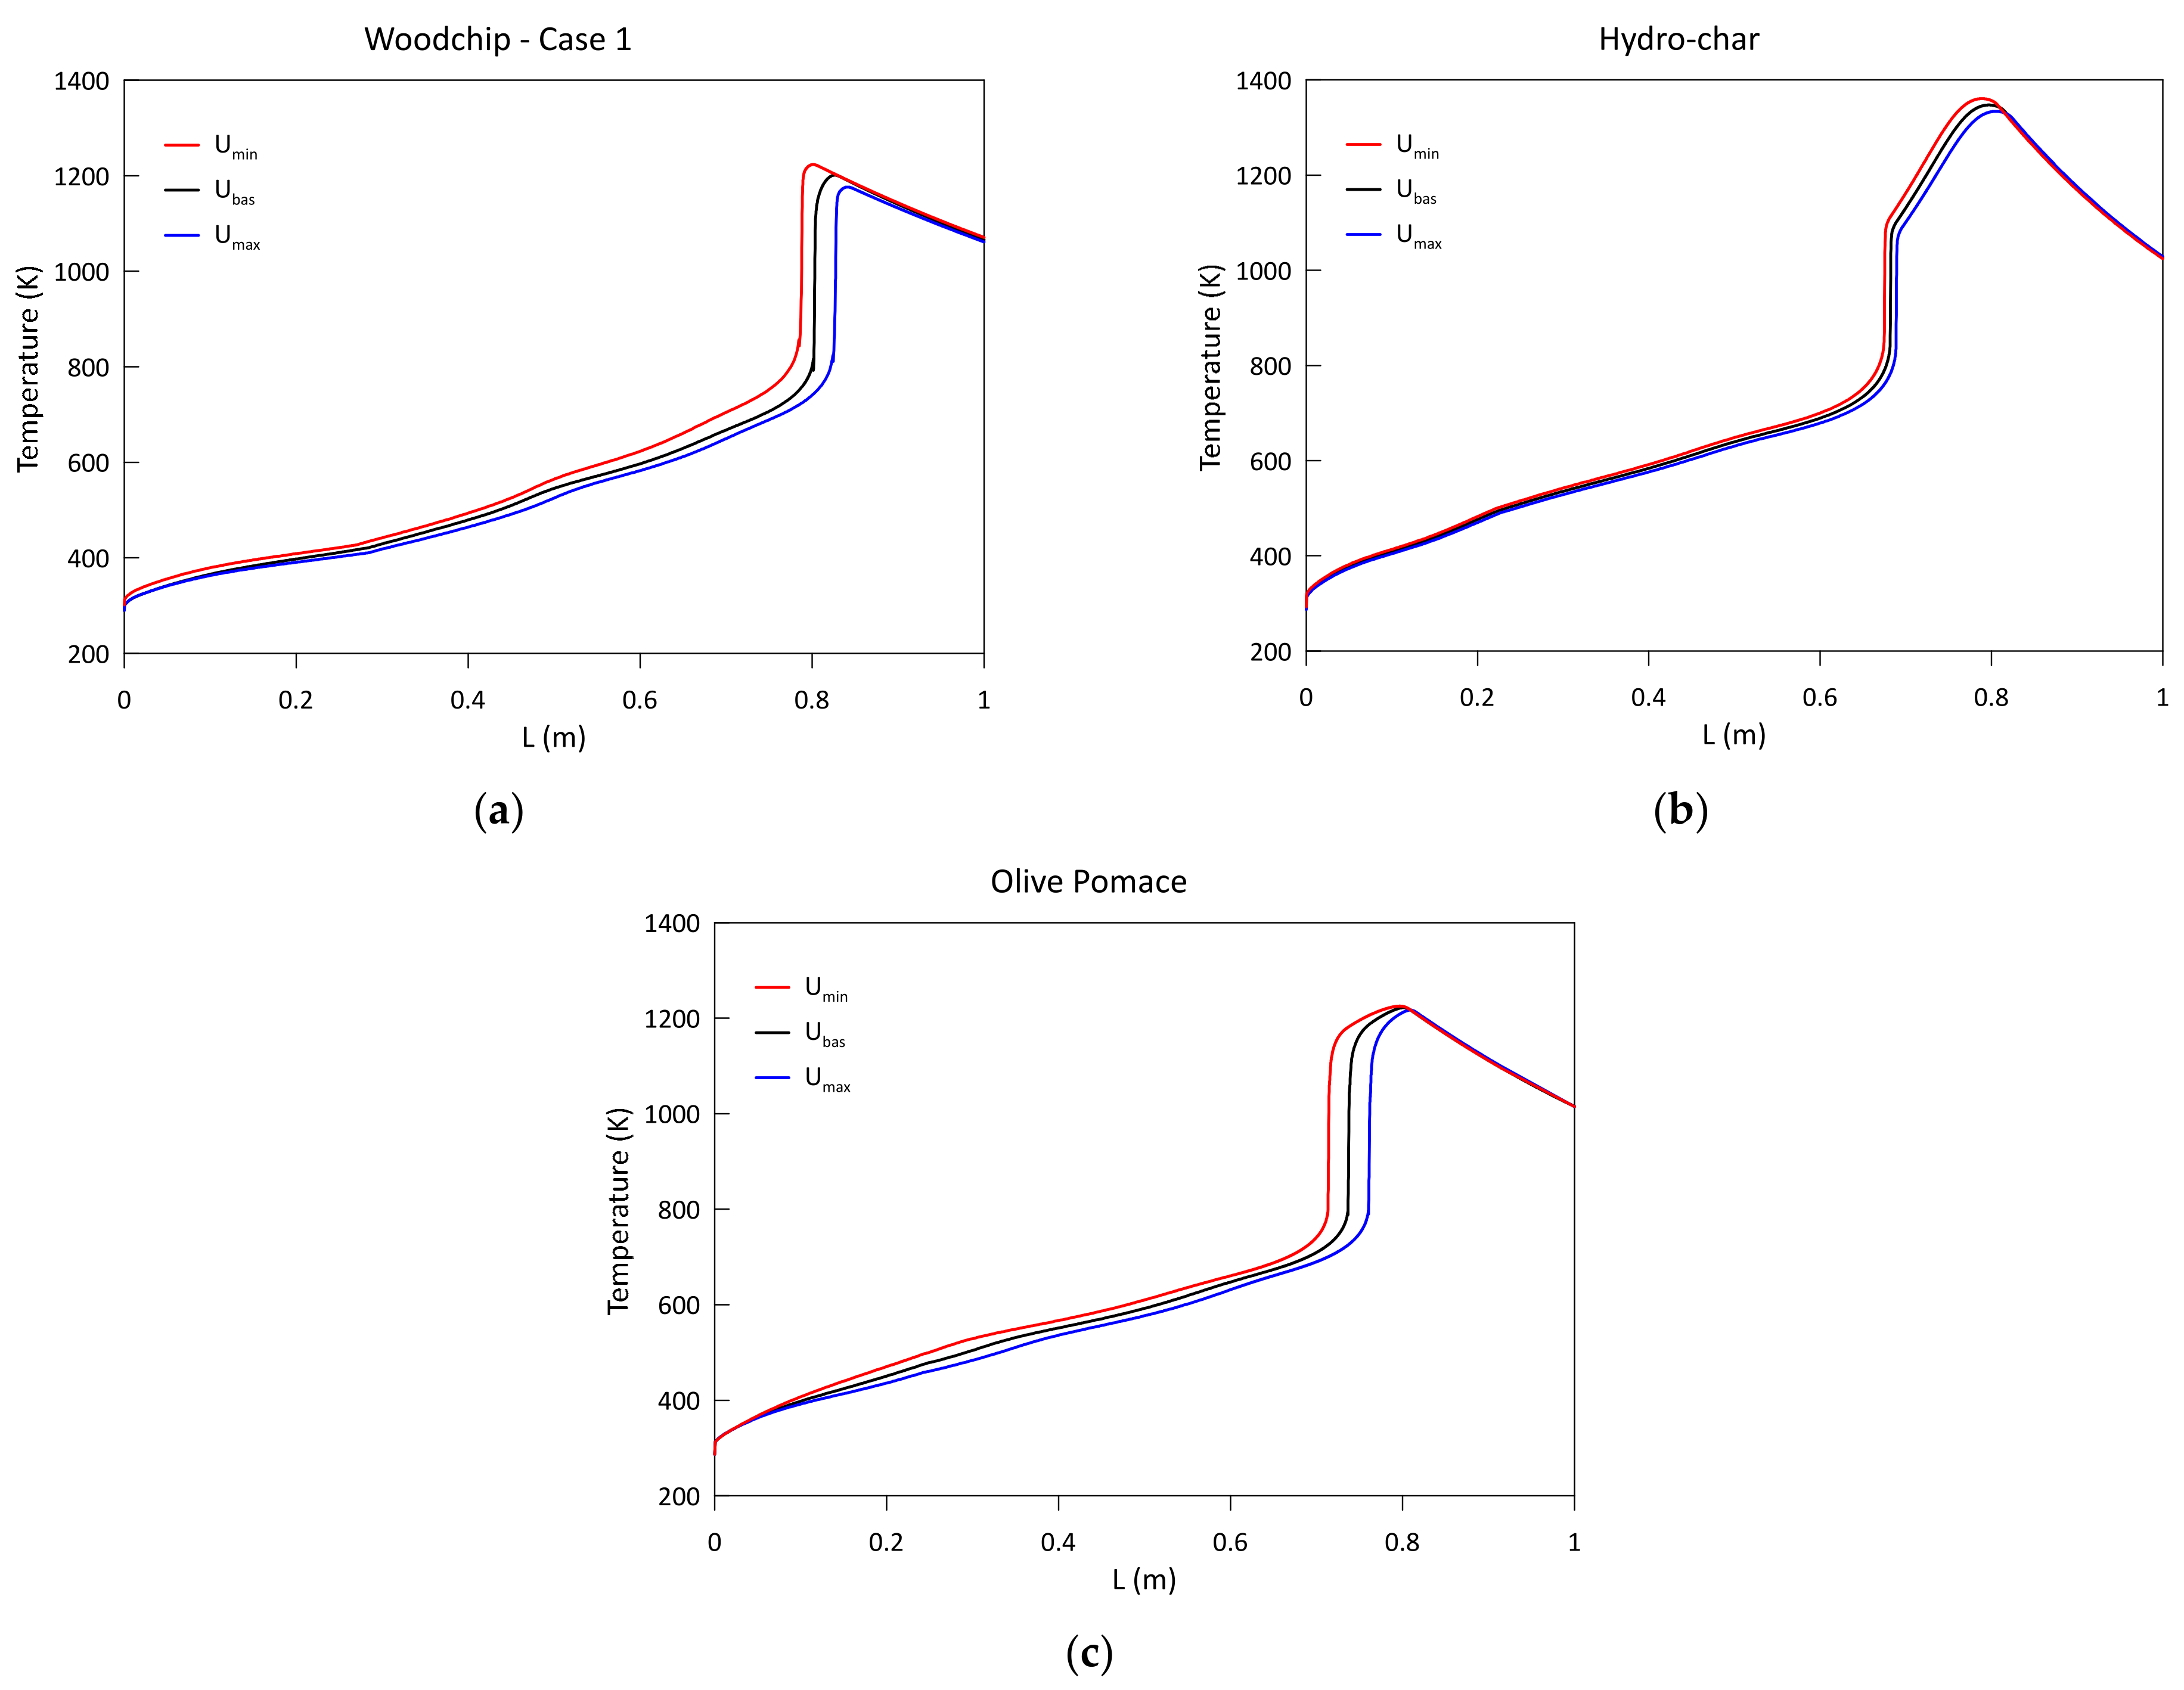
3.2. Parametric Analysis of the Influence of the Gasification ER
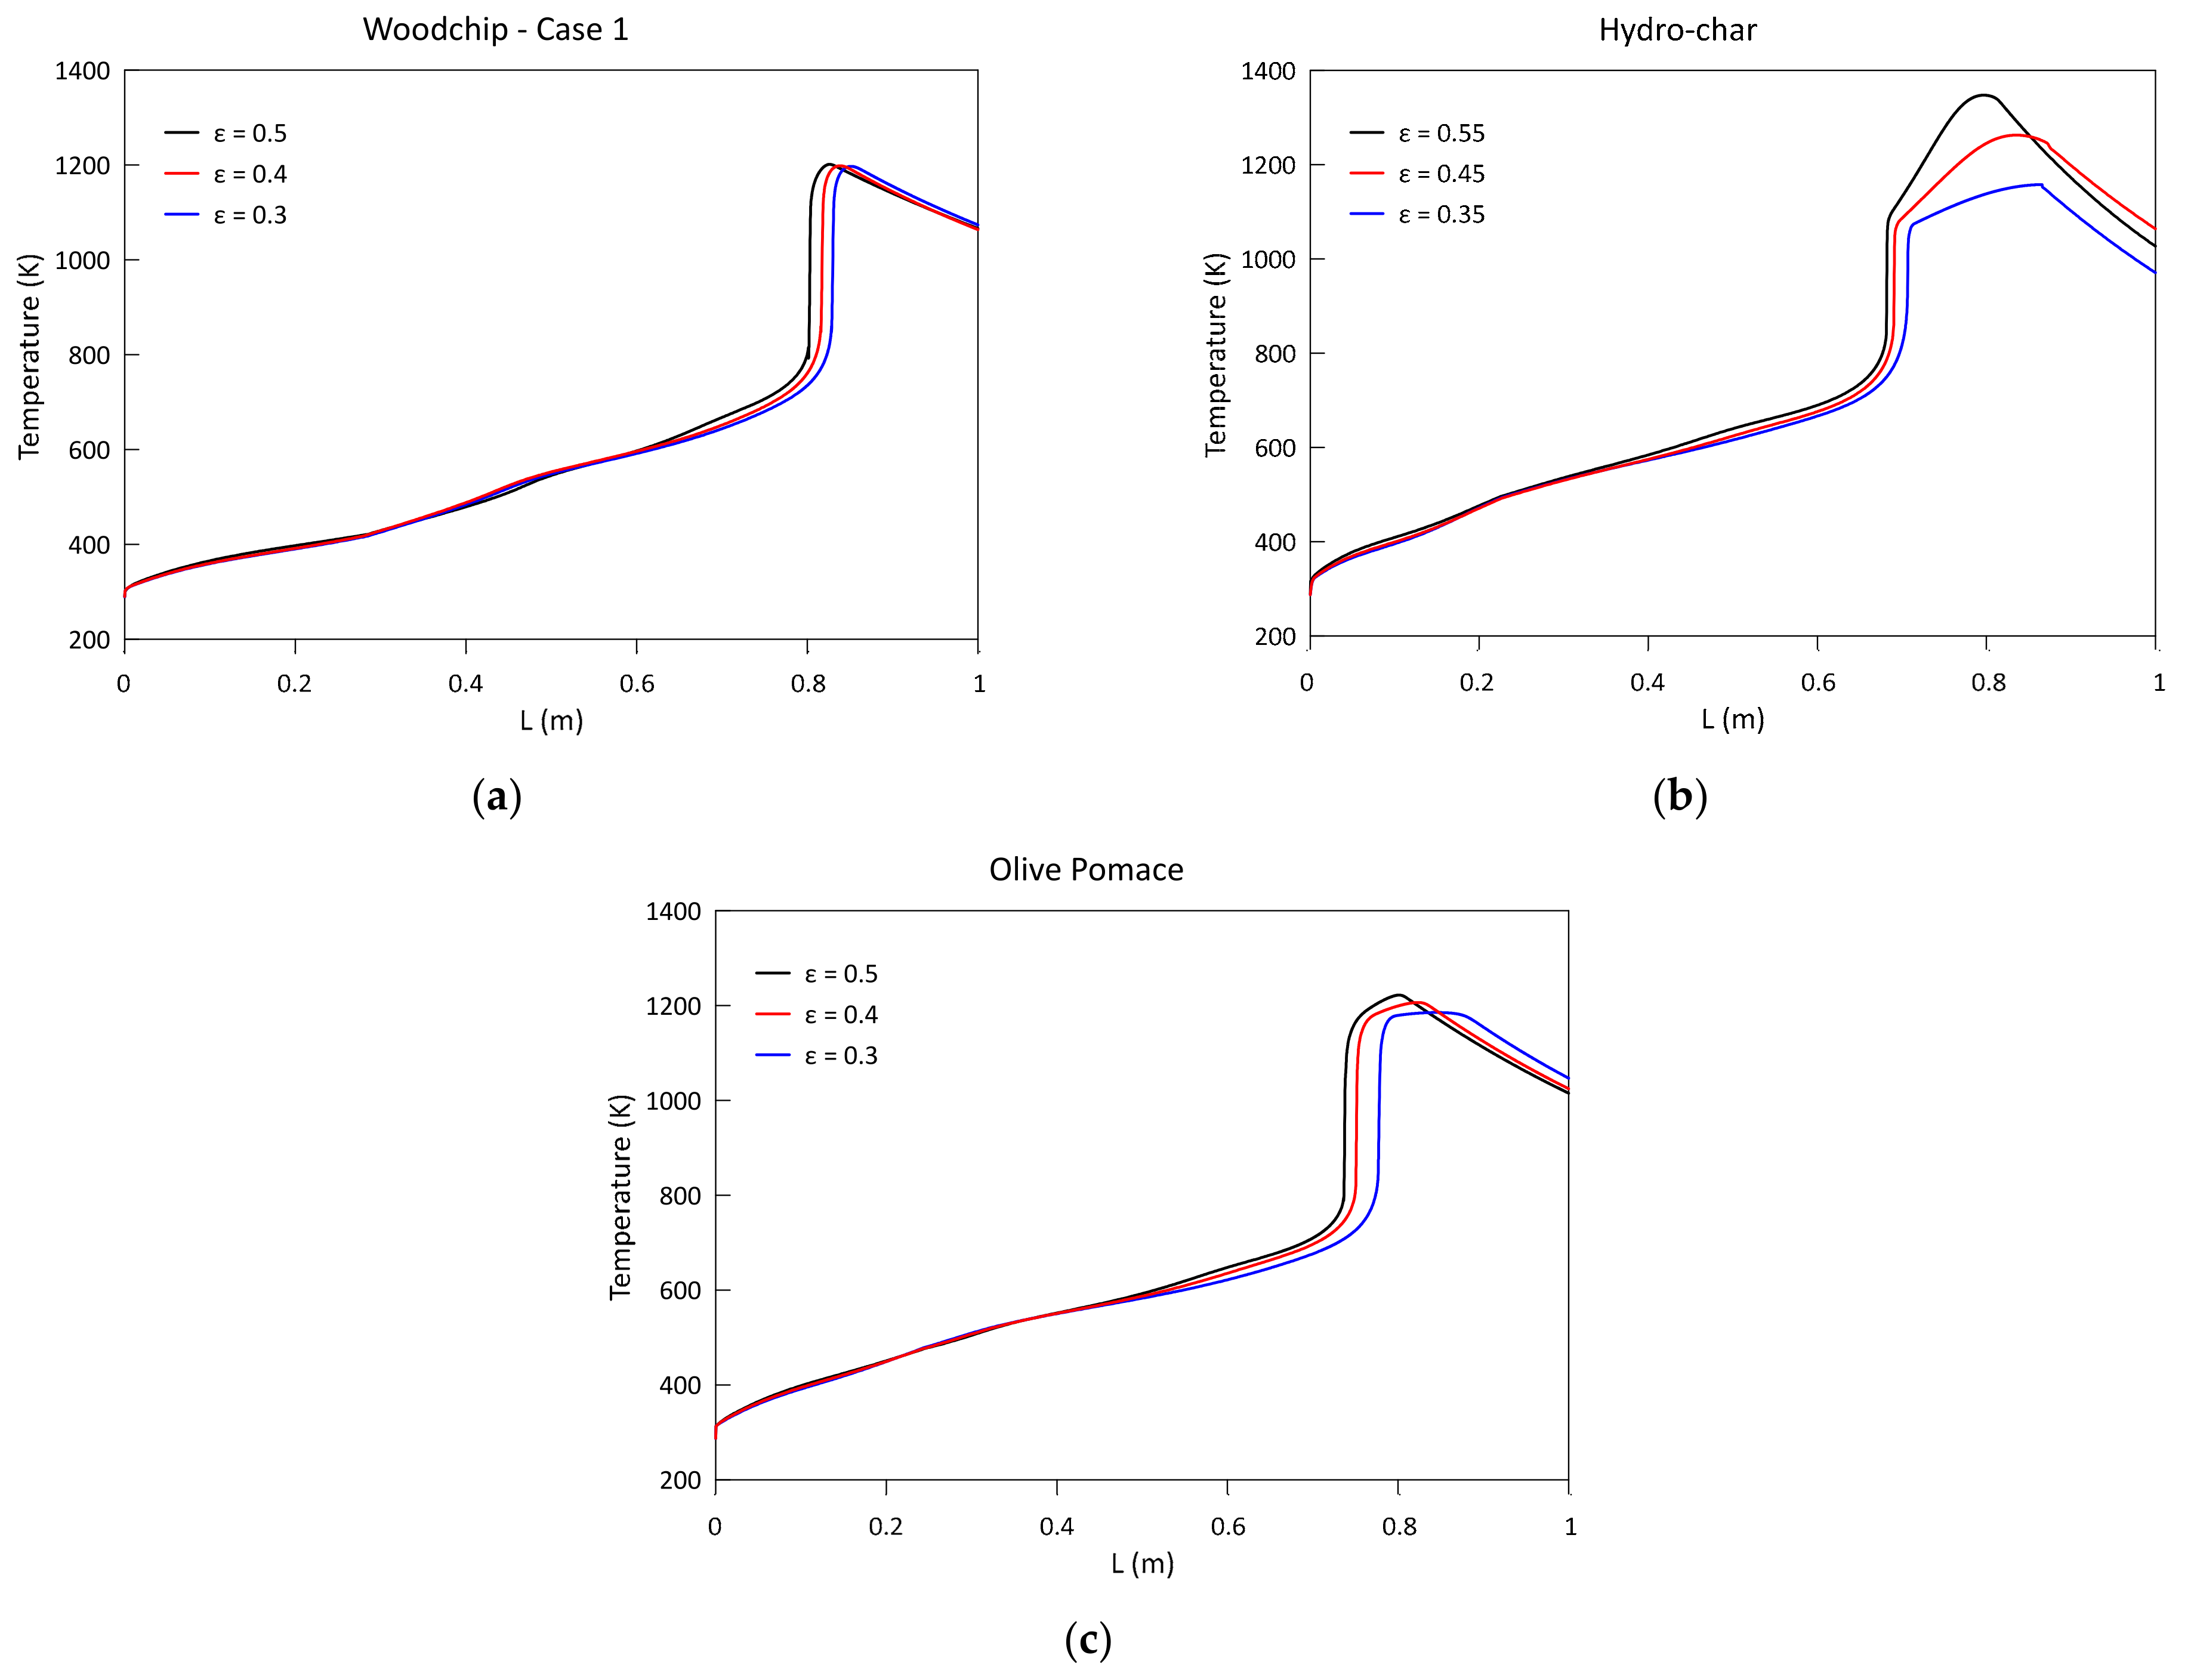
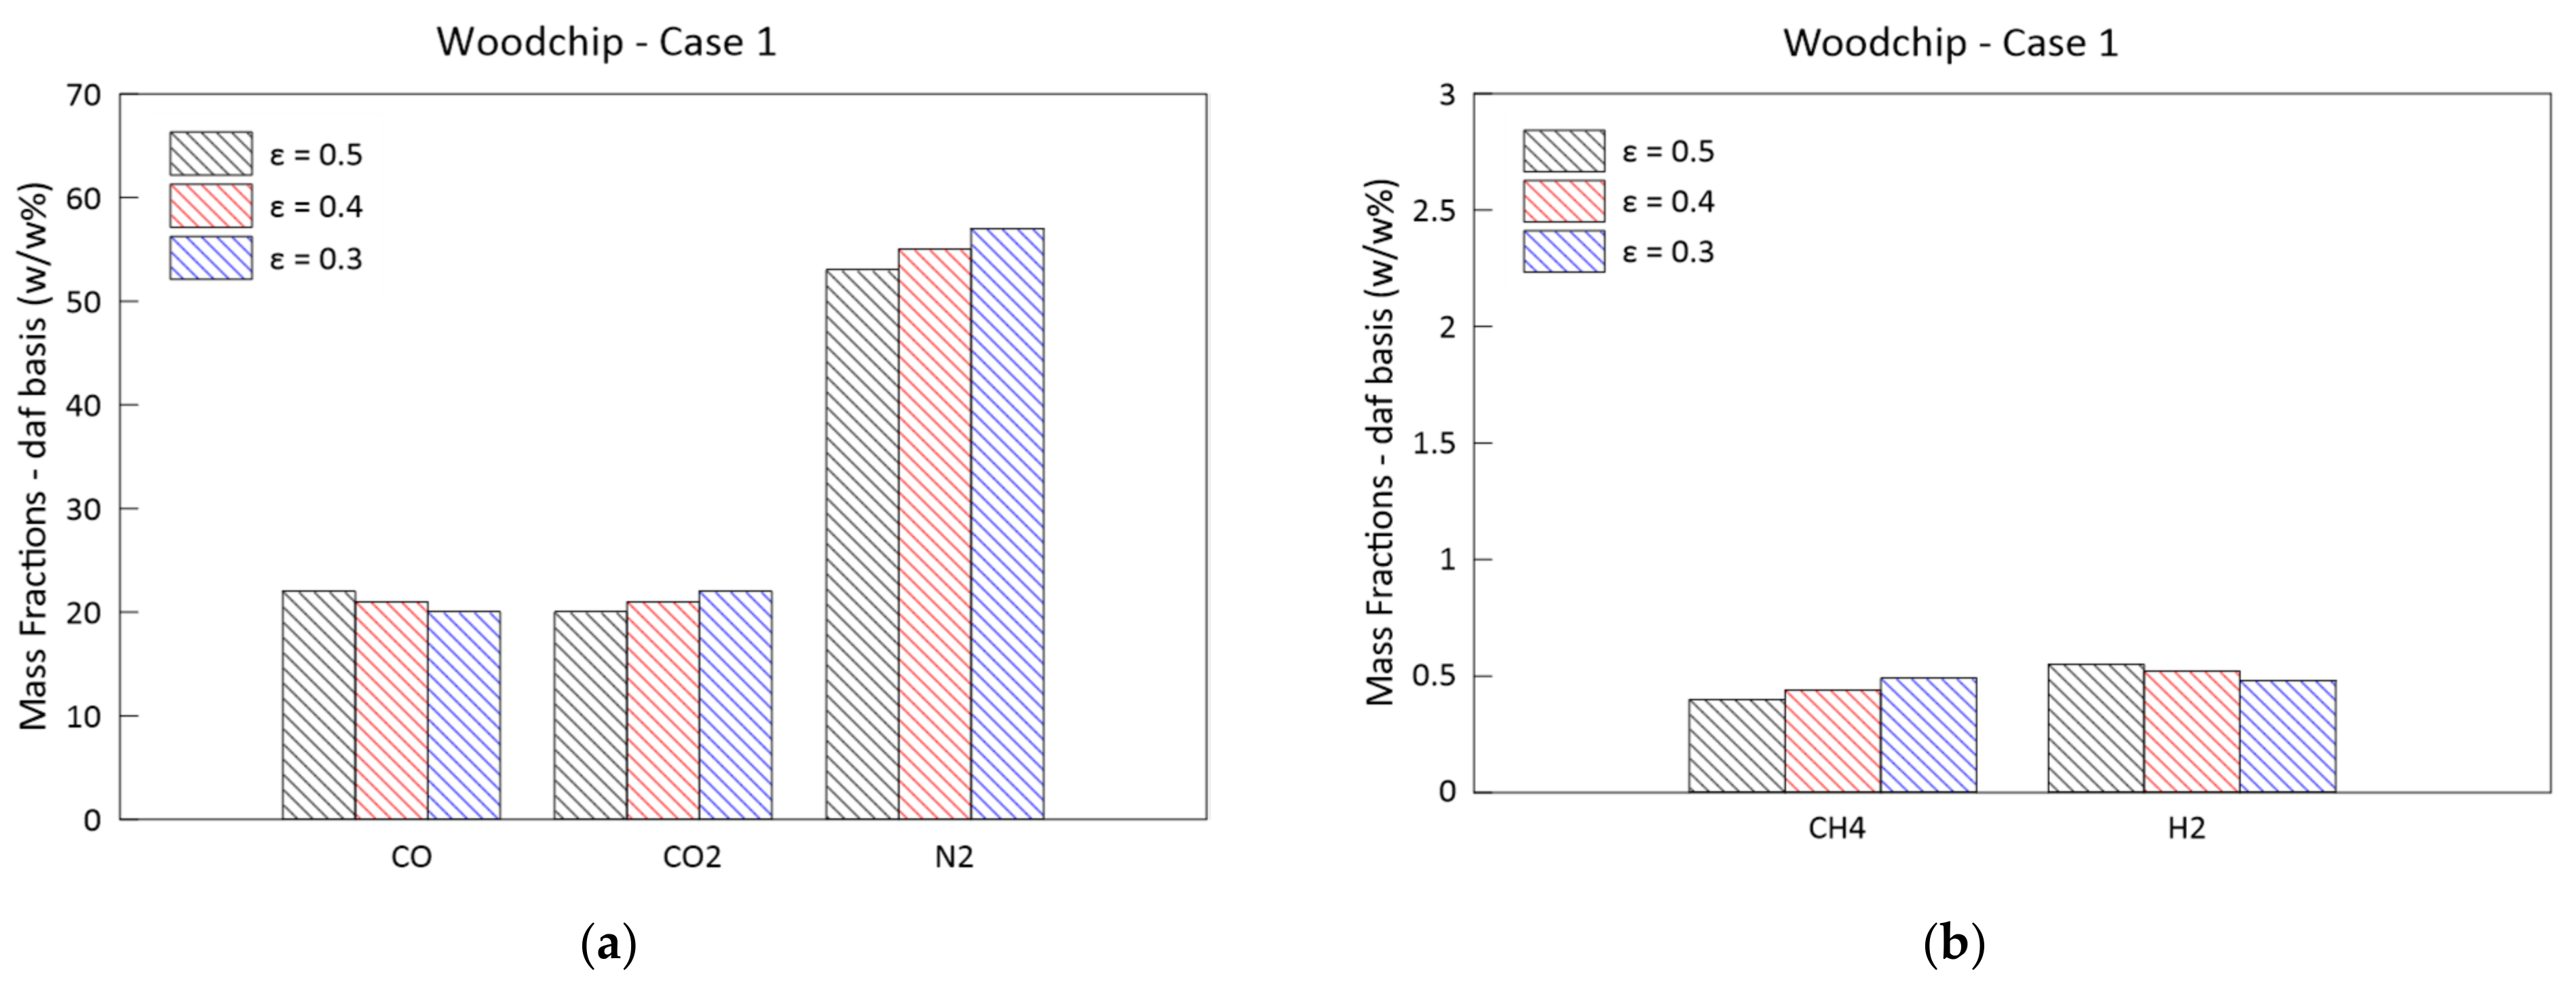
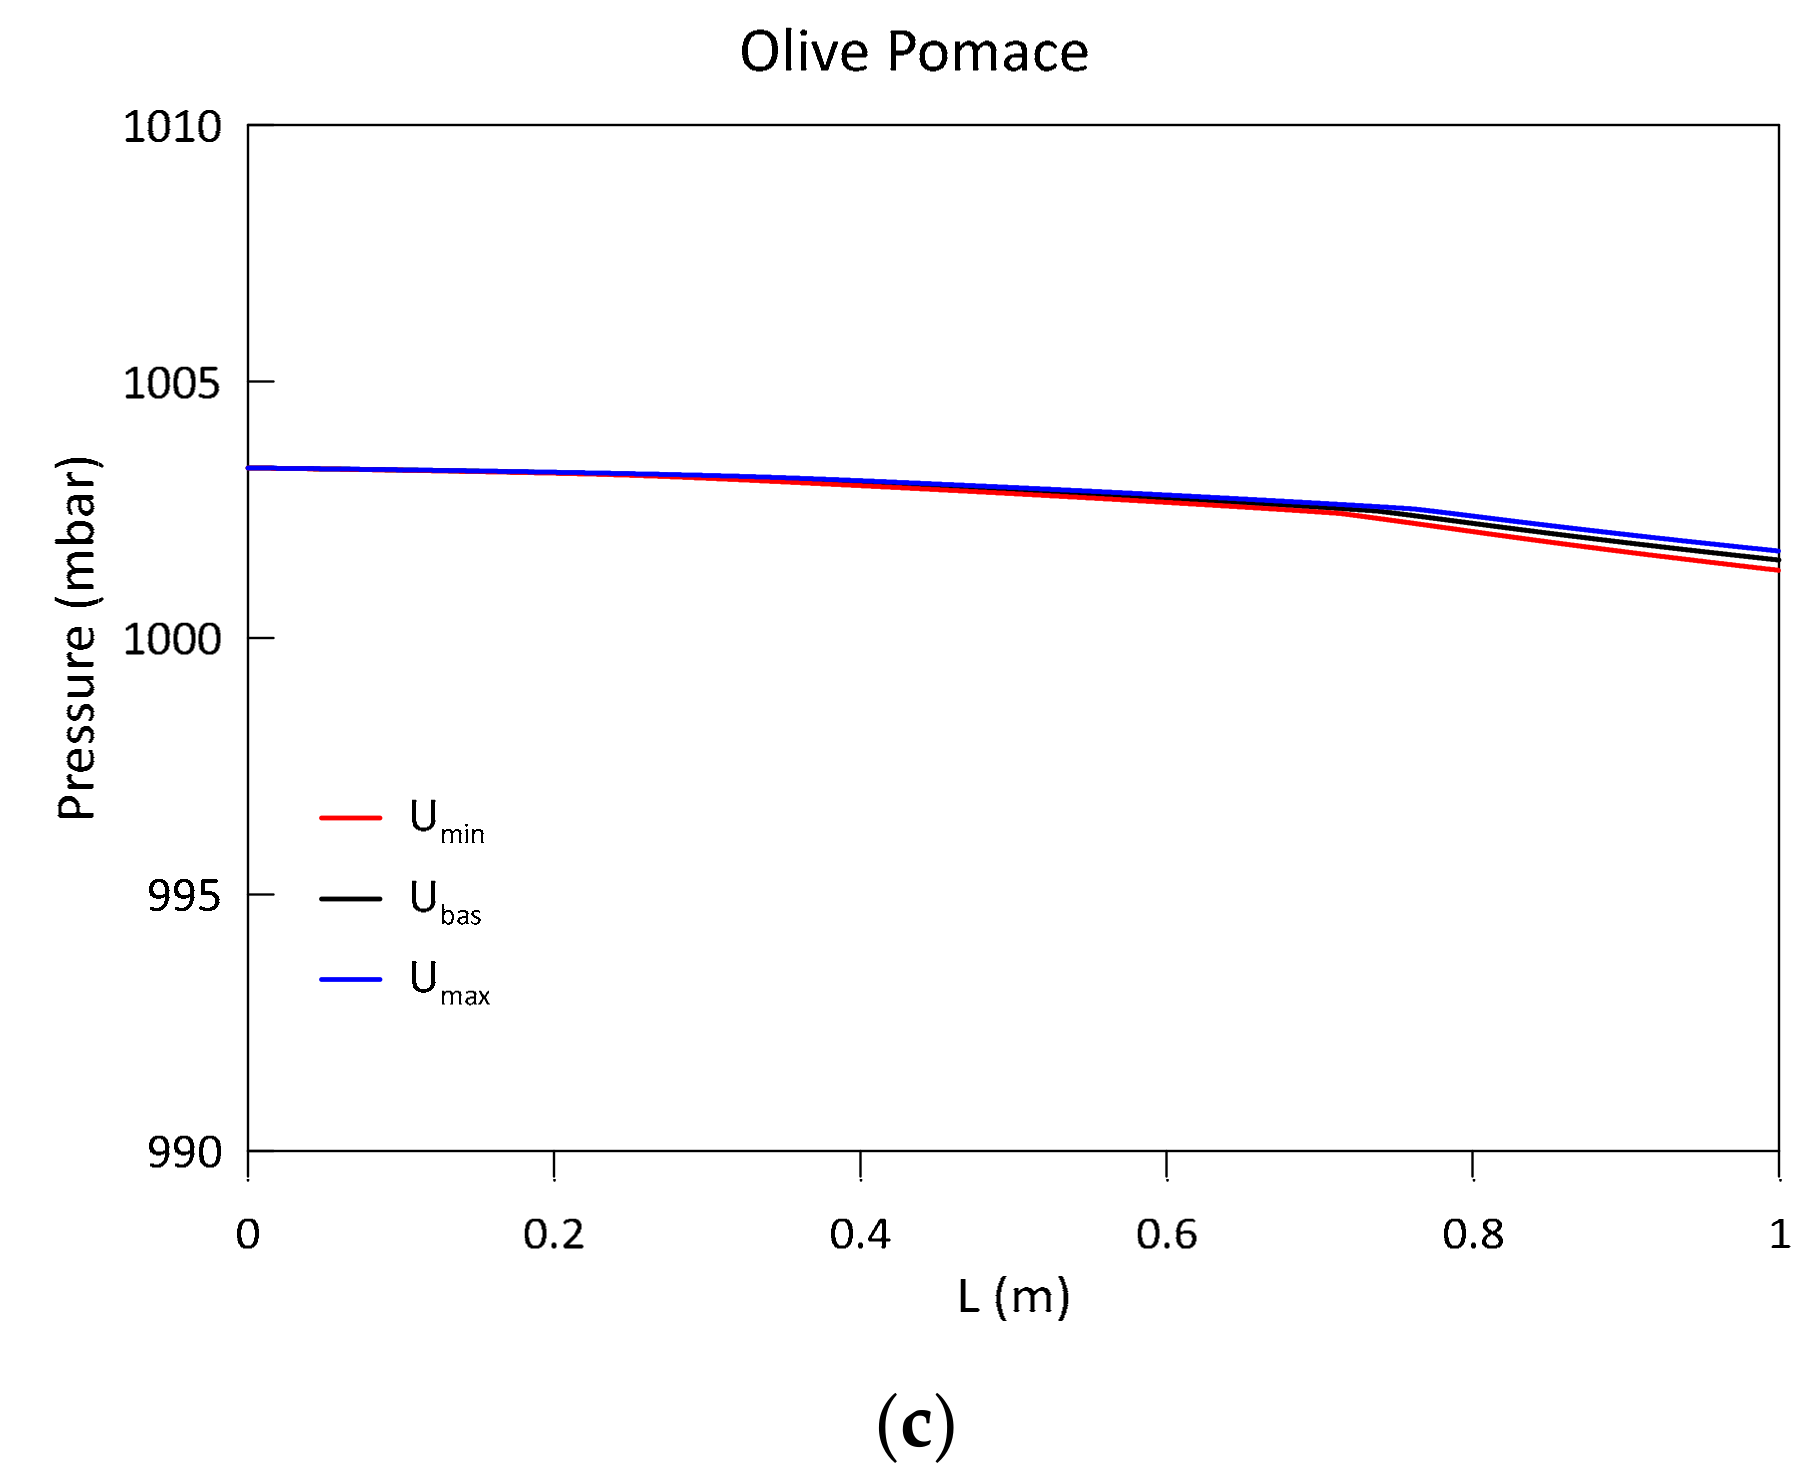
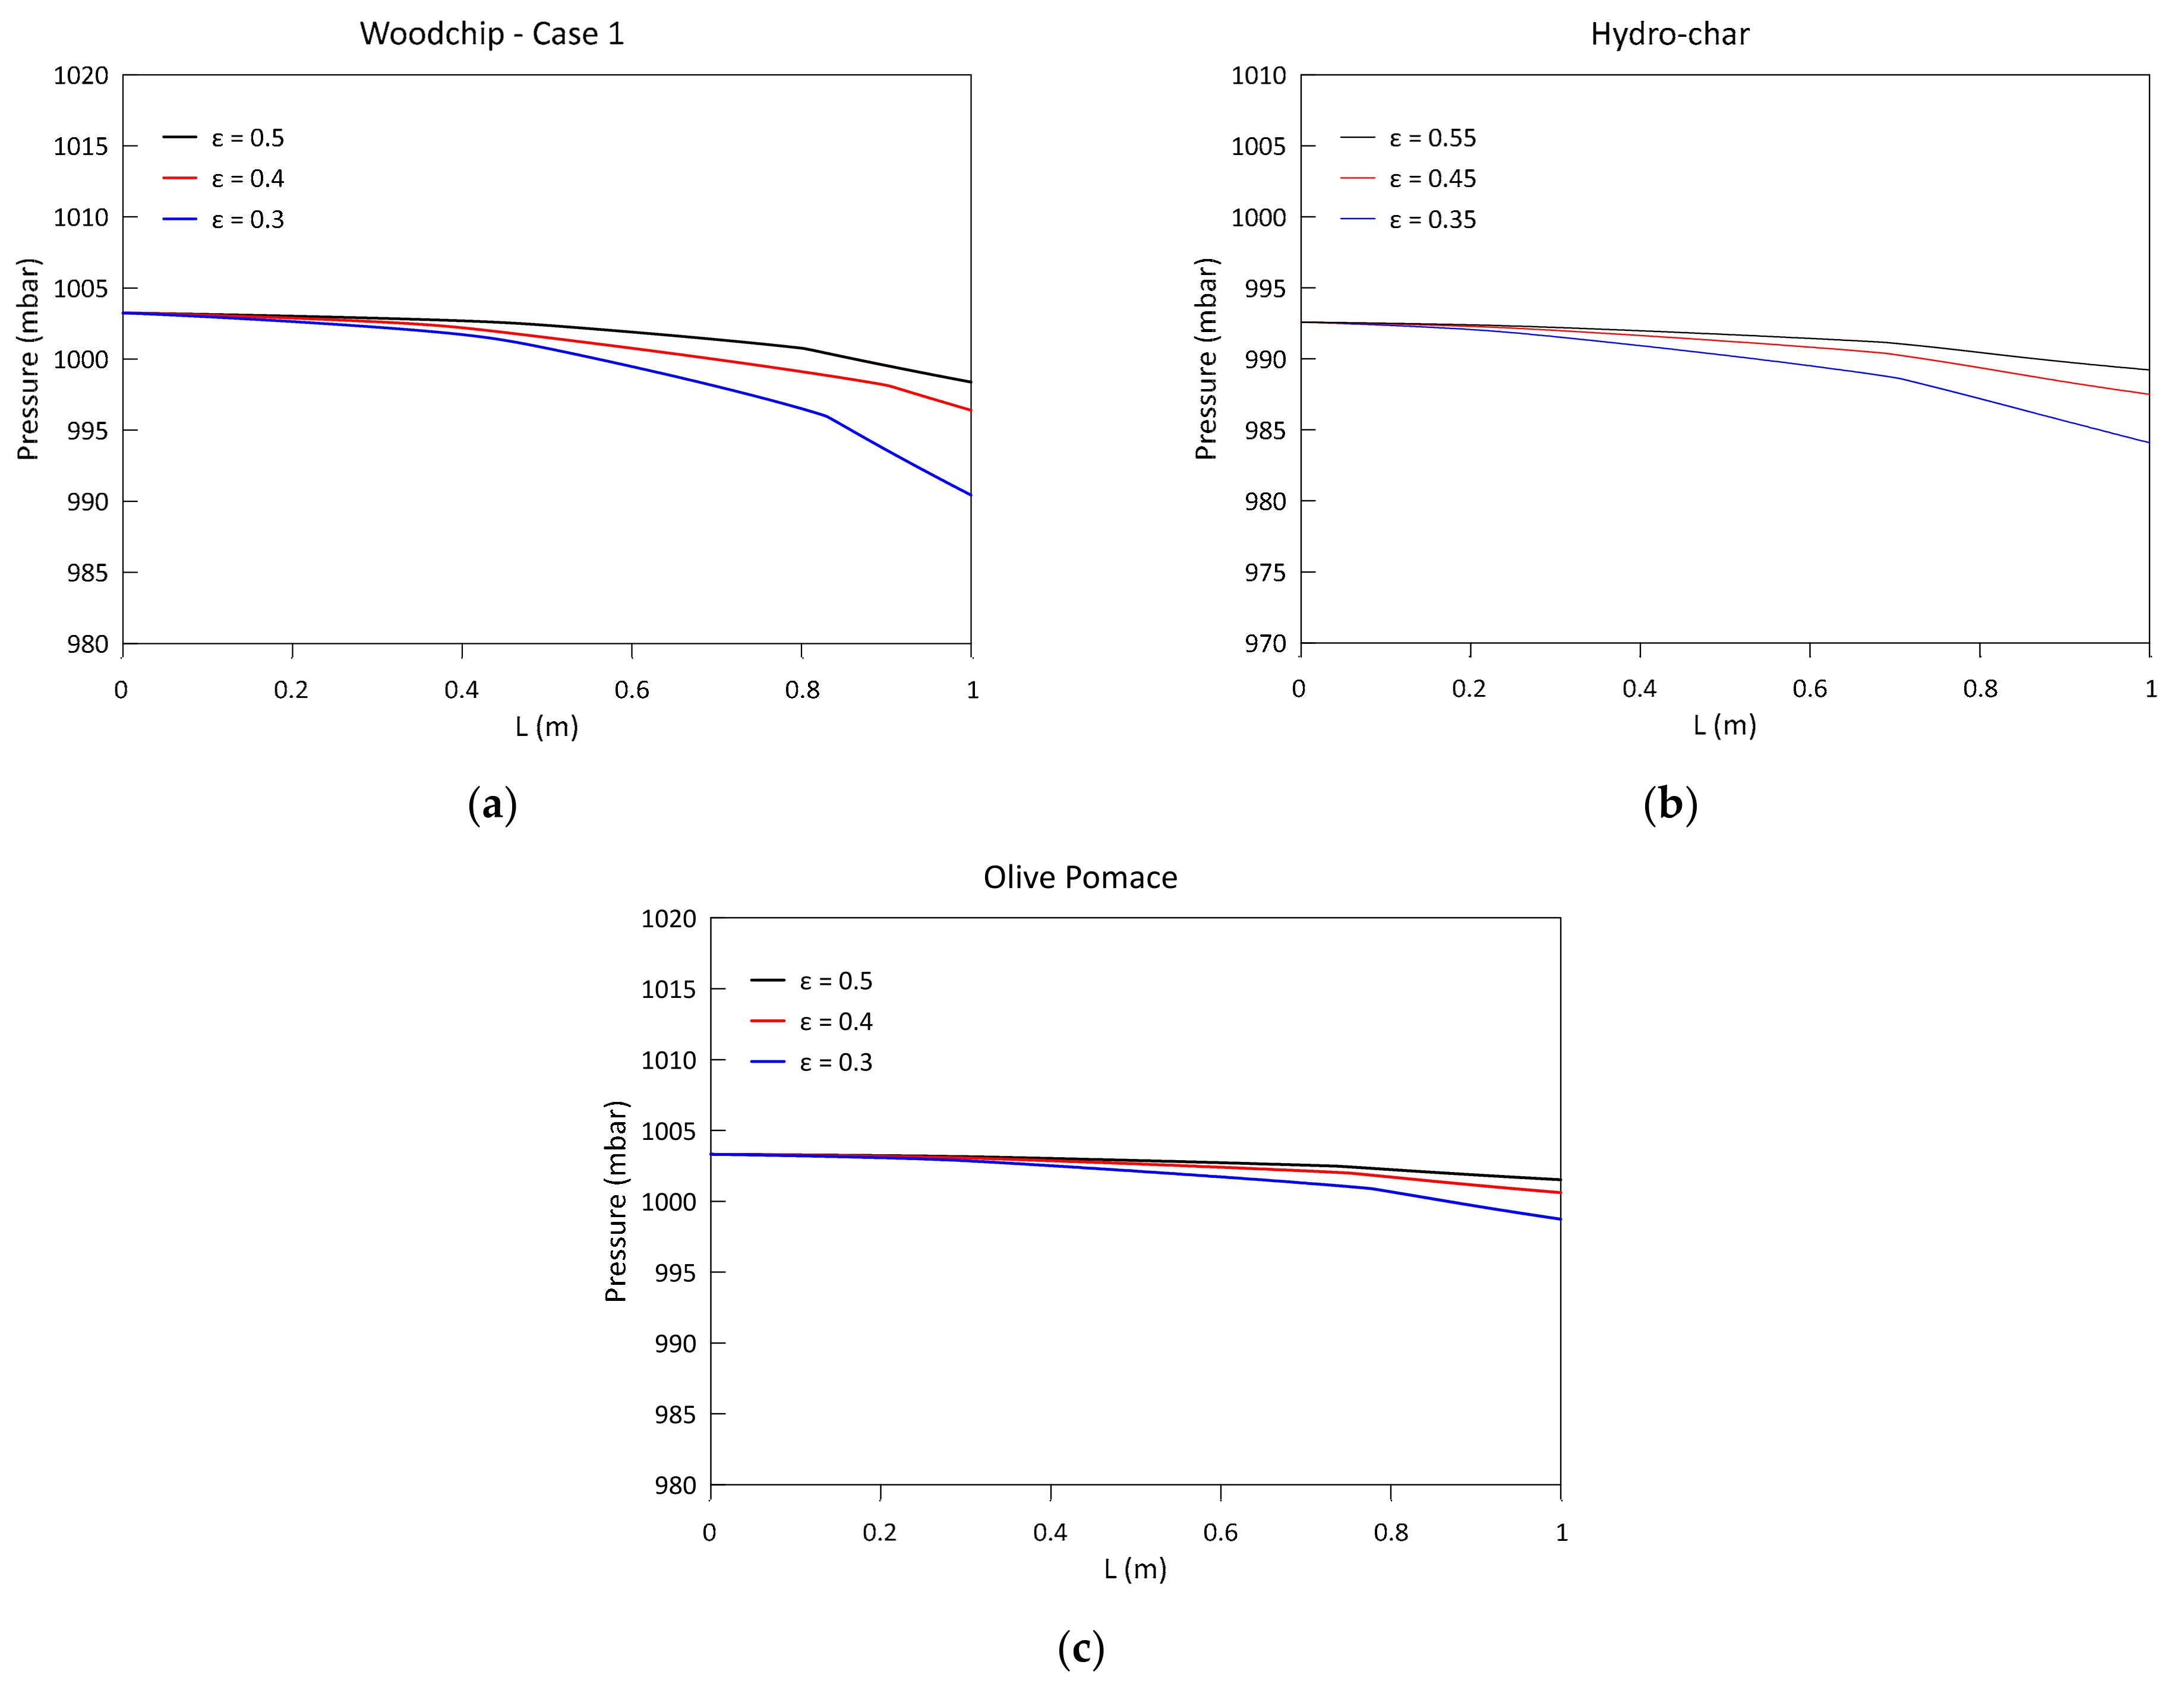
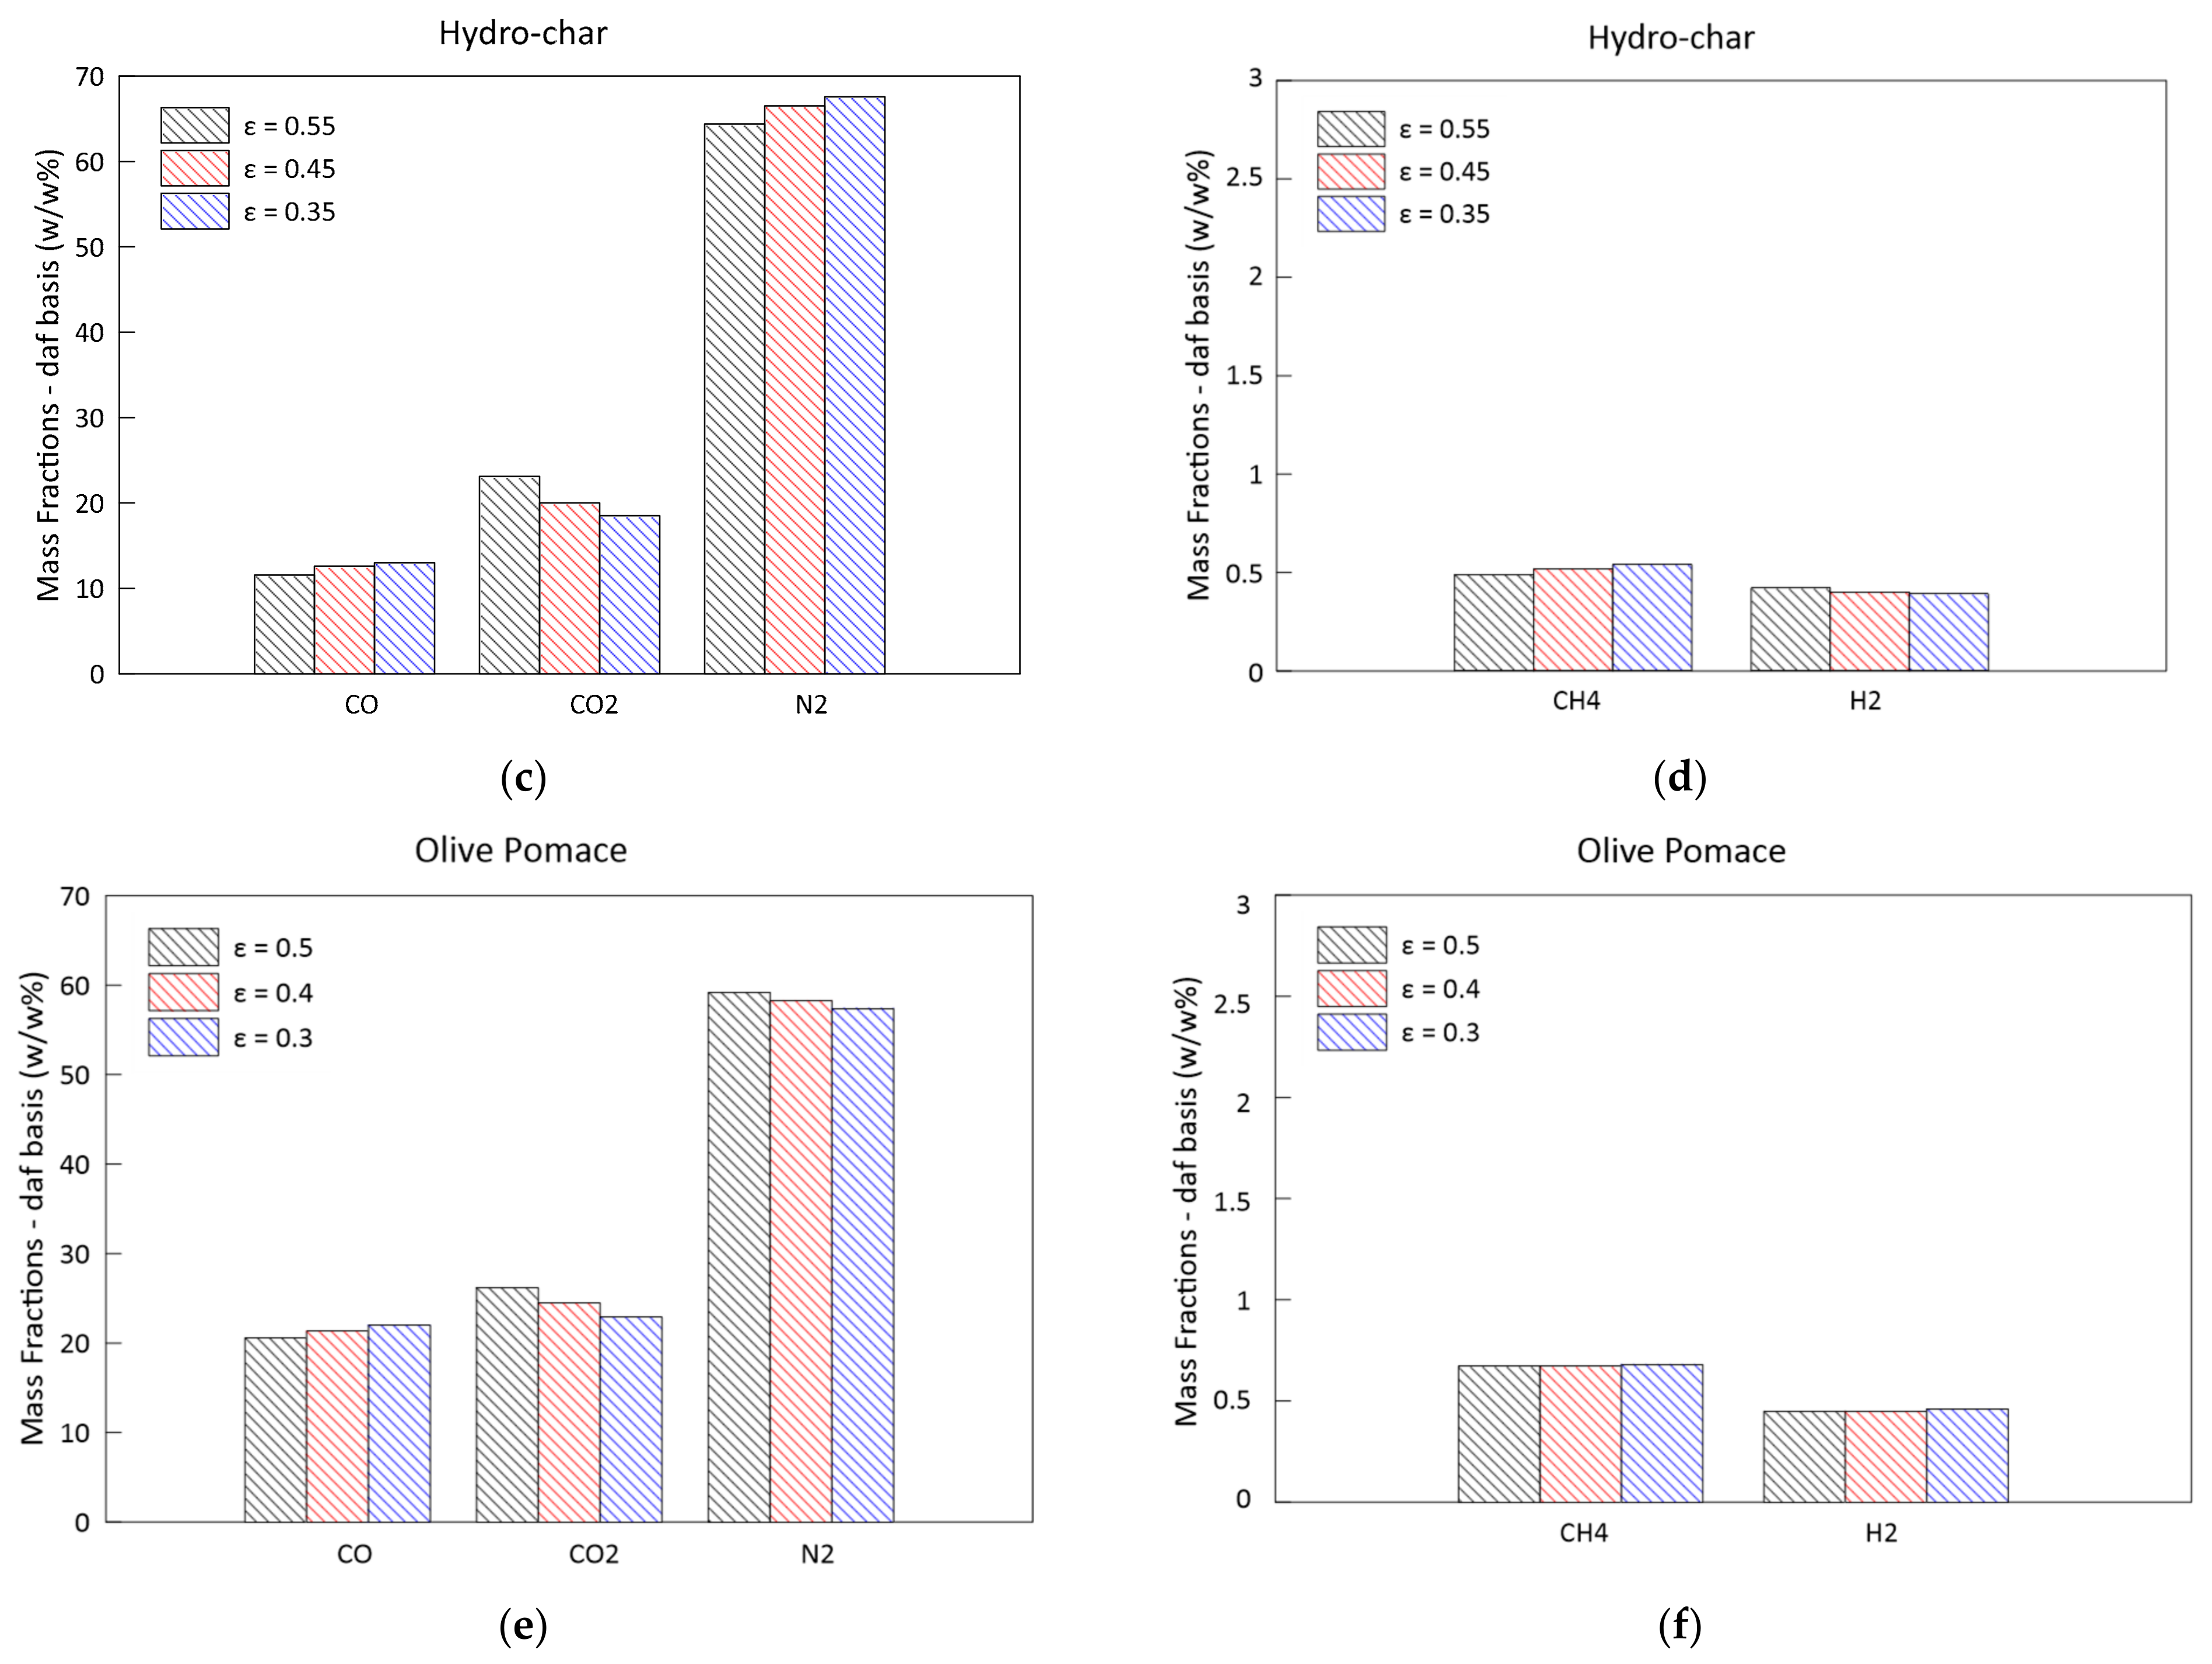
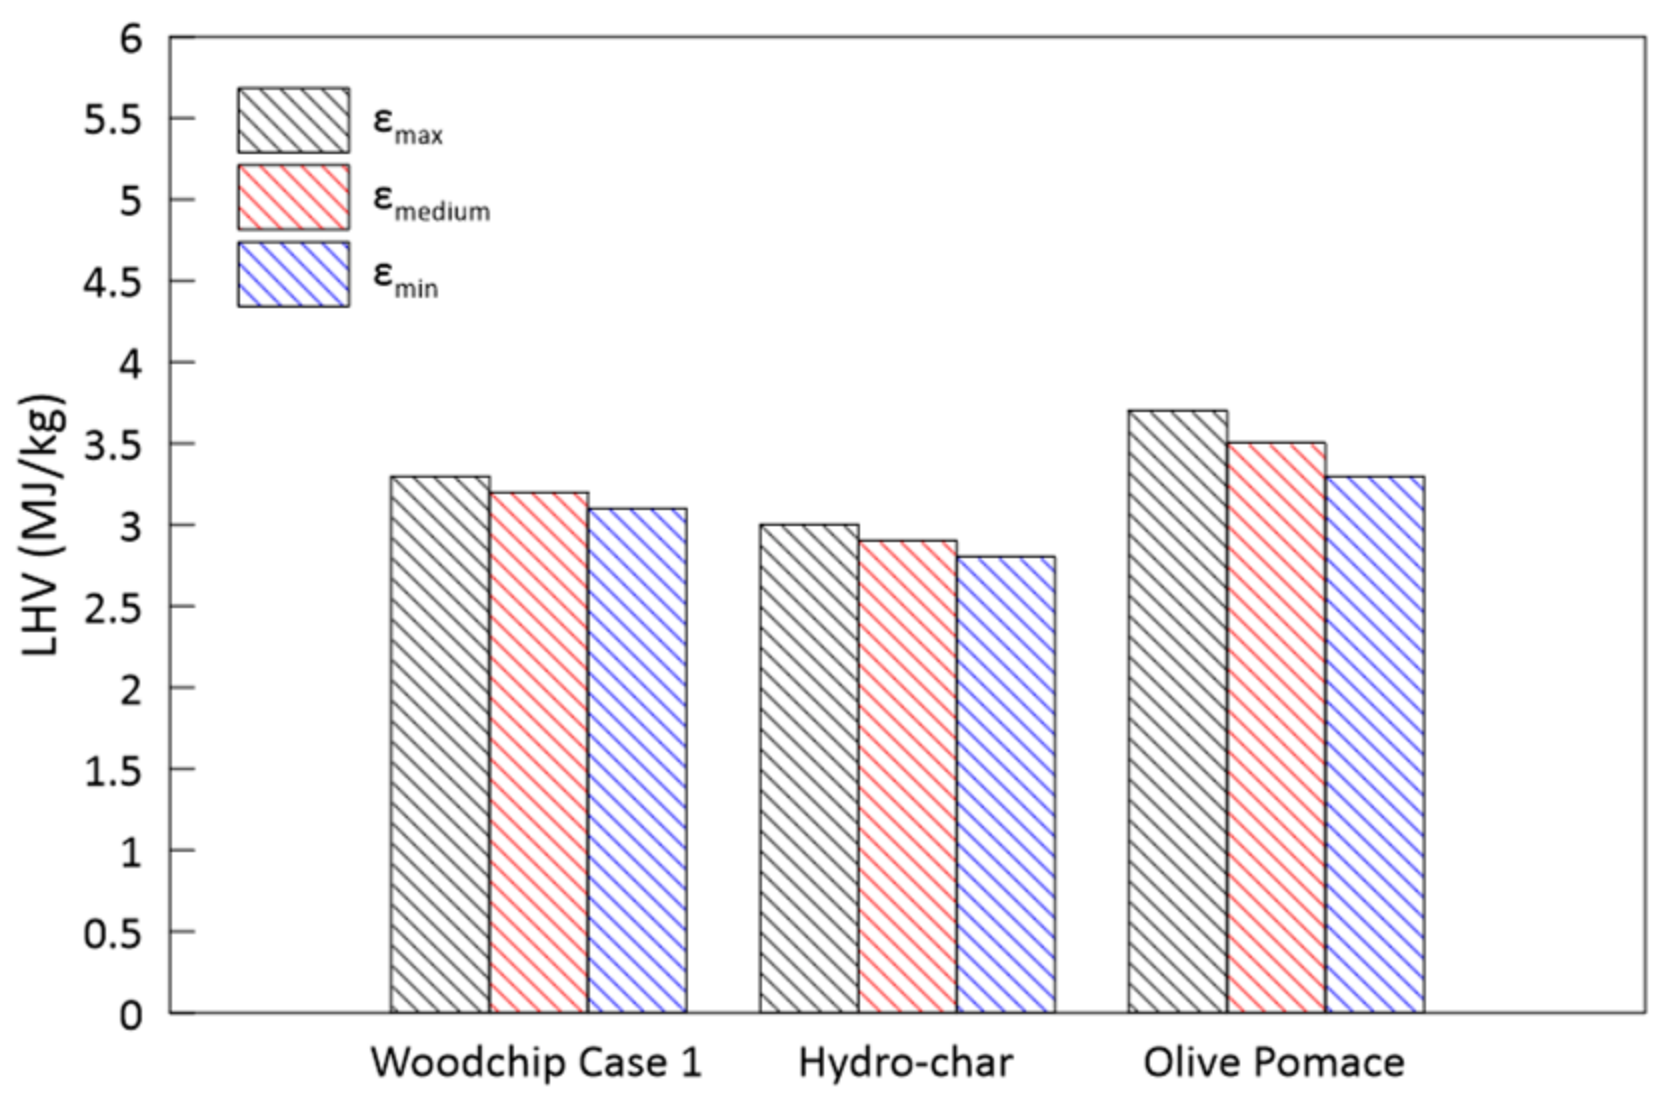
3.3. Parametric Analysis of the Influence of the Bed Porosity
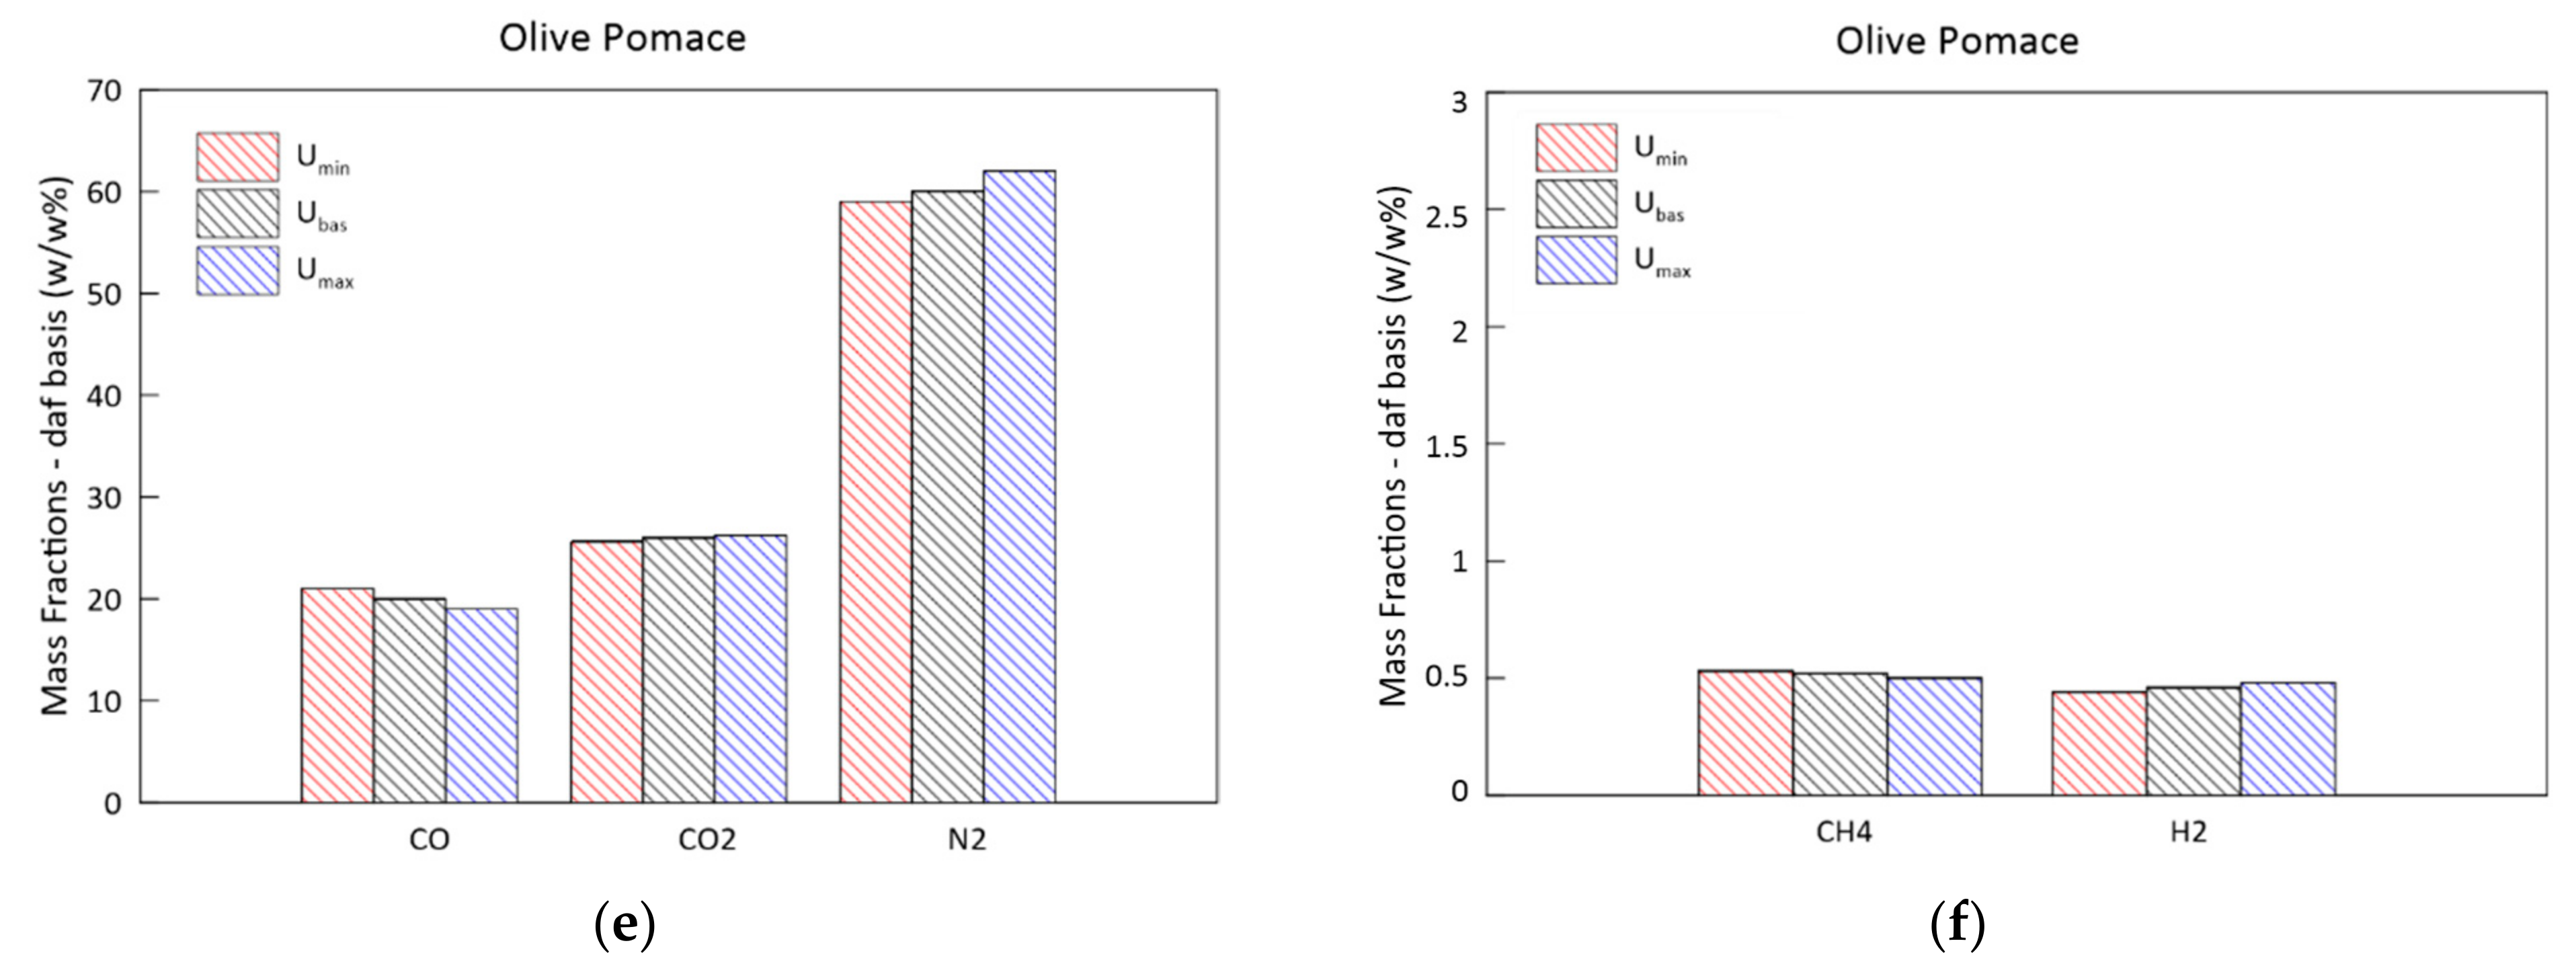
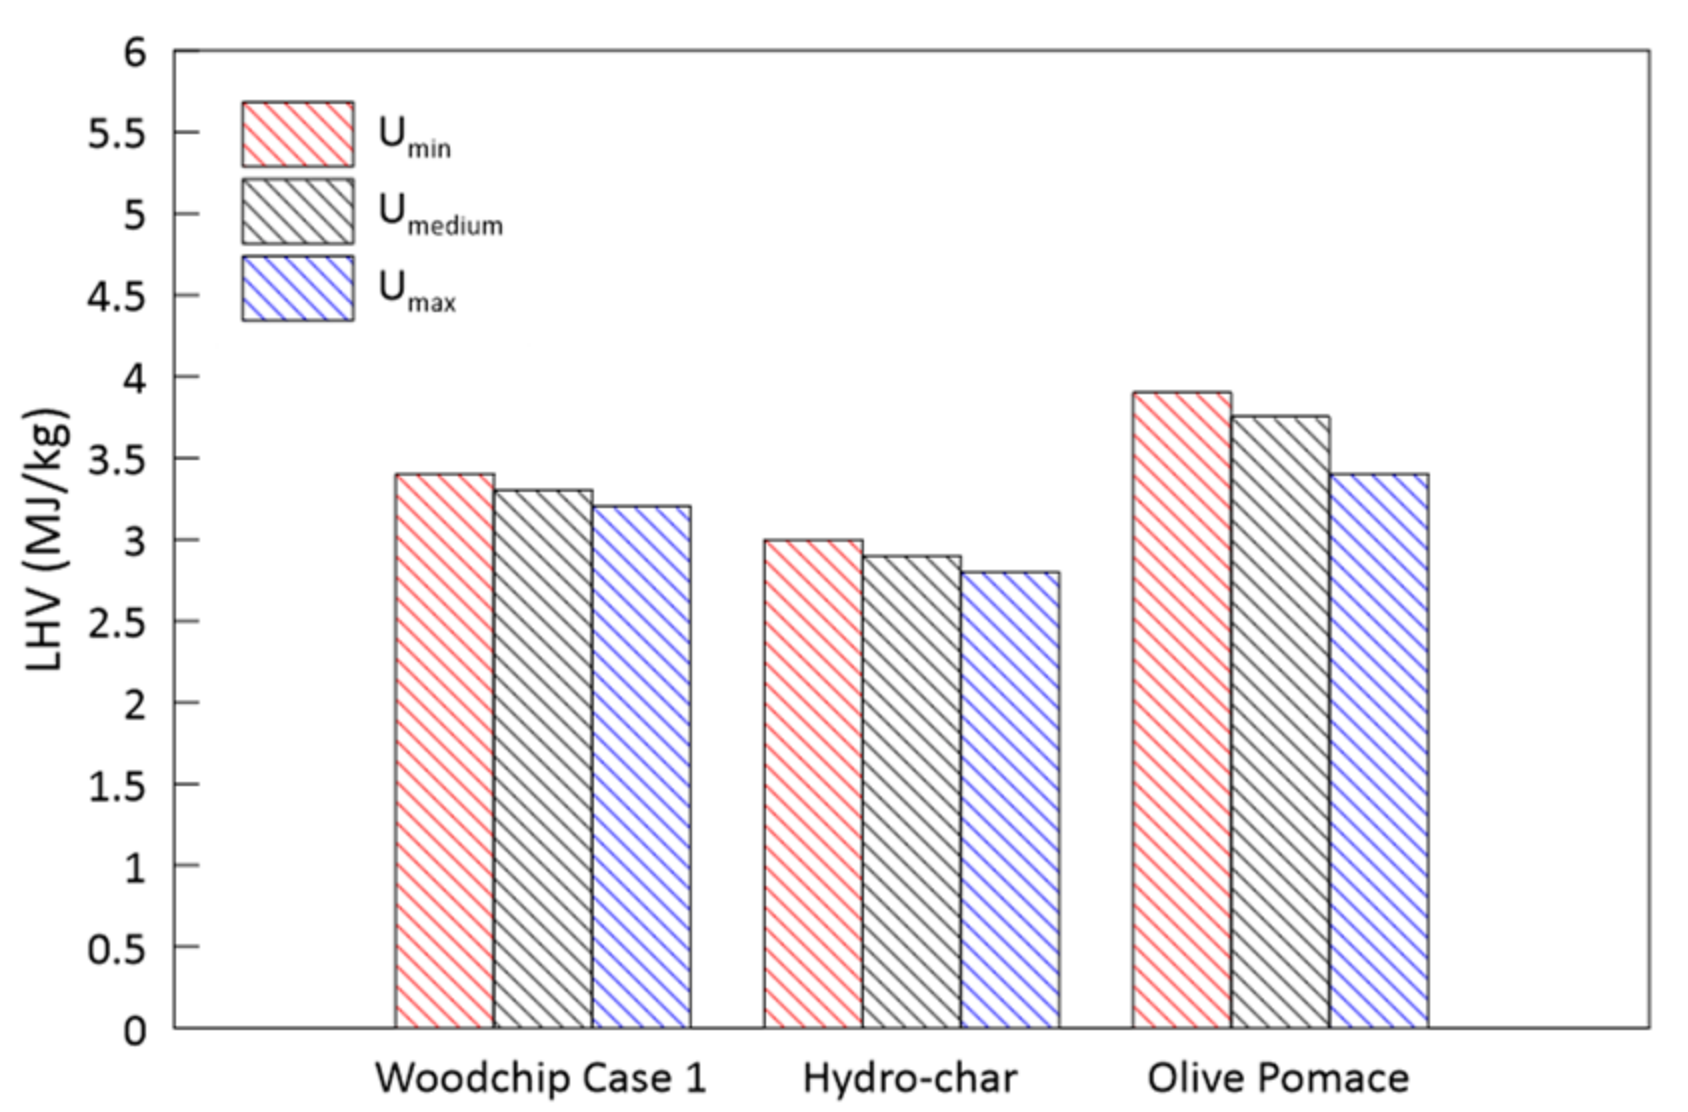
3.4. Parametric Analysis of the Biomass Moisture Content
4. Conclusions
- Higher ERs lead to syngas characterized by a lower heating values and to higher temperatures achieved in the reduction zone;
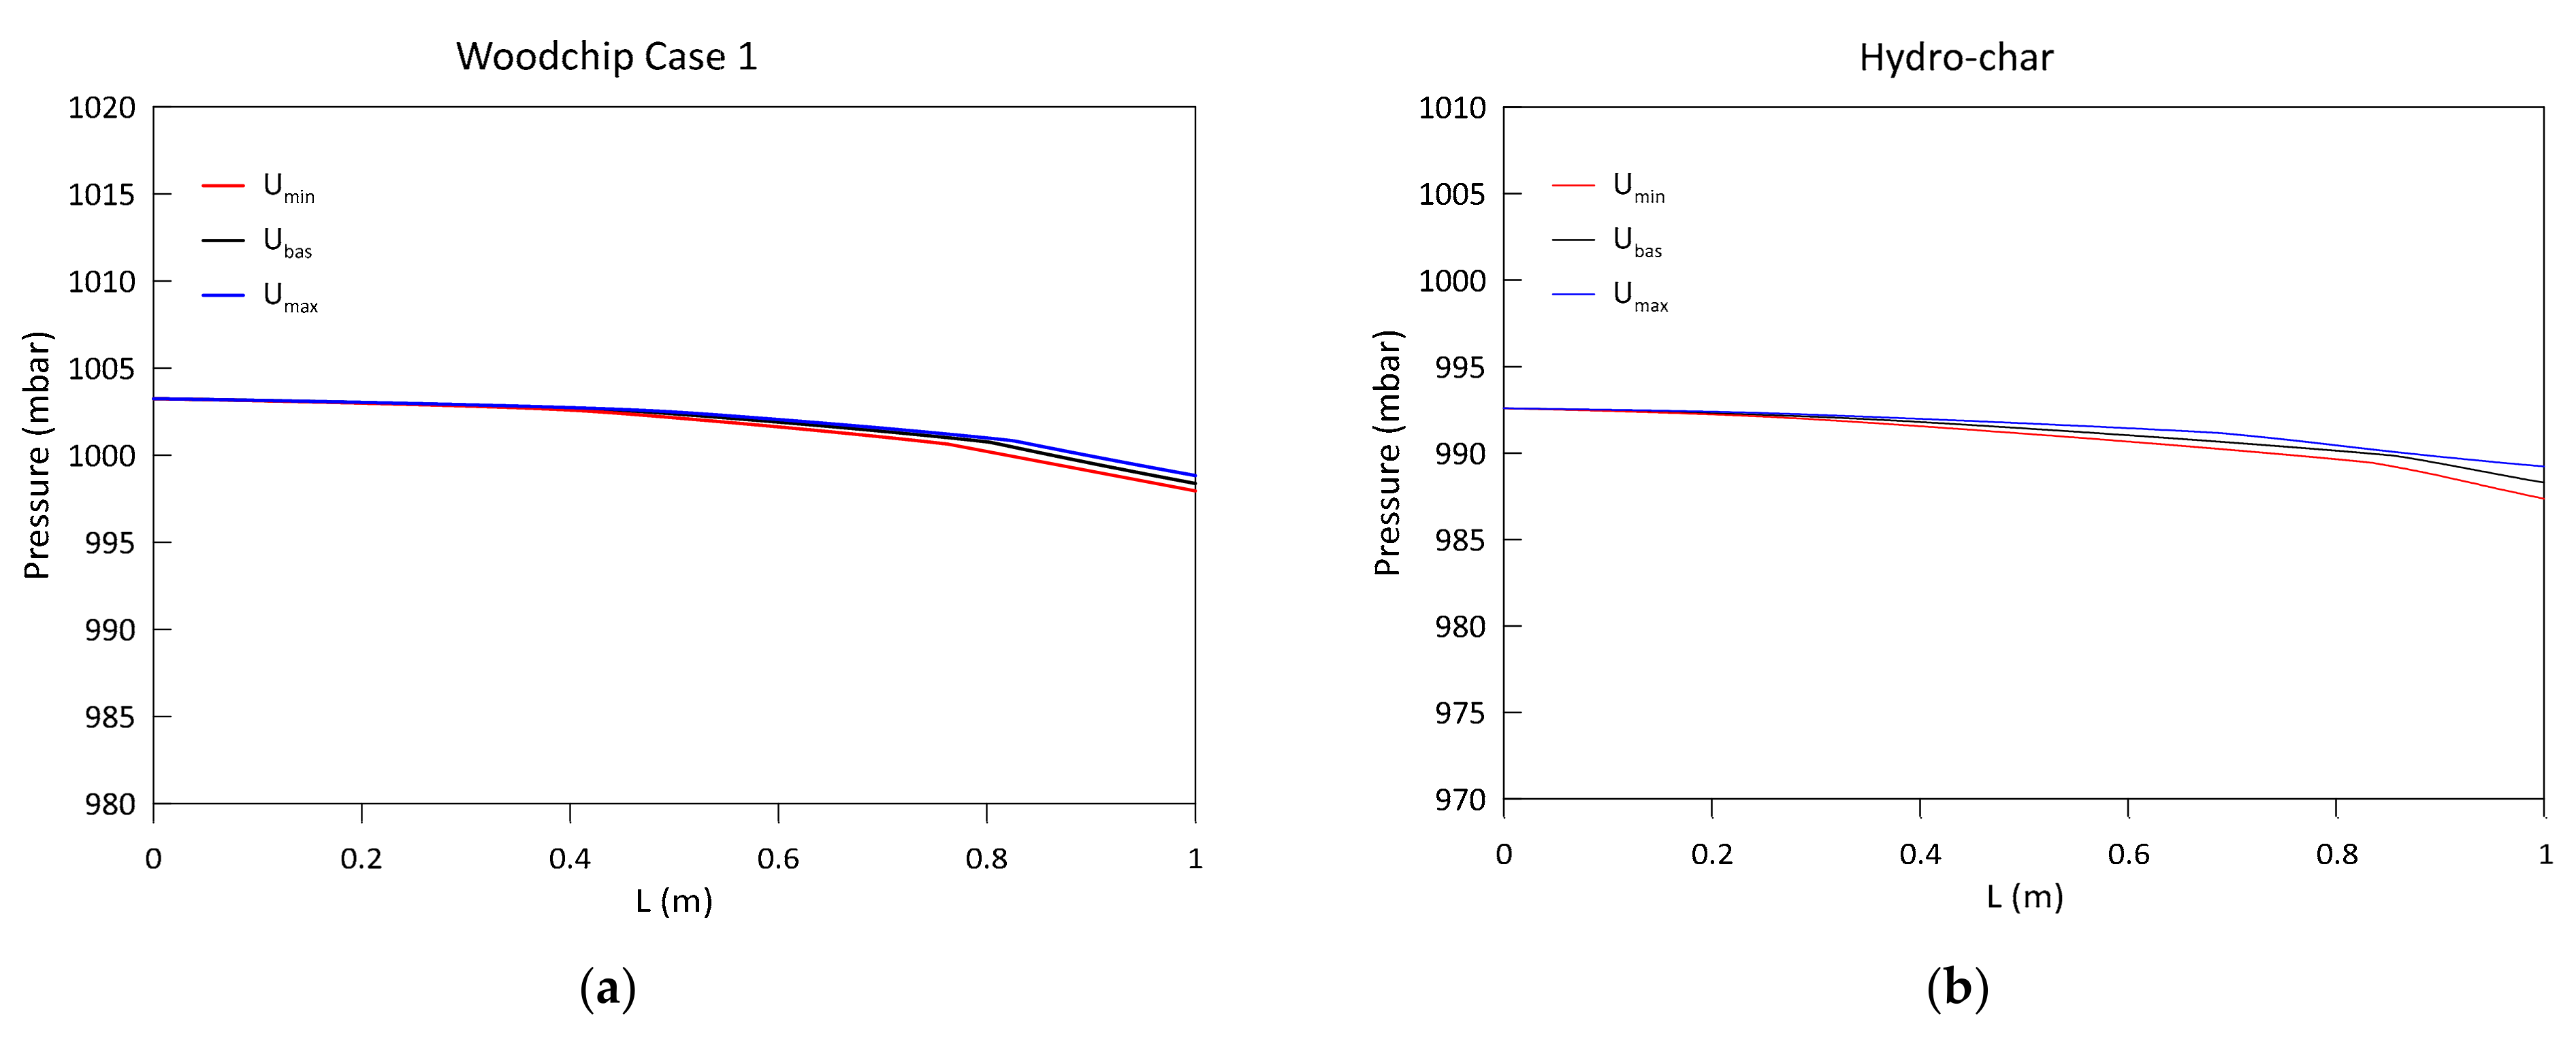
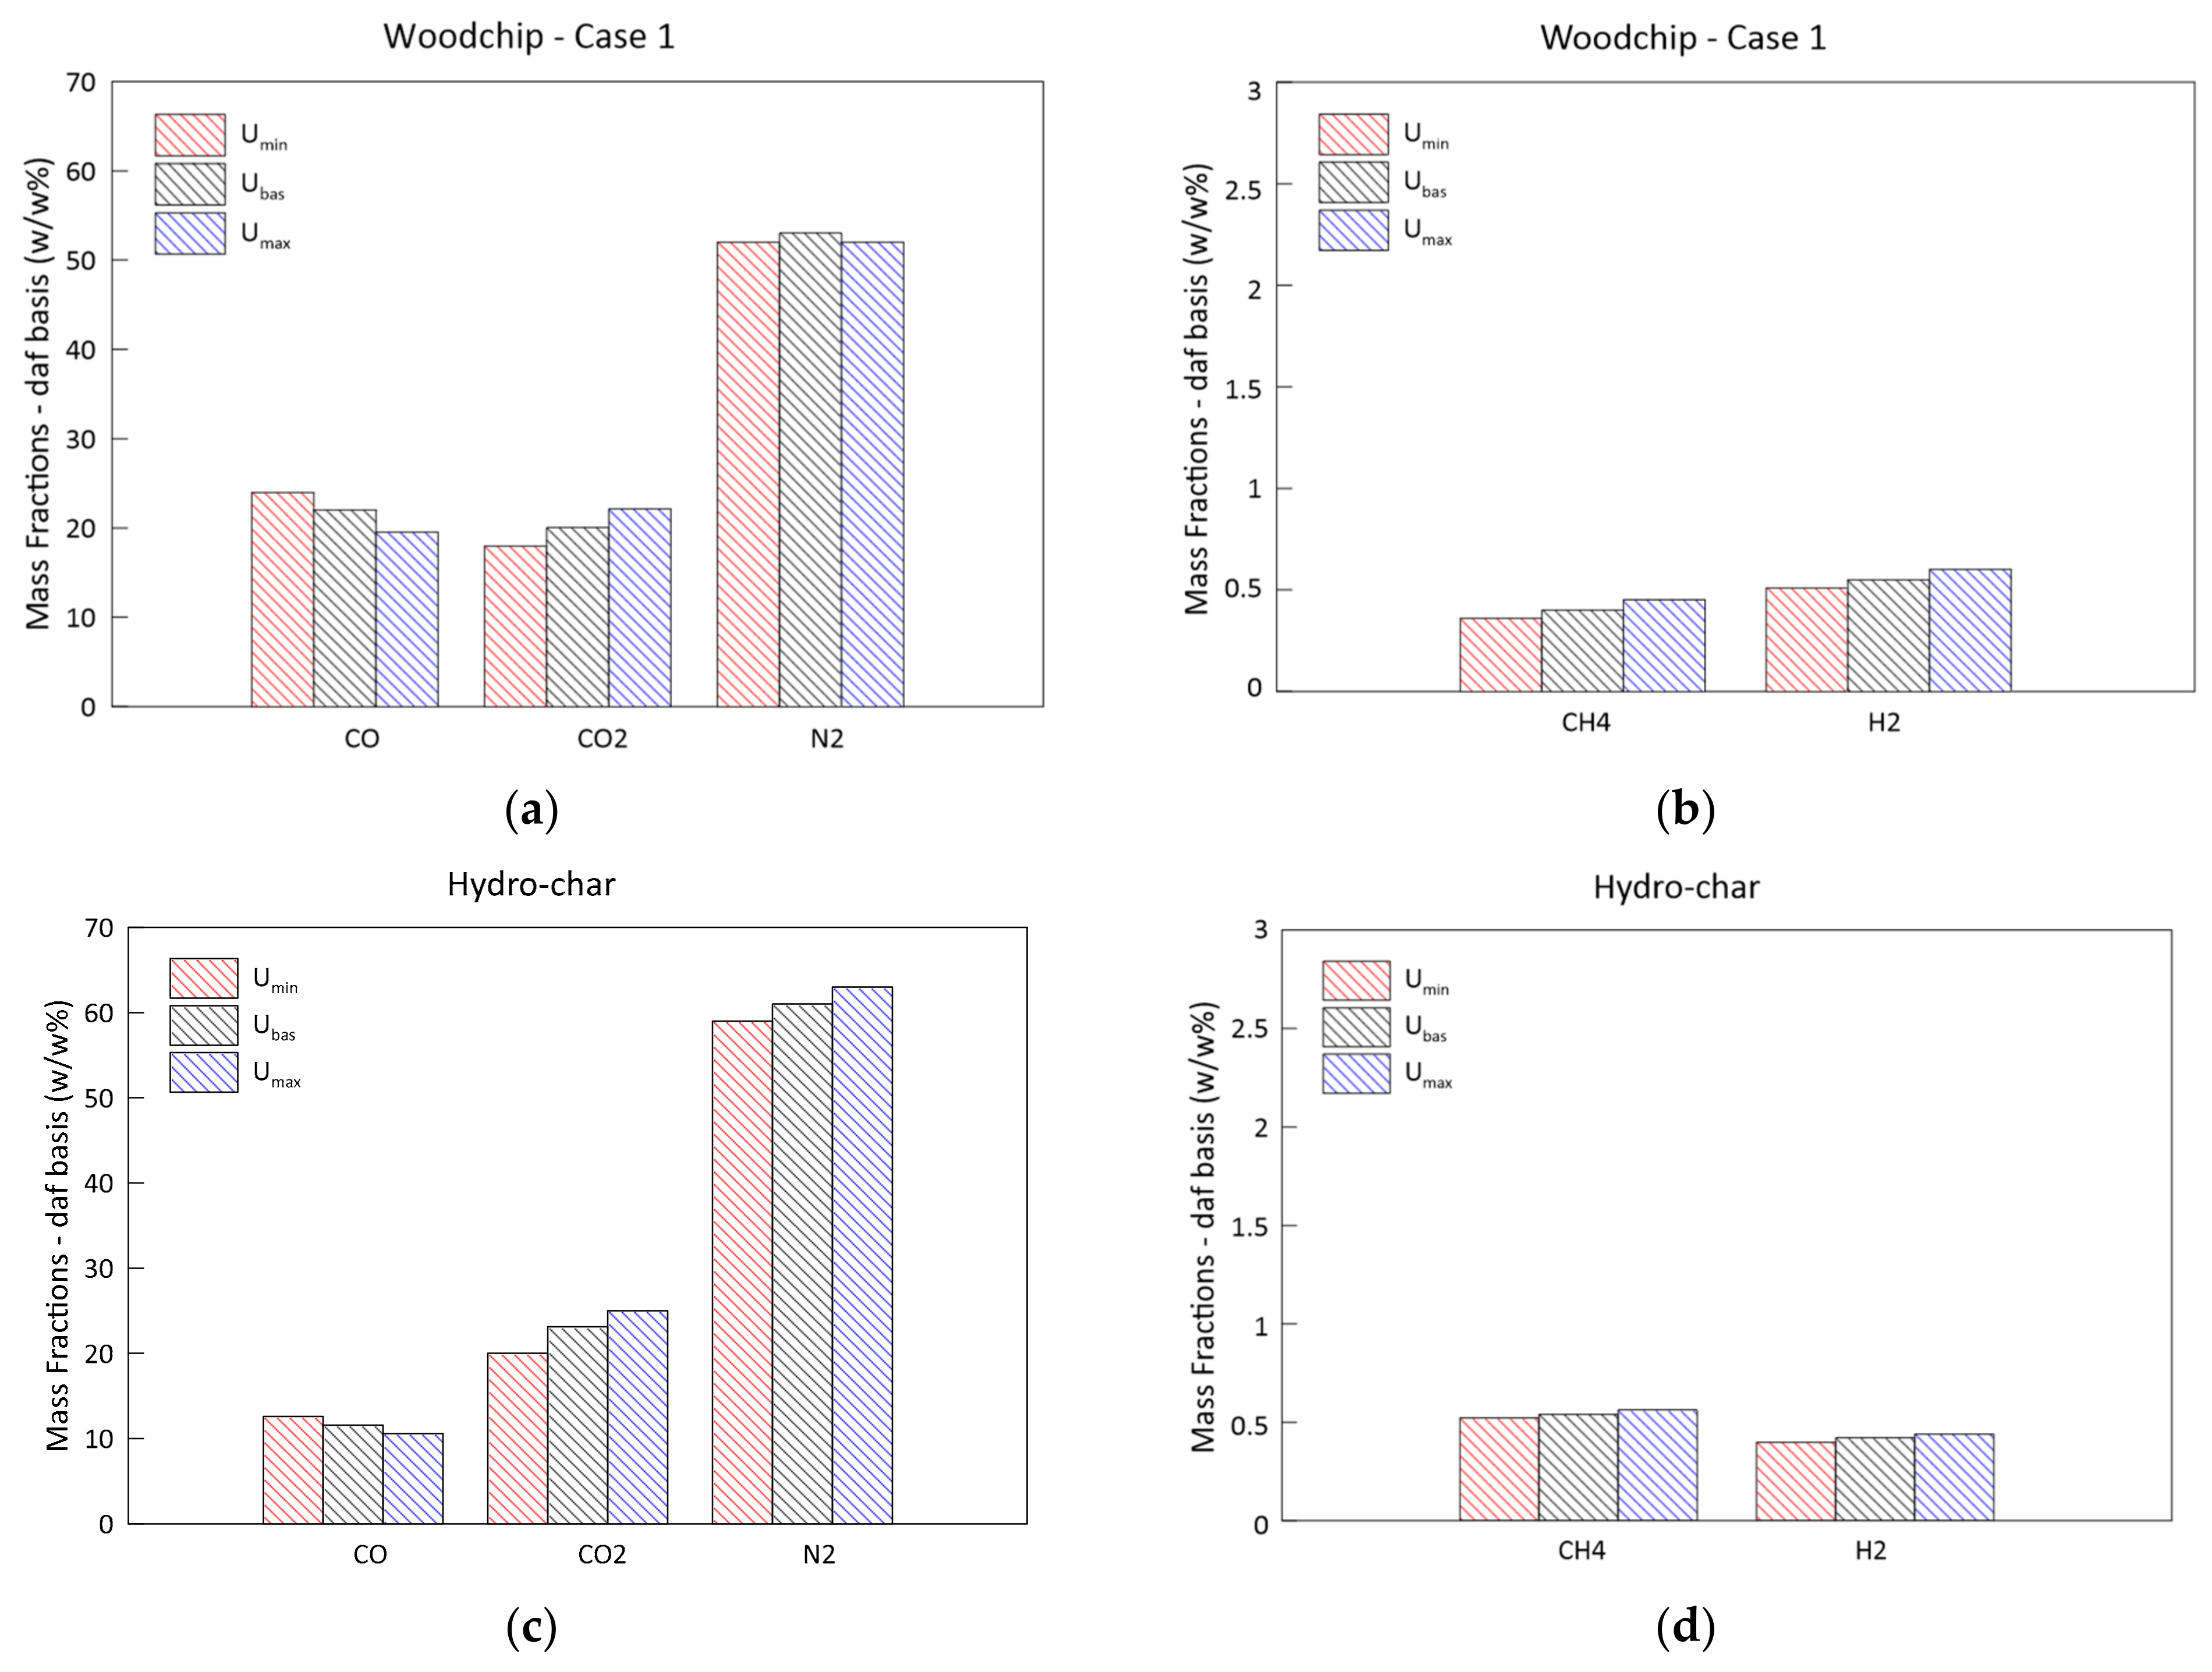
- A greater biomass packaging in the reactor determines a general shift of reactivity towards the exit section: the greatest influence can be noticed on the pressure drop along the reactor axis. The delay in the combustion and gasification reactions also causes a reduction in CH4 and H2;
- An increase in the biomass moisture content delays the evolution of the temperature profile, as greater energy is spent during the evaporation process. This also occurs at the expense of the H2 and CH4 produced in the subsequent phases, resulting in a syngas of poorer quality. The pressure evolution is instead influenced in a negligible way.
Supplementary Materials
Author Contributions
Funding
Acknowledgments
Conflicts of Interest
Nomenclature
| Latin symbol | Quantity and SI Unit |
| 1D | Mono Dimensional |
| , , , , , , , , | Stoichiometric coefficient gas phase for N2, H2O, CO2, CO, H2, CH4, H2S, CmHn |
| A | Ash |
| AH2O | Pre-exponential factor of the drying reaction— |
| Specific surface area of the particle— | |
| C | Char |
| CHP | Combined Heat and Power |
| CH4 | Methane |
| CO | Carbon monoxide |
| CO2 | Carbon dioxide |
| CmHn | Tar |
| — | |
| — | |
| Di | Species Diffusivity Coefficient— |
| Dreact | Reactor Diameter— |
| Particle diameter— | |
| Inner core diameter— | |
| ER | Equivalence Ratio |
| Moisture | |
| MC | Molecular weight Char— |
| Mj | — |
| N2 | Nitrogen |
| GHG | Green House Gases |
| H2 | Hydrogen |
| H2O | Vapour water |
| H2S | Hydrogen sulfide |
| — | |
| — | |
| Coefficient of solid-gas heat exchange— | |
| Coefficient of gas-wall heat exchange— | |
| Coefficient of solid-wall heat exchange— | |
| Kinetic constant for homogeneous reactions gas phase— | |
| — | |
| — | |
| — | |
| Kinetic constant of the water gas shift reaction— | |
| K0 | Pre-exponential factor of the devolatilization reaction— |
| Equilibrium constant of the water gas shift reaction | |
| LHV | Lower Heating Value |
| ODE | Ordinary Differential Equations |
| O2 | Oxygen |
| P | Total pressure— |
| Gas-wall heat exchanged— | |
| Solid-gas heat exchanged— | |
| Solid-wall heat exchanged— | |
| R | Universal gas constant— |
| Reaction rate devolatilization— | |
| Reaction rate drying— | |
| Reaction rate homogeneous reactions gas phase— | |
| Reaction rate heterogeneous reactions involving carbon— | |
| SP | Shell progressive |
| TG | Gas temperature— |
| TS | Solid temperature — |
| TWall | Wall temperature — |
| UG | Gas velocity— |
| US | Solid velocity— |
| Wdaf | Biomass/residual material (dry-ash free basis) |
| Greek symbol | Quantity and SI Unit |
| α1, β1, γ1, δ1, ε1 | Stoichiometric coefficient for raw material |
| Stoichiometric coefficient gas phase for C | |
| Heat of reaction water vapour— | |
| Heat of reaction for homogeneous reactions gas phase— | |
| Heat of reaction for heterogeneous reactions involving carbon— | |
| ΔV | Differential volume— |
| Δz | Height along the gasifier— |
| ε | Degree of vacuum of the bed |
| Correction factor for solid-gas heat exchange coefficient | |
| μG | Fluid viscosity— |
| ηi | Devolatilization yields |
| Stoichiometric coefficient gas phase f for j = O2, N2, H2O, CO2, CO, H2, CmHn | |
| ξ | Fraction of the particle radius occupied by unreacted char |
| ρi | Solid partial bed densities for i = WdafSS, M, C and A— |
| ρj | Gas phase partial densities for j = O2, N2, H2O, CO2, CO, H2, CH4, H2S, CmHn— |
| Subscripts and superscripts | Quantity and SI Unit |
| ash | Referred to ash |
| C | Referred to char |
| dev | Referred to devolatilization |
| diff | Referred to diffusion |
| dry | Referred to drying |
| G | Referred to gas |
| G1,2,3,4 | Referred to gas homogeneous reactions gas phase |
| Gl | |
| Gj | |
| P | Referred to particle |
| R | Referred to reaction |
| S | Referred to solid |
| Si | |
| Sp1,2,3,4 | Referred to heterogeneous reactions involving carbon |
| GW | Referred to gas-wall |
| SG | Referred to solid-gas |
| SW | Referred to solid-wall |
| W | Referred to wall |
| WG | Referred to water gas shift reaction |
References
- IRENA: Global Energy Transformation, A Roadmap to 2050. Available online: https://www.irena.org/media/Files/IRENA/Agency/Publication/2018/Apr/IRENA_Report_GET_2018.pdf (accessed on 10 February 2021).
- IEA International Energy Agency, Renewables 2019—Analysis and Forecast to 2024. Available online: https://webstore.iea.org/market-report-series-renewables-2019 (accessed on 10 January 2021).
- Costa, M.; Buono, A.; Caputo, C.; Carotenuto, A.; Cirillo, D.; Costagliola, M.A.; Di Blasio, G.; La Villetta, M.; Macaluso, A.; Martoriello, G.; et al. The “INNOVARE” Project: Innovative Plants for Distributed Poly-Generation by Residual Biomass. Energies 2020, 13, 4020. [Google Scholar] [CrossRef]
- Vassilev, S.V.; Vassileva, C.G.; Vassilev, V.S. Advantages and disadvantages of composition and properties of biomass in comparison with coal: An overview. Fuel 2015, 158, 330–350. [Google Scholar] [CrossRef]
- Guo, F.; Dong, Y.; Dong, L.; Guo, C. Effect of design and operating parameters on the gasification process of biomass in a downdraft fixed bed: An experimental study. Int. J. Hydrog. Energy 2014, 39, 5625–5633. [Google Scholar] [CrossRef]
- Palma, C.F. Modelling of tar formation and evolution for biomass gasification: A review. Appl. Energy 2013, 111, 129–141. [Google Scholar] [CrossRef]
- Trninić, M.; Stojiljković, D.; Manić, N.; Skreiberg, Ø.; Wang, L.; Jovović, A. A mathematical model of biomass downdraft gasification with an integrated pyrolysis model. Fuel 2020, 265, 116867. [Google Scholar] [CrossRef]
- Basu, P. Biomass Gasification and Pyrolysis; Elsevier: New York, NY, USA, 2010. [Google Scholar]
- La Villetta, M.; Costa, M.; Massarotti, N. Modelling approaches to biomass gasification: A review with emphasis on the stoichiometric method. Renew. Sustain. Energy Rev. 2017, 74, 71–88. [Google Scholar] [CrossRef]
- Adeyemi, I.; Janajreh, I.; Arink, T.; Ghenai, C. Gasification behavior of coal and woody biomass: Validation and parametrical study. Appl. Energy 2017, 185, 1007–1018. [Google Scholar] [CrossRef]
- Giltrap, D.; McKibbin, R.; Barnes, G. A steady state model of gas-char reactions in a downdraft biomass gasifier. Sol. Energy 2003, 74, 85–91. [Google Scholar] [CrossRef]
- Wang, Y.; Kinoshita, C. Kinetic model of biomass gasification. Sol. Energy 1993, 51, 19–25. [Google Scholar] [CrossRef]
- Di Blasi, C. Dynamic behaviour of stratified downdraft gasifiers. Chem. Eng. Sci. 2000, 55, 2931–2944. [Google Scholar] [CrossRef]
- Sharma, A.K. Equilibrium and kinetic modeling of char reduction reactions in a downdraft biomass gasifier: A comparison. Sol. Energy 2008, 82, 918–928. [Google Scholar] [CrossRef]
- Tinaut, F.; Melgar, A.; Pérez, J.F.; Horrillo, A. Effect of biomass particle size and air superficial velocity on the gasification process in a downdraft fixed bed gasifier. An experimental and modelling study. Fuel Process. Technol. 2008, 89, 1076–1089. [Google Scholar] [CrossRef]
- Umeki, K.; Namioka, T.; Yoshikawa, K. Analysis of an updraft biomass gasifier with high temperature steam using a numerical model. Appl. Energy 2012, 90, 38–45. [Google Scholar] [CrossRef]
- Simone, M.; Nicolella, C.; Tognotti, L. Numerical and experimental investigation of downdraft gasification of woody residues. Bioresour. Technol. 2013, 133, 92–101. [Google Scholar] [CrossRef]
- Patra, T.K.; Nimisha, K.; Sheth, P.N. A comprehensive dynamic model for downdraft gasifier using heat and mass transport coupled with reaction kinetics. Energy 2016, 116, 1230–1242. [Google Scholar] [CrossRef]
- Salem, A.M.; Paul, M.C. An integrated kinetic model for downdraft gasifier based on a novel approach that optimises the reduction zone of gasifier. Biomass Bioenergy 2018, 109, 172–181. [Google Scholar] [CrossRef] [Green Version]
- Tartarelli, R.; Seggiani, M. Analisi e Modellazione Numerica del Processo di Gassificazione del Carbone in Reattori Updraft; ENEA 2010 Report RdS 27. Available online: https://www.enea.it/it/Ricerca_sviluppo/documenti/ricerca-di-sistema-elettrico/gassificazione-carbone/28-dicmpi-rt-5252-modgsf.pdf (accessed on 12 July 2021).
- Knacke, O.; Kubaschewski, O.; Hesselmann, K. Thermo-Chemical Properties of Inorganic Substances, 2nd ed.; Springer: Berlin/Heidelberg, Germany, 1991. [Google Scholar]
- Hobbs, M.L.; Radulovic, P.T.; Smoot, L.D. Modeling fixed-bed coal gasifiers. AIChE J. 1992, 38, 681–702. [Google Scholar] [CrossRef]
- Mandl, C.; Obernberger, I.; Biedermann, F. Updraft fixed-bed gasification of softwood pellets: Mathematical modelling and comparison with experimental data. In Proceedings of the 17th European Biomass Conference & Exhibition, ETA-Renewable Energies, Hamburg, Germany, 29 June–3 July 2009. [Google Scholar]
- Koufopanos, C.A.; Papayannanos, N.; Maschio, G.; Lucchesi, A. Modeling the pyrolysis of biomass particles: Studies on kinetics, thermal and heat transfer effects. Can. J. Chem. Eng. 1991, 69, 907–915. [Google Scholar] [CrossRef]
- Chan, W.-C.R.; Kelbon, M.; Krieger, B.B. Modelling and experimental verification of physical and chemical processes during pyrolysis of a large biomass particle. Fuel 1985, 64, 1505–1513. [Google Scholar] [CrossRef]
- Di Blasi, C.; Russo, G. Modelling of Transport Phenomena and Kinetics of Biomass Pyrolysis, Advances in Thermochemical Biomass Conversion; Springer: Berlin/Heidelberg, Germany, 1993; pp. 906–921. [Google Scholar] [CrossRef]
- Font, R.; Marcilla, A.; Verdu, E.; Devesa, J. Kinetics of the pyrolysis of almond shells and almond shells impregnated with cobalt dichloride in a fluidized bed reactor and in a pyroprobe 100. Ind. Eng. Chem. Res. 1990, 29, 1846–1855. [Google Scholar] [CrossRef]
- Janse, A.; Westerhout, R.; Prins, W. Modelling of flash pyrolysis of a single wood particle. Chem. Eng. Process. Process Intensif. 2000, 39, 239–252. [Google Scholar] [CrossRef]
- Shafizadeh, F.; Chin, P.P.S. Thermal Deterioration of Wood; ACS Series American Chemical Society; ACS Publications: Washington, DC, USA, 1977; pp. 57–81. [Google Scholar] [CrossRef]
- Thurner, F.; Mann, U. Kinetic investigation of wood pyrolysis. Ind. Eng. Chem. Process. Des. Dev. 1981, 20, 482–488. [Google Scholar] [CrossRef]
- Bin Yang, Y.; Phan, A.N.; Ryu, C.; Sharifi, V.; Swithenbank, J. Mathematical modelling of slow pyrolysis of segregated solid wastes in a packed-bed pyrolyser. Fuel 2007, 86, 169–180. [Google Scholar] [CrossRef]
- Ahmed, S.; Clements, L.D. Kinetics of Biomass Pyrolysis with Radiant Heating. In Proceedings of the International Conference on Research in Biomass Conversion, Phoenix, AZ, USA, 2 April 1988. [Google Scholar] [CrossRef]
- Teislev, B. Simulation of the Biomass Updraft Gasifier, MEK-ET. 2006. Available online: http://www.risoe.dk/rispubl/NEI/mek-et-2006-02.pdf (accessed on 12 July 2021).
- Molina, A.; Mondragón, F. Reactivity of coal gasification with steam and CO2. Fuel 1998, 77, 1831–1839. [Google Scholar] [CrossRef]
- Liliedahl, T.; Sjöström, K. Modelling of char-gas reaction kinetics. Fuel 1997, 76, 29–37. [Google Scholar] [CrossRef]
- Kajitani, S.; Suzuki, N.; Ashizawa, M.; Hara, S. CO2 gasification rate analysis of coal char in entrained flow coal gasifier. Fuel 2006, 85, 163–169. [Google Scholar] [CrossRef]
- Ozbas, K.E.; Kök, M.V.; Hiçyilmaz, C. Comparative kinetic analysis of raw and cleaned coals. J. Therm. Anal. Calorim. 2002, 69, 541–549. [Google Scholar] [CrossRef]
- Henrich, E.; Bürkle, S.; Meza-Renken, Z.; Rumpel, S. Combustion and gasification kinetics of pyrolysis chars from waste and biomass. J. Anal. Appl. Pyrolysis 1999, 49, 221–241. [Google Scholar] [CrossRef]
- Scott, S.; Davidson, J.; Dennis, J.; Fennell, P.; Hayhurst, A. The rate of gasification by CO2 of chars from waste. Proc. Combust. Inst. 2005, 30, 2151–2159. [Google Scholar] [CrossRef]
- Yang, W.; Ponzio, A.; Lucas, C.; Blasiak, W. Performance analysis of a fixed-bed biomass gasifier using high-temperature air. Fuel Process. Technol. 2006, 87, 235–245. [Google Scholar] [CrossRef]
- Costruzioni Motori Diesel (CMD). Pirogassificatore ECO20 X. Available online: http://www.cmdengine.com/eco20-pirogassificatore (accessed on 12 May 2020).
- Costa, M.; Rocco, V.; Caputo, C.; Cirillo, D.; Di Blasio, G.; La Villetta, M.; Martoriello, G.; Tuccillo, R. Model based optimization of the control strategy of a gasifier coupled with a spark ignition engine in a biomass powered cogeneration system. Appl. Therm. Eng. 2019, 160, 114083. [Google Scholar] [CrossRef]
- Costa, M.; La Villetta, M.; Massarotti, N. Optimal tuning of a thermo-chemical equilibrium model for downdraft biomass gasifiers. Chem. Eng. 2015, 43, 439–444. [Google Scholar] [CrossRef]
- Wang, S.C.; Wen, C.Y. Experimental evaluation of nonisotheral solid-gas reaction model. AIChE J. 1972, 18, 1231–1238. [Google Scholar] [CrossRef]


| Reaction | Reaction Name |
|---|---|
| Biomasswet → Biomassdry + H2Ovapour | Drying |
| Biomassdry → Char + Volatiles (Gas + Tar) | Devolatilization |
| Heterogeneous Reactions | |
| C + ER∙O2(g) → 2(1 − ER)∙CO + (2∙ER − 1) CO2 | Oxidation |
| C + CO2(g) → 2CO | Boudouard Reaction |
| C + H2O(g) → CO + H2 | (Water/gas heterogeneous reaction) |
| C + 2H2(g) → CH4 | (Methane formation reaction) |
| Homogeneous Reactions | |
| CO + H2O(g) ↔ CO2 + H2 | (Water/gas shift reaction) |
| Tar + O2 → CO + H2O | |
| Tar + H2O →CO + H2O | (Tar reforming) |
| Tar → CO + CO2 + CH4 + H2 | (Tar cracking) |
| CH4 + 2O2 → CO + 2H2O | |
| CH4 + H2O ↔ CO + 3H2 | (Methane reforming reaction) |
| CO + 0.5O2 → CO2 | |
| H2 + 0.5O2 → H2O | |
| Drying |
| Biomass wet → Biomass dry + H2O vapor [23] |
| Rdry (kg/(s∙m3bed)) = ρH2O∙5.56 × 10⁶∙exp(−8.79 × 10⁴/(8.31∙TS)) |
| Devolatilization |
| Cα1Hβ1Oγ1Nδ1Sε1 → α2∙C + a∙H2 + b∙CH4 + c∙CO + CmHn + d∙H2O + e∙CO2 + f∙H2S + g∙N2 [33] |
| Rdev (kg/(s∙m3bed)) = ρW∙2 × 10⁴∙exp(−8467/TS) |
| Homogeneous reactions gas phase |
| G1: CO + ½ O2 → CO2 [23] |
| RG1 (kmol/(s∙m3)) = ε∙kG1∙[CO]∙[H2O]0.5∙[O2]0.5 with kG1 = 1.3 × 10¹⁴·exp(−62,700/TG) |
| G2: H2 + ½ O2 → H2O [23] |
| RG2 (kmol/(s∙m3)) = ε∙kG2∙[H2]∙[O2] with kG2 = 8.83 × 10¹¹·exp(−12,005/TG) |
| G3: CH4 + 2O2 → CO2 + 2 H2O [23] |
| RG3 (kmol/(s∙m3)) = ε∙kG3∙[CH4]∙[O2] with kG3 = 2.552 × 10¹⁷·exp(−11,196/TG) |
| G4: CmHn + (m/2 + n/4) O2 → m CO2 + n/2 H2O [38] |
| RG4 (kmol/(s∙m3)) = ε∙kG4∙[CmHn]0.5∙[O2] with kG4 = 1891·TG·exp(−12,200/TG) |
| Water–gas shift reaction |
| CO + H2O → H2 + CO2 [13,23] |
| RWG (kmol/(s∙m3)) = ε∙kWG∙{[CO]∙[H2O] − [CO2]∙[H2]/KWGeq} |
| with kWG = 2.78 × 10³·exp(−1513/TG) KWGeq = 0.0265·exp(−3966/TG) |
| Heterogeneous reactions involving carbon |
| (P1): C + ½ O2 → CO [31] |
| (P2): C + CO2 → 2 CO [23] |
| (P3): C + H2O → H2 + CO [31] |
| (P4): C + 2 H2 → CH4 [23] |
| RSP (kgC/(s∙m3bed)) = {ρGl/[(1/kdiff,Gl) + (1/kash,Gl)∙(1/ξ−1) + (1/kRp,Gl∙ξ2)]}∙[MC/(υRp,Gl∙MGl)]∙ASG |
| with Gl = O2, CO2, H2O, H2. The coefficients ki are listed in Table S2 in the Supplementary Materials. |
| Biomass | As Delivered | After Briquetting | Average Dimensions | Average Density [kg/m3] | Porosity ε |
|---|---|---|---|---|---|
| Woodchip Case 1 | 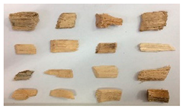 | - | 10–30 mm | 860 | 0.5 |
| Woodchip Case 2 | 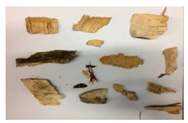 | - | 10–30 mm | 810 | 0.5 |
| Hydro-char | 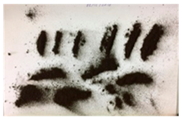 | 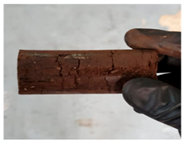 | Length: 40–80 mm. Diameter: 35 mm. | 1250 | 0.55 |
| Olive Pomace | 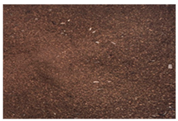 | 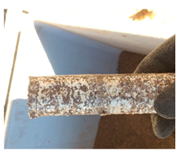 | Length: 40–80 mm. Diameter: 35 mm. | 808 | 0.5 |
| Parameter | Woodchip Case 1 | Woodchip Case 2 | Hydro-Char | Olive Pomace |
|---|---|---|---|---|
| (a) Proximate analysis | ||||
| Initial Moisture | 11.2% | 15.9% | 12.4% | 8.4% |
| Ash (db) | 0.56% | 0.36% | 17.36% | 3.72% |
| Volatile matter (db) | 82.89% | 78.64% | 59.13% | 74.34% |
| Fixed carbon (db) | 16.67% | 21% | 23.51% | 21.94% |
| (b) Ultimate analysis | ||||
| Carbon (daf) | 45.5% | 44.4% | 65.2% | 50.2% |
| Hydrogen (daf) | 5.6% | 5.2% | 6.3% | 5.9% |
| Nitrogen (daf) | 0.0% | 0.2% | 1.3% | 0.8% |
| Oxygen (daf) | 48.9% | 50.0% | 27.2% | 43.1% |
| (c) Heating value | ||||
| High calorific value kJ/kg (daf) | 17,068 | 17,026 | 26,815 | 19,654 |
| Lower calorific value kJ/kg (daf) | 15,710 | 16,854 | 25,457 | 18,296 |
| Characteristic | Value |
|---|---|
| Maximum Reactor Diameter. | 0.21 m |
| Minimum Reactor Diameter | 0.10 m |
| Gasifier Length | 1 m |
| Equivalence ratio | 0.3 |
| 1st Thermocouple position | 0.06 m |
| 2nd Thermocouple position | 0.78 m |
| 3rd Thermocouple position | 0.98 m |
| 1st Pressure Sensor position | 0.06 m |
| 2nd Pressure Sensor position | 0.98 m |
| Species | Woodchip Case 1 | Woodchip Case 2 | Hydro-Char | Olive Pomace |
|---|---|---|---|---|
| H2% | 1.21 | 1.65 | 1.53 | 1.58 |
| N2% | 61.79 | 43.2 | 54.64 | 45.0 |
| CO% | 20.55 | 26.87 | 21.45 | 11.24 |
| CH4% | 1.17 | 1.09 | 1.52 | 3.1 |
| CO2% | 15.29 | 26.52 | 17.73 | 39.08 |
Publisher’s Note: MDPI stays neutral with regard to jurisdictional claims in published maps and institutional affiliations. |
© 2021 by the authors. Licensee MDPI, Basel, Switzerland. This article is an open access article distributed under the terms and conditions of the Creative Commons Attribution (CC BY) license (https://creativecommons.org/licenses/by/4.0/).
Share and Cite
Costa, M.; La Villetta, M.; Piazzullo, D.; Cirillo, D. A Phenomenological Model of a Downdraft Biomass Gasifier Flexible to the Feedstock Composition and the Reactor Design. Energies 2021, 14, 4226. https://doi.org/10.3390/en14144226
Costa M, La Villetta M, Piazzullo D, Cirillo D. A Phenomenological Model of a Downdraft Biomass Gasifier Flexible to the Feedstock Composition and the Reactor Design. Energies. 2021; 14(14):4226. https://doi.org/10.3390/en14144226
Chicago/Turabian StyleCosta, Michela, Maurizio La Villetta, Daniele Piazzullo, and Domenico Cirillo. 2021. "A Phenomenological Model of a Downdraft Biomass Gasifier Flexible to the Feedstock Composition and the Reactor Design" Energies 14, no. 14: 4226. https://doi.org/10.3390/en14144226
APA StyleCosta, M., La Villetta, M., Piazzullo, D., & Cirillo, D. (2021). A Phenomenological Model of a Downdraft Biomass Gasifier Flexible to the Feedstock Composition and the Reactor Design. Energies, 14(14), 4226. https://doi.org/10.3390/en14144226